on sensitivity of case-based reasoning to optimal feature subsets in business failure prediction
TRANSCRIPT
Expert Systems with Applications 37 (2010) 4811–4821
Contents lists available at ScienceDirect
Expert Systems with Applications
journal homepage: www.elsevier .com/locate /eswa
On sensitivity of case-based reasoning to optimal feature subsets in businessfailure prediction
Hui Li a,*, Hai-Bin Huang a, Jie Sun a, Chuang Lin b
a School of Business Administration, Zhejiang Normal University, 91 Subbox in P.O. Box 62, YingBinDaDao 688, Jinhua City 321004, Zhejiang Province, PR Chinab School of Software, Dalian University of Technology, Dalian City 116020, Liaoning Province, PR China
a r t i c l e i n f o
Keywords:Business failure prediction (BFP)Case-based reasoning (CBR)k-Nearest neighborFeature selectionFiltersWrappersChinese listed company
0957-4174/$ - see front matter � 2009 Elsevier Ltd. Adoi:10.1016/j.eswa.2009.12.034
* Corresponding author. Tel.: +86 158 8899 3616.E-mail addresses: [email protected] (H. Li), sunji
a b s t r a c t
Case-based reasoning (CBR) was firstly introduced into the area of business failure prediction (BFP) in1996. The conclusion drawn out in its first application in this area is that CBR is not more applicable thanmultiple discriminant analysis (MDA) and Logit. On the contrary, there are some arguments which claimthat CBR with k-nearest neighbor (k-NN) as its heart is not surely outranked by those machine learningtechniques. In this research, we attempt to investigate whether or not CBR is sensitive to the so-calledoptimal feature subsets in BFP, since feature subset is an important factor that accounts for CBR’s perfor-mance. When CBR is used to solve such classification problem, the retrieval process of its life-cycle ismainly used. We use the classical Euclidean metric technique to calculate case similarity. Empirical datatwo years prior to failure are collected from Shanghai Stock Exchange and Shenzhen Stock Exchange inChina. Four filters, i.e. MDA stepwise method, Logit stepwise method, One-way ANOVA, independent-samples t-test, and the wrapper approach of genetic algorithm are employed to generate five optimal fea-ture subsets after data normalization. Thirty-times hold-out method is used as assessment of predictiveperformances by combining leave-one-out cross-validation and hold-out method. The two statisticalbaseline models, i.e. MDA and Logit, and the new model of support vector machine are employed as com-parative models. Empirical results indicate that CBR is truly sensitive to optimal feature subsets with datafor medium-term BFP. The stepwise method of MDA, a filter approach, is the first choice for CBR to selectoptimal feature subsets, followed by the stepwise method of Logit and the wrapper. The two filterapproaches of ANOVA and t-test are the fourth choice. If MDA stepwise method is employed to selectoptimal feature subset for the CBR system, there are no significant difference on predictive performanceof medium-term BFP between CBR and the other three models, i.e. MDA, Logit, SVM. On the contrary, CBRis outperformed by the three models at the significant level of 1%, if ANOVA or t-test is used as featureselection method for CBR.
� 2009 Elsevier Ltd. All rights reserved.
1. Introduction 1996; Odom & Sharda, 1990; Salchenberger, Mine, & Lash, 1992;
Our team is involved in predicting business failure of firms andbanks. Such problems arise on various techniques from areas ofsoft computing, computational intelligence, statistics, data base,information technology, and decision aiding. It appears to be quiteimportant to avoid firms and banks from falling into bankruptcyand assure stable economic development of a whole country, oreven the whole world. In forty years’ research of the area of busi-ness failure prediction (BFP), it is to find more accurate predictorsand models focused. Various techniques, such as: multivariate dis-criminant analysis (MDA) (Beaver, 1966; Canbas, Cabuk, & Kilic,2005; Altman, 1968; Grice & Ingram, 2001), Logit (Lin, 2009; Ohl-son, 1980; Youn & Gu, 2010; Jones & Hensher, 2004; Martin, 1977),neural networks (NN) (Leshno & Spector, 1996; Lee, Han, & Kwon,
ll rights reserved.
[email protected] (J. Sun).
Serrano-Cinca, 1996; Wilson & Sharda, 1994; Adya & Collopy,1998; Chauhan, Ravi, & Chandra, 2009; Chen & Du, 2009; Cho,Kim, & Bae, 2009; Ravi & Pramodh, 2008; Tam, 1991; Tseng &Hu, 2009; Yang, Platt, & Platt, 1999), case-based reasoning (CBR)(Ahn & Kim, 2009; Jo & Han, 1996), discrete-time duration model(Nam, Kim, Park, & Lee, 2008), support vector machines (SVM)(Härdle, Lee, Schäfer, & Yeh, 2009; Min & Lee, 2005), have been em-ployed in the area to predict business failure. To date, SVM, whichcould be viewed as a special form of NN, is one of the preferred pre-dictive models in BFP on the whole. And it has been testified thatSVM could produce higher predictive performance than thosemodels as MDA, Logit, NN, etc. (Hua, Wang, & Xu, 2007; Hui &Sun, 2006; Min & Lee, 2005; Min, Lee, & Han, 2006; Shin, Lee, &Kim, 2005; Wu, Tzeng, & Goo, 2007).
This research is related to the investigation of applications ofthe CBR paradigm for solving the problem of BFP. Former re-searches on CBR-based BFP provide both evidence on CBR’s more
4812 H. Li et al. / Expert Systems with Applications 37 (2010) 4811–4821
applicability (Ahn & Kim, 2009; Li & Sun, 2009; Li, Sun, & Sun,2009; Lin, Wang, Wu, & Chuang, 2009; Park & Han, 2002; Sun &Hui, 2006; Yip, 2004) and more inapplicability (Bryant, 1997; Jo& Han, 1996; Jo, Han, & Lee, 1997) than other models in the area.There may be lots of reasons accounting for the instability of CBR’sspecific application performances in BFP. Yet we attempt to inves-tigate whether or not the choice of optimal feature subsets, an in-side factor related to the CBR paradigm, could be one of the reasonsresulting in the fluctuation of CBR’s predictive accuracies. It meansthat we would like to investigate whether or not CBR is sensitive to‘optimal’ feature subsets. Standardized data-oriented feature selec-tion methods are utilized to generate the so-called optimal featuresubsets. The findings of this research might provide some guidanceon industrial applications of CBR in BFP.
Since the two statistical predictive models of MDA and Logithave been the baseline models in the area of BFP, they are em-ployed to make a comparison when carrying out investigation onCBR’s sensitivity to ‘optimal’ feature subsets. SVM is also used asanother baseline model in BFP, as it is a newcomer, a special formof NN, and an effective predictive model proposed recently. Datafor BFP are collected from Shanghai Stock Exchange and ShenzhenStock Exchange in China.
The paper is organized as follows. Section 2 gives a briefdescription on the methodology of CBR, CBR’s applications inBFP, and commonly used methods of feature selection to obtainoptimal feature subsets. Section 3 describes main contribution ofthis work. Methodology of the research is presented in Section 4,followed by the presentation of empirical design in Section 5. Sec-tion 6 provides corresponding results and makes some discussions.It is concluded in Section 7.
2. Research background
2.1. Case-based reasoning (CBR)
CBR is a problem-solving methodology that arose from cogni-tive science. Tversky (1977), a brilliant cognitive scientist, firstlydefined the degree of similarity of two objects as a ratio whosenumerator is the number of common features of the two objects,and whose denominator is the total number of features. CBR hasbeen developed in theories in 1980s (Hammond, 1989; Keane,1988; Kolodner, 1983; Schank, 1982). It has been hotly researchedand applied into various areas in 1990s (Aamodt & Plaza, 1994;Aha, Kibler, & Albert, 1991; Kolodner, 1992; Kolodner, 1993;Kolodner & Mark, 1992; Liao, Zhang, & Mount, 1998; Smyth &Keane, 1998; Watson, 1997; Watson, 1999), and it has been refo-cused to achieve a jump in 2000s (Finnie & Sun, 2003; Li et al.,2009; Pal, Dillon, & Yeung, 2001; Pal & Mitra, 2004; Pal & Shiu,2004; Pan, Yang, & Pan, 2007; Sun & Hui, 2006). To date, variousacademic and applied researches of CBR are chiefly carried outon the foundation of the four REs of CBR, i.e. Retrieve, Reuse, Revise,and Retain. When applying CBR into the area of BFP, similar casesto the current one are firstly retrieved. Then, corresponding classlabels of similar cases are reused to generate a forecasting. At last,new cases are learned by the system with specific learning strate-gies. The most commonly used retrieval technique is k-NN, whichis built on the foundations of Euclidean metric and majority voting.
2.2. CBR-based BFP
In 1996, Jo and Han (1996) combined MDA, CBR, and NN to gen-erate a hybrid forecasting system for BFP. The byproduct of theirresearch is the proposal of CBR for BFP. In the following year, Joet al. (1997) gave the comparison among predictive accuracies ofthe three models, i.e. MDA, CBR, and NN. The heart of the CBR algo-
rithm is k-nearest neighbor (k-NN) on the foundation of Euclideanmetric. In the same year, Bryant (1997) also tried to use CBR in BFPwith the comparison with Logit. The conclusion drawn out is thatLogit outperformed CBR in BFP. In Bryant’s (1997) research, theshell of ReMind is employed to implement the algorithm of CBR.
Though the first three researches in CBR-based BFP did not pro-vide enough evidence that CBR is more applicable than other mod-els in the area, yet Park and Han (2002) still focused on theproblem by employing AHP to weighting features in CBR. Theydraw the conclusion that weighted CBR by AHP on the foundationof k-NN could improve predictive accuracy of the CBR system inBFP. Two years later, Yip (2004) compared predictive performancesof weighted CBR, pure CBR, and MDA in BFP, with the conclusionthat weighted CBR could achieve the highest predictive accuracy.Recently, Sun and Hui (2006) employed grey coefficient metric inthe algorithm of k-NN in place of Euclidean metric and applied itinto BFP. Their conclusion is that CBR could generate high predic-tive accuracy than those models such as MDA, Logit, NN, SVM,etc. in predicting business failure one year or two years before. Liet al. (2009) introduced outranking relations into CBR to fulfillthe algorithm of case retrieval, and applied it into BFP. Their con-clusion is that CBR could produce higher predictive performancethan other models.
2.3. Commonly used methods of feature selection in BFP
The main purpose of feature selection is to pick up an optimalsubset of features that are relevant. There is an evaluation functionto assess performance of each subset of features. Feature selectioncould be divided into two groups based on the type of evaluationfunction. In general, there are two types of methods of featureselection, i.e. the filters and the wrappers (Guyon & Elisseeff,2003). The filters employ a filter function as the role of evaluationfunction by looking at the intrinsic characteristic of the data andmeasuring the power to discriminate among the groups. It is inde-pendent from the model or classifier. Commonly used filters in BFPare stepwise method of Logit (Back, Laitinen, & Sere, 1996; Minet al., 2006), stepwise method of MDA (Back et al., 1996; Hui &Sun, 2006; Li et al., 2009; Min et al., 2006; Sun & Hui, 2006; Sun& Li, 2008a, 2008b), t-test (Bryant, 1997; Hua et al., 2007; Jo &Han, 1996; Min et al., 2006; Shin et al., 2005), and analysis of var-iance (ANOVA) (Lin & McClean, 2001). The wrappers employ theclassifier’s performance as the evaluation function directly. A com-monly used wrapper approach in BFP is genetic algorithm (GA)(Back et al., 1996; Min et al., 2006).
3. Contribution of this work
From the above brief summary on CBR-based BFP, we could findthat there are both evidence demonstrating CBR’s applicability andinapplicability in BFP. It is not uncommon that a technique ormethodology could do a good job in some specific applications,while a bad job in some other specific applications. In fact, thereis also some evidence that no machine learning algorithms consis-tently outperform nearest neighbor algorithm (Cost & Salzberg,1993; McKenzie & Forsyth, 1995; Pernkopf, 2005), which is theheart of CBR in applications of BFP. However, we may wonderwhy there are such apparently fluctuant predictive performancesof CBR.
The main contribution of this work is that the sensitivity on var-ious optimal feature subsets of the CBR system in BFP is discussedand analyzed. We firstly provide empirical evidence on CBR’s sen-sitivity to optimal feature subsets in BFP. We believe that the find-ings might provide some guidance for further industrialapplications in BFP of the CBR system. The so-called optimal fea-

H. Li et al. / Expert Systems with Applications 37 (2010) 4811–4821 4813
ture subsets are achieved by some commonly employed featureselection methods in the area. There is evidence from Lin andMcClean’s (2001) research that standardized feature selectionmethods, such as ANOVA, could generate a better feature subsetthan the method of human judgments could do. And the so-calledhuman experience is hard to be obtained by hand at the same time.Thus, the feature selection method based on human judgments isnot employed in this research. The two chief data-oriented meth-ods in achieving optimal feature subsets, i.e. the filters and thewrappers, are both employed. And predictive accuracies of CBRon the foundation of corresponding optimal feature subsets arecompared and analyzed to find the impacts of optimal feature sub-sets on performance of the CBR system in BFP.
4. Methodology
4.1. Core processes of CBR-based forecasting
In CBR-based BFP, the inside idea of prediction is explained asfollows. Similar cases to the current one are firstly obtained. Then,corresponding class labels of the so-called similar cases are com-bined by majority voting to get the predicted label of the currentcase. There are four REs in the classical life-cycle model of CBR.Since it is the process of Retrieval mainly involved in such forecast-ing systems, we would concentrate on the key techniques used inthis process. Though there are several types of techniques thatcould be employed in the process, i.e. nearest-neighbor retrieval,inductive approaches, knowledge-guided approaches, and vali-dated retrieval, yet the majority of former researches of CBR-basedBFP utilized the technique of k-NN. Thus, the research object in thispaper is CBR with k-NN as its heart. This algorithm is on the foun-dation of Euclidean metric between pair-wise cases.
Let a weight, ws 2 ½0;1�, be assigned to the sth feature.P
ws ¼ 1.Thus, the Euclidean metric between two cases, i.e. case a and caseb, could be calculated by the following way:
dðca; cbÞ ¼ffiffiffiffiffiffiffiffiffiffiffiffiffiffiffiffiffiffiffiffiffiffiffiffiffiffiffiffiffiffiffiffiffiffiffiffiffiffiffiffiffiffiffiffiffiffiffiffiffiXS
s¼1ðws � dsðca; cbÞÞ2
r; ð1Þ
dsðca; cbÞ ¼ jxas � xbsj; ð2Þ
where ca and cb represent case a and case b, respectively, dðca; cbÞrepresents the Euclidean distance, dsðca; cbÞ represents the distancebetween the two cases on the sth feature, xas and xbs represent val-ues of case a and case b on the sth feature, respectively. LetSIMðca; cbÞ express the similarity between the two cases. AfterEuclidean distance between the pair of cases has been calculated,the similarity measure between two cases could be achieved bythe following way:
SIMðca; cbÞ ¼1
1þ dðca; cbÞ: ð3Þ
From the above definition of similarity measure by Euclideanmetric, we could find that two parameters should be predeter-mined, i.e. inputted features and weights of each feature, whencomputing the similarity between a pair of cases. Since featureselection is a special form of feature weighting, we would put equalimportance on each feature in optimal feature subset, and no fur-ther weighting mechanisms is employed.
4.2. Obtaining optimal feature subsets
Now, what is important is how to select inputted features, i.e.the optimal features, for k-NN algorithm in CBR. Since inputted fea-tures are very important to the implementation of CBR, we attemptto investigate whether or not CBR yields to produce significantlydifferent predictive performances on different optimal feature sub-
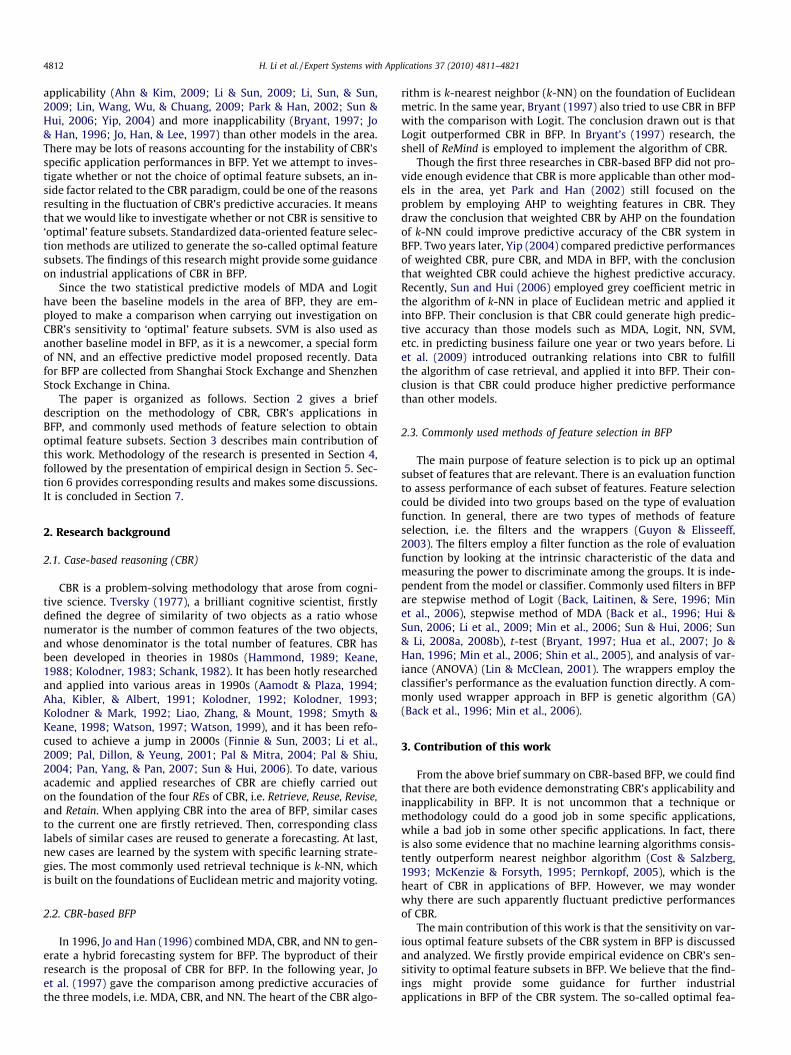
sets. As indicates in the brief summary of feature selection meth-ods used in the area, the four types of filters, i.e. stepwisemethods of MDA and Logit, t-test, and ANOVA, and the wrapper ap-proach of GA are commonly employed. Thus, the optimal featuresubsets could be achieved by the way shown in Fig. 1.
4.2.1. Candidate financial featuresIn order to predict business failure, candidate financial features
should be predetermined firstly. Nowadays, results of BFP aremainly generated from financial ratios. Thus, we plan to employnumerical financial ratios deriving from financial statements asthe majority of this area does. There are lots of financial ratios thatcould be computed from financial statements. In order to coverindicators on information of a whole company and take availabilityof information into consideration at the same time, we select 30financial ratios from public information of listed companies in Chi-na. They are composed of profitability ratios, activity ratios, liabil-ity ratios, structure ratios, growth ratios, and ratios on per shareitem and yields. They cover commonly used financial ratios inthe area of BFP in China. These financial ratios are not hard to beobtained from public information of listed companies on web orsome commercial databases. Though there may be some otherfinancial ratios that could also contribute to predict business fail-ure, yet they are not employed in this research since they are noteasily achieved for majority companies used.
Profitability ratios include: gross income to sales (GIS), net in-come to sales (NIS), earning before interest and tax to total assets(EBITTA), net profit to total assets (NPTA), net profit to current as-sets (NPCA), net profit to fixed assets (NPFA), net profit to equity(NPE), and profit margin (PM).
Activity ratios include account receivables turnover (ART),inventory turnover (IT), account payable turnover (APT), total as-sets turnover (TAT), current assets turnover (CAT), and fixed assetsturnover (FAT).
Liability ratios include: current ratio (CR), ratio of cash to currentliability (RCCL), asset-liability ratio (ALR), equity to debt ratio (EDR),ratio of liability to tangible net asset (RLTNA), ratio of liability to mar-ket value of equity (RLME), and interest coverage ratio (ICR).
Structural ratios include: proportion of current asset over totalasset (PCATA), proportion of fixed assets over total assets (PFATA),proportion of equity to fixed assets (PEFA), and proportion of cur-rent liability over total liability (PCLTL).
Growth ratios include: growth rate of primary business (GRPB),and growth rate of total assets (GRTA).
Per share items and yields include: earning per share (EPS), netassets per share (NAPS), and cash flow per share (CFPS).
4.2.2. Stepwise method of MDAMDA is a useful tool for developing a predictive model based on
feature values of each sample data. A discriminant function wouldbe generated based on linear combinations of the predictor fea-tures that provide the best discrimination between the groups.The so-called discriminant functions are generated from data forwhich group value is known. It is a specific form of supervisedlearning. Then, the functions could be applied to new samples thathave measurements for feature values but have unknown group la-bel. In MDA, coefficients of the linear discriminant function areestimated by collected data. Let the sth feature be expressed asfeas and corresponding coefficient is expressed as coes. The functioncould be denoted as
DSN ¼XS
s¼1
coes � feas: ð4Þ
In order to select those features that discriminate the two groupsefficiently, stepwise method is often employed in MDA. In forward
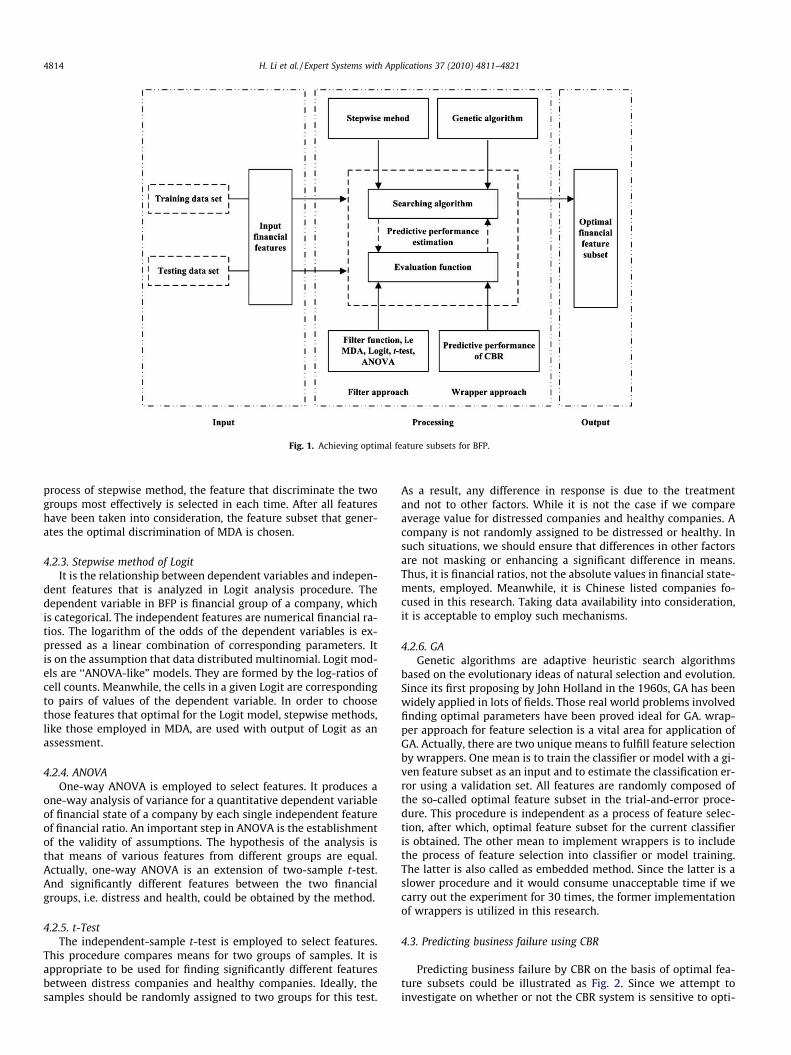
Fig. 1. Achieving optimal feature subsets for BFP.
4814 H. Li et al. / Expert Systems with Applications 37 (2010) 4811–4821
process of stepwise method, the feature that discriminate the twogroups most effectively is selected in each time. After all featureshave been taken into consideration, the feature subset that gener-ates the optimal discrimination of MDA is chosen.
4.2.3. Stepwise method of LogitIt is the relationship between dependent variables and indepen-
dent features that is analyzed in Logit analysis procedure. Thedependent variable in BFP is financial group of a company, whichis categorical. The independent features are numerical financial ra-tios. The logarithm of the odds of the dependent variables is ex-pressed as a linear combination of corresponding parameters. Itis on the assumption that data distributed multinomial. Logit mod-els are ‘‘ANOVA-like” models. They are formed by the log-ratios ofcell counts. Meanwhile, the cells in a given Logit are correspondingto pairs of values of the dependent variable. In order to choosethose features that optimal for the Logit model, stepwise methods,like those employed in MDA, are used with output of Logit as anassessment.
4.2.4. ANOVAOne-way ANOVA is employed to select features. It produces a
one-way analysis of variance for a quantitative dependent variableof financial state of a company by each single independent featureof financial ratio. An important step in ANOVA is the establishmentof the validity of assumptions. The hypothesis of the analysis isthat means of various features from different groups are equal.Actually, one-way ANOVA is an extension of two-sample t-test.And significantly different features between the two financialgroups, i.e. distress and health, could be obtained by the method.
4.2.5. t-TestThe independent-sample t-test is employed to select features.
This procedure compares means for two groups of samples. It isappropriate to be used for finding significantly different featuresbetween distress companies and healthy companies. Ideally, thesamples should be randomly assigned to two groups for this test.
As a result, any difference in response is due to the treatmentand not to other factors. While it is not the case if we compareaverage value for distressed companies and healthy companies. Acompany is not randomly assigned to be distressed or healthy. Insuch situations, we should ensure that differences in other factorsare not masking or enhancing a significant difference in means.Thus, it is financial ratios, not the absolute values in financial state-ments, employed. Meanwhile, it is Chinese listed companies fo-cused in this research. Taking data availability into consideration,it is acceptable to employ such mechanisms.
4.2.6. GAGenetic algorithms are adaptive heuristic search algorithms
based on the evolutionary ideas of natural selection and evolution.Since its first proposing by John Holland in the 1960s, GA has beenwidely applied in lots of fields. Those real world problems involvedfinding optimal parameters have been proved ideal for GA. wrap-per approach for feature selection is a vital area for application ofGA. Actually, there are two unique means to fulfill feature selectionby wrappers. One mean is to train the classifier or model with a gi-ven feature subset as an input and to estimate the classification er-ror using a validation set. All features are randomly composed ofthe so-called optimal feature subset in the trial-and-error proce-dure. This procedure is independent as a process of feature selec-tion, after which, optimal feature subset for the current classifieris obtained. The other mean to implement wrappers is to includethe process of feature selection into classifier or model training.The latter is also called as embedded method. Since the latter is aslower procedure and it would consume unacceptable time if wecarry out the experiment for 30 times, the former implementationof wrappers is utilized in this research.
4.3. Predicting business failure using CBR
Predicting business failure by CBR on the basis of optimal fea-ture subsets could be illustrated as Fig. 2. Since we attempt toinvestigate on whether or not the CBR system is sensitive to opti-
Fig. 2. Predicting business failure using CBR on the basis of various optimal feature subsets.
H. Li et al. / Expert Systems with Applications 37 (2010) 4811–4821 4815
mal feature subsets, the so-called optimal feature subsets must begenerated firstly. As we employ data-oriented feature selectionmethod, financial data are the foundation of feature selection.Using MDA, Logit, and CBR as assessment respectively, stepwisemethod and GA are employed to generate various feature subsets.On its basis, predictive accuracies are generated. This process is re-peated until the highest predictive ratio is achieved. As a result,corresponding optimal feature subsets are obtained. When t-testand one-way ANOVA are employed to generate optimal featuresubsets, significance values between the two groups, i.e. distressand health for BFP, are computed firstly. Then, features are chosento compose optimal feature subset on the foundation of signifi-cance values. Thus, the two corresponding optimal feature subsetsare obtained.
With the optimal feature subsets, we could get various reducedrepresentations of initial data. These reduced forms of financialdata are inputted into the CBR system. Euclidean distance betweeneach pair of cases could be calculated. On the foundation of the dis-tance, corresponding similarities could be achieved. Then, severalnearest neighbors to the current case could be retrieved. And cor-responding class labels of the k nearest neighbors to the currentcase are integrated to make a prediction. In this research, we adoptPan et al.’s (2007) operation in dealing with neighbor number ofthe algorithm of k-NN. We try 1NN,3NN, . . .,19NN to find the opti-mal algorithm of CBR with the data scaled into the range of [0,1]and the assessment of 30-times hold-out method.
4.4. Significance test under 30-times hold-out method
Significance test could be implemented by the way shown asFig. 3. In order to carry out significance test on predictive perfor-mances of CBR and comparative models on corresponding optimalfeature subsets, we plan to implement the experiment for tens oftimes. For the model of SVM, we attempt to employ the kernel ofRBF as Shin et al. (2005), Min and Lee (2005), Min et al. (2006),Hui and Sun (2006), Hua et al. (2007), Wu et al. (2007) did. Sincethere are two types of parameters to be optimized in SVM, i.e. Cand v, it is validating accuracy used for SVM if the technique ofcross-validation is employed. Meanwhile, it is testing accuracyused in various CBR models, MDA, and Logit.
In order to employ testing accuracy as an assessment for all themodels in the experiment, hold-out method is to be used. Collecteddata are split into two parts. One part, which occupies 30%, is uti-lized as testing data to generate testing accuracies. The other part,which occupies 70%, is utilized as training and validating dataset totrain classifiers. For various CBR models, MDA, and Logit, all data inthis part are used as training data. For SVM, the technique of leave-one-out cross-validation and grid search are employed to find opti-mal parameter values with all data in this part. Each time one sam-ple is taken out as validating data and the rest in this part is used totrain SVM. Grid-search technique is used to search optimal param-eter values in the candidate space.
The disadvantage of hold-out method is that its estimation onpredictive accuracy is biased. In order to tackle with this problem,we attempt to carry out this split for 30 times to carry out 30 timesof experiment, since enough computational resources could beachieved by nowadays computer technology. Thus, there are seri-als of testing accuracies generated from the 30 times experiments.For each model used, there are 30 testing accuracies which couldbe used to carry out significance test.
In order to find whether or not there exists significant predic-tive difference among various CBR models, MDA, Logit, and SVM,paired-samples t-test is employed. In the test, only two modelsare taken into consideration each time. Paired-samples t-test com-pares means of 30 testing accuracies generated by the two models.It computes the difference between the two models for each pair ofaccuracies, and tests to see whether the average difference is sig-nificantly different from zero. When carrying out paired-samplest-test, we make the assumption that there is no significant differ-ence between means of 30 testing accuracies generated by thetwo comparative models.
5. Data and experiment implementation
5.1. Data collection
Sample data used in this research are composed of financial ra-tios transformed from financial statements and correspondingtreatments by China Securities Supervision and Management Com-
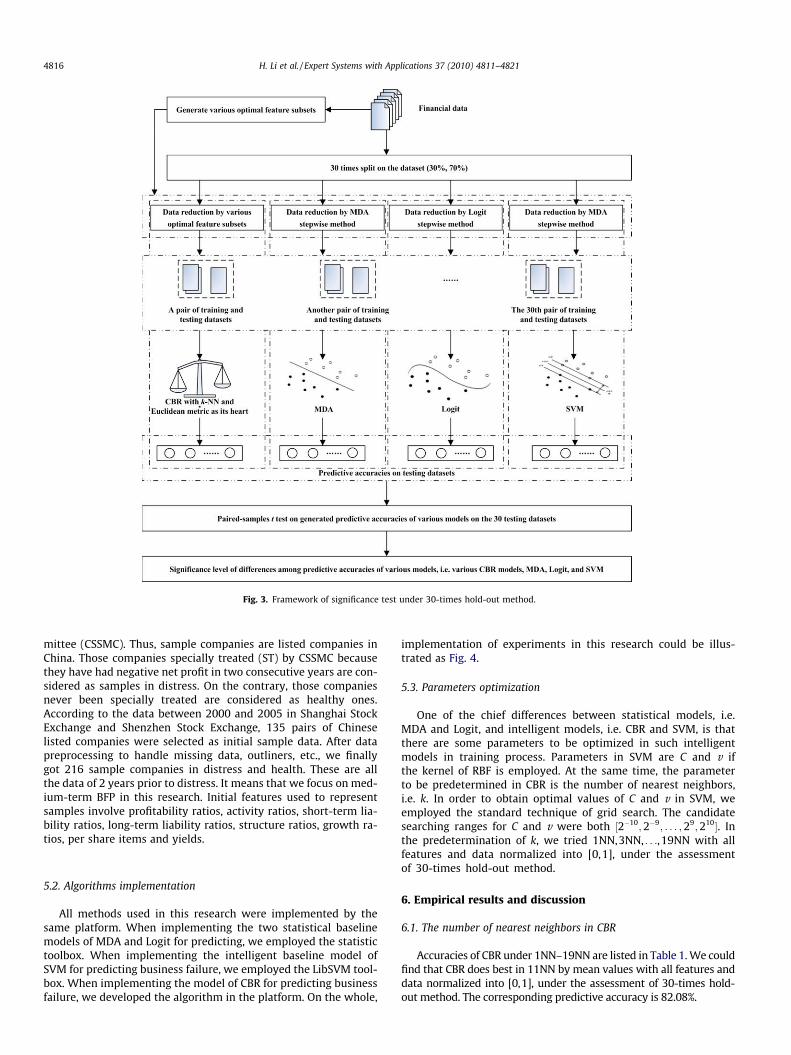
Fig. 3. Framework of significance test under 30-times hold-out method.
4816 H. Li et al. / Expert Systems with Applications 37 (2010) 4811–4821
mittee (CSSMC). Thus, sample companies are listed companies inChina. Those companies specially treated (ST) by CSSMC becausethey have had negative net profit in two consecutive years are con-sidered as samples in distress. On the contrary, those companiesnever been specially treated are considered as healthy ones.According to the data between 2000 and 2005 in Shanghai StockExchange and Shenzhen Stock Exchange, 135 pairs of Chineselisted companies were selected as initial sample data. After datapreprocessing to handle missing data, outliners, etc., we finallygot 216 sample companies in distress and health. These are allthe data of 2 years prior to distress. It means that we focus on med-ium-term BFP in this research. Initial features used to representsamples involve profitability ratios, activity ratios, short-term lia-bility ratios, long-term liability ratios, structure ratios, growth ra-tios, per share items and yields.
5.2. Algorithms implementation
All methods used in this research were implemented by thesame platform. When implementing the two statistical baselinemodels of MDA and Logit for predicting, we employed the statistictoolbox. When implementing the intelligent baseline model ofSVM for predicting business failure, we employed the LibSVM tool-box. When implementing the model of CBR for predicting businessfailure, we developed the algorithm in the platform. On the whole,
implementation of experiments in this research could be illus-trated as Fig. 4.
5.3. Parameters optimization
One of the chief differences between statistical models, i.e.MDA and Logit, and intelligent models, i.e. CBR and SVM, is thatthere are some parameters to be optimized in such intelligentmodels in training process. Parameters in SVM are C and v ifthe kernel of RBF is employed. At the same time, the parameterto be predetermined in CBR is the number of nearest neighbors,i.e. k. In order to obtain optimal values of C and v in SVM, weemployed the standard technique of grid search. The candidatesearching ranges for C and v were both ½2�10;2�9; . . . ;29;210�. Inthe predetermination of k, we tried 1NN,3NN, . . .,19NN with allfeatures and data normalized into [0,1], under the assessmentof 30-times hold-out method.
6. Empirical results and discussion
6.1. The number of nearest neighbors in CBR
Accuracies of CBR under 1NN–19NN are listed in Table 1. We couldfind that CBR does best in 11NN by mean values with all features anddata normalized into [0,1], under the assessment of 30-times hold-out method. The corresponding predictive accuracy is 82.08%.

H. Li et al. / Expert Systems with Applications 37 (2010) 4811–4821 4817
6.2. Optimal feature subsets
When GA is used to select optimal feature subset for CBR withinitial data, the best hit ratio is 86.6%. We use 200 generations.
Fig. 4. Algorithm implementa
Table 1Predictive accuracies of CBR in the search of k.
Dataset 1NN 3NN 5NN 7NN 9NN
1 73.43 87.50 76.56 79.68 75.002 82.81 76.56 73.43 75.00 87.53 68.75 76.56 81.25 81.25 75.004 81.25 84.37 85.93 78.12 71.875 68.75 79.68 82.81 87.5 79.686 78.12 76.56 73.43 79.68 79.687 78.12 79.68 78.12 81.25 73.438 75.00 78.12 78.12 71.87 81.259 70.31 75.00 84.37 76.56 82.8110 73.43 85.93 73.43 78.12 82.8111 73.43 79.68 75.00 85.93 76.5612 82.81 79.68 79.68 79.68 78.1213 71.87 75.00 76.56 81.25 78.1214 76.56 75.00 84.37 79.68 78.1215 75.00 76.56 79.68 82.81 75.0016 68.75 76.56 75.00 73.43 84.3717 73.43 75.00 85.93 82.81 76.5618 71.87 79.68 84.37 79.68 75.0019 71.87 79.68 82.81 81.25 79.6820 71.87 79.68 73.43 84.37 76.5621 73.43 78.12 78.12 85.93 75.0022 73.43 76.56 78.12 84.37 79.6823 73.43 84.37 78.12 81.25 84.3724 82.81 82.81 76.56 82.81 84.3725 76.56 81.25 68.75 75.00 85.9326 78.12 76.56 82.81 85.93 87.527 78.12 71.87 85.93 78.12 78.1228 82.81 84.37 78.12 78.12 78.1229 70.31 75.00 81.25 81.25 82.8130 75.00 76.56 75.00 78.12 84.37
Means 75.05 78.80 78.90 80.36 79.58
Evolution curve of fitness values is shown as Fig. 5. Optimal featuresubsets selected by stepwise method of MDA, Logit, t-test, ANOVAand GA are listed in Table 2. From Table 2 we could find that opti-mal features selected by independent-sample t-test and ANOVA
tions of the experiment.
11NN 13NN 15NN 17NN 19NN
85.93 79.68 79.68 85.93 79.6881.25 73.43 75.00 68.75 89.0682.81 78.12 81.25 87.50 82.8185.93 78.12 82.81 79.68 75.0085.93 85.93 82.81 82.81 81.2575.00 78.12 76.56 76.56 75.0084.37 68.75 84.37 90.62 68.7584.37 82.81 76.56 78.12 81.2578.12 85.93 89.06 82.81 87.5079.68 84.37 78.12 84.37 85.9381.25 76.56 75.00 81.25 85.9375.00 81.25 79.68 76.56 82.8182.81 75.00 76.56 78.12 76.5682.81 85.93 79.68 84.37 81.2581.25 75.00 73.43 87.5 84.3784.37 81.25 78.12 75.00 81.2578.12 87.5 73.43 79.68 82.8182.81 81.25 71.87 81.25 81.2581.25 76.56 71.87 89.06 82.8182.81 81.25 85.93 84.37 71.8778.12 81.25 81.25 82.81 81.2575.00 78.12 70.31 71.87 85.9378.12 85.93 75.00 75.00 82.8192.18 81.25 84.37 81.25 82.8189.06 79.68 87.5 87.50 78.1282.81 79.68 79.68 79.68 84.3782.81 82.81 82.81 73.43 79.6878.12 78.12 75.00 85.93 84.3784.37 84.37 78.12 85.93 79.6885.93 82.81 81.25 78.12 81.25
82.08 80.36 78.90 81.19 81.25

0 20 40 60 80 100 120 140 160 180 2000.78
0.79
0.8
0.81
0.82
0.83
0.84
0.85
0.86
0.87
generation
pred
ictiv
e ac
cura
cy
best fitvalue
mean fitvalue
Fig. 5. Evolution curve of fitness values.
Table 2Optimal feature subsets.
No. Methodsfeatures
MDA stepwisemethod
Logit stepwisemethod
t-Test
ANOVA GA
1 GIS – – X X –2 NIS – – X X X3 EBITTA – – X X –4 NPTA X X X X –5 NPCA X – X X –6 NPFA – – – – X7 PM – – X X –8 NPE X – X X –9 ART – – – – –10 IT – – – – –11 APT X X – – X12 TAT – – X X –13 CAT X X X X X14 FAT X X X X X15 CR – – X X X16 RCCL – – X X –17 ALR X X X X X18 EDR – X X X X19 RLTNA – – X X –20 RLMVE – – X X –21 PCL – – X X –22 PCATA – – – – –23 PFATA – – X X –24 PEFA – – X X –25 PCLTL – – X X –
4818 H. Li et al. / Expert Systems with Applications 37 (2010) 4811–4821
are the same, which consist of 24 features. Optimal feature subsetselected by MDA stepwise method consists of 7 features. That ofLogit stepwise method consists of 6 features, and that of GA con-sists of 10 features.
26 GRPB – – – – X27 GRTA – – X X –28 EPS – – X X X29 NAPS – – X X –30 CFPS – – X X –
6.3. Predictive results
Predictive results of CBR are generated by 11NN with data nor-malized into [0,1]. Thirty independent predictive accuracies andcorresponding means, S.D. and coefficient of variation generatedby CBR with optimal feature subsets obtained by MDA stepwise
Table 3Predictive performance of various models on 30 independent data sets.
Data sets 1 MDA-CBR 2 Logit-CBR 3 ANOV
1 87.50 89.06 75.002 85.93 87.50 82.813 87.50 85.93 82.814 84.37 85.93 82.815 85.93 84.37 85.936 89.06 90.62 81.257 87.50 85.93 89.068 82.81 82.81 78.129 82.81 82.81 81.2510 76.56 75.00 79.6811 81.25 81.25 76.5612 84.37 85.93 79.6813 85.93 84.37 84.3714 90.62 93.75 85.9315 84.37 84.37 79.6816 82.81 84.37 84.3717 84.37 84.37 84.3718 85.93 82.81 81.2519 84.37 84.37 79.6820 81.25 79.68 81.2521 84.37 84.37 75.0022 90.62 84.37 79.6823 82.81 82.81 79.6824 78.12 79.68 78.1225 82.81 82.81 76.5626 81.25 79.68 82.8127 87.50 89.06 84.3728 79.68 79.68 78.1229 85.93 84.37 84.3730 81.25 81.25 79.68Max. 90.62 93.75 89.06Min. 76.56 75.00 75.00Mean 84.32 84.11 81.14S.D. 3.34 3.69 3.38Coefficient of variance 0.040 0.044 0.042
method, Logit stepwise method, ANOVA, and GA are listed in Table 2.They are named as MDA-CBR, Logit-CBR, ANOVA-CBR, and GA-CBR
A-CBR 4 GA-CBR 5 MDA 6 Logit 7 SVM
89.06 82.81 84.37 82.8189.06 85.93 85.93 89.0685.93 85.93 87.50 85.9382.81 82.81 85.93 82.8185.93 85.93 84.37 85.9387.50 82.81 82.81 89.0687.50 82.81 85.93 85.9381.25 81.25 81.25 82.8184.37 89.06 87.50 82.8178.12 81.25 81.25 79.6879.68 81.25 84.37 82.8181.25 84.37 81.25 82.8185.93 84.37 85.93 85.9390.62 87.50 90.62 89.0684.37 85.93 85.93 87.5085.93 85.93 81.25 85.9381.25 82.81 81.25 84.3784.37 81.25 82.81 81.2581.25 81.25 79.68 84.3776.56 78.12 79.68 79.6881.25 84.37 85.93 89.0685.93 89.06 90.62 89.0679.68 76.56 79.68 84.3778.12 81.25 79.68 82.8178.12 81.25 85.93 82.8179.68 82.81 90.62 84.3787.50 87.50 89.06 92.1882.81 82.81 81.25 81.2584.37 82.81 84.37 85.9381.25 84.37 84.37 85.9390.62 89.06 90.62 92.1876.56 76.56 79.68 79.6883.38 83.54 84.37 84.94
3.72 2.89 3.35 3.050.045 0.035 0.040 0.036

Table 4p-Values of two-tailed paired-samples t-test between each pair of models.
Models MDA-CBR
Logit-CBR
ANOVA-CBR
GA-CBR MDA Logit
Logit-CBR
0.628a – – – – –
ANOVA- 4.7*** 3.956*** – – – –
H. Li et al. / Expert Systems with Applications 37 (2010) 4811–4821 4819
in Table 3. Meanwhile, corresponding predictive results produced byMDA, Logit, and SVM are also listed in Table 3. The map of predictiveresults is also shown as Fig. 6. The map of statistical indices of means,S.D. and coefficient of variation generated by the seven models areshown as Fig. 7. p-Values of two-tailed paired-samples t-test be-tween each pair-wise models of MDA-CBR, Logit-CBR, ANOVA-CBR,MDA, Logit and SVM are listed in Table 4.
CBRGA-CBR 2.3** 1.728* �3.35*** – – –MDA 1.36 0.89 �3.539*** �0.301 – –Logit �0.087 �0.37 �4.357*** �1.53 �1.834* –SVM �1.325 �1.646 �5.58*** �2.92*** �2.953*** �1.056
a p-Values.* Significant at the level of 10%.** Significant at the level of 5%*** Significant at the level of 1%.
6.4. Discussion
6.4.1. Predictive accuracyIn Table 3, the first two best values of statistical indices are
texted bold. We could find that SVM outperforms the othermodels on the whole. From Table 3 and mean map of Fig. 7we could find that SVM outperforms all the four CBR modelsand the two statistical models of MDA and Logit by 0.62%,0.83%, 3.8%, 1.56%, 1.4%, and 0.57%. CBR performs the best withthe predictive accuracy of 84.32% when MDA stepwise methodis employed to generate optimal feature subset. It outperformsMDA by 0.78% and is outperformed by Logit by 0.05%. When Lo-git stepwise method is employed to select optimal features, CBRalso produces better performance than MDA and worse perfor-mance than Logit. Otherwise, CBR produces worse performancethan MDA and Logit. At the same time, predictive accuracies ofCBR on the four optimal feature subsets vary strongly, whichcould be found in Fig. 7. It means that CBR is truly sensitiveto the choice of optimal features in BFP.
From Table 3 and variance maps of Fig. 7 we could find that MDAand SVM are the first two most stable models. For CBR systems, itachieves the most stable performance if the filter approach of MDAstepwise method is used to select optimal feature subset. On the con-trary, CBR produces the most unstable performance if the wrapperapproach of GA is employed as feature selection method.
Fig. 6. Map of correspondin
Fig. 7. Maps of stat
6.4.2. Significance testFrom Table 4 we could find that there are significantly different
predictive performances of the CBR systems between feature selec-tion methods of (MDA stepwise method, ANOVA) and (MDA step-wise method, GA) at least at the level of 5%. There are alsosignificantly different performances of the CBR systems betweenfeature selection methods of (Logit stepwise method, ANOVA)and (Logit stepwise method, GA). There are also significantly differ-ent performances of the CBR systems between feature selectionmethods of (GA, ANOVA). It means that MDA stepwise method isthe most optimal method to carry out feature selection for CBR.While, Logit stepwise method comes secondly. GA is the thirdchoice to find optimal feature subset for the CBR system in busi-ness failure selection. And ANOVA or t-test is not ideally applied.It also means that the filter approach is more applicable than thewrapper approach to be used in the selection procedure for opti-mal feature subset to some extent.
From Table 4 we could also find that there are no significant dif-ference in predictive accuracy between CBR and the two statistical
g predictive accuracies.
istical indices.
4820 H. Li et al. / Expert Systems with Applications 37 (2010) 4811–4821
models of MDA and Logit, if MDA stepwise method, Logit stepwisemethod, or GA is employed to select optimal feature subset for theCBR system in BFP. Otherwise, CBR is outperformed by MDA andLogit at the significant level of 1%.
Meanwhile, SVM outperforms CBR significantly at the level of1%, if ANOVA and GA are used as feature selection method of theCBR system. Otherwise, there is no significant difference in predic-tive accuracy between SVM and CBR. SVM also outperforms MDAsignificantly at the level of 1%. And there is no significant differenceon predictive accuracy between SVM and Logit.
7. Conclusion and remark
The conclusion of this research is that CBR is truly sensitive tooptimal feature subsets in medium-term BFP. The stepwise meth-ods of MDA and Logit, two filter approaches, are the first choicesfor CBR to select optimal feature subsets. The wrapper approachof GA is the third choice. ANOVA and t-test are the fourth choices.If a true optimal feature subset is used in the CBR-based predictionsystem, it could produce acceptable predictive accuracy. On thecontrary, the CBR system could possibly produce lower perfor-mance than other models. If MDA stepwise method and Logit step-wise method are employed to select optimal feature subset for theCBR system, there are no significant differences on predictive per-formances between CBR and the other three models, i.e. MDA, Lo-git, SVM. On the contrary, CBR is outperformed by the three modelsat the significant level of 1%, if ANOVA or t-test is used as featureselection method for CBR. If GA is utilized for CBR to select optimalfeature subset, there is no significant difference on predictive accu-racy between CBR and the two statistical models of MDA and Logit.Meanwhile, SVM outperforms CBR significantly at the level of 1%.
Note that the conclusion drawn out is under the circumstanceof experimental design. In this research, we combined leave-one-out cross-validation and hold-out method to form 30-times hold-out method and use the new way as assessment. The parameterof nearest neighbors should be predetermined in the CBR system.We tried 1NN,3NN, . . .,19NN to find the optimal value of nearestneighbors under the assessment of 30-times hold-out method.The finding is that 11NN is an optimal choice. When employingthe wrapper approach of GA to select optimal feature subset, weused the assessment of leave-one-out cross-validation since theembed approach of GA into 30-times hold-out method would con-sume unacceptable computing cost. Since performances of CBR andSVM yield to be underestimated if data are not normalized, weused Min–Max normalization to scale all data into the range of[0,1]. We also used MDA stepwise method to select optimal featuresubset for SVM. Meanwhile, the data employed are collected fromShenzhen Stock Exchange and Shanghai Stock Exchange in China.At the same time, this research provides evidence on CBR’s sensi-tivity to optimal feature subsets from the view of the data twoyears prior to distress in China. It is also of interest whether thisconclusion can be drawn for BFP or some other countries.
Acknowledgements
This research is partially supported by the National Natural Sci-ence Foundation of China (No. 70801055) and the Zhejiang Provin-cial Natural Science Foundation of China (No. Y6090392). Theauthors gratefully thank anonymous referees for their recommen-dations and editors for their work.
References
Aamodt, A., & Plaza, E. (1994). Case-based reasoning: Foundation issues,methodological variations, and system approach. AI Communications, 7(1),39–59.
Adya, M., & Collopy, F. (1998). How effective are neural networks at forecastingand prediction? A review and evaluation. Journal of Forecasting, 17(5),481–495.
Aha, D. W., Kibler, D., & Albert, M. (1991). Instance-based learning algorithms.Machine Learning, 6, 37–66.
Ahn, H., & Kim, K. (2009). Bankruptcy prediction modeling with hybrid case-basedreasoning and genetic algorithms approach. Applied Soft Computing, 9(2),599–607.
Altman, E. I. (1968). Financial ratios, discriminant analysis and the prediction ofcorporate bankruptcy. Journal of Finance, 23(4), 589–609.
Back, B., Laitinen, T., & Sere, K. (1996). Neural network and genetic algorithm forbankruptcy prediction. Expert Systems with Applications, 11(4), 407–413.
Beaver, W. (1966). Financial ratios as predictors of failure. Journal of AccountingResearch, 4, 71–111.
Bryant, S. M. (1997). A case-based reasoning approach to bankruptcy predictionmodeling. Intelligent Systems in Accounting, Finance and Management, 6,195–214.
Canbas, S., Cabuk, A., & Kilic, S. B. (2005). Prediction of commercial bank failure viamultivariate statistical analysis of financial structure: The Turkish case.European Journal of Operational Research, 166, 528–546.
Chauhan, N., Ravi, V., & Chandra, D. (2009). Differential evolution trained waveletneural networks: Application to bankruptcy prediction in banks. Expert Systemswith Applications, 36(4), 7659–7665.
Chen, W., & Du, Y. (2009). Using neural networks and data mining techniques forthe financial distress prediction model. Expert Systems with Applications, 36(2),4075–4086.
Cho, S., Kim, J., & Bae, J. (2009). An integrative model with subject weight based onneural network learning for bankruptcy prediction. Expert Systems withApplications, 36(1), 403–410.
Cost, S., & Salzberg, S. (1993). A weighted nearest neighbor algorithm for learningwith symbolic features. Machine Learning, 10, 57–78.
Finnie, G., & Sun, Z. (2003). R5 model for case-based reasoning. Knowledge-BasedSystems, 16(1), 59–65.
Grice, J. S., & Ingram, R. W. (2001). Tests of the generalizability of Altman’sbankruptcy prediction model. Journal of Business Research, 54(1), 53–61.
Guyon, I., & Elisseeff, A. (2003). An introduction to variable and feature selection.Journal of Machine Learning Research, 3, 1157–1182.
Hammond, K. J. (1989). Case-based planning. San Diego, CA: Academic Press.Härdle, W., Lee, Y., Schäfer, D., & Yeh, Y.-R. (2009). Variable selection and
oversampling in the use of smooth support vector machines for predictingthe default risk of companies. Journal of Forecasting, 28(6), 512–534.
Hua, Z.-S., Wang, Y., Xu, X.-Y., et al. (2007). Predicting corporate financial distressbased on integration of support vector machine and logistic regression. ExpertSystems with Applications, 33, 434–440.
Hui, X.-F., & Sun, J. (2006). An application of support vector machine to companies’financial distress prediction. Lecture Notes in Artificial Intelligence, 3885,274–282.
Jo, H., & Han, I. (1996). Integration of case-based forecasting, neural network, anddiscriminant analysis for bankruptcy prediction. Expert Systems withApplications, 11(4), 415–422.
Jo, H., Han, I., & Lee, H. (1997). Bankruptcy prediction using case-based reasoning,neural network and discriminant analysis for bankruptcy prediction. ExpertSystems with Applications, 13(2), 97–108.
Jones, S., & Hensher, D. A. (2004). Predicting firm financial distress: A mixed Logitmodel. Accounting Review, 79(4), 1011–1038.
Keane, M. T. (1988). Analogical problem solving. Chichester, West Sussex, England:Ellis Horwood.
Kolodner, J. L. (1983). Reconstructive memory, a computer model. Cognitive Science,7, 281–328.
Kolodner, J. L. (1992). An introduction to case-based reasoning. Artificial IntelligenceReview, 6(1), 3–34.
Kolodner, J. L. (1993). Case-based reasoning. San Francisco: Morgan Kaufman.Kolodner, J. L., & Mark, W. (1992). Case-based reasoning. IEEE Expert, 7(5),
5–6.Lee, K. C., Han, I., & Kwon, Y. (1996). Hybrid neural network models for bankruptcy
predictions. Decision Support Systems, 18, 63–72.Leshno, M., & Spector, Y. (1996). Neural network prediction analysis: The
bankruptcy case. Neurocomputing, 10, 125–147.Li, H., & Sun, J. (2009). Hybridizing principles of the Electre method with case-based
reasoning for data mining: Electre-CBR-I and Electre-CBR-II. European Journal ofOperational Research, 197(1), 214–224.
Li, H., Sun, J., & Sun, B.-L. (2009). Financial distress prediction based on OR-CBR inthe principle of k-nearest neighbors. Expert systems with Applications, 36(1),643–659.
Liao, T. W., Zhang, Z., & Mount, C. R. (1998). Similarity measures for retrieval in case-based reasoning systems. Applied Artificial Intelligence, 12, 267–288.
Lin, T. (2009). A cross model study of corporate financial distress prediction inTaiwan: Multiple discriminant analysis, logit, probit and neural networksmodels. Neurocomputing, 72(16–18), 3507–3516.
Lin, F.-Y., & McClean, S. (2001). A data mining approach to the prediction ofcorporate failure. Knowledge-based systems, 14, 189–195.
Lin, R., Wang, Y., Wu, C., & Chuang, C. (2009). Developing a business failureprediction model via RST, GRA and CBR. Expert Systems with Applications, 36(2),1593–1600.
Martin, D. (1977). Early warning of bank failure: A Logit regression approach.Journal of Banking and Finance, 1, 249–276.
H. Li et al. / Expert Systems with Applications 37 (2010) 4811–4821 4821
McKenzie, D. P., & Forsyth, R. S. (1995). Classification by similarity: An overview ofstatistical methods of case-based reasoning. Computer in Hunan Behavior, 11(2),273–288.
Min, J.-H., & Lee, Y.-C. (2005). Bankruptcy prediction using support vector machinewith optimal choice of kernel function parameters. Expert Systems withApplications, 28, 603–614.
Min, S.-H., Lee, J.-M., & Han, I. (2006). Hybrid genetic algorithms and support vectormachines for bankruptcy prediction. Expert Systems with Applications, 31,652–660.
Nam, C., Kim, T., Park, N., & Lee, H. (2008). Bankruptcy prediction using a discrete-time duration model incorporating temporal and macroeconomicdependencies. Journal of Forecasting, 27(6), 493–506.
Odom, M., & Sharda, R. (1990). A neural networks model for bankruptcy prediction.In Proceedings of international joint conference on neural networks, San Diego, CA(pp. 163–168).
Ohlson, J. A. (1980). Financial rations and the probabilistic prediction of bankruptcy.Journal of Accounting Research, 18, 109–131.
Pal, S. K., Dillon, T. S., & Yeung, D. S. (2001). Soft computing in case-based reasoning.London: Springer.
Pal, S. K., & Mitra, P. (2004). Case generation using rough sets with fuzzyrepresentation. IEEE Transactions on Knowledge and Data Engineering, 16(3).
Pal, S. K., & Shiu, S. C. K. (2004). Foundations of soft case-based reasoning. New Jersey:Wiley & Sons.
Pan, R., Yang, Q., & Pan, J. (2007). Mining competent case bases for case-basedreasoning. Artificial Intelligence, 171(16–17), 039–1068.
Park, C.-S., & Han, I. (2002). A case-based reasoning with the feature weightsderived by analytic hierarchy process for bankruptcy prediction. Expert Systemswith Applications, 23(3), 255–264.
Pernkopf, F. (2005). Bayesian network classifiers versus selective k-NN classifier.Pattern Recognition, 38, 1–10.
Ravi, V., & Pramodh, C. (2008). Threshold accepting trained principal componentneural network and feature subset selection: Application to bankruptcyprediction in banks. Applied Soft Computing, 8(4), 1539–1548.
Salchenberger, L., Mine, C., & Lash, N. (1992). Neural networks: A tool for predictingthrift failures. Decision Sciences, 23, 899–916.
Schank, R. (1982). Dynamic memory: A theory of learning in computers and people.New York: Cambridge University Press.
Serrano-Cinca, C. (1996). Self organizing neural networks for financial diagnosis.Decision Support Systems, 17, 227–238.
Shin, K.-S., Lee, T.-S., & Kim, H.-J. (2005). An application of support vector machinesin bankruptcy prediction model. Expert Systems with Applications, 28, 127–135.
Smyth, B., & Keane, M. T. (1998). Adaptation-guided retrieval: Questioning thesimilarity assumption in reasoning. Artificial Intelligence, 102, 249–293.
Sun, J., & Hui, X.-F. (2006). Financial distress prediction based on similarityweighted voting CBR. Lecture Notes in Artificial Intelligence, 4093, 947–958.
Sun, J., & Li, H. (2008a). Listed companies’ financial distress prediction based onweighted majority voting combination of multiple classifiers. Expert Systemswith Applications, 35(3), 818–827.
Sun, J., & Li, H. (2008b). Data mining method for listed companies’ financial distressprediction. Knowledge-Based Systems, 21, 1–5.
Tam, K. Y. (1991). Neural network models and the prediction of bank bankruptcy.Omega, 19(5), 429–445.
Tseng, F., & Hu, Y. (2009). Comparing four bankruptcy prediction models: Logit,quadratic interval logit, neural and fuzzy neural networks. Expert Systems withApplications, 37(3), 1846–1853.
Tversky, A. (1977). Features of similarity. Psychological Review, 84(4), 327–352.Watson, I. (1997). Applying case-based reasoning: Techniques for enterprise systems.
San Francisco: Morgan Kaufman.Watson, I. (1999). Case-based reasoning is a methodology not a technology.
Knowledge-Based Systems, 12, 303–308.Wilson, R. L., & Sharda, R. (1994). Bankruptcy prediction using neural networks.
Decision Support Systems, 11, 545–557.Wu, C.-H., Tzeng, G.-H., Goo, Y.-J., et al. (2007). A real-valued genetic algorithm to
optimize the parameters of support vector machine for predicting bankruptcy.Expert Systems with Applications, 32(2), 397–408.
Yang, Z. R., Platt, M. B., & Platt, H. D. (1999). Probability neural network inbankruptcy prediction. Journal of Business Research, 44, 67–74.
Yip, A. Y. N. (2004). Predicting business failure with a case-based reasoningapproach. Lecture Notes in Computer Science, 3215, 665–671.
Youn, H., & Gu, Z. (2010). Predicting Korean lodging firm failures: An artificial neuralnetwork model along with a logistic regression model. International Journal ofHospitality Management, 29(1), 120–127.