on-road monitoring of innovative taper - issue - trl monitoring of innovative... · element of risk...
TRANSCRIPT

Road Workers’ Safety Forum
Trials Team
Trial Report: On-Road Monitoring of Innovative Taper
M25 Motorway, 2007-2008

i
TABLE OF CONTENTS
1 INTRODUCTION.......................................................................................1
1.1 Description of Innovative Taper Technique.............................................................. 2
1.2 History of Development and Evaluation of Innovative Taper ................................. 3
2 TRIAL METHOD .......................................................................................5
2.1 Data collection for taper placement and retrieval. ................................................... 5
2.2 Traffic data analysis. ................................................................................................... 7
2.3 User assessments ....................................................................................................... 7
3 RESULTS................................................................................................10
3.1 On-road monitoring of the taper placement and retrieval..................................... 10
3.2 Traffic data analysis .................................................................................................. 11
3.3 Car driver perception assessment........................................................................... 14
3.4 Heavy goods vehicle driver perception assessment............................................. 20
3.5 Road worker benefits assessment .......................................................................... 23
4 CONCLUSIONS AND SUMMARY..........................................................27
Car and Truck Driver Questionnaire.................................................................................... 29

RoWSaF Trials Team Trial Report On-Road Monitoring of Innovative Taper Version: Issue (October 2008)
1
1 INTRODUCTION Road works are a necessary part of the maintenance of a modern road network and
temporary lane closures are an essential tool that enables maintenance operations to
be carried out safely. The Road Workers’ Safety Forum Trials Team exists to trial
equipment and techniques that can improve the safety of road workers. This includes
any measures that have the potential to reduce risk to personnel involved in the
installation and removal of lane closures.
The most hazardous activity in closing a live lane is establishing the initial angled line
of cones that closes the lane, known as the “cone taper”. Although the introduction
(championed by RoWSaF) of sequentially flashing road danger lamps on the cone
taper has reduced taper collisions by a significant amount, there is still a significant
element of risk to the road workers involved in setting out the taper.
One potential method to improve the safety of road workers is to reduce the time
spent in the carriageway installing and removing lane closures. An innovative cone
taper layout that was designed to achieve this safety improvement was proposed to
RoWSaF by Carillion plc. This method (referred to as the “innovative taper” in this
report) was designed to reduce the number of cones required in a cone taper and
thus reduce the time taken to install and/or remove a lane closure.
This report presents the findings of a limited area roll-out of the innovative taper,
which was conducted following successful off-road trials and an initial deployment of
the technique on a live carriageway. It provides a description of the technique, its
development and the effects of the innovative taper on road worker and road user
safety.
RoWSaF Trials Team Trial Report On-Road Monitoring of Innovative Taper Version: Issue (October 2008)
2
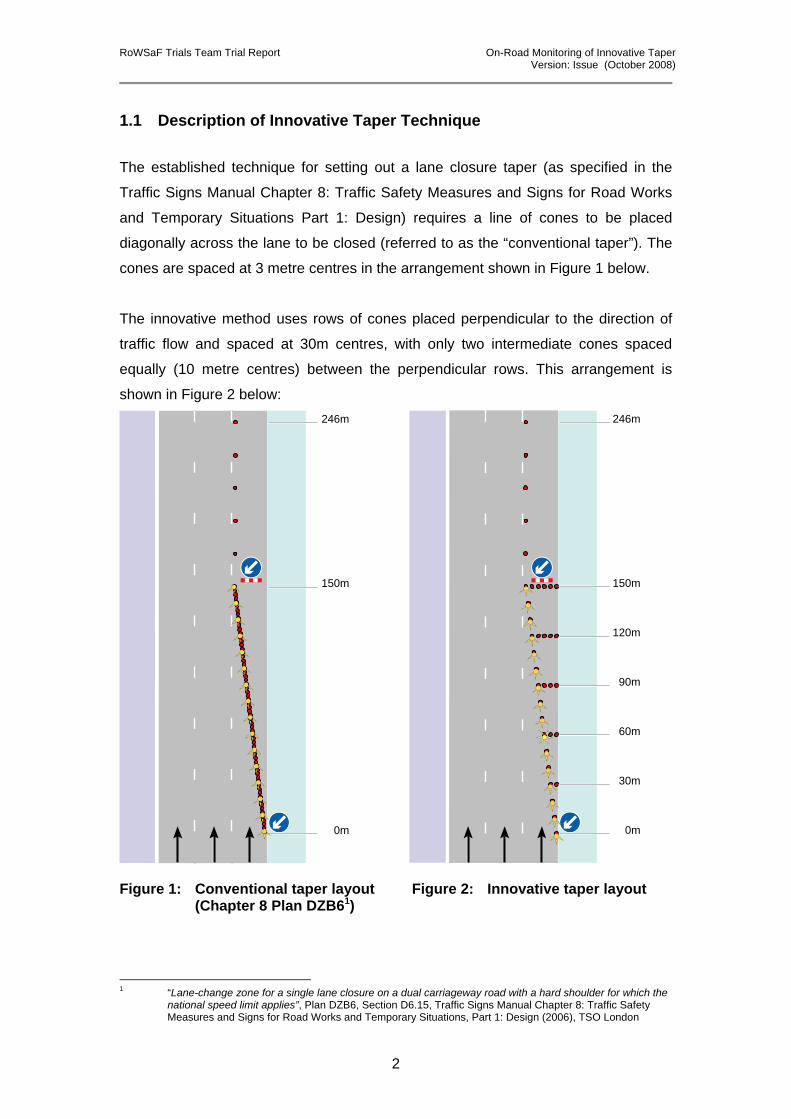
1.1 Description of Innovative Taper Technique
The established technique for setting out a lane closure taper (as specified in the
Traffic Signs Manual Chapter 8: Traffic Safety Measures and Signs for Road Works
and Temporary Situations Part 1: Design) requires a line of cones to be placed
diagonally across the lane to be closed (referred to as the “conventional taper”). The
cones are spaced at 3 metre centres in the arrangement shown in Figure 1 below.
The innovative method uses rows of cones placed perpendicular to the direction of
traffic flow and spaced at 30m centres, with only two intermediate cones spaced
equally (10 metre centres) between the perpendicular rows. This arrangement is
shown in Figure 2 below:
0m
150m
246m
0m
150m
120m
90m
60m
30m
246m
Figure 1: Conventional taper layout Figure 2: Innovative taper layout (Chapter 8 Plan DZB61)
1 “Lane-change zone for a single lane closure on a dual carriageway road with a hard shoulder for which the
national speed limit applies”, Plan DZB6, Section D6.15, Traffic Signs Manual Chapter 8: Traffic Safety Measures and Signs for Road Works and Temporary Situations, Part 1: Design (2006), TSO London
RoWSaF Trials Team Trial Report On-Road Monitoring of Innovative Taper Version: Issue (October 2008)
3
The innovative taper requires only 31 cones to establish a single lane closure
compared to the 51 cones required to establish a lane closure using a conventional
taper. The reduced number of cones in the innovative taper is balanced by the
arrangement of perpendicular rows which gives the appearance of a “wall” of cones
and thus the illusion of solidity to the taper. A further benefit of the reduced number of
cones required for the innovative taper is a reduced manual handling requirement,
estimated by industry to be around 50% of that of deploying a conventional taper.
1.2 History of Development and Evaluation of Innovative Taper
The innovative taper layout was originally suggested to the Road Workers’ Safety
Forum (RoWSaF) by Carillion. The development and evaluation of the innovative
taper by RoWSaF took place in three stages:-
1) An off-road trial at TRL’s test track was carried out on 30th November 2006 by
the RoWSaF Trials Team. This trial took place to evaluate the concept and
develop an optimum design for the innovative taper. Stakeholders from
RoWSaF and the wider traffic management industry were present to provide
their feedback and assist with development suggestions. The outcome of the
trial was the design shown in Figure 2 above. The positive reception from
RoWSaF encouraged Carillion and the Highways Agency to propose an initial
deployment of the innovative taper on a section of the network in Area 8 with
low traffic flow.
2) A pilot deployment on a live carriageway took place on the M45 motorway on
17th May 2007 under the control of CarillionWSP. Members of RoWSaF and
key stakeholders from the traffic management industry were again present as
observers. Comparison measurements were taken of traffic behaviour when
approaching an innovative and conventional taper and video and still
photographs were taken of the trial. A detailed chronology was also made of
deployment and removal of each taper type to establish the potential level of
time savings from the new technique. The monitoring of the trial was
documented in a Trials Team report presented to the RoWSaF Working
Group.2
2 Road Worker Safety Forum Trials Team Trial Report: On-Road Evaluation of Innovative Taper M45
motorway, 17th May 2007 (2007), Report version 2.01, dated June 2007 ,TRL Limited, Wokingham

RoWSaF Trials Team Trial Report On-Road Monitoring of Innovative Taper Version: Issue (October 2008)
4
3) The initial deployment of the innovative taper on the M45 was considered
sufficiently successful to warrant a limited area roll-out in Area 5, again under
the control of Carillion. Approval was sought from the Agency to undertake
multiple deployments of the innovative taper in live traffic conditions over a
period of several months. These trials were monitored on site and from traffic
data, with user perceptions of the new taper measured in a parallel exercise.
This report summarises the findings from the monitoring of the limited area roll-out
and supporting work carried out by the Trials Team.

RoWSaF Trials Team Trial Report On-Road Monitoring of Innovative Taper Version: Issue (October 2008)
5
2 TRIAL METHOD Monitoring and evaluation of the limited area roll-out of the innovative taper took
place over a number of months (late 2007 - 2008). The programme of work
comprised five main parts:
2.1 Data collection for taper placement and retrieval.
Three sources of data were collected for the trial.
2.1.1 Video and photographic data
Video data of sample night-time deployment of the innovative taper were collected
from a suitable vantage point (a bridge adjacent to the taper). The main site-based
monitoring was carried out between Junction 9 and 10 of the M25 in March 2008.
Figures 1 and 2 - Views of innovative taper from an overbridge, M25.
Members of the Trials Team observed the setting-out process of the innovative taper
that was being used to establish the Lane 1 closure. The setting-out process was
recorded both by video and stills photography. Once the lane closure was
established, car driver’s eye height video data was recorded of the innovative taper
and a conventional taper set out on the opposite carriageway. Two sets of video data
were collected for each taper. The first of these involved the taper in Lane 1 being
approached in Lane 1 with a lane change manoeuvre from Lane 1 to Lane 2 carried
out adjacent to the taper. A second set of video data was collected by approaching
the taper in Lane 2 with no lane change manoeuvre taking place.

RoWSaF Trials Team Trial Report On-Road Monitoring of Innovative Taper Version: Issue (October 2008)
6
Further video data were collected for both types of taper as it was known from
previous Trials Team work on road works signing that visual perception is dependent
on viewing angle. With the assistance of Carillion, video data were collected for both
innovative and conventional tapers from a heavy goods (traffic management) vehicle.
This gave a driver’s eye viewing height of approximately 2.9m, compared to
approximately 1.1m for the video data collected from the car driver’s eye height.
2.1.2 Traffic flow data
As part of the limited area roll-out, the Area 5 team at Carillion were requested to
provide the Trials Team with locations and dates of road works activity where
innovative tapers were used. Similar data were also requested for conventional
tapers for the purposes of comparison.
This information was then used to acquire traffic flow data for road works using both
types of taper. As part of the roll-out, Carillion were also requested to collect any
details of taper strikes for both conventional and innovative tapers. These two
sources of data were required to provide an indication of how many vehicles had
passed the innovative taper, how many collisions had occurred and hence assess
the safety of the innovative taper relative to a conventional cone taper arrangement.
2.1.3 Deployment and removal time data
The Area 5 team were also asked to record the time taken to deploy and retrieve the
innovative taper. This was required to give a clearer indication of the time savings
that could be achieved through the application of the technique, as the earlier off-
road and on-road trials had demonstrated some variability in timings.
The earlier variability was thought to result from the lack of experience of the traffic
management personnel involved in deploying and removing the innovative tapers
under trial conditions. It was anticipated that wider use of the technique and thus
personnel gaining experience in its use would give a more robust indication of
potential time savings and the consequent reduction in risk from exposure to live
traffic.

RoWSaF Trials Team Trial Report On-Road Monitoring of Innovative Taper Version: Issue (October 2008)
7
2.2 Traffic data analysis.
An essential part of the limited area roll-out was assessing any potential change in
risk to road users arising from the use of the innovative taper.
The level of exposure to traffic for innovative and conventional tapers was calculated
based on the average number of vehicles passing each type of taper during the
limited area roll-out. This ensured that the conventional and innovative tapers were
used on roads with similar levels of traffic flow.
The only measure of collision risk that could be obtained from the limited area roll-out
was to examine the number of collisions with each taper type and compensate for
exposure to traffic. Industry reports suggest that the number of collisions with tapers
has dropped significantly as a consequence of the use of sequentially flashing road
danger lamps (SFRDLs) on the taper. This made it unlikely that a collision with the
taper would occur as SFRDLs were used on each innovative taper deployed.
It was therefore assumed that if the results of the comparison of collision rates
showed that the rates were equivalent then the collision risk to road users from the
use of the innovative taper could be considered to be no greater than for the use of a
conventional taper.
2.3 User assessments
User assessments were carried out to provide data on the public and workforce
perceptions of the innovative taper.
2.3.1 Car driver perception assessment.
Video data of the innovative and conventional tapers taken from the car driver’s eye
height were processed to produce a series of video excerpts. These were normalised
as far as possible to ensure that each started 200m away from the taper, continued
through to the end of works and was around 35 seconds in length.

RoWSaF Trials Team Trial Report On-Road Monitoring of Innovative Taper Version: Issue (October 2008)
8
Eight excerpts were prepared, which were divided into two sets; one for daylight
(taken from the M45 pilot deployment video data) and one for night-time (from the
M25 limited area roll-out video data) as shown in Table 1.
Excerpt set
Lighting conditions & video data source
Taper type Approach lane
Excerpt designation
Daylight (M45) Conventional 1 DC1
Daylight (M45) Innovative 1 DI1
Daylight (M45) Conventional 2 DC2 1
Daylight (M45) Innovative 2 DI2
Night-time (M25) Conventional 1 NC1
Night time (M25) Innovative 1 NI1
Night time (M25) Conventional 2 NC2 2
Night time (M25) Innovative 2 NI2
Table 1: Arrangement of car driver perception assessment video excerpts
Each set contains two pairs of excerpts. Each pair of excerpts compared
conventional and innovative tapers viewed from the same lane. To offset any
potential bias in the results, the presentation order was randomised. Each participant
was shown one of the two sets (four excerpts in total).
Instructions to the participants were carefully worded to avoid alerting the participants
to look for differences in the traffic management (see Appendix for the participant
questionnaire). The participant was shown the first two excerpts from the set and
asked a number of questions. They were then shown the remaining excerpts and
asked further questions.
Participants were members of the public who held current driving licences and drove
on a regular basis. Whilst efforts were made to ensure a broad demographic, there
was nevertheless a weighting towards females under 30. All participants held a full
driving licence for Category B vehicles (car / light van) and were regular drivers.

RoWSaF Trials Team Trial Report On-Road Monitoring of Innovative Taper Version: Issue (October 2008)
9
2.3.2 Heavy Goods Vehicle driver perception assessment.
A similar methodology was used for the heavy goods vehicle (HGV) driver perception
assessment as for the car driver perception assessment. The night-time video data
collected from the HGV driver’s eye view was processed to produce a series of video
excerpts similar to those described in Section 2.3.1. HGV driver perception was
measured using the same questionnaire structure employed for the car driver
perception assessment, with the key difference being that the number of sets of
excerpts was halved as only night-time assessments were carried out with the HGV
drivers.
Members of the Trials Team surveyed 16 HGV drivers at the M25 South Mimms
motorway service area. The age range of drivers was wider than for the car drivers
and the sample was biased towards males.
2.3.3 Road worker benefits assessment
This assessment was carried out to examine the level of acceptance of the
innovative taper technique amongst operatives experienced in its use. The
assessment was also intended to identify any operational issues that could arise from
the use of the innovative taper.
A group of 37 traffic management operatives who had been using the innovative
taper technique during the limited area roll-out were invited to participate in a survey.
This survey was carried out on behalf of the Trials Team by a traffic management
contractor working with Carillion and the results provided to the Trials Team for
analysis and reporting.

RoWSaF Trials Team Trial Report On-Road Monitoring of Innovative Taper Version: Issue (October 2008)
10
3 Results
3.1 On-road monitoring of the taper placement and retrieval
Observations of the deployment of an innovative taper made during the collection of
video and still photography data showed that the taper took around ten minutes to
install on a live lane closure when deployed from a traffic management installation
vehicle.
Further deployment and removal time data were collected for the Trials Team. This
data was obtained by Carillion from Associated Asphalt Traffic Management, one of
Carillion’s sub-contractors. It was reported that across the installation of 520
innovative tapers, the average time taken to install the taper was between six and
seven minutes, with the average time taken for taper removal of six minutes. Further
time data were obtained directly from Carillion Traffic Management, which stated:
“Carillion Traffic Management has been trailing [sic] the new taper system
on Area 5 ... using four T[raffic] M[anagement] Gangs, Monday to Friday.
In this time we have installed over 150 closures using the new taper....
The feed back [from the operatives] indicates that is that it is now taking
them less time than when they first started. Time is now down to 10
minutes when dropped from the Traffic Management Installation Vehicle
and 5 minutes if it is just being walked on from the side of the road.”3
This time data suggests that the average time taken to deploy or remove an
innovative taper is 6-10 minutes. For comparison, the time reported by the traffic
management industry for an experienced traffic management crew to place or
remove a conventional taper is 15 - 20 minutes.
The data suggest that a 50-70% reduction in time to deploy a single lane closure
taper was achieved by using the innovative layout. This has the potential to
significantly reduce road worker exposure to risk by reducing the time taken to set
out and remove temporary traffic management. 3 Carillion Traffic Management Memo A109.CH.MEMO.081 from Chris Heyball to Andy Hicks, dated 2nd
October 2008

RoWSaF Trials Team Trial Report On-Road Monitoring of Innovative Taper Version: Issue (October 2008)
11
3.2 Traffic data analysis
An indication of exposure of the innovative taper to traffic in the trial area was
calculated by obtaining traffic count data (from the HA’s MIDAS network and from the
NTCC) for 34 innovative taper deployments and 10 conventional taper deployments.
For the deployments examined, the traffic data indicated that a total of 71,464
vehicles had passed by innovative taper works during the two sampling periods. This
gave an average (mean) of 2,102 vehicles passing each innovative taper. The traffic
counts at the sites where conventional tapers had been deployed totalled 29,193
vehicles, giving an average (mean) of 2,919 vehicles passing each conventional
taper.
The difference between the two average traffic counts is a consequence of the much
larger range in the innovative tapers (between 178 – 4,376 vehicles) compared to the
smaller sample of conventional tapers (1,749 – 4,183 vehicles). However, the counts
were of similar magnitude and thus traffic levels past each type of taper were
considered comparable.
Data from the two sampling periods are presented in Table 2 (conventional taper
deployments) and Table 3 (innovative taper deployments):
Date Road Junctions Carriageway Count Source
05/06/2008 M25 J10-11 B 3710 MIDAS 09/06/2008 M25 J5-6 A 2609 MIDAS 10/06/2008 M25 J4 B 1749 MIDAS 10/06/2008 M25 J3-4 A 2029 MIDAS 12/06/2008 M25 J8-9 A 3474 MIDAS 16/06/2008 M25 J9 B 2881 MIDAS 17/06/2008 M25 J8-9 A 3288 MIDAS 20/06/2008 M25 J8-9 B 4183 MIDAS 24/06/2008 M25 J9-10 B 1787 MIDAS 25/06/2008 M25 J8-9 B 3483 MIDAS
Total Flow 29193 Table 2 - Flow Data for Conventional Taper Deployments
RoWSaF Trials Team Trial Report On-Road Monitoring of Innovative Taper Version: Issue (October 2008)
12
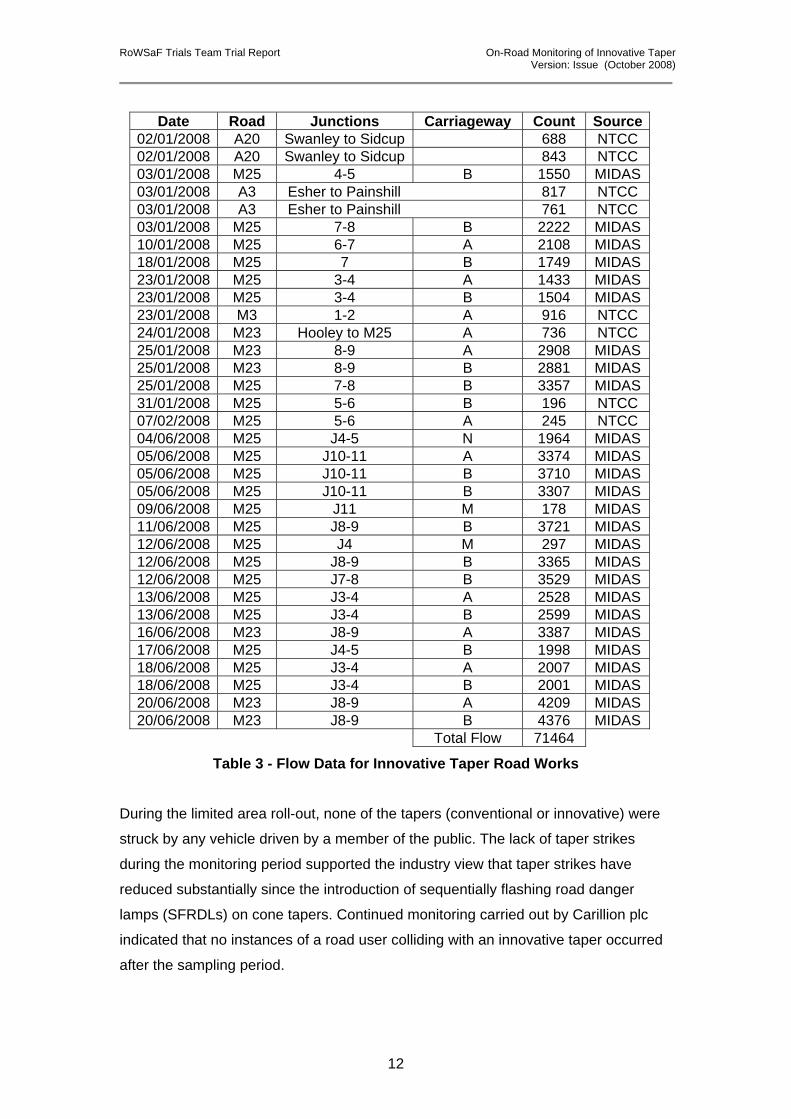
Date Road Junctions Carriageway Count Source
02/01/2008 A20 Swanley to Sidcup 688 NTCC 02/01/2008 A20 Swanley to Sidcup 843 NTCC 03/01/2008 M25 4-5 B 1550 MIDAS 03/01/2008 A3 Esher to Painshill 817 NTCC 03/01/2008 A3 Esher to Painshill 761 NTCC 03/01/2008 M25 7-8 B 2222 MIDAS 10/01/2008 M25 6-7 A 2108 MIDAS 18/01/2008 M25 7 B 1749 MIDAS 23/01/2008 M25 3-4 A 1433 MIDAS 23/01/2008 M25 3-4 B 1504 MIDAS 23/01/2008 M3 1-2 A 916 NTCC 24/01/2008 M23 Hooley to M25 A 736 NTCC 25/01/2008 M23 8-9 A 2908 MIDAS 25/01/2008 M23 8-9 B 2881 MIDAS 25/01/2008 M25 7-8 B 3357 MIDAS 31/01/2008 M25 5-6 B 196 NTCC 07/02/2008 M25 5-6 A 245 NTCC 04/06/2008 M25 J4-5 N 1964 MIDAS 05/06/2008 M25 J10-11 A 3374 MIDAS 05/06/2008 M25 J10-11 B 3710 MIDAS 05/06/2008 M25 J10-11 B 3307 MIDAS 09/06/2008 M25 J11 M 178 MIDAS 11/06/2008 M25 J8-9 B 3721 MIDAS 12/06/2008 M25 J4 M 297 MIDAS 12/06/2008 M25 J8-9 B 3365 MIDAS 12/06/2008 M25 J7-8 B 3529 MIDAS 13/06/2008 M25 J3-4 A 2528 MIDAS 13/06/2008 M25 J3-4 B 2599 MIDAS 16/06/2008 M23 J8-9 A 3387 MIDAS 17/06/2008 M25 J4-5 B 1998 MIDAS 18/06/2008 M25 J3-4 A 2007 MIDAS 18/06/2008 M25 J3-4 B 2001 MIDAS 20/06/2008 M23 J8-9 A 4209 MIDAS 20/06/2008 M23 J8-9 B 4376 MIDAS
Total Flow 71464
Table 3 - Flow Data for Innovative Taper Road Works
During the limited area roll-out, none of the tapers (conventional or innovative) were
struck by any vehicle driven by a member of the public. The lack of taper strikes
during the monitoring period supported the industry view that taper strikes have
reduced substantially since the introduction of sequentially flashing road danger
lamps (SFRDLs) on cone tapers. Continued monitoring carried out by Carillion plc
indicated that no instances of a road user colliding with an innovative taper occurred
after the sampling period.

RoWSaF Trials Team Trial Report On-Road Monitoring of Innovative Taper Version: Issue (October 2008)
13
The absence of any collision with either type of taper made it impossible to calculate
a collision rate per vehicle for either innovative or conventional taper. However, the
absence of any collisions with the innovative taper suggested that the collision risk to
road users from the use of the innovative taper cannot be any greater than for the
use of a conventional taper. This in turn implied that the innovative taper layout
carried no greater risk of a road user colliding with it than the conventional Chapter 8
taper layout.
Towards the end of the limited area roll-out, there was an incident where a heavy
goods vehicle struck a traffic management vehicle.
The traffic management vehicle was parked stationary on the hard shoulder. The
traffic management operatives were in the final stages of clearing away a relaxed
layout closure of Lanes 3 and 2 and as part of this work they were removing the “200
yards” lane closure advance warning sign.
Whilst there had been an innovative taper downstream of the advance warning sign
location, this had already been completely removed some time before the collision
occurred. There is no evidence to indicate that the innovative taper was either a
causative or contributory factor in this collision.

RoWSaF Trials Team Trial Report On-Road Monitoring of Innovative Taper Version: Issue (October 2008)
14
3.3 Car driver perception assessment The car driver perception assessment was carried out on 46 drivers. The age and
sex distribution of the sample of drivers is shown in Figures 5 and 6 below:
0
5
10
15
20
25
30
Under 30 30-45 45-60
Age Group
Num
ber o
f Par
ticip
ants
Night
Day
Figure 5 - Participant age (car driver perception assessment)
0
5
10
15
20
25
Female Male
Gender
Num
ber
of P
artic
ipan
ts
NightDay
Figure 6 - Participant gender (car driver perception assessment)
The results of the car driver perception assessment were examined by time of day,
with an overall analysis of the clarity of taper types.

RoWSaF Trials Team Trial Report On-Road Monitoring of Innovative Taper Version: Issue (October 2008)
15
3.3.1 Daytime perception assessment The twenty-four participants who undertook the daytime perception assessment were
asked after viewing the first two video excerpts what differences (if any) they had
noticed. Twenty-one of the participants said that they noticed differences, whereas
three said they did not. The participants who had indicated they had noticed
differences were then asked to expand on the differences they had observed and to
comment on the relative clarity of the two taper arrangements.
The participants were then shown the second two video excerpts and asked the
same questions. There is no evidence of a learning effect in the data from the second
assessment as eighteen participants (14% fewer) said that they noticed differences
compared to six who said there were none. Participants who had noticed differences
were again asked to expand on the differences they had observed.
For the daytime excerpts, the distribution of differences noticed by the participants is
shown in Figure 7:
14%
9%
3%
17%
19%
11%
8%
3%
11%
5%
Vehicles
Road
Maintenance vehicles
Signs
Road markings
Distance to closure
Cones
Not sure
None
personnel
Figure 7 - Differences noticed by car drivers (daytime excerpts)
8% of participants mentioned cones when commenting on differences between the
excerpts viewed. None of these participants explicitly identified a difference between
the layouts of the tapers. Most participants commented on the proximity of the cones
to an overbridge present in the video, with others commenting that the cones
downstream of the innovative taper were further away from the live lane than in the

RoWSaF Trials Team Trial Report On-Road Monitoring of Innovative Taper Version: Issue (October 2008)
16
conventional taper video excerpt. One participant stated that they had observed
cones in one excerpt but not in the other, even though they were clearly visible in
both excerpts.
The greatest number of participants noticed differences in the road markings. This
occurred as a result of the location of the innovative taper during the M45 pilot
deployment, which was 500m upstream of a roundabout which featured transverse
yellow bar markings on the approach. These were not present in the video excerpt
for the conventional taper as this had been placed on the opposite side of the
carriageway.
Comments were also made regarding the signing. Although the temporary road
works signing was consistent between the excerpts, there were differences between
the permanent signing visible in each excerpt. Comments on vehicles were a result
of the differences in other traffic between the two excerpts. Several participants
remarked that the innovative taper was further away from the start of the excerpt than
for the conventional taper, even though the excerpts had been carefully prepared to
ensure they started at equivalent locations immediately after the 400 yard advance
warning sign.
Once the participants had expanded on the differences they noticed, where
appropriate, they were asked which of the videos they thought presented a clearer
message of what they, as a driver, had to do. The results are shown in Figure 8.
0
5
10
15
20
25
Innovative Conventional Both the Same Neither
Taper Clarity
Num
ber
of p
artic
ipan
ts
Figure 8 – Car drivers’ rating of taper clarity (daytime excerpts)

RoWSaF Trials Team Trial Report On-Road Monitoring of Innovative Taper Version: Issue (October 2008)
17
For the daytime perception there was a statistically significant difference in the choice
of taper clarity expressed, with a majority of drivers considering that the innovative
taper was clearer (t= 6.05 p<1%).
3.3.2 Night-time perception assessment
For the night-time perception assessment, eighteen of the twenty-two participants
noted differences between the first pair of video excerpts and four who did not. There
was a small difference for the second pair of excerpts, with 20 participants noting
differences compared to two who did not.
For the night-time perception assessment, the distribution of differences identified by
the participants was as shown in Figure 9:
12%
8%
2%
32%
2%
25%
5%
2%
10%2%
VehiclesRoadMaintenance vehiclesSignsRoad markingsDistance to closureConesNot sureNonepersonnel
Figure 9 - Differences noticed by car drivers (night-time perception assessment)
Signing was the most frequently noticed difference. This was most probably due to
the presence of a permanent variable message sign (VMS) adjacent to the innovative
taper and the absence of any equivalent VMS in the conventional taper video
excerpt. (The VMS adjacent to the innovative taper was not displaying any
information at the time the video data were collected.)

RoWSaF Trials Team Trial Report On-Road Monitoring of Innovative Taper Version: Issue (October 2008)
18
Many respondents observed that there was a greater distance to the road closure in
the case of the innovative taper, even though the video excerpts had been carefully
prepared to ensure the approaches to each type of taper were equivalent. The
comments from participants could have been a consequence of the locations of the
tapers, as the innovative taper was placed on a section of carriageway with a slight
left-handed curve and the conventional taper was placed on the opposite side and
thus was on a slight right-handed curve.
However, as the comments regarding a perceived greater distance to the innovative
taper were consistent with the daytime perception assessment, these results may
indicate a real effect. The innovative taper may possibly have given an earlier
warning of the lane closure to the assessment participants, thus apparently
expanding the perceived distance to the taper. This effect would require further
investigation but may represent an additional yet unanticipated benefit of using the
innovative taper.
The differences identified by those participants who viewed the night-time video
excerpts were mainly unrelated to the arrangement of cones in the two tapers.
Although cones were mentioned in 5% of post-viewing responses, none of the
participants explicitly stated that they had noticed a difference in the cone layouts.
In the night time analysis there was a shift towards finding the conventional taper
clearer. This can be seen in Figure 10 below:
0
2
4
6
8
10
12
14
16
18
20
Innovative Conventional Both the Same Neither
Taper Clarity
Num
ber o
f Par
ticip
ants
Figure 10 – Car drivers’ rating of taper clarity (night-time excerpts)

RoWSaF Trials Team Trial Report On-Road Monitoring of Innovative Taper Version: Issue (October 2008)
19
The rated difference in clarity between the innovative and conventional tapers was
statistically significant (t=4.53, p<1%).
The reason for the major difference in clarity rating in the night-time data (Figure 10)
compared to the daytime data (Figure 8) was not fully identified. Factors that may
have had an influence were differences in the road layout (2-lane vs. 4-lane) or
comparison of an outside lane closure in the day with a nearside lane closure at
night, which were defined by operational parameters outside of the control of the
Trials Team.
It is likely that the greatest influences on participant perception were the variations in
quality between the daytime and night-time video data. Under low light conditions
video data is not particularly effective at reproducing lit or reflective materials such as
lamps, cones and signs. Additionally, the colour balance of the night-time video data
was also considerably affected by the low-pressure sodium vapour lights on the
motorway. This type of lighting changes the apparent colour of objects due to the
very specific wavelength (589nm) of the sodium vapour lamp. This effect is
particularly an issue for red or red/orange objects such as the cones in the tapers
and thus may have influenced participants’ views.
3.3.3 Overall clarity of conventional and innovative tapers
The results from participants’ rating of the taper types in terms of the clarity were
aggregated and are presented in Figure 11 below.
0
5
10
15
20
25
30
35
Innovative Conventional Both the Same Neither
Taper Clarity
Num
ber o
f Par
ticip
ants
Figure 11 – Clarity of taper arrangement (all car drivers)

RoWSaF Trials Team Trial Report On-Road Monitoring of Innovative Taper Version: Issue (October 2008)
20
The majority of participants rated innovative tapers and conventional tapers of
comparable clarity. There is no statistically significant difference between the number
of participants finding the innovative taper clearer than the conventional taper
(t=1.07, p=29.0%).
There is also no statistically significant difference between the numbers of
participants finding the tapers both the same and those preferring the innovative
(t=0.76 p=45.3%) or conventional taper (t=1.82 p=7.4%). The lack of significance in
the aggregated data indicates that there was no significant difference in clarity
between innovative and conventional tapers.
3.4 Heavy goods vehicle driver perception assessment The distribution of heavy goods vehicle (HGV) drivers who participated in the
perception assessment was significantly different to the participants in the car driver
sample. The HGV driver sample was smaller, more heavily biased to male drivers
and towards the upper end of the age range. The distributions of age and sex of
participants are shown in Figures 12 and 13:
0
2
4
6
8
10
30-45 45-60 60+
Age Group
Num
ber
of P
artic
ipan
ts
Figure 12 - Participant age (HGV driver perception assessment)

RoWSaF Trials Team Trial Report On-Road Monitoring of Innovative Taper Version: Issue (October 2008)
21
0
2
4
6
8
10
12
14
Female MaleGender
Num
ber o
f Par
ticip
ants
Figure 13 - Participant gender (truck survey)
The HGV driver perception assessment used night-time excerpts from video data
collected from an HGV driver’s eye height. Participants were asked to respond to the
same questionnaire structure used for the car driver perception assessment and
describe any observed differences between two sets of two video excerpts
None of the HGV drivers who participated in the assessment specifically identified
that there was a different layout of cones. An inactive variable message sign (VMS)
that was present in one video excerpt but not the other was noted, together with
other differences ranging from the topography of the roads to the presence of other
vehicles. However there were no consistent differences reported by the participants.
One driver stated that he had observed a gap in the cones in the innovative taper
excerpt. This referred to the works access downstream of the taper, which was not
part of the assessment as it did not relate to the taper itself. The presence of a
flashing lamp at the works access may have drawn his attention to this location as
there was a static (non-flashing) lamp marking the works access on the conventional
taper.
Overall, most participants considered the clarity of the two taper arrangements to be
similar as shown in Figure 14 below:

RoWSaF Trials Team Trial Report On-Road Monitoring of Innovative Taper Version: Issue (October 2008)
22
0
2
4
6
8
10
12
14
16
18
20
22
Innovative Conventional Both the Same
Taper Clarity
Num
ber o
f Par
ticip
ants
Figure 14 - Clarity of taper arrangement (HGV driver perception assessment)
For HGV drivers who expressed an opinion regarding the clarity of the tapers, a small
proportion considered the conventional taper to be clearer. However, the majority
(65%) of participants viewed the two tapers as of similar clarity. This suggested that
HGV drivers did not view the innovative taper as significantly different to a
conventional taper.

RoWSaF Trials Team Trial Report On-Road Monitoring of Innovative Taper Version: Issue (October 2008)
23
3.5 Road worker benefits assessment
The review of the road worker benefits assessment carried out for the Trials Team by
the traffic management contractor highlighted the following issues:
In response to the first question “Do you feel comfortable with the new taper?”, 28
operatives said that they were comfortable with the new taper and eight indicated
they were not. Positive remarks obtained from those who felt comfortable centred on
the ease and speed of deployment and removal of the new taper and associated
benefits to the road worker. Negative comments were largely based around the
dislike of change and the requirement to learn a new technique.
Answers to the second question –“Is there any part of the setting out of the taper that
you feel could be improved?” – were consistent with the Question 1 responses. All
respondents except two stated that the current innovative taper deployment method
was good. One of the positive comments suggested that the spacing of the
intermediate cones should be revised to 9m instead of 10m to make them consistent
with the spacing of the road markings.
The two respondents who indicated improvements could be made both proposed
using the conventional taper method instead of the innovative taper but did not
provide any information as to why they considered it better than the innovative layout.
This appeared to be an echo of the points made in response to Question 1 by those
operatives who did not like the innovative taper arrangement.
Answers to question 3 – “Is there any part of the picking up of the taper that you feel
could be improved?” – indicated that the taper removal process was viewed as
acceptable, with the majority of respondents indicating that they were happy with the
current procedure. Two respondents specifically mentioned that care must be taken
during the removal of the innovative taper as the traffic management vehicle is
required to reverse in close proximity to road workers on the carriageway.

RoWSaF Trials Team Trial Report On-Road Monitoring of Innovative Taper Version: Issue (October 2008)
24
Road worker responses to question 4 – “Has the time spent installing the taper
decreased or increased?” – varied as shown in Figure 15
Question 4 - Has the time spent installing the taper decreased or increased?
Increase
Decrease
Same
Other
Figure 15 Change in time taken to install taper (road worker assessment)
Twenty-four respondents said that they felt that the innovative taper was quicker to
put out and retrieve than the conventional one, with four saying that it took the same
time and one saying that it increased installation time.
From those road workers who had experienced a reduction in time taken, a figure of
five minutes per procedure was mentioned. The respondent who said that the
installation time had increased did not provide any estimate of the additional time
taken, why they were of this opinion or provide any additional useful information. The
remaining respondents (classed as “other”) did not express any opinion.
The purpose of question 5 – “How does the taper look to you once installed?” – was
to obtain the opinions of operatives as to whether the visual appearance of the
innovative taper layout was as good as that of a conventional taper. Comments
received were mainly positive, though some respondents voiced concerns that the
spacing between cones was too large and might enable vehicles to pass through.

RoWSaF Trials Team Trial Report On-Road Monitoring of Innovative Taper Version: Issue (October 2008)
25
Responses to question 6 – “Is the taper easier or harder to install than the
conventional taper?” – indicated that most operatives viewed the innovative taper as
easier to install compared to the conventional layout, as shown in Figure 16:
Question 6 - Is the taper easier or harder to install than the conventional taper?
Easier
Harder
Same
Other
Figure 16 Ease of installation of innovative taper (road worker assessment)
Twenty-three respondents said that they found that the innovative taper was easier to
install than the conventional, compared to four who said it was harder and five who
said that it was comparable to the conventional method. Two respondents specifically
commented that the innovative taper technique was easier for inexperienced TM
operatives to learn than the conventional taper technique. The remaining
respondents (classed as “other”) did not express any opinion.
The safety performance of the innovative taper was addressed in Question 7 –“Is
there a difference between nearside and offside layouts in respect to health and
safety?” Twenty-one participants claimed there were no operational differences
between deployment of innovative tapers on the nearside and offside of the
carriageway. Six responses claimed that it did make a difference, though the
differences were not specified and the same number of respondents claimed there
was a difference for nearside deployments as claimed there was a difference for
offside deployments.
The final question – “Would you like to continue with the trial?” – was included to gain
an indication of industry’s likely acceptance of the technique. The majority of TM

RoWSaF Trials Team Trial Report On-Road Monitoring of Innovative Taper Version: Issue (October 2008)
26
operatives polled said that they would like to continue with the on-road trial of the
innovative taper.
The road worker benefits assessment suggested that a majority of operatives were in
favour of the innovative taper technique and considered it provided a benefit to road
workers. A number of specific points were noted from the assessment that should be
considered as part of any further roll-out of the taper technique:
• Operatives commented that when laying the innovative taper the traffic
management vehicle had to start and stop frequently during installation and
removal. This made it more difficult for the operative working on the back of the
truck to remain standing.
• Two comments were that the visual effect of the taper was best suited to single
lane drops of lane 1 or the outside lane.
• One comment was received that it was easier for inexperienced TM operatives to
gain proficiency in setting out the innovative taper.
• Operatives indicated that they liked the closer proximity of the TM vehicle to their
location on the carriageway during placement and pickup.

RoWSaF Trials Team Trial Report On-Road Monitoring of Innovative Taper Version: Issue (October 2008)
27
4 CONCLUSIONS AND SUMMARY
Monitoring of the limited area roll-out of the innovative taper was intended to
establish whether the innovative taper could provide a safety benefit to road workers
and to ensure the risk to road users was no greater than the equivalent conventional
taper. The limited area roll-out was carried out in Area 5 and the key findings from
the monitoring carried out by the Trials Team were:
• The time taken to install or remove an innovative taper was 50-70% of the time
taken to install or remove a conventional taper
• Time savings (and thus reduction in exposure to live traffic) during the limited
area roll-out were around 20 minutes per taper installation and removal
• The reduction in manual handling from using the innovative taper was around
50% when compared to a conventional taper
• Examination of the traffic count and accident data suggests that the collision risk
to road users from the use of the innovative taper is not any greater than for the
use of a conventional taper.
• This is in agreement with the user perception assessment for both car and HGV
drivers, which showed users did not notice any major difference between the two
taper layouts and there was no strong preference for either type of taper.
• The majority of road workers who had used the innovative taper felt it was easier
to learn as well as quicker to install and remove compared to a conventional taper
and consequently wished to continue with the trial.
Although the results of this trial are consistent and suggest the innovative taper
layout is safe for both road workers and road users, it is strongly recommended that
the Agency should collect a substantial body of evidence to assess the long-term
safety of the technique.

RoWSaF Trials Team Trial Report On-Road Monitoring of Innovative Taper Version: Issue (October 2008)
28
The Trials Team therefore recommends that wider use of the innovative taper is
supported by monitoring of the technique. This would enable the Highways Agency to
ensure any collisions with innovative tapers can be investigated and an assessment
made of collision frequency and risk together with the effect on both the cone layout
and the impacting vehicle.

RoWSaF Trials Team Trial Report On-Road Monitoring of Innovative Taper Version: Issue (October 2008)
29
APPENDIX
Car and Truck Driver Questionnaire

RoWSaF Trials Team Trial Report On-Road Monitoring of Innovative Taper Version: Issue (October 2008)
30
Survey Questionnaire The Transport Research Laboratory is undertaking work on behalf of the Highways Agency to explore the effectiveness of road works equipment. We would like to show you four short videos and ask you a few questions which should take around 15 minutes.
1) Watch first two videos (clip 1 and clip 2).
Did you notice any differences between what you saw in the two videos?
Yes
No
2) If yes, what were the differences that you noticed?
3) Did you feel that either video presented a clearer message of what you, as a driver, were supposed to do?
Clip 1 was clearer Clip 2 was clearer I thought they were
about the same I didn’t understand either one

RoWSaF Trials Team Trial Report On-Road Monitoring of Innovative Taper Version: Issue (October 2008)
31
4) Watch second two videos (clip 3 and clip 4)
Did you notice any differences between what you saw in the two videos?
Yes
No
5) If yes, what were the differences that you noticed?
6) Did you feel that either video presented a clearer message of what you, as a driver, were supposed to do?
Clip 3 was clearer Clip 4 was clearer I thought they were
about the same I didn’t understand either one
Finally, what sort of vehicles do you drive on the motorway? Car Van Commercial lorry/bus Other - e.g. motorcyclist
- To be completed by interviewer - Participant Gender
Male Female
Age : Under 30 30-45 45-60 Over 60 Presentation B C D E