on parameter adjustment of the fuzzy neighborhood-based
TRANSCRIPT

Turk J Elec Eng & Comp Sci(2019) 27: 2093 – 2105© TÜBİTAKdoi:10.3906/elk-1807-55
Turkish Journal of Electrical Engineering & Computer Sciences
http :// journa l s . tub i tak .gov . t r/e lektr ik/
Research Article
On parameter adjustment of the fuzzy neighborhood-based clustering algorithms
Fatma Günseli YAŞAR ÇIKLAÇANDIR1 , Gözde ULUTAGAY2 , Semih UTKU3,∗ ,Efendi NASİBOV4
1Department of Computer Engineering, Faculty of Engineering and Architecture, İzmir Katip Çelebi University,İzmir, Turkey
2Faculty of Engineering and Natural Sciences, Bahçeşehir University, İstanbul, Turkey3Department of Computer Engineering, Faculty of Engineering and Architecture, Dokuz Eylül University,
İzmir, Turkey4Department of Computer Sciences, Faculty of Science, Dokuz Eylül University, İzmir, Turkey
Received: 06.07.2018 • Accepted/Published Online: 30.12.2018 • Final Version: 15.05.2019
Abstract: Day by day huge amounts data are produced, and evaluation of these data becomes more difficult. Thedata obtained should provide meaningful, correct, and accurate information. Therefore, all data must be separatedinto clusters correctly, and the right information from these clusters must be obtained. Having the correct clustersdepends on the clustering algorithm that is used. There are many clustering algorithms. The density-based methods arevery important among the groups of clustering methods, as they can find arbitrary shapes. An advanced model of thedensity-based spatial clustering of applications with noise (DBSCAN) algorithm, called fuzzy neighborhood DBSCANGaussian means (FN-DBSCAN-GM), is offered in this study. The main contribution of FN-DBSCAN-GM is to findthe parameters automatically and to divide the data into clusters robustly. The effectiveness of FN-DBSCAN-GM hasbeen demonstrated on overlapping datasets (six artificial and two real-life datasets). The performances of these datasetsare compared with the percentage of correct classification and validity index. Our experiments showed that this newalgorithm was a preferable and robust algorithm.
Key words: Cluster analysis, DBSCAN, FN-DBSCAN
1. IntroductionClustering helps us to collect similar data in the same cluster and separates the different data into differentclusters. The density-based spatial clustering of applications with noise (DBSCAN) algorithm is the most well-known algorithm based on densities in the literature [1]. It needs two input parameters (εand MinPts) forclustering. ε is a distance measure, and Minpts is the minimum number of points. All points in the databaseare classified into three types: core, border, and noise. If a point is a core point, the number of elements in theε neighborhood is at least Minpts. In addition, all density-connected points create a cluster in DBSCAN [2].
DBSCAN finds the clusters with different shapes. It is a powerful method because of its positiveproperties. However, some disadvantages exist in this algorithm [3]. After a small change in input variables,the results show deterioration. In addition, it cannot find clusters with different densities. There are otherkinds of density-based clustering algorithms that have been developed to eliminate the disadvantages of theDBSCAN algorithm. DMDBSCAN (dynamic method DBSCAN), LDBSCAN (local-DBSCAN), and EDBSCAN∗Correspondence: [email protected]
This work is licensed under a Creative Commons Attribution 4.0 International License.2093
ÇIKLAÇANDIR et al./Turk J Elec Eng & Comp Sci
(enhanced-DBSCAN) were developed for handling different densities [4–6]. The DBSCAN-GM and VDBSCAN(varied density-based spatial clustering of applications with noise) algorithms were produced for obtaining goodclustering without input parameters [7, 8]. Fuzzy neighborhood DBSCAN (FN-DBSCAN) and soft-DBSCANalgorithms were produced for robustness [9, 10]. Fast clustering, active-DBSCAN, and FDBSCAN algorithmswere developed [11, 12]. However, the developed algorithms are still inadequate to obtain good clustering [13].
Finding convenient parameters of FN-DBSCAN is a big problem, especially for some datasets [14]. Inthis study, an algorithm that makes FN-DBSCAN parameter-free is proposed. It is the developed version ofstudy [15]. Note that the above-mentioned VDBSCAN method is also a parameter-free method and it producesclusters with different densities. In addition, it computes k-distances and tries to estimate input parametersof the DBSCAN method. However, the FN-DBSCAN-GM method handled in our study is a fuzzy version ofDBSCAN and it tries to estimate input parameters using a statistical test. The rest of this paper is organizedinto five sections. Clustering algorithms that are necessary for this study are explained in the second section ofthe paper. The proposed algorithm, called FN-DBSCAN-GM, is described in Section 3. The results from ourexperiments can be seen in Section 4. The article concludes in Section 5.
2. Background
2.1. K-means algorithm
The K-means algorithm was proposed by MacQueen [16]. The number of clusters, called k, is an input parameterin this algorithm. Data are divided into k clusters by measuring cluster similarity. Each cluster center iscalculated by the average value of the coordinates of objects in the cluster. In this algorithm, the first step isto determine the coordinates of k centers. This can be done by various methods. For example, random valuesor the coordinates of the first k objects can be assigned to the initial center values. After that, Euclid’s formulais used for calculating distances between objects and centers as in Eq. (1). x is an object, c is a center, and j isthe dimension of these points.
d(x, c) =
(j∑
i=1
(ci − xi)
)1/2
(1)
Each object is assigned to the closest center. New coordinates of centers are recalculated as in Eq. (2). xh isthe point assigned to the cluster. The average of the assigned points determines the new cluster center.
newc =
∑nh=1 xh
n(2)
These processes are continued as long as there is a difference between the new coordinates of centersand the previous coordinates of those centers. The K-means algorithm has some weaknesses: it needs an inputparameter ‘k’. Results vary according to the value of k. It is a sensitive algorithm for the noises and initialcluster centers. For example, the results obtained when the first k points are selected as initial cluster centers(Figure 1) are different from the results obtained when random numbers are selected as initial cluster centers(Figure 2). It can be used for numerical data and does not give good results in overlapping sets.
The algorithm of the K-means is as given in Algorithm 1.
2094

ÇIKLAÇANDIR et al./Turk J Elec Eng & Comp Sci
-0.2 0 0.2 0.4 0.6 0.8 10
0.2
0.4
0.6
0.8
1KMEANS Clustering (number of clusters = 2)
Cluster #1Cluster #2
-0.2 0 0.2 0.4 0.6 0.8 10
0.1
0.2
0.3
0.4
0.5
0.6
0.7
0.8
0.9
1KMEANS Clustering (number of clusters = 2)
Cluster #1Cluster #2
Figure 1. When first two points in the dataset are se-lected as initial cluster centers.
Figure 2. When two random points are selected as initialcluster centers.
Algorithm 1. K-means algorithm.Step 1: k is input. Let k be the number of cluster centers.Step 2: Select k cluster centers.Step 3: Calculate the distance between each point and cluster centers.Step 4: Each point is assigned to the nearest center.Step 5: Recalculate the new cluster centers.Step 6: If there is a difference between new centers and previous centers, go to Step 3.Step 7: End.
2.2. G-means algorithm
The Gaussian means algorithm was developed by Hamerly and Elkan in 2004 [9]. The K-means algorithm hasa disadvantage. The optimal value of k must be assigned to provide the best clustering. Automatic estimationof k will be the best solution.
The Gaussian means algorithm makes use of a statistical test to make the decision for the number ofclusters. If Gaussian distribution cannot be provided with the number of clusters, the number is increased by1. The K-means algorithm is run for each increase of it while there is not a Gaussian distribution. k startsfrom the smallest value, for example 1. It tries to find the correct number of clusters, and so it can find it. Thealgorithm of Gaussian means (G-means) is as given in Algorithm 2.
Algorithm 2. G-means algorithm.Step 1: S={si} is the set of the centers.Step 2: Use the K-means algorithm for an initial set of centers.Step 3: Apply a statistical test for all data points that are assigned to each center to find out whether thesedata points follow Gaussian distribution or not.Step 4: If there is a Gaussian distribution for si, keep si. Otherwise, replace it with two centers.Step 5: Repeat Step 2 while new centers are added.Step 6: End.
2.3. Fuzzy neighborhood DBSCAN (FN-DBSCAN) algorithm
A system based on fuzzy logic consists of three basic steps: a fuzzification step, inference step, and defuzzificationstep (Figure 4). In the fuzzification step, crisp inputs are converted to fuzzy inputs. After processing with the
2095

ÇIKLAÇANDIR et al./Turk J Elec Eng & Comp Sci
fuzzy rules in the inference step, fuzzy outputs are obtained. These outputs are converted to crisp data in thedefuzzification step. In the fuzzy approach, each element in a database belongs to all clusters with differentmembership degrees. Membership degress are calculated using a membership function and get values between0 and 1.
Fuzzy sets and subsets are the basic elements of fuzzy logic. An object is a member of each cluster witha membership degree in the fuzzy approach, in contrast to the crisp approach.
The FN-DBSCAN algorithm was developed by Nasibov and Ulutagay in 2008 [10]. They include fuzzinessin the DBSCAN algorithm in order to check robustness. In Figure 4, the number of neighbors of x1 is equalto the number of neighbors of x2 , so the points of x1 and x2 are the same according to DBSCAN. However,densities of them within an ε neighborhood are different. FN-DBSCAN finds the difference between x1 andx2 [5, 17]. Therefore, it can be said that FN-DBSCAN is more robust. In this algorithm, ε1 and ε2 are inputparameters.
Fuzzification Inference Defuzzification
Rule Base
CrispInput
CrispOutput
FuzzyInput
FuzzyOutput
Figure 3. Structure of a fuzzy system [18].
Figure 4. x1 andx2 points are dissimilar for fuzzy neighborhood cardinality [19].
For the ith point, xi is (xi1, xi2, xi3, ..., xim ). Here, m is the dimension of points. h is a number thattakes values from 1 to m in Eq. (3). xmin
h and xmaxh are calculated as in Eqs. (4) and (5).
h = 1, ...,m (3)
xmaxh = max
ixih (4)
xminh = min
ixih (5)
2096

ÇIKLAÇANDIR et al./Turk J Elec Eng & Comp Sci
Using the values of xminh and xmax
h , the coordinates of points xih are normalized as in Eq. (6). d(x′
i, x′
j) is thedistance between normalized values of xi and xj in Eq. (7).
x′
ih =xih − xmin
h
(xmaxh − xmin
h )m1/2(6)
d(x′
i, x′
j) =
(m∑
h=1
(x′
ih − x′
jh)2
)1/2
(7)
First, the value of dmax must be calculated as in Eq. (8). There is more than one method to calculateneighborhood membership functions. There can different neighborhood membership functions used, such asEqs. (9)–(11). The h value selected in Eqs. (10) and (11) determines the neighborhood radius, and it is greaterthan 0.
dmax = maxi,j
(d(x′
i, x′
j)) (8)
Nxi(xj) =
{1− d(xi,xj)
dmax, ifd(xi, xj) ≤ d0
0, otherwise
}(9)
Here, d0 is a given threshold value:
Nxi(xj) = max{0, 1− h
d(xi, xj)
dmax} (10)
Nxi(xj) = exp(−(hd(xi, xj)
dmax
)2)
(11)
For each point xi ∈ D,N(xi, ε1) denotes the neighborhood set of the point xi within the minimum thresholdvalue, which is created as in Eq. (12). ωj is the cardinality of a pointjwithin the ε1 in Eq. (13). ωmax is themaximum of ωj(j = 1, ..., n) . The input of MinPts in DBSCAN is normalized as in Eq. (14), and this value,named ε2 , is used in the FN-DBSCAN algorithm. If any point providing Eq. (12) also provides Eq. (15), thepoint is a fuzzy core point.
N(xi, ε1) = {q ∈ D,Nxi(q) ≥ ε1} (12)
ωj = | N(xj , ε1)| (13)
ε2 =MinPts
ωmax(14)
cardFN(x; ε1, ε2) =∑
y∈N(x;ε1)
Nx(y) ≥ ε2 (15)
The FN-DBSCAN algorithm combines the advantages of the DBSCAN and NRFJP (noise-robust fuzzyjoint points) algorithms and is used in many areas [19]. Its time complexity is higher than that of DBSCAN[12]. However, FN-DBSCAN is robust like NRFJP. Its algorithm is as given in Algorithm 3.
2097
ÇIKLAÇANDIR et al./Turk J Elec Eng & Comp Sci
Algorithm 3. FN-DBSCAN algorithm.Step 1: ε1 and ε2 are inputs.Step 2: Mark all data points as unassigned. Assign 1 to t.Step 3: Find an unassigned fuzzy core point p with the limits of ε1 and ε2. If it is not found, go to Step 9.Step 4: Assign p to a new cluster Ct and mark it as assigned.Step 5: Create a set of S and put all ε1 neighbors to the p points, which are not assigned yet, into S.Step 6: Get an unassigned point q, which is in S. Assign q to Ct. Remove q from S and mark it as assigned.Step 7: If q is a fuzzy core point, add all unassigned points in the ε1 neighborhood of q to S.Step 8: Repeat Steps 6 and 7 if S is not an empty set.Step 9: Increase t=t+1 and go to Step 3.Step 9: If there is an unassigned point, assign it as noise.Step 10: End.
2.4. The proposed algorithm: FN-DBSCAN-GM
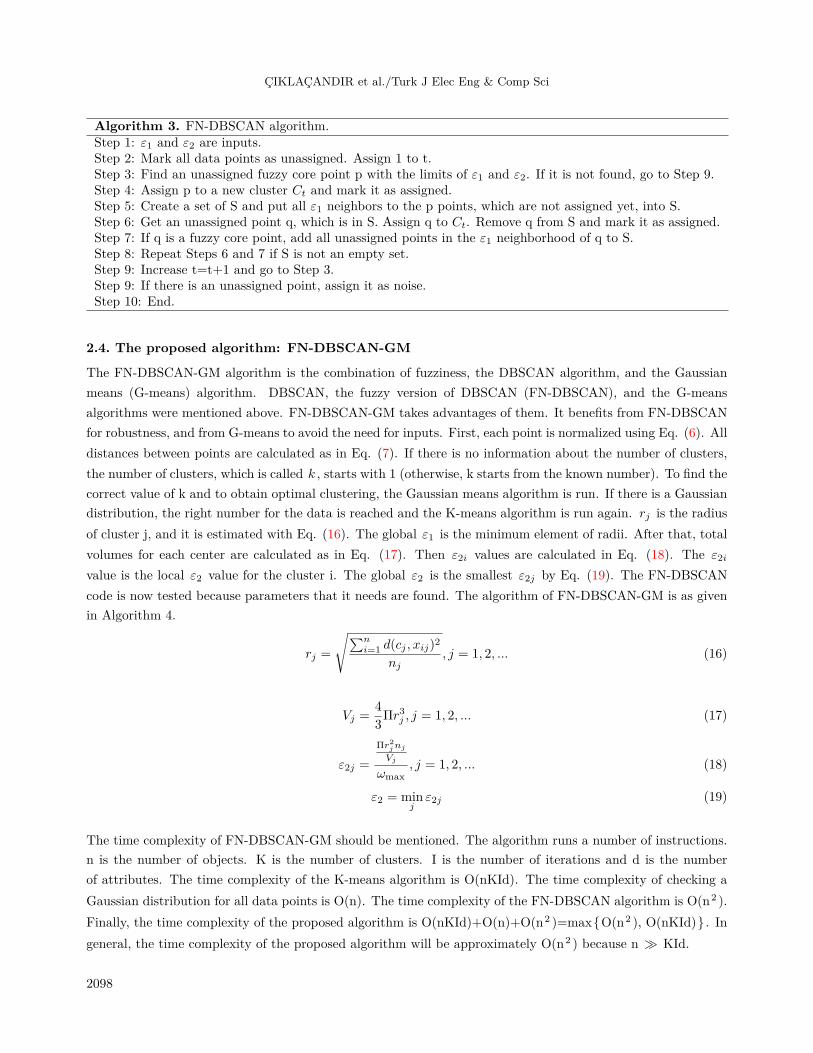
The FN-DBSCAN-GM algorithm is the combination of fuzziness, the DBSCAN algorithm, and the Gaussianmeans (G-means) algorithm. DBSCAN, the fuzzy version of DBSCAN (FN-DBSCAN), and the G-meansalgorithms were mentioned above. FN-DBSCAN-GM takes advantages of them. It benefits from FN-DBSCANfor robustness, and from G-means to avoid the need for inputs. First, each point is normalized using Eq. (6). Alldistances between points are calculated as in Eq. (7). If there is no information about the number of clusters,the number of clusters, which is called k , starts with 1 (otherwise, k starts from the known number). To find thecorrect value of k and to obtain optimal clustering, the Gaussian means algorithm is run. If there is a Gaussiandistribution, the right number for the data is reached and the K-means algorithm is run again. rj is the radiusof cluster j, and it is estimated with Eq. (16). The global ε1 is the minimum element of radii. After that, totalvolumes for each center are calculated as in Eq. (17). Then ε2i values are calculated in Eq. (18). The ε2i
value is the local ε2 value for the cluster i. The global ε2 is the smallest ε2j by Eq. (19). The FN-DBSCANcode is now tested because parameters that it needs are found. The algorithm of FN-DBSCAN-GM is as givenin Algorithm 4.
rj =
√∑ni=1 d(cj , xij)2
nj, j = 1, 2, ... (16)
Vj =4
3Πr3j , j = 1, 2, ... (17)
ε2j =
Πr2jnj
Vj
ωmax, j = 1, 2, ... (18)
ε2 = minj
ε2j (19)
The time complexity of FN-DBSCAN-GM should be mentioned. The algorithm runs a number of instructions.n is the number of objects. K is the number of clusters. I is the number of iterations and d is the numberof attributes. The time complexity of the K-means algorithm is O(nKId). The time complexity of checking aGaussian distribution for all data points is O(n). The time complexity of the FN-DBSCAN algorithm is O(n2 ).Finally, the time complexity of the proposed algorithm is O(nKId)+O(n)+O(n2 )=max{O(n2 ), O(nKId)} . Ingeneral, the time complexity of the proposed algorithm will be approximately O(n2 ) because n ≫ KId.
2098
ÇIKLAÇANDIR et al./Turk J Elec Eng & Comp Sci
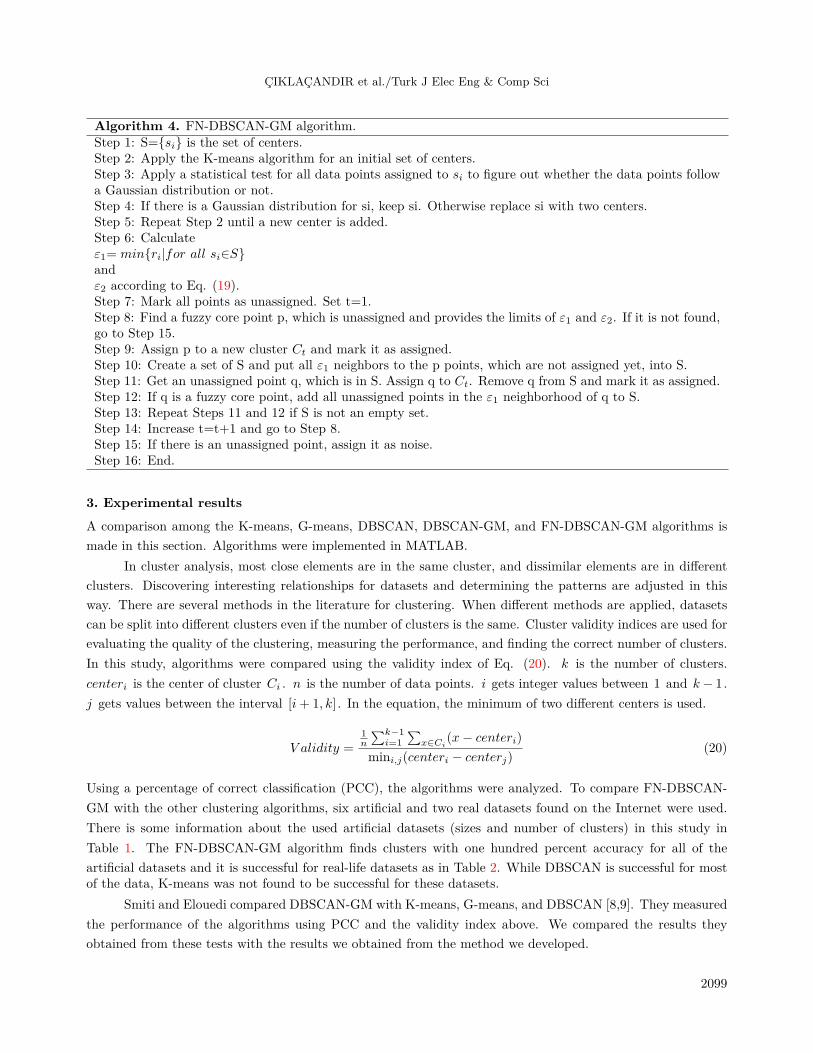
Algorithm 4. FN-DBSCAN-GM algorithm.Step 1: S={si} is the set of centers.Step 2: Apply the K-means algorithm for an initial set of centers.Step 3: Apply a statistical test for all data points assigned to si to figure out whether the data points followa Gaussian distribution or not.Step 4: If there is a Gaussian distribution for si, keep si. Otherwise replace si with two centers.Step 5: Repeat Step 2 until a new center is added.Step 6: Calculateε1= min{ri|for all si∈S}andε2 according to Eq. (19).Step 7: Mark all points as unassigned. Set t=1.Step 8: Find a fuzzy core point p, which is unassigned and provides the limits of ε1 and ε2. If it is not found,go to Step 15.Step 9: Assign p to a new cluster Ct and mark it as assigned.Step 10: Create a set of S and put all ε1 neighbors to the p points, which are not assigned yet, into S.Step 11: Get an unassigned point q, which is in S. Assign q to Ct. Remove q from S and mark it as assigned.Step 12: If q is a fuzzy core point, add all unassigned points in the ε1 neighborhood of q to S.Step 13: Repeat Steps 11 and 12 if S is not an empty set.Step 14: Increase t=t+1 and go to Step 8.Step 15: If there is an unassigned point, assign it as noise.Step 16: End.
3. Experimental resultsA comparison among the K-means, G-means, DBSCAN, DBSCAN-GM, and FN-DBSCAN-GM algorithms ismade in this section. Algorithms were implemented in MATLAB.
In cluster analysis, most close elements are in the same cluster, and dissimilar elements are in differentclusters. Discovering interesting relationships for datasets and determining the patterns are adjusted in thisway. There are several methods in the literature for clustering. When different methods are applied, datasetscan be split into different clusters even if the number of clusters is the same. Cluster validity indices are used forevaluating the quality of the clustering, measuring the performance, and finding the correct number of clusters.In this study, algorithms were compared using the validity index of Eq. (20). k is the number of clusters.centeri is the center of cluster Ci . n is the number of data points. i gets integer values between 1 and k− 1 .j gets values between the interval [i+ 1, k] . In the equation, the minimum of two different centers is used.
V alidity =1n
∑k−1i=1
∑x∈Ci
(x− centeri)
mini,j(centeri − centerj)(20)
Using a percentage of correct classification (PCC), the algorithms were analyzed. To compare FN-DBSCAN-GM with the other clustering algorithms, six artificial and two real datasets found on the Internet were used.There is some information about the used artificial datasets (sizes and number of clusters) in this study inTable 1. The FN-DBSCAN-GM algorithm finds clusters with one hundred percent accuracy for all of theartificial datasets and it is successful for real-life datasets as in Table 2. While DBSCAN is successful for mostof the data, K-means was not found to be successful for these datasets.
Smiti and Elouedi compared DBSCAN-GM with K-means, G-means, and DBSCAN [8,9]. They measuredthe performance of the algorithms using PCC and the validity index above. We compared the results theyobtained from these tests with the results we obtained from the method we developed.
2099

ÇIKLAÇANDIR et al./Turk J Elec Eng & Comp Sci
There are results of experiments on real-life datasets (Iris, Indian) in Tables 3 and 4. The Iris datasethas 150 flower data. Each object in the Iris dataset has four attributes. The Indian dataset has 768 data.The number of attributes in the Indian dataset is nine. As can be seen from the Table 3, PCC values of theFN-DBSCAN-GM algorithm are greater than the others.
Table 1. The properties of artificial datasets.
Datasets Size Cluster numberSpiral-1 200 × 2 2Wave 287 × 2 2
Spiral-2 312 × 2 3Face 320 × 2 4Moon 514 × 2 4Ring 800 × 2 2
Table 2. PCC values of artificial datasets.
Datasets K-MEANS DBSCAN FN-DBSCAN-GMSpiral-1 43.5 100 100Wave 73.519 100 100
Spiral-2 54.915 78 100Face 86.5625 100 100Moon 65.078 100 100Ring 46 100 100
Table 3. PCC values of Iris and Indian datasets.
Datasets K-MEANS G-MEANS DBSCAN DBSCAN-GM FN-DBSCAN-GMIris 95.270 97.67 98.33 98.55 98.59
Indian 8.150 2.583 97.6 99 99.82
Table 4. Validity values of Iris and Indian datasets.
Datasets K-MEANS G-MEANS DBSCAN DBSCAN-GM FN-DBSCAN-GMIris 1.483 0.272 0.33 0.261 0.0667
Indian 3.171 3.431 1.914 2.198 0.0022
Figures 5–7 show outputs obtained from the artificial datasets. Columns a and b indicate the resultsfrom different datasets. Parameters that provide better results were entered for the DBSCAN algorithm andthe number of clusters was entered for the K-means algorithm. The quality of FN-DBSCAN-GM is understoodspecifically from the datasets of Spiral-2 and Moon. It finds overlapping clusters effectively.
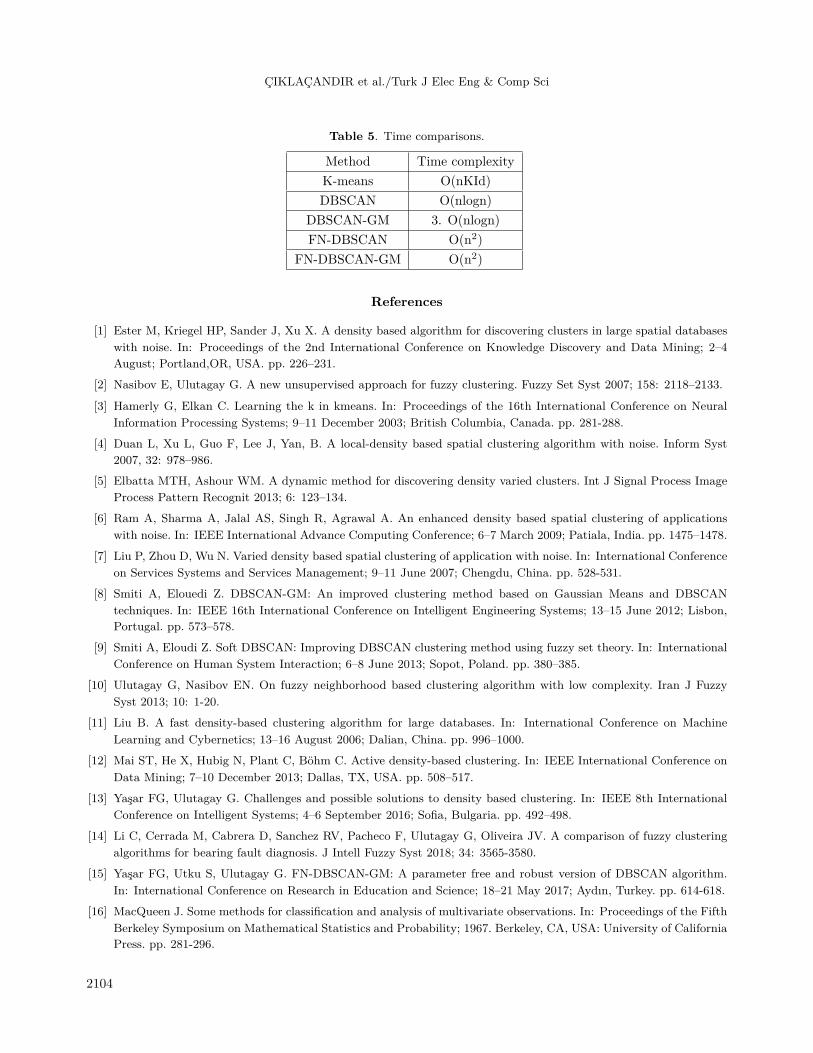
The comparison of time complexities is given in Table 5. The time complexity of the FN-DBSCAN-GMalgorithm is approximately O(n2 ).
2100

ÇIKLAÇANDIR et al./Turk J Elec Eng & Comp Sci
-0.2 0 0.2 0.4 0.6 0.8 10
0.2
0.4
0.6
0.8
1KMEANS Clustering (number of clusters = 2)
Cluster #1Cluster #2
0 0.2 0.4 0.6 0.8 10
0.1
0.2
0.3
0.4
0.5
0.6
0.7
0.8
0.9
1KMEANS Clustering (number of clusters = 2)
Cluster #1Cluster #2
-0.2 0 0.2 0.4 0.6 0.8 10
0.2
0.4
0.6
0.8
1DBSCAN Clustering (0 = 0.07, MinPts = 2)
Cluster #1Cluster #2
0 0.2 0.4 0.6 0.8 10
0.2
0.4
0.6
0.8
1DBSCAN Clustering ( 0 = 0.1, MinPts = 3)
Cluster #1Cluster #2
-0.2 0 0.2 0.4 0.6 0.8 10
0.2
0.4
0.6
0.8
1FN-DBSCAN-GM Clustering
Cluster #1Cluster #2
0 0.2 0.4 0.6 0.8 10
0.2
0.4
0.6
0.8
1FN-DBSCAN-GM Clustering
Cluster #1Cluster #2
Figure 5. Clustering results of Spiral-1 dataset (left) and wave dataset (right).
Results of the FN-DBSCAN and DBSCAN algorithms are compared by changing the values of inputparameters. When input parameters give the correct results in the FN-DBSCAN and DBSCAN algorithms, thereached result is 170 (ε1 , ε2 ) optimal input parameters for the FN-DBSCAN algorithm and 94 (ε , MinPts)optimal input parameters for the DBSCAN algorithm. MinPts is the minimum number of points in the ε
neighborhood of a core point. Therefore, the value of MinPts must be an integer number. ε1 , ε2 , and ε cantake decimal values. Tests were continued by increasing the values of ε , ε1 , and ε2 by 0.01, within the interval[0,1]. The number of parameters that give correct results for the FN-DBSCAN algorithm is greater than thenumber of parameters that give correct results for the DBSCAN algorithm. According to this result, it can be
2101

ÇIKLAÇANDIR et al./Turk J Elec Eng & Comp Sci
0 5 10 15 20 25 30 35
5
10
15
20
25
30
KMEANS Clustering (number of clusters = 3)Cluster #1Cluster #2Cluster #3
0 0.2 0.4 0.6 0.8 10
0.1
0.2
0.3
0.4
0.5
0.6
0.7
0.8
0.9
1KMEANS Clustering (number of clusters = 4)
Cluster #1Cluster #2Cluster #3Cluster #4
0 10 20 30
5
10
15
20
25
30
DBSCAN Clustering (0 = 0.988, MinPts = 3)
NoiseCluster #1Cluster #2Cluster #3Cluster #4Cluster #5Cluster #6Cluster #7
0 0.2 0.4 0.6 0.8 10
0.2
0.4
0.6
0.8
1DBSCAN Clustering (0 = 0.2, MinPts = 5)
Cluster #1Cluster #2Cluster #3Cluster #4
0 10 20 30
5
10
15
20
25
30
FN-DBSCAN-GM Clustering
Cluster #1Cluster #2Cluster #3
0 0.2 0.4 0.6 0.8 10
0.2
0.4
0.6
0.8
1FN-DBSCAN-GM Clustering
Cluster #1
Cluster #2
Cluster #3
Cluster #4
Figure 6. Clustering results of Spiral-2 dataset (left) and Face dataset (right).
inferred that the probability of finding the right parameters of the FN-DBSCAN-GM algorithm is greater thanthe probability of finding the right parameters of DBSCAN-GM. Therefore, the FN-DBSCAN-GM algorithm ismore robust than the DBSCAN-GM algorithm.
4. ConclusionA new clustering algorithm, FN-DBSCAN-GM, which is based on densities, is proposed in this study. Testswere done on six artificial datasets and two real-life datasets. The newly developed algorithm was successfulin finding the parameters of the DBSCAN algorithm, and also it gave more robust results than the DBSCAN
2102

ÇIKLAÇANDIR et al./Turk J Elec Eng & Comp Sci
0 0.2 0.4 0.6 0.8 10
0.1
0.2
0.3
0.4
0.5
0.6
0.7
0.8
0.9
1KMEANS Clustering (number of clusters = 4)
Cluster #1Cluster #2Cluster #3Cluster #4
0 0.2 0.4 0.6 0.8 10
0.1
0.2
0.3
0.4
0.5
0.6
0.7
0.8
0.9
1KMEANS Clustering (number of clusters = 2)
Cluster #1Cluster #2
0 0.2 0.4 0.6 0.8 10
0.2
0.4
0.6
0.8
1DBSCAN Clustering (0 = 0.07, MinPts = 2)
Cluster #1Cluster #2Cluster #3Cluster #4
0 0.2 0.4 0.6 0.8 10
0.2
0.4
0.6
0.8
1DBSCAN Clustering ( 0 = 0.07, MinPts = 2)
Cluster #1Cluster #2
0 0.2 0.4 0.6 0.8 10
0.2
0.4
0.6
0.8
1FN-DBSCAN-GM Clustering
Cluster #1
Cluster #2
Cluster #3
Cluster #4
0 0.2 0.4 0.6 0.8 10
0.2
0.4
0.6
0.8
1FN-DBSCAN-GM Clustering
Cluster #1Cluster #2
Figure 7. Clustering results of Moon dataset (left) and Ring dataset (right).
algorithm and the DBSCAN-GM algorithm. Compared to the other clustering algorithms (K-means, G-means,DBSCAN, DBSCAN-GM), the FN-DBSCAN-GM algorithm discovers all clusters for both artificial and real-lifedatasets. According to test results, the proposed FN-DBSCAN-GM algorithm can be preferred in different areasfor datasets in areas using fuzzy neighborhood relations (data mining, pattern processing, fabric error detection,etc.).
FN-DBSCAN-GM has many advantages. However, the time complexity is not good enough, especiallyfor big data. The time complexity of FN-DBSCAN-GM will be reduced as future work.
2103
ÇIKLAÇANDIR et al./Turk J Elec Eng & Comp Sci
Table 5. Time comparisons.
Method Time complexityK-means O(nKId)DBSCAN O(nlogn)
DBSCAN-GM 3. O(nlogn)FN-DBSCAN O(n2)
FN-DBSCAN-GM O(n2)
References
[1] Ester M, Kriegel HP, Sander J, Xu X. A density based algorithm for discovering clusters in large spatial databaseswith noise. In: Proceedings of the 2nd International Conference on Knowledge Discovery and Data Mining; 2–4August; Portland,OR, USA. pp. 226–231.
[2] Nasibov E, Ulutagay G. A new unsupervised approach for fuzzy clustering. Fuzzy Set Syst 2007; 158: 2118–2133.
[3] Hamerly G, Elkan C. Learning the k in kmeans. In: Proceedings of the 16th International Conference on NeuralInformation Processing Systems; 9–11 December 2003; British Columbia, Canada. pp. 281-288.
[4] Duan L, Xu L, Guo F, Lee J, Yan, B. A local-density based spatial clustering algorithm with noise. Inform Syst2007, 32: 978–986.
[5] Elbatta MTH, Ashour WM. A dynamic method for discovering density varied clusters. Int J Signal Process ImageProcess Pattern Recognit 2013; 6: 123–134.
[6] Ram A, Sharma A, Jalal AS, Singh R, Agrawal A. An enhanced density based spatial clustering of applicationswith noise. In: IEEE International Advance Computing Conference; 6–7 March 2009; Patiala, India. pp. 1475–1478.
[7] Liu P, Zhou D, Wu N. Varied density based spatial clustering of application with noise. In: International Conferenceon Services Systems and Services Management; 9–11 June 2007; Chengdu, China. pp. 528-531.
[8] Smiti A, Elouedi Z. DBSCAN-GM: An improved clustering method based on Gaussian Means and DBSCANtechniques. In: IEEE 16th International Conference on Intelligent Engineering Systems; 13–15 June 2012; Lisbon,Portugal. pp. 573–578.
[9] Smiti A, Eloudi Z. Soft DBSCAN: Improving DBSCAN clustering method using fuzzy set theory. In: InternationalConference on Human System Interaction; 6–8 June 2013; Sopot, Poland. pp. 380–385.
[10] Ulutagay G, Nasibov EN. On fuzzy neighborhood based clustering algorithm with low complexity. Iran J FuzzySyst 2013; 10: 1-20.
[11] Liu B. A fast density-based clustering algorithm for large databases. In: International Conference on MachineLearning and Cybernetics; 13–16 August 2006; Dalian, China. pp. 996–1000.
[12] Mai ST, He X, Hubig N, Plant C, Böhm C. Active density-based clustering. In: IEEE International Conference onData Mining; 7–10 December 2013; Dallas, TX, USA. pp. 508–517.
[13] Yaşar FG, Ulutagay G. Challenges and possible solutions to density based clustering. In: IEEE 8th InternationalConference on Intelligent Systems; 4–6 September 2016; Sofia, Bulgaria. pp. 492–498.
[14] Li C, Cerrada M, Cabrera D, Sanchez RV, Pacheco F, Ulutagay G, Oliveira JV. A comparison of fuzzy clusteringalgorithms for bearing fault diagnosis. J Intell Fuzzy Syst 2018; 34: 3565-3580.
[15] Yaşar FG, Utku S, Ulutagay G. FN-DBSCAN-GM: A parameter free and robust version of DBSCAN algorithm.In: International Conference on Research in Education and Science; 18–21 May 2017; Aydın, Turkey. pp. 614-618.
[16] MacQueen J. Some methods for classification and analysis of multivariate observations. In: Proceedings of the FifthBerkeley Symposium on Mathematical Statistics and Probability; 1967. Berkeley, CA, USA: University of CaliforniaPress. pp. 281-296.
2104
ÇIKLAÇANDIR et al./Turk J Elec Eng & Comp Sci
[17] Nasibov EN, Ulutagay G. Robustness of density-based clustering methods with various neighborhood relations.Fuzzy Set Syst 2009; 160: 3601–3615.
[18] Feng G. A survey on analysis and design of model-based fuzzy control systems. IEEE Trans Fuzzy Syst 2006; 14:676-697.
[19] Ulutagay G, Nasibov E. Fuzzy and crisp clustering methods based on the neighborhood concept: a comprehensivereview. J Intell Fuzzy Syst 2012; 23: 271–281.
2105