on nano size structures for enhanced early bone formation
TRANSCRIPT

1
On Nano Size Structures ForEnhanced Early Bone Formation
Luiz Meirelles
SAHLGRENSKA AKADEMIN
Department of Prosthodontics / Dental Material Science
Department of Biomaterials
Göteborg 2007

2

3
To Cristianewith love

4
This thesis represents number 36 in a series of investigations on implants, hard tissue and the locomotorapparatus originating from the Department of Biomaterials/Handicap Research, Institute for ClinicalSciences at Sahlgrenska Academy, Göteborg University, Sweden.
1. Anders R Eriksson DDS, 1984. Heat-induced Bone Tissue Injury. An in vivo investigation ofheat tolerance of bone tissue and temperature rise in the drilling of cortical bone. Thesisdefended 21.2.1984. Ext. examin.: Docent K.-G. Thorngren.
2. Magnus Jacobsson MD, 1985. On Bone Behaviour after Irradiation. Thesis defended29.4.1985. Ext. examin.: Docent A. Nathanson.
3. Fredrik Buch MD, 1985. On Electrical Stimulation of Bone Tissue. Thesis defended 28.5.1985.Ext. examin.: Docent T. Ejsing-Jörgensen.
4. Peter Kälebo MD, 1987. On Experimental Bone Regeneration in Titanium Implants. Aquantitative microradiographic and histologic investigation using the Bone Harvest Chamber.Thesis defended 1.10.1987. Ext. examin.: Docent N.Egund.
5. Lars Carlsson MD, 1989. On the Development of a new Concept for Orthopaedic ImplantFixation. Thesis defended 2.12.1989. Ext. examin.: Docent L.-Å. Broström.
6. Tord Röstlund MD, 1990. On the Development of a New Arthroplasty. Thesis defended19.1.1990. Ext. examin.: Docent Å. Carlsson.
7. Carina Johansson Techn Res, 1991. On Tissue Reactions to Metal Implants. Thesisdefended 12.4.1991. Ext. examin.: Professor K. Nilner.
8. Lars Sennerby DDS, 1991. On the Bone Tissue Response to Titanium Implants. Thesisdefended 24.9.1991. Ext. examin.: Dr J.E. Davis.
9. Per Morberg MD, 1991. On Bone Tissue Reactions to Acrylic Cement. Thesis defended19.12.1991. Ext. examin.: Docent K. Obrant.
10. Ulla Myhr PT, 1994. On Factors of Importance for Sitting in Children with Cerebral Palsy.Thesis defended 15.4.1994. Ext. examin.: Docent K. Harms-Ringdahl.
11. Magnus Gottlander MD, 1994. On Hard Tissue Reactions to Hydroxyapatite-Coated TitaniumImplants. Thesis defended 25.11.1994. Ext. examin.: Docent P. Aspenberg.
12. Edward Ebramzadeh MScEng, 1995. On Factors Affecting Long-Term Outcome of Total HipReplacements. Thesis defended 6.2.1995. Ext. examin.: Docent L. Linder.
13. Patricia Campbell BA, 1995. On Aseptic Loosening in Total Hip Replacement: the Role ofUHMWPE Wear Particles. Thesis defended 7.2.1995. Ext. examin.: Professor D. Howie.
14. Ann Wennerberg DDS, 1996. On Surface Roughness and Implant Incorporation. Thesisdefended 19.4.1996. Ext. examin.: Professor P.-O. Glantz.
15. Neil Meredith BDS MSc FDS RCS, 1997. On the Clinical Measurement of Implant Stability andOsseointegration. Thesis defended 3.6.1997. Ext. examin.: Professor J. Brunski.
16. Lars Rasmusson DDS, 1998. On Implant Integration in Membrane-Induced and Grafter Bone.Thesis defended 4.12.1998. Ext. examin.: Professor R. Haanaes.
17. Thay Q Lee MSc, 1999. On the Biomechanics of the Patellofemoral Joint and PatellarResurfacing in Total Knee Arthroplasty. Thesis defended 19.4.1999. Ext. examin.: Docent G.Nemeth.
18. Anna Karin Lundgren DDS, 1999. On Factors Influencing Guided Regeneration andAugmentation of Intramembraneous Bone. Thesis defended 7.5.1999. Ext. examin.: ProfessorB. Klinge.
19. Carl-Johan Ivanoff DDS, 1999. On Surgical and Implant Related Factors Influencing Integration andFunction of Titanium Implants. Experimental and Clinical Aspects. Thesis defended
12.5.1999. Ext. examin.:Professor B. Rosenquist.

5
20. Bertil Friberg DDS MDS, 1999. On Bone Quality and Implant Stability Measurements. Thesisdefended 12.11.1999. Ext. examin.: Docent P. Åstrand.
21. Åse Allansdotter Johnsson MD, 1999. On Implant Integration in Irradiated Bone. AnExperimental Study of the Effects of Hyberbaric Oxygenation and Delayed Implant Placement.Thesis defended 8.12.1999. Ext. examin.: Docent K. Arvidsson-Fyrberg.
22. Börje Svensson DDS, 2000. On Costochondral Grafts Replacing Mandibular Condyles inJuvenile Chronic Arthritis. A Clinical, Histologic and Experimental Study. Thesis defended22.5.2000. Ext. examin.: Professor Ch. Lindqvist.
23. Warren Macdonald BEng, MPhil, 2000. On Component Integration in Total Hip Arthroplasty:Pre-Clinical Evaluations. Thesis defended 1.9.2000. Ext. examin.: Dr A.J.C. Lee.
24. Magne Røkkum MD, 2001. On Late Complications with HA Coated Hip Asthroplasties. Thesisdefended 12.10.2001. Ext. examin.: Professor P. Benum.
25. Carin Hallgren Höstner DDS, 2001. On the Bone Response to Different Implant Textures. A3D analysis of roughness, wavelength and surface pattern of experimental implants. Thesisdefended 9.11.2001. Ext. examin.: Professor S. Lundgren.
26. Young-Taeg Sul DDS, 2002. On the Bone Response to Oxidised Titanium Implants: The roleof microporous structure and chemical composition of the surface oxide in enhancedosseointegration. Thesis defended 7.6.2002. Ext. examin.: Professor J.-E. Ellingsen.
27. Victoria Franke Stenport DDS, 2002. On Growth Factors and Titanium Implant Integration inBone. Thesis defended 11.6.2002. Ext. examin.: Associate Professor E. Solheim.
28. Mikael Sundfeldt MD, 2002. On the Aetiology of Aseptic Loosening in Joint Arthroplasties,and Routes to Improved cemented Fixation. Thesis defended 14.6.2002. Ext. examin.:Professor N Dahlén.
29. Christer Slotte DDS, 2003. On Surgical Techniques to Increase Bone Density and Volume.Studies in the Rat and the Rabbit. Thesis defended 13.6.2003. Ext. examin.: Professor C.H.F.Hämmerle.
30. Anna Arvidsson MSc, 2003. On Surface Mediated Interactions Related to Chemo-mechanicalCaries Removal. Effects on surrounding tissues and materials. Thesis defended 28.11.2003.Ext. examin.: Professor P. Tengvall.
31. Pia Bolind DDS, 2004. On 606 retrieved oral and cranio-facial implants. An analysis ofconsecutively received human specimens. Thesis defended 17.12. 2004. Ext. examin:Professor A. Piattelli.
32. Patricia Miranda Burgos DDS, 2006. On the influence of micro-and macroscopic surfacemodifications on bone integration of titanium implants.Thesis defended 1.9. 2006. Ext. examin:Professor A. Piattelli.
33. Jonas P Becktor DDS, 2006. On factors influencing the outcome of various techniques usingendosseous implants for reconstruction of the atrophic edentulous and partially dentate maxilla. Thesis defended 17.11.2006. Ext examin: Professor K. F. Moos
34. Anna Göransson DDS, 2006. On Possibly Bioactive CP Titanium Surfaces. Thesis defended8.12. 2006 Ext examin: Prof B. Melsen
35. Andreas Thor DDS, 2006. On platelet-rich plasma in reconstructive dental implant surgery.Thesis defended 8.12. 2006. Ext examin Prof E.M. Pinholt.
36 Luiz Meirelles DDS MSc 2007. On Nano Size Structures For Enhanced Early BoneFormation. To be defended 13.6.2007. Ext examin:Professor Lyndon F. Cooper.

6
Abstract
Purpose The general aim of the present thesis was to investigate early bone response totitanium implants modified with nano size structures. Therefore, 1. a model to evaluate titaniumimplants modified with nano size structures was validated; 2.a suitable detection method ofnano size structures was implemented.Materials and Methods A rabbit model was selected and healing time was 4 weeks in allexperiments. A smooth cylindrical implant design was selected in order to control the macro-threads and micro-structures. Thus, early bone response could be related to added nano sizestructures alone. A stabilization plate was utilized to ensure adequate fixation of the attachedimplant. Smooth implants were obtained through polishing techniques (electrical and mechanical)and were used as control surfaces and, after relevant modifications, as experimental surfaces.Six surface modifications were investigated: 1. mechanically polished, 2. electropolished, 3.nano hydroxyapatite (HA), 4. nano titania, 5. blasted (TiO2) and 6. fluoride-modified. Theimplant surface topography was measured with an interferometer and an atomic forcemicroscope. Surface roughness parameters were calculated and nano size structures dimensionand distribution were characterized. Surface morphology was evaluated by scanning electronmicroscopy. Surface chemical composition was monitored with X-ray photoelectron spectroscopy.The bone response was measured with removal torque tests and histological andhistomorphometrical analyses.Results The model tested to evaluate smooth implants was found adequate. Atomic forcemeasurements combined with image processor analyses software was suitable to characterizenano size structures at the implant surface. Nano HA modified implants enhanced bone formationat 4 weeks of healing compared to electropolished implants. However, placed in a gap healingmodel the nano HA modified implants showed similar bone formation compared to electropolishedimplants. If both test and control implants were modified with nano structures, so-called bioactivenano HA and bioinert nano titania, respectively; enhanced bone response of 24% was found tothe “bioinert” nano titania implants, although not statistically significant. The beneficial effectof nano size structures on the experimental model was tested on screw shaped moderatelyrough implants. The oral implants that exhibited particular nano structures (fluoride and nanoHA) showed a tendency of higher removal torque values compared to control (blasted) implants,that lacked such structures.Conclusions Based on in vivo animal experiments, enhanced bone formation was demonstratedto smooth and moderately rough titanium implants modified with nano size structures withdifferent chemical composition.
Key words: nano structures, nanotopography, surface modification, osseointegration, bone tissue,titanium implants
ISBN: 978-91-628-7202-1
Correspondence: Luiz Meirelles, Dept Biomaterials, Box 412, 405 30 Göteborg, Sweden;email: [email protected]
7
List of papersThis thesis is based on the following papers, which are referred to in the text by their Romannumerals (I-V):
Paper I: validate the model Paper II: effect of nano HA Paper III: nano HA in a gap model Paper IV: nano- HA and titania Paper V: nano structures on oral implants
Meirelles L, Arvidsson A, Albrektsson T, Wennerberg A. Increased bone formation to unstable nano rough titanium implants. Clin Oral Impl Res, In press. Meirelles L, Arvidsson A, Andersson M, Kjellin P, Albrektsson T, Wennerberg A. Nano hydroxyapatite structures influence early bone formation. Submitted for publication. Meirelles L, Albrektsson T, Kjellin P, Arvidsson A, Stenport Franke V, Andersson M, Wennerberg A. Bone reaction to nano hydroxyapatite modified titanium implants placed in a gap healing model. J Biomed Mater Res Part:A, accepted. Meirelles L, Melin, L, Peltola T, Kjellin P, Kangasniemi I, Fredrik C, Andersson M, Albrektsson T., Wennerberg A. Nano size hydroxyapatite and titania nano structures and early bone healing. Submitted for publication. Meirelles L, Currie F, Jacobsson M, Albrektsson T, Wennerberg A. The effect of chemical and nano modifications on early stage of osseointegration. Submitted for publication.

8
Contents
Introduction 9Background 9Bone tissue 10Bone response and biomaterilas classfication 14Implant Surface in Relation to Bone Healing 15Topography 20
Aims 25
Material and Methods 27Implant Design 27Surface Modifications 27Stabilization Plate 283D Topographical Characterization 28Chemical Characterization 30Animal Model and Anaesthesia 31Surgical technique and implant insertion 31Bone Response Evaluation Methods 32Statistics 34
Results 353D Topographical Characterization 35Chemical Characterization 36Bone Response 36
Discussion of methods 45Study Design 45Topographical analysis 47Bone Response Evaluation Methods 52
Discussion of results 54Rationale behind each study 54Surface Roughness and Chemistry 55Surface features 57Summary and future perspectives 58
Conclusions 59
Acknowledgements 60
References 61

9
Introduction
Background
The replacement of lost or failing tissues demands artificial substitutes that should be suitablefor every patient and could be delivered and stored. Implant material and design have been infocus of intense research to optimize tissue response to foreign materials. The replacement ofa single lost tooth requires adequate function of a multi-unit implant. Successful connectionbetween hard and soft tissues and the inserted implant is a vital requirement for long-termoutcome. In addition to the implant material and design, effort of researchers and clinicianshave been concentrated to the surgical procedure, minimizing trauma and optimizing implantstability.Osseointegrated commercially pure (c.p.) titanium implants were successfully introduced byBrånemark et al1 for rehabilitation of edentulous jaws. Later, good results with the Brånemarkimplant system were reported by Brånemark et al2 and Albrektsson et al3 at longer healingperiods. Attempts to explain the mechanisms behind osseointegration started in the 1980s;bone response to different metal alloys4, implant designs and surgical fit5, were investigated atdifferent healing periods and with different techniques6. The aim was to evaluate bone-implantinterface interactions that may lead to failure or success of implant rehabilitation. The conceptdeveloped to restore fully edentulous jaws was also applied for fixed partial bridges or singlereplacements where long term evaluations likewise demonstrated high degree of success7,8.Today, c.p. titanium is the most widespread used biomaterial in oral implantology and titaniumbased materials are used for replacement of lost tissues in several parts of the human body.
Despite high success rates obtained with the correct protocol, some cases may not be idealfor repair with osseointegrated implants. Factors underlying implant success or failure havebeen investigated in numerous scientific reports. However, the mechanisms that explain thebackground to success or failure are not fully understood. At this moment, nanotechnologyhas emerged with several techniques to modify implant surfaces. In addition, some evaluationtechniques at the nano level are contributing important information regarding tissue and cellinteractions with the implanted material. Increased knowledge of the early healing events atthe nano level may help to understand the sequence of events at bone-implant interfaces andprovide guidelines for the further development of osseointegrated implant surfaces.

10
Bone tissueBone tissue can be divided in organic and inorganic components, which corresponds to 20%and 65% of the wet weight of bone, respectively. Water content contributes with 10%,approximately. The bone organic matrix is formed mainly by collagen type I and small amountsof type V and XII (90%, approximately). The remaining 10% of the organic matrix is formedby a variety of non-collagenous proteins that have different functions on the regulation of bonemineralization, organization of the matrix and activity of bone cells. The proteins includeosteocalcin, osteonectin, bone sialoproteins, bone phosphoproteins and proteoglycans.The inorganic matrix serves as an ion reservoir and gives bone most of its stiffness and strength.The basic unit of the inorganic matrix is the apatite crystals that contain calcium, phosphorous,sodium and magnesium.On the macroscopical level there are two types of bone: cortical and cancellous. Cortical andcancellous bone have the same matrix composition and structure, but the mass of the corticalbone matrix per unit of volume is higher, with approximately 10% of porosity compared to50-90% porosity found in the cancellous bone. This difference in tissue arrangement providesincreased resistance to torsion and bending to the cortical compared to the cancellous bone.At the microcospical level, cortical and cancellous bone may consist of woven or lamellarbone. Woven bone has an irregular pattern of collagen fibrils and it contains approximatelyfour times the number of osteocytes per unit of volume compared to lamellar bone. Osteocytespresent in the woven bone vary in size, orientation and distribution, while those in lamellarbone are relatively uniform in size, with the long axis parallel to the collagen fibrils of thematrix. The surfaces of bone are covered with connective tissue sheets called periosteum(externally) and endosteum (internally). The periosteum contributes an important part of theblood supply to the bone and exhibits mesenchymal cells that may differentiate and formosteoblasts and osteocytes. The references consulted in this section includes: Junqueira &Carneiro 9, Buckwalter et al 10 and Bilezikian et al 11.
Bone cells
There are four cells directly responsible for bone formation and resorption through life.Osteoblasts, bone lining cells and osteocytes are derived from mesemchymal stem cells;located at the bone marrow and at the perio/endo-steum. They are responsible for the bonematrix deposition and maintenance. Osteoclasts are derived from the fusion of bone marrow-derived mononucleated cells and, when active, resorbs bone matrix.The osteoblast is the key cell for bone formation and it arises from the osteoblast lineage withrecognizable stages of proliferation and differentiation, as detected by in vivo and in vitroexperiments. There are 7 postulated steps observed from the precursor stem cells to the finalosteocyte. The cell development sequence was routinely characterized by morphologicaldefinitions, where decreasing profilerative capacity and increasing differentiation was observed.

11
Morphological definitions are now routinely supplemented by the analysis of bone cellmacromolecules, such as bone matrix proteins: type I collagen, osteocalcin (OCN), osteopontin(OPN), bone sialoproteins (BSP); and transcriptors factors, such as: Cbfa1/Runx2, AP-1,Msx-2 and Dlx-5. The expression of each one of these markers is related to differentiationstep of the bone cell lineage12. In addition, the intensity detected of each marker may indicatehow active the cell is; that, ideally, could determine the ability of the cell to form bone on theseeded surface.The mature osteoblasts are located on the surface of the bone, packed tightly against eachother, separated by the mineralized bone by a thin zone called osteoid. An active osteoblasthas a round, oval or polyhedral form and secrete the bone matrix, starting with collagen typeI. After secretion of several bone matrix components, some osteoblasts are trapped in bonematrix and become osteocytes. The last step of the osteogenic cells may include also cellapoptosis or differentiation to bone lining cells.Bone lining cells are flat, elongated and inactive cells that cover bone surfaces; they do notparticipate in bone formation or resorption. They have few cytoplasmatic organelles and littleis known regarding the function of these cells.Osteocytes lie in the lacunae situated between lamellae of the matrix. Only one osteocyte isfound in each lacuna. Thin canaliculi house cytoplasmatic processes that communicate amongosteocytes and molecules are exchanged. Compared to osteoblasts, the almond-shapedosteocytes exhibit significantly reduced number of organelles. These cells are involved in themaintenance of the bone matrix, and their death may be followed by matrix resorption.The Osteoclast has the only function to resorb mineralized tissue, a normal function for bonegrowth and remodeling. At present, osteoclasts seems to be the only cell that is able to resorbthe mineralized tissue matrix, where the larger cells are more effective than the smaller ones.Osteoclasts originate from the hematopoetic tissue. After proliferation and differentiation dueto several cytokines and growth factors, the mononuclear preosteoclasts are guided to bonesurfaces. At the resorption site is observed the retraction of the bone lining cells and themultinuclear osteoclast can attach to the mineralized border. The resorbing osteoclasts arehighly polarized cells, containing several different plasma membrane domains: ruffled border,sealing zone, basolateral domain and a functional secretory domain. The ruffled border is theactual resorbing unit of the cell, characterized by a low pH. Osteoclasts can go through morethan one resorption cycle after which they can go two different routes: fission into mononuclearcells or death.
Bone chemistry of the inorganic matrix
The mineral part of bone is formed by hydroxyapatite, Ca10(PO4)6(OH)2. Hydroxyapatitecrystal precursors are initially found inside matrix vesicles; extracellular vesicles associatedwith mineralized tissue forming cells, such as osteoblasts and odontoblasts. Ca2+ and PO4
3-
accumulation inside these matrix vesicles will form noncrystalline amorphous calcium phosphates

12
further transformed to hydroxyapatite (Phase 1). Some reports indicate that this transitoryamorphous phase is characterized by octacalcium phosphate13. Continuous growth of thecrystals inside the matrix vesicles will expose them to the extracellular fluid, after penetratingthe matrix vesicle membranes (Phase 2)14. The HA crystals are deposited in a way that theirc axes are aligned to the collagen fibril15 and will act as nucleation sites for the continuousbone mineralization process. The intimate relationship between the HA crystals and the collagenfibers was demonstrated in the early 1950s16.When investigated in more detail, the apatite present in bone is rather variable (as expectedfrom biological material). In the early 1950s, McConnell17 speculated that bone mineral ismore similar to carbonate containing apatite, a notion supported by others18,19. The overallcontent of CO3 in the apatite structure may be related to the age of the tissue20. Some otherselements, such as, F, Cl, Mg, Na and K may be found in bone, dependent on the age of thehost, biopsy region and species investigated. Legeros21 suggested the approximate formulafor the mineral phase of bone to be: (Ca, Mg, Na)10(PO4HPO4CO3)6(OH)2.
Bone 3D nanotopography
Bone may be represented by different levels of organization; from the macro to the nanostructure, i.e. from the overall shape of each individual bone till small structures at the nanolevel (Fig.1). Bone extracellular matrix (ECM) is mainly formed by collagen type I and apatitecrystals, constituents of the organic and inorganic matrix, respectively. Both collagen type Iand apatite crystal dimensions are in the nanometer size, producing a unique 3D nanotopography. Collagen type I is formed by the arrangement of cylindrical triple helix units withan average diameter of 1.5 nm and length of 300 nm22, that forms collagen fibrils of 80-100nm in diameter. The triple helix cylinder molecules of collagen are parallel, organized in differentrows and separated by the following cylinder by a gap of 35 nm. The apatite crystals presentin bone exhibit a plate-shaped form, with average dimensions of 50 X 25 X 4 nm, evaluatedby TEM23 and small angle X-ray scattering24, respectively.Cells attachment, migration, proliferation and protein syntheses are affected by the three-dimensional spatial arrangement of the ECM, which provides binding sites on the differentnano structures existent.The importance of the existent 3D nano topography of bone does not imply that chemicalsignaling is irrelevant. Cell-cell and cell-matrix chemical signaling follows binding sites locatedin the different structures located on the extracellular matrix25,26. The issue highlighted is thatthe adequate understanding of the bone ECM topography may indicate the adequate 3Dnano topography for biomaterials surfaces. The characterization of 3D nanotopography maynot only focus on the early events during tissue healing after implantation; on load bearingimplants, such as the osseointegrated implants, the surface may interact favorably duringfunction, i.e., enable proper stress transfer at the implant-tissue interface, withstanding thedynamic shear strengths.

13
Figure 1. Hierarchical organization of bone at different size levels in bone. Overall shape ofbone (a) at the macro level; each osteon formed by the osteocytes on the micro level (b),apatite crystals and collagen fibers with the binding sites represent the structures at the nanolevel of resolution, forming the 3D nano topography of bone (c,d). From [Stevens, M; George,J. Exploring and engineering the cell surface interface. Science 2005; 310:1135-38]. Reprintedwith permission from AAAS.

14
Bone response and biomaterials classification
Bone response
The bone tissue response to osseointegrated implants can be related to six factors proposedby Albrektsson and coworkers27: implant material, implant design, surface quality, status ofthe bone bed, surgical technique and implant loading conditions. The improvement of theosseointegrated implant success may be result of increased knowledge of these factors.
Biomaterial classification
At about the same time as the work by Albrektsson et al27, Osborn & Newesely 28, proposeda classification of materials to be implanted in the bone according to the material activity andrelated tissue response: biotolerant, bioinert, bioactive. According to this classification:
A biotolerant material was described as capable of a distance osteogenesis; bone will formbut not in contact with the host bone. The implant retention is based on the principle ofinterlocking exclusively by mechanical means. The materials included in this group arerepresented by bone cement, stainless steel and Cr-Co alloy.
A bioinert material was supposed to show contact osteogenesis; direct contact of the adjacentbone is observed to the implanted material. The implant retention is also based on the interlockingprinciple, i.e. exclusively by a mechanically based anchorage. The materials included in thisgroup are represented by carbon, alumina and titanium.
Bioactive materials showed bonding osteogenesis; direct chemical bond between implantand adjacent bone occur. The implant retention is based on both mechanical interlocking andchemical bonding between bone-implant. The materials included in this group are representedby glass-ceramics, tricalcium phosphates and hydroxyapatite.

15
Implant Surface in Relation to Bone Healing
There are different methods and materials currently in use to optimize the bone response andother approaches are under evaluation. For example, surface modifications, such as: heattreatment, blasting, acid etching, hydroxyapatite coating and sol-gel coating have beenintroduced.
Heat treated implants
Hazan and coworkers evaluated Ti-6Al-4V and stainless steel implants29. The Ti-6Al-4Vscrew implants were heat treated at 280oC for 180 min and compared to non-heated Ti-6Al-4V implants, placed in the femur medullary canal of rats. Evaluation periods included 4, 5, 6,10 and 35 days and significantly increased pull out values for the heat treated implants werereported at all time periods evaluated. However, the increased bone formation to heat treatedimplants reported by Hazan et al29 was not observed in a more recent study30. Titanium c.p.implants that were heat treated up to 700-800oC and when compared to controls exhibitedthicker oxide and similar roughness parameters. Bone response after 6 weeks in the rabbittibia and femur demonstrated similar values of bone contact and bone area. An alternativeapproach to improve surface affinity for bone was previous treatment with NaOH of thesurface before heat treatment31. The NaOH treatment results in a sodium titanate hydrogel,converted in an amorphous sodium titanate layer with heat treatment at 600oC 32. In vivotests revealed increased bone response to the alkali-heat treated compared to untreatedimplants after 3-12 weeks of healing in rabbits33 and dogs34. However, the authors did notevaluate the surface topography, and the clear difference observed in porosity may be enoughto explain the higher bone formation to the alkali-heat treated implants. In another study35, aporous implant served as control and was also further modified with apatite-wollastonite(AW) glass and with alkali- heat treatment. Hence, the clear difference in microtopographyobserved in the previous studies33,34 was not present. In this study35, where all the implantsexhibited surface pores, no difference in bone ingrowth after 4 and 12 weeks healing periodwas observed when the so-called bioactive was compared to the control implant. Push outtests revealed higher value only between the control and alkali-heat treated implant after 4weeks, whereas similar values were reported after 12 weeks.
Blasted implants
The grit blasting technique usually is performed with titania or alumina particles. The finalsurface roughness may be controlled by varying the particle size selected. Titanium implantsblasted with alumina and titania particles with sizes of 25 μm and 75 μm (Sa = 1-1.5 μm)demonstrated enhanced bone formation compared to turned implants (Sa = 0.4 μm) placed in

16
rabbits36. TioBlast implants (AstraTech) surface modification included grit blasting with titaniaparticles. The success rate of TioBlast implants reported in a prospective study after 7 yearswas 96.9% with the same survival rate at 10 years. Compared to turned implants, TioBlastimplants demonstrated lower bone loss and higher overall success rates37,38. Grit blastingrepresented the first clinically applied surface modification of titanium implants; the techniquehas then been further modified with acid etching, such as: SLA (Straumann) and Osseospeed(AstraTech).
Acid Etched implants
Acid etching of titanium removes the oxide layer and parts of the underlying material, even ifthe surface oxide immediately reforms under normal conditions. The extent of material removeddepends on the acid concentration, temperature and treatment time. The most commonlyused solutions for acid etching of titanium includes: a mixture of HNO3 and HF or a mixture ofHCl and H2SO4
39. Fluoride treatment has been investigated in the field of biomaterials fielddue to the benefits of this element in bone physiology. An in vitro analysis of fluoride modifiedimplants was performed with human mesenchymal cells. No difference in cell attachment40,41
was detected between the fluoride modified and control (grit-blasted) implants. In addition,decreased cell proliferation was observed after 7 days on the fluoride modified compared tocontrol (grit-blasted) implants41. The results of osteoblast differentiation showed increasedexpression of Cbfa140,42, osterix40 and bone sialoprotein41 to fluoridated implants. An in vivoevaluation was performed to test the potentially enhanced bone response to fluoride modifiedimplants. Ellingsen (1995)43 used an aqueous solution with up to 4% of NaF for etchingtitanium c.p. coined-shape implants. After 4 and 8 weeks the push out test revealed an improvedretention for the NaF treated implant compared to control (untreated) implants. Moreover,improved bone formation was observed on screw shaped implants treated with diluted HFsolution44. Analyses were performed after 1 and 3 months. Fluoride modified implants exhibitedincreased bone contact and bone area values at both periods evaluated compared to thecontrol implants. Removal torque evaluations showed higher values for the fluoride implantsafter a 3-month healing period, but no difference at 1 month. Enhanced bone formation wasreported at an earlier healing period of 21 days41. In this study41, implants were placed in therat tibia, and showed increased bone contact values for the fluoride modified implants comparedto the control (untreated) implants.
Hydroxyapatite coated implants
Hydroxyapatite is one of the materials that may form a direct and strong binding between theimplant and bone tissue45,46, named as bioactive according to Osborn & Newesely28

17
classification. This property of hydroxyapatite, Ca10(PO4)6(OH)2, is related to a sequence ofevents that results in precipitation of a CaP rich layer on the implant material through a solid-solution ion exchange on the bone-implant interface47,48. This reaction will occur simultaneouslywith biomolecules incorporation and cell recruitment. The CaP incorporated layer will graduallybe developed, via octacalcium phosphate49, in a biologically equivalent hydroxyapatite46,50
that will be incorporated in the developing bone46,51,52.Synthetic hydroxyapatite has also been widely investigated for biomaterials applications dueto the similar chemical composition when compared to the mineral (inorganic) matrix of bone,which is generally referred to as hydroxyapatite. Different elements, such as: F and Si, may beintroduced in the synthetic apatite. The presence of different elements in the apatite crystal isof great importance for the surface kinetics of the synthetic material that ultimately is related tobone response. The dissolution rate of the material depends on the particle size, porosity,specific surface area and crystallinity. For example, when comparing to hydroxyapatite; thecarbonate apatite is less stable and the fluoride apatite is more stable53,54. The decreaseddissolution rate of carbonate apatite has been attributed to the simultaneous increase in particlesize, evaluated by TEM55. It was observed that a higher content of carbonate was associatedto an increased particle size. Thus, increased dissolution rate may be related not only to thechemical composition, but also be associated to the difference in particle size.Depending on the fabrication technique, hydroxyapatite may show a similar crystal structureas the mineral phase of bone. The hydroxyapatite properties known already by early 1980sresulted in an intense investigation for the potential application of the material. HA bulk materialwas first used for alveolar ridge augmentation56,57 and craniofacial reconstructive surgery58.Further evaluation of bulk HA as a load-bearing implant59,60 failed in long-term and fractureddue to fatigue failure of the ceramic material. The low shear strength of bulk HA required adifferent approach, where the material was applied as coating on metals. Initially promisingresults in the late 1980s were reported from different groups in animal experiments61,62. Thecoat was based on the plasma spraying method63.
HA coatings techniques
Important factors for the behavior of the HA coatings include: chemical composition, Ca/Pratio, crystallinity, microstructure, adhesive strength, thickness and presence of trace elements64.Different methods have been described for applying hydroxyapatite coatings onto metals anddifferent material properties may result from each method.Plasma-spraying is the most important commercially used technique for coating metals,especially titanium. In a so-called plasma gun, an electric arc current of high energy is struckbetween a cathode and an anode. An inert gas is directed through the space between theseelectrodes, and the arc current ionizes the gas and a plasma is formed65. The rapidly moving
18
particles present in the plasma are accelerated towards the cathode and anode and thencollide with others atoms. The high speed flame with melted particles is directed to the materialsurface and the ceramic powder is deposited. Initial reports suggested that a chemical bondwould occur between the ceramic deposited and the titanium oxides66. However this chemicalbond was never proven to exist. Plasma spraying technique results in a coating thickness ofminimally 40-50 μm. Furthermore, this technique lacks in stability of the deposited ceramicand an amorphous phase is a common finding. It may also be difficult to have a homogenouscoating layer on samples with complex design. In vivo results showed a faster bone integrationin short-term evaluations, however longer evaluation periods failed to maintain the increasedbone response values67-70. Moreover, some complications have been reported on load bearingimplants placed in humans due to de-attachment of the ceramic coating from the bulk metal71-
74.Spark anodizing is a method based on the principle of anodic oxidation of the metal, a wellknown method to increase oxide thickness of the metal. In contrast to the anodizing processwhere the voltage is kept below the dielectric breakdown, spark anodizing is carried out atvoltages above the breakdown limit39. The thickness of the oxide produced may vary from afew up to 20 μm. If calcium and phosphate are added to the solution, the oxide formed willincorporate such elements, but not as hydroxyapatite75. Hydrothermal post-treatment hasproven effective in converting the non crystalline calcium phosphate in the oxide into crystallinehydroxyapatite76. An adhesion strength of 38-40 MPa was achieved with a low electrolyteconcentration that lead to an incomplete coverage of the implant by HA crystals and lowerbone response, when compared to implants with full HA coverage76,77. Even when comparedto turned implants, the spark anodized with HA crystals failed to show increased boneformation78. So far, no implants have been placed in humans with this modification.
HA thin coatings techniques (< 10 μm)
Pulsed laser deposition is a method with well controlled thickness of the coating. The numberof laser pulses determined the desired film thickness, deposited at a rate of approximately0.02 nm/laser shot. The crystalline phases of CaP formed, Ca/P ratio and coating adhesionare dependent on the temperature and gas content in the vacuum chamber. Interestingly, thecoating thickness used for in vitro an in vivo tests was 2,0 μm79,80, a thickness that may lead tothe undesirable de-attachment. So far, no implants have been placed in humans with thismodification.Sputter deposition is a process that ejects atoms or molecules of a material by bombardmentof high energy ions. There are several sputter techniques and a common drawback inherent inall these methods is that the deposition rate is very low and the process itself is very slow81.The deposition rate is improved by using a magnetically enhanced variant of diode sputtering,so-called radiofrequency magnetron sputtering82. In vivo evaluation at short- and long- term

19
periods revealed more bone contact compared to amorphous CaP and turned implants83,84.However, no implants have been clinically documented with this surface modification.The Sol-gel method has been successfully used to deposit hydroxyapatite thin films on titaniumsamples with different designs, such as discs, cylinders and screws85,86. The thickness mayvary from 1 to 10 μm. Coating thickness can be controlled during the different stages of thesol-gel process or by simply adding different number of layers on the substrate. The low bondstrength observed on sol-gel derived HA layers 86 may be improved by mixing TiO2 sol withHA sol, producing a HA-TiO2 composite sols87. The sol-gel method may produce differentceramics of interest for osseointegrated implants, different from HA, as will be discussed inthe next section.
Sol-Gel coated implants
The sol-gel method represents a simple and low cost procedure with homogenous chemicalcomposition onto substrates with large dimensions and complex design. Sol-gel processing ofinorganic ceramic and glass materials started at the mid 1800s88, when it was reported thathydrolysis of tetraethyl orthosilicate formed SiO2. However, at that time, extremely long dryingperiods (1 year or more) were necessary and consequently there was little technologicalinterest. The development of new evaluation techniques from the 1950s, for example: nuclearmagnetic resonance and X-ray photoelectron spectroscopy enabled the investigation of eachstep of the sol-gel process on the nanometer scale. The better understanding and control ofeach step of the sol-gel process allowed a remarkable decrease in the drying step withoutdamage to the coating89. The sol-gel method has attracted great attention in the field ofbiomaterials since the final product may include hydroxyapatite and titania, two of the mostcommon materials used for osseointegrated implants. Sol-gel titania films may be preparedusing a dip coating90,91 or spin coating92 process. Titania bonding strengths of the films arerelated to the surface pre-treatment, firing atmosphere, and surface topography93. Moreover,the particle size and particle aggregation can be modulated by the aging time of the sol; thatmay produce different coating thickness, ranging from 210 to 380 nm94. In addition, thenumber of layers applied onto the sample affects the surface topography. A more narrowpeak distance distribution was demonstrated with 5 layers compared to 1 layer95.In vivo bone tissue evaluations of surfaces modified using the sol-gel method have been mainlyperformed on CaP or glass materials. Bone formation was in close contact with the materialand no adverse reaction was observed96,97. However, the behavior of sol-gel modifications ofloaded osseointegrated implants in the long term remains unknown.

20
Topography
The modifications currently available for osseointegrated implants, and generally in use, are avariation of physical and/or chemical methods. Most often a chemical modification also resultsin different surface chemistry, surface energy and surface charge. In addition, somemodifications, like HA coated implants, possess surface properties that distinguish them fromturned implants, besides the obvious difference in surface chemistry and microtopography. Inthis section, topographical modification experiments performed by several authors wereconsidered, even when a chemical method was used. However, the potential variables besidesthe difference in surface topography highlighted by the authors should be kept in mind. Implantsurface topography may be divided in: macro, micro and nano level of resolution, as representedby Figure 2.
Figure 2. Implant macro level represented by the overall shape and thread design (a,b).Micro and nano structures are observed at higher resolution (c). From [Wennerberg A. Onsurface roughness and implant incorporation. PhD thesis. Göteborg: Göteborg University;1996 ] Reprinted with permission by the author.
a b
c

21
Micro topography
In vitro
Surface microtopography has been reported to influence cell adhesion, morphology,proliferation and differentiation. Bowers et al98 investigated osteoblast attachment on c.p.titanium discs. Higher cell attachment was observed on the sand blasted discs after 30-, 60-and 120 minutes compared to smoother surfaces, that were polished and acid etched. Similarresults were reported by Keller et al99. Osteoblast like cells attachment was evaluated on c.p.titanium discs with different surface roughness. A tendency for higher osteoblast like cellattachment for the rougher (sandblasted) surfaces compared to smooth (polished) surfacesafter 15-, 30- and 60 minutes was observed. After 120 minutes, there was a significant increaseof cell attachment on the rougher sandblasted (Ra=0.9 μm) compared to smoother surfacespolished with 600 grit SiC paper (Ra=0.2 μm) and the smoothest one polished with 1μmdiamond paste (Ra=0.04 μm). Cell attachment does not represent the entire cell activity onimplants. Cell activity on surfaces may also be demonstrated by the differences in cellproliferation and gene expression. Boyan et al100 evaluated osteoblast like cells on turned(Ra=0.6 μm), grit-blasted/acid etched (Ra=4.0 μm) and plasma sprayed (Ra=5.2 μm) surfaces.Cell morphology was similar after 14 days on the different surfaces. In addition, calcium andphosphorous content did not vary with the surface roughness, whereas cell proliferationdecreased as the surface roughness increased. In contrast, alkaline phosphatase activity wasincreased with increasing roughness. Masaki et al40 evaluated the gene expression of boneECM proteins and transcription factors of human mesenchymal cells on: 1. TiO2 grit blasted(Sa=1.1μm) surfaces, 2. (1) + acid etched in dilute HF solution (Sa=0.9 μm) surfaces, 3. gritblasted Al2O3 + acid etched in H2SO4/HCl and 4. (3) prepared under N2 atmosphere andstored in NaCl. The Sa values of the surfaces 1and 2 were reported from a previous study44
and the Sa values of the surfaces 3 and 4 were not reported. After 72 h, no difference inosteocalcin, bone sialoprotein II and collagen type I expression were detected among theinvestigated surfaces. In contrast, Cbfa1 and osterix expression was higher on surfaces 1 and2; and ALP gene expression was higher on surface 4, compared to the other surfaces.
In vivo
Several reports evaluated bone formation to implants with different surface roughness,measured as bone contact to the implant surface and/or biomechanical tests of the bone-implant interface. Generally, rougher implants show enhanced bone formation compared tosmoother implants101-104. Titanium implants surface microtopography was firstly describedwith 3D roughness parameters in 1992105. Later, blasted implants with different 3D roughnessparameters were evaluated in a series of studies106-109 and an optimal surface range of roughnesswas suggested for Sa values between 1-1.5 μm36 . The continued increase of surface roughness

22
above this range was not correlated with correspondent increase of bone response, on thecontrary, the opposite was the case. Today, most currently available dental implants exhibit amoderately rough implant surface, with 3D surface roughness values within the optimal rangeas suggested by Wennerberg & Albrektsson110.
Nano topography
In this thesis nano topography will be separated in two sub headings: Nano Roughness andNano Features, which could have been applied to microtopography (previous section) aswell. However, the literature concerning surface micro topography generally refers to surfaceroughness, not referring to individual features with micro dimensions present at the materialsurface. The nano topography literature commonly refers to both nano roughness and tospecifically designed nano features added on the material surface, so called nanofabricatedmaterials. It is important to understand that the overall surface roughness parameters of thesample will be modified when features are added on the surface i.e., by adding nano features,the surface roughness will be modified as well. Moreover, the nano rough materials may alsopossess nano features; however, the modification used to produce the so-called nano roughmaterials did not intentionally produce such nano features and, from the surface roughnessparameters described is not possible to evaluate the dimension of each individual feature atthe surface. In contrast, nano fabricated features have well defined dimensions that aim tomodulate cell activity. Specific cell response, such as: attachment, migration, proliferation anddifferentiation can be obtained guided by the features present at the surface.
Nano Roughness
In vitro Webster et al111 evaluated osteoblast adhesion on alumina and titania discs preparedby compacting powders with different particles size onto the surface. The discs were sinteredat different temperatures to obtain different nano roughness parameters of alumina and titaniamaterials. Significantly increased osteoblast adhesion was observed on alumina discs withincreased root mean square deviation (Sq) of 20 nm compared to 17 nm and larger surfacearea of 1.73 compared to 1.15 μm2, respectively. Furthermore, the titania discs revealedincreased osteoblast adhesion to discs with increased surface roughness (32 and 12 nm,respectively) and larger surface area (1.45 and 1.07 μm2, respectively). In addition, discsprepared with an identical method, but the powders consisting of Ti, Ti6Al4 and CoCrMowere tested. As previously reported for alumina and titania discs, increased osteoblast adhesionwas found in the discs from the three groups with increased Sq values112. Webster et al113
investigated osteoblast adhesion and type and concentration of different proteins adsorbedon the surface. The materials included were: alumina, titania and HA, with different nanoroughness. Pore diameter and porosity (%) were also calculated. As previously reported, the
23
osteoblast adhesion was greater on the discs that exhibited increased nano roughness,independent of the different surface chemistry. Surface porosity was higher and pore diameterdecreased on the discs with increased nano roughness. Protein adsorption revealed greateramount of vitronectin associated to the increased osteoblast adhesion on the nano rougherimplants. The osteoblast proliferation and ALP synthesis on these surfaces was evaluated onanother study from the same group114. Osteoblast proliferation increased in all tested discs(alumina, titania and HA) with increased nano roughness after 3 and 5 days. In addition, ALPsynthesis was higher after 21 and 28 days on the discs with increased nano roughness values.Oliveira & Nanci115 cultured new bone rat calvaria cells on titanium discs etched with H2SO4and H2O2. The acid etched surface revealed nano pits, whereas the control (turned) surfacesfailed to show such features, although the surface roughness was not numerically evaluated.The results indicated an overexpression of OPN and BSP both intra- and extracellulary. Inaddition, a higher proportion of cells was observed with peripheral cytoplasmic distribution ofOPN as early as 6h.
Nano Features
The literature cited in the following section will include nano feature modifications that exhibitat least one dimension below the 100 nm limit. The first commonly investigated design116,117,with controlled dimensions on the surface, was the parallel groove and ridge arrangement atthe micro level of resolution. Cell orientation was related to the groove orientation, describedas the contact guidance phenomenon. The methods currently in use enable the fabrication offeatures with well controlled dimensions within the nanometer level. However, the groove andridge arrangements are not in use for metal implants with complex designs, even if importantfindings on cell activity have emerged from these investigations. Wojciak-Stothard et al118
investigated murine macrophages on flat and nano grooved surfaces with different depths.Fifteen minutes after plating, most cells remained rounded on the plain substrata compared towell spread cells observed on the nano grooved substrata, which indicates cell activation.Moreover, cell adhesion increased gradually from the plain substrata to the shallow (30 nm)grooved substrata with higher values observed on the deepest (282 nm) grooved substrata.Similar results were found for cell orientation; the deeper the grooves the more orientated thecells. Readers interested in a more detailed explanation of the importance of groove and ridgedimensions on cell activity and orientation are directed to review papers in the field (Curtis &Wilkinson119; Flemming et al120).Another approach to optimize cell activity with nano features include the so-called islands121,122
or hemispherical pillars123,124, achieved by polymer demixing processes or colloidal lithography.Dalby et al121 compared fibroblast activity on flat surfaces and surfaces with 13 nm highislands of a diameter of 263 nm. After 3 days, increased fibroblast spreading, more focalcontacts associated to vinculin, upregulation of genes involved with cell signaling and collagenprecursors were observed on the surfaces with nano islands compared to the flat surfaces. In

24
another study122, endothelial cell activity was tested on surfaces with islands with heights of13-, 35- and 95 nm. Similar to fibroblasts 121, endothelial cells on the surfaces with 13nmislands revealed the largest cell areas (longer and wider axes) and a well defined cytoskeleton,compared to the flat and to the 35- and 95 nm island surfaces. Contrary to the increasedactivity of the fibroblast and endothelial cells, surfaces with similar features (18-, 35 and 95nm height islands) did not influence rat calvaria bone cells125. In a recent paper, Dalby et al126
compared cell activity on surfaces with different nano features, including 35- and 45 nm heightislands with a diameter of 2.2 μm and 1.7 μm, respectively. Features with column shape with10 nm height and 144 diameter were added on the flat (control) substrata. The human bonemarrow cells showed an increased cell spreading on all the three groups with nano featurescompared to flat substrata, with cells extending filopodia towards the nano features. It wasalso demonstrated a well defined cytoskeleton, enhanced expression of stress fibers withclear focal contacts, and increased expression of osteocalcin and osteopontin on the substratawith nano features.The most used material at present for nano fabrication is silicon or polystyrene (tissue cultureplastic). These materials are cheap and very easy to work with due to several chemical reactantsavailable. However, silicon and polystyrene do not have the mechanical properties requiredto load bearing osseointegrated implants. Recently, a modification with defined nano sizecrystals was implemented on titanium samples, through the sol-gel route. Zhu et al127 preparednano HA crystals of 15-50 nm in length and coated turned and anodized titanium plates.Mouse pre osteoblast cells had decreased adhesion after 15 min on the nano HA coatedsurface and similar values after 30 min compared to the control (uncoated) implants. NanoHA showed well developed filopodia and lamellipodia compared to the control implants; thatdemonstrated a greater number of focal contacts. The size of the nano crystals was notevaluated on the surface. Therefore, the size of the features present at the surface is unknown.Sato et al128 reported the dimensions of the nano HA crystal of 40-100 nm in length anddiameter of 20-30 nm. However, SEM and laser particle size analyses revealed crystalagglomerations and broad size distribution, resulting in features up to 10 μm at the surface.Thus, the use of precursor materials with nano sizes may not ensure the equivalent size on thefinal surface.
There is clear evidence from numerous in vitro studies that cell activity can be modulatedby nano size structures of different dimensions and distribution at the surface. However,there is no evidence of modulation of in vivo bone tissue response to implants due tonano size surface structures alone.

25
Aims
1. To validate a model for evaluation of bone healing to smooth cylindrical titanium implants
2. To investigate the influence of nano size hydroxyapatite structures on early boneformation
3. To determine the effect of nano size hydroxyapatite structures on early bone formationin a gap healing design
4. To compare early bone formation to titanium implants with nano size “bioactive” and“bioinert” surfaces
5. To investigate the early bone formation to moderately rough screw shaped implantswith nano size structures of different chemical compositions

26

27
Material and Methods
Implant DesignIn study I, II, III and IV cylindrical implants were turned from c.p. titanium (grade 3) rodswith a diameter of 3.5 mm and length of 8.0 mm. In study I, test implants had a threaded topto ensure full fixation on the stabilization plate, whereas the control implants had a cylindricaldesign from the bottom to the top. In study II-IV, all the implants had the same design as thetest implant from study I.In study V, screw-shaped blasted implants were used (Astra Tech AB, Mölndal, Sweden).Implants were turned from c.p. titanium (grade 3) rods and further blasted with TiO2.
Surface ModificationsA total of three underlying topographies have been used in this thesis: 1 mechanical polished,2 electropolished and 3 TiO2 blasted. Further implant surface modifications included nano HA(Promimic, Göteborg, Sweden), fluoride-modified (Astra Tech AB, Mölndal, Sweden), andnano titania (Vivoxid, Turku, Finland). In study I, surface modification included onlymechanically polished implants. Study II and III included electropolished implants furthermodified with nano HA. Study IV included mechanically polished implants modified withnano hydroxyapatite and nano titania. Study V included TiO2 blasted implants further modifiedwith nano hydroxyapatite, and fluoride acid etching.
Table1. Implant design, underlying surface and nano modification investigated in each study.
Implant design Underlying surface Nano modification
Study I Cylindrical Mechanically polished none
Study II Cylindrical Electropolished Nano HA
Study III Cylindrical Electropolished Nano HA
Study IV Cylindrical Mechanically polished Nano- HA and titania
Study V Screw shaped TiO2 blasted Fluoride and nano HA

28
Stabilization PlateExperimental cylindrical implants used in study I-IV lack of macro and micro retention.Therefore, a stabilization plate was implemented to ensure implant stability during healingphase. The plate consists of two side holes for the fixating screws and a threaded central holefor the tested implants. This model provides the same fixation to the implant no matter thesurface properties and prevents uncontrolled micromovements that may cause soft tissueintegration of the very smooth implant used in this study. The stabilization plate was originallydeveloped to ensure maximal stability enabling in vivo observations of the microcirculation ofgrafted bone129.
3D Topographical Characterization
Interferometer- Micrometer Level of Resolution
The principle of the interferometer is that two light waves, when brought together, interferewith each other. If the crest of one wave coincides with the trough of the other, the interferenceis destructive and the waves cancel out. On the other hand, if two crests or two troughscoincide, the waves reinforce each other. Subsequently, an optical fringe with parallel light anddark bands will be formed. A MicroXam equipment (PhaseShift, Tucson, USA) was used forinterferometry evaluation of the implant surface topography with a measurement area of200X260 μm. The equipment has a lateral resolution of 0.3 μm and vertical resolution of 0.05nm. The maximum vertical measuring range is 5 mm. The instrument is suitable to evaluatestructures at the micrometer level of resolution in height and spatial direction and at the sub-nanometer level of resolution in height direction.
AFM – Nanometer Level of Resolution
AFM characterization was used to evaluate the implant surface with a resolution at thenanometer level. In contrast to the interferometer principle, AFM measurements require contactbetween a scanning probe and the surface. AFM principle depends on the selected operatingmodes: 1 constant height, 2 constant force and 3 intermittent contact (Tapping mode™). TheAFM in the present thesis used the Tapping mode™. A cantilever is attached to a piezocrystal which oscillates in the vertical direction in the range of 100-400 kHz. When the tipcomes close to the sample, the oscillation of the cantilever is damped. The oscillation of thecantilever is monitored by a photo diode. The equipment has a lateral resolution of 2 nm anda vertical resolution in the atomic level i.e, picometer level of resolution. AFM analysis wasperformed in TappingMode™ using etched silicon probes (Digital Instruments, Santa Barbara,

29
USA) with cantilever lengths of 125 nm and a resonance frequency of 290 kHz. Measurementareas of 10x10 μm, each consisting of 512 scans, was recorded and the images were capturedat a scan rate of 1.0 Hz.
Filter Selection
The raw data obtained from the topographical equipments were further processed to separatethe form, waviness and roughness from the original measurements. A Gaussian high pass filter(50X50 μm) was used in all the optical interferometer measurements in study I-V. The Gaussianfilter is suitable for smoothing surfaces with rich features. In the AFM measurements smallsurface corrugations can sometimes be dominated by the noise in the scanner system. Thiswill create observable steps between the scan lines. A least mean square (LMS) fit methodsubstracts a fitted polynomial function from each individual scan line with a defined polynomialdegree. Therefore, in the AFM measurements a third order LMS fit line-wise correction wasselected. However, there might be less information about corrugations perpendicular to thescan lines and especially for roughness measurements, this may cause underestimated values130.
3D Topographical parameters
3D surface roughness parameters can be separated into four groups depending on thecharacteristics of the surface that they quantify, according to Stout131.
1. Amplitude parameters.2. Spatial parameters.3. Hybrid parameters.4. Functional parameters.
In the present thesis one of the amplitude, hybrid and spatial parameters were used to describethe surface roughness, as recommended by Wennerberg & Albrektsson110. Sa amplitudeparameter is the arithmetic average height deviation, Sdr hybrid parameter is the developedsurface area ratio and Sds spatial parameter is the number of local maxima per area.

30
Surface features characterization
In addition to the surface roughness calculation, the AFM images were evaluated with animage processor (SPIP™, Image Metrology, Lyngby, Denmark), to detect pore and featuredimensions with the grain/pore mode. The threshold segmentation method of detecting thegrains/pores was selected in the present thesis. The method defines a threshold level and abinary condition is imposed. In the grain analysis mode, only part of the signal above thethreshold is considered a segment/grain to be detected and the rest is disregarded. Alternatively,the parts under the threshold level can be interpreted as the segments to be detected, whichwill be considered as pores (Fig. 3).
Figure 3. 2D profile of AFM measurement (10x10 μm). The black dashed line represents thedetection level. In the grain analysis mode, the structures above ( ) the detection level will becounted. In the pore analysis, the structures below ( ) the detection level will be counted.
Chemical Characterization
Chemical composition of the implants was monitored by X-ray photoelectron spectroscopy(XPS). The principle of the XPS is the emission of photoelectrons from atoms by absorptionof photons excited by a X-ray beam. This observed photoelectron emission peaks in thespectrum are due to the different energy levels in the originating atoms from the materialsurface. These levels known as binding energies are element specific and represent the basisfor the analytical application of the XPS. The measurement is performed under ultra highvacuum and provides qualitative and semi-quantitative information on the elemental compositionof the sample. The instrument used was a PHI 5500 (Perkin Elmer, Physical ElectronicsDivision) with a monochromatic Al Kα X-ray source operated at 350 W. The relative energyscale was fixed with C 1s.

31
Animal Model and Anaesthesia
All studies were approved by the local ethic committee at the Göteborg University. A total offifty New Zealand white rabbits of both sexes were used in the experiments. All animals wereadult, aged from 9 to 11 months, only female rabbits were used, except for study V, whereonly male rabbits were used. The animals were kept in separate cages before surgery and twoto three days after implant surgery. Thereafter, all the animals were kept in a specially designedroom. In study V, the male rabbits were kept in separate cages during the experiment. Allanimals had free access to tap water and were fed with standard pellets, carrots, apples andhay. One animal died in study II one day after surgery, when re-suturing was been applied.Animals were anaesthetized with intramuscular injections of fentanyl and fluanison (HypnormVet, Janssen Farmaucetica, Belgium) at a dose of 0.5 mL per kg of body weight andintraperitoneal injections of diazepam (Stesolid, Dumex, Denmark) at a dose of 0,25 mg peranimal. If necessary anaesthesia was maintained using additional doses of Hypnorm at a doseof 0.1 mL per kg body weight. Before surgery, the shaved skin of the rabbit was carefullywashed with a mixture of 1% iodine and 70% ethanol. Local anesthesia with 1.0 mL of 5 %lidocaine (Xylocain, Astra Zeneca, Sweden) was injected subcutaneously in the surgical site.A single dose of prophylactic antibiotic (Borgal, Intervet, Boxmeer, The Netherlands) wasadministered at a dose of 0.5 mL per kg body weight. All ten animals received 0.5 mL of ananalgesic (Temgesic, Reckitt and Coleman, England) at a concentration of 0.3 mg/mL on theday of operation and 3 days there after. Four weeks after surgery the animals wereanaesthetized with intramuscular injections of fentanyl and fluanison (Hypnorm Vet, JanssenFarmaucetica, Belgium) at a dose of 0.5 mL per kg of body weight and further sacrificed with10 mL overdose of pentobarbital 60 mg/mL, (Pentobarbitalnatrium, Apoteksbolaget, Sweden).
Surgical technique and implant insertion
Operation was performed under aseptic conditions. In study I-IV, three holes were drilled onthe flat proximal medial tibial methaphysis surface parallel to the long axis of the bone. Thisprocedure was done under copious saline irrigation at low rotatory speed. A 3.5 mm drill wasutilized to prepare the central hole for the cylindrical implant in study I,II, IV, whereas in studyIII a 4.2 mm drill was used. Thereafter the stabilization plate was anchored by two fixatingscrews of 1.0 mm in diameter through the side holes fastened against the cortical bone. Theimplant and stabilization plate were already connected before surgery and the instrument usedto handle the implant-plate gripped the plate; not the implant. This ensured a safe handling ofthe implant by the surgeon avoiding contact with the surface. In study V the screw-shapedimplants were placed in a randomized design enabling the insertion of one implant of each ofthe four tested implants group, inserted according to AstraTech protocol.
32
Bone Response Evaluation Methods
Qualitative Evaluation
In study I, three developing stages of bone formation was observed: primitive woven bone,woven bone and lamellar cortical bone. Primitive woven bone was not fully mineralized anddarkly stained, representing the earlier stage of woven bone. Woven bone showed a mineralizedmatrix, lightly stained than the primitive woven bone, and exhibited a clear distinguishing tissueborder. Cortical lamellar bone corresponds to the original cortex of the animal; displaysmineralized pale stained matrix and osteocytes parallel to the lamellae. In studies II-V, thequalitative evaluation showed mainly cortical lamellar bone and woven bone. Therefore, nodifferent bone developing stages were described.
Histomorphometric evaluation
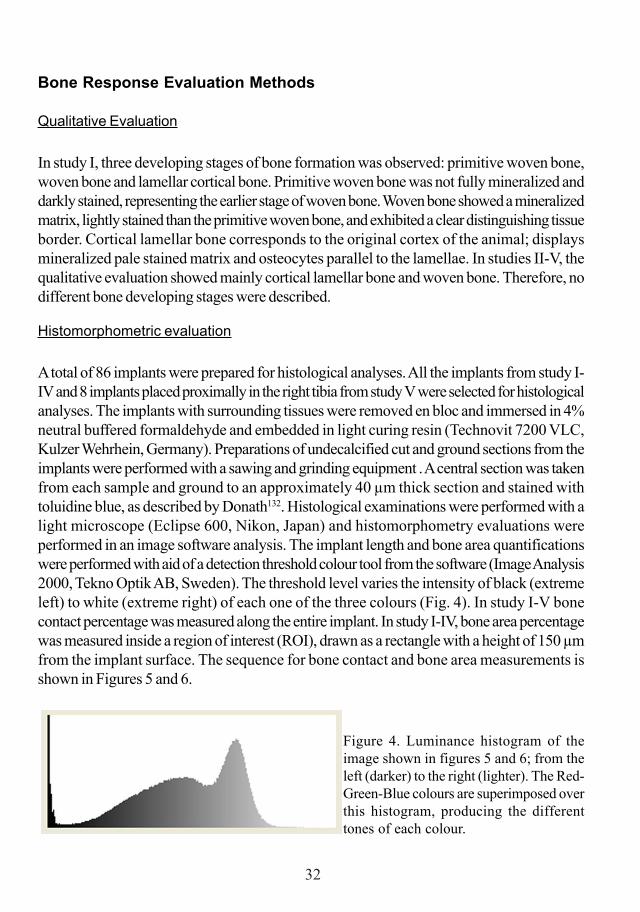
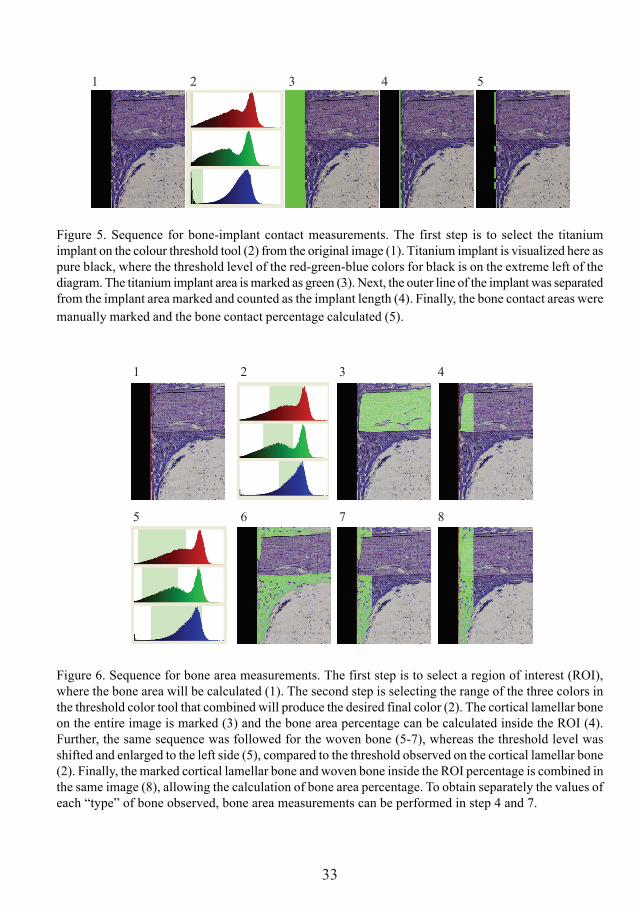
A total of 86 implants were prepared for histological analyses. All the implants from study I-IV and 8 implants placed proximally in the right tibia from study V were selected for histologicalanalyses. The implants with surrounding tissues were removed en bloc and immersed in 4%neutral buffered formaldehyde and embedded in light curing resin (Technovit 7200 VLC,Kulzer Wehrhein, Germany). Preparations of undecalcified cut and ground sections from theimplants were performed with a sawing and grinding equipment . A central section was takenfrom each sample and ground to an approximately 40 μm thick section and stained withtoluidine blue, as described by Donath132. Histological examinations were performed with alight microscope (Eclipse 600, Nikon, Japan) and histomorphometry evaluations wereperformed in an image software analysis. The implant length and bone area quantificationswere performed with aid of a detection threshold colour tool from the software (Image Analysis2000, Tekno Optik AB, Sweden). The threshold level varies the intensity of black (extremeleft) to white (extreme right) of each one of the three colours (Fig. 4). In study I-V bonecontact percentage was measured along the entire implant. In study I-IV, bone area percentagewas measured inside a region of interest (ROI), drawn as a rectangle with a height of 150 μmfrom the implant surface. The sequence for bone contact and bone area measurements isshown in Figures 5 and 6.
Figure 4. Luminance histogram of theimage shown in figures 5 and 6; from theleft (darker) to the right (lighter). The Red-Green-Blue colours are superimposed overthis histogram, producing the differenttones of each colour.
33
Figure 5. Sequence for bone-implant contact measurements. The first step is to select the titaniumimplant on the colour threshold tool (2) from the original image (1). Titanium implant is visualized here aspure black, where the threshold level of the red-green-blue colors for black is on the extreme left of thediagram. The titanium implant area is marked as green (3). Next, the outer line of the implant was separatedfrom the implant area marked and counted as the implant length (4). Finally, the bone contact areas weremanually marked and the bone contact percentage calculated (5).
Figure 6. Sequence for bone area measurements. The first step is to select a region of interest (ROI),where the bone area will be calculated (1). The second step is selecting the range of the three colors inthe threshold color tool that combined will produce the desired final color (2). The cortical lamellar boneon the entire image is marked (3) and the bone area percentage can be calculated inside the ROI (4).Further, the same sequence was followed for the woven bone (5-7), whereas the threshold level wasshifted and enlarged to the left side (5), compared to the threshold observed on the cortical lamellar bone(2). Finally, the marked cortical lamellar bone and woven bone inside the ROI percentage is combined inthe same image (8), allowing the calculation of bone area percentage. To obtain separately the values ofeach “type” of bone observed, bone area measurements can be performed in step 4 and 7.
1 2 3 4 5
1 2 3 4
5 6 7 8

34
Removal torque test
The biomechanical test of the implant-bone interface was performed with the removal torque(RTQ) test in 32 implants in study V. The RTQ instrument is an electronic equipment (DetektorAB, Gothenburg, Sweden) involving a strain gauge transducer used for testing the implantstability (the peak loosening torque in Ncm) in the bone bed and thus can be regarded as athree dimensional test roughly reflecting the interfacial shear strength between bone tissue andthe implant . A linearly increasing torque is applied on the same axis of the implant until failureof integration is reached, and the peak value recorded.
StatisticsWilcoxon sign rank test was selected for bone contact and bone area evaluation in studies I-IV. Kruskal-Wallis test evaluated the interferometer surface roughness parameters within eachgroup in study II. In study I-IV, the surface roughness comparison between the two groupswas performed with Mann-Whitney test. In study V, RTQ values were analyzed with theKruskal-Wallis test. Differences were considered statistically significant at p < 0.05.

35
Results
3D Topographical Characterization
Interferometer – Micrometer Level of Resolution
The titanium cylinders implants used in the study I-IV evaluated with interferometer revealeda very smooth surface, achieved by different surface treatments. In study I and IV polishinglines were observed, shallower after the nano coating on study IV. In study II and III theelectropolishing technique produced a very smooth surface and the grain boundaries could beobserved on the implants. In study V, all the implants showed a moderately rough implantsurface. The measurement area evaluated in all implants was 200X260 μm. Surface roughnessparameters calculated were the following: Sa; Sds; Sdr. A summary of the surface roughnessparameters of the implants used in study I-V is presented in Table 2.
AFM – Nanometer Level of Resolution
The measurements at higher resolution level revealed in more detail the structures observedwith the interferometer and some structures not detected with the previous equipment. Instudy I and IV the polishing lines were observed with the AFM as seen with the interferometer.Moreover, in study IV, nano structures were detected at the valleys and ridges of the nano HAcoated implant, whereas the nano titania implants exhibited a homogenous layer over thesurface, with rare shallow remaining polishing lines visible. In study II and III, the AFMmeasurements of the very smooth implants exhibited the titanium grain boundaries, as seenwith the interferometer, and no groove-ridge background was detected. The nano structureswere observed at the surface on a similar plane. The measurement area was 10X10 μm in allstudies. The surface roughness parameters Sa, Sds and Sdr of the titanium cylindrical implantsused in the study I-IV, evaluated at higher resolution with AFM, is summarized in Table 3.
Surface features and pore characterization
The structures present at the implant surface detected with AFM measurements in study II-IVwas characterized as pores; below the detection level determined, and as features; above thethreshold level determined. The structure characterization was performed with an imageprocessor (SPIP™, Image Metrology, Denmark), that provides automatic detection of each

36
individual structure. In study II both pores and features were evaluated. In study III onlypores were evaluated, whereas in study IV only the features were evaluated. The surfacefeature and pore characterization values are presented in Table 4. To better describe thefeatures present in study II and IV, a frequency histogram was plotted with all detected elements.In study II the diameter frequency histogram was similar for the electropolished andelectropolished-HA implants, but with some few more features detected in the range of 200-300 nm on the electropolished-HA implant. In study IV, a narrow distribution is observed onthe frequency histogram of height and diameter of the titania implant, with some feature diametersup to 100 nm and heights of 4 nm; the HA implant had some features with diameters up to 380nm and heights of 40 nm, with some intermediate values shown as well. The features detectedon the grain mode of a nano HA coated implant are shown in Figure 7.
Chemical Characterization
All test implants evaluated in studies II and IV consisted mainly of TiO2. Carbon surfacecontaminants were present in similar content among the implants evaluated, due to air exposure.Some traces of N were present in all implants investigated. The test nano HA implant (StudyII, V) contained Ca and P ions on the XPS survey spectra. In study V, the fluoride etchedimplant contained small amounts of fluoride anions.
Bone Response
Qualitative Evaluation
In all five studies, overall bone formation was similar to the implants. New formed bone couldbe observed in the endosteal and periosteal regions, and lining the implant surface (endostealformation); and between the plate and the stabilization plate (periosteal formation) in study I-IV. The origin of newly formed bone was the cortical lamellar bone of the animal. In study I,a primitive woven bone formation was observed mainly on the unstable implant compared tothe stable implant.

37
Figure 7. Nano features detected on an electropolished titanium implant modified with nanoHA. 2D image of the AFM measurement (10x10 μm) (A). The detection of the features maybe performed on a specific dimension range set before the calculation. Here, this was done tomake the features visualization more clear. Feature length of < 100 nm, 200-300 nm and 400-1000 nm are marked in B, C, D, respectively.
A B
C D

38
Tabl
e 2 In
terfe
rom
eter
eval
uatio
n. A
sum
mar
y of t
he su
rface
roug
hnes
s on t
he di
ffere
nt su
rface
mod
ifica
tions
used
in st
udy I
, II,
III, I
V an
d V. T
he er
rors
of ti
lt an
d bow
wer
e rem
oved
with
Gau
ssia
n hig
h pas
s filt
er (5
0x50
μm
). A
mea
sure
men
t are
a of 2
00x2
60 μ
m w
as u
sed.
Stud
y I-
impl
ants
wer
e m
echa
nica
lly p
olis
hed
(pol
ishe
d). S
tudy
II a
nd II
I- e
lect
ropo
lishe
d im
plan
ts n
on m
odifi
ed w
ith n
ano
HA
(E) a
ndm
odifi
ed w
ith n
ano
HA
(E-H
A).
Stud
y IV
- im
plan
ts w
ere
mec
hani
cally
pol
ishe
d an
d m
odifi
ed w
ith n
ano
HA
(HA
) and
with
nan
o tit
ania
(Tita
nia)
. Stu
dy V
, bla
sted
(B) i
mpl
ants
wer
e mod
ified
with
nan
o H
A (B
-HA
) and
, tw
o id
entic
al g
roup
s mod
ified
with
dilu
te H
F so
lutio
n (B
-F1
and
B-F
2).
Inte
rfer
omet
er
Stud
y I
Stud
y II
Stud
y III
St
udy
IV
St
udy
V
P
olis
hed
E
E-H
A E
E
-HA
H
A
Tita
nia
B
B
-HA
B
-F1
B-F
2 S a
(n
m)
109
94
134
49
84
170
121
(µm
) 1.
421.
36
1.26
1.
24
S ds
(µm
-2)
0.1
0 0
0 0
0.1
0.1
(mm
-2)
0.1
0.1
0.1
0.1
S dr
(%)
2.2
0.1
0.3
0 0.
1 2.
6 1.
6 (%
) 30
.130
.3
29.2
28

39
Table 3 AFM evaluation. A summary of the surface roughness on the different surfacemodifications used in study I, II, III and IV. The errors of tilt and bow were removed with athird order least mean square fit. A measurement area of 10x10 μm was used and the imageswere captured at a scan rate of 1.0 Hz.
Table 4 A summary of the features and pore characterization on the AFM measurements ofthe different surface modifications used in study II, III and IV. The errors of tilt and bow wereremoved with a third order least mean square fit. Measurement area of 10x10 μm. Featurediameter (diam.), height, coverage area (cov.) and density (d.); pore diameter (diam.), depth,porosity (por) and number of pores are described, mean (SD).
AFM Study I Study II Study III Study IV Polished E E-HA E E-HA HA Titania Sa (nm) 11.7 0.9 2.3 1 1 21.9 9.8 Sds (µm-2) 18.4 115 90 154 132 18.2 19.7 Sdr (%) 0.7 0 0.4 0.1 0.1 3.1 0.3
Feature Pore Implant diam. height cov.
(%) d.
(n/µm2) diam. depth por. (%) pores
Study II E 61
(40) 1.1
(0.2) 48 104 152 (283)
2.6 (1.2) 2.3 29
E-HA 67 (54)
1.2 (0.3) 43 90 83
(79) 1.3
(0.4) 7.2 669
Study III E - - - - 108
(150) 1.9
(0.5) 2.3 89
E-HA - - - - 96 (103)
1.8 (0.3) 2.2 148
Study IV HA 30
(48) 3
(6) 23 94 - - - -
Titania 24 (15)
1 (0) 45 721 - - - -
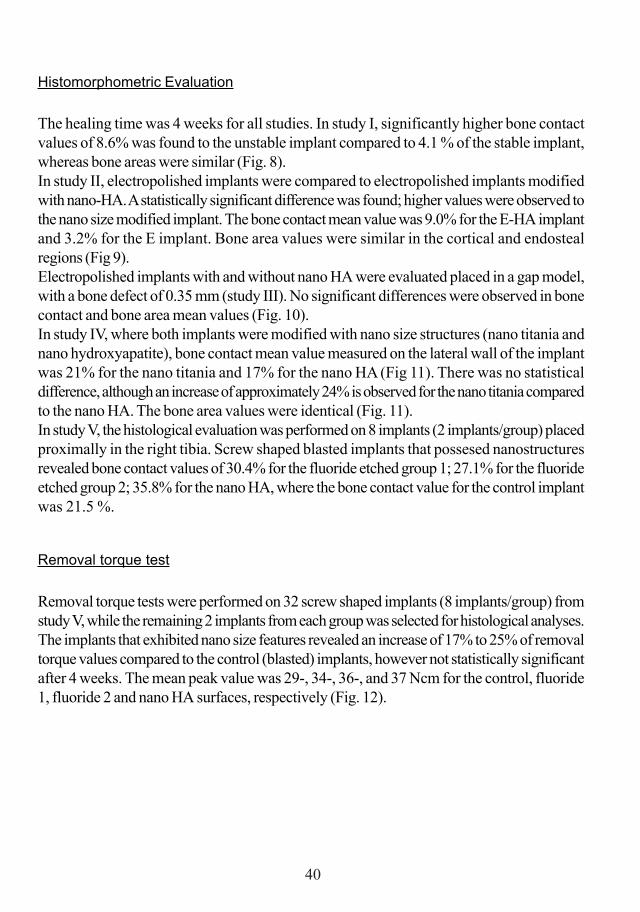
40
Histomorphometric Evaluation
The healing time was 4 weeks for all studies. In study I, significantly higher bone contactvalues of 8.6% was found to the unstable implant compared to 4.1 % of the stable implant,whereas bone areas were similar (Fig. 8).In study II, electropolished implants were compared to electropolished implants modifiedwith nano-HA. A statistically significant difference was found; higher values were observed tothe nano size modified implant. The bone contact mean value was 9.0% for the E-HA implantand 3.2% for the E implant. Bone area values were similar in the cortical and endostealregions (Fig 9).Electropolished implants with and without nano HA were evaluated placed in a gap model,with a bone defect of 0.35 mm (study III). No significant differences were observed in bonecontact and bone area mean values (Fig. 10).In study IV, where both implants were modified with nano size structures (nano titania andnano hydroxyapatite), bone contact mean value measured on the lateral wall of the implantwas 21% for the nano titania and 17% for the nano HA (Fig 11). There was no statisticaldifference, although an increase of approximately 24% is observed for the nano titania comparedto the nano HA. The bone area values were identical (Fig. 11).In study V, the histological evaluation was performed on 8 implants (2 implants/group) placedproximally in the right tibia. Screw shaped blasted implants that possesed nanostructuresrevealed bone contact values of 30.4% for the fluoride etched group 1; 27.1% for the fluorideetched group 2; 35.8% for the nano HA, where the bone contact value for the control implantwas 21.5 %.
Removal torque test
Removal torque tests were performed on 32 screw shaped implants (8 implants/group) fromstudy V, while the remaining 2 implants from each group was selected for histological analyses.The implants that exhibited nano size features revealed an increase of 17% to 25% of removaltorque values compared to the control (blasted) implants, however not statistically significantafter 4 weeks. The mean peak value was 29-, 34-, 36-, and 37 Ncm for the control, fluoride1, fluoride 2 and nano HA surfaces, respectively (Fig. 12).

41
Figure 8 A. The percentage of bone contact in study I.Primitive woven bone (PWB), woven bone (WB), corticallamellar bone (CB).
Figure 8 B. The percentage of bone area in study I. Primitivewoven bone (PWB), woven bone (WB), cortical lamellarbone (CB).
Percentage bone contact - Study I
0123456789
10
Not stable Stable
PWBWBCB
Percentage bone area - Study I
0
10
20
30
40
50
60
70
80
Not stable Stable
PWBWBCB
%
%

42
Figure 9 A. The percentage of bone contact in study II.
Figure 9 B. The percentage of bone area in study II.
Percentage bone contact - Study II
0123456789
10
Electropolished Electropolished Nano HA
Percentage bone area - Study II
01020
30405060
708090
Cortical Region Endosteal Region
Electropolished
Electropolished Nano HA
%
%

43
Figure 10 A. The percentage of bone contact in study III.
Figure 10 B. The percentage of bone area inside thegap in study III.
Percentage bone contact - Study III
0
0,5
1
1,5
2
2,5
Electropolished Electropolished Nano HA
Percentage bone area - Study III
01020
30405060
708090
Electropolished Electropolished Nano HA
%
%
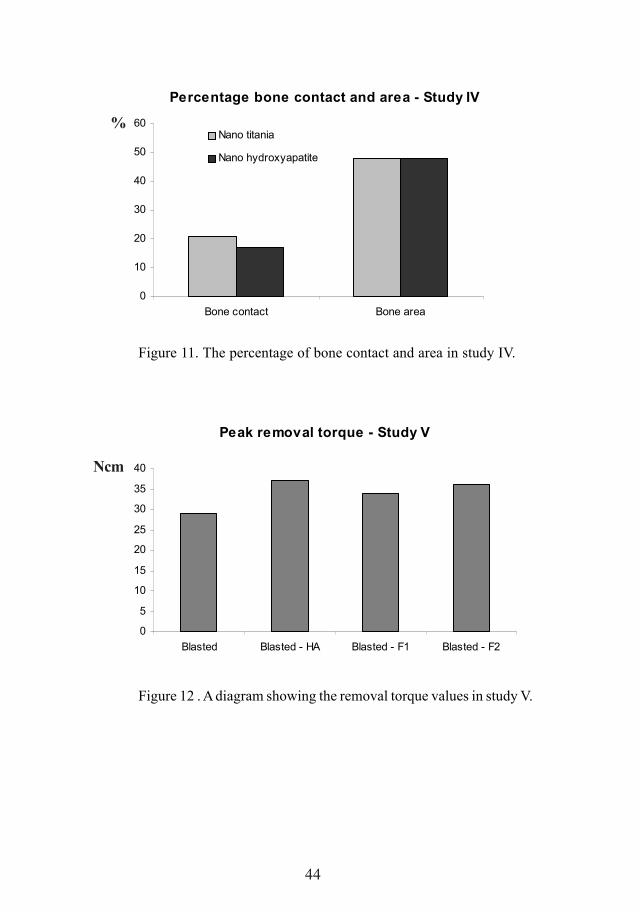
44
Figure 11. The percentage of bone contact and area in study IV.
Figure 12 . A diagram showing the removal torque values in study V.
Percentage bone contact and area - Study IV
0
10
20
30
40
50
60
Bone contact Bone area
Nano titania
Nano hydroxyapatite
Peak removal torque - Study V
0
5
10
15
20
25
30
35
40
Blasted Blasted - HA Blasted - F1 Blasted - F2
%
Ncm

45
Discussion of methods
Study Design
Implant design
Oral implants currently in use are based on the screw-shaped designs initially introduced byBrånemark et al1, which provides macro-retention immediately after implant installation. Thechoice of an experimental cylindrical design, with a very smooth surface, is related to thegeneral aim of the present thesis. Cylindrical smooth implants used do not exhibit macro-threads or surface microstructures. Hence, the variables that affect early bone formation arereduced. Furthermore, nano size features applied with controlled dimensions on this experimentalmodel ensured that: the bone formation observed to the implant surface was dependenton the created nanotopography. Moreover, cylindrical implants provide a favorable designfor surface topography evaluation at higher resolution with AFM.The experimental model used in the study I-IV is not suitable for clinical applications. In studyV, a blasted screw shaped implant was selected. This implant design corresponds to currentavailable oral implants.
Stabilization plate (Study I-IV)
To verify the fixation of the complex - cylindrical implant and stabilization plate - a test wascarried out in a universal testing machine (DL-10000, Emic, Parana , Brazil). The test wasperformed with a load cell of 50 kgF and speed of 1 mm/min. The actuator was positioned onthe top of the implant (test) and on the square part of the stabilization plate (control) toinvestigate potential displacement of the implant in relation to the plate (Fig. 13). Seven testswere performed for each group and no difference in displacement was detected between thetest and control groups.A representative graph of the implant and plate displacement with increasing load is shown inFigure 14. Thus, the stabilization plate ensured adequate fixation of the implant, despitethe lack of macro and micro retention at the surface. Additionally, the stabilization plateprovides the same fixation no matter the implant surface properties and bone response isnot affected by potential differences of initial stability.
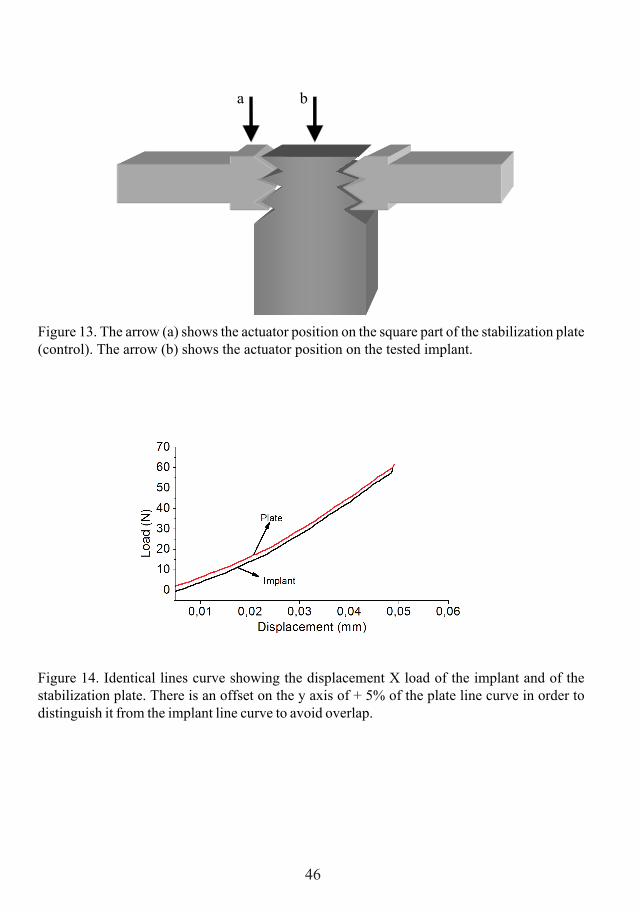
46
Figure 13. The arrow (a) shows the actuator position on the square part of the stabilization plate(control). The arrow (b) shows the actuator position on the tested implant.
Figure 14. Identical lines curve showing the displacement X load of the implant and of thestabilization plate. There is an offset on the y axis of + 5% of the plate line curve in order todistinguish it from the implant line curve to avoid overlap.
a b

47
Topographical analysis
Using two resolution levels – AFM/Interferometer
The choice to use two equipments for surface topographical characterization is explained bythe difference in resolution of the interferometer and the AFM equipments; and by the need tocharacterize structures at these two levels of resolution.The cylindrical implants investigated in the study II-IV were polished to remove themicrostrucutres and further coated with nano size features. The interferometer evaluation wasperformed to: (1) verify the absence of microstructures on the polished surfaces and (2)investigate the final nano coated surface, i.e. whether the coating procedure altered the implantsurface at the micro level. AFM evaluation of the cylindrical implants (Study II-IV) wasperformed to characterize the applied nano structures that varied from 10 nm to 250 nm indiameter. Such small structures would not be detected by the interferometer.In study V, the implant surface was numerically evaluated only with interferometer. AFMequipment has a limited vertical range of 6 μm that is unsuitable to evaluate moderately roughscrew-shaped implants. The nano size features morphology was evaluated by SEM in studyV.
Filter selection
Interferometer measurements (200x260μm) were further processed with a Gaussian highpass filter with a size of 50x50 μm to separate form, waviness and roughness. Gaussian filtersare indicated to remove form and waviness from measurements of surfaces with rich features.The ideal filter size and measurements area has been investigated by Wennerberg36 and thevalues recommended have been used in the present thesis.AFM measurements (10x10μm) exhibited steps between subsequent scan lines. A polynomialplane correction that levels each scan line was selected. The LMS fit method substracts afitted polynomial function from each individual scan line with a polynomial degree defined bythe user. Polynomial degrees may be set between 0 and 5. Degrees greater than 3 are seldomrecommended because the fit might then start to match the real surface structure more thanthe undesired plane error130. In order to investigate the ideal polynomial degree for the AFMmeasurements, the 1st, 2nd and 3rd polynomial degree was tested on study IV. The surfaceroughness parameters, the subtracted image and the processed image were evaluated and theresults are shown in Figure 15 and Table 5.

48
Figure 15 B1. Measurement after correctionwith the 1st degree of the LMS fit method.
Figure 15 B2. What was removed from theoriginal measurement after correction withthe 1st degree of the LMS fit method.
Figure 15 A. The original nano HA coated implant AFM measurement (10x10 μm). The observedform, waviness and the steps between the scan lines should be removed before surface roughnessevaluation and nano structures characterization.

49
Figure 15 D2. What was removed from theoriginal measurement after correction withthe 3rd degree of the LMS fit method.
Figure 15 D1. Measurement after correctionwith the 3rd degree of the LMS fit method.
Figure 15 C1. Measurement after correctionwith the 2nd degree of the LMS fit method.
Figure 15 C2. What was removed from theoriginal measurement after correction withthe 2nd degree of the LMS fit method.

50
Table 5 The influence of the least mean square polynomial degree (1-3) on surface roughnessof nano coated titania (T) and hydroxyapatite implants (HA) from study IV. AFM areameasurements of 10x10 μm measured on the bottom, middle and top part of three implants ofeach group. Sa (nm), Sds (μm-2) and Sdr (%).
1st 2nd 3rd Sa Sds Sdr Sa Sds Sdr Sa Sds Sdr T1_1 13 24 0.19 4.8 24 0.16 4.2 24 0.15
T1_2 7.7 25 0.12 4.5 25 0.11 4.3 25 0.11
T1_3 30 12 0.57 17 20 0.58 16 20 0.58 T2_1 9.8 21 0.09 5 22 0.08 4.4 23 0.08
T2_2 43 11 0.57 31 12 0.64 28 13 0.87
T2_3 21 16 0.23 19 18 0.24 13 18 0.21 T3_1 9.8 15 0.12 6.9 16 0.1 5.3 19 0.1
T3_2 10 14 0.18 7.9 15 0.17 7.4 16 0.19
T3_3 11 17 0.22 7.3 18 0.19 5.6 19 0.18
Mean 17.26 17.22 0.25 11.49 18.89 0.25 9.80 19.67 0.27 SD 12.00 5.04 0.19 9.05 4.28 0.21 8.02 3.87 0.27
HA1_1 48 14 4.4 36 14 4 28 14 3.6
HA1_2 28 16 1.8 20 16 1.7 17 17 1.6
HA1_3 40 16 4 29 16 3.5 25 16 3.3 HA2_1 19 19 1.4 17 20 1.5 13 21 1.4
HA2_2 47 16 4.2 34 17 3.8 23 17 3.6
HA2_3 27 17 2.9 20 17 2.8 17 17 2.7 HA3_1 105 20 6.2 45 19 3.9 32 19 3.5
HA3_2 36 17 4 29 18 3.9 27 18 4.6
HA3_3 30 25 3.5 23 25 3.3 15 25 3.3
Mean 42.22 17.78 3.58 28.11 18.00 3.16 21.89 18.22 3.07
SD 25.41 3.23 1.44 9.12 3.16 0.96 6.62 3.19 1.02

51
3D Topographical Parameters
Surfaces are naturally based on a 3D scale. 2D surface characterization represents only partof the structures present at the surface, and conclusive assumptions of the surface topographywith a 2D profiling characterization, should be avoided. Dong et al133 discussed the importanceof describing numerically a surface with the roughness parameters based on a 3D analysis. 3Danalysis exhibits advantages compared to 2D analysis: 1. surface topography is three dimensionalin nature; 2. the parameters obtained are more realistic, specially the extreme parameters; 3.new parameters can be described, such as Sci (surface fluid core index), recently reported asrelevant for osseointegration134; 4. larger volume of data is obtained, providing more reliableand representative analysis and; 5. allows proper visualization of the surface133. The Sparameters, described by Stout131, are standard parameters of 3D evaluations. In the presentthesis, all surface roughness measurements were based on 3D analyses and one amplitude-average height deviation (Sa); one hybrid-surface developed ratio (Sdr) and one spatial –density of summits (Sds) parameters were calculated to described surface roughness of eachmeasurement.
Detection of Nano structures
Each individual structure detected at the surface does not represent solely the particle dimensionsexhibited in the solution where the implant was dipped. Furthermore, the applied particle sizesmay be modulated by different factors during its synthesis and may vary depending on thecoating technique parameters used. Thus, the nano structures detected at the implantsurface represent a combination of the pre-existing topography combined with thoseachieved by the synthesis-coating technique. In Figure 16, some potential combination ofthe pre-existing structures and the applied structures is shown. Numerous reports of nanobased materials failed to show nano structures at the surface with size equivalent to the onepresent in the precursor material, which could be a powder or a solution. This is usuallycaused by particle agglomeration that may end up with micro-sized structures. Another relevantissue in the detection process is to distinguish the applied structures from the pre-existingstructures. Simply calculating the mean value and claiming that the difference corresponds tothe “new” structures is not ideal. In the present thesis, not only the difference in mean valueswas reported; a frequency histogram showed the range of each feature size segment existentbefore and after the coating. Thus, it was possible to verify the dimensions of the appliednano features at the implant surface. The different range of sizes of the structures may alsobe visualized at the surface, adding more data of the nano modified surface.

52
Figure 16.Schematic illustration of some potential combinations of the underlying topography,with pre-existing structures, together with the particles present in the solution (a). The modifiedsurface may exhibit higher or wider features (b); or may also exhibit increased feature density(c).
Bone Response Evaluation Methods
Histomorphometric Evaluation
The amount of titanium and the very smooth implant surface did not allow further grinding toa 10 μm thick section, following the preparation technique described by Donath132. Initialattempts to reach the ideal 10 μm thick section resulted in implant de-attachment and damageto the surrounding tissues. A thickness of 40 μm was found safe for the sections in study I-IV.Johansson & Morberg135 reported that section with this thickness may produce overestimatedbone contact values. No difference in bone area can be expected comparing sections in therange of 10-40 μm thickness. Bone-implant contact and bone area measurements have beenused in numerous doctoral projects at the Biomaterials Department and is a standard techniqueto evaluate bone-implant interface.The threshold Red-Blue-Green 3 steps technique for histomorphometry measurement representsa very fast and reliable method to calculate bone area and bone contact values. The thresholdRGB tool is especially valuable to measure implants with complex shape (Fig. 17).
a) b) c)Nano particles
Underlying topography

53
Removal torque test
The removal torque test has been used routinely for evaluation of screw-shaped implant withsurface topography at the micro level and have been reported to be correlated with the boneimplant contact values4,136. However, nano size modified implants have not been evaluatedbefore and the reliability (repeatability) of the method should be investigated for this purpose.The removal torque reliability test was performed in study V. The values of the two identicalfluoride-modified surfaces were very similar, which supports reliability of the removal torquemethod. The removal torque test is a reliable method for evaluation of bone response toimplants modified with nano size structures.
Figure 17. Screw shaped implants (a) used in study V. The macro and micro threads aremarked automatically (b), despite the complex design.
a) b)

54
Discussion of results
Rationale behind each study
Study I – Validate the modelMicro structures and macro threads are known to affect bone response. An experimentalmodel to evaluate solely the effect of nano size structures must be free of micro structures(very smooth surfaces) and free of macro threads (cylindrical). The smooth cylindrical implantshould have a device to ensure adequate stability, avoiding micro movements known to affectbone formation. A stabilization plate was implemented to ensure adequate fixation of thesmooth cylindrical implant during the experiments. The model was tested in Study I and provedto be suitable to evaluate implants modified with nano size structures, as observed in StudiesII-IV.
Study II – Effect of nano size HA structuresThe effect of nano HA structures added on smooth cylindrical implants on bone response wasinvestigated. The detection of nano size structures was performed on AFM measurementscombined with image processor software. Firstly, the nano HA coating method producednano size structures at the implant surface with equivalent size of the particles present in theprecursor solution (where the nano HA particles are synthesized). Secondly, the added nanoHA structures to smooth cylindrical implants enhanced bone formation. However, the enhancedbone formation could be an effect of the nano HA chemistry or the nano topography; or asynergetic effect of both chemistry and nano topography.
Study III – Effect of nano size HA structures placed in a gapThe results from Study II showed that nano HA structures enhanced bone formation in amodel without gap. The potential effect of nano HA on a gap healing design was investigatedin study III. Therefore, nano HA modified implants were compared to electropolished implantsplaced in a gap. Control uncoated and nano HA coated implants exhibited similar roughnessand porosity parameters on AFM measurements. After 4 weeks of healing, similar boneresponse was observed to both control and nano HA coated implants. This result indicatesthat bioactivity of nano HA was not supported in this gap healing model.
Study IV – Effect of “bioinert” and “bioactive” surfacesIn this last study with the experimental smooth cylindrical implants, a direct approach wasselected in order to separately investigate the effect of surface chemistry and the effect ofnano size structures added to the implant surface. Here, both control and test implants hadbeen coated with nano size structures. The control implants were coated with “bioinert” nanotitania structures whereas test implants were coated with “bioactive” nano HA structures, i.e.

55
the aim was to investigate whether nano HA structures would result in enhanced osseointegrationcompared to nano titania structures. The bone response to nano titania coated implants was24% higher compared to nano HA coated implants, although the difference was not significant.The present study did not support the enhanced bone formation to hydroxyapatite comparedto titania materials.
Study V – Nano size structures for oral implantsThe findings from the previous studies with very smooth implants showed that: the presence ofnano size structures with specific dimensions at the implant surface enhances bone response,irrespective of the surface chemistry. The enhanced bone response to nano size structurescould only occur to very smooth experimental implants. In study V, the hypothesis of enhancedbone response to moderately rough screw shaped implants modified with implemented nanosize structures was investigated. Fluoride-modified and nano HA coated implants that possessnano size structures, showed a tendency of enhanced bone response (17-25%) compared tocontrol implants, without similar nano size structures.
Surface Roughness and Chemistry
The surface roughness values from the implants prepared with the same method exhibitedsimilar values as measured on the top, middle and bottom part of the implants. This wasshown in detail in study II. Statistical analyses revealed similar surface roughness values evaluatedon the top, middle and bottom part for both electropolished and modified electropolishedsurfaces with nano HA. Different surface roughness along the implant could affect boneformation, especially in the rabbit tibia model, where the rabbit cortex is in the same region asthe top part of the implant.The apparent contradictory results of increased roughness in Study II and decreased roughnessin Study V, observed with the nano HA modification, is explained by the different underlyingtopography. In study II, the implants were electropolished to produce a very smooth surface;by contrast, the underlying topography in Study V was moderately rough. Thus, the appliednano crystals introduced structures on the very smooth implants (study II), increasing surfaceroughness; whereas in the moderately rough implants (study V), the nano crystals reduced thedepth of the valleys and broadened the peaks, decreasing slightly the surface roughness. Theetching with diluted HF acid produced a similar effect. The edges of the microstructures weresmoothened and on the microstructured walls, nanostructures produced by the acid etchingcould be detected.The decrease in surface roughness to “rougher” surfaces could already be observed in StudyIV, where the underlying topography evaluated by interferometer exhibited a Sa of 225 nm.Mechanically polished surfaces to be modified with nano -HA and -titania, were roughercompared to the electropolished implants from Study II (Sa = 94 nm) and Study III (Sa= 49

56
nm), and exhibited increased surface roughness values compared to the final surfaces in StudyIV modified with nano HA (Sa= 170 nm) and titania (Sa= 121 nm).The difference of the surface roughness values from the underlying topography (control) andthe modified implants was, in all the studies, within the nanometer range; and alone could notexplain the bone response observed in the present studies. In study IV, nano titania implantsexhibited decreased Sa values, both on interferometer and AFM measurements, for the nanotitania compared to nano HA implants. However, the bone response was 24% higher for thenano titania compared to the nano HA implants. In study V, the implementation of nano structuresthrough coating with nano HA particles and etching with diluted hydrofluoric acid showed atendency of increased bone formation compared to control (blasted) implants. The topographyevaluation performed with the interferometer demonstrated decreased surface roughness atthe nanometer range for the nano HA coated and for the fluoride-modified implants comparedto the blasted implant, which represented the underlying surface. Removal torque values werelower for the rougher blasted implant compared to the smoother blasted nano HA and smoothestblasted fluoride-modified implants. The present results do not support the modulation ofbone response by differences of surface roughness values on the nanometer range alone.The surface modifications used in the present thesis revealed differences in chemical compositionand nanotopography of the implant surface. The mechanisms that may explain the enhancedbone formation found in the present thesis to nano size structures with specific dimensions atthe implant surface are not fully understood. At this moment, is not possible to affirm that bonetissue response is modulated only by surface chemistry or topography, or more probably bya synergetic effect of both variables.The bioactive materials described by Osborn & Newesely28 showed direct bonding betweenthe implant and adjacent bone. One of the precursor materials to be classified as bioactivewas hydroxyapatite. In the present thesis, nano HA modification lead to increased boneformation in studies II and V when compared to control implants that lack of applied nanostructures. However, in study IV, when a direct approach compared the “bioactive” HA to“bioinert” titania, the bone response observed was the opposite as could be expected. Althoughnot statistically significant, increase of 24% of bone contact was found to the “bioinert” (titania)compared to “bioactive” (HA) materials. Moreover, nano HA implants, evaluated in study V,showed similar removal torque compared to fluoride-modified implants with reduced amountof fluoride at the surface. Some parameters of the nano size structures described in the presentthesis are not part of routine surface analyses of osseointegrated implants and it wasdemonstrated to be relevant for bone tissue formation. Thus, the surface chemistry effect ofHA alone may not explain the enhanced early bone formation in the present studies.The need of a specific micro- and nano- topography was showed clearly in study III. Verysmooth implants with similar nano structure dimensions failed to show differences in boneformation, despite the presence of nano HA in a gap healing model. Thus, the enhanced boneresponse to bioactive materials can be explained by specific structures added to the surface

57
during the chemical treatment. If there is a beneficial effect of the surface chemistry it willoccur in the presence of a specific topography.
Surface features
In the present thesis, the surface modifications investigated produced nano size structures atthe surface with specific dimensions. In study II, the nano HA modification increased surfacefeature diameter in 6 nm, equivalent to the particles present in the solution. In addition, nanoHA implants showed increased surface porosity and number of pores on the nano level ofresolution; that may act as binding sites for the biomolecules involved in the early healingphase, which could explain the enhanced bone formation. In study III, surface porosity wassimilar between the electropolished and electropolished + nano HA implants. Moreover, thedifferences in pore diameter and number of pores were not as remarkable as observed instudy II. Despite the different surface chemistry composition of the electropolished and modifiedelectropolished surfaces with nano HA, the bone formation in the gap healing model observedin study III was similar. In study IV, the features detected at the nano HA implant had adiscrete higher diameter compared to the nano titania. Increased feature height was alsoobserved for the nano HA, whereas the surface coverage area was almost 2 times higher forthe nano titania with a remarkable increase in the surface feature density. The bone responsewas 24% higher for the nano titania compared to the nano HA, although not statisticallysignificant. The present results revealed that applied nano structures with different dimensionsenhanced bone formation, independent of the surface chemical composition. The presentresults showed enhanced bone formation to titanium implants modified with nano sizestructures with specific dimensions.The ideal feature dimensions and distribution for enhanced bone response require moreexperiments. Moreover, the surface properties of an implant with nano size structures willdiffer from those with micro size structures, with respect to dissolution. A recent experimentreported higher ionic dissolution rate to nano HA based materials compared to conventionalHA materials137. Thus, more ions were released at the interface of nano sized materials thatmay modulate cell activity and tissue formation. The increased availability of ions at the interfaceis also applicable for the fluoride-modified implants with nano size structures or any materialthat possess nano size structures, as discussed by Hench138. More recently, sub-nanometerstructure morphology of nano HA particles has been characterized by TEM139 and may alsoinfluence early healing events at the interface.

58
The present thesis and future perspectives of it can be summarized as follows:In the absence of micro structures, the present thesis, presumably for the first time invivo, evidenced enhanced early bone response from varying the nano structures alone.Moreover, a 17-25% enhanced bone response to nano structures was demonstrated onmoderately rough surfaces too, although this difference was not significant. The presenceof nano-size structures, irrespective of varying surface chemistry (fluoride, HA or titania),resulted in evidence of supported bone formation. The next focus will be on the “ideal”nano structure dimension and distribution at the implant surface that is coupled to anenhanced bone response. It is possible to produce different nano structures by varyingsome parameters of the surface modifications used in the present thesis. By varying thenano structure dimension and distribution it may be possible to increase the knowledgeof osseointegration mechanisms and modulate the bone response. Bone healing toosseointegrated implants follows a sequence of events that is time dependent. Thisfactor adds an extra challenge to the design of an “optimal” surface for osseointegratedimplants. The surface must function properly from the early hours of the inflammatoryresponse up to several years and withstand dynamic loading; indeed implant surfacesmust meet the demands from a biomolecule viewpoint and enable proper stress transferat the bone-implant interface. Future experiments must evaluate the clinical long-termresults of the “add-on” coatings used in the present thesis and ensure the integrity ofthe bone-implant interface that will determine the success of the rehabilitation.

59
Conclusions
1. A model for evaluation of bone healing to smooth cylindrical titanium implants hasbeen validated and found suitable for further studies
2. Nano size hydroxyapatite structures enhanced early bone formation to smooth titaniumimplants
3. Nano size hydroxyapatite structures did not affect early bone formation in a gaphealing design to smooth titanium implants
4. Smooth titanium implants modified with nano size “bioinert” or “bioactive” surfacesshowed similar bone formation
5. Moderately rough screw shaped implants with nano size structures of different chemicalcompositions showed a tendency of enhanced bone formation compared to blastedcontrols without added nano structures

60
AcknowledgementsI would like to thank everyone involved in this work for their support and for making my thesispossible. I wish to express my special thanks to:
Ann Wennerberg for outstanding and reliable guidance, for her sharp eyes in all hypotheses toput the work always on the right track, and never failing support and enthusiasm throughoutthese years, and for giving me freedom to carry out this project.
Tomas Albrektsson for inspiration, constructive criticism and for sharing a rare knowledge ofthe field with wise words and great discussions. Special thanks for the warm support to myfamily.
Magnus Jacobsson and Lars Sennerby, for great collaboration and discussions.
Altair Cury and Carlos Elias for all your interest and continuous support over the years.
Carina Johansson and Peter Thomsen for inspiring discussions about research and othersinteresting subjects.
Stig Karlsson for welcoming me at the Dept Prosthodontics and for introducing me to AnnWennerberg
Gunnar E. Carlsson for having a great interest in my work, always a smile and friendly chats.
Anna Arvidsson, Anna Göransson and Victoria Franke Stenport for helping me in the earlydays with all the equipments and valuable contribution.
Gunilla Aronsson, Maria Hoffman and Petra Johansson for all their support, excellent work andfor always being helpful.
My co-authors Fredrik Currie, Ilkka Kangasniemi, Per Kjellin, Lory Melin, Martin Anderssonand Timo Peltola for stimulating collaborations.
Stefan Rosen and Karin Westerberg at Toponova and Image Metrology staff for generoustechnical support.
Barbro Lanner, Katarina Nobelius and Nina Klubal for kindly helping with administrative matters.
All colleagues at the Departments of Prosthodontics and Biomaterials for friendly supportduring these years and all good moments.
Finally, my wife Cristiane, my parents Maria and Luiz, my sister Ana and my brother Andre forlove, support and for always being there.
This work was supported by grants from CAPES, Research Agency from the Brazilian Ministryof Education and Hjalmar Svensson Research Foundation.

61
References
1. Branemark PI, Adell R, Breine U, Hansson BO, Lindstrom J, Ohlsson A. Intra-osseous anchorage of dental prostheses. I. Experimental studies. Scand J PlastReconstr Surg 1969;3(2):81-100.
2. Branemark PI, Hansson BO, Adell R, Breine U, Lindstrom J, Hallen O, Ohman A.Osseointegrated implants in the treatment of the edentulous jaw. Experience from a10-year period. Scand J Plast Reconstr Surg Suppl 1977;16:1-132.
3. Albrektsson T, Dahl E, Enbom L, Engevall S, Engquist B, Eriksson AR, Feldmann G,Freiberg N, Glantz PO, Kjellman O and others. Osseointegrated oral implants. ASwedish multicenter study of 8139 consecutively inserted Nobelpharma implants. JPeriodontol 1988;59(5):287-96.
4. Johansson C. On tissue reactions to metal implants. Göteborg: Göteborg University;1991.
5. Carlsson L. On the development of a new concept for orthopaedic implant fixation[PhD]. Göteborg: Göteborg University; 1989.
6. Sennerby L. On the bone tissue response to titanium implants. Göteborg: GöteborgUniversity; 1991.
7. Naert I, Koutsikakis G, Duyck J, Quirynen M, Jacobs R, van Steenberghe D. Biologicoutcome of single-implant restorations as tooth replacements: a long-term follow-upstudy. Clin Implant Dent Relat Res 2000;2(4):209-18.
8. van Steenberghe D, Lekholm U, Bolender C, Folmer T, Henry P, Herrmann I, HiguchiK, Laney W, Linden U, Astrand P. Applicability of osseointegrated oral implants inthe rehabilitation of partial edentulism: a prospective multicenter study on 558 fixtures.Int J Oral Maxillofac Implants 1990;5(3):272-81.
9. Junqueira L, Carneiro J. Histologia Básica. Rio de Janeiro: Guanabara Koogan; 1995.10. Buckwalter JA, Glimcher MJ, Cooper RR, Recker R. Bone biology. I: Structure,
blood supply, cells, matrix, and mineralization. Instr Course Lect 1996;45:371-86.11. Bilezikian J, Raisz L, Rodan G. Principles of bone biology. San Diego: Academic
Press; 2002.12. Aubin JE. Bone stem cells. J Cell Biochem Suppl 1998;30-31:73-82.13. Muenzenberg KJ, Gebhardt M. Brushite octacalcium phosphate, and carbonate-
containing apatite in bone. Clin Orthop Relat Res 1973(90):271-3.14. Anderson HC. Molecular biology of matrix vesicles. Clin Orthop Relat Res
1995(314):266-80.15. Traub W, Arad T, Weiner S. 3-Dimensional Ordered Distribution of Crystals in Turkey
Tendon Collagen-Fibers. Proceedings of the National Academy of Sciences of theUnited States of America 1989;86(24):9822-9826.

62
16. Robinson RA, Watson ML. Collagen-crystal relationships in bone as seen in theelectron microscope. Anat Rec 1952;114(3):383-409.
17. Mc CD. The crystal chemistry of carbonate apatities and their relationship to thecomposition of calcified tissues. J Dent Res 1952;31(1):53-63.
18. LeGeros RZ. Calcium phosphates in oral biology and medicine. Monogr Oral Sci1991;15:1-201.
19. Pellegrino ED, Biltz RM. Mineralization in the chick embryo. I. Monohydrogenphosphate and carbonate relationships during maturation of the bone crystal complex.Calcif Tissue Res 1972;10(2):128-35.
20. Rey C, Renugopalakrishnan V, Collins B, Glimcher MJ. Fourier transform infraredspectroscopic study of the carbonate ions in bone mineral during aging. Calcif TissueInt 1991;49(4):251-8.
21. LeGeros RZ. Properties of osteoconductive biomaterials: calcium phosphates. ClinOrthop Relat Res 2002(395):81-98.
22. Miller A. Collagen: the organic matrix of bone. Philos Trans R Soc Lond B Biol Sci1984;304(1121):455-77.
23. Weiner S, Price PA. Disaggregation of bone into crystals. Calcif Tissue Int1986;39(6):365-75.
24. Wachtel E, Weiner S. Small-angle x-ray scattering study of dispersed crystals frombone and tendon. J Bone Miner Res 1994;9(10):1651-5.
25. Aumailley M, Gayraud B. Structure and biological activity of the extracellular matrix.J Mol Med 1998;76(3-4):253-65.
26. Adams JC. Cell-matrix contact structures. Cell Mol Life Sci 2001;58(3):371-92.27. Albrektsson T, Branemark PI, Hansson HA, Lindstrom J. Osseointegrated titanium
implants. Requirements for ensuring a long-lasting, direct bone-to-implant anchoragein man. Acta Orthop Scand 1981;52(2):155-70.
28. Osborn JF, Newesely H. Dynamic aspects of the implant-bone-interface. In: HeimkeG, editor. Dental implant: Materials and systems; 1979; Munchen. Hanser. p 111-123. (Dental implant: Materials and systems).
29. Hazan R, Brener R, Oron U. Bone growth to metal implants is regulated by theirsurface chemical properties. Biomaterials 1993;14(8):570-4.
30. Kanagaraja S, Wennerberg A, Eriksson C, Nygren H. Cellular reactions and boneapposition to titanium surfaces with different surface roughness and oxide thicknesscleaned by oxidation. Biomaterials 2001;22(13):1809-18.
31. Kim HM, Miyaji F, Kokubo T, Nakamura T. Preparation of bioactive Ti and itsalloys via simple chemical surface treatment. J Biomed Mater Res 1996;32(3):409-17.
32. Kim HM, Miyaji F, Kokubo T, Nakamura T. Bonding strength of bonelike apatitelayer to Ti metal substrate. J Biomed Mater Res 1997;38(2):121-7.

63
33. Nishiguchi S, Fujibayashi S, Kim HM, Kokubo T, Nakamura T. Biology of alkali-and heat-treated titanium implants. J Biomed Mater Res A 2003;67(1):26-35.
34. Nishiguchi S, Kato H, Fujita H, Oka M, Kim HM, Kokubo T, Nakamura T. Titaniummetals form direct bonding to bone after alkali and heat treatments. Biomaterials2001;22(18):2525-33.
35. Nishiguchi S, Kato H, Neo M, Oka M, Kim HM, Kokubo T, Nakamura T. Alkali-and heat-treated porous titanium for orthopedic implants. J Biomed Mater Res2001;54(2):198-208.
36. Wennerberg A. On surface roughness and implant incorporation [PhD]. Göteborg:Göteborg University; 1996.
37. Engquist B, Astrand P, Dahlgren S, Engquist E, Feldmann H, Grondahl K. Marginalbone reaction to oral implants: a prospective comparative study of Astra Tech andBranemark System implants. Clin Oral Implants Res 2002;13(1):30-7.
38. van Steenberghe D, De Mars G, Quirynen M, Jacobs R, Naert I. A prospective split-mouth comparative study of two screw-shaped self-tapping pure titanium implantsystems. Clin Oral Implants Res 2000;11(3):202-9.
39. Lausmaa J. Mechanical, Thermal, Chemical and Electrochemical surface treatmentof titanium. In: Brunette DM, Tengvall P, Textor M, Thomsen P, editors. Titanium inmedicine: materials science, surface science, engineeiring, biological responses andmedical applications. Berlin: Springer; 2001.
40. Masaki C, Schneider GB, Zaharias R, Seabold D, Stanford C. Effects of implantsurface microtopography on osteoblast gene expression. Clin Oral Implants Res2005;16(6):650-6.
41. Cooper LF, Zhou Y, Takebe J, Guo J, Abron A, Holmen A, Ellingsen JE. Fluoridemodification effects on osteoblast behavior and bone formation at TiO2 grit-blastedc.p. titanium endosseous implants. Biomaterials 2006;27(6):926-36.
42. Isa ZM, Schneider GB, Zaharias R, Seabold D, Stanford CM. Effects of fluoride-modified titanium surfaces on osteoblast proliferation and gene expression. Int J OralMaxillofac Implants 2006;21(2):203-11.
43. Ellingsen JE. Pre-treatment of titanium implants with fluoride improves their retentionin bone. J Mater Sci: Mater Med 1995;6:749-753.
44. Ellingsen JE, Johansson CB, Wennerberg A, Holmen A. Improved retention and bone-tolmplant contact with fluoride-modified titanium implants. Int J Oral MaxillofacImplants 2004;19(5):659-66.
45. Jarcho M. Calcium phosphate ceramics as hard tissue prosthetics. Clin Orthop RelatRes 1981(157):259-78.
46. Jarcho M, Kay JF, Gumaer KI, Doremus RH, Drobeck HP. Tissue, cellular andsubcellular events at a bone-ceramic hydroxylapatite interface. J Bioeng 1977;1(2):79-92.
64
47. Ducheyne P, Qiu Q. Bioactive ceramics: the effect of surface reactivity on boneformation and bone cell function. Biomaterials 1999;20(23-24):2287-303.
48. Ducheyne P, Cuckler JM. Bioactive ceramic prosthetic coatings. Clin Orthop RelatRes 1992(276):102-14.
49. Brown WE, Eidelman N, Tomazic B. Octacalcium phosphate as a precursor inbiomineral formation. Adv Dent Res 1987;1(2):306-13.
50. Bagambisa FB, Joos U, Schilli W. Mechanisms and structure of the bond betweenbone and hydroxyapatite ceramics. J Biomed Mater Res 1993;27(8):1047-55.
51. Ogiso M, Tabata T, Ichijo T, Borgese D. Examination of human bone surrounded bya dense hydroxyapatite dental implant after long-term use. J Long Term Eff MedImplants 1992;2(4):235-47.
52. Ogiso M, Yamashita Y, Matsumoto T. Microstructural changes in bone of HA-coatedimplants. J Biomed Mater Res 1998;39(1):23-31.
53. Chin KOA, Nancollas GH. Dissolution of Fluorapatite - a Constant-CompositionKinetics Study. Langmuir 1991;7(10):2175-2179.
54. Nelson DG, Featherstone JD, Duncan JF, Cutress TW. Effect of carbonate and fluorideon the dissolution behaviour of synthetic apatites. Caries Res 1983;17(3):200-11.
55. Nelson DGA, Barry JC, Shields CP, Glena R, Featherstone JDB. Crystal Morphology,Composition, and Dissolution Behavior of Carbonated Apatites Prepared at ControlledPh and Temperature. Journal of Colloid and Interface Science 1989;130(2):467-479.
56. de Putter C, de Groot K, Sillevis S. Implants of dense hydroxyapatite in prostheticdentistry. In: Lee A, Albrektsson T, Branemark PI, editors. Clinical aplications ofbiomaterials. Chichester: John Wiley & Sons; 1982. p 123-31.
57. Kent JN, Quinn JH, Zide MF, Guerra LR, Boyne PJ. Alveolar ridge augmentationusing nonresorbable hydroxylapatite with or without autogenous cancellous bone. JOral Maxillofac Surg 1983;41(10):629-42.
58. Holmes RE, Hagler HK. Porous hydroxyapatite as a bone graft substitute in cranialreconstruction: a histometric study. Plast Reconstr Surg 1988;81(5):662-71.
59. de Putter C, de Groot K, Sillevis Smitt PA. Transmucosal implants of densehydroxylapatite. J Prosthet Dent 1983;49(1):87-95.
60. Jarcho M. Biomaterial aspects of calcium phosphates. Properties and applications.Dent Clin North Am 1986;30(1):25-47.
61. Cook SD, Thomas KA, Kay JF, Jarcho M. Hydroxyapatite-coated titanium fororthopedic implant applications. Clin Orthop Relat Res 1988(232):225-43.
62. Hayashi K, Uenoyama K, Matsuguchi N, Sugioka Y. Quantitative analysis of in vivotissue responses to titanium-oxide- and hydroxyapatite-coated titanium alloy. J BiomedMater Res 1991;25(4):515-23.
63. de Groot K, Geesink R, Klein CP, Serekian P. Plasma sprayed coatings ofhydroxylapatite. J Biomed Mater Res 1987;21(12):1375-81.

65
64. Soballe K. Hydroxyapatite ceramic coating for bone implant fixation. Mechanicaland histological studies in dogs. Acta Orthop Scand Suppl 1993;255:1-58.
65. Herman H. Plasma-Sprayed Coatings. Scientific American 1988;259(3):112-117.66. Ducheyne P, Van Raemdonck W, Heughebaert JC, Heughebaert M. Structural analysis
of hydroxyapatite coatings on titanium. Biomaterials 1986;7(2):97-103.67. Gottlander M, Albrektsson T. Histomorphometric studies of hydroxylapatite-coated
and uncoated CP titanium threaded implants in bone. Int J Oral Maxillofac Implants1991;6(4):399-404.
68. Gottlander M, Albrektsson T, Carlsson LV. A histomorphometric study of unthreadedhydroxyapatite-coated and titanium-coated implants in rabbit bone. Int J OralMaxillofac Implants 1992;7(4):485-90.
69. Gottlander M, Albrektsson T. Histomorphometric analyses of hydroxyapatite-coatedand uncoated titanium implants. The importance of the implant design. Clin Oral ImplantsRes 1992;3(2):71-6.
70. Gottlander M, Johansson CB, Wennerberg A, Albrektsson T, Radin S, Ducheyne P.Bone tissue reactions to an electrophoretically applied calcium phosphate coating.Biomaterials 1997;18(7):551-7.
71. Rokkum M, Reigstad A, Johansson CB, Albrektsson T. Tissue reactions adjacent towell-fixed hydroxyapatite-coated acetabular cups. Histopathology of ten specimensretrieved at reoperation after 0.3 to 5.8 years. J Bone Joint Surg Br 2003;85(3):440-7.
72. Albrektsson T. Hydroxyapatite-coated implants: a case against their use. J OralMaxillofac Surg 1998;56(11):1312-26.
73. Bloebaum RD, Beeks D, Dorr LD, Savory CG, DuPont JA, Hofmann AA.Complications with hydroxyapatite particulate separation in total hip arthroplasty. ClinOrthop Relat Res 1994(298):19-26.
74. Bloebaum RD, Zou L, Bachus KN, Shea KG, Hofmann AA, Dunn HK. Analysis ofparticles in acetabular components from patients with osteolysis. Clin Orthop RelatRes 1997(338):109-18.
75. Ishizawa H, Ogino M. Thin hydroxyapatite layers formed on porous titanium usingelectrochemical and hydrothermal reaction. Journal of Materials Science1996;31(23):6279-6284.
76. Ishizawa H, Ogino M. Hydrothermal precipitation of hydroxyapatite on anodic titaniumoxide films containing Ca and P. Journal of Materials Science 1999;34(23):5893-5898.
77. Ishizawa H, Fujino M, Ogino M. Mechanical and Histological Investigation ofHydrothermally Treated and Untreated Anodic Titanium-Oxide Films Containing Caand P. Journal of Biomedical Materials Research 1995;29(11):1459-1468.
66
78. Giavaresi G, Fini M, Cigada A, Chiesa R, Rondelli G, Rimondini L, Torricelli P, AldiniNN, Giardino R. Mechanical and histomorphometric evaluations of titanium implantswith different surface treatments inserted in sheep cortical bone. Biomaterials2003;24(9):1583-94.
79. Cleries L, Fernandez-Pradas JM, Morenza JL. Bone growth on and resorption ofcalcium phosphate coatings obtained by pulsed laser deposition (vol 49, pg 43, 2000).Journal of Biomedical Materials Research 2001;57(3):473-473.
80. Peraire C, Arias JL, Bernal D, Leon B, Arano A, Roth W. Biological stability andosteoconductivity in rabbit tibia of pulsed laser deposited hydroxylapatite coatings.Journal of Biomedical Materials Research Part A 2006;77A(2):370-379.
81. de Groot K, Wolke JGC, Jansen JA. Calcium phosphate coatings for medical implants.Proceedings of the Institution of Mechanical Engineers Part H-Journal of Engineeringin Medicine 1998;212(H2):137-147.
82. Jansen JA, Wolke JG, Swann S, Van der Waerden JP, de Groot K. Application ofmagnetron sputtering for producing ceramic coatings on implant materials. Clin OralImplants Res 1993;4(1):28-34.
83. Mohammadi S, Esposito M, Hall J, Emanuelsson L, Krozer A, Thomsen P. Long-term bone response to titanium implants coated with thin radiofrequent magnetron-sputtered hydroxyapatite in rabbits. Int J Oral Maxillofac Implants 2004;19(4):498-509.
84. Mohammadi S, Esposito M, Hall J, Emanuelsson L, Krozer A, Thomsen P. Short-term bone response to titanium implants coated with thin radiofrequent magnetron-sputtered hydroxyapatite in rabbits. Clin Implant Dent Relat Res 2003;5(4):241-53.
85. Ramires PA, Romito A, Cosentino F, Milella E. The influence of titania/hydroxyapatitecomposite coatings on in vitro osteoblasts behaviour. Biomaterials 2001;22(12):1467-74.
86. Kim HW, Koh YH, Li LH, Lee S, Kim HE. Hydroxyapatite coating on titaniumsubstrate with titania buffer layer processed by sol-gel method. Biomaterials2004;25(13):2533-8.
87. Kim HW, Kim HE, Salih V, Knowles JC. Hydroxyapatite and titania sol-gel compositecoatings on titanium for hard tissue implants; mechanical and in vitro biologicalperformance. J Biomed Mater Res B Appl Biomater 2005;72(1):1-8.
88. Ebelmen M. Recherches sur les combinaisons des acides borique et silicique avec leséthers. Annales de Chimie et de Physique 1846(16):129-166.
89. Hench LL, West JK. The Sol-Gel Process. Chemical Reviews 1990;90(1):33-72.90. Li P, de Groot K. Calcium phosphate formation within sol-gel prepared titania in vitro
and in vivo. J Biomed Mater Res 1993;27(12):1495-500.91. Li PJ, Kangasniemi I, Degroot K, Kokubo T. Bonelike Hydroxyapatite Induction by
a Gel-Derived Titania on a Titanium Substrate. Journal of the American CeramicSociety 1994;77(5):1307-1312.

67
92. Bornside DE, Macosko CW, Scriven LE. On the Modeling of Spin Coating. Journalof Imaging Technology 1987;13(4):122-130.
93. Patsi ME, Hautaniemi JA, Rahiala HM, Peltola TO, Kangasniemi IMO. Bondingstrengths of titania sol-gel derived coatings on titanium. Journal of Sol-Gel Scienceand Technology 1998;11(1):55-66.
94. Jokinen M, Rahiala H, Rosenholm JB, Peltola T, Kangasniemi I. Relation betweenaggregation and heterogeneity of obtained structure in sol-gel derived CaO-P2O5-SiO2. Journal of Sol-Gel Science and Technology 1998;12(3):159-167.
95. Peltola T, Jokinen M, Rahiala H, Patsi M, Heikkila J, Kangasniemi I, Yli-Urpo A.Effect of aging time of sol on structure and in vitro calcium phosphate formation ofsol-gel-derived titania films. Journal of Biomedical Materials Research2000;51(2):200-208.
96. Gan L, Pilliar R. Calcium phosphate sol-gel-derived thin films on porous-surfacedimplants for enhanced osteoconductivity. Part I: Synthesis and characterization.Biomaterials 2004;25(22):5303-12.
97. Gil-Albarova J, Garrido-Lahiguera R, Salinas AJ, Roman J, Bueno-Lozano AL, Gil-Albarova R, Vallet-Regi M. The in vivo performance of a sol-gel glass and a glass-ceramic in the treatment of limited bone defects. Biomaterials 2004;25(19):4639-45.
98. Bowers KT, Keller JC, Randolph BA, Wick DG, Michaels CM. Optimization ofsurface micromorphology for enhanced osteoblast responses in vitro. Int J OralMaxillofac Implants 1992;7(3):302-10.
99. Keller JC, Stanford CM, Wightman JP, Draughn RA, Zaharias R. Characterizationsof titanium implant surfaces. III. J Biomed Mater Res 1994;28(8):939-46.
100. Boyan BD, Bonewald LF, Paschalis EP, Lohmann CH, Rosser J, Cochran DL, DeanDD, Schwartz Z, Boskey AL. Osteoblast-mediated mineral deposition in culture isdependent on surface microtopography. Calcif Tissue Int 2002;71(6):519-29.
101. Cohen J. Tissue reactions to metals—the influence of surface finish. J Bone Joint SurgAm 1961;43:687-99.
102. Carlsson L, Rostlund T, Albrektsson B, Albrektsson T. Removal torques for polishedand rough titanium implants. Int J Oral Maxillofac Implants 1988;3(1):21-4.
103. Buser D, Schenk RK, Steinemann S, Fiorellini JP, Fox CH, Stich H. Influence ofsurface characteristics on bone integration of titanium implants. A histomorphometricstudy in miniature pigs. J Biomed Mater Res 1991;25(7):889-902.
104. Larsson C, Thomsen P, Aronsson BO, Rodahl M, Lausmaa J, Kasemo B, EricsonLE. Bone response to surface-modified titanium implants: studies on the early tissueresponse to machined and electropolished implants with different oxide thicknesses.Biomaterials 1996;17(6):605-16.
105. Wennerberg A, Albrektsson T, Ulrich H, Krol JJ. An Optical 3-Dimensional Techniquefor Topographical Descriptions of Surgical Implants. Journal of Biomedical Engineering1992;14(5):412-418.

68
106. Wennerberg A, Ektessabi A, Albrektsson T, Johansson C, Andersson B. A 1-yearfollow-up of implants of differing surface roughness placed in rabbit bone. Int J OralMaxillofac Implants 1997;12(4):486-94.
107. Wennerberg A, Albrektsson T, Lausmaa J. Torque and histomorphometric evaluationof c.p. titanium screws blasted with 25- and 75-microns-sized particles of Al2O3. JBiomed Mater Res 1996;30(2):251-60.
108. Wennerberg A, Albrektsson T, Johansson C, Andersson B. Experimental study ofturned and grit-blasted screw-shaped implants with special emphasis on effects ofblasting material and surface topography. Biomaterials 1996;17(1):15-22.
109. Wennerberg A, Albrektsson T, Andersson B, Krol JJ. A histomorphometric and removaltorque study of screw-shaped titanium implants with three different surfacetopographies. Clin Oral Implants Res 1995;6(1):24-30.
110. Wennerberg A, Albrektsson T. Suggested guidelines for the topographic evaluationof implant surfaces. Int J Oral Maxillofac Implants 2000;15(3):331-44.
111. Webster TJ, Siegel RW, Bizios R. Osteoblast adhesion on nanophase ceramics.Biomaterials 1999;20(13):1221-7.
112. Webster TJ, Ejiofor JU. Increased osteoblast adhesion on nanophase metals: Ti,Ti6Al4V, and CoCrMo. Biomaterials 2004;25(19):4731-9.
113. Webster TJ, Ergun C, Doremus RH, Siegel RW, Bizios R. Specific proteins mediateenhanced osteoblast adhesion on nanophase ceramics. J Biomed Mater Res2000;51(3):475-83.
114. Webster TJ, Ergun C, Doremus RH, Siegel RW, Bizios R. Enhanced functions ofosteoblasts on nanophase ceramics. Biomaterials 2000;21(17):1803-10.
115. de Oliveira PT, Nanci A. Nanotexturing of titanium-based surfaces upregulatesexpression of bone sialoprotein and osteopontin by cultured osteogenic cells.Biomaterials 2004;25(3):403-13.
116. Brunette DM, Kenner GS, Gould TR. Grooved titanium surfaces orient growth andmigration of cells from human gingival explants. J Dent Res 1983;62(10):1045-8.
117. Clark P, Connolly P, Curtis AS, Dow JA, Wilkinson CD. Topographical control ofcell behaviour. I. Simple step cues. Development 1987;99(3):439-48.
118. Wojciak-Stothard B, Curtis A, Monaghan W, MacDonald K, Wilkinson C. Guidanceand activation of murine macrophages by nanometric scale topography. Exp Cell Res1996;223(2):426-35.
119. Curtis A, Wilkinson C. Topographical control of cells. Biomaterials 1997;18(24):1573-83.
120. Flemming RG, Murphy CJ, Abrams GA, Goodman SL, Nealey PF. Effects of syntheticmicro- and nano-structured surfaces on cell behavior. Biomaterials 1999;20(6):573-88.
121. Dalby MJ, Yarwood SJ, Riehle MO, Johnstone HJ, Affrossman S, Curtis AS.Increasing fibroblast response to materials using nanotopography: morphological and
69
genetic measurements of cell response to 13-nm-high polymer demixed islands. ExpCell Res 2002;276(1):1-9.
122. Dalby MJ, Riehle MO, Johnstone H, Affrossman S, Curtis AS. In vitro reaction ofendothelial cells to polymer demixed nanotopography. Biomaterials2002;23(14):2945-54.
123. Andersson AS, Backhed F, von Euler A, Richter-Dahlfors A, Sutherland D, KasemoB. Nanoscale features influence epithelial cell morphology and cytokine production.Biomaterials 2003;24(20):3427-36.
124. Rice JM, Hunt JA, Gallagher JA, Hanarp P, Sutherland DS, Gold J. Quantitativeassessment of the response of primary derived human osteoblasts and macrophagesto a range of nanotopography surfaces in a single culture model in vitro. Biomaterials2003;24(26):4799-818.
125. Riehle MO, Dalby MJ, Johnstone H, MacIntosh A, Affrossman S. Cell behaviour ofrat calvaria bone cells on surfaces with random nanometric features. Materials Science& Engineering C-Biomimetic and Supramolecular Systems 2003;23(3):337-340.
126. Dalby MJ, McCloy D, Robertson M, Agheli H, Sutherland D, Affrossman S, OreffoRO. Osteoprogenitor response to semi-ordered and random nanotopographies.Biomaterials 2006;27(15):2980-7.
127. Zhu XL, Eibl O, Berthold C, Scheideler L, Geis-Gerstrofer J. Structuralcharacterization of nanocrystalline hydroxyapatite and adhesion of pre-osteoblast cells.Nanotechnology 2006;17(11):2711-2721.
128. Sato M, Sambito MA, Aslani A, Kalkhoran NM, Slamovich EB, Webster TJ.Increased osteoblast functions on undoped and ytrrium-doped nanocrystallinehydroxyapatite coatings on titanium. Biomaterials 2006;27(11):2358-69.
129. Albrektsson T, Albrektsson B. Microcirculation in grafted bone. A chamber techniquefor vital microscopy of rabbit bone transplants. Acta Orthop Scand 1978;49(1):1-7.
130. SPIPTM. User’s and reference guide version 3.3. Image Metrology.131. Stout K-J SP, Dong WP, Mainsah E, Luo N, Mathia T, Zahouani H. The development
of methods for characterization of roughness in three dimensions. EUR 15178 EN ofcommision of the European Communities, University of Birmingham, Birmingham 1993.
132. Donath K. Preparation of histologic sections by cutting–grinding technique for hardtissue and other materials not suitable to be sectioned by routine methods. Norderstedt:Exakt-Kulzer publ.; 1993. 1-16P p.
133. Dong W, Mainsah E, Sullivan P, Stout K-J. Instruments ans measurements techniquesof 3 dimensional surface topography. In: K-J S, editor. Three dimensional surfacetopography; measurement, interpetration and applications. London: Penton Press;1994. p 3-63.
134. Arvidsson A, Sater BA, Wennerberg A. The role of functional parameters fortopographical characterization of bone-anchored implants. Clin Implant Dent RelatRes 2006;8(2):70-6.

70
135. Johansson CB, Morberg P. Importance of ground section thickness for reliablehistomorphometrical results. Biomaterials 1995;16(2):91-5.
136. Sul YT. On the bone response to oxidised titanium implants: the role of micro-porousstructure and chemical composition of the surface oxide in enhanced osseointegration[PhD]. Göteborg: Göteborg University; 2002.
137. Murugan R, Ramakrishna S. Aqueous mediated synthesis of bioresorbablenanocrystalline hydroxyapatite. Journal of Crystal Growth 2005;274(1-2):209-213.
138. Hench LL. Bioceramics - from Concept to Clinic. Journal of the American CeramicSociety 1991;74(7):1487-1510.
139. Zhu X, Eibl O, Scheideler L, Geis-Gerstorfer J. Characterization of nanohydroxyapatite/collagen surfaces and cellular behaviors. J Biomed Mater Res A2006;79(1):114-27.