on - lamprell/media/files/l/lamprell-v3/... · 2019-09-19 · strengthen position in core markets...
TRANSCRIPT

l a m p r e l l . c o m
Mo
ray E
ast
fab
ricati
on
Half yearresults 2019
19 September 2019
Disclaimer
2
This presentation contains certain forward-looking statements relating to the business,
financial performance and results of the Company and/ or the industry in which it operates.
Forward-looking statements concern future circumstances and results and other
statements that are not historical facts, sometimes identified by the words “believes”,
“expects, “predicts”, ”intends”, “projects”, “plans” “estimates”, “aims”, “foresees”,
anticipates”, “targets” and similar expressions. The forward-looking statements, contained
in this document, including assumptions, opinions and views of the Company or cited from
third party sources are solely opinions and forecasts which are uncertain and subject to
risks. A multitude of factors can cause actual events to differ significantly from any
anticipated development. Neither the Company nor any of its officers or employees
guarantees that the assumptions underlying such forward-looking statements are free from
errors nor does any of the foregoing accept any responsibility for the future accuracy of the
opinions expressed in this document or the actual occurrence of the forecasted
developments.
No representation or warranty (express or implied) is made as to, and no reliance should
be placed on, any information, including projections, estimates, targets and opinions,
contained herein, and no liability whatsoever is accepted as to any errors, omissions or
misstatements contained herein, and, accordingly, neither the Company nor any of its
subsidiary undertakings nor any such person’s officers or employees accepts any liability
whatsoever arising directly or indirectly from the use of this document.

Highlights
Operational review
Strategy
Financial review
Outlook
Appendices
123456
Agenda
3

HighlightsChristopher McDonald
CEO
l a m p r e l l . c o m
Mo
ray E
ast
weld
ing

HighlightsFoundations for growth
5
▪ Excellent safety performance – TRIR 0.16*
▪ East Anglia One operationally completed, Moray
East progressing to schedule
▪ Strong bid pipeline across oil and gas and
renewables: progressing closer to awards
▪ Net cash reduced, but expected to improve in 2H
▪ Operational improvements ahead of major work
returning to yards$6.3bnBid Pipeline
$441.0mBacklog
$50.2mNet Cash
$106.4mRevenue
$(51.9)mNet loss
* Total recordable injury rate

OperationalreviewChristopher McDonald
CEO
l a m p r e l l . c o m
Com
pact
Dri
ller

7
Moray East:
▪ Project on time and on budget
▪ Yard set up improved for throughput and
efficiency of fabricating serial jackets
▪ Fabrication peaks in Q4 2019 with final
deliveries early Q3 2020
Rig refurbishment:
▪ 9 completed YTD
▪ 12 stacked
▪ Scopes continue to be below strong market
levels but improving
East Anglia One:
▪ All jackets installed by client
▪ Contractual close out progressing
Operational reviewMoray East ramping up to peak activity

8
IMI Maritime Yard
▪ Dredging and site preparation works
completed
▪ Construction work commenced
▪ On schedule for full commissioning in
2022
IMI sub-contract work
▪ LOI for first two new build jackup rigs
extended
▪ Detailed technical discussions with
client continue
Saudi Aramco LTA programme
▪ Bidding volumes as anticipated
▪ Multiple packages submitted
▪ Several bids in final stages of
preparation
Strategic initiatives in Saudi ArabiaExposure to transformational opportunities
9
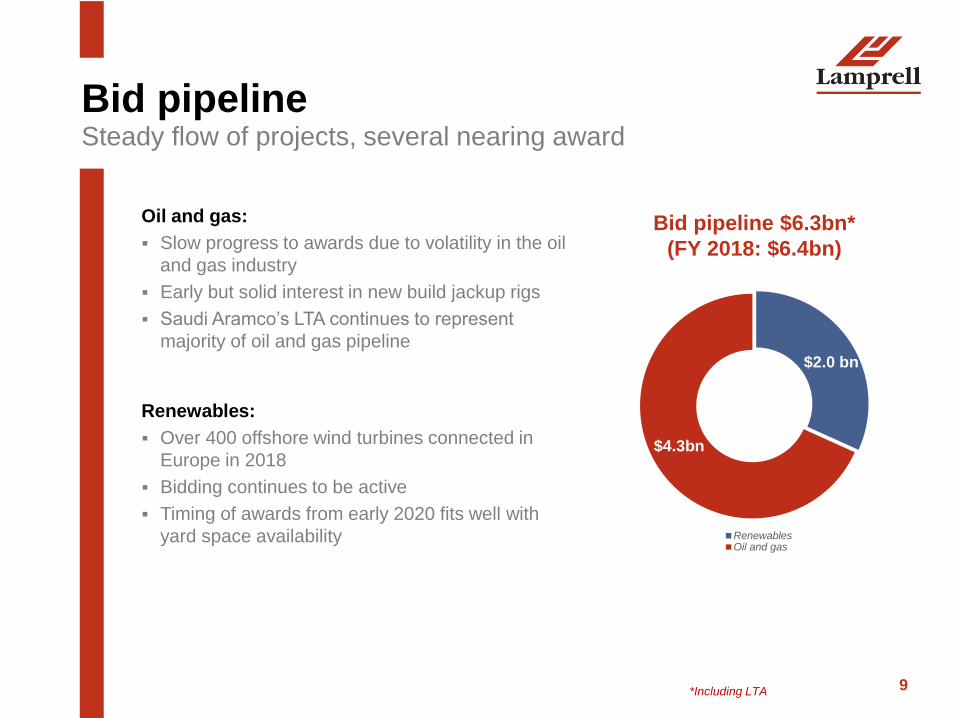
Renewables:
▪ Over 400 offshore wind turbines connected in
Europe in 2018
▪ Bidding continues to be active
▪ Timing of awards from early 2020 fits well with
yard space availability
Oil and gas:
▪ Slow progress to awards due to volatility in the oil
and gas industry
▪ Early but solid interest in new build jackup rigs
▪ Saudi Aramco’s LTA continues to represent
majority of oil and gas pipeline
Bid pipeline $6.3bn*
(FY 2018: $6.4bn)
*Including LTA
$2.0 bn
$4.3bn
RenewablesOil and gas
Bid pipelineSteady flow of projects, several nearing award

Strategy updateChristopher McDonald
CEO
l a m p r e l l . c o m
Sta
cked
rig
s -
Ham
riyah

Strengthen position in core markets
▪ New build jackup market severely challenged
but new opportunities begin to arise
Implement EPC(i) strategy
▪ Saudi Aramco LTA programme to open up
projects higher up the value chain
Expand into new markets and geographies
▪ Strong foothold in European offshore wind
market
▪ Multiple projects due for award from early 2020
▪ Focus on strategic presence in Saudi Arabia
Delivering on our strategyGaining a stronger foothold in new markets
11

FinancialreviewTony Wright
CFO
l a m p r e l l . c o m
Mo
ray E
ast pro
ject
constr
uctio
n in
Ham
riyah
Fa
cili
ty

▪ Revenue in line with forecast, to ramp up in 2H 2019 as per project scheduling
▪ Loss driven by cost pressures at low revenue levels
▪ Net cash reducing in line with working capital requirements and will improve in 2H
2019
▪ Total overheads $48.8 million, operational overheads $19.0 million, G&A $29.3 million
▪ Debt facility extended until December 2019 as new facility negotiations progress
Income statement
($m, unless stated otherwise)HY 2019 HY 2018
Revenue 106.4 155.1
EBITDA (29.6) (6.2)
EBITDA margin (27.8)% (4.0)%
Loss from continuing operations after
income tax(51.9) (21.9)
Reported diluted loss per share (US
cents)(15.20) (6.42)
Balance sheet
($m)HY 2019 FY2018
Net cash as at 30 June 50.2 80.0
Tangible net assets 314.7 363.0
Revenue by
segmentHY2019$m HY2018$m
Rigs 13.2 52.0
EPC(I) 61.9 74.7
Contracting
services31.3
28.4
13
Key FinancialsBalance sheet supports business through downturn
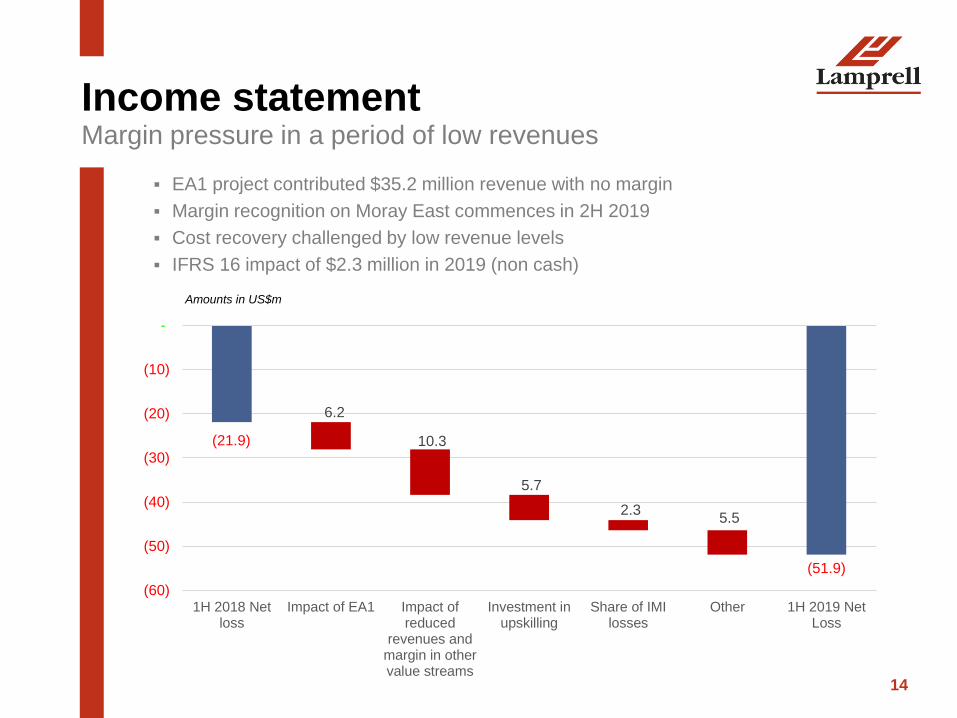
▪ EA1 project contributed $35.2 million revenue with no margin
▪ Margin recognition on Moray East commences in 2H 2019
▪ Cost recovery challenged by low revenue levels
▪ IFRS 16 impact of $2.3 million in 2019 (non cash)
14
Income statementMargin pressure in a period of low revenues
Amounts in US$m
(21.9)
(51.9)
6.2
10.3
5.7
2.3 5.5
(60)
(50)
(40)
(30)
(20)
(10)
-
1H 2018 Netloss
Impact of EA1 Impact ofreduced
revenues andmargin in othervalue streams
Investment inupskilling
Share of IMIlosses
Other 1H 2019 NetLoss

▪ Net cash reduction driven by Moray East working capital requirements, minor
yard investment and operational losses
15
Net cash$50.2m in line with forecast
Amounts in US$m
80.0 7.7 22.4
9.6
5.5
50.2
-
10.0
20.0
30.0
40.0
50.0
60.0
70.0
80.0
90.0
100.0
Net Cash as at 31stDecember 2018
Movement inworking capital
Operating cash flows Asset additions Other Net Cash as at 30thJune 2019

▪ Sufficient headroom for medium term working
capital requirements
▪ Focus on monetising inventory on the
balance sheet
▪ $37m restricted cash
▪ Negotiations for new debt facility at an
advanced stage
Debt packageHY19
$m
FY18
$m
Term loan - 20
Working capital facility 40 50
Revolver - -
Total funded facilities 40 70
Committed bonding - -
16
Balance sheetSecuring sufficient headroom for growth
Balance sheetHY19
$m
FY18
$m
Strategic investments 176.4 175.4
Hamriyah yard
improvements 38.9 34.8
New pipe shop 24.8 23.0
Rig kit inventory 69.1 69.1
IMI capital 43.6 48.5
Other Assets 305.6 281.2
Gross Cash 90.5 99.8
Total Assets 572.5 556.4
Tangible Net Assets 314.7 363.0

▪ Financial performance in 1H 2019 in line
with expectations
▪ Focus on cost remains
▪ Incremental investment to sustain
operational capability
▪ Net cash will improve moderately in 2H 2019
17
Financial outlookProfitability remains challenged in 2019
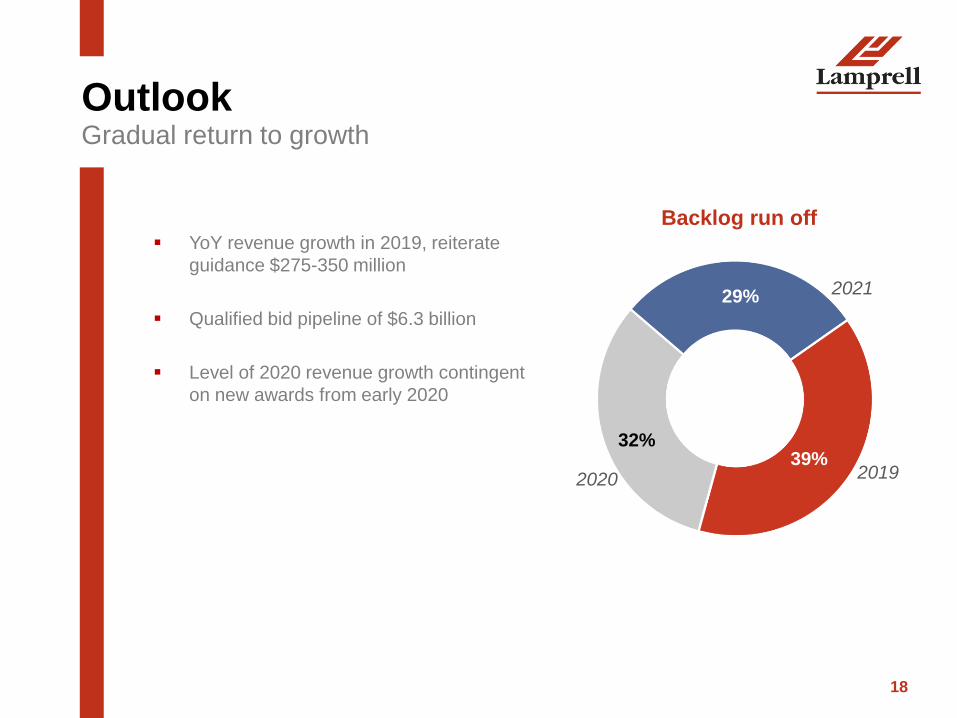
▪ YoY revenue growth in 2019, reiterate
guidance $275-350 million
▪ Qualified bid pipeline of $6.3 billion
▪ Level of 2020 revenue growth contingent
on new awards from early 2020
18
OutlookGradual return to growth
39%32%
29%
2020 2019
Backlog run off
2021
Appendix
l a m p r e l l . c o m
Mo
ray E
ast pro
ject
constr
uctio
n in
Sharja
h F
acili
ty

20
Financial summary
Amounts in $mHY 2019, $m
Underlying/ Reported
HY 2018 $m
Underlying/ Reported
Revenue 106.4 155.1
Cost of sales (119.4) (147.9)
Gross (loss) / profit (13.0) 7.2
Gross margin % (12.2%) 4.6%
G&A (29.3) (22.7)
Operating loss (41.7) (15.7)
Finance costs - net* (4.1) (1.8)
Share of loss in investments accounted using
the equity method (6.1) (3.3)
Loss before income tax (51.9) (20.9)
Income tax expense (0.01) (1.1)
Loss for the period (51.9) (21.9)
Total loss attributable to equity holders (51.9) (21.9)
* Represents the net balance of finance costs and finance income
21
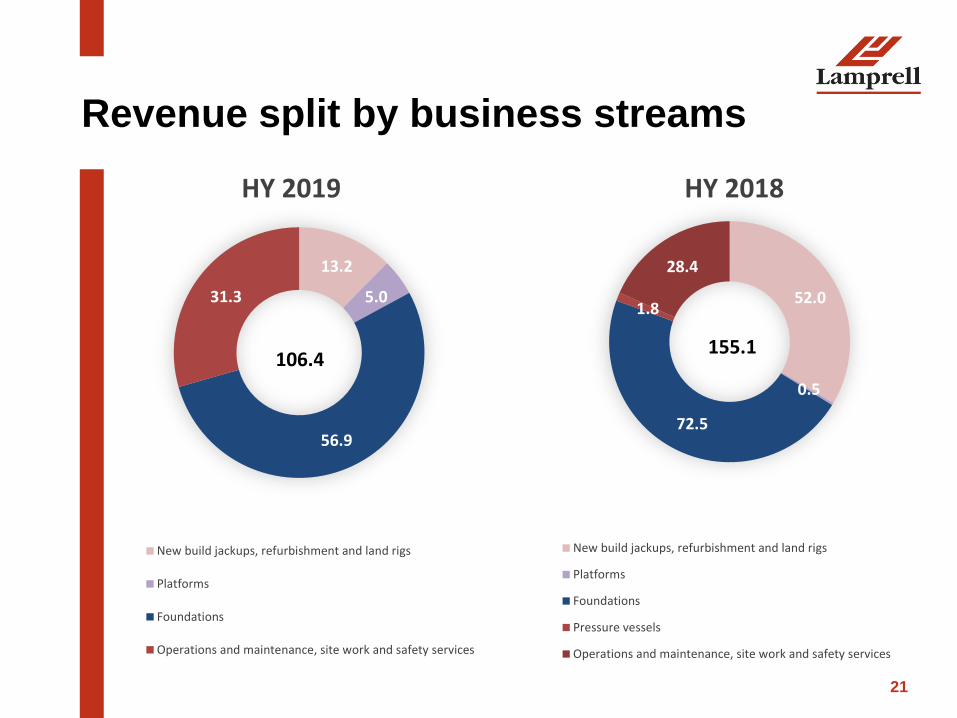
Revenue split by business streams
13.2
5.0
56.9
31.3
HY 2019
New build jackups, refurbishment and land rigs
Platforms
Foundations
Operations and maintenance, site work and safety services
106.4
52.0
0.5
72.5
1.8
28.4
HY 2018
New build jackups, refurbishment and land rigs
Platforms
Foundations
Pressure vessels
Operations and maintenance, site work and safety services
155.1
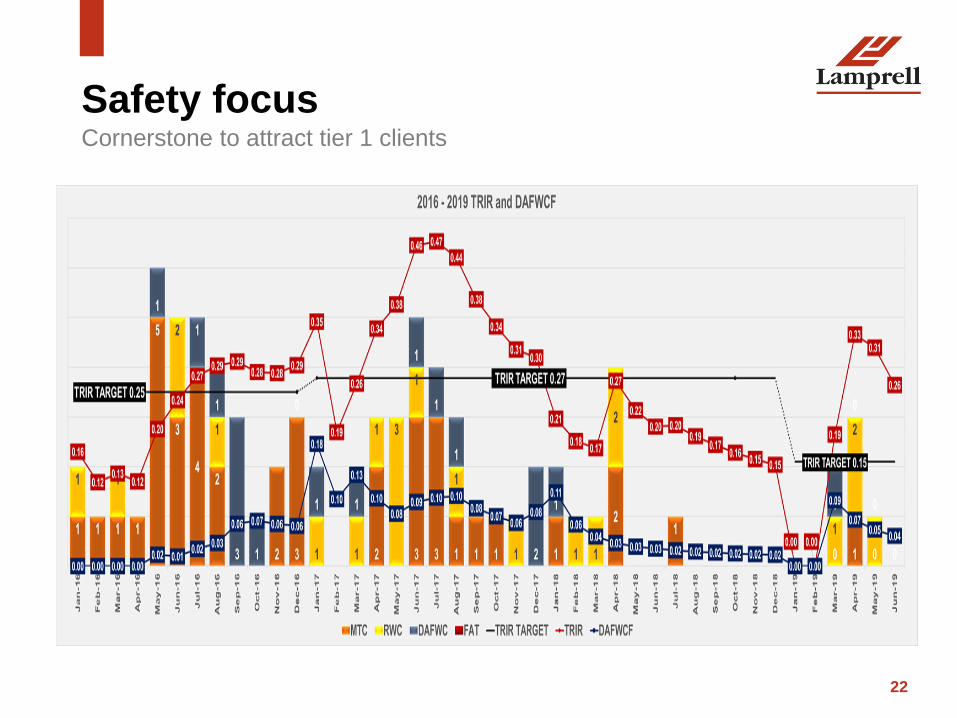
22
Safety focusCornerstone to attract tier 1 clients