on interactive data visualization of physiological low
TRANSCRIPT
HAL Id: hal-01506791https://hal.inria.fr/hal-01506791
Submitted on 12 Apr 2017
HAL is a multi-disciplinary open accessarchive for the deposit and dissemination of sci-entific research documents, whether they are pub-lished or not. The documents may come fromteaching and research institutions in France orabroad, or from public or private research centers.
L’archive ouverte pluridisciplinaire HAL, estdestinée au dépôt et à la diffusion de documentsscientifiques de niveau recherche, publiés ou non,émanant des établissements d’enseignement et derecherche français ou étrangers, des laboratoirespublics ou privés.
Distributed under a Creative Commons Attribution| 4.0 International License
On Interactive Data Visualization of PhysiologicalLow-Cost-Sensor Data with Focus on Mental Stress
Andreas Holzinger, Manuel Bruschi, Wolfgang Eder
To cite this version:Andreas Holzinger, Manuel Bruschi, Wolfgang Eder. On Interactive Data Visualization of Physiologi-cal Low-Cost-Sensor Data with Focus on Mental Stress. 1st Cross-Domain Conference and Workshopon Availability, Reliability, and Security in Information Systems (CD-ARES), Sep 2013, Regensburg,Germany. pp.469-480. �hal-01506791�

On Interactive Data Visualization ofPhysiological Low-Cost-Sensor Data with Focus
on Mental Stress
Andreas Holzinger1, Manuel Bruschi1, and Wolfgang Eder2
1 Medical University Graz, A-8036 Graz, AustriaInstitute for Medical Informatics, Statistics & Documentation,
Research Unit Human-Computer Interaction{a.holzinger,m.bruschi}@hci4all.at
2 Wolfgang Eder Unternehmensentwicklung, A-8010 Graz, [email protected]
Abstract. Emotions are important mental and physiological states in-fluencing perception and cognition and have been a topic of interest inHuman-Computer Interaction (HCI) for some time. Popular examplesinclude stress detection or affective computing. The use of emotional ef-fects for various applications in decision support systems is of increasinginterest. Emotional and affective states represent very personal data andcould be used for burn-out prevention. In this paper we report on firstresults and experiences of our EMOMES project, where the goal was todesign and develop an end-user centered mobile software for interactivevisualization of physiological data. Our solution was a star-plot visual-ization, which has been tested with data from N=50 managers (aged25-55) taken during a burn-out prevention seminar. The results demon-strate that the leading psychologist could obtain insight into the dataappropriately, thereby providing support in the prevention of stress andburnout syndromes.
Keywords: Data visualization, Knowledge Discovery, EDA, BVP, HRV,Stress, low-cost sensor
1 Introduction
The value of emotion to the quality and range of everyday human experience isunderestimated. It has a huge influence on the domains of cognition, in particularattention, memory, and reasoning [1]. An increasing problem in our western in-dustrialized world is the Burnout Syndrome (BOS), which is a psychological stateresulting from prolonged exposure to job stressors [2, 3]. In the past, many meth-ods have been developed for measuring emotions, for a rapid overview refer e.g. to[4–7] and for a very short overview see [8], here a very brief summary: Electro-dermal activity (EDA), aka Galvanic skin response (GSR), electro-dermal re-sponse (EDR), or skin conductance response (SCR) is basically the measuring
2 Holzinger et al.
of the electrical resistance of the skin and can be used as a sensitive index of theactivity of the sympathetic nervous system. Another popular method to assessthe psychophysiological activity is Heart-Rate Variability (HRV) (see details inSection 2), which can be derived from Electrocardiographic (ECG) or Blood Vol-ume Pulse Data (BVP). Viewing these Biosignals on mobile devices is a currentand increasing trend [9].
Research on stress recognition and classification with physiological signalshas reached a good point (for an overview look at [10]. Nonetheless, becausepeople are sensitive to this topic due the popularity about burnout, we must becareful with our affirmations. Today, algorithms are able to reach a high accu-racy for modeling stress but we still can not fully trust them, there is alwaysthe danger of modeling artifacts. However, stress remains an important aspectof human health that we must learn to deal with. Until recognition and clas-sification patterns become fully reliable, we will continue to retrieve any dataavailable and provide information to the individual expert end users, enablingthem to gain knowledge by interactive visualizations - intelligence remains theforte of the human brain [11]. Moreover, while people are often unable to clearlyidentify their own emotions; it can be iteratively learned.
We recognized that the participants involvement/acceptance of the evalua-tion process necessitated an clear and easy to understand visualization of thephysiological data processing results, in order for them to learn something abouttheir emotions or discuss them with an expert.
Therefore our central goal was to design and develop an interactive infor-mation visualization for our signal processing model, which 1) displays most ofthe important feature evaluations regarding stress, 2) displays the data in a waythat it is easy to compare features between relaxing and activating situations;3) displays the data in a way that can be helpful for a non-expert end user and4) at least may be provided with average computer resources within a tolerabletime.
In short, the visualization must provide a variety of information about in-dividual physiological activities with the focus on stress, so that both the non-expert and the expert can analyze and discuss the data and, most of all, toobtain insight and new knowledge from it. All the data collection, evaluationand visualization should be done by one user interface. To ensure that the solu-tion will be affordable for many people, we have used a low-cost-sensor, whichis described in Section 3.
2 Background - Psychophysiological Assessment
Physiological events are involuntary activities for which our Autonomic Ner-vous System (ANS) is responsible. Two main nervous systems are relevant forstress, the Sympathetic and Parasympathetic Nervous Systems (SNS and PNSrespectively). Stressful situations cause dynamic changes in the ANS wherebythe activity of the SNS increases and of the PNS decreases. In short, the SNSdominates during restless activities and the PNS during resting ones. These

On Interactive Data Visualization of Physiological signals 3
two systems are important for our research, because they regulate the differentphysiological signals, such as heart rate variability (HRV), galvanic skin response(GSR), brain activity (EEG), blood pressure (BP) etc. Note that these systemsare influenced by many different factors; two of them are eustress and distress.Eustress characterizes positive states and distress negative states, therefore, notall monitored stress should be perceived as bad stress. [12]
As Sharma and Gedeon showed in [10]-(Table 5) HRV and GSR are two goodparameters for detecting stress. In our work we used GSR and BVP records froma low-cost sensor. The signal of the BVP can be used to compute the HRV andsome other features explained in Section 1.
2.1 Electrodermal activity (EDA)
Electrodermal phenomena and the cardiac response are the most frequently as-sessed indices for the highly complex autonomic nervous system (ANS) activationin psychophysiology [13, 14]. The ease of obtaining a distinct electrodermal re-sponse (EDR) with inexpensive methods, the non-intrusiveness, and lenient fieldconditions are the major reasons for its popularity. Electrodermal recordings canuse either external current (AC or DC) or the body’s own electric current, thefirst are called exosomatic and second endosomatic. When an external current isapplied to biological tissues such as skin, they act similar to electrical networksbuilt of resistors and capacitors [13].
The term electrodermal activity (EDA) stands for all electrical phenomena ofthe skin, and was first introduced by Johnson and Lubin [15]. But there are alsoother frequently used terms, such as like Galvanic Skin Response (GSR). Thiselectrical phenomena also includes all active and passive electrical propertieswhich correlate to the skin and its extremities. The EDA has a central impor-tance in biosignal acquisition and this concerns its psychological significance.Since the first research activities this response system has been closely linkedwith the psychological concepts of emotion, arousal and attention [14]. Basicallyit measures the hydration in the epidermis and dermis of the skin, which in-creases or decreases with the activation or inhibition of the sweat glands thatare controlled by the sympathetic chain of the ANS.
Typically, this is recorded using two sensors placed at the surface of the handor feet, since these are the areas of the body with higher seat gland density. Inmost cases the ring and middle finger are chosen and the most common unitused is µS.
The signal is a good indicator for stress, so that it helps to differentiatebetween conflict and non-conflict situations, but it is also a good indicator fordynamic activity. Usually a rapid rise of skin conductivity reflects a simple stressstimulus.
2.2 Cardiac activity
The main purpose of our cardiac activity is to maintain our organs activity byproviding them with blood, , which is pumped around the body by the heart.
4 Holzinger et al.
When we are under stress, the heart rate is increased by the SNS and after thestress has passed the PNS decreases it. . It is therefore obvious that we canevaluate stress by measuring the rate of cardiac activity. [16] Regarding stress,as in [17], acute stress causes the heart to contract with high force and increasedfrequency. It is also known that with more chronic stress, the mass of the heartis increased. However, the baseline cardiac activity depends on the fitness of anindividual and his activity.
There are several methods of measuring the cardiac activity, one used inour work is blood volume pulse (BVP). Photoplethysmography (PPG) is a non-invasive monitoring technique that can be used to track changes in the cardiacsystem. A reflective finger PPG sensor converts the fluctuation in the bloodvolume within a region of the index finger into a continuous waveform knownas the Blood Volume Pulse (BVP). Traditionally, the BVP period was usedto determine the heart rate. Current research however, shows that the BVP iscapable of reflecting more than just the heart rate. [18] With the BVP signal,we are able to compute the RR-Intervals (the time between two following heartbeats) [19] and therefore the Heart Rate Variability (HRV). More information isprovided in Section 4.
3 Experimental setup
Fifty healthy managers between the ages of 25 - 55 were recruited during aseminar and participated in our tests. Due to the pressure of time caused bytesting this many participants during a seminar we had to design an experimentalsetup with a maximum time window of ten minutes. Therefore, the setup andintroduction had to be fast and easy but without putting the participants understress. Since we measured EDA and BVP, other requirements to our design arose.In order to have truthful signals, we had to ensure that there were no distractingor exciting elements in the room and also the temperature had to be kept at apleasant level. In the past we experienced, some participants becoming nervousonly because of a little blinking led on the notebook or the integrated webcamand sometimes the room temperature distorted our measurements.
As showed in [20] electrodermal and cardiac activity are both influenced bythe physical activity of the participant. Both are strongly affected by anxiety andexercise [21] and in order to differentiate mental stress from other elicitations theactivity also has to be considered. There are several solutions for this problem:firstly to add an accelerometer to the design, secondly to differentiate stressthrough feature extraction and preferably by reducing the physical activity asmuch as possible.
Another challenge we had set ourselves was to use low-cost sensors. Sincethe main purpose of our measurement is not to make a clinical analysis of theparticipants, but to visualize important information about their inner processesfor discussion and learning, it is possible to keep the costs low.
Keeping all this in mind, we designed a hardware/software methodology thatsatisfies all these requirements.
On Interactive Data Visualization of Physiological signals 5
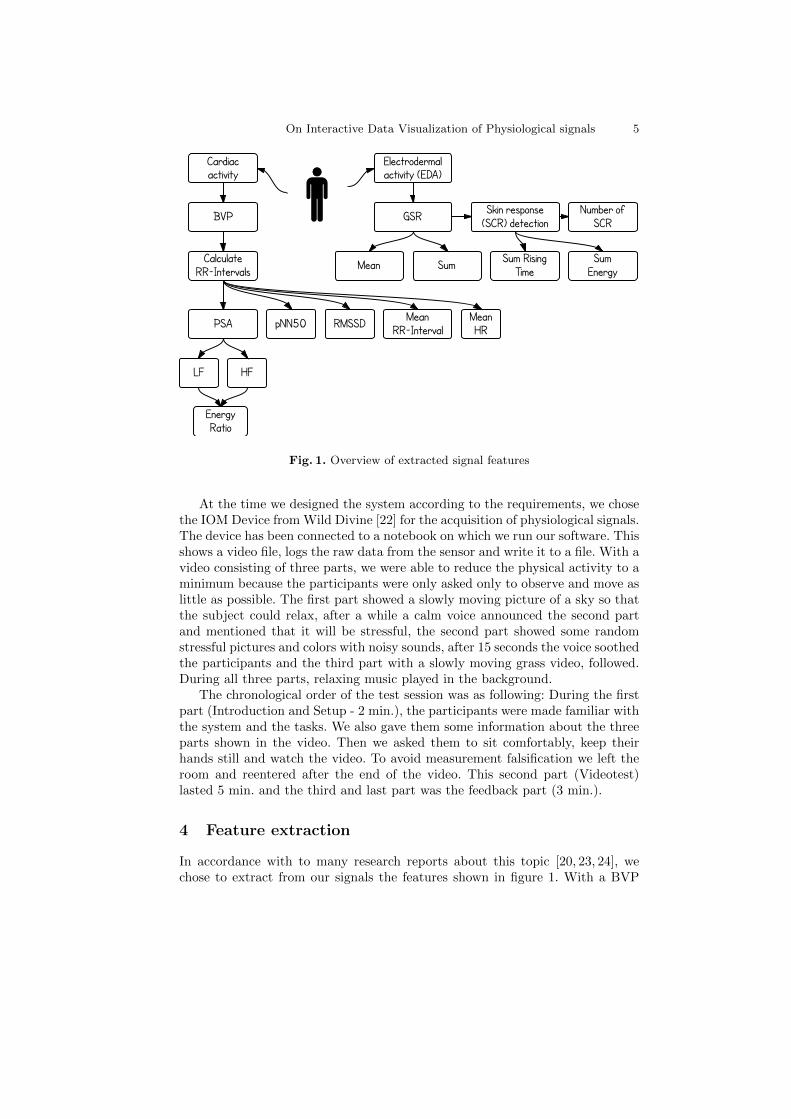
Fig. 1. Overview of extracted signal features
At the time we designed the system according to the requirements, we chosethe IOM Device from Wild Divine [22] for the acquisition of physiological signals.The device has been connected to a notebook on which we run our software. Thisshows a video file, logs the raw data from the sensor and write it to a file. With avideo consisting of three parts, we were able to reduce the physical activity to aminimum because the participants were only asked only to observe and move aslittle as possible. The first part showed a slowly moving picture of a sky so thatthe subject could relax, after a while a calm voice announced the second partand mentioned that it will be stressful, the second part showed some randomstressful pictures and colors with noisy sounds, after 15 seconds the voice soothedthe participants and the third part with a slowly moving grass video, followed.During all three parts, relaxing music played in the background.
The chronological order of the test session was as following: During the firstpart (Introduction and Setup - 2 min.), the participants were made familiar withthe system and the tasks. We also gave them some information about the threeparts shown in the video. Then we asked them to sit comfortably, keep theirhands still and watch the video. To avoid measurement falsification we left theroom and reentered after the end of the video. This second part (Videotest)lasted 5 min. and the third and last part was the feedback part (3 min.).
4 Feature extraction
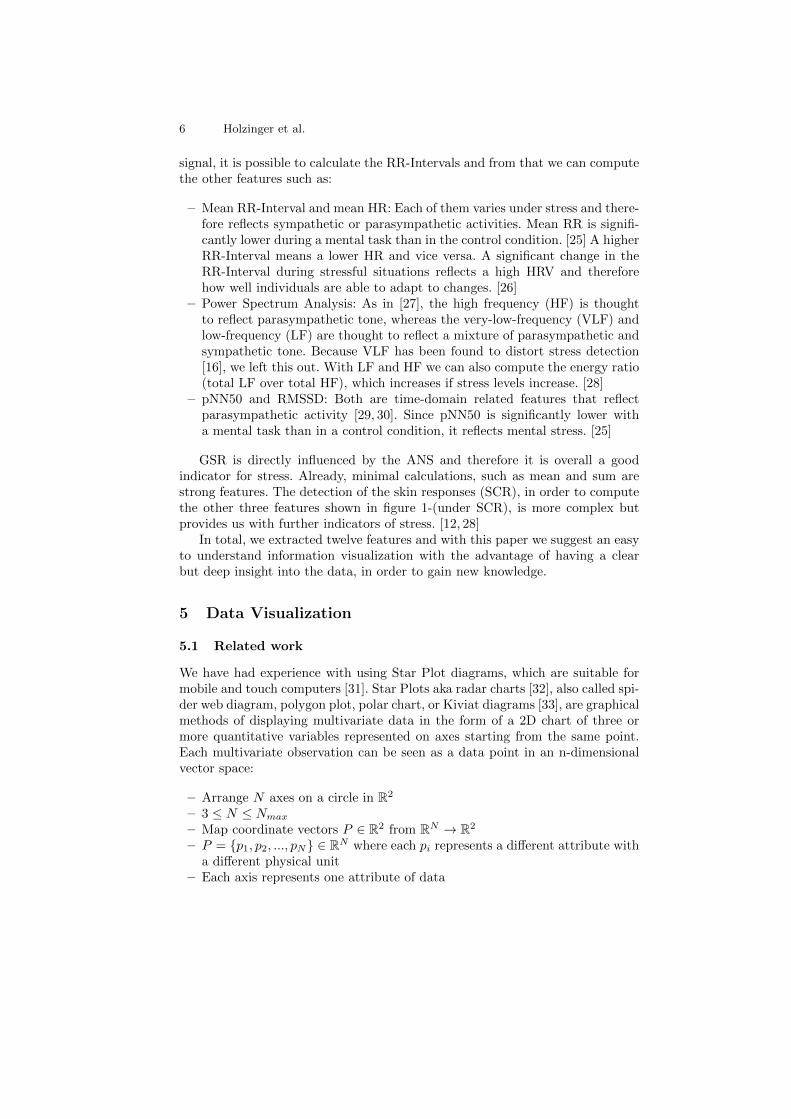
In accordance with to many research reports about this topic [20, 23, 24], wechose to extract from our signals the features shown in figure 1. With a BVP
6 Holzinger et al.
signal, it is possible to calculate the RR-Intervals and from that we can computethe other features such as:
– Mean RR-Interval and mean HR: Each of them varies under stress and there-fore reflects sympathetic or parasympathetic activities. Mean RR is signifi-cantly lower during a mental task than in the control condition. [25] A higherRR-Interval means a lower HR and vice versa. A significant change in theRR-Interval during stressful situations reflects a high HRV and thereforehow well individuals are able to adapt to changes. [26]
– Power Spectrum Analysis: As in [27], the high frequency (HF) is thoughtto reflect parasympathetic tone, whereas the very-low-frequency (VLF) andlow-frequency (LF) are thought to reflect a mixture of parasympathetic andsympathetic tone. Because VLF has been found to distort stress detection[16], we left this out. With LF and HF we can also compute the energy ratio(total LF over total HF), which increases if stress levels increase. [28]
– pNN50 and RMSSD: Both are time-domain related features that reflectparasympathetic activity [29, 30]. Since pNN50 is significantly lower witha mental task than in a control condition, it reflects mental stress. [25]
GSR is directly influenced by the ANS and therefore it is overall a goodindicator for stress. Already, minimal calculations, such as mean and sum arestrong features. The detection of the skin responses (SCR), in order to computethe other three features shown in figure 1-(under SCR), is more complex butprovides us with further indicators of stress. [12, 28]
In total, we extracted twelve features and with this paper we suggest an easyto understand information visualization with the advantage of having a clearbut deep insight into the data, in order to gain new knowledge.
5 Data Visualization
5.1 Related work
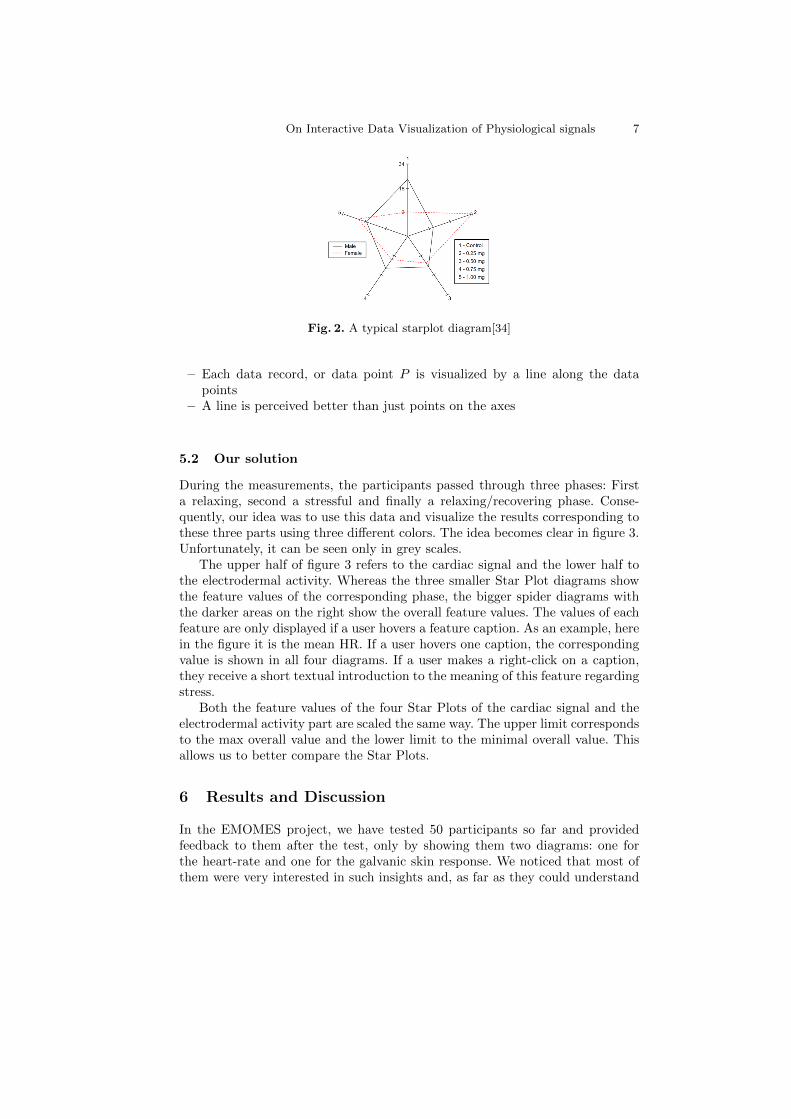
We have had experience with using Star Plot diagrams, which are suitable formobile and touch computers [31]. Star Plots aka radar charts [32], also called spi-der web diagram, polygon plot, polar chart, or Kiviat diagrams [33], are graphicalmethods of displaying multivariate data in the form of a 2D chart of three ormore quantitative variables represented on axes starting from the same point.Each multivariate observation can be seen as a data point in an n-dimensionalvector space:
– Arrange N axes on a circle in R2
– 3 ≤ N ≤ Nmax
– Map coordinate vectors P ∈ R2 from RN → R2
– P = {p1, p2, ..., pN} ∈ RN where each pi represents a different attribute witha different physical unit
– Each axis represents one attribute of data
On Interactive Data Visualization of Physiological signals 7
Fig. 2. A typical starplot diagram[34]
– Each data record, or data point P is visualized by a line along the datapoints
– A line is perceived better than just points on the axes
5.2 Our solution
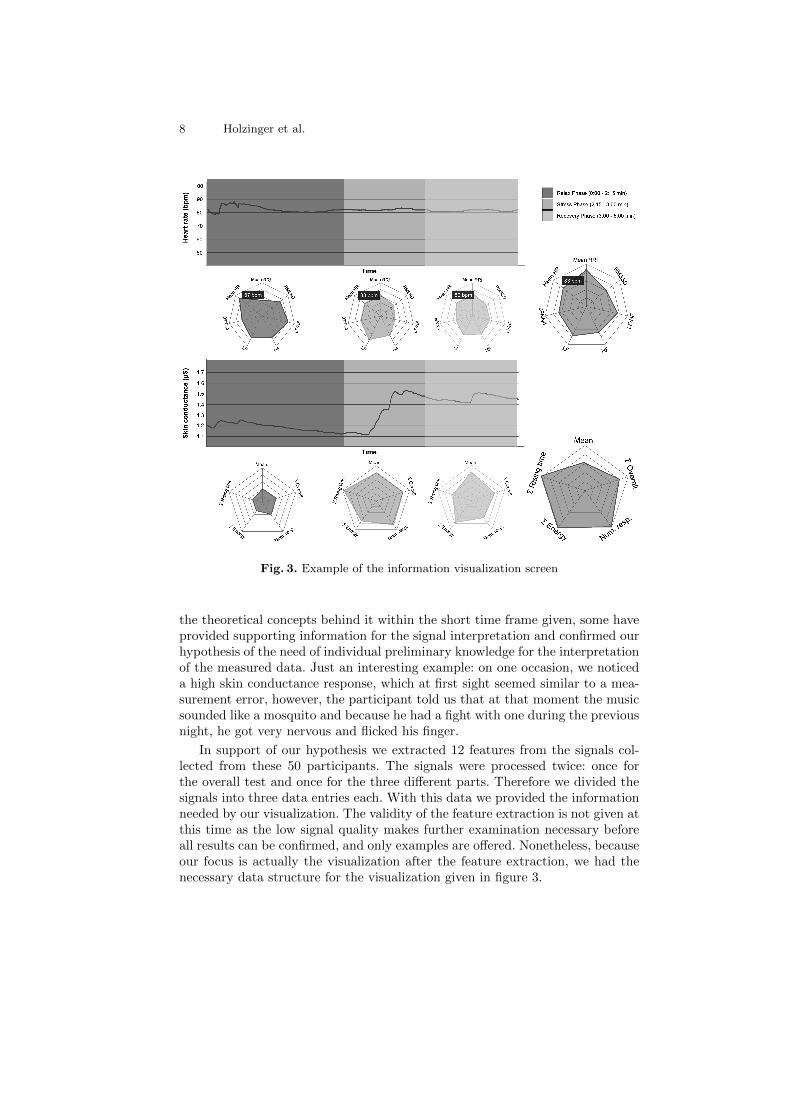
During the measurements, the participants passed through three phases: Firsta relaxing, second a stressful and finally a relaxing/recovering phase. Conse-quently, our idea was to use this data and visualize the results corresponding tothese three parts using three different colors. The idea becomes clear in figure 3.Unfortunately, it can be seen only in grey scales.
The upper half of figure 3 refers to the cardiac signal and the lower half tothe electrodermal activity. Whereas the three smaller Star Plot diagrams showthe feature values of the corresponding phase, the bigger spider diagrams withthe darker areas on the right show the overall feature values. The values of eachfeature are only displayed if a user hovers a feature caption. As an example, herein the figure it is the mean HR. If a user hovers one caption, the correspondingvalue is shown in all four diagrams. If a user makes a right-click on a caption,they receive a short textual introduction to the meaning of this feature regardingstress.
Both the feature values of the four Star Plots of the cardiac signal and theelectrodermal activity part are scaled the same way. The upper limit correspondsto the max overall value and the lower limit to the minimal overall value. Thisallows us to better compare the Star Plots.
6 Results and Discussion
In the EMOMES project, we have tested 50 participants so far and providedfeedback to them after the test, only by showing them two diagrams: one forthe heart-rate and one for the galvanic skin response. We noticed that most ofthem were very interested in such insights and, as far as they could understand
8 Holzinger et al.
Fig. 3. Example of the information visualization screen
the theoretical concepts behind it within the short time frame given, some haveprovided supporting information for the signal interpretation and confirmed ourhypothesis of the need of individual preliminary knowledge for the interpretationof the measured data. Just an interesting example: on one occasion, we noticeda high skin conductance response, which at first sight seemed similar to a mea-surement error, however, the participant told us that at that moment the musicsounded like a mosquito and because he had a fight with one during the previousnight, he got very nervous and flicked his finger.
In support of our hypothesis we extracted 12 features from the signals col-lected from these 50 participants. The signals were processed twice: once forthe overall test and once for the three different parts. Therefore we divided thesignals into three data entries each. With this data we provided the informationneeded by our visualization. The validity of the feature extraction is not given atthis time as the low signal quality makes further examination necessary beforeall results can be confirmed, and only examples are offered. Nonetheless, becauseour focus is actually the visualization after the feature extraction, we had thenecessary data structure for the visualization given in figure 3.
On Interactive Data Visualization of Physiological signals 9
Feature Min Mean Max
MeanRR (ms) 669 867 1114
MeanHR (bpm) 54 73 93
pNN50 (%) 24.80 49.44 76.90
RMSSD (ms) 46 111 265
LF (%) 23.90 40.69 56.70
HF (%) 16.50 39.13 68.30
LF/HF 0.364 1.2480 3.056
Sum GSR (µS) -3.88 0.4640 3.09
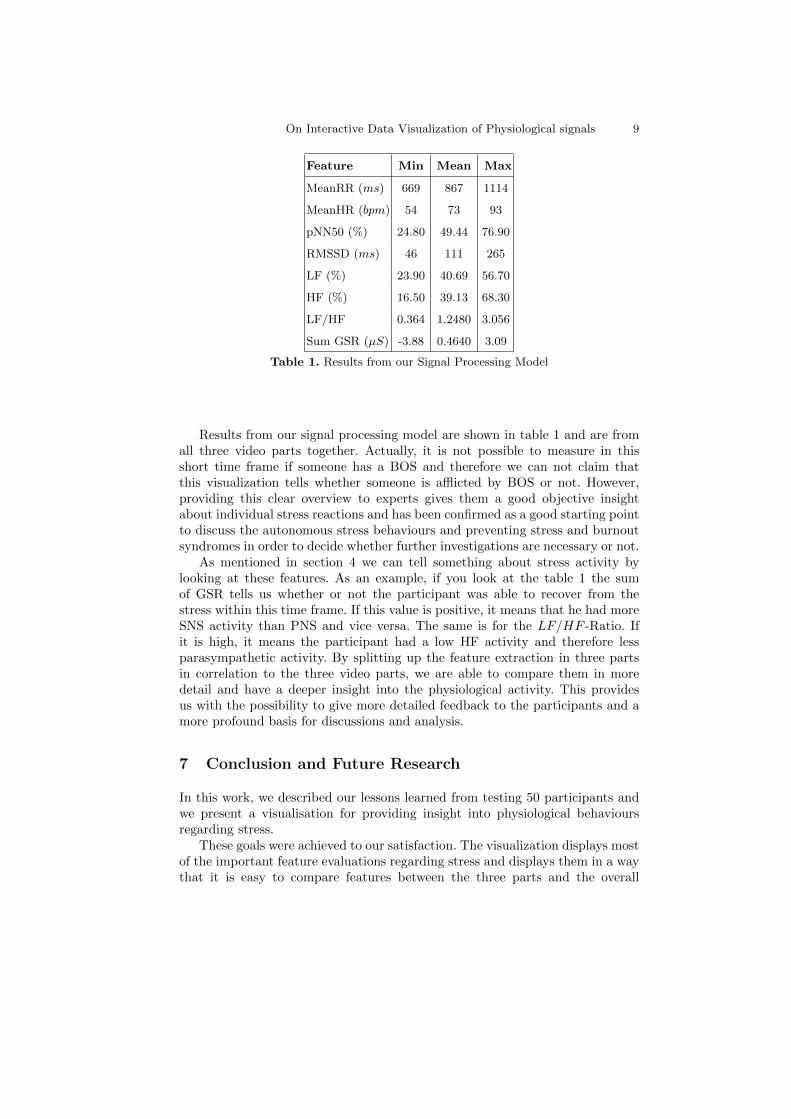
Table 1. Results from our Signal Processing Model
Results from our signal processing model are shown in table 1 and are fromall three video parts together. Actually, it is not possible to measure in thisshort time frame if someone has a BOS and therefore we can not claim thatthis visualization tells whether someone is afflicted by BOS or not. However,providing this clear overview to experts gives them a good objective insightabout individual stress reactions and has been confirmed as a good starting pointto discuss the autonomous stress behaviours and preventing stress and burnoutsyndromes in order to decide whether further investigations are necessary or not.
As mentioned in section 4 we can tell something about stress activity bylooking at these features. As an example, if you look at the table 1 the sumof GSR tells us whether or not the participant was able to recover from thestress within this time frame. If this value is positive, it means that he had moreSNS activity than PNS and vice versa. The same is for the LF/HF -Ratio. Ifit is high, it means the participant had a low HF activity and therefore lessparasympathetic activity. By splitting up the feature extraction in three partsin correlation to the three video parts, we are able to compare them in moredetail and have a deeper insight into the physiological activity. This providesus with the possibility to give more detailed feedback to the participants and amore profound basis for discussions and analysis.
7 Conclusion and Future Research
In this work, we described our lessons learned from testing 50 participants andwe present a visualisation for providing insight into physiological behavioursregarding stress.
These goals were achieved to our satisfaction. The visualization displays mostof the important feature evaluations regarding stress and displays them in a waythat it is easy to compare features between the three parts and the overall
10 Holzinger et al.
features. It gives us a very clean insight into the data and offers good possibil-ities for knowledge discovery. With a minimum of support, a layman is able tounderstand the science behind it and can support us with useful information.Nonetheless there are some things that can be improved and expanded.
The low-cost sensor provided workable signals, but for more accurate studiesthe signal quality is too low. However there are still low-cost sensors that arepromising, such the BITalino [35] and for better results for the visualizationothers will also be tried. After the completion of the processing, the evaluationof this visualization with a larger test group will provide further insight into oursuppositions.
For a better insight for stress prevention, it would be helpful to include inour software a questionnaire like the Hamburger Burnout Inventory (HBI) thatreflects the subjective sensation of the participants, especially looking at BOS. Ifthe participants do this in advance of the test, at the end they have an objectiveand subjective insight.
Acknowledgments. We thank the anonymous reviewers for their helpful com-ments. Many thanks also to Hugo Silva from the Technical University of Lisbonfor constantly supporting our research. Thanks to Carl Bck from the TechnicalUniversity of Graz for some helpful comments. This work was partially fundedby Austrian Science Fund (FFG), Innovationsscheck Plus No. 840131.
References
1. Dolan, R.J.: Emotion, cognition, and behavior. Science 298(5596) (2002) 1191–1194
2. Le Gall, J., Azoulay, E., Embriaco, N., Poncet, M., Pochard, F.: Burn out syndromeamong critical care workers]. Bulletin de l’Academie nationale de medecine 195(2)(2011) 389
3. Weber, A., Jaekel-Reinhard, A.: Burnout syndrome: a disease of modern societies?Occupational medicine 50(7) (2000) 512–517
4. Wickens, C.D., Gordon, S.E., Liu, Y.: An introduction to human factors engineer-ing. (2004)
5. Rubin, J., Chisnell, D.: Handbook of Usability Testing: Howto Plan, Design, andConduct Effective Tests. Wiley (2008)
6. Cairns, P., Cox, A.L.: Research methods for human-computer interaction. Cam-bridge University Press (2008)
7. Lazar, J., Feng, J.H., Hochheiser, H.: Research methods in human-computer in-teraction. Wiley (2010)
8. Holzinger, A.: Process Guide for Students for Interdisciplinary Work in ComputerScience/Informatics: Instructions Manual-Handbuch fur Studierende. BoD–Bookson Demand (2010)
9. Breitwieser, C., Terbu, O., Holzinger, A., Brunner, C., Lindstaedt, S., Muller-Putz,G.R.: iscope–viewing biosignals on mobile devices. In: Pervasive Computing andthe Networked World. Springer (2013) 50–56
10. Sharma, N., Gedeon, T.: Objective measures, sensors and computational tech-niques for stress recognition and classification: A survey. Computer methods andprograms in biomedicine 108(3) (Dec 2012) 1287–1301
On Interactive Data Visualization of Physiological signals 11
11. Holzinger, A.: On knowledge discovery and interactive intelligent visualization ofbiomedical data-challenges in human-computer interaction & biomedical informat-ics. In: 9th International Joint Conference on e-Business and Telecommunications(ICETE 2012), pp. IS9–IS20. (2012)
12. Boucsein, W.: Electrodermal activity. Springer (2012)13. Boucsein, W.: Electrodermal Activity. Springer (2012)14. Dawson, M.E., Schell, A.M., Filion, D.L.: The electrodermal system. In Cacioppo,
J.T., Tassinary, L.G., eds.: Handbook of Psychophysiology. 3 edn. Cambridge Press(2007) 159–181
15. Johnson, L.C., Lubin, A.: Spontaneous electrodermal activity during waking andsleeping. Psychophysiology 3(1) (1966)
16. Camm, A.J., Malik, M., Bigger, J., Breithardt, G., Cerutti, S., Cohen, R., Coumel,P., Fallen, E., Kennedy, H., Kleiger, R., et al.: Heart rate variability: standardsof measurement, physiological interpretation and clinical use. task force of theeuropean society of cardiology and the north american society of pacing and elec-trophysiology. Circulation 93(5) (1996) 1043–1065
17. Devereux, R.B., Roman, M.J., Palmieri, V., Okin, P.M., Boman, K., Gerdts, E.,Nieminen, M.S., Papademetriou, V., Wachtell, K., Dahlof, B.: Left ventricularwall stresses and wall stress-mass-heart rate products in hypertensive patients withelectrocardiographic left ventricular hypertrophy: The life study. Journal of hy-pertension 18(8) (2000) 1129–1138
18. Barreto, A.B., Aguilar, C.D., Jakubzick, E.E.: Adaptive lms delay measurementin dual blood volume pulse signals for non-invasive monitoring [photoplethysmog-raphy]. In: Biomedical Engineering Conference, 1997., Proceedings of the 1997Sixteenth Southern, IEEE (1997) 117–120
19. Silva, H., Sousa, J., Gamboa, H.: Study and evaluation of palmar blood volumepulse for heart rate monitoring in a multimodal framework. Computing Paradigmsfor Mental Health (2012) 35
20. Sun, F.T., Kuo, C., Cheng, H.T., Buthpitiya, S., Collins, P., Griss, M.: Activity-aware mental stress detection using physiological sensors. In: Mobile Computing,Applications, and Services. Springer (2012) 282–301
21. Wilhelm, F.H., Pfaltz, M.C., Grossman, P., Roth, W.T.: Distinguishing emotionalfrom physical activation in ambulatory psychophysiological monitoring. BiomedicalSciences Instrumentation 42 (2006) 458–463
22. Wilddivine: http://www.wilddivine.com (2013) [Online; accessed 01-May-2013].23. Zhai, J., Barreto, A.: Stress detection in computer users based on digital sig-
nal processing of noninvasive physiological variables. In: Engineering in Medicineand Biology Society, 2006. EMBS’06. 28th Annual International Conference of theIEEE, IEEE (2006) 1355–1358
24. Canento, F., Silva, H., Fred, A.: Applicability of multi-modal electrophysiologicaldata acquisition and processing to emotion recognition. Computing Paradigms forMental Health (2012) 59
25. Taelman, J., Vandeput, S., Spaepen, A., Van Huffel, S.: Influence of mental stresson heart rate and heart rate variability. In: 4th European conference of the interna-tional federation for medical and biological engineering, Springer (2009) 1366–1369
26. Acharya, U.R., Joseph, K.P., Kannathal, N., Lim, C.M., Suri, J.S.: Heart ratevariability: a review. Medical and Biological Engineering and Computing 44(12)(2006) 1031–1051
27. LAUER, M.S.: Autonomic function and prognosis. Cleveland Clinic journal ofmedicine 76(Suppl 2) (2009) S18–S22

12 Holzinger et al.
28. Healey, J.A., Picard, R.W.: Detecting stress during real-world driving tasks usingphysiological sensors. Intelligent Transportation Systems, IEEE Transactions on6(2) (2005) 156–166
29. Buchheit, M., Papelier, Y., Laursen, P.B., Ahmaidi, S.: Noninvasive assessment ofcardiac parasympathetic function: postexercise heart rate recovery or heart ratevariability? American Journal of Physiology-Heart and Circulatory Physiology293(1) (2007) H8–H10
30. Zulfiqar, U., Jurivich, D.A., Gao, W., Singer, D.H.: Relation of high heart ratevariability to healthy longevity. The American journal of cardiology 105(8) (2010)1181–1185
31. Holzinger, A., Holler, M., Bloice, M., Urlesberger, B.: Typical problems with de-veloping mobile applications for health care. ICE-B 2008 (2008) 235
32. Ebert, P.S.: Smart radar chart (May 11 2005) EP Patent 1,530,141.33. Morris, M.F.: Kiviat graphs: conventions and figures of merit. ACM SIGMETRICS
Performance Evaluation Review 3(3) (1974) 2–834. Saary, M.J.: Radar plots: a useful way for presenting multivariate health care data.
Journal of clinical epidemiology 61(4) (2008) 311–31735. Alves, A., Silva, H., Lourenco, A., Fred, A.: BITalino: A Biosignal Acquisition
System based on the Arduino. In: Proceeding of the 6th Conference on Bio-InspiredSystems and Signal Processing (BIOSIGNALS). (2013)