on horizontal curves final technical report volume i1 - deep blue
TRANSCRIPT

Side Friction for Superelevation
on Horizontal Curves
Final Technical Report Volume I 1
C. C. MacAdam P. S. Fancher
L. Segel
Contract Number: DTFH61-82-C-00019
August 1985
UMTRI The University of Michigan Transportation Research Institute

This document i s disseminated under t h e sponsorship of t he Department of Transpor ta t ion i n t h e i n t e r e s t of information exchange. The United S t a t e s Government assumes no l i a b i l i t y f o r i t s contents o r use the reo f .
The contents of t h i s r epo r t r e f l e c t the view of the con t r ac to r , who i s respons ib le f o r t he accuracy of t he d a t a presented here in . The con ten t s do not n e c e s s a r i l y r e f l e c t the o f f i c i a l po l i cy of t h e Department of Transpor ta t ion .
This r epo r t does not c o n s t i t u t e a s tandard , s p e c i f i c a t i o n , o r r egu la t ion .
The United S t a t e s Government does not endorse products o r manufacturers. Trade o r manufacturers ' names appear he re in only because they a r e considered e s s e n t i a l t o the ob jec t of t h i s document.

Vol. I1 - Technical Report 8. PufmminO Orpmizcvtion ~ . p o r c NO.
7. A u r h d r ) C . C . MacAdm, P.S. rancher , L. Segel 1 LYTRI-85-18/2
Tuhaico l Repart Docurmtutibn Page
1. R ~ p e r t No.
U.S. ~ e ~ a r i m e n t of Transpor ta t ion Washington, D. C. 20590
L I
COTR - Mr. Laurence HcCarthy FCP P r o j e c t IS , " ~ e s i g n and Correct ive Geometries"
2. Covonrzn! Accosalon No.
9. P w f o r n ~ n ~ Orgmirsiibn Nono a d Addrmss The Univers i ty of Michigan Transpor ta t ion Research I n s t i t u t e
The b a s i c ob jec t ive of t h i s s tudy has been to address the i s s u e of how adequate point-mass r ep re sen ta t ions a r e i n p red ic t ing f r i c t i o n requirements f o r a c t u a l v e h i c l e s opera t ing along superelevated curves. The p r o j e c t focused on t h i s and r e l a t e d ques t ions by combining computer a n a l y s i s and f u l l - s c a l e veh ic l e t e s t i n g , Simple-to-use models f o r p red ic t ing the f r i c - t i o n f a c t o r requirements a t i nd iv idua l wheel l oca t ions were f i r s t developed and appl ied t o t h e s teady-turning condi t ion . An e x i s t i n g com- prehensive computer ~ o d e l used f o r p red ic t ing t r a n s i e n t o r nonsteady maneuvering s i t u a t i o n s was a l s o employed t o ana lyze f r i c t i o n demand whi le maneuvering along supere leva ted curves. Highway t e s t s were then performed f o r two passenger c a r s and a f ive-axle t r a c t o r - s e m i t r a i l e r t o c o l l e c t repre- s e n t a t i v e t e s t da t a and a s s i s t i n v a l i d i n g t h e p red ic t ions of t h e computer models. F i n a l l y , a s e n s i t i v i t y a n a l y s i s was performed t o i l l u s t r a t e the r e l a t i v e importance and i n t e r a c t i o n s of var ious v e h i c l e parameters and
I highway geometrics i n inf luenc ing s i d e f r i c t i o n requirements. I
3. R a c ~ p ~ m t ' r Cotoiog No.
4. T ~ t l . d S u b ~ ~ t l a
SIDE FRICTION FOR SUPERELEVATION ON HORIZOETAL CURVES
10. Wort Unrl No.
11 . Controct er Gront NO.
5. R-rt Doc*
August 1985 6. P u h m t n g O r p n ~ z o t ~ o n Code
2901 Baxter Road Ann Arbor, Ydchigan 48109
12. Sponsoring ~ m q H r * and Addrmsa
Federa l Bighvay Administrat ion
17. K . t Words friction factor, highway design, supere leva ted curves, computer models, v e h i c l e t e s t s , s teady
DTFH61-82-C-00019 13. f rpr 01 Rrpwc ~d Period bwot.d
F i n a l 6/82 - 7/85
'8. D i s w i h t i m Stemnmt
No r e s t r i c t i o n s . This document i s a v a i l a b l e t o the pub l i c through t h e
f
National Technical Information Serv ice , t u rn ing , o b s t a c l e avoidance I Spr ing f i e ld , Vi rg in ia 22161
19. k c v r i + y Ct*.ul. (o l h i s W) a. kewit, CIo*df. (of &hi. pro.)
I Unclass i f ied
21. No. of Poqoa
Unclass i f ied
22. Price
I


CONTEXTS
LISTOFTAELES . . . . . . . . . . . . . . . . . . . . . . . . . . i x
Chapter
1 INTRODUCTIOE . . . . . . . . . . . . . . . . . . . . . . . 1
. . . . . . . . . . . . . . . . . . . . . 2 PROJECT O17ERVIEW 3
2 . 1 Comparison of Point-Mass and Indiv idua l h%eel F r i c t i o n Factors . . . . . . . . . . . . . . 3
2 . 2 Special Factors That Exaggerate F r i c t i o n F a c t o r Dispersion . . . . . . . . . . . . 11
2 . 3 Methodology . . . . . . . . . . . . . . . . . . . . . 16
2 . 4 Overview of Model Development . . . . . . . . . . . . 1 7
2 . 5 Overview of Vehicle Testing . . . . . . . . . . . . . 1 8
2 . 6 S e n s i t i v i t y Analysis Overview . . . . . . . . . . . . 1 9
3 .1 In t roduct ion t o t he Different Models . . . . . . . . . . . . . . . . . . and Their Uses 2 1
3 . 2 Single-Unit Steady Turning Model . . . . . . . . . . 22
3 . 3 Tractor-Semitrai ler Steady Turning Model . . . . . . 2 8
3 .4 Modifications t o the Comprehensive Braking . . . . . . . . . . . . . . . . and Steer ing Model 32
3 . 5 Model Applications and Recommended Usage . . . . . . 35
4 VEHICLE TESTING . . . . . . . . . . . . . . . . . . . . . 38
. . . . . . . . . . . . . . Test Vehicle Descript ions 38
Horizontal Curve S i t e Descript ions . . . . . . . . . 4 3
Test Measurements and Data Acquisi t ion . . . . . . . 46
. . . . . . . . . . . . . . . Vehicle Test Maneuvers 51
Example Steady Turning Test Results . . . . . . . . . 5 2
Example Obstacle Avoidance Test Result . . . . . . . 57
Example ~ rak ing /Acce le ra t ing Test Result . . . . . . 6 2
Observations and Conclusions Concerning . . . . . . . . . . . . . . . . . the Test Resul ts 62


CONTENTS (Continued)
Chapter
. . . . 5 CO?PARISOXS OF MODEL PREDICTIOES AKD TEST RESL%TS 67
. . . . . . . . . . . . . 1 Steady Turning Comparisons 67
. . . . . . . . . . . 5 .2 Obstacle Avoidance Comparisons 94
. . . . . . . . . . 3 . 3 Brak ing /Acce le ra t ing Comparisons 119
. . . . . . . 5 . 4 Conclusions Regarding Nodel Va l i da t i on 140
. . . . . . . . . . . . . . . . . . 6 SENSITIVITY AKALYSES 141
. . . . . . . . . 6 . 1 Passenger Car Parameter V a r i a t i o n s 141
. . . . . . 6.2 T rac to r -Semi t r a i l e r Parameter V a r i a t i o n s 159
6 . 3 S e n s i t i v i t y of Peak F r i c t i o n Fac to r s During . . . . . . . . . . . Obstac le Avoidance Maneuvers 183
ianeuver s 6 . 4 Steady Turning and Obs tac le Avoidance Pr . . . . . . . . . . Under Low F r i c t i o n Condi t ions 193
. . . . . . . 6 .5 A n a l y t i c a l F r i c t i o n Fat-tor Express ions 196
6 . 6 S t ee r i ng Requirements f o r Superelevated Curves . . . 201
-I
1 RESEARCH FIIL~INGS AKD CLTRENT ASSHTO DESIGN POLICY . . . 206
7 . 1 "Steady Turning" Driver Behavior and . . . . . . . . . . . . F r i c t i o n Fac to r V a r i a t i o n s 206
. . . . . . . . . . . 7 . 2 Larger Rad i i Hor izon ta l Curves 209
. . . . . . . . . . . . . . . . . 7.3 S p i r a l T r a n s i t i o n s 210
. . . . . . 7.4 Ro l l S t a b i l i t y Margins f o r Heavy Trucks 212
7 .5 S t ee r i ng Requirements Along Superelevated . . . . . . . . . . . . . Curves a t Reduced Speed 213
8 CONCLUSIONS AND RECOMhQATIONS . . . . . . . . . . . . . 214
. . . . . . . . . . . . . . . . . . . . . . . 9 REFERENCES 219
. . . . . . . . . . . . . . . . . 10 SELECTED BIBLIOGRAPHI'. 220


LIST OF FIGURES
Figure
1 Force equi l ibr ium . . . . . . . . . . . . . . . . . . . . . . 4
2 Point-mass model . . . . . . . . . . . . . . . . . . . . . . 6
. . . . . . . . . . . . . . . . . . . . . . . . 3 Bicycle model 7
4 Ti re forces def in ing the ind iv idua l wheel " f r i c t i o n f a c t o r " . . . . . . . . . . . . . . . . . . . . . 8
6 Side-to-side v a r i a t i o n i n f r ic:t ion f a c t o r s due t o d i f f e r ences i n v e r t i c a l t i r e loads . . . . . . . . . . . 1 2
7 Passenger car t i r e v s t ruck t i r e . . . . . . . . . . . . . . i 4
. . . . . . . . . . . . . . . 8 S ingle-uni tmodel ; r e a r v i e w . 23
. . . . . . . . . . . . . . . . 9 Single-uni tmodel ; p l a n v i e w 23
10 Single-uni t model: s i d e view . . . . . . . . . . . . . . . . 24
11 Trac tor -semi t ra i le r model: plan view . . . . . . . . . . . . 29
1 2 Independent suspension model (Phase 4) . . . . . . . . . . . 34
13 T e s t v e h i c l e A . . . . . . . . . . . . . . . . . . . . . . . 39
1 4 Test v e h i c l e B . . . . . . . . . . . . . . . . . . . . . . . 40
15 T e s t v e h i c l e C . . . . . . . . . . . . . . . . . . . . . . . 4 1
16 Curve s i t e desc r ip t ions . . . . . . . . . . . . . . . . . . . 44
1 7 Curve s i t e desc r ip t ions . . . . . . . . . . . . . . . . . . . 45
. . . . . . . . . . . 18 Trol ley and f i f th-wheel instrumentat ion 48
. . . . . . . . 19 Instrumentat ion and da ta acqu i s i t i on console 49
. . . . . . . 20 Example s teady turn ing t e s t r e s u l t ; veh ic l e A 53
2 1 Sample v e r t i c a l load measurements . . . . . . . . . . . . . . 56
. . . . . . . . . . 2 2 Normalized v e r t i c a l t i r e load comparisons 58
. . . . . . 23 Obstacle avoidance t e s t r e s u l t example; veh ic l e C 59


LIST OF FIGURES (Continued)
Figure
2 4 Brakinglaccelerat ing t e s t r e s u l t example; passenger . . . . . . . . . . . . . . . . . . . . . . . . . . . c a r B
. . . . . . . . . . . . . . 25 Model/test comparisons; veh ic l e C
. . . . . . . . . . . 26 F r i c t i o n f a c t o r comparisons; vehic le C
. . . . . . . . . . . 2 7 F r i c t i o n f a c t o r comparisons; vehic le C
. . . . . . . . . . . 28 F r i c t i o n f a c t o r comparisons; veh ic l e C
. . . . . . . . . . . 29 F r i c t i o n f a c t o r comparisons; veh ic l e C
30 F r i c t i o n f a c t o r comparisons; veh ic l e C . . . . . . . . . . . F r i c t i o n f a c t o r comparisons; vehic le C . . . . . . . . . . .
. . . . . . . . . . . . . . Model/test comparisons; veh ic l e A
. . . . . . . . . . . F r i c t i o n f a c t o r comparisons; vehic le A
. . . . . . . . . . . F r i c t i o n f a c t o r comparisons; veh ic l e A
. . . . . . . . . . . F r i c t i o n f a c t o r comparisons; v e h i c l e A
. . . . . . . . . . . . . . Modelltest conparisons; vehic le B
. . . . . . . . . . . F r i c t i o n f a c t o r comparisons; vehic le B
. . . . . . . . . . . F r i c t i o n f a c t o r comparisons; veh ic l e B
. . . . . . . . . . . F r i c t i o n f a c t o r comparisons; vehic le B
. . . . . . . . . . . F r i c t i o n f a c t o r comparisons; vehic le B
. . . . . . . . . . . F r i c t i o n f a c t o r comparisons; veh ic l e B
Obstacle avoidance (double lane change) maneuver . . . . . . Phase 4 model / tes t comparison; obs tac le avoidance
. . . . . . . . . . . . . . . . . . . . maneuver; veh ic l e C
Phase 4 model / tes t comparisons; obs t ac l e avoidance . . . . . . . . . . . . . . . . . . . . maneuver/ veh ic l e A
Phase 4 model l tes t comparisons; obs t ac l e avoidance . . . . . . . . . . . . . . . . . . . . maneuver; veh ic l e B


LIST OF FIGURES (Continued)
Figure
46 Phase 4 modelltest comparisons; brakinglaccelerating . . . . . . . . . . . . . . . . . . . . maneuver;vehicle C
47 Phase 4 modelltest comparisons; braking/accelerating . . . . . . . . . . . . . . . . . . . . maneuver; vehicle A
48 Phase 4 model/test comparisons; braking/accelerating . . . . . . . . . . . . . . . . . . . . maneuver; vehicle B
. . . . . . . . . . . . . 4 9 Passenger car parameter variations
. . . . . . . . . . . . . 5 0 Passenger car parameter variations
. . . . . . . . . . . . . 5 1 Passenger car parameter variations
. . . . . . . . . . . . . 5 2 Passenger car parameter variations
. . . . . . . . . . . . . 53 Passenger car parameter variations
. . . . . . . . . . . . . 5 4 Passenger car parameter variations
. . . . . . . . . . . . . . 5 5 Passenger car response variables
. . . . . . . . . . . . . . 56 Passenger car response variables
. . . . . . . . . . . . . . 57 Passenger car response variables
. . . . . . . . . . . . . . 5 8 Passenger car response variables
. . . . . . . . . . . . . . 5 9 Passenger car response variables
. . . . . . . . . . . . . . 6 0 Passenger car response variables
. . . . . . . . . . . . . . 6i Passenger car response variables
. . . . . . . . . . . . . . 6 2 Passenger car response variables
. . . . . . . . . . . . . . 63 Passenger car response variables
. . . . . . . . . . 6 4 Tractor-semitrailer parameter variations
. . . . . . . . . . 6 5 Tractor-semitrailer parameter variations
. . . . . . . . . . 66 Tractor-semitrailer parameter variations
. . . . . . . . . . 67 Tractor-semitrailer parameter variations


LIST OF FIGURES (Continued)
Fieure
. . . . . . . . . . Tractor-semitrailer parameter variations 165
Tractor-semitrailer parameter variations . . . . . . . . . . 166 . . . . . . . . . . Tractor-semitrailer parameter variations 167
Tractor-semitrailer parameter variations . . . . . . . . . . 168 Tractor-semitrailer parameter variations . . . . . . . . . . 169 Tractor-semitrailer response variables . . . . . . . . . . . 170 Tractor-semitrailer response variables . . . . . . . . . . . 172 Tractor-semitrailer response variables . . . . . . . . . . . 174 Tractor-semitrailer response variables . . . . . . . . . . . 176 Tractor-semitrailer response variables . . . . . . . . . . . 178 Tractor-semitrailer response variables . . . . . . . . . . . 180 Peak friction factors occurring during obstacle avoidance maneuver; passenger car . . . . . . . . . . . . 184
Peak friction factors occurring during obstacle avoidance maneuver; passenger car . . . . . . . . . . . . 185
Peak friction factors occurring during obstacle . . . . . . . . . . . . avoidance maneuver; passenger car 186
Peak friction factor comparison; obstacle avoidance . . . . maneuver vs steady turning maneuver; passenger car 188
Peak friction factors occurring during obstacle . . . . . . . . . avoidance maneuver; tractor-semitrailer 189
Peak friction factors occurring during obstacle . . . . . . . . . avoidance maneuver: tractor-semitrailer 190
Peak friction factors occurring during obstacle . . . . . . . . . avoidance maneuver; tractor-semitrailer 191
Peak friction factor comparison; obstacle avoidance maneuver vs steady turning maneuver;
. . . . . . . . . . . . . . . . . . . tractor-semitrailer 192


LIST OF FIGURES (Continued)
F i g u r e
87 ~ i r e / r o a d f r i c t i o n n e c e s s a r y f o r s t a b l e o p e r z t i o n under low f r i c t i o n c o n d i t i o n s ; s t e a d y t u r n i n g maneuver. . . . . 194
88 Loss of d i r e c t i o n a l c o n t r o l exper ienced by passenger c a r under low f r i c t i o n c o n d i t i o n s . . . . . . . . . . . . 195
89 T i r e / r o a d f r i c t i o n n e c e s s a r y f o r s t a b l e o p e r a t i o n under low f r i c t i o n c o n d i t i o n s ; o b s t a c l e avoidance maneuver. . . 1 9 7
90 Sample measurement; s t e a d y t u r n i n g ; v e h i c l e A . . . . . . . 204


LIST OF TABLES
Table
1 . . . . . . . . . , . . . . . . . . Test vehicle descriptions 42
. . . . . . . . . . . . . . . 2 Summary of curve site geometry 43
. . . . . . . . . . . . . . 3 Tractor-semitrailer measurements 46
. . . . . . . . . . . . . . . . . 4 Passenger car measurements 47
. . . . . . . . . . . . . 5 Parameter and variable definitions 199


Chapter 1
INTRODUCTION
This document i s t h e f i n a l r e p o r t f o r t h e F e d e r a l Highway Admin i s t r a t i on
p r o j e c t e n t i t l e d , "Side F r i c t i o n f o r Supe re l eva t ion on Hor i zon ta l Curves,"
performed under Con t r ac t Number DTFH61-82-C-00019. The b a s i c o b j e c t i v e of
t h i s p r o j e c t has been t o a d d r e s s t h e i s s u e of how adequa te point-mass
r e p r e s e n t a t i o n s a r e i n p r e d i c t i n g f r i c t i o n requi rements f o r a c t u a l v e h i c l e s
o p e r a t i n g a long supe re l eva t ed curves . S ince c u r r e n t d e s i g n p r a c t i c e
c h a r a c t e r i z e s t h e v e h i c l e under c o n d i t i o n s of s t eady t u r n i n g motion a s a
s imple point-mass, l e g i t i m a t e q u e s t i o n s concern ing t h e f r i c t i o n requi rements
a t i n d i v i d u a l wheel l o c a t i o n s and how they r e l a t e t o t h e point-mass
r e p r e s e n t a t i o n a r e examined,
The p r o j e c t focused on t h i s and r e l a t e d q u e s t i o n s by combining computer
a n a l y s i s and f u l l s c a l e v e h i c l e t e s t i n g . Simple-to-use models f o r p r e d i c t i n g
t h e f r i c t i o n f a c t o r r equ i r emen t s a t i n d i v i d u a l wheel l o c a t i o n s were f i r s t
developed and a p p l i e d t o t h e s t e a d y t u r n i n g cond i t i on . An e x i s t i n g
comprehensive computer model (UMTRI "Phase 4", [ 5 ] ) used f o r p r e d i c t i n g
t r a n s i e n t o r nons teady maneuvering s i t u a t i o n s was a l s o employed t o ana lyze
f r i c t i o n demand wh i l e maneuvering a long supe re l eva t ed curves . Highway t e s t s
were t h e n performed f o r two passenger c a r s and a f i v e - a x l e t r a c t o r - s e m i t r a i l e r
t o c o l l e c t r e p r e s e n t a t i v e t e s t d a t a and a s s i s t i n v a l i d a t i n g t h e p r e d i c t i o n s
of t h e computer models. F i n a l l y , a s e n s i t i v i t y a n a l y s i s was performed t o
i l l u s t r a t e t h e r e l a t i v e impor tance and i n t e r a c t i o n s of v a r i o u s v e h i c l e
parameters and highway geome t r i e s i n i n f l u e n c i n g s i d e f r i c t i o n requi rements .
Because t h e p r i n c i p a l concern of t h i s s tudy was t o e v a l u a t e f r i c t i o n a l
requi rements of v e h i c l e s d u r i n g n e g o t i a t i o n of h o r i z o n t a l c u r v e s , p o r t i o n s of
t h i s r e p o r t c o n t a i n r e s u l t s which i l l u s t r a t e how changes i n v e h i c l e p r o p e r t i e s
a s w e l l a s changes i n cu rve geometry a f f e c t t h e e v e n t u a l answers.
Consequent ly , t h e i n t e r a c t i o n between v e h i c l e and highway w i l l f r e q u e n t l y r e l y
upon, o r be i l l u s t r a t e d i n terms o f , s e l e c t e d v e h i c l e responses . I n c e r t a i n
c a s e s , t h i s i s d e s i r a b l e i n o r d e r t o demons t r a t e , f o r example, t h a t a l t hough

c e r t a i n v e h i c l e p r o p e r t i e s may change, t h e s i d e f r i c t i o n r equ i r emen t s may no t .
Thus, t h e m o d i f i c a t i o n of c e r t a i n v e h i c l e p r o p e r t i e s would be i l l u s t r a t e d by
changes i n v e h i c l e r e sponses , wh i l e s imu l t aneous ly showing t h a t t h e f r i c t i o n
f a c t o r s remain u n a f f e c t e d .
I n a d d i t i o n t o t h e Execu t ive Summary (volume I ) , t h e main r e p o r t i s
o rgan ized i n t o e i g h t c h a p t e r s and a s e t of s i x appendices . Volume I1 c o n t a i n s
t h e main body of t h e t e c h n i c a l r e p o r t , Volume 111 c o n t a i n s t h e appendices A
t o G which p rov ide d e t a i l e d i n f o r m a t i o n r e l a t i n g t o t h e computer models /
p r e d i c t i o n s and expe r imen ta l t e s t d a t a .
Chapter 2 of t h i s volume p r e s e n t s an overview of t h e p r o j e c t and i t s
o r g a n i z a t i o n . The b a s i c t e c h n i c a l q u e s t i o n s a r e f i r s t i n t r o d u c e d , fo l lowed by
a g e n e r a l d e s c r i p t i o n of t h e t a s k s employed i n accompl ish ing t h e p r o j e c t
g o a l s . Chapter 3 d e s c r i b e s t h e models developed and used du r ing t h e p r o j e c t
work. Use and i n t e r p r e t a t i o n of t h e model p r e d i c t i o n s a r e a l s o d i scus sed .
Chapter 4 cove r s t h e v e h i c l e t e s t i n g phase of t h e p r o j e c t . Tes t v e h i c l e s ,
curve s i t e s , and t e s t maneuvers a r e f i r s t d e s c r i b e d . Example r e s u l t s a r e t hen
shown f o r each v e h i c l e and b r i e f l y d i s cus sed . A comparison of v e h i c l e t e s t
r e s u l t s and model p r e d i c t i o n s a r e p re sen ted i n c h a p t e r 5. S teady t u r n i n g ,
o b s t a c l e avo idance , and b rak ing / a c c e l e r a t i n g maneuvers performed a l o n g
s u p e r e l e v a t e d cu rves a r e used a s r e p r e s e n t a t i v e maneuvers f o r c h a l l e n g i n g t h e
v a l i d i t y of t h e v a r i o u s models. Chapter 6 p r e s e n t s f i n d i n g s of t h e
s e n s i t i v i t y a n a l y s i s which s t u d i e d t h e i n f l u e n c e of v a r i o u s v e h i c l e and
highway geome t r i c pa rame te r s on f r i c t i o n demand. I n a d d i t i o n , s e v e r a l s p e c i a l
s t u d i e s were conducted t o examine 1 ) low f r i c t i o n c o n d i t i o n s du r ing s t e a d y
t u r n i n g and o b s t a c l e avo idance , 2 ) t h e s e n s i t i v i t y of f r i c t i o n f a c t o r
e s t i m a t e s t o measurement e r r o r s , and 3 ) c o n t r i b u t i o n s of d r i v e r s t e e r i n g
a c t i v i t y and v e h i c l e c h a r a c t e r i s t i c s t o f r i c t i o n demand l e v e l s beyond t h a t
p r e d i c t e d by t h e point-mass va lue . C e r t a i n recommendations from p rev ious
s t u d i e s f o r modifying c u r r e n t d e s i g n p o l i c y a r e a l s o examined. Chapter 7
r e l a t e s t h e b a s i c r e s e a r c h f i n d i n g s t o c u r r e n t AASHTO d e s i g n p o l i c y and a l s o
t o r e c e n t s t u d i e s performed by o t h e r i n v e s t i g a t o r s . L a s t l y , c h a p t e r 8
p r e s e n t s c o n c l u s i o n s and recommendations on t h e work performed w i t h i n t h i s
p r o j e c t .

Chapter 2
PROJECT OVERVIEW
This chapter provides a genera l overview of the work performed wi th in
t h i s p r o j e c t and in t roduces the t e c h n i c a l i s s u e s which motivate the reasons
f o r i t , Greater d e t a i l and in-depth d i scuss ions of the m a t e r i a l presented i n
t h i s chap te r can be found i n subsequent chap te r s and the accompanying
appendices. The chap te r begins wi th m a t e r i a l which exp la ins the t e c h n i c a l
reasons mot ivat ing the work while a l s o i l l u s t r a t i n g b a s i c concepts and
terminology used throughout t h e r e p o r t , The remaining s e c t i o n s of t h i s
chap te r provide a s h o r t summary of the p r o j e c t work.
2 . 1 Comparison of Point-Mass and Ind iv idua l Wheel F r i c t i o n Fac to r s
This s e c t i o n i l l u s t r a t e s how f r i c t i o n f a c t o r va lues can become
d i s t r i b u t e d on a c t u a l v e h i c l e s by p resen t ing t h r e e simple models, s t a r t i n g
from the s imples t "point-mass" model and i n c r e a s i n g i n r ea l i sm t o a four-wheel
r e p r e s e n t a t i o n of a passenger ca r . As the rea l ism of each model i s inc reased ,
a l e v e l i s reached which r e q u i r e s d i f f e r e n c e s i n i n d i v i d u a l f r i c t i o n f a c t o r s
t o occur and d i f f e r from the simple point-mass model. The f i r s t model
considered i s t h a t i n which the t o t a l v e h i c l e mass i s assumed concentra ted a t
one loca t ion . This i s followed by a "bicycle" model i n which the veh ic le i s
represented a s having f r o n t and r e a r t i r e s but no width, The t h i r d case i s a
four-wheel model which adds width , o r side-to-side p r o p e r t i e s , and an e leva ted
mass c e n t e r t o the "bicycle" model.
2.1.1 Point-Mass Model
Figure 1 in t roduces the concept of t h e point-mass model f o r r ep resen t ing
s teady tu rn ing motion along a supere levated curve of cons tan t r a d i u s , R. I f
t h e v e h i c l e i s represen ted , not by a d i s t r i b u t e d mass system, but r a t h e r a s an
o b j e c t wi th i t s mass concentra ted a t a s i n g l e p o i n t , f i g u r e 1 may be used t o
d e r i v e and i l l u s t r a t e the required f r i c t i o n force . I n f i g u r e 1 the point-
mass, m , moves on a c i r c u l a r path of r a d i u s , R , a t a speed, V. The su r face
( road) on which i t moves i s superelevated an amount, e . In order f o r the

Force Fqui 1 ibr ium
m mass of o b j e c t g g r a v i t y f f r ic t ion l e c t o r e s u p e r e l e v e t i o n r a t e V speed
mg (weight)
F i g u r e 1. F o r c e e q u i l i b r i u m .

point-mass t o move i n t h i s c i r c u l a r manner the f o r c e s a c t i n g on the ob jec t
must balance , o r be i n equ i l ib r ium, i n a r a d i a l d i r e c t i o n . Figure 1 shows
t h r e e f o r c e s a c t i n g on the mass i n the r a d i a l d i r e c t i o n : 1 ) t h e c e n t r i f u g a l
f o r c e , ~ v ' / R , a c t i n g outward from the c e n t e r of the t u r n , 2 ) the weight
component of the ob jec t a c t i n g inward (down the s l o p e ) , mge, due t o the
supere leva t ion of the s u r f a c e , and 3 ) the remaining f r i c t i o n f o r c e , mgf,
required t o balance the sum of f o r c e s a c t i n g on the ob jec t . Expressing t h i s
required fo rce equi l ibr ium a s an equat ion
mge + mgf = mv2/R (1)
r e s u l t s i n a "model" f o r the point-mass which permits the c a l c u l a t i o n of the
required f r i c t i o n force . Since m , V , e , and R a r e assumed known, the f r i c t i o n
fo rce required f o r s teady turning i s simply
mgf = ~ v ' / R - mge ( 2 )
o r , d iv id ing each term by the ob jec t weight, mg, r e s u l t s i n the standard
point-mass des ign equat ion f o r the " f r i c t i o n f a c t o r , " f ,
Figure 2 i l l u s t r a t e s the point-mass model i n t h i s form with "normalized"
f o r c e s ( a c c e l e r a t i o n s ) r ep lac ing the f o r c e s appearing i n f i g u r e 1 .
2.1.2 Bicycle Model
I f t h e point-mass model i s now extended t o include one f r o n t and one r e a r
t i r e loca ted a t d i s t a n c e s a and b, r e s p e c t i v e l y , from the mass c e n t e r , m , the
point-mass model becomes a "bicycle" model. Figure 3 shows a diagram
analogous t o t h a t used f o r the point-mass model. In t roduc t ion of f r o n t and
r e a r t i r e s now r e q u i r e s two i n d i v i d u a l wheel f r i c t i o n f a c t o r s ( f r o n t and
r e a r ) , f l and f 2 , t o be determined. What exac t ly i s meant by the term
" ind iv idua l wheel f r i c t i o n f a c t o r s " i s i l l u s t r a t e d i n f i g u r e 4 . The f r i c t i o n
f a c t o r simply represen t s the normalized l a t e r a l t i r e f o r c e , o r r a t i o of
l a t e r a l t i r e fo rce t o v e r t i c a l t i r e f o r c e a t each wheel loca t ion .

( cen t r i f ugsl accel )
superelevat ion: e
f r i c t i o n f a c t o r : f
Figure 2 . Point-mass model

(speed)
(curve (centr i fugal accel )
superelevat ion: e f r i c t i o n f a c t o r s : f , , f2
F i g u r e 3. Bicycle model

f : "friction factor"
F : Lateral Tire Force Y
F Z - Vertical Tire Force Figure 4 . T i r e f o r c e s d e f i n i n g t h e i n d i v i d u a l
wheel " f r i c t i o n f a c t o r "

Because the road-plane f o r c e s a c t i n g on the mass i n f i g u r e 3 a r e not
concentra ted a t one p o i n t , a moment balance a s we l l a s a fo rce balance must
e x i s t about the mass c e n t e r i n order f o r a steady turning condi t ion t o
p reva i l . The a d d i t i o n a l moment balance cond i t ion provides a second equat ion
t o permit i d e n t i f i c a t i o n of the a d d i t i o n a l f r i c t i o n fo rce i n t h i s model.
Hence, the two equat ions de f in ing the "bicycle" model a r e given by:
and
Equation ( 4 ) r ep resen t s the r a d i a l fo rce balance cond i t ion while equat ion ( 5 )
expresses the moment balance requirement. Solving these two equat ions f o r the
two unknown f r i c t i o n f a c t o r s , f l and f 2 , shows them t o be equal t o the point-
mass r e s u l t :
Therefore , d i s t r i b u t i n g the f r i c t i o n f o r c e s i n a simple f o r e l a f t manner a s
shown here wi th the b icyc le model i n d i c a t e s t h a t the ind iv idua l f r i c t i o n
f a c t o r requirements a r e i d e n t i c a l t o the point-mass value.
2.1.3 Two-Axle Model
Figure 5 r e p r e s e n t s the next s t e p toward rea l ism by adding width t o the
b icyc le model i n t h e form of l e f t and r i g h t s i d e t i r e s and a mass c e n t e r
e l eva ted some d i s t a n c e above ground. As a r e s u l t , two a d d i t i o n a l unknown
f r i c t i o n f a c t o r s , f j and f 4 , a r e in t roduced due t o the side-to-side t i r e fo rce
d i s t r i b u t i o n . I f t h i s model i s presumed t o permit v e r t i c a l load t r a n s f e r from
s i d e t o s i d e a s occurs i n a c t u a l veh ic les because of an e leva ted mass c e n t e r ,
r o l l equlibrium must a l s o e x i s t . The r o l l equi l ibr ium cond i t ion provides an
a d d i t i o n a l equat ion t o help determine the a d d i t i o n a l unknown f r i c t i o n a l s i d e
fo rces . Without p resen t ing the mathematical d e t a i l s , i t i s not d i f f i c u l t t o
see t h a t the two-axle case i s very s i m i l a r t o the b icyc le model, except f o r
d i f f e r i n g v e r t i c a l t i r e loads ac ross each axle . Since the l a t e r a l t i r e f o r c e s

(curve b (centr i fugal accel e r )
superelevation: e
f r i c t i o n f a c t o r s : f,, f,, f,, f4
F i g u r e 5 . Two-axle model

a r e nominally the same a t each wheel l o c a t i o n of the same ax le (un less they
a r e s t rong ly dependent upon v e r t i c a l load , which i s not normally the c a s e ) ,
the v a r i a t i o n i n i n d i v i d u a l wheel f r i c t i o n f a c t o r s ac ross an ax le i s pr imar i ly
determined by side-to-side d i f f e r e n c e s i n v e r t i c a l t i r e load. Figure 6 he lps
t o f u r t h e r i l l u s t r a t e t h i s point .
As a r e s u l t , the f r i c t i o n f a c t o r values observed i n the two-axle case
w i l l not normally be equal t o the point-mass value. I n genera l , the i n s i d e o r
more l i g h t l y loaded t i r e s w i l l e x h i b i t f r i c t i o n f a c t o r values g r e a t e r than the
point-mass va lue , while the ou t s ide o r more heavi ly loaded t i r e s w i l l e x h i b i t
f r i c t i o n f a c t o r values l e s s than the point-mass value. Key quest ions t h a t
then a r i s e a r e : How much v a r i a t i o n i n f r i c t i o n f a c t o r values can be expected
t o occur a t d i f f e r e n t wheel l o c a t i o n s ? How do d i f f e r e n t v e h i c l e s inf luence
the amount of v a r i a t i o n ? And l a s t l y : I s the l e v e l of f r i c t i o n f a c t o r
v a r i a t i o n s i g n i f i c a n t i n the sense t h a t hor izon ta l curve des ign pol icy should
be modified t o account f o r i t?
2 . 2 Specia l Fac to r s That Exaggerate F r i c t i o n Factor Dispersion
In a d d i t i o n t o the mat ter of d i f f e r e n t side-to-side v e r t i c a l t i r e loads
c o n t r i b u t i n g t o the v a r i a t i o n i n ind iv idua l wheel f r i c t i o n f a c t o r s , o the r
v e h i c l e r e l a t e d f a c t o r s can a l s o in f luence and c o n t r i b u t e t o t h i s phenomena.
Several of these f a c t o r s a r e d iscussed b r i e f l y i n the following sect ion.
2 .2 .1 Tandem Axle E f f e c t s
When veh ic les equipped wi th tandem a x l e s a r e considered, whether they a r e
heavy duty commercial v e h i c l e s o r u t i l i t y t r a i l e r s pul led by passenger c a r s ,
the presence of a tandem a x l e s e t ( o r a d d i t i o n a l a x l e s ) causes the degree of
f r i c t i o n f a c t o r v a r i a t i o n t o inc rease f u r t h e r . The a d d i t i o n a l d i spe r s ion i s a
d i r e c t r e s u l t of the load l e v e l i n g mechanism i n most tandem suspensions
coupled wi th the requirement t h a t the t i r e s on each of the tandem ax les
produce d i f f e r e n t l a t e r a l t i r e f o r c e s due t o t h e i r f o r e / a f t loca t ions . Hence,
the same-side t i r e s of a tandem suspension c a r r y about the same load ( v e r t i c a l
t i r e f o r c e ) , but d i f f e r s i g n i f i c a n t l y i n l a t e r a l t i r e fo rce production. The
n e t r e s u l t i s increased v a r i a t i o n i n the f r i c t i o n f a c t o r s a t the tandem ax les

outside wheel
ins ide wheel
( left side friction factor )
( right side irichon factor )
Figure 6. Side-to-side variation in friction factors due to differences in vertical tire loads

due t o v a r i a t i o n s i n same-side l a t e r a l t i r e fo rces . Note t h a t t h i s i s i n
d i r e c t c o n t r a s t t o the e f f e c t d iscussed i n the previous s e c t i o n , which
depended upon d i f f e r e n c e s occuring i n side-to-side v e r t i c a l t i r e fo rces while
the l a t e r a l t i r e f o r c e s remained the same.
2 . 2 . 2 T i r e Load S e n s i t i v i t y P r o p e r t i e s
The manner i n which t i r e s produce l a t e r a l ( o r s i d e ) f o r c e i n response t o
changes i n the v e r t i c a l load t h a t they ca r ry a l s o plays an important r o l e i n
the degree t o which f r i c t i o n f a c t o r s w i l l vary. Since the f r i c t i o n f a c t o r i s
simply the r a t i o of l a t e r a l t o v e r t i c a l t i r e f o r c e , the s e n s i t i v i t y of a
t i r e ' s l a t e r a l f o r c e t o changes i n v e r t i c a l t i r e fo rce i s important. For
small t i r e s i d e s l i p angles and constant l o a d s , t y p i c a l of most highway
opera t ing cond i t ions , the pneumatic t i r e i s genera l ly observed t o produce
l a t e r a l t i r e f o r c e i n d i r e c t propor t ion t o i t s s i d e s l i p angle. This
r e l a t i o n s h i p i s usua l ly expressed a s
where F i s the l a t e r a l t i r e f o r c e , B i s the t i r e s i d e s l i p ang le , and Ca i s Y
t he t i r e corner ing s t i f f n e s s which depends upon v e r t i c a l load , F . For z
t y p i c a l highway operat ing cond i t ions , knowledge about a t i r e ' s corner ing
s t i f f n e s s dependence upon v e r t i c a l load w i l l r evea l the p r i n c i p a l f r i c t i o n
f a c t o r s e n s i t i v i t y t o v e r t i c a l load changes.
Figure 7 shows t y p i c a l corner ing s t i f f n e s s dependencies upon v e r t i c a l
load f o r a passenger c a r t i r e and a heavy t ruck t i r e . Since the t y p i c a l
passenger c a r t i r e i s designed t o opera te a t a t i r e load which p laces i t near
the peak of i t s corner ing s t i f f n e s s p l o t and because i t s range of opera t ing
load i s t y p i c a l l y smal l , the passenger c a r t i r e i s seen t o have a nea r ly
constant corner ing s t i f f n e s s . Thus, side-to-side load v a r i a t i o n s ac ross an
ax le do not measurably a f f e c t a passenger c a r t i r e ' s corner ing s t i f f n e s s and
consequently i t s l a t e r a l t i r e f o r c e production. The r e s u l t i s t h a t f r i c t i o n
f a c t o r va lues , which a r e the r a t i o of t h i s nonvarying l a t e r a l fo rce t o a
varying v e r t i c a l f o r c e , a r e s i g n i f i c a n t l y a f f e c t e d by the side-to-side load
t r a n s f e r ac ross an axle .

Passenger Car Tire
Tire Cornering SUf f ness
Tire Cornering Stiffness
Typical Highway rn Operating Range
lightly loaded) (static design load) (heavily loaded)
Vertical Tire Load ( F,)
Heavy Truck Tire
k typical highway operating range I -
(lightly (rated load) I
(heavily loaded) I loaded) I
Vertical Tire Load ( F,)
Figure 7. Passenger car tire vs truck tire

I n d i r e c t c o n t r a s t t o t h e passenger c a r t i r e i s the heavy t ruck t i r e ,
a l s o seen i n Figure 7 . The corner ing s t i f f n e s s p l o t f o r the heavy t ruck shows
t h a t the t y p i c a l opera t ing range causes i t t o vary nea r ly i n propor t ion t o the
v e r t i c a l load. That i s , a s v e r t i c a l t i r e load i n c r e a s e s , so does the
corner ing s t i f f n e s s and consequently the l a t e r a l t i r e force . Since the
t y p i c a l t ruck t i r e behaves i n t h i s manner, i t s f r i c t i o n f a c t o r s e n s i t i v i t y t o
v e r t i c a l load changes i s l e s s than t h a t of a t y p i c a l passenger c a r t i r e . ( I f
the corner ing s t i f f n e s s increased and decreased a t the same r a t e a s the
v e r t i c a l load , the t i r e would e x h i b i t no change i n i t s f r i c t i o n f a c t o r i n
response t o the accompanying load changes. ) A s a r e s u l t , t he mechanical
p r o p e r t i e s of t h e t ruck t i r e p lay an i n f l u e n t i a l r o l e i n l e s sen ing i t s
s u s c e p t i b i l i t y t o f r i c t i o n f a c t o r v a r i a t i o n s de r iv ing from v e r t i c a l load
changes. Unfor tunate ly , the t y p i c a l heavy t r u c k , un l ike the passenger c a r , i s
saddled wi th a number of o t h e r f e a t u r e s which c o n t r i b u t e adverse ly t o f r i c t i o n
f a c t o r d i s p e r s i o n , thereby o f f s e t t i n g t h i s one advantage.
2 . 2 . 3 Elevated Mass Center
Vehicles charac te r i zed by high c e n t e r s of g r a v i t y , most t y p i c a l l y the
commercial v e h i c l e , a l s o s u f f e r d i sp ropor t iona te ly i n terms of f r i c t i o n f a c t o r
v a r i a t i o n , t h e reason being t h a t h igh center-of-gravity (c.g.) v e h i c l e s
t r a n s f e r more load side-to-side i n a given t u r n than do veh ic les having lower
mass cen te r s . For tuna te ly , f o r many of these veh ic les the reduced load
s e n s i t i v i t y of t h e i r t i r e p r o p e r t i e s , a s d iscussed i n the previous s e c t i o n ,
prevent them from having s i g n i f i c a n t l y h igher f r i c t i o n f a c t o r v a r i a t i o n s .
Never theless , the normal load t r a n s f e r i n commercial v e h i c l e s can be
considerable and does c o n t r i b u t e adverse ly t o a d d i t i o n a l d i spe r s ion i n
f r i c t i o n f a c t o r values.
For o t h e r specia l -case v e h i c l e s f a l l i n g i n an in termedia te c l a s s , such a s
l i g h t t rucks ca r ry ing a high c.g. payload, and which a r e equipped wi th t i r e s
behaving s i m i l a r l y t o passenger c a r t i r e s , the propensi ty f o r d i f f e r i n g
f r i c t i o n f a c t o r s i s s i g n i f i c a n t l y increased. However, the type of veh ic le
most l i k e l y t o e x h i b i t s i g n i f i c a n t f r i c t i o n f a c t o r d i spe r s ion and s t i l l be
r e p r e s e n t a t i v e of a por t ion of the v e h i c l e popula t ion would be one having

mul t ip le a x l e s and an e leva ted c e n t e r of g r a v i t y (e .g . , a cement mixer
equipped wi th a tandem o r t r i - a x l e r e a r suspension).
2 . 3 Methodology
I n o rde r t o address t h e t e c h n i c a l i s s u e s r a i s e d i n t h e preceding s e c t i o n s
from a f i rm foo tho ld , computer-based a n a l y s i s and v e h i c l e t e s t i n g were
combined t o p r e d i c t and measure t h e degree of f r i c t i o n f a c t o r v a r i a t i o n s o r
d i s p e r s i o n l i k e l y t o be exh ib i t ed by t y p i c a l passenger c a r s and commercial
veh ic les . Simple-to-use computer models f o r p r e d i c t i n g s teady tu rn ing
performance were f i r s t developed and t a i l o r e d t o the s p e c i f i c t e c h n i c a l i s s u e s
being addressed. Typical d a t a inpu t required f o r these models a r e curve
r a d i u s , supere leva t ion r a t e , t r a v e l speed, and var ious veh ic le c h a r a c t e r i s t i c s
( t i r e and suspension p r o p e r t i e s , geometry, and weights) . The output c o n s i s t s
of i n d i v i d u a l wheel f r i c t i o n f a c t o r s , the point-mass f r i c t i o n f a c t o r va lue ,
and a d d i t i o n a l v e h i c l e response v a r i a b l e s such a s required s t e e r i n g ang le ,
r o l l ang le , and d r i v e t h r u s t . The model output t h e r e f o r e p r e d i c t s what
f r i c t i o n f a c t o r s and v e h i c l e responses a r e required i n o rde r t o achieve the
tu rn ing cond i t ions s p e c i f i e d a s inpu t t o the program. The programs were
developed t o run on t y p i c a l microcomputers and opera te i n an i n t e r a c t i v e and
simple manner, thereby i n c r e a s i n g t h e i r genera l a v a i l a b i l i t y and encouraging
t h e i r l i k e l y use by p o t e n t i a l use r s .
The second major phase of the p r o j e c t p lan cons i s t ed of t e s t i n g s e v e r a l
v e h i c l e s along s e l e c t e d highway curve s i t e s . A f r o n t wheel d r i v e and r e a r
wheel d r i v e passenger c a r , a s we l l a s a f ive-axle t r a c t o r - s e m i t r a i l e r , were
each t e s t e d under s i m i l a r cond i t ions a long the same highway curves. The
v e h i c l e s s e l e c t e d were considered r e p r e s e n t a t i v e of average veh ic les opera t ing
on the highway system. Data c o l l e c t e d from t h i s a c t i v i t y were then used t o
document t y p i c a l v e h i c l e responses opera t ing along superelevated curves and t o
v a l i d a t e p r e d i c t i o n s from the computer models. I n cases where s i g n i f i c a n t
d i s c r e p a n c i e s were apparent between t e s t r e s u l t s and model p r e d i c t i o n s , the
t e s t d a t a would be used t o c o r r e c t i d e n t i f i a b l e e r r o r s o r d e f i c i e n c i e s i n the
models.

Following the vehicle testing and model validation activity, a
sensitivity analysis was conducted to determine what vehicle parameters,
highway geometric features, and operating conditions have the greatest
influence in modifying friction factor demand. If, for example, a particular
vehicle parameter variation was accompanied by significant variation in
individual wheel friction factors, the highway design engineer may wish to
anticipate the likelihood of this occurring in the vehicle population and
thereby modify current design practice which ignores its influence. In
addition to examining the influence of typical parameter variations, several
special studies were performed to consider the impact of low friction
conditions during steady turning and obstacle avoidance maneuvers. Finally,
an informal error analysis was performed to help determine to what extent
nominal errors in test measurements may contribute to errors in estimates of
friction factors based on these measurements.
2.4 Overview of Model Development
The model development work performed during the project was comprised of
two basic parts. The first part was directed at the development of two
microcomputer-based models used to predict the steady turning performance of
(1) single-unit vehicles (passenger cars, multiple-axle straight trucks, etc.)
and (2) articulated vehicles (tractor-semitrailers, car-trailers, etc.).
These models are intended for studying low level lateral acceleration
conditions as typically encountered during steady turning on most highway
curves. (Chapter 3 and appendices A and B describe and document these models
in greater detail.) The primary advantage of these models over more complex
models which are capable of providing similar information, is their
simplicity. Furthermore, the parametric input and model outputs are
specifically tailored to the analysis of side friction requirements used in
highway curve design.
The second part of the model development work involved modification of an
existing vehicle dynamics simulation (UMTRI "Phase 4" [ 5 ] , normally used to
model heavy trucks and commercial vehicles) to better represent passenger car
behavior. This model was then subsequently used to model transient and
nonlinear dynamic maneuvers performed by automobiles and tractor-semitrailers

along supere leva ted curves. Typical usage would inc lude s i m u l a t i o n of
o b s t a c l e avoidance maneuvers i n which d r i v e r s move from one l a n e t o a n o t h e r ,
o r , braking dur ing curve nego t i a t ion . The use of t h i s type of model, i n
c o n t r a s t t o the s teady- turning microcomputer models, a l lows one t o i d e n t i f y
peak f r i c t i o n demands dur ing t r a n s i e n t o r dynamic maneuvering a s we l l a s
r e p r e s e n t a t i o n of non l inea r opera t ing cond i t ions (e.g., low f r i c t i o n
c o n d i t i o n s i n which t i r e f o r c e s s a t u r a t e ) .
2.5 Overview of Vehicle Tes t ing
The t h r e e v e h i c l e s used i n t h e highway curve t e s t i n g a r e shown i n the
photographs of f i g u r e s 13 through 15 (Chapter 4). Vehicle A ( f i g u r e 13) i s a
compact f ront-wheel-drive passenger c a r weighing 3,200 l b (1,452 kg) i n i t s
t e s t condi t ion. Vehicle B ( f i g u r e 14) i s a midsize rear-wheel-drive passenger
c a r weighing 3,500 l b (1589 kg) i n i t s t e s t cond i t ion . Vehicle C ( f i g u r e 15)
i s a f ive -ax le t r a c t o r - s e m i t r a i l e r having a g r o s s v e h i c l e weight of
approximately 76,000 l b (34,504 kg) when t e s t e d . Each v e h i c l e c a r r i e d two
passengers ( inc lud ing t h e d r i v e r ) , an ins t rumenta t ion package, and an onboard
e l e c t r i c a l genera to r dur ing the highway t e s t s . During each t e s t va r ious
veh ic le reponses were measured and s t o r e d on t ape f o r subsequent d a t a
a n a l y s i s .
Three types of maneuvers were performed f o r each v e h i c l e a t the se lec ted
curve s i t e s . The f i r s t maneuver was simple s teady t u r n i n g i n which the t e s t
d r i v e r drove t h e supere leva ted curve a t a f i x e d speed i n one lane . The second
highway t e s t was an o b s t a c l e avoidance maneuver i n which the d r i v e r , s t a r t i n g
from a s t eady t u r n cond i t ion i n the o u t s i d e t r a v e l l a n e , s t e e r e d t o t h e i n s i d e
t r a v e l l a n e and back aga in , s i m i l a r t o a pass ing maneuver. The t h i r d maneuver
was braking / a c c e l e r a t i n g i n a t u r n and d u p l i c a t e d t h e s t eady tu rn ing
maneuver except t h a t the brakes were app l i ed t o a moderate l e v e l whi le i n t h e
curve causing the v e h i c l e t o slow down. Th i s was then followed immediately by
a per iod of a c c e l e r a t i o n i n which t h e v e h i c l e was brought back up t o i t s
i n i t i a l speed. Each of t h e s e highway maneuvers r epresen t reasonable scenar ios
f o r v e h i c l e s opera t ing along supere leva ted highway curves and, a s such, were
s e l e c t e d a s t h e b a s i s of t h e exper imenta l measurements.

The vehicle tests were performed at three highway curve sites. Each site
was a conventional connector-type ramp containing two traffic lanes in the
direction of travel. Each curve had a 1273 ft ( 3 8 8 m) radius and was
superelevated to either 6.7 percent or 7.0 percent. The posted speed limit
was 55 mph (88 km/h) for all curves. Some additional data was collected at an
exit ramp site having a radius of 230 ft (70 m) and superelevation of 7
percent. The advisory speed limit for the ramp was 25 mph (40 km/h). The
ramp data provided a good alternative benchmark to the other curves, in terms
of speed and radius, to further check and validate the computer models.
2.6 Sensitivity Analysis Overview
Following the vehicle testing and model validation efforts, a sensitivity
analysis was conducted to evaluate typical variations of vehicle and highway
geometric parameters as influences for affecting friction factor levels or
their wheel-to-wheel distribution on a vehicle. A passenger car and a five-
axle tractor-semitrailer were used as baseline vehicles for this study. If a
particular vehicle parameter, such as tire cornering stiffness, was shown to
strongly affect friction factor values and their distribution about a typical
vehicle, the highway design engineer may need to consider its influence in the
present design policy. On the other hand, if typical variations of vehicle
parameters are seen to have little affect upon altering the friction factor
values of a vehicle, the highway engineer can feel confident that nominal
differences in vehicle characteristics normally occurring in the vehicle
population will not significantly affect a highway curve design based upon a
representative vehicle.
In addition to examining parameter variation influences, sensitivity
analyses were also conducted for low friction conditions involving steady
turning and obstacle avoidance maneuvers. The nonlinear model was used to
study minimal surface friction requirements for performing the indicated
maneuvers with a passenger car and five-axle tractor-semitrailer. The primary
purpose was to help determine and compare friction factor variations required
for steady turning maneuvers with those required in performing modest and
representative highway obstacle avoidance maneuevers. Contributions to
friction factor demand beyond that predicted by the point-mass model deriving

from veh ic le c h a r a c t e r i s t i c s and d r i v e r s t e e r i n g behavior were a l s o considered
i n the ana lys i s . F i n a l l y , a s impl i f i ed a n a l y s i s aimed a t determining
r e l a t i o n s h i p s between f r i c t i o n f a c t o r values and veh ic le response v a r i a b l e s i s
discussed from the viewpoint of how measurement e r r o r s can in f luence es t ima tes
of f r i c t i o n f a c t o r values.

Chapter 3
MODEL DEVELOPMENT
3.1 In t roduc t ion t o t h e D i f f e r e n t Models and Their Uses
Three b a s i c model development a c t i v i t i e s occurred dur ing t h i s p ro jec t .
Two of t h e s e models were developed t o p r e d i c t s teady tu rn ing performance of
passenger c a r s and commercial v e h i c l e s and can be implemented on
microcomputers. The microcomputer models a r e intended t o s tudy simple s teady
tu rn ing motion of v e h i c l e s a t low l e v e l s of l a t e r a l a c c e l e r a t i o n normally
encountered along superelevated highway curves. The remaining model
development a c t i v i t y was concerned wi th modifying an e x i s t i n g l a rge - sca le
computer model [ 5 ] t o b e t t e r r ep resen t passenger c a r suspension p r o p e r t i e s .
The l a rge - sca le model i s f a r more comprehensive but l e s s convenient t o use and
i s p r imar i ly intended f o r s imulat ing t r a n s i e n t o r nonl inear v e h i c l e maneuvers,
such a s o b s t a c l e avoidance o r braking i n a turn. The p r i n c i p a l advantage of
both types of models over a point -mass formulat ion l i e s i n t h e i r more
r e a l i s t i c r e p r e s e n t a t i o n of vehicle-highway i n t e r a c t i o n s , which i n t u r n
provides more d e t a i l e d informat ion about v e h i c l e responses and required t i r e
forces .
I f such models become too cumbersome and t h e i r advantages a r e negated by
complicated r u l e s of usage, t h e i r u t i l i t y can be severe ly diminished. The
microcomputer models developed dur ing t h i s p r o j e c t hopeful ly s t r i k e a balance
between model r ea l i sm and s i m p l i c i t y of use. I n any even t , t h e mathematical
d e t a i l s under ly ing t h e microcomputer models developed here have been
thoroughly documented (appendices A and B) such t h a t f u t u r e enhancements o r
t r a n s l a t i o n t o s p e c i f i c machines a r e e a s i l y accomplished.
The remaining s e c t i o n s of t h i s chap te r desc r ibe the s p e c i f i c models and
p resen t sample r e s u l t s of t h e i r usage. I n t e r p r e t a t i o n of t h e i r p r e d i c t i o n s
and recommended r e s t r i c t i o n s concerning t h e i r in tended use conclude the
chapter .

3 . 2 Single-Unit Steady Turning Model
3.2.1 Model Descr ip t ion
The "s ingle-uni t" model i s used t o r epresen t passenger c a r s , s t r a i g h t
t r u c k s , and f u l l t r a i l e r s undergoing s teady tu rn ing motion along superelevated
highway curves of constant radius . One veh ic le body element (sprung mass) and
a s many a s s i x a x l e s (unsprung masses) a r e permitted. Input t o the model i s
i n the form of parametr ic d a t a which desc r ibes the v e h i c l e and t h e highway
geometry. Given a s e t of v e h i c l e c h a r a c t e r i s t i c s (weights and geometric
in fo rmat ion) , a speed of t r a v e l , and the s p e c i f i e d highway geometry (curve
r a d i u s , supere leva t ion , and g rade) , the model c a l c u l a t e s the s e t of t i r e
f o r c e s and s t e e r angle required t o n e g o t i a t e the s p e c i f i e d curve a t the
s p e c i f i e d speed wi th t h a t veh ic le . Basic model output inc ludes the
o r i e n t a t i o n of the v e h i c l e r e l a t i v e t o the road, the required s t e e r angle ,
d r i v e t h r u s t , t i r e f o r c e s , i n d i v i d u a l wheel f r i c t i o n f a c t o r s , and the
corresponding point-mass f r i c t i o n f a c t o r value,
Figures 8 through 10 i l l s t r a t e the b a s i c f e a t u r e s of the s ingle-uni t
model. The v e h i c l e body o r sprung mass element, ms , i s allowed t o move
v e r t i c a l l y and t o r o t a t e i n r o l l , p i t c h , and yaw. The suspension o r unsprung
masses, m and m a r e f i x e d i n height r e l a t i v e t o the road plane. The f r ' v e h i c l e has a body-axis coordinate system (x ,y ,z ) whose o r i g i n i s loca ted a t
(xO,y0,zO) and which t r a n s l a t e s and r o t a t e s with the v e h i c l e body. The x-axis
p o i n t s forward, the y-axis t o the r i g h t , and the z-axis downward. The
i n e r t i a l coordinate system (X,Y,Z) i s f ixed i n space wi th the Z-axis al igned
i n the d i r e c t i o n of the g r a v i t y vector . A l l body motions ( t r a n s l a t i o n and
r o t a t i o n ) a r e expressed a s r e l a t i v e motion between t h e body-axis system
( x , y , z ) and t h e i n e r t i a l coordinate system ( X , Y , Z ) . The o r i g i n s and axes of
the two coordinate systems coincide e x a c t l y i f the veh ic le i s t r a v e l i n g i n a
s t r a i g h t l i n e on a pure ly h o r i z o n t a l road plane (normal t o the g r a v i t y
v e c t o r ) , This cond i t ion can t h e r f o re be viewed a s the "reference condi t ion"
with which t o compare the model c a l c u l a t i o n s f o r t r a v e l along a curve
con ta in ing supere leva t ion and/or grade.

. . . . . . . . . . . . . I : : : : : :
.-) Right Turn
Figure 8. Single-unit model; rear view.
IY Inertial Coordinate System
Figure 9. Single-unit model; plan view,

Figure 10. Single-unit model: side view

For example, f i g u r e 8 (Rear View) shows t h e road su r face supere levated
an amount, e , f o r the v e h i c l e tu rn ing t o the r i g h t . The body of the v e h i c l e
i s seen a s having r o l l e d an amount Ad r e l a t i v e t o the supere lvated road
s u r f a c e , o r an amount d r e l a t i v e t o t h e h o r i z o n t a l p lane (normal t o the
g r a v i t y vec to r ) . By the aforementioned convention, the model c a l c u l a t e s the
angle d which i s the angle between t h e body-fixed coordinate system y-axis and
t h e i n e r t i a l coordinate system Y-axis* The q u a n t i t y i s simply the
d i f f e r e n c e between d and e. (Thus, i f 4 i s ze ro , bd i s equal t o -e.)
Sign conventions f o r displacements and r o t a t i o n s fo l low normal SAE
p r a c t i c e [ 7 ] .
1. A p o s i t i v e z-displacement of t h e body (bounce motion) i s down and toward
the road surface .
2. P o s i t i v e r o l l motion of t h e body i s clockwise when viewed from the r e a r a s
i n f i g u r e 8.
3. P o s i t i v e p i t c h motion of t h e body i s def ined a s "nose up" a s shown i n
f i g u r e 10.
4 . P o s i t i v e supere leva t ion i s def ined a s a road s u r f a c e s lop ing downward t o
the r i g h t a s seen i n f i g u r e 8.
5. P o s i t i v e grade, pr , i s a road s u r f a c e s lop ing upward a s seen i n f i g u r e 10.
The s ing le -un i t model c a l c u l a t e s f o r the s p e c i f i e d s teady tu rn ing
cond i t ion t h e fo l lowing b a s i c q u a n t i t i e s , a l s o seen i n f i g u r e s 8 through 10:
F~~ the required t i r e d r i v e t h r u s t ( f r o n t o r r e a r d r i v e )
P t h e p i t c h angle of the body ( r e l a t i v e t o t h e
re fe rence cond i t ion)
the l a t e r a l s i d e s l i p v e l o c i t y of t h e v e h i c l e sprung mass c e n t e r
the v e r t i c a l bounce motion of t h e body ( r e l a t i v e t o t h e
re fe rence cond i t ion)
d~~ the required s t e e r angle

and
d t h e r o l l angle of the body ( r e l a t i v e t o the re fe rence
cond i t ion)
From t h i s informat ion the necessary l a t e r a l and v e r t i c a l t i r e f o r c e s a r e
then ca lcu la ted . Values f o r the i n d i v i d u a l wheel f r i c t i o n f a c t o r s and the
equ iva len t point-mass value f r i c t i o n f a c t o r conclude the s e t of model
c a l c u l a t i o n s . Addi t ional d e t a i l s on the s ing le -un i t model c a l c u l a t i o n s can be
found i n appendix A.
3.2.2 Parametr ic Input Data
I n o rde r t o perform the c a l c u l a t i o n s i d e n t i f i e d i n t h e previous s e c t i o n ,
c e r t a i n parametr ic inpu t d a t a desc r ib ing the v e h i c l e and the highway geometry
a r e needed. The fol lowing parameters a r e required a s inpu t by the s ingle-uni t
model and over which the model u s e r has d i r e c t c o n t r o l f o r s tudying and
analyzing va r ious types of highway-vehicle i n t e r a c t i o n s . The l i s t i n g of the
parameters i s i n the same o rder a s required by the microcomputer model
(appendix D) :
number of a x l e s on t h e f r o n t suspension ( 1 t o 5 )
number of a x l e s on the r e a r suspension (1 t o 6-nf)
f r o n t t i r e corner ing s t i f f n e s s
r e a r t i r e corner ing s t i f f n e s s
f r o n t suspension s t i f f n e s s
r e a r suspension s t i f f n e s s
v e h i c l e wheelbase
highway supere leva t ion
highway grade
v e h i c l e speed
highway curve rad ius
f r o n t s t a t i c a x l e l o a d ( s )
r e a r s t a t i c ax le l o a d ( s )
he igh t above ground of f r o n t suspension r o l l c e n t e r
he igh t above ground of r e a r suspension r o l l c e n t e r
he igh t above ground of sprung mass c.g.

F f r o n t suspension spread
T~ r e a r suspension spread
TTf f r o n t t i r e t r a c k
TT r r e a r ti re t r a c k
Wf weight of f r o n t unsprung mass
'r weight of r e a r unsprung mass
'r r o l l i n g r e s i s t a n c e percentage
The following aerodynamic parameters a r e op t iona l :
he igh t above ground of the aerodynamic c e n t e r of pressure
d i s t a n c e of aerodynamic c e n t e r of pressure ahead of the body
mass c e n t e r
F ron ta l c ross - sec t iona l a r e a of veh ic le
aerodynamic drag c o e f f i c i e n t
aerodynamic l i f t c o e f f i c i e n t a t trim p i t c h angle ( p = pr )
s lope of aerodynamic l i f t c o e f f i c i e n t with respec t t o p i t c h
s lope of aerodynamic s i d e f o r c e wi th respec t t o r e l a t i v e (wind)
yaw angle
Normally, i n a computer implementation, t h e model u s e r has the op t ion of
reading most of these parameters from pres tored d a t a f i l e s which would con ta in
d e f a u l t va lues based upon v e h i c l e s i z e o r weight ca tegor ies . The remaining
few d a t a i tems assoc ia ted wi th highway geometry and v e h i c l e speed, and l i k e l y
t o be r e g u l a r l y a l t e r e d , would be entered from t h e keyboard i n an i n t e r a c t i v e
fashion. Appendix D con ta ins an informal u s e r ' s manual f o r opera t ing the
Apple 11+ microcomputer implementation of the s ingle-uni t model descr ibed
here.
Numerous examples of the s ingle-uni t model c a l c u l a t i o n s appear
throughout t h i s r e p o r t , p a r t i c u l a r l y i n chap te r s 5 and 6 and a l s o i n appendix
D

3.3 Tractor-Semitrailer Steady Turning Model
3.3.1 Model Description
The tractor-semitrailer steady turning model is very similar in concept
and purpose to the single-unit model described in the previous section. The
tractor-semitrailer model of course contains an additional axle and sprung
mass element (tractor) in addition to an articulation joint which connects the
tractor to the semitrailer. Hence, the model calculates the steady turning
orientation of two sprung mass elements (tractor and semitrailer), the
required articulation angle between the two units, the tractor front wheel
steer angle, and all of the tire forces and associated friction factor values.
The tractor-semitrailer model permits only one axle on the tractor front
suspension but allows the tractor rear suspension and semitrailer suspension
to distribute as many as six axles in any manner.
Figure 11 shows a plan view of the tractor-semitrailer model. The very
same rules concerning variable definitions discussed for the single-unit model
apply equally to the tractor-semitrailer model. In figure 11 the articulation
angle ( angle between the x-axes of the tractor and semitrailer), n , and the tractor front axle steer angle, aFW, are defined. Also seen are the sideslip
velocities, vl and v2, of the tractor and semitrailer units. The model treats
the tractor roll angle as equal to that of the semitrailer.
The single-unit model calculates for the specified steady turning
condition the following basic quantities, identical in definition to those
seen in figures 8 through 10 for the single unit model, and in figure 11 for
the tractor-semitrailer model:
F x ~ the required tractor rear tire drive thrust
p1 the pitch angle of the tractor body ( relative to the reference
condition )
p2 the pitch angle of the semitrailer body ( relative to the
reference condition )

Right Turn
Figure 11. Tractor-semitrailer model:
plan view
Inertial Coordinate System

t h e l a t e r a l s i d e s l i p v e l o c i t y of the t r a c t o r mass c e n t e r
the l a t e r a l s i d e s l i p v e l o c i t y of the s e m i t r a i l e r mass c e n t e r
the v e r t i c a l bounce motion of the t r a c t o r body ( r e l a t i v e t o the
reference cond i t ion)
2 2 t h e v e r t i c a l bounce motion of the s e m i t r a i l e r body ( r e l a t i v e t o
the re fe rence cond i t ion)
b,W t h e required t r a c t o r f r o n t a x l e s t e e r angle
(5 the r o l l angle of the t r a c t o r and the s e m i t r a i l e r bodies
( r e l a t i v e t o the reference cond i t ion)
fi the required a r t i c u l a t i o n angle between the t r a c t o r and
semi t r a i l e r
A s i n the case of the s ing le -un i t model, t h e necessary l a t e r a l and
v e r t i c a l t i r e f o r c e s a r e then determined from t h i s information. Values f o r
the i n d i v i d u a l wheel f r i c t i o n f a c t o r s and the equivalent point-mass f r i c t i o n
f a c t o r value conclude the s e t of model ca lcu la t ions . Addi t ional d e t a i l s on
the t r a c t o r - s e m i t r a i l e r model c a l c u l a t i o n s a r e contained i n appendix B.
3 . 3 . 2 Parametric Input Data
The following l i s t of parameters, s i m i l a r t o those seen i n the s ing le -
u n i t model, a r e required a s inpu t t o the t r a c t o r - s e m i t r a i l e r model. The
l i s t i n g of t h e parameters i s i n t h e same o rder a s required by the
microcomputer model (appendix D) :

number of t r a c t o r r e a r a x l e s
number of s e m i t r a i l e r r e a r a x l e s
t r a c t o r f r o n t t i r e corner ing s t i f f n e s s
t r a c t o r r e a r t i r e corner ing s t i f f n e s s
s e m i t r a i l e r r e a r corner ing s t i f f n e s s
t r a c t o r f r o n t suspension s t i f f n e s s
t r a c t o r r e a r suspension s t i f f n e s s e s
s e m i t r a i l e r suspension s t i f f n e s s e s
f o r e / a f t tandem a x l e spread on t r a c t o r
f ore /af t tandem ax le spread on s e m i t r a i l e r
t r a c t o r wheelbase
s e m i t r a i l e r wheelbase
highway superelevat ion
highway grade
veh ic le speed
highway curve r a d i u s
t r a c t o r and s e m i t r a i l e r s t a t i c ax le loads
weight of t r a c t o r body
he igh t above ground of t r a c t o r f r o n t suspension r o l l c e n t e r
he igh t above ground of t r a c t o r r e a r suspension r o l l c e n t e r
height above ground of s e m i t r a i l e r suspension r o l l c e n t e r
height above ground of t r a c t o r body mass c e n t e r
height above ground of s e m i t r a i l e r sprung mass c.g.
F i f t h wheel height above ground
Trac to r frame height above ground
t r a c t o r and s e m i t r a i l e r suspension spreads
t r a c t o r and s e m i t r a i l e r t i r e t r a c k widths
weight of a x l e s
r o l l i n g r e s i s t a n c e percentage

The following aerodynamic parameters are optional:
h~ height above ground of the aerodynamic center of pressure
X A distance of semitrailer aerodynamic center of pressure ahead
of the semitrailer mass center
AF frontal cross-sectional area of vehicle
C D aerodynamic drag coefficient of the combination vehicle
CLO aerodynamic lift coefficient at trim pitch angle (p = pr)
L slope of aerodynamic lift coefficient with respect to pitch
S Y slope of aerodynamic side force with respect to relative (wind)
yaw angle
The additional number of parameters required for the tractor - semitrailer model are of course due to the increased number of units and
possible axles. As in the case of the single-unit model, any computer
implemenation of the tractor-semitrailer model would presumably store standard
sets of these numerical values in data files associated with different vehicle
types. Only those parameters routinely changed as part of some study or
analysis would then be required as keyboard entry items. Appendix D contains
instructions for operating the Apple 11+ microcomputer implementation of the
tractor-semitrailer model developed under this project. It is similar in
concept and description to that outlined above.
3.4 Modifications to the Comprehensive Braking and Steering Model
As part of the model development activity, an existing large-scale
computer simulation [ 5 ] primarily used for modeling commercial vehicles was
modified to include independent wheel suspensions. This additional feature
was added to this model so that improved simulation of passenger car behavior
could be conducted within the project work. Frequently referred to as the
"Phase 4" model, it was primarily intended for use in this project for
simulating obstacle avoidance maneuvers along superelvated curves wherein a
driver model steers the vehicle from one lane to another along a prescribed
path. The other type of maneuver for which the Phase 4 model was employed was
in simulating braking / accelerating maneuvers also along superelevated curves. The principal difference between the Phase 4 model and those
descr ibed i n the previous two s e c t i o n s i s t h a t the Phase 4 model i s a dynamic
model capable of r ep resen t ing time-varying and/or nonl inear v e h i c l e l d r i v e r
responses. The s teady tu rn ing models a r e -9 s t a t i c f ixed s t e e r , constant
v e l o c i t y models intended f o r low l e v e l l a t e r a l a c c e l e r a t i o n opera t ing
condi t ions . The Phase 4 model of course can be used t o s imulate the same
s teady tu rn ing performance under low a c c e l e r a t i o n condi t ions . However, un less
some s p e c i a l n o n l i n e a r i t y o r o t h e r f e a t u r e f o r which the s teady tu rn ing models
a r e not app l i cab le i s needed, the s teady tu rn ing models w i l l provide much the
same informat ion a s the Phase 4 model, but a t a considerably lower l e v e l of
u s e r e f f o r t and computer hardware.
The primary re fe rence f o r t h e Phase 4 model i s i t s u s e r ' s manual [ 51 .
The m a t e r i a l contained he re and i n appendix C supplement t h e Phase 4 u s e r ' s
manual by documenting the independent suspension op t ion added dur ing the
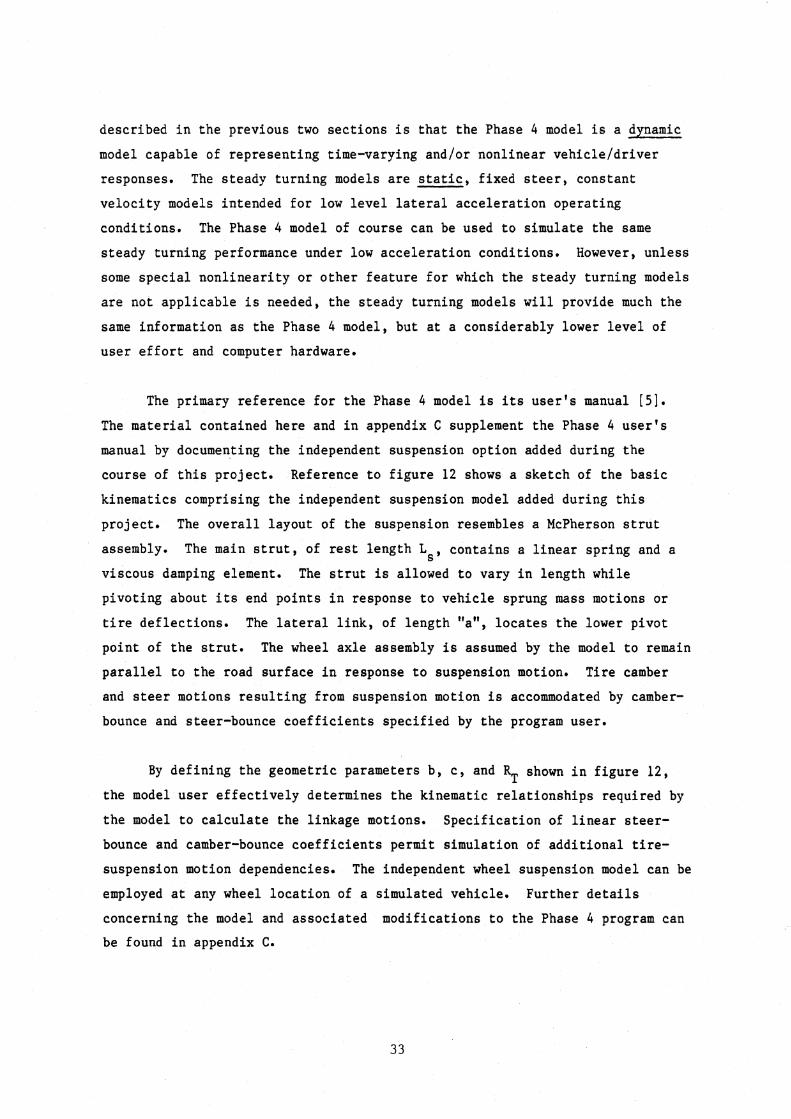
course of t h i s p ro jec t . Reference t o f i g u r e 1 2 shows a sketch of the b a s i c
k inemat ics comprising t h e independent suspension model added dur ing t h i s
p ro jec t . The o v e r a l l l ayou t of the suspension resembles a McPherson s t r u t
assembly. The main s t r u t , of r e s t l eng th Ls, con ta ins a l i n e a r sp r ing and a
v iscous damping element. The s t r u t i s allowed t o vary i n l eng th while
p ivo t ing about i t s end p o i n t s i n response t o veh ic le sprung mass motions or
t i r e d e f l e c t i o n s . The l a t e r a l l i n k , of l eng th "a", l o c a t e s the lower p ivot
po in t of t h e s t r u t . The wheel ax le assembly i s assumed by the model t o remain
p a r a l l e l t o t h e road su r face i n response t o suspension motion. T i r e camber
and s t e e r motions r e s u l t i n g from suspension motion i s accommodated by camber-
bounce and steer-bounce c o e f f i c i e n t s s p e c i f i e d by the program user .
By d e f i n i n g the geometric parameters b , c , and RT shown i n f i g u r e 1 2 ,
the model use r e f f e c t i v e l y determines t h e kinematic r e l a t i o n s h i p s required by
t h e model t o c a l c u l a t e the l inkage motions. S p e c i f i c a t i o n of l i n e a r s t e e r -
bounce and camber-bounce c o e f f i c i e n t s permit s imulat ion of a d d i t i o n a l t i r e -
suspension motion dependencies. The independent wheel suspension model can be
employed a t any wheel l o c a t i o n of a simulated vehic le . Fur ther d e t a i l s
concerning the model and assoc ia ted modif ica t ions t o the Phase 4 program can
be found i n appendix C.

End View
Input Parameters: -
b tire track dimension c spacing of upper strut pivot R static trre radius
steer-bounce coefficient .-camber-bounce coefficient
Figure 12. Independent suspension model (Phase 4)

The suspension model descr ibed here was used t o s imulate the independent
suspension c h a r a c t e r i s t i c s f o r passenger c a r v e h i c l e s t e s t e d and analyzed
w i t h i n the p r o j e c t . The a d d i t i o n of t h i s suspension f e a t u r e permitted the
a n a l y s i s of both passenger c a r s and commercial v e h i c l e s w i t h i n the context of
one v e h i c l e dynamics program. Frequently when two d i f f e r e n t v e h i c l e models
a r e employed t o compare r e s u l t s about s i m i l a r v e h i c l e dynamics problems, small
d i f f e r e n c e s i n t h e models themselves can i n t e r f e r e wi th t h e i n t e r p r e t a t i o n of
r e s u l t s , p a r t i c u l a r l y when the d i f f e r e n c e s i n r e s u l t s might happen t o be
r e l a t i v e l y small. Furthermore, swi tching from one v e h i c l e type t o another
dur ing a s imulat ion e x e r c i s e i s more convenient and l e s s prone t o e r r o r wi th
one model s i n c e the p ro toco l regarding parameter modif ica t ions i s more
s tandardized.
3.5 Model Appl ica t ions and Recommended Usage
Computer models a r e o f t e n developed f o r s p e c i f i c purposes and a s such
a r e earmarked f o r some r e s t r i c t e d range of opera t ing cond i t ions o r s e t of
a p p l i c a b l e r u l e s of usage. I n some cases these r e s t r i c t i o n s a r e i m p l i c i t and
not c l e a r l y defined. The m a t e r i a l i n t h i s s e c t i o n i s in tended t o help guide a
p o t e n t i a l u s e r of the models and computer programs developed under t h i s
p r o j e c t t o b e t t e r e s t ima te the range of a p p l i c a b i l i t y of t h e d i f f e r e n t models.
3.5.1 Single-Unit Steady Turning Model A p p l i c a b i l i t y
The fol lowing l i s t of opera t ing cond i t ions should be s a t i s f i e d when
us ing t h e s i m p l i f i e d s ing le -un i t model t o s tudy passenger c a r s o r s i m i l a r
vehic les .
* Constant v e l o c i t y , cons tan t r a d i u s , f i x e d s t e e r tu rn ing maneuvers
* Superelevat ion r a t e s l e s s than 15 percent
* Grades l e s s than 15 percent
* Vehicle speeds g r e a t e r than 10 mph (16 km/h)
* F r i c t i o n f a c t o r va lues l e s s than 0.30 * Moderate o r h igh t i r e l r o a d su r face f r i c t i o n l e v e l s
(peak f r i c t i o n > 0.40)
* Presumption of simple l i n e a r v e h i c l e c h a r a c t e r i s t i c s

Noncompliance wi th these recommended opera t ing cond i t ions can r e s u l t i n
model p r e d i c t i o n s t h a t a r e l e s s r e l i a b l e and i n some cases meaningless.
Use of the s ing le -un i t model t o s tudy commercial v e h i c l e s such a s
s t r a i g h t t rucks o r f u l l t r a i l e r s should fol low the recommendations p e r t a i n i n g
t o the t r a c t o r - s e m i t r a i l e r model i n the fo l lowing sec t ion .
3.5.2 Trac to r -Semi t ra i l e r Steady Turning Model A p p l i c a b i l i t y
The s i m p l i f i e d t r a c t o r - s e m i t r a i l e r model should observe the same usage
r e s t r i c t i o n s a s the s ing le -un i t model noted above, except f o r the maximum
f r i c t i o n f a c t o r recommendation. Since the f r i c t i o n f a c t o r r e p r e s e n t s the
road-plane l a t e r a l a c c e l e r a t i o n demand required of the v e h i c l e , i t a l s o
r e f l e c t s , i n more o r l e s s d i r e c t p ropor t ion , the amount of side-to-side load
t r a n s f e r occurr ing ac ross the v e h i c l e suspensions. A s noted i n s e c t i o n 2.2.2,
s i g n i f i c a n t v e r t i c a l load changes i n t ruck t i r e s cannot be t r e a t e d i n q u i t e
the same manner a s passenger c a r t i r e s . That i s , un less t h e f r i c t i o n f a c t o r
va lues a r e l e s s than about 0.10, the assumption t h a t t i r e corner ing
s t i f f n e s s e s a r e nea r ly cons tan t begins t o l o s e v a l i d i t y . Since most
commercial v e h i c l e s can have a wide range of mass c e n t e r h e i g h t s which,
toge the r with l a t e r a l a c c e l e r a t i o n , a r e the p r i n c i p a l determinants of side-to-
s i d e load t r a n s f e r , t h e model u s e r should r e s t r i c t t h e range of f r i c t i o n
f a c t o r a p p l i c a b i l i t y when s tudying commercial v e h i c l e s wi th e leva ted mass
cen te r s . I n genera l , i f a f u l l y loaded commercial v e h i c l e i s being s t u d i e d ,
the maximum f r i c t i o n f a c t o r should probably not exceed 0.20 t o 0.25 depending
upon the c.g. height . Most empty commercial v e h i c l e s can be s tud ied up t o
maximum f r i c t i o n f a c t o r values of 0.30.
The t r a c t o r - s e m i t r a i l e r model con ta ins an op t ion f o r r ep resen t ing t i r e
corner ing s t i f f n e s s a s a func t ion of v e r t i c a l load f o r cases i n which accura te
t i r e load s e n s i t i v i t y i s important . Normally t h i s should be employed f o r
commercial v e h i c l e s exper iencing f r i c t i o n f a c t o r va lues above 0.15 . Constant
corner ing s t i f f n e s s va lues f o r commercial v e h i c l e s can of course be used, but
i f s o , the indkvidual wheel f r i c t i o n f a c t o r va lues p red ic ted by the model w i l l

d i s p l a y s l i g h t l y g r e a t e r d i s p e r s i o n than should normally occur , due t o the
a £ orementioned corner ing s t i f f n e s s p r o p e r t i e s of t y p i c a l t ruck t i r e s .
3.5.3 Phase 4 Model A p p l i c a b i l i t y
The Phase 4 model i s f a r l e s s r e s t r i c t e d i n i t s range of opera t ing
cond i t ions than the s teady tu rn ing models. The primary l i m i t a t i o n s f o r t h i s
model a r e noted below:
* Vehicle r o l l ang les l e s s than 15 degrees (0.25 rad)
* Vehicle p i t c h ang les l e s s than 15 degrees (0.25 rad)
* Vehicle speeds g r e a t e r than 3 mph (5 km/h)
The p r i n c i p a l reasons f o r the r o l l and p i t c h angle r e s t r i c t i o n s a r e due
t o "small angle" assumptions i n t h e Phase 4 model f o r these motion va r i ab les .
In g e n e r a l , t h i s a l s o impl ies r e s t r i c t i o n s f o r highway supere leva t ion and
grade equal t o those i d e n t i f i e d f o r the s teady turning models (< 15 percent) .
The low speed r e s t r i c t i o n does not apply t o braking maneuvers so much a s i t
does f o r very low speed tu rn ing maneuvers. A t very low speed, t h e l a t e r a l
t i r e fo rce c a l c u l a t i o n s a r e a l t e r e d t o avoid low speed computational
d i f f i c u l t i e s and thereby become l e s s accura te i n t h i s speed range.
F i n a l l y , i t should be noted t h a t following the development of t h e
steady-turning models, s e v e r a l d i f f e r e n t comparisons under i d e n t i c a l opera t ing
cond i t ions were performed between the steady-turning models and the Phase 4
model. I n a l l c a s e s , t h e p red ic ted v e h i c l e responses of both models agreed
wi th in d i f f e r e n c e s of l e s s than 1 percent. Comparisons were made f o r
supere levated and nonsuperelevated curves , a s wel l a s f o r s t r a i g h t
supere levated tangents ( i n f i n i t e r ad ius case f o r the s impl i f i ed models). A
passenger c a r and a three-axle t r a c t o r - s e m i t r a i l e r were used a s comparison
veh ic les i n t h i s exe rc i se . I n s h o r t , the s teady tu rn ing models developed
during t h i s p r o j e c t a r e viewed a s accura te p r e d i c t o r s of s teady s t a t e veh ic le
tu rn ing performance when used wi thin t h e intended range of a p p l i c a t i o n s c i t e d
e a r l i e r .

Chapter 4
VEHICLE TESTING
This chap te r p resen t s a d e s c r i p t i o n of the f u l l s c a l e veh ic le t e s t i n g
which took p a r t dur ing the p ro jec t . Two s tandard 1984 passenger c a r s and a
f ive-axle t r a c t o r - s e m i t r a i l e r were used i n the t e s t program. The major i ty of
t e s t s were conducted along AASHTO h o r i z o n t a l curves a t speeds near the posted
l i m i t . Data c o l l e c t e d from the t e s t i n g were used t o v a l i d a t e the computer
models developed dur ing t h e course of the p r o j e c t research. The d a t a
c o l l e c t e d a l s o se rve a s a u s e f u l resource f o r cu r ren t and f u t u r e resea rch
programs.
The chap te r begins wi th a d e s c r i p t i o n of t h e t e s t v e h i c l e s , the curve
s i t e s , and v e h i c l e t e s t maneuvers performed. A d e s c r i p t i o n of the t e s t
measurements and the d a t a a c q u i s t i o n system follows. Example t e s t r e s u l t s a r e
then presented f o r each vehic le . A genera l d i scuss ion of the t e s t r e s u l t s
concludes the chapter .
4.1 Test Vehicle Descr ip t ions
Figures 13 through 15 show photographs of the th ree t e s t veh ic les
l a b e l l e d here a s v e h i c l e s A, B , and C , r e spec t ive ly . Vehicle A i s a standard
1984 f r o n t wheel d r i v e four-door passenger c a r , and veh ic le B i s a 1984 two
door r e a r wheel d r i v e passenger car . Vehicle C i s a f ive-axle t r a c t o r - s e m i t r a i l e r c o n s i s t i n g of a 142 inch (3.6 m) wheelbase COE t r a c t o r and a 45 f t
(13.7 m) van s e m i t r a i l e r . Table 1 l i s ts b a s i c parameters and f e a t u r e s
desc r ib ing each of t h e th ree t e s t vehic les .


Table 1. Test v e h i c l e d e s c r i p t i o n s
Passenger Car A:
Wheelbase 100.3 "
Front a x l e load (2 passengers & ins t rumenta t ion) 1800 l b
Rear a x l e load 1400 l b
Estimated c.g. he igh t above ground 25 " Front t i r e t r a c k 57 "
Rear t i r e t r a c k 57 " Front wheel d r i v e
Passenger Car B:
Wheelbase 105.6 I'
Front a x l e load (2 passengers & ins t rumenta t ion) 1925 l b
Rear a x l e load 1675 l b
Estimated c.g. height above ground 25 " Front t i r e t r a c k 57 "
Rear t i r e t r a c k 57 "
Rear wheel d r i v e
5-Axle Tractor-Semit ra i ler C:
T rac to r wheelbase
S e m i t r a i l e r wheelbase
Trac to r f r o n t a x l e load
Trac to r r e a r a x l e loads (each)
S e m i t r a i l e r a x l e loads (each)
Trac to r c. g. he igh t above ground
S e m i t r a i l e r c.g. he igh t above ground
Trac to r f r o n t t i r e t r a c k
Trac to r r e a r t i r e t r a c k
S e m i t r a i l e r r e a r t i r e t r a c k
142 I'
410 " 10,300 l b
15,700 l b
16,900 l b
44 " (body + payload) 70 "
81 I'
73 "
73 "
1 inch = 25.4 mm
1 pound = 0.454 kg

4.2 Hor izonta l Curve S i t e Descr ip t ions
Three hor izon ta l curves i n t h e v i c i n i t y of Ann Arbor, Michigan were
se lec ted a s s i t e s a t which t o perform the veh ic le measurements. Each of these
s i t e s was a conventional connector-type ramp having two t r a f f i c l anes i n the
d i r e c t i o n of t r a v e l and a posted speed l i m i t of 55 mph (88 km/h). Figures 16
and 17 i l l u s t r a t e each of t h e curves l abe led a s 1, 2, and 3 , r e spec t ive ly ,
Table 2 l i s t s the geometric d a t a desc r ib ing each curve and i s based upon
topographic survey maps obtained from the Michigan Department of
Transpor ta t ion.
I n a d d i t i o n t o t h e t h r e e curve s i t e s 1 t o 3 , d a t a was a l s o c o l l e c t e d on
a s tandard clover-leaf e x i t ramp having a r ad ius of 230 f t (70 m) and
supere leva t ion r a t e of 6 percent t o 7 percent. (F ie ld measurements performed
by the Michigan Department of Transpor ta t ion during the t e s t program
determined t h a t the e x i t ramp supere leva t ion r a t e was mi ldly v a r i a b l e i n t h i s
range and p r imar i ly a t t r i b u t a b l e t o s e v e r a l r e su r fac ing e f f o r t s s i n c e i t s
i n i t i a l cons t ruc t ion . ) The e x i t ramp, labeled a s s i t e 4 , was p r imar i ly used
t o provide an a l t e r n a t i v e s e t of speed and rad ius cond i t ions t o f u r t h e r check
and v a l i d a t e t h e computer models. I t s b a s i c geometric d a t a a r e a l s o shown i n
t a b l e 2 . A sketch of the ramp is shown i n f i g u r e 17.
Table 2. Summary of curve s i t e geometry
Curve S i t e Radius Curvature Superelevation Length - Grade
# ( f t ) (deg ( X > ( f t ) ( % >
2 1273 4 30' 7 0 1785 +0.3 t o -1.9
3 1273 4 30' 6,7 1826 +1.0 t o -1.2
4 (ramp) 230.7 24 50' 6.0 t o 7.0 1087 0.0 t o -2.0
1 f t = 0.305 m

posted speed = 55 mph
North
Curve s i t e 1
Curve s i t e 2. Figure 16 . Curve s i t e d e s c r i p t i o n s .

posted speed = 55 mph
North
Curve s i t e 3.
= 25 rnph
Curve s i te 4 (ramp). F i g u r e 17. Curve s i t e d e s c r i p t i o n s .

4.3 Test Measurements and Data Acquisition
Sixteen channels of data were collected for the tractor-semitrailer test
vehicle and ten channels of data for each of the passenger cars. Tables 3 and
4 list the type of data measured for each vehicle.
Table 3 . Tractor-semitrailer measurements
Channel fl Measurement
Time
Vehicle Speed
Trailer Lateral Accel
Trailer Long Accel
Trailer Yaw Rate
Trailer Roll Angle
Trailer Pitch Angle
Steering Wheel Angle
Left Front Steer Angle
Right Front Steer Angle
Articulation Angle
Wheel Rotation
Wheel Load A
Wheel Load B
Trolley Angle
Tractor Yaw Rate
Units - Symbol
seconds
mph
g's
g's
deg/sec
degrees
degrees
degrees
degrees
degrees
degrees
degrees
pounds
pounds
degrees
deg/sec
t
V
ay 2 ax2
r2
d2
8
dsw
dfwl
dfwr
Gam --- A
B
Trolley
r

Table 4. Passenger car measurements
Channel 4' Measurement Units
Time
Vehicle Speed
Lateral Acceleration
Longitud Acceleration
Yaw Rate
Roll Angle
Pitch Angle
Steering Wheel Angle
Left Front Wheel Angle
Trolley Angle
seconds
mph
g's
g's
deglsec
degrees
degrees
degrees
degrees
degrees
Symbol
t or T
v AY
Ax
r
d 8
dsw
dfw
Trolley
Data channels 3 to 7 were part of a stable platform measurement system
which was located at the approximate center of gravity of the semitrailer and
each passenger car. A conventional fifth wheel, as seen in figure 18, was
used for the measurement of vehicle speed (channel 2). Linear potentiometers
were used for all front wheel angle measurements; a rotary potentiometer was
used for the measurement of steering wheel angle. A "string" potentiometer
was used for measuring tractor-semitrailer articulation angle. Channels 12-14
for the tractor-semitrailer were measurements from the FHWA (Maritime
Dynamics) Wheel Load Transducer 191 located at the right and rearmost wheel
position of the semitrailer. Trolley Angle measurements for vehicle sideslip
were made with the FHWA (MIRA) sideslip / roll trolley 181. See figure 18.
Tractor yaw rate, supplementing the trailer yaw rate measurement, was measured
using a rate gyro mounted on the tractor frame rails. The yaw rate and
vehicle speed measurements were used to estimate path curvature during steady
turning conditions. The complete digital data acquisition system was located
in the tractor cab and rear seats of each passeneger car during the tests.
Other instrumentation is seen in figure 19.

F i g u r e 18. Trolley and fifth-wheel instrumentation.
48

Figure 19. Instrumentation and data acquisition console.
4 9

The measured values of r o l l angle o r predic ted values from the models
seen throughout t h i s r epor t a r e a l l r e l a t i v e t o the t r u e v e r t i c a l ( g r a v i t y
vector) . Also l a t e r a l a c c e l e r a t i o n values measured and predic ted a r e those
occurr ing i n the hor izon ta l plane, Hence, point-mass f r i c t i o n f a c t o r s a r e
obtained by s u b t r a c t i n g the roadway supere leva t ion from the l a t e r a l
a c c e l e r a t i o n value (expressed i n g ' s ) .
I n a d d i t i o n t o these vehicle-based measurements which occurred during
highway t e s t i n g , l abora to ry measurements of t i r e c h a r a c t e r i s t i c s were a l s o
conducted. A sample t i r e from each suspension of each t e s t veh ic le ( four
passenger c a r t i r e s ; th ree t ruck t i r e s ) was s e l e c t e d f o r t e s t i n g t o measure
l a t e r a l t i r e f o r c e p r o p e r t i e s a s a func t ion of t i r e s l i p angle and v e r t i c a l
load. These d a t a were l a t e r used i n the computer models dur ing the model
v a l i d a t i o n a c t i v i t y . The l abora to ry t i r e t e s t s were performed on the UMTRI
f l a t bed t i r e t e s t machine. Each t i r e was t e s t e d a t s l i p angles of -1, 0 , +1,
+2, and +4 degrees. V e r t i c a l t i r e loads above, below, and equal t o the
expected opera t ing load dur ing highway t e s t i n g were used i n the l abora to ry
measurements. T i r e corner ing s t i f f n e s s values used by t h e s teady tu rn ing
models were c a l c u l a t e d from the average of the +1 and -1 degree l a t e r a l t i r e
f o r c e measurements. Appendix E con ta ins the complete s e t of l abora to ry t i r e
measurements,
S tee r ing system t e s t s were a l s o conducted on t h e t r a c t o r t e s t vehicle.
Since commercial v e h i c l e s t e e r i n g system p r o p e r t i e s a r e o f t e n l e s s we l l
behaved than passenger c a r systems and f requen t ly conta in s i g n i f i c a n t l e v e l s
of h y s t e r e s i s , l abora to ry t e s t s were performed on t h i s v e h i c l e t o ga the r b a s i c
informat ion on s t e e r i n g g a i n and h y s t e r e s i s . The s t e e r i n g wheel - f r o n t wheel
measurements were c o l l e c t e d t o supplement f r o n t wheel measurements i n the
event t r ansducer problems occurred dur ing t h e v e h i c l e t e s t s . The s t e e r i n g
system t e s t s were conducted wi th the a x l e loaded normally and a l s o wi th no
load appl ied . The measurements, seen i n appendix E , show t h a t t y p i c a l l e v e l s
of h y s t e r e s i s (40 degrees of dead zone a t the s t e e r i n g wheel) d id e x i s t i n the
s t e e r i n g system of the t r a c t o r . The n e t r e s u l t i s t h a t measurements of d r i v e r
s t e e r i n g wheel movements dur ing highway t e s t s w i l l u sua l ly be more a c t i v e
than, and l e s s we l l c o r r e l a t e d wi th , t h e corresponding f r o n t wheel angle
measurements.

L a s t l y , t h e veh ic le measurement time h i s t o r i e s presented wi th in the
repor t a r e i n an "as i s " s t a t e . That i s , except f o r simple averaging
c a l c u l a t i o n s and removal of s i g n a l o f f s e t s , no at tempt was made t o "massage"
the data . In genera l , most of the veh ic le measurement d a t a c o l l e c t e d during
the t e s t program a r e of good qua l i ty . Weaknesses e x i s t here and t h e r e due t o
s l i g h t ga in and o f f s e t e r r o r s , but o v e r a l l , the measurements a r e viewed a s
r e l i a b l e and worth preserving f o r f u t u r e reference.
4.4 Vehicle Test Maneuvers
Three types of veh ic le t e s t s were conducted f o r each veh ic le a t the
t h r e e supere levated highway curve s i t e s . The f i r s t t e s t was simple steady
tu rn ing i n which t h e t e s t d r i v e r was asked t o fo l low the curve i n a normal and
smooth fashion. Data c o l l e c t i o n was i n i t i a t e d j u s t p r i o r t o e n t e r i n g the
curve, u s u a l l y on a s t r a i g h t tangent having small and somewhat v a r i a b l e cross-
slope. Data c o l l e c t i o n was completed 25 t o 40 seconds l a t e r , depending on the
curve and t e s t v e h i c l e ( t r a c t o r - s e m i t r a i l e r maximum times were l imi ted t o 25
seconds because of the a d d i t i o n a l number of da ta channels being recorded).
Normally, s t ra ight- running "zero c a l i b r a t i o n " d a t a was a l s o c o l l e c t e d 1 t o 2
miles (1.6 t o 3 . 2 km) p r i o r t o and/or a f t e r each curve s i t e i n o rde r t o help
i d e n t i f y t ransducer zero o f f s e t readings f o r use i n the subsequent d a t a
processing. The s t a b l e p la t form e r e c t i o n system was a l s o d i sab led p r i o r t o
each t e s t t o prevent c e n t r i p e t a l a c c e l e r a t i o n dur ing tu rn ing from in f luenc ing
the e r e c t i o n system es t ima te of the t r u e v e r t i c a l .
The second v e h i c l e t e s t maneuver was an o b s t a c l e avoidance, o r "double
l a n e change" maneuver, a l s o performed along each curve. The d r i v e r f i r s t
en te red the curve and reached a s teady turning condit ion. Af te r severa l
seconds, the v e h i c l e was s t e e r e d i n t o the adjoining l ane and then back i n t o
the i n i t i a l t r a v e l lane . The i n t e n t was t o s imulate movement around an
o b s t a c l e r e s t i n g i n the i n i t i a l t r a v e l lane. The r a p i d i t y of movement from
one l a n e t o another was casua l t o moderate. Emergency o r panic-l ike movements
were not performed. The o b s t a c l e avoidance maneuevers were performed s t a r t i n g
from the o u t s i d e t r a v e l l ane a s wel l a s from the i n s i d e t r a v e l lane.

The l a s t v e h i c l e t e s t was braking / a c c e l e r a t i n g i n a turn. Again, the
t e s t d r i v e r en te red the curve and reached a s teady turning condi t ion. Braking
was then appl ied t o d e c e l e r a t e the veh ic le down t o a speed of about 20 t o 30
mph (32 t o 48 km/h) (braking t o a complete r e s t was not poss ib le f o r reasons
of s a f e t y and t r a f f i c i n t e r r u p t i o n ) . The v e h i c l e was then acce le ra ted back up
t o normal speed. The l e v e l of braking was u s u a l l y l i g h t t o moderate and
t y p i c a l l y i n t h e v i c i n i t y of 0.3 g ' s of dece le ra t ion .
4.5 Example Steady Turning Test Resu l t s
Figure 20 shows a s e t of s teady tu rn ing response measurements c o l l e c t e d
dur ing a t y p i c a l t e s t . The d a t a seen i n f i g u r e 20 correspond t o passenger c a r
A and curve s i t e 1. The time h i s t o r i e s seen he re include each of the
measurements l i s t e d i n t a b l e 4. During a t e s t , each measurement was d i g i t i z e d
a t a r a t e of 40 Hz and s to red on a high d e n s i t y c a r t r i d g e tape f o r subsequent
d a t a process ing and p l o t t i n g . The time h i s t o r i e s seen he re a r e 8-Hz
(subsampled) p l o t s of the d i g i t i z e d d a t a and have had zero o f f s e t s removed
based on s t r a i g h t running "zero c a l i b r a t i o n " data. The numerical values shown
on the r i g h t hand s i d e of some of these p l o t s a r e average va lues of the time
h i s t o r y v a r i a b l e s f o r the 15-second i n t e r v a l s t a r t i n g a t the 10-second mark.
The average value readings were t y p i c a l l y used t o de f ine and compare the t e s t
d a t a wi th p r e d i c t i o n s from the s teady tu rn ing models. S imi la r s e t s of d a t a
f o r t h i s v e h i c l e and the o t h e r two t e s t v e h i c l e s a r e contained i n appendix E.
Summary p l o t s of the s t eady tu rn ing d a t a a r e presented i n chap te r 5 where
comparisons between t h e measurements and model p r e d i c t i o n s a r e presented.
I n a d d i t i o n t o the s tandard s e t of v e h i c l e response measurements
performed dur ing these t e s t s , measurement of v e r t i c a l load a t a s i n g l e wheel
l o c a t i o n on the s e m i t r a i l e r t e s t v e h i c l e was a l s o at tempted a s p a r t of the
s teady tu rn ing t e s t s . Figure 21 shows two sample v e r t i c a l load measurements
processed from the FHWA wheel load c e l l . Figure 21 r epresen t s time h i s t o r y
playbacks of the peak va lues of t h e load c e l l channel B s i g n a l (following
forward and inverse Four ier t ransformat ion t o inc rease the time domain
r e s o l u t i o n and accuracy of the peak values) . The degree of load t r a n s f e r seen
i n the c h a r t s of f i g u r e 21 i s s l i g h t l y i n f l a t e d because of load c e l l c ross-
t a l k between v e r t i c a l and l a t e r a l load. Using the load c e l l manufacturer 's

6 0
50
40
50 Ave: Speed 56.7 (mph) 20
10
I 5 10 15 20 2 5 30
Figure 20. Example steady turning t e s t r e s u l t ; veh ic le A .

1
0
- 1
- 2 Ave: v aw - 3 -3.73 Rate (deg/s) -4
-5 -4
0 5 10 2 0
-2.1 Angle (deg)
-2.8
1.5
1
.5 Pi tch Angle 0 (dee)
-3
- 1
- 1.5 0 5 10 2 0 2 5
Figure 20 (cont)

. I
0
-. 1
Left -.2 Front Elheel .,3 Angle (deg) -.4
-.5 -.6
2
1.6
1.2
'Itolley Angle (ded .4
0
-.4
-.8
Figure 20 (cont)

140
n 120 03 P 5 100 0 - 600 \
u Ave: g A ?18 16 - -00 .- cr L a 200 >
(:I o 60 12 o 1 eo 240 J 200 Y 360
Wheel Revolut ions x 2
Ver t i ca l Wheel Load Measurement ( p r i o r t o l oad c e l l c ross- ta lk c o r r e c t i o n ) S e m i t r a i l e r Rearmast Outside Wheel-Set Curve # 1 / Repeat 2 / 45.5 mph
Wheel Revolut ions x 2
Ver t i ca l Wheel Load Measurement (prior t o l oad c e l l c ross- ta lk c o r r e c t i o n ) S e m i t r a i l e r Rear most Outside Wheel-Set Curve #3 / Repeat 1 / 57.5 mph
Figure 21. Sample vertical load measurements

recommended c r o s s t a l k c o r r e c t i o n t o t h e v e r t i c a l load r e s u l t s i n 3 percent t o
6 percent lower readings i n these d a t a during normal cornering.
Figure 22 presen t s the completely processed v e r t i c a l load measurements
seen i n Figure 21 along wi th corresponding model p red ic t ions i n a r a t i o e d
form. The y-axis i s simply the r a t i o of the measured ( o r p red ic ted) wheel
load when opera t ing i n the curve t o an i n i t i a l ( o r s t a t i c ) load measurement
p r i o r t o e n t e r i n g t h e curve. Measurements f o r two d i f f e r e n t i n i t i a l load
va lues a r e shown i n each case. The f i r s t case , i d e n t i f i e d a s I n i t i a l Load 1 ,
was obtained from t h e load c e l l reading j u s t p r i o r t o e n t e r i n g each curve on
the supere levated tangents. The second case , i d e n t i f i e d a s I n i t i a l Load 2 ,
was obta ined from a s t r a i g h t l i n e running cond i t ion (10 seconds i n l eng th )
approximately 2 mi les (3.2 km) p r i o r t o each curve. Mild d r i f t i n g i n load
c e l l readings , apparent ly due t o temperature s e n s i t i v i t i e s , have been observed
i n s e v e r a l of the processed wheel load data. These v a r i a t i o n s con t r ibu ted t o
approximately 5 percent v a r i a t i o n s i n the t o t a l load c e l l reading. The c h a r t s
presented i n Figure 22 por t ray s i m i l a r v a r i a t i o n s i n the measured wheel load
d a t a seen here. As such, the wheel load c e l l d i d not appear t o o f f e r a h ighly
accura te means f o r measuring v e r t i c a l wheel loads un less , poss ib ly , " I n i t i a l
Load 1" types of c a l c u l a t i o n s a r e performed - c l o s e l y spaced i n time t o
account f o r ga in d r i f t i n g . ( A more d i r e c t s o l u t i o n would be t o s u b s t a n t i a l l y
lower the temperature s e n s i t i v i t y of the load c e l l i t s e l f . )
Notwithstanding these accuracy concerns, the load c e l l measurements
were s t i l l u s e f u l i n the sense t h a t they d i d provide "ballpark" e s t i m a t e s of
v e r t i c a l t i r e load t ime-h i s to r i e s t h a t could be compared, i n a q u a l i t a t i v e
manner, wi th s i m i l a r p r e d i c t i o n s from t h e Phase 4 model t o help i d e n t i f y and
reso lve any noteworthy d i f fe rences . When severa l such comparisons were
subsequently made wi th t h e model p r e d i c t i o n s , no unusual d i f f e r e n c e s i n the
genera l na tu re of these time h i s t o r i e s were observed.
4.6 Example Obstacle Avoidance Test Result
Figure 23 shows an example t e s t r e s u l t f o r the o b s t a c l e avoidance
maneuever performed by the t r a c t o r - s e m i t r a i l e r t e s t vehic le . The s e t of time
h i s t o r i e s seen i n f i g u r e 23 represen t a maneuver which begins a s a s teady
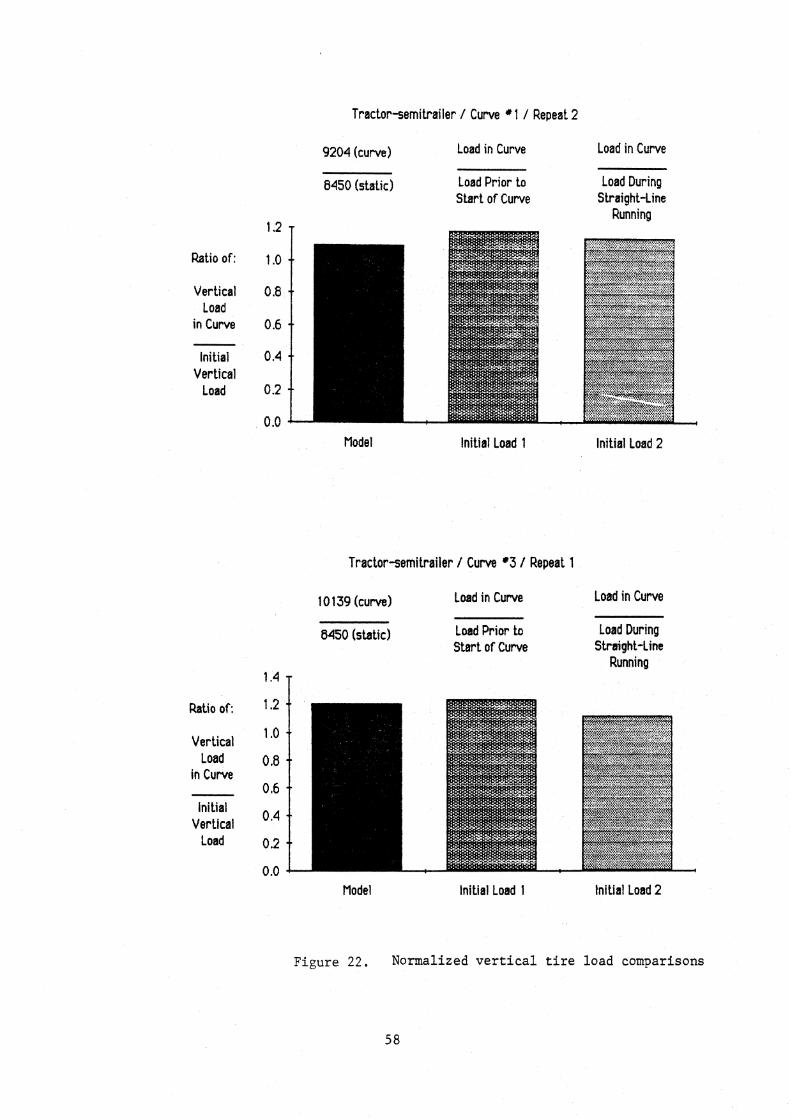
Tractor-semitrailer / Curve * 1 / Repeat 2
9 2 0 4 (curve) Load in Curve Load i n Curve
8 4 5 0 (static) Load Prior to Load During S ta r t o f Curve Straight-Line
Running 1.2
Ratio of: 1,o
Vert ical 0.8 Load
i n Curve 0.6
Initial 0.4 Vert ical
Load 0.2
0 .o Model Initial Load 1 Initial Load 2
Tractor-semitrailer / Curve *3 1 Repeat 1
10 139 (curve) Load i n Curve Load in Curve
8450 (static) Load Pr ior to Load During S ta r t o f Curve Straight-Line
Running 1.4 T
Ratio of: 1.2
1 -0 Vert ical
Load 0.8 i n Curve
0 $6 Initial
0.4 Vertical Load 0.2
0 .o Model Initial Load 1 Initial Load 2
Figure 22. Normalized vertical tire load comparisons

54
45
36 Speed
(mph) 27
18
Lateral Accel
k ' s )
.04
.03
.02
Long .O 1 Accel 0
(g 's )
-.O 1
-.02
-.03
-.04 0 4 8 I2 20
Figure 2 3 . Obstacle avoidance t e s t r e s u l t example; vehic le C .

Trailer Yaw Rate (degls)
Roll - 2 .I Angle
(deg , -4
- 5 -6
I I 0 4 6 12 16 2 0
TIME (secl
6
4
2
Tractor 0 Yaw ate - 2 (degls)
-4
-6
-6 0 4 6 I2 16 20
Figure 23 (cont)

Left Front Wheel Angle (deg)
Ar t i cu l a t ion Angle (ded - 1
2.7
1.8
Fdght Front .9
Wheel Angle 0 (deg)
-.9
F i g u r e 2 3 (cont)
- 1.8
-2.7 - 0 4 8 12 16 2 0
I \ I I

tu rn ing maneuver i n t h e o u t s i d e t r a v e l lane. A t approximately 8 seconds ( i n
t h i s f i g u r e ) , t h e v e h i c l e i s s t e e r e d t o the i n s i d e l ane and then back t o the
o u t s i d e l a n e , completing the maneuver a t about the 16-second mark. Time
h i s t o r i e s such a s these were used t o eva lua te peak f r i c t i o n demands of
v e h i c l e s performing modest o b s t a c l e avoidance maneuvers, a s wel l a s t o
v a l i d a t e p r e d i c t i o n s of s i m i l a r maneuvers performed with the Phase 4 model.
Examples of o b s t a c l e avoidance maneuvers f o r t h e passenger c a r s and
comparisons wi th Phase 4 model p red ic t ions a r e included i n the next chapter.
4.7 Example Braking / Accelera t ing Test Result
Example t e s t r e s u l t s f o r a braking / a c c e l e r a t i n g maneuver a r e presented
i n f i g u r e 24 f o r passenger c a r B a t curve s i t e 1. The time h i s t o r i e s
r epresen t a maneuver which begins a s a s teady tu rn ing maneuver. A t
approximately the 13-second mark i n t h i s f i g u r e , t h e brakes a r e appl ied
r e s u l t i n g i n a l o n g i t u d i n a l d e c e l e r a t i o n of 0.24 g ' s . A t t he 18-second mark
the brakes a r e r e leased and the veh ic le acce le ra ted (+0.10 g) back toward i t s
i n i t i a l speed. During t h i s type of t e s t the d r i v e r always kept t h e v e h i c l e i n
the same l ane throughout the maneuver. Braking / a c c e l e r a t i n g t e s t s such a s
these were p r imar i ly used t o f u r t h e r v a l i d a t e p red ic t ions f o r s i m i l a r
maneuevers performed wi th t h e Phase 4 model. Examples of braking / a c c e l e r a t i n g maneuvers f o r the t r a c t o r - s e m i t r a i l e r and passenger c a r t e s t
v e h i c l e s a r e a l s o seen i n chap te r 5 where comparisons wi th the Phase 4 model
a r e presented.
4.8 Observations and Conclusions Concerning t h e Test Resul ts
The p r i n c i p a l obse rva t ions regarding the v e h i c l e t e s t i n g a c t i v i t y i t s e l f
a r e noted below. Addi t ional observat ions and conclus ions r e l a t e d t o the t e s t
measurements appear i n t h e next chap te r when comparisons between the
experimental measurements and computer model p r e d i c t i o n s a r e presented and
discussed. I n regard t o t h e v e h i c l e t e s t measurements themselves:
* Measurement of v e h i c l e s i d e s l i p under cond i t ions of s teady tu rn ing ,
through use of the t r o l l e y device , was found t o be s u r p r i s i n g l y
accura te and repeatable . Since t h e t r o l l e y device used i n the t e s t

Speed (mph)
Lateral Accel (3's)
.16
.08 Long Accel 0
(g 's)
-.08
-. 16
-.24 .
-.32 , 0 5 10 15 2 0 2 5 30
Figure 24. Brakingiaccelerating test result example; passenger car B.

1
0
- 1
-2 Yaw Rate (deg/s) -3
-4
-5 -6
0 5 10 2 0 25 -. -
30
. -1.6 Roll Angle (deg) -2.4
Left Front -.2 !?heel Angle -.4 (deg)
Figure 2 4 (cont)

s e r i e s i s p r imar i ly intended f o r use on smooth t e s t pad s u r f a c e s ,
some r e s e r v a t i o n s were held a t the beginning of the t e s t i n g on i t s
performance i n a more normal and noisy road environment. Although
the d u r a b i l i t y and dynamic performance of the t r o l l e y device can be
improved s i g n i f i c a n t l y by c e r t a i n simple des ign changes, i t s use i n
f u t u r e veh ic le t e s t programs requ i r ing the measurement of veh ic le
s i d e s l i p during s teady tu rn ing cond i t ions appears useful . Among the
des ign changes required f o r the s i d e s l i p t r o l l e y t o improve i t s
accurracy a r e : 1) use of more rugged wheel assemblies and low
i n f l a t i o n pressure t i r e s t o b e t t e r handle roughness l e v e l s
encountered i n normal highway environments, and 2 ) s i g n i f i c a n t
i n c r e a s e i n i ts l e n g t h , p r imar i ly the yaw-pivot t o wheel dimension,
i n o rde r t o mimimize angular d i s tu rbances de r iv ing from normal
roadway dis turbances .
* Measurement of veh ic le r o l l angle us ing the s t a b i l i z e d pla t form
proved t o be highly v a r i a b l e and l e s s accura te than o r i g i n a l l y
an t i c ipa ted . The primary cause of the r o l l inaccurac ies l i e s with
the servo c o n t r o l mechanism used i n maintaining the p la t form i n a
h o r i z o n t a l pos i t ion . Simple mercury switches a r e used t o d r i v e the
p la t form back and f o r t h about a h o r i z o n t a l pos i t ion when d i s tu rbed ,
f o r example, by small e x t e r n a l forces . The dead zone range (+- 0.4
degrees) is apparent ly l a r g e enough t h a t s i g n i f i c a n t o f f s e t e r r o r s
a r e achieved i n r o l l angle when the e r e c t i o n system was d i sab led
dur ing a t e s t . The s t a b l e p la t form alignment e r r o r s d id not a f f e c t
l a t e r a l a c c e l e r a t i o n measurements s i n c e zero values of l a t e r a l
a c c e l e r a t i o n were defined by the i n i t i a l condi t ion of every t e s t and
any l a t e r a l a c c e l e r a t i o n o f f s e t s de r iv ing from pla t form alignment
e r r o r s were the ref o re removed. For tunate ly , the r o l l angle e r r o r s
encountered he re only a f f e c t e d the es t ima t ion of f r i c t i o n f a c t o r s
from s i d e t o s i d e ac ross an a x l e , and f u r t h e r , only t o a small
degree. Since good e s t i m a t e s of l a t e r a l load t r a n s f e r can be made on
the b a s i s of l a t e r a l a c c e l e r a t i o n and f o r e l a f t suspension
d i s t r i b u t i o n s a lone, t h e v a r i a b i l i t y i n r o l l angle measurements was
not extremely c r i t i c a l t o t h e o v e r a l l r e sea rch r e s u l t s . (Normally,
f o r high l a t e r a l a c c e l e r a t i o n t e s t s performed on a sk id pad i n which

l a r g e r o l l angles and accura te t r a n s i e n t responses a r e r equ i red , the
s t a b l e p la t form system is a proper choice f o r r o l l angle .
measurement. However, f o r more normal d r i v i n g condi t ions of long
d u r a t i o n , a ground-based potentiometer measurement system, s i m i l a r t o
the FHWA t r o l l e y , appears more a t t r a c t i v e a s a method f o r r o l l angle
measurement, p a r t i c u l a r l y when roadway supere leva t ion informat ion i s
a l s o known. )
* The modest degree of d r i f t i n g observed i n the processed load c e l l
readings , apparen t ly due t o temperature s e n s i t i v i t i e s , prevented the
use of t h i s s i g n a l a s an accura te measurement of p r e v a i l i n g v e r t i c a l
wheel load a t the s i n g l e t r a c t o r - s e m i t r a i l e r wheel loca t ion .
However, i t s use d i d a l low f o r q u a l i t a t i v e eva lua t ions of how
v e r t i c a l wheel loads vary on heavy v e h i c l e s when e n t e r i n g and
t r a v e r s i n g supere levated curves.
* Although the p r i n c i p a l p r o j e c t mot ivat ion f o r performing the
descr ibed v e h i c l e t e s t s was t o a s s i s t i n v a l i d a t i n g the developed
computer models, a l a r g e body of u s e f u l t e s t da ta was generated
dur ing t h i s p r o j e c t and could be used a s a source of r e p r e s e n t a t i v e
d r i v e r / v e h i c l e behavior on superevated curves f o r f u t u r e p r o j e c t s o r
s tud ies .

Chapter 5
COMPARISONS OF MODEL PREDICTIONS AND TEST RESULTS
Development of t h e s t eady tu rn ing model wi th in t h i s p r o j e c t and r e l a t e d
ques t ions concerning f r i c t i o n f a c t o r values a t i n d i v i d u a l wheel l o c a t i o n s
focused most of t h e model v a l i d a t i o n e f f o r t s on t h e s teady tu rn ing condi t ion.
Accordingly, the major i ty of d a t a and model c a l c u l a t i o n s presented i n t h i s
chap te r a r e a s s o c i a t e d wi th t h e s teady tu rn ing maneuver. A l l model
p r e d i c t i o n s seen i n s e c t i o n 5.1 r e f e r t o the s t eady tu rn ing models developed
dur ing the p r o j e c t . Comparisons between Phase 4 model p r e d i c t i o n s and t e s t
r e s u l t s f o r the o b s t a c l e avoidance and braking / a c c e l e r a t i n g maneuvers a r e
seen i n s e c t i o n s 5.2 and 5.3 . 5.1 Steady Turning Comparisons
The comparisons between t e s t r e s u l t s and model p r e d i c t i o n s seen he re and
i n appendix F a r e presented i n a bar-graph format f o r ease of reading. The
experimental d a t a , however, a r e a l s o contained i n appendix E i n t h e i r raw time
h i s t o r y format. Model p r e d i c t i o n s corresponding t o t h e t e s t d a t a seen he re
(and appendix E) a r e contained i n appendix D. R e f e r r a l t o appendix E i s
u s e f u l f o r a more d e t a i l e d understanding of t h e na tu re of the d a t a and i t s
noise l e v e l . Also, a l though these experimental d a t a a r e r e f e r r e d t o a s
"steady turning," they a r e approximations t o i d e a l s t eady tu rn ing motion
because of e x t e r n a l d i s t u r b a n c e s and normal d r i v e r s t e e r i n g behavior. Average
value c a l c u l a t i o n s were performed f o r most of the v a r i a b l e s seen i n appendix E
over an eight-second o r g r e a t e r time span dur ing each t e s t . These average
va lues a r e p r i n t e d on t h e r i g h t p o r t i o n of t h e p l o t s contained i n appendix E
and a r e the same t e s t r e s u l t va lues presented i n t h i s s e c t i o n i n a bar-graph
format.
I n most c a s e s , zero va lues were def ined f o r yaw r a t e , l a t e r a l
a c c e l e r a t i o n , and p i t c h angle measurements taken on approach t angen t s p r i o r t o
e n t e r i n g t h e curves. Other v a r i a b l e s ( s t e e r i n g wheel ang le , f r o n t wheel

angle, r o l l angle , and t r o l l e y angle) used zero ca l ib ra t ion runs p r io r to or
following the curve s i t e .
Referring t o f igure 25, seven char t s corresponding t o seven d i f f e ren t
var iab les a r e seen. Each char t contains three s e t s of bar-graphs which
compare t e s t r e s u l t s with predict ions from the steady turning model. Each
bar-graph s e t represents a t e s t repeat a t curve s i t e 1. Speed, l a t e r a l
acce lera t ion , s t e e r (average of r i gh t and l e f t f ront wheel angles ) , r o l l
angle, and a r t i c u l a t i o n angle measurements a r e obtained d i r e c t l y from the
average values seen i n appendix E. The path radius graph i s calculated from
the r a t i o of the vehicle speed measurement, V (mph), and t r a i l e r yaw r a t e , r2
(deg/s ) , [ i .e . Radius ( f t ) = (~ ) (88 ) (57 .3 ) / (60)(r2) 1, with adjustments fo r
the measurement u n i t s l i s t e d i n Tables 3 and 4. The s i d e s l i p angle char t
values i n degrees (vehicle s i d e s l i p a t the t r a i l e r mass center / car mass
center ) a r e obtained from the following equation:
s i d e s l i p angle = [ ( c ) ( r2 ) (60 ) / (88 V)] - t r o l l e y angle
where: c i s the rearward dis tance from the semi t r a i l e r cog. ( or ca r ) t o the
t r o l l e y wheel ( f t ) , and 60188 i s the un i t cor rec t ion f a c t o r f o r mph t o f t / s .
A pos i t i ve t r o l l e y angle corresponds t o the angle between the tow vehicle and
the t r o l l e y when the t r o l l e y i s located a t the rear of the vehicle during
turning motion t o the r igh t . (The t r o l l e y measurements seen i n appendix E
contain a s ign e r r o r per the above def in i t ion . )
It should a l s o be noted t h a t the bar-chart summaries seen here contain
mostly pos i t ive values and therefore imply r igh t hand turns by convention.
Data f o r curves 1 , 2 , and 3 seen i n appendix A ( l e f t tu rns) have had t h e i r
s igns changed i n t h i s sec t ion t o provide consistency i n the summary chart
presentations.
5.1.1 Tractor-semitrai ler Comparisons
The comparisons between t e s t r e s u l t s and model predict ions shown i n
Figure 25 f o r the t rac tor -semi t ra i le r general ly ind ica te very good agreement.

Curve " 1 : Tractor-semi
Speed (mph)
t
5 Test Results fl Hadel
2
Repeat *
5 Test Results Model Predictions
Latera Accel (g's)
2 3 Repeat #
Figure 25. Modelltest comparisons; vehicle C.

Curve # 1 : Tractor-semi
Test Results Model Predictions
Steer Angle (deg)
2 Repeat *
+
a Test Results 8 Model Predictions
Roll Ang 1 e (deg)
2 3 Repeat *
Figure 25 (cont)

Curve * 1 : Tractor-semi
Test Results Model Predictions
Sideslip Angie (deg)
Curve 1 : Tractor-semi
Test Results Model
Path Radius
(ft)
1 2 3 Repeat #
Figure 25 (cont)

Curve 1 : Tractor-seml
Test Results Model Predictions
Articulation Angle (deg)
2 3 Repeat #
Figure 25 (cont)

Since the model (chapter 3 & appendix B) uses vehicle speed as an input value,
the comparisons seen i n the speed char t s w i l l always be iden t i ca l and are
included here primarily t o ind ica te speed changes from t e s t t o t e s t . The low
power capacity of the t r a c t o r used i n the t e s t program and a modest uphi l l
approach grade prevented operating speeds a t curve s i t e 1 much above 45 mph
(72 km/h). A t the speeds seen i n f igure 25 the t ractor-semitrai ler
experiences about 0.11 g ' s of l a t e r a l accelerat ion i n the horizontal plane, or
approximately 0.04 g ' s (0.11 - 0.067) i n terms of a point-mass f r i c t i o n f ac to r
i n the road plane. The remaining variables seen i n f igure 25, with perhaps
the exception of a r t i c u l a t i o n angle, general ly exhib i t margins of agreement
within 5 t o 10% . The a r t i c u l a t i o n angle measurements seen throughout the
report show readings which a re approximately 7% too high. An e r r o r i n the
value used to c a l i b r a t e the a r t i c u l a t i o n angle transducer was found subsequent
t o the data processing. The impact of t h i s e r r o r on the overa l l research
r e s u l t s i s small and i f corrected i n the displayed graphs would ac t t o fur ther
improve the l eve l of agreement already observed.
Figure F-1 of appendix F shows s imi la r r e s u l t s from curve s i t e s 2 and 3.
Again, most of the char t s r e f l e c t general agreement. The r o l l angle
measurement f o r curve 3 contains a modest e r r o r due to the s t ab l e platform
r o l l correct ions applied by the servo system. However, a s indicated e a r l i e r ,
a r e s u l t l i k e t h i s can be traced d i r e c t l y t o an inaccurate zero reference
value f o r r o l l angle. The s i d e s l i p discrepancy seen f o r curve 3 i s
a t t r i b u t a b l e t o an o f f s e t zero data value f o r t h i s pa r t i cu l a r run.
Ordinarily, the average values of s i d e s l i p ( t r o l l e y ) measurements a r e well
within 0.1 t o 0.2 degrees of i dea l values. A t f i r s t glance, observation of
the noise leve l on the t r o l l e y s igna l , pa r t i cu l a r ly f o r the t rac tor -
s emi t r a i l e r data (appendix E ) , would not suggest accuracies anywhere near the
l eve l achieved. However, averaging over periods of 10 seconds or so was shown
t o produce very repeatable and accurate t r o l l e y measurements i n most cases.
Figure F-2 of appendix F shows s imi la r comparisons f o r two repeats a t the
ramp s i t e 4. The noteworthy item here i s the increased leve l of l a t e r a l
accelerat ion and reduced speed i n contrast t o the other three s i t e s . The data
seen here a re f o r runs performed about 7 mph (11 km/h) above the advisory
speed f o r the ramp. The elevated l eve l of l a t e r a l accelerat ion f o r these t e s t

r e s u l t s i s beginning t o exceed the legi t imate range of appl ica t ion of the
l i n e a r model - -par t icular ly f o r a loaded t rac tor -semi t ra i le r vehicle. - However, these r e s u l t s i l l u s t r a t e t h a t even a t these l eve l s of l a t e r a l
acce lera t ion , the s implif ied steady turning models do a very reasonable job of
predict ing the steady turning response of a t rac tor -semi t ra i le r vehicle. In
general , the r o l l angle values measured a t the ramp s i t e were more e r r a t i c
than those measured a t the other curve s i t e s . This was due, i n pa r t , t o the
noted va r i a t i ons i n superelevation a t the ramp s i t e , as well as more variable
d r ive r s teer ing and speed cont ro l which contributed t o addi t iona l r o l l
motions. The net e f f e c t of these addi t iona l r o l l motions a t the ramp s i t e was
to introduce small , and l a rge ly inconsequential , va r i a t i ons i n the estimates
of v e r t i c a l load t r ans fe r across each axle.
Figures 26 through 31 compare f r i c t i o n f ac to r values derived s t r i c t l y
from the t e s t measurements ( a s described i n appendix E , sec t ion 4 ) with those
predicted by the steady turning model. Greater s c a t t e r i s seen i n these s e t s
of t e s t r e s u l t s than i n the previous vehicle response f igures simply because
each f r i c t i o n f a c t o r value depends on four o r more vehicle measurements
(speed, yaw r a t e , t r o l l e y angle, r o l l angle, a r t i c u l a t i o n angle, and f ron t
wheel s t e e r angle). As noted i n chapter 4 , modest noise or o f f s e t s i n any one
of the measurements w i l l contr ibute t o e r r o r i n the f r i c t i o n f a c t o r estimate.
The s e n s i t i v i t i e s t o small cumulative e r r o r s a re i l l u s t r a t e d by comparing the
f r i c t i o n f ac to r t e s t r e s u l t s seen i n f i gu res 26 through 28 (curve 1, repeats 1
t o 3 ) with the l e v e l of t e s t r e s u l t s c a t t e r observed i n f igure 25. The
f r i c t i o n f ac to r d i f fe rences seen i n f i gu re 26 a r e a l l on the t r a c t o r (axles 1
t o 3 ) and a r e produced primarily by the 0.3 degree a r t i c u l a t i o n angle
discrepancy previously seen i n f igure 25. Superior estimates of f r i c t i o n
f ac to r s a t the s emi t r a i l e r wheel loca t ions (axles 5 and 6) a r e due to t h e i r
dependence on fewer measurements ( V , r2 , t r o l l e y angle, and r o l l angle). In
con t r a s t , t r a c t o r f ron t wheel f r i c t i o n f ac to r s depend on the g rea t e s t number
of measurements ( V , r2 , t r o l l e y angle, r o l l angle, a r t i c u l a t i o n angle, and
f ron t wheel s t e e r angle).
Measurement e r r o r s can of ten be iden t i f i ed by the degree of discrepancies
i n estimated f r i c t i o n f ac to r s and where they occur on the vehicle. For
example, s ince the semi t r a i l e r f r i c t i o n f ac to r values depend primarily on

Tractor-semi Curve 1 Repeat 1
0.20
Fr ic t ion Factor Oe10
Tractor-semi C u m 1 Repeat 1
- -
OUTSIDE WHEELS
Axle 1 Axle 2 Axle 3 C.G. Axle 4 Axle 5
Location
Fr ic t ion Factor O.10
I Test Results Model Predictions I
1 0 s t R e s u Model Predictions ] INSIDE WHEELS
Axle I Axle 2 Axle 3 C.G. Axle 4 Axle 5
Location
Figure 26. Friction factor comparisons; vehicle C

Tractor-semi Curve * 1 Repeat 2
OeZO I Fr ic t ion Factor O.1°
--
)O TsllResulb Model Predictions I OUTSIDE WHEELS
Tractor-semi Curve 1 Repeet 2 0,20
Axle 1 Axle 2 Axle 3 C.G. Axle 4 Axle 5
Location
Test Results Model Predictions
INSIDE WHEELS
Fr ic t ion Factor
0.05
0 .oo Axle 1 Axle 2 Axle 3 C.G. Axle 4 Axle 5
Location Figure 27 . F r i c t i o n f a c t o r comparisons ; veh i c l e C

Tractor-semi Curve 1 Repeat 3
Oe20 I Test Results Model Predictions
L
OUTSIDE WHEELS
Fr i c t i on Factor
Axle 1 Axle 2 Axle 3 C.G. Axle 4 Axle 5
Location
Tractor-semi Curve I
1 T R e Hodel Predictions I INSIDE WHEELS
Fr i c t i on Factor
Axle 1 Axle 2 Axle 3 COG. Axle 4 Axle 5
Locat ion Figure 28. Friction factor comparisons; vehicle C

Trac tor-semi Curve #2 Repeat 1
0.20
F r i c t ion Factor O.1°
Tractor-semi Curve *2 Repeat 1
Fr ic t ion Factor
I Test Resulb 8 Model Predictions I OUTSIDE WHEELS
Axle 1 Axle 2 Axle 3 C.G. Axle 4 Axle 5
Location
I Test Results Plodel Predictions I INSIDE WEELS
Axle 1 Axle 2 Axle 3 C.G. Axle 4 Axle 5
Location Figure 29. F r i c t i on fac tor comparisons ; vehicle C

Tractor-semi Curve *3 Repeat 1
1 Test Results Model Predictions 1 OUTSIDE WHEELS
t rict ion 0.15
Factor 0.10
0.05
0.00
Tractor-semi Curve *3 Repeat I
Friction Factor
Axle 1 Axle 2 Axle 3 C.6. Axle 4 Axle 5
Location
Test Results Model Predictions
INSIDE WHEELS
Axle I Axle 2 Axle 3 C.G. Axle 4 Axle 5
Location Figure 30. F r i c t i o n f a c t o r comparisons; veh i c l e C

Tractor-semi Curve *3 Repeat 1
0.25
0.20
10 Test Results Model Predictions I
OUTSIDE WHEELS
Fr ic t ion 0.15
Factor 0.10
0.05
0 .oo Axle I Axle 2 Axle 3 C.G. Axle 4 Axle 5
Processing repeated using Tro t ley value Location of -0.5 degrees (approx value measured in s im i la r curves) in place of -0.2 degrees (va lue measured here & having apparent o f fset )
Tractor-semi Curve *3
Fr ic t ion Factor
10 Test Results Model Predictions I INSIDE WHEELS
Axle 1 Axle 2 Axle 3 C.G, Axle 4 Axle 5
Location Figure 31. F r i c t i o n f a c t o r comparisons; v e h i c l e C
8 0

t r o l l e y measurements (V and r2 a r e usual ly qui te accurate) , a s ign i f i can t
f r i c t i o n f ac to r e r r o r a t t ha t locat ion would imply an e r r o r i n the t r o l l e y
measurement. Similar ly, large discrepancies only a t the f ront t r a c t o r
s teer ing axle would suggest erroneous s teer ing angle measurements, s ince only
tha t axle depends upon s teer ing wheel angle measurements i n estimating
f r i c t i o n f ac to r values. (More modest discrepancies a t the f ront axle locat ion
can a l so be a t t r i bu ted t o vehicle r o l l - t i r e camber suspension properties.
This i s discussed fu r the r under the data presented f o r passenger car B.)
Figures 27 through 29 ind ica te t h a t the individual wheel f r i c t i o n f ac to r s
derived from the t e s t data a r e comparable t o the values predicted by the
steady turning models and vary from wheel t o wheel locat ion i n a very s imilar
manner. The l a rges t var ia t ions away from the point-mass (c.g.) value occur on
the ins ide wheels, and usual ly a t the t r a c t o r and semi t r a i l e r rearmost axle.
F ina l ly , Figures 30 and 31 i l l u s t r a t e the e f f ec t tha t a 0.3 degree change
i n t r o l l e y angle measurement can have on the f r i c t i o n f ac to r estimates f o r the
e n t i r e t ractor-semitrai ler . Figure 30 shows experimentally determined
f r i c t i o n f ac to r values which appear cons is ten t ly l a rge r than the values
predicted by the model. This i s a d i r e c t consequence of the erroneous
s i d e s l i p ( t r o l l e y ) measurement noted e a r l i e r i n Figure F-1 of appendix F f o r
curve 3. Figure 31 corresponds t o the very same s e t of measurements used i n
f igure 30, except f o r an a l t e r ed value of t r o l l e y angle measurement.
Signif icant improvement i n each of the f r i c t i o n f ac to r estimates occurs as a
r e su l t of replacing the t r o l l e y measurement with a more accurate value.
5.1.2 Pasenger Car A Comparisons
The steady turning comparisons f o r the f ron t wheel dr ive t e s t vehicle
presented i n f igures 32 t o 35 (and s imi la r f igures F-3 and F-4 of appendix F)
a r e general ly qui te good. The most not iceable discrepancy i n these
comparisons appears f o r s teer ing angle where the t e s t r e s u l t s cons is ten t ly
f a l l below the model predictions. The apparent cause of t h i s appears t o be a
small instrumentation gain e r r o r i n the f ron t wheel s t e e r measurement. The
r o l l angle measurements showed improved consistency i n the passenger car A
data. The t r o l l e y again performed very well i n the vehicle A s e r i e s of t e s t s

Curve # 1 : Dodge Aries
Speed (mph)
Lateral Accel (g's)
Test Results Model A
2 Repeat *
Curve * 1: Dodge Aries
Test Results Model Predictions
2 3 Repeat *
Figure 32. Idodel/ test comparisons; veh i c l e A

Curve # 1 : Dodge Aries
Test Results Model Predictions
Steer Angle (deg)
1 2 3
Repeat *
Curve # 1 : Dodge Art es
I a Test Results Nodel Predictions I
R o l l Angle (deg)
1 2 3
Repeat *
Figure 32 (cont)

Curve * 1 : Dodge Aries
Path Radius (ft)
Sideslip Angle (deg)
Test Results 19 Model
2 3 Repeat
Curve * I : Dodge Aries
a Test Results Model hedictions
Repeat
Figure 32 (cont)

Dodge Aries Curve 1
10 Test Results Model Predictions I
t r i c t l o n Factor O.10 I
Lefl Front Right Front C.G. Left Resr Right Rear
Location
Dodge Aries Curve 1
18 Test Results Model Predictions I
F r i c t ion 1 Factor O.1° f
0.05
0.00 Left Front Right Front C.G. Left Reer Right Rear
Location Figure 33. F r i c t i o n f a c t o r comparisons; vehicle A

Dodge Aries Curve 1 Repeat 3
O" I Fr ic t ion
I Test Results Model Predictions I
Left Front Right Front C.G. Left Rear Right Rear
Locat ion
Figure 33 (.cant)

Dodge Aries Curve *2 Repeat 1
0.20
Fr ic t ion Factor
Dodge Aries Curve *3
Factor
I 0 Test Results nodel Predictions I
Left Front Right Front C.G. Left Rear Right Rear
Location
ri l s s t Rnults nodel Predictions I
Left Front Right Front C.G. Left Rear Right Rear
Location Figure 34. F r i c t i o n f a c t o r comparisons; v e h i c l e A

Dodge Aries Ramp
Repeat 1
Fr ic t ion Factor
Dodge Aries Ramp
Repeat 2
Friction Factor
Test Results Model Predictions
Left Front Right Front C.G. Left Rear Right Rear
Location
0 Test Results Model Predictions
Left Front Right Front C.G. Left Rear Right Rear
Location F i ~ u r e 35 . Friction factor comparisons; vehicle A

benef i t t ing espec ia l ly from a much smoother r i de from the passenger car. The
overa l l l eve l of noise i n the t r o l l e y time h i s t o r i e s (appendix E) i s g rea t ly
reduced from tha t seen i n the t rac tor -semi t ra i le r t e s t s .
The f r i c t i o n f ac to r comparisons seen i n f igure 33 fo r curve 1 and vehicle
A a re general ly qui te good and exhib i t l eve l s of var ia t ion expected from
experimental measurements performed under these operating conditions. The
f r i c t i o n f ac to r comparisons seen i n f igure 34 f o r curves 2 and 3 exhibi t
g rea te r discrepancies a t the f ron t wheel locat ions primarily because of the
s teer ing wheel d i f fe rences seen i n f igure F-3 of appendix Fa Eventhough the
curve geometry and speeds were nearly i den t i ca l f o r a l l these curve
measurements, the s teer ing wheel angle measurements f o r curves 2 and 3 a re
unexplainably lower than those observed i n curve 1. Frequently, these
differences a r e a t t r i b u t a b l e t o var ia t ions i n zero data values obtained from
d i f f e ren t sect ions of roadway.
F ina l ly , f igure 35 compares f r i c t i o n f ac to r values a t the ramp s i t e ,
curve 4, under conditions of lower speed and reduced curve radius. Although
the f ron t wheel locat ions show differences which a re due t o e r r o r s i n f ront
wheel angle measurement, the rear wheel values and point-mass value (c.g. )
exhib i t very good agreement. This pa r t i cu l a r f igure underscores the point
made e a r l i e r i n the t rac tor -semi t ra i le r da ta , tha t unless a l l vehicle response
measurements t ha t contr ibute to f r i c t i o n f ac to r estimates a re accurate , modest
e r r o r s i n c e r t a i n measurements can s ign i f i can t ly a f f e c t the accuracy of the
f r i c t i o n f ac to r estimates. In t h i s case, the rear wheel f r i c t i o n f ac to r
est imates depend upon four measurements (yaw r a t e , speed, t r o l l e y angle, and
r o l l angle) , whereas the f ront wheel values depend upon the same measurements
but s t e e r angle as well, Consequently, only the f ron t wheel f r i c t i o n f ac to r
est imates a re affected i n t h i s pa r t i cu l a r case.
5.1.3 Passenger Car B Comparisons
The rear wheel dr ive passenger car comparisons seen i n f igures 36 and 37
(and f igures F-5 and F-6 of appendix F) a l so ind ica te general agreement with
the r e s u l t s predicted by the model. The primary discrepancy f o r vehicle B
appears i n the comparisons of f ron t wheel s t e e r angle, No explanation has

Curve * 1 : Ford LTD
Test Results Model
Speed (mph)
Lateral Acce 1 (g's)
2 Repeat #
Curve * 1 : Ford LTD
Test Results Model Predictions
I 2 Repeat *
Figure 36. ~odell test comparisons ; vehicle B

Curve * 1 : Ford LTD
Steer Angle tdeg)
Test Results Model Predictions
2 Repeat *
Curve # 1 : Ford LTD
a Test Results @ Model Predictions
Roll 3 Angle (deg) 2
2 Repeat
Figure 36 (cont)

Curve * 1 : Ford LTD
el Test R ~ S U I ~ S El Model
Curve Radius
( f t )
Sides1 ip Ang 1 e (deg)
2 3 Repeat #
Curve # 1 : Ford LTD
a Test Rcrsults a Model Predictions
Repeat #
Figu re 36 (cont)
92

F o r d LTD Curve # 1 Repeat 1 Oa20 T
F r i c t ion Factor
Ford LTD Curve # 1
F r i c t ion Factor
0 Test Results Model Predictions
Left Front Right Front C.G. Left Rear Right Rear
Location
1 Test I t s Model Predictions I
Left Front Right Front C.G. Left Rear Right Rear
Location Figure 37. Friction factor comparisons; vehicle B

been s p e c i f i c a l l y i den t i f i ed f o r the s t e e r angle discrepancies , although an
instrumentaion gain, automatically s e t by the da ta acquist ion system, appears
t o be the probable cause. It i s known t h a t the f ront wheel s t e e r angle
measurements seen here a r e too high because many of the measurements suggest
s teer ing gear r a t i o s ( s t ee r ing wheel angle / f ront wheel angle) t h a t a re too
low. For example, the ramp data fo r vehicle B (appendix E) which includes the
e f f e c t s of s t ee r ing system compliance, suggests s t ee r ing gear r a t i o s i n the
v i c i n i t y of 17 ( a more reasonable value would be 25 o r 30). Since the known
gear r a t i o i s 20 (and perhaps a s low as 19.5 due t o i t s var iable s teer ing gear
proper t ies ) , no explanation other than a transducer/instrumentation gain e r r o r
i s l ike ly .
Aside from these matters , the remaining vehicle response measurements
compare very favorably with the predict ions from the steady turning models.
Vehicle s i d e s l i p measurements f o r curve 1 show di f fe rences of l e s s than 0.03
degrees f o r each of the three repeats. The s i d e s l i p measurements f o r the
remaining three curve s i t e s shown i n t h i s s e t of f igures contain e r ro r s of
l e s s than 0.15 degrees. The curve radius and l a t e r a l accelerat ion
measurements a r e normally within 5 percent of the ac tua l o r predicted values.
The f r i c t i o n f ac to r r e s u l t s seen i n f igures 37 through 41 f o r the f ron t
wheels a r e of course g rea t ly influenced by the f ront s t e e r angle measurements.
To indica te how the f r i c t i o n f ac to r estimates a r e a l t e r e d by more accurate
est imates of f ron t s t e e r angle, several of these f igures ( 3 8 , 40, and 41)
contain dupl ica te t e s t r e s u l t es t imates - one using the measured f ron t s t e e r
angle, the other using f ron t s t e e r angle predicted by the model. In each of
these dupl ica te f i gu res , the only measured quant i ty a l t e r ed was f ront s t e e r
angle. The degree of improvement seen i n the f ron t wheel f r i c t i o n f ac to r
p l o t s , r e su l t i ng from a more accurate value of s t e e r angle, again emphasizes
the s e n s i t i v i t y of est imating f r i c t i o n f ac to r values when modest e r ro r s i n one
measurement are present.
5.2 Obstacle Avoidance Comparisons
The model predict ions presented i n t h i s and the next sect ion make use of
the nonlinear Phase 4 model. The comparisons seen here a r e presented i n a

Ford LTD Curve # 1 Repeat 2 0.25
0.20
Friction 0.15
Factor
0 Test I Model Predictions
Left Front Right Front C.G. Left Rear Right Rear
Location
Test Resulb 59 Model Predictions
Friction Factor Oe10
0 -05
F o r d LTD Curve # I Repeat 2 0.00 ( using front wheel angle f rom model
Left Front Right Front C.G. Left Rear Right Rear . . i n p lace o f f r o n t Location wheel angle measurement) Figure 38. Friction factor comparisons; vehicle B

Ford LTD Curve *2 Repeat 1
020 I Fr i c t i on Factor
Test Results Model Predictions
Ford LTt) Curve *3 Repeat 1
OS2O 1
Fr i c t i on Factor Oq10
Left Front Right Front C.G. Left Rear Right Rear
Locat ion
Test Results Model Predictions
Left Front Right Front C.G. Left Rear Right Rear
Locat ion Figure 39. Friction factor comparisons; vehicle B
96

F o r d LTD Ramp Repeat 1
0 Test Results Model Predictions
Fr ic t ion Factor
0.3
Left Front Right Front C.G. Left Rear Right Resr
Location
Fr ic t ion Factor
Ford LTD Ramp Repeat 1 ( using f ron t wheel
I Test Rmults flodel Predictions I
a f f p / i f rom mode/ Left Front Right Front C.G. Left Rear Right Rear i n place o f f ron t wheel angle Location measurement)
F i g u r e 40. F r i c t i o n f a c t o r comparisons; vehicle B

Fo rd LTD Ramp 0.4 T
Repeat 2
Fr ic t ion Factor
0 Test Results @ Model Predictions
Left Front Right Front C.G. Left Rear Right Rear
Location
Test Rssults Model Predictions
Fr ic t ion Factor O.10 .
0.05 Ford LTD Ramp Repeat 2 ( using f ront wheel OaoO ' anp/e f rom mode/ Left Front Right Front C.G. Left Rear Right Rear in plsca of f ront wheel angle Location measurement)
Figure 4 1 , F r i c t i o n f a c t o r comparisons; veh i c l e B

time h is tory format, ra ther than a s summary char t s used fo r the steady turning
comparisons, because of the time varying nature of the t e s t maneuvers.
The model r e s u l t s seen i n Figures 43 through 45 were obtained by running
the Phase 4 model under d r ive r control (closed-loop) [6] along a superelevated
curve having the same geometry a s curve 1. Following a steady turning
condition, the dr iver model performs an obstacle avoidance maneuver s t a r t i n g
from the outside lane ( turning l e f t , as i n f igure 42). Figure 43 corresponds
t o the t r a c t o r - semi t r a i l e r ; f igure 44 to passenger car A; and f igure 45 to
passenger car B.
In the ac tua l vehicle t e s t s the dr iver was allowed t o move from the
i n i t i a l t r ave l lane to the adjoining lane with complete freedom. No path o r
coned course was specif ied i n performing the lane-to-lane movement. In the
computer simulation, a path f o r the d r ive r model t o follow during the lane t o
lane movement must be specified. The path used i n the simulation calculat ions
was a simple 12-ft (3.7 m) o f f s e t t o the ins ide of the 1273 f t (388 m) radius
curve and then back again, varying i n a l i nea r fashion over a forward t rave l
dis tance of approximately 100 t o 150 f t (30 t o 45 m). See f igure 42. Two
runs fo r each vehicle were made with the Phase 4 model t o produce the r e su l t s
seen i n t h i s section. The second run i n each case was a repeat of the f i r s t
run with a path adjustment of the lane change t o b e t t e r match the observed
t e s t resu l t s . In general , the l eve l of agreement i n these comparisons is very
reasonable. A l l comparisons seen here were made f o r curve 1.
Each of the f igure pages contains a d i r e c t comparison of t e s t data (top
cha r t ) with i t s corresponding Phase 4 predict ion (bottom chart) . In some of
the comparisons the simulation r e s u l t s show the lane change being performed
somewhat before o r a f t e r t ha t seen i n the t e s t resu l t . The time skew i s not
important and is only due to where along the curve the simulation lane change
occurs. Also, the beginning of the simulation ca lcu la t ions ( t imelo) has the
vehicle s t a r t i n g from a horizontal plane pos i t ion and driving on t o a 6.7
percent superelevated curve over a dis tance of 200 f e e t (61 m). The s t a r t i n g
posi t ion fo r the t e s t vehicle was an incl ined tangent of var iable
superelevation. Accordingly, the f i r s t few seconds of simulation predict ions
w i l l be d i f f e r en t from the t e s t measurements, pa r t i cu l a r ly i n r o l l response.

Lane .: Change
Figure 42. Obstacle avoidance (double lane change) maneuver

Speed (mph)
Chan r 2 27
Figure 43. Phase 4 model/ t e s t comparison; obstacle avoidance
maneuver; vehicle C.
f ,'
J 9
4 5, t
I I .. .$;I
v 1 (rnph)27 1
I
1 L
I
i I
----I
i
Phase 4
16 j I
i 9
!
I
0 4 '.I P: 12 1 tl 2 - l;j ..
TIME (sec)

Lateral Acceleration (g ' s )
Chan 0
TIME (set)
Figure 43 (cont)

Longitudinal Acceleration (g 's)
Chan .O 1
* 4 0
-.o 1
r .-, . c) J
.$2
Ax2 .if 1
(gas) -.0 1
- . 02 ,
.-. ', -.L"
-,04 0 .-, ... 4 8 12 L V
TIME (secf
Figure 43 (cont)

Trai le r Yaw Rate (deg/s)
Chan 0
Figure 43 (cont)

Trailer R o l l Angle (deg)
Chan - 5
o 4 8 12 TIME fsec)
Figure 43 (cont)

.4 Chan
= 9 0
.9 Chan * 10 r i g h t
-.9
Fron t Iv'heel Angles (deg]
.-, - L . i
1 .g
.9 df w [beg) O
average - . 9
- 1.8
? m - A , / 4 12 .- .-. O 8 L {!
TIME (sec8 F i g u r e 43 (cont)

Articulation Anele (deg)
TIME fsec)
Figure 43 (cont)

TIME Isec)
Tractor Yaw Rate (deg/s)
6 A
Figure 4 3 ( c o n t )
4 I \
2 i ' Chan (I
\, b w - ~
* 16 -2
- 4
-6
-6 L
0 4 8 12 16 20

Speed (mph)
40 Chan * 2 30
Figure 4 4 . Phase 4 model/test comparisons; obstacle avoidance maneuver; vehicle A .
--
<) Cl
K 8-1 -,I I.'
40 V
lmph, 3 0
I
I
2 0 t I 1 1 0
0 b
1 i
I i
I i 1
I I I i j
I I
-
I
I:, e. I (1 15 20 L. ,' :> 0 .-. P- ., -. , ..
TIME (sec)
I
Phase 4 j I
I I !
I

Lateral Acceleration (g 's)
O Chan
Figure 44 (cont)

Yaw Rate (deg/s)
4
2
0 Chan A T T ~ . - 2 Y c. . " 5 - 2 P ,,.,.I 0
- 4
- t.f
- 8 0 C -3 15 J ,J I..)
10 15 20
TIME (sec)
Figure 44 (cont)

Roll Angle (deg)
9 Chan r 6 - 1
15 2 (j
TIME (sec)
Figure 44 (cont)

Front Wheel Angle (deg)
Chan -.z
.4
*, . i:
O
dfw - . 2
(deg) -,4
-,b
-.8
- 1 >. c: 1 (j 2 (1 :I c .., r. C! -) 15 b -,.' .:I !J
TIME (sec)
Figure 44 (cont)

Speed (mph)
40 Chan
30 Ave: 56,o
Figure 45. Phase 4 model/test comparisons; obstacle avoidance maneuver; vehicle B.
t:rO
5 CI
40 V
(mph,30
Phase 4
20
1 (:I
[::I O K 1 Q 1 5) 20 3c: 2 "
i ,J .,I V
TI ME (set)
I
i

Lateral Acceleration (g's)
Chan -.07
10 15 20
TIME (sec)
Figure 45 (cont)

Yaw Rate (deg / s )
0 Chan Ave:
-3.53
10 r * 15 t (.I
TIME (sec)
Figure 45 ( con t )

R o l l Angle (deg)
Chan - 1
TIME (sec)
Figu re 4 5 (cont)

F r o n t Wheel Angle (deg)
0 Chan # g -.5 Ave:
-.&9
i
.5
0 dfw (deg) -.5
- 1
- 1.5
- 2 r - ?
(:I 1 CI 15 b -) 3 1:' ,I ' I..! 71 c: -)
TIME jsec)
Figure 45 (cont)

Also, r o l l and s teer ing gain discrepancies t ha t were observed i n the steady
turning comparisons w i l l , i n general , a l so appear i n these data as well. For
example, the measured s teer ing responses f o r passenger car B seen i n f igure 45
(obstacle avoidance maneuver), disagree to about the same extent i n gain a s
t ha t observed i n the steady turning comparisons. Overall , the leve l of
agreement seen i n these comparisons i s qui te good.
5.3 Braking / Accelerating Comparisons
The example comparisons seen i n Figures 46 through 48 a r e f o r braking and
acce lera t ing along a superelevated curve. Figure 46 corresponds t o the
t r a c t o r - semi t ra i le r ; f igure 47 t o passenger car A; and f igure 48 t o
passenger car B. Curve 1 i s the s i t e a t which the t e s t r e s u l t s seen here were
collected. The simulation runs a r e s imi la r to the ones performed fo r the
obstacle avoidance maneuvers except tha t braking and accelerat ion l eve l s ,
s imi la r to those seen i n the t e s t da ta , were selected. Curve negot iat ion
(without a lane-to-lane movement) i s provided by the dr iver model. Again, the
general qua l i ty of most responses predicted by the simulation agree with the
vehicle measurements. The s teer ing predict ions a r e more var iab le , par t ly
because of more ac t ive s teer ing behavior by the d r ive r i n the t rac tor -
s emi t r a i l e r t e s t s , and pa r t l y because of strong bounce-steer in te rac t ions seen
i n the vehicle A measurement. The s teer ing angle transducer was mounted on
vehicle A i n such a manner t ha t s ign i f i can t ve r t i ca l movement of the sprung
mass (as occurs during braking) would produce a negative s teer ing indication.
Hence, the "unusual" (not actual ) s teer ing measurement seen occurring during
decelerat ion i n the vehicle A data. The braking / accelerat ing runs a l so
suggest t ha t the model representat ion has too l i t t l e understeer. This
observation can be seen i n the degree t o which s teer ing leve ls d i f f e r pr ior to
and following braking. A vehicle with l i t t l e or no understeer requires
approximately the same amount of s teer ing t o t rack a given radius a t d i f f e r e n t
speeds ( s imi la r t o what is observed i n the simulation). The t e s t da ta ,
however, display g rea t e r var ia t ions i n s teer ing requirements as the vehicle
speeds change. Aside from t h i s , the majority of comparisons a re very
favorable and suggest t h a t the Phase 4 model can be used t o accurately
represent nominal d r ive r / vehicle responses along superelevated highway
curves.

Speed (rnph)
8 12
TIME fsec)
Figure 46. Phase 4 model/ tes t comparisons ; brakinglaccelerating maneuver; vehicle C.

L a t e r a l Acceleration ( g ' s )
Chan
Q 12
TIME (sec)
F i g u r e 46 (.cant)

Longitudinal Acceleration (g ' s)
-.07 Chan r 4 - . I4
4 1.) P 12 20
TIME (secf
Figure 46 (cont)

Trailer Yaw Rate ( d e g l s )
-.7 Chan
* 5 - 1.4
TIME isec)
Figure 46 ( con t )

T r a i l e r R o l l Angle (deg)
- 1.2 Chan t 6 -1.6
0
- 9 .I,)
- 1 , t I 02 ldeg) -2.4
3 9 . '3.1:
-4
-4.8 r.. 0 8 12 L c!
TIME (sec)
Figure 46 (cont )

Chan -,+
Left
-.8
4 6 12
Front Wheel Angles (deg)
Chan -.4
Right
-.S
dfw -.4
(deg) .- - , tl Average - !? . l.J
4 .- - 1.j 8 12 C:I
Figure 46 (cont)

A r t i c u l a t i o n Angle (deg)
Chan
* 11
.4
C3
-, 4
Gam -.b ideg) - 1.2
- 1.6
- '7 Y
- 2 .Lj O 8 12
TIME isec)
Figure 46 (cont)

Tractor Yaw Rate (degls)
-.7 Chan r 16 -1.4
12
TIME Isec)
Figure 46 (cont )

Speed (mph)
_-, . ' --- ". Measured ( ----- I
,,.--- .--'--* --
,-Fa
TIME (set)
Figure 47. Phase 4 model/test comparisons ; brakinglaccelerating maneuver; vehicle A.

Lateral Acceleration (g ' s )
.O;i
0
-.04 A7
tgts) -.08
- . 12
- , 1 f l
- 3 . ii I:! c
-j 10 15 20 2 5 J $0
TIME (sec)
Chan
" 3 rs
/' i
- 3 r . c.
F i g u r e 47 (cont)
O C 1 10 1 :, 20 $7 L ) C 9 0 .,
I
ir
1
r , - ~ ' ' ". i >h>q
b, AT?e: -, 1 f>+

Longitudinal Acceleration (g 's)
. 1 tf
. Cl
O
AX -.06 (g's) -. 10
- .2 4
- .32
- ,4 r: 1 t:l 1 f; 20 .-I C 0 -..' s ,, .I "0
TIME (set)
Figure 47 (cant)

Yaw Rate (degls)
Chan - 1.6
TIME (sec)
Figure 4 7 (cont)

R o l l Angle (deg)
Chan - 1.2
10 C 1 -? 2 0 TIME Csec)
F i g u r e 4 7 ( c o n t )

Front Fheel Angle (deg)
Chan * 9
dfw -.4
[deg) -.' 0 - . ()
10 15 20
TIME (sec)
Figure 4 7 (cont)

Speed (mph.)
60
50
40 Chan * 2 30
20
10
0 O c
-) 10 151 20 25 &. 90
I
I
o E: -.) 10 15 20 3c. ; . I J 3 1.' A
TIME Isec)
Figure 48. Phase 4 model/test comparisons; brakinglaccelerating maneuver; vehicle B .

Lateral Acceleration (g 's)
16 2 5 20
TIME (secl
Figure 48 (cont)

Longitudinal Acceleration (o's)
0 Chan
* 4 -.08
1 1:! 1 20
TIME (see)
Figure 48 (cont)

Yaw Rate (deg/s)
Chan -2
1
0
- 1
r -2
(*lfs) ., - 3
- L j
c - J
- b E m P o -) 1 15 L ~j h r) -.I r .-) '0
TIME (sec)
Figure 48 (cont)

R o l l Angle (deg)
.8
0
-3
Chan - 1.6
TIME (see1
Figure 48 (cont)

Front Wheel Angle (deg)
'7 -.A
Chan * g -.4
- 'i . L.
dfw (deg)
- ,b
C 15 .- r. 0 ,, 10 2 \.! b 3E:
TIME isec)
Figure 48 (cont)

5.4 Conclusions Regarding Model Validation
The basic f indings concerning model va l ida t ion a s seen here i n the
comparisons between vehicle measurements and model predict ions a re :
* General agreement e x i s t s between the predict ions of vehicle response
provided by the steady-turning vehicle models and measurements of
ac tua l vehicles under s imi la r operating conditions.
* Comparisons between t e s t r e s u l t s and the Phase 4 model f o r t rans ien t
obstacle avoidance and braking / acce lera t ing maneuvers perf armed
along superelvated curves a l so were shown t o exhib i t very good
agreement.
* Iden t i f i ca t ion of r e l a t i v e l y small f r i c t i o n f ac to r s a t individual
wheel loca t ions through processing of normal vehicle response
measurements i s highly sens i t i ve t o the accuracy of those response
measurements. The enhanced s e n s i t i v i t y i s due t o the dependence of
each f r i c t i o n f ac to r value on four o r more d i f f e r e n t measured
quant i t ies . Therefore, unless a l l of the contr ibut ing measurements
a r e f a i r l y accurate , the expectation of obtaining an accurate estimate
f o r the pa r t i cu l a r f r i c t i o n f ac to r is diminished. (This matter i s
addressed fu r the r i n the next chapter when s e n s i t i v i t i e s of f r i c t i o n
f a c t o r values deriving from possible measurement e r r o r s a r e examined.)
* As a consequence of the above observations, use of the steady turning
models to pred ic t or estimate individual wheel f r i c t i o n fac tor values
i s viewed a s more r e l i a b l e and preferable t o cur ren t ly ex is t ing
methods of d i r e c t measurement. This of course assumes tha t reasonable
or representat ive est imates of vehicle parameters a r e used i n the
models.

Chapter 6
SENSITIVITY ANALYSES
The mater ial contained i n t h i s chapter presents r e s u l t s of several
s e n s i t i v i t y analyses conducted with the steady turning and Phase 4 models.
The general th rus t of most of these analyses i s directed a t the influence tha t
various vehicle and highway gemetric parameters may have i n influencing
f r i c t i o n f ac to r demand or d i s t r i bu t ion on a vehicle. A passenger car and a
five-axle t rac tor -semi t ra i le r were used as representat ive, o r basel ine,
vehicles i n the parameter var ia t ion s tudies . The baseline parameter s e t s used
i n these analyses correspond t o passenger car A and the five-axle t rac tor -
semi t ra i le r t e s t vehicles. The pr inc ipa l difference between the data s e t s
used here and those used f o r comparisons seen i n chapter 5 was vehicle speed.
Most of the analyses i n t h i s chapter were performed a t a baseline speed of
approximately 56 mph (90 km/h) ( se lec ted from one of the t e s t runs f o r vehicle
A a t curve 1). The baseline curve geometry corresponds t o t ha t of curve 1
(1273 f t (388 m) radius; 6.7 percent superelevation).
Sections 6.1 and 6.2 present parameter var ia t ion s tudies performed with
the steady turning models f o r the basel ine passenger car and t rac tor -
semi t ra i le r . Section 6.3 shows r e s u l t s of a s imi la r study f o r obstacle
avoidance maneuvers using these same vehicles and the Phase 4 model. Steady
turning and obstacle avoidance maneuvers performed under low f r i c t i o n
conditions a r e examined i n sec t ion 6.4 . Section 6.5 discusses basic
re la t ionships between f r i c t i o n f ac to r s and vehicle response variables and how
e r ro r s i n vehicle measurements can a f f e c t estimates of f r i c t i o n f ac to r values.
Last ly , sec t ion 6.6 examines d r ive r s teer ing requirements and observed
behavior during t r ave r sa l of superelevated curves.
6.1 Passenger Car Parameter Variations
The r e s u l t s seen i n t h i s sect ion i l l u s t r a t e the e f f e c t s upon individual
wheel f r i c t i o n f ac to r values and basic vehicle response variables which can be

expected by varying d i f f e r e n t vehicle and highway geometric parameters. The
s i ze of each parameter va r i a t i on was selected t o be representat ive of possible
parameter changes t h a t can occur. For example varying a vehic le ' s t i r e
cornering s t i f f n e s s by 50 percent or more would be unreasonable and not
representa t ive of l i k e l y occurrences i n the vehicle population. Variations of
25 percent, however, can occur due t o i n f l a t i o n pressure changes and wear-
re la ted phenomena, This type of ra t iona le was used f o r se lec t ing the
parameter va r i a t i ons appearing i n t h i s study.
The basel ine condition f o r passenger car A corresponds t o curve s i t e 1
and a t r a v e l speed of 56.7 mph (91 km/h). Figures 49 through 54 present
r e s u l t s f o r f r i c t i o n f ac to r va r i a t i ons resu l t ing from various changes i n
vehicle and highway parameters. For example, the top port ion of f i gu re 49
shows the inf luence of varying curve radius by 10 percent. F r i c t i on f ac to r
values a r e seen t o increase and decrease from the baseline condition, f o r each
wheel locat ion and the equivalent point-mass (c.g.) value, i n response t o the
curve radius changes. Likewise the lower port ion of f i gu re 49 i l l u s t r a t e
s imi la r r e s u l t s due t o changes i n highway superelevation r a t e (8.7, 6.7, and
4.7 percent). For a l l of the r e s u l t s seen i n t h i s sec t ion , only one parameter
va r i a t i on a t a time away from the basel ine condition i s being performed.
Figure 50 i l l u s t r a t e s the e f f e c t t h a t changes i n speed and highway grade have
upon a l t e r i n g f r i c t i o n f a c t o r levels . As seen i n f igures 49 and 50, and which
should be expected based upon a point-mass ana lys is , the f r i c t i o n f a c t o r
values a re s ign i f i can t ly a f fec ted by curvature, superelevation and speed, but
very l i t t l e by highway grade. Moreover, the degree of f r i c t i o n f ac to r
va r i a t i ons seen i n f i gu re 49 f o r each of the wheel loca t ions i s more o r l e s s
the same amount exhibi ted by the point mass value. That i s , no pa r t i cu l a r
wheel loca t ion i s seen changing by a disproport ionate amount i n comparison t o
the point-mass value. As such, these r e s u l t s suggest t ha t a point-mass
formulation provides not only a reasonably accurate predict ion of the values
of the individual wheel f r i c t i o n f a c t o r s f o r passenger ca r s , but a l so , the
degree t o which they can be expected t o respond t o va r i a t i ons i n highway
geometry.
Examination of f i gu res 51 through 54, which apply t o vehicle-related
parameter va r i a t i ons , shows tha t var ia t ions i n most vehicle parameters have

Baseline: R = 1273 f t V = 56.7 mph e = 0.067 ft / ft
/ Curve Radius Increased 10% e] Baseline Condition Curve Radius Decreased I OX
Frict ion 0.09
Factor 0 -06
LF RF C.G. LR RR
Wheel Locat ion
Baseline: R = 1273 f t V = 56.7 mph e = 0.067 ft/ft
Superelevation Increased Baseline Condition f@ Superelevation Decreased by 0.02 by 0.02
L
Frict ion Factor
LF RF C.G. LR RR Wheel Location
Figure 49. Passenger car parameter variations.

Baseline: R = 1273 ft V = 56.7 mph e = 0.067 ft/ft
- I a Speed Increased 5 MPH fl Baseline Condition Speed Decreased 5 MPH I
Friction Factor
RF C . G , LR
Wheel Location
Baseline: R = 1273 ft V = 56.7 mph e = 0.067 ft/ft
1 3% Up Grade ed Baseline Condition 3% Down Grade I
Friction 0.09
Factor 0.06
0.03
0.00 RF C.G. LR
Wheel Location
Figure 50. Passenger car parameter variations.

R = 1273 ft V = 56.7 mph e = 0.067 ft/ft
C.G. Raised 6 Inches Baseline Condition C . G 1 owered 6 Inches
Friction 0.09
Factor 0.06
0 -03
0 .OO LF RF C.G. LR RR
Wheel Location
'I C.G. Roved Rearward 6 13 Baseline Condition C.6 Moved Forward 6 Inches Inches
LF RF C.G. LR RR Wheel Location
Figure 51. Passenger car parameter variations.

R = 1273 ft V = 56.7 mph e = 0.067 ft /ft -- -
50% Softer Front m Baseline Condition Q 508 Stiffer Front Suspension Suspension
0.12
Friction 0.09
Factor 0.06
0.03
0 .OO W C.G. LR
Wheel Location
R = 1273 ft V = 56.7 mph e = 0.067 ft/ft
502 Softer Rear Suspension Baseline Condition a 50% Stiffer R Suspension
Friction 0.09
Factor
RF C,G. LR
Wheel Locat ion
Figure 52. Passenger car parameter ~ a r i a t i o n s .

R = 1273 f t V = 56.7 mph e = 0.067 f t / f t
/ 1 801 Front Tire Cornerine Baseline Condition @ 1208 Front Tire Cornering / Stiffness Stiffness
Fr ic t ion 0.09
Factor 0.06
0.03
0 -00 I F RF C.G. LR RR
Wheel Location
R = 1273 i t V = 56.7 mph e = 0.067 Wft
11 80% Rear Tire Cornering Baseline Condition 120% Rear Tire Cornering Stiffness Stiffness
LF RF C.G. LR RR Wheel Location
Figure 5 3 . Passenger car parameter variations.

1 108 Shorter Wheelbase Baxline Condition @ IOX Longer Wheelbase ]
Friction 0.09
Factor
RF C.G, LR
Wheel Location
Figure 54. Passenger car parameter variations.

l i t t l e or no e f f e c t upon modifying f r i c t i o n f ac to r values fo r a representat ive
passenger car. Less than 5 percent var ia t ions a r e seen here occurring f o r
var ia t ions i n center of grav i ty height , f igure 51, and var ia t ions i n
suspension proper t ies , f igure 52. In te res t ing ly , t i r e cornering s t i f f n e s s
var ia t ions , f igure 53, have no influence whatsoever upon f r i c t i o n f ac to r
values. The overa l l i n s e n s i t i v i t y of f r i c t i o n f ac to r values t o var ia t ions i n
passenger car propert ies i s of course benef ic ia l to the highway designer.
Provided tha t a reasonable representat ion of the vehicle i s employed, modest
changes i n vehicle proper t ies ( a s perhaps represented by the bulk of the
passenger ca r vehicle population) should have l i t t l e o r no impact upon the
f r i c t i o n f ac to r values occurring i n the basic design. Hence, a par t icu lar
curve design, based upon a mid-size Chevrolet, should apply equally t o
Chevettes and Cadillacs.
The next s e t of f i gu res , 55 through 63, show r e s u l t s of three basic
vehicle responses predicted by the steady turning model f o r the same s e t of
parametric var ia t ions j u s t considered. Instead of examining f r i c t i o n fac tor
changes, a s seen i n f igures 49 through 54, the corresponding vehicle responses
a re seen. Such p lo t s a r e very useful i n explaining how changes i n vehicle or
highway geometry a f f e c t basic vehicle behavior. Figure 55 i l l u s t r a t e s how
changes i n curve radius a f f e c t s three vehicle response variables: required
f ront wheel s t e e r angle, r o l l angle, and vehicle s i d e s l i p angle (angle between
the vehicle heading and the veloci ty vector of the mass center) . For example,
smaller curve r a d i i require l a rge r s t e e r angles and produce r o l l angles
fu r the r away from the road plane ( the " r o l l angle" of the baseline road plane
i s 3.8 degrees). Also, t i gh t e r turning requires addi t ional s i d e s l i p response.
These vehicle response p lo t s a r e useful i n explaining why and how
vehicles respond t o d i f f e r en t parameter var ia t ions during steady turning
motion, even though t h e i r f r i c t i o n f ac to r values may vary by only small
amounts o r not a t a l l . For example, s ign i f i can t changes i n t i r e cornering
s t i f f n e s s e s were seen t o have no e f f e c t upon f r i c t i o n fac tor values i n f igure
53. However, examination of f igure 63 shows tha t s ign i f i can t changes do occur
i n the basic response of the vehicle f o r the corresponding t i r e var iat ions.
In pa r t i cu l a r , d i f f e r en t f ron t wheel s t e e r angles a re required fo r f ront t i r e
cornering s t i f f n e s s va r i a t i ons , while f ront wheel s t e e r angle changes and

Baseline: R = 1273 ft V = 56.7 mph e = 0.067 ft/ft
Radius Increased 10% Baseline Radius Decreased 10%
Front 0.4
Wheel Steer Angle 0.3
Curve Radius Variat ions
Vehicle Rol l Angle 3
2
1
0
Curve Radius Variat ions
0 -00
Vehicle -0.05
Sideslip -o,lo
Angle -0.15
-0 -20
Curve Radius Variations
Pisure 5 5 . Passenger car response variables.
15 0

Baseline: R = 1273 ft V = 56 .7 mph e = 0 . 0 6 7 ft/ft
Speed Increased 5 Baseline Speed Decreased 5 MPH MPH
Speed Variat ions
Vehicle Rol l Angle 3
0
Speed Variat ions
Speed Variat ions
Figure 56. Passenger car response variables.

Baseline: R = 1273 ft V = 56.7 mph e = 0.067 ft/ft
Superelevation Baseline Superelevation b Increased by 0.02 Decreased by 0.02
Front 0.4 Wheel
Steer Angle 0.3
0 ,o Superelevat ion Variations
Vehicle Roll Angle
3
0
Superelevation Variations
0 .oo
Vehicle -o,os Sideslip ,,,,
Angle -0.15
-0.20
-0.25
-0.30
Superelevat ion Variations
Figure 57. Passenger car res?onse var iab les .

Baseline: R = 1273 ft V = 56.7 mph e = 0.067 Wft
1 3% Up Grade Baseline 3X Down Grade
Front 0.4
Wheel Steer Angle 0.3
0.2
0.1
0 .o
Grade Variat ions
Vehic le Rol l Angle 3
2
1
0
Grade Variat ions
0 $00
Vehic le -0.05
Sidesl ip -o,,o Angle
-0.15 I
Grade Variat ions
Figure 58. Passenger car response variables.

Baseline: R = 1273 ft V = 56.7 mph e = 0.067 ft/f&
10% Increase Baseline 10% D~~~~~~~
Front 0.4 Wheel
Steer Angle 0.3
0.2
0.1
0 .o
Wheelbase Variat ions
Vehicle Rol l Angle 3
2
1
0
Wheelbase Variat ions
0.00
Vehicle -0.05
Sideslip ,*,, Angle
-0.15 I
Wheelbase Variat ions
Figure 59. Passenger c a r r e sponse v a r i a b l e s .

Baseline: R = 1273 ft V = 56,7 mph e = 0.067 fVft t
B C.G. Lowered 6 a Baseline c.6. Raised 6 inches Inches
Front 0.4
Wheel Steer Angle 0.3
0.2
0.1
0 -0
C. 6, Height Variations
Vehicle Rol l Angle 3
2
1
0
C. G. Height Variations
0 .oo
Vehicle -0.05
Sideslip Ang 1 e
-0.15 I
C. G. Weight Variations
Figure 60. Passenger car response variables .
155

Baseline: R = 1273 ft V = 56.7 mph e = 0.067 ft/ft
C.G. Moved Baseline B C.6, Moved Forward 6 inches Rearward 6 Inches
Front 0.5
Wheel , ,
Steer Angle 0.3
0.2
0.1
0 .o
C. G. Variations
Vehicle R o l l Angle
C. G. Variations
0 .oo
Vehicle -0.05
Sideslip ,,,, Angle
-0.15
-0.20
-0 -25
-0.30
C. G. Variations
Figure 61. Passenger car response variables.

Baseline: R = 1273 ft V = 56.7 mph e = 0.067 ft/ft
I 50% Softer a 50% Stiffer Baseline 5 50% S o f k r 508 St i f fer Front Front Rear Rear
Front 0.4
Wheel Steer Angle 0.3
0.2
0.1
0 .o
Suspension Variations
Vehicle R o l l Angle 3
(deg) 2
I
0
Suspension Variations
0.00
Vehicle -0.05
Sideslip ,,,, Angle (deg)
-0.15
-0 -25
-0.30
Suspension Variations
Figure 62. Passenger car response var iab les .

Baseline: R = 1273 ft V = 56.7 mph e = 0,067 ft/ft
Front Reduced 0 Front Increased Baseline Rear Reduced @ Rear Increased 20% 208 20% 20%
Front 0.5
Wheel ,, Steer Angie
0 -3
0.2
0.1
0 .o
T i re Variat ions
Vehicle Rol l Angle 3
0
T i re Variat ions
Vehicie -0.05
Sidesl ip Angle
-0.15
T i re Variat ions
Figure 63. Passenger car response var iab les .

s i d e s l i p response changes both occur fo r s imi la r rear t i r e var iat ions. This
simply t e l l s us t ha t the vehicle i s "trimmed" t o a new a t t i t u d e i n response t o
t i r e var ia t ions such as these, but t ha t no change i n l a t e r a l or v e r t i c a l t i r e
forces occur.
Similar i n t e rp re t a t ions can be applied t o f igures 56 through 62 fo r
understanding how vehicles respond t o the remaining parameter var iat ions.
Most of these a r e f a i r l y straightforward. For example, highway grade changes,
f igure 58, have no discernable e f f e c t upon the d i rec t iona l vehicle responses.
Changes i n mass center height and suspension propert ies , f igures 60 and 62,
only influence the r o l l response, whereas f o r e / a f t changes i n mass center
primarily a f f e c t the required s t e e r angle and s i d e s l i p response, f igure 61.
Variations i n vehicle speed and highway superelevation, f igures 56 and 57,
probably have the g rea t e s t overa l l influence on the vehicle responses seen
here. Last ly , vehicle wheelbase var ia t ions , f i gu re 59, produce modest changes
i n required s t e e r angles and small var ia t ions i n s i d e s l i p response.
6.2 Tractor-Semitrailer Parameter Variations
The mater ial presented i n t h i s sect ion f o r the baseline t rac tor -
s emi t r a i l e r c lose ly p a r a l l e l s t ha t seen i n the previous sec t ion fo r the
passenger car. The pr inc ipa l difference here i s tha t the baseline speed of
the t rac tor -semi t ra i le r , 47.6 mph (76 km/h), correponds t o one of the t e s t
runs used a t curve s i t e 1. The reason f o r se lec t ing a speed corresponding t o
one of the t e s t conditions i s so tha t s e n s i t i v i t i e s seen here can be re la ted
to the t e s t data r e s u l t s seen elsewhere throughout the report. Figures 64
through 72 show basel ine f r i c t i o n f ac to r values and t h e i r response t o changes
i n various highway and vehicle parameters. The odd numbered wheel locat ions
on these p l o t s correspond t o the outs ide, or more heavily loaded, wheels. or example, wheel loca t ion number 1 corresponds t o the outside f ront wheel, e tc . )
The "c.g." locat ion corresponds t o the semi t ra i le r mass center and i s the
equivalent point-mass value. As seen i n f igures 64 and 65, changes i n the
highway curvature, superelevation, and vehicle speed produce s ign i f i can t
changes i n the t rac tor -semi t ra i le r f r i c t i o n f ac to r s - s imi la r to those
observed i n the passenger car. However, unlike the passenger car , a point-
mass formulation i s not a t a l l appropriate f o r predicting f r i c t i o n fac tor

Baseline: R = 1273 fl V = 47.6 mph e = 0.067 W f f (Tractor-semi trailer 1
Superelevation Increased Baseline Condition @ Superelevation Decreased , by 0.02 by 0.02 A
Friction Factor
1 2 3 4 5 6 C . G . 7 8 9 10 Wheel Location
Baseline: R 8 1273 ff V = 47.6 mph e = 0.067 Wfl (Tractor-semitrailer)
Radius Increased 10% 0 Baseline Condition Radius Decreased 1 OR C
1 2 3 4 5 C . G . 7 8 9 10 Wheel Location
Figure 64. Tractor-semitrailer parameter variations.

Baseline: R = 1273 f l V = 47.6 mph e = 0.067 fUft (Tractor-semitrailer)
[I Speed Increased 5 MPH Baseline Condition P Speed Decreesed 5 MPH PH]
0.09
Frict ion Factor 0.06
0.03
0 .oo 1 2 3 4 5 6 C . G . 7 8 9 1 0
Wheel Locat ion
Baseline: R = 1273 ft V = 47.6 mph e = 0.067 Wft (Tractor-ssmitrsiier)
w
3% Up Grade a Baseline Condition 3% Down Grade
1 2 3 4 5 6 C . G . 7 8 9 1 0
Wheel Location
Figure 65. Tractor-semitrailer parameter yariations.

values a t the various wheel locat ions of the t ractor-semitrai ler . I n f a c t ,
va r i a t i ons i n f r i c t i o n f ac to r l eve l s occurring from wheel-to-wheel (because of
the commercial vehicle proper t ies discussed i n chapter 2 ) a r e seen t o equal or
exceed those va r i a t i ons due t o speed, curvature, and superelevation e f f e c t s
considered here. The question of whether the point-mass value (which i s
e s s e n t i a l l y a weighted average of the individual wheel f r i c t i o n f ac to r s ) i s an
appropriate value t o use when designing a highway curve f o r commercial
vehic les , i s deferred u n t i l sec t ion 6.4 . Figures 65 through 68 show tha t highway grade, fo re / a f t and v e r t i c a l
payload movements, and suspension changes do not s ign i f i can t ly a f f e c t the
individual wheel f r i c t i o n fac tors . Further, f ron t t i r e cornering s t i f f n e s s
va r i a t i ons and t r a c t o r f i f t h wheel movements l ikewise play no important role.
However, t i r e cornering s t i f f n e s s va r i a t i ons a t the rear suspensions of the
t r a c t o r and semi t r a i l e r , f i gu re 69, do have modest inf luences, but only a t
t h e i r respect ive wheel locat ions. Wheelbase var ia t ions seen i n f igure 70 have
no not iceable e f fec t .
Figure 71 compares f r i c t i o n f ac to r values f o r the loaded basel ine
t rac tor -semi t ra i le r with those predicted f o r the same vehicle but carrying no
payload. Similar comparisons a r e a l so seen f o r a higher operating speed of 60
mph (96 km/h). The r e s u l t s show t h a t a t both speeds the empty vehicle
configurat ion displays g rea t e r dispersion i n i t s f r i c t i o n f ac to r p r o f i l e than
does the loaded vehicle and t h a t the amount of wheel-to-wheel var ia t ion i n
the f r i c t i o n f a c t o r s a l so increases with speed.
F ina l ly , i n f i gu re 72, r e s u l t s from running the loaded baseline vehicle
a t 47, 60, and 70 mph (75, 96, 112 km/h) a r e shown. The strong influence of
forward speed as a determinant of required f r i c t i o n i s c l ea r ly i l l u s t r a t e d i n
t h i s chart . Not only a re the absolute values of f r i c t i o n f ac to r s dramatically
a f fec ted by speed, but so a l s o i s the degree of dispersion, or amount of
wheel-towhee1 variat ion.
Figures 7 3 through 78 (and f igures G-1 t o G-8 of appendix G) present the
corresponding vehicle responses resu l t ing from the same parameter var ia t ions
j u s t considered i n the f r i c t i o n f ac to r plots . Each f igure i s comprised of

Baseline: R = 1273 ff V = 47.6 mph e = 0.067 nlff (Tractor-semitrailer)
7
I Trailer Payload Forward Baseline Condition Trailer Payload Aft 36" 36'
Friction Factor
1 2 3 4 5 6 C . G . 7 8 9 10
Wheel Locat ion
Baseline: R = 1273 ff V = 47.6 mph e = 0.067 nlff (Tractor~emitrailer)
I Trailer C.G. Lowered 20' Baseline Condition Trailer C.G. Raised 20' b
Friction Fact or
1 2 3 4 5 6 C . G . 7 8 9 1 0 Wheel Location
Figure 66. Tractor-semitrailer parameter variations.

Friction Factor
Baseline: R = 1273 ft V = 47.6 mph e = 0.067 Nft (Tractor-semitrailer)
Tract Front Tires Soflened Baseline Condition Tract Front Tire! by 25% by 25X
1 2 3 4 5 6 C.G. 7 8 9 10
Wheel Locat ion
Baseline: R = 1273 R V = 47.6 mph e = 0.067 fVR (Tractor-semitrailer)
Tract Rear Susp Sobned a Baseline Condition Tract Rear Susp Stiffened by 308 by 30%
1 2 3 4 5 6 C . G . 7 8 9 10
Wheel Location
Figure 67. Tractor-semitrailer parameter variations.

Baseline: R = 1273 f l V = 47.6 mph e = 0,067 Rift (Tractor-semitrailer)
Trailer Susp Softened by [;3 Baseline Condition Trailer Susp Stiffened by 30% 30%
I
0 -06
Frict ion Factor 0.04
0.02
0 -00 1 2 3 4 5 6 C.6. 7 8 9 10
Wheel Location
Baseline: R = 1273 f l V = 47,6 mph e = 0.067 Wft (Tractor-semitrailer)
1
Tractor 5th Wheel Forward Baseline Condition Tractor 5th Wheel Aft 8' 8'
1 2 3 4 5 6 C . G . 7 8 9 10
Wheel Locat ion
Figure 68. Tractor-semitrailer parameter variations.

Baseline: R = 1273 fl V = 47.6 mph e = 0,067 Wfl (Tractor-semitrailer)
Tract Rear Tires Softened Baseline Condition Tract Rear Tires Stiffened by 25% by 25%
Friction Factor
1 2 3 4 5 6 C.G. 7 8 9 10 Wheel Location
Baseline: R = 1273 ft V = 47.6 mph e = 0.067 fVfl (Tractorsemitrailer)
----
1 2 3 4 5 6 C . G . 7 8 9 1 0 Wheel Location
I Trailer Tirss Softened by fa Baseline Condition @ Treiler Tirsrr Stiffened by 25% 25%
Figure 69. Tractor-semitrailer parameter variations.
J

Baseline: R = 1273 ff V = 47.6 mph e = 0.067 Wff (Tractor-semitrailer)
I Tractor Wheelbase a Baseline Condition Tractor Wheelbase Shortened by 15% Lengthened by 1574
Frict ion Factor
1 2 3 4 5 6 C.G. 7 8 9 10 Wheel Locat ion
Baseline: R = 1273 ft V = 47.6 mph e = 0.067 Wff (Tractor-semitrailer)
I Trailer Wheelbase Baseline Cornlition Trailer Wheelbase Shortened by 15% Lengthened by 15R
0.06
Frict ion Factor 0.04
0.02
0 -00 1 2 3 4 5 6 C . G . 7 8 9 10
Wheel Locat ion
Figure 70. Tractor-semitrailer parameter variations.

Baseline: R = 1273 ft V = 47.6 mph e = 0.067 Wff (Tractor-semitrailerl
1 Baseline Condition 5 Empty Vehicle
Friction Factor
Friction Factor
1 2 3 4 5 6 C . G . 7 0 9 10 Wheel Locat ion
Baseline Curve: R = 1273 ft e = 0.067 Wft (Tractor-semi trailer)
Loaded Baseline 6 6 0 mph a Empty Vehicle C 6 0 mph I
1 2 3 4 5 6 C.G. 7 8 9 10
Wheel Location
Figure 71. Tractor-semitrailer parameter ~ariations.

Baseline: R = 1273 ft V = 47.6 mph e 0.067 N R (Tractorsemitrailer 1
Baseline Condition 60 mph 1 70 mph
Friction Factor
1 2 3 4 5 6 C . G . 7 8 9 10
Wheel Locat ion
Figure 72. Tractor-semitrailer parameter variations.

Baseline: R = 1273 ft V = 47,6 mph e = 0.067 Wft Tractorseml trailer
Increased 10% Baseline Decreased 1OW
Front '0.6
Wheel 0.5 Steer Angle 0.4
0.3
0.2
0.1
0 .o Curve Radius Variations
Rol l Angle 3
2
1
0
Curve Radius Variations
Articulation Anglel ,7
1,6
1.5
I -4
1.3
Curve Radius Variations
Figure 73. Tractor-semitrailer response variables.

Baseline: R = 1273 ft V = 47.6 mph e = 0.067 fUft Tractorsemitraller
Increased 10% Baseline Decreased 10%
0.09 Tractor 0,0,
Sideslip 0.07
Angle O a o 6 0.05 0.04 0.03 0.02 0.01 0 .oo
Curve Radius Variations
Baseline: R = 1273 ft V = 47 6 mph 8 = 0.067 fWft Tractor-semitrailer
Increased 10% Baseline kf Decreased 10%
Trailer ,,4
Sideslip Angle O.3
0.2
0.1
0 ,o Curve Radius Variations
Figure 73 (cont)

Baseline: R = 1273 f l V = 47.6 mph e = 0.067 fUft Tractor-semitrailer
1 Increased by 0.02 Baseline Decreased by 0.02
Front 0.6
Wheel 0.5
Steer Angle 0.4 0.3
0.2
0.1
0 .o Superelevat ion Variations
Rol l Angle
3
2
1
0
Superelevation Variations
1.8 Articulation
Angle 1.7 1
Superelevation Variations
Figure 74. Tractor-semitrailer response variables.

Bsseline: R = 1273 it V = 47 6 nph e = 0.067 fUn Tractor-semi trailer
I Increased by 0.02 Baseline Decreased by & 0.02 1
Tractor 0.15 Sideslip lo
0.05
0 .OO
-0.05
Superelevation Variations
Baseline: R = 1273 it V = 47 b mph e = 0.067 ft/fl Tractorsemi trailer
I Increased by 0.02 Baseline Decreased by L 0.02
Trailer 0.5
Sideslip ,,4
Angle 0.3
0.2
0.1
0 .o Superelevat ion Variations
Figure 7 4 (cont )

Baseline: R - 1273 ft V - 47.6 mph e - 0,067 Wft Tractor-semitrailer
Speed Increased Baseline Speed Decreased 5 HPH 5 MPH
Front Oh Wheel 0.5
Steer Angle 0.4
0.3
0.2
0.1
0 .o Speed Variations
Ro l l Angle 3
2
1
0
Speed Variations
Articulation Angle 1.7
Speed Variations
Figure 75. Tractor-semitrailer response variables.

Baseline: R - 1273 f i V - 47.6 rnph s - 0.067 ft/ft Tractor-semitrailer
Speed Increased Baseline Speed Decreased 5 MPH 5 MPH
Tractor Sideslip
Angle
Speed Variations
Baseline: R - 1273 ft V - 47.6 mph e - 0,067 ft/ft Tractor-semitrailer
Speed Increased 1 Baseline E# Speed Decreased 5 MPH 5 NPH
Tra i le r 0.5
Sideslip 0.4
Angle 0,3
0.2
0.1
0 .o Speed Variations
Figure 75 ( con t )

Baseline: R = 1273 ft V = 47.6 rnph e = 0.067 Wft Tractorsemitraller
8OX Cornering a Baseline 125% Cornering S m s Stiffaesc;
0 -7
Front 0.6
Wheel 0.5
Steer Angle 0.4 0.3
0.2
0.1
0 .0
Tractor Front T i re Variat ions
Rol l Angle 3
2
1
0
Tractor Front T i re Variat ions
Articulation Angle
Tractor Front T i re Variat ions
Figure 76. Tractor-semitrailer response variables,

Baseline: R 5 1273 ft V = 47.6 mph e = 0.067 ft/n Tractor-semitrailer
80% Cornering ed Baseline f@ 125% Cornering Stiffness S t i f r n s
0.06
Tractor 0.05
Sideslip ,,, 0.03
0.02
0.01
0 .oo Tractor Front T i re Variations
Baseline: R = 1273 f't V = 47.6 mph e = 0.067 fVft Tractor-semitrafler
80% Cornering Pd Baseline 125X Cornering Sliffbees Stifbees
Tra i le r 0.4 Sideslip
Angle O5
0.2
0.1
0 -0
Tractor Front T i re Variations
Figure 76 (cont)

Baseline: R = 1273 ft V = 47.6 mph e = 0.067 Wft Tractor-semitrailer
3
6 80% Cornering e) Baseline 125% Cornering e=s s-ts
Front 0.6
Wheel 0.5
Steer Angle 0.4 0.3
0.2
0.1
0 .o Tractor Rear T i re Variations
Rol l Angle 3
2
1
0
Tractor Rear T i re Variations
Articulation Angle, ,7 '" 1
Tractor Rear T i re Variations
Figure 77. Tractor-semitrailer response variables.

Baseline: R = 1273 ft V = 47.6 mph e = 0.067 Wft Tractor-semitrailer
IC 00% Cornerlng Basellne 125% Cornering b S k i m Stif-
0.12
Tractor 0810
Sideslip 0.08 0.06 0.04 0.02 0 .oo
-0.02
Tractor Rear Ti re Variations
Baseline: R = 1273 R V = 47.6 mph e = 0.067 fUft Tractor-semitrailer
I 00% Cornering Baseline !8 125% Cornerlng Stiftaers s
Trailer o, Sideslip
Angle O e 3
0.2
0.1
0 .o Tractor Rear Ti re Variations
Figure 7 7 (cont)

Baseline: R = 1273 ft V = 47.6 mph e = 0.067 fUft Tractor-semitrai ter
1). 802 Cornering Pa Baseline &! 125% Cornering S t , e + s SUffn~sc,
0,6
Front 0.5 Wheel 0,4
Steer Angle o,3
0.2
0.1
0.0
Trai ler T i re Variations
Roll Angle 3
2
1
0
Trailer Tfre Variations
Articulation Angle -7
Trai ler T i re Variations
Figure 78. Tractor-semitrailer response variables.

Baseline: R = 1273 ft V = 47.6 mph e = 0.067 Nft Tractor-semitrailer
t
80% Cornering Pd Baseline 125% Cornering Stiffness
0,06
Tractor 0.05
Sideslip ,,, 0.03
0.02
0.01
0 .oo Trai ler T i re Variations
Baseline: R = 1273 ft V = 47.6 mph e = 0.067 fUft Tractor semitrai ler
1) 80% Cornering e/ Baseline 125% Cornering Stiftness
Tra i le r Sideslip
Angle Om3
0.2
0.1
0 .o Trai ler T i re Variations
Figure 78 (cont)

f ive d i f f e r en t vehicle response variables and a re grouped according t o a
s ingle parameter var iat ion. For example, f igure 73 i l l u s t r a t e s the required
t r ac to r s t e e r angle, t ractor-semitrai ler r o l l angle, a r t i cu l a t ion angle,
t r ac to r and semi t ra i le r s ides l ip angles resu l t ing from 10 percent changes i n
curve rad i i . Use of these vehicle response p lo t s , i n combination with the
corresponding f r i c t i o n f ac to r p lo t s j u s t examined, permit an understanding of
how a vehicle can exhib i t l i t t l e or no change i n f r i c t i o n fac tors despi te
s ign i f i can t var ia t ions of ce r t a in vehicle properties. As i n the case of the
passenger car , t i r e cornering s t i f f n e s s var ia t ions produce l i t t l e o r no change
i n individual wheel f r i c t i o n f ac to r values. However, f igures 77 and 78
suggest tha t s ign i f icant changes do occur i n the vehicle response or "trim"
condition as a r e s u l t of these t i r e var iat ions. Figure 76 shows t h a t t r ac to r
s t e e r angle alone i s the vehicle response to a change i n t r a c t o r f ront t i r e
cornering s t i f f n e s s . Changes i n t r a c t o r r ea r t i r e propert ies , f igure 7 7 ,
r e su l t i n a d i f f e r en t t r a c t o r s t e e r angle, a r t i cu l a t ion angle, and t r ac to r
s i d e s l i p response. And l a s t l y , semi t ra i le r t i r e var ia t ions seen i n f igure 78
only influence a r t i cu l a t ion angle and semi t ra i le r s ides l ip response.
As was observed i n the passenger car case and i s seen here f o r the
t ractor-semitrai ler , i n f igures 73 through 75, var iat ions i n highway
curvature, superelevation, and vehicle speed have the grea tes t overal l
influence, not only i n f r i c t i o n fac tor var ia t ions , but i n terms of vehicle
reponse var ia t ions a s well. Figure 76 again shows highway grade t o have no
important e f f e c t upon the vehicle steady turning response. Variations i n
t rac tor -semi t ra i le r suspension propert ies , f igures G-2 and G-3 of appendix G ,
a r e seen t o influence only the vehicle r o l l response. or el aft movement of
the t r a c t o r f i f t h wheel, f igure G-4 of appendix G , primarily a f f ec t s the
required t r a c t o r s t e e r angle and the t rac tor / semi t ra i le r s ides l ip responses.
Vert ical movement of the semi t ra i le r mass center only influences r o l l response
whereas f o r e l a f t movement of the semi t ra i le r mass center r e su l t s i n
s ign i f i can t changes i n a r t i c u l a t i o n angle and vehicle s ides l ip , f igures G-5
and G-6 of appendix G. Lastly, wheelbase var ia t ions seen i n f igures G-7 and
G-8 of appendix G , show tha t t r ac to r wheelbase var ia t ions influence the
required t r a c t o r s t ee r angle and i t s s ides l ip response, while var iat ions i n
semi t ra i le r wheelbase r e su l t i n changes only to a r t i cu l a t ion angle and
semi t ra i le r s ides l ip response.

6.3 S e n s i t i v i t y of Peak F r i c t i o n Factors During Obstacle Avoidance Maneuvers
This s e c t i o n p resen t s a summary of f ind ings r e l a t e d t o peak f r i c t i o n
f a c t o r values occurr ing during a simulated obs tac le avoidance (double-lane-
change) maneuver. The Phase 4 model was used t o s imulate the e a r l i e r
descr ibed lane-to-lane movement us ing a d r i v e r model [6 ] . The r e s u l t s seen
here a r e f o r the same base l ine passenger ca r and t r ac to r - semi t ra i l e r . Both
veh ic les perform the same maneuver (same path i n p u t ) and a t the same speed of
56 mph (90 km/h). The curve geometry corresponds t o curve s i t e 1 ( l e f t tu rn ) .
Af te r reaching a s teady turning cond i t ion on the supere levated curve i n the
o u t s i d e t r a v e l l a n e , the d r i v e r model s t e e r s t h e veh ic le t o t h e i n s i d e lane
(12 f t (3.6 m) l a t e r a l l y ) , and then back again t o the o r i g i n a l lane. The
l a t e r a l l ane change displacements occur over a t o t a l forward t r a v e l d i s t a n c e
of approximately 300 f t (91 m). The "sever i ty" of the maneuver would be
c l a s s i f i e d a s "moderate" meaning t h a t i t i s more demanding than a standard
passing maneuver, but considerably l e s s demanding than an evas ive emergency
maneuver,
Figure 7 9 shows values of & f r i c t i o n f a c t o r produced a t each wheel
l o c a t i o n and the mass c e n t e r (point -mass va lue ) of the passenger c a r during
the descr ibed base l ine maneuver. Also shown on the same p l o t a r e peak
f r i c t i o n f a c t o r values corresponding t o runs performed with smal ler and l a r g e r
r a t e s of highway superelevat ion. The r e s u l t s i n d i c a t e t h a t a l though the
required f r i c t i o n l e v e l s a r e s e v e r a l times those required f o r simple s teady
turning on the same curve, the d i f f e r e n c e i n peak f r i c t i o n f a c t o r values due
t o d i f f e r e n t r a t e s of highway supere leva t ion d i f f e r only by the amount of the
supere levat ion,
Figures 80 and 81 present s i m i l a r p l o t s showing r e s u l t s of speed changes
and t i r e proper ty v a r i a t i o n s . The inf luence of forward speed is s i g n i f i c a n t
a s seen i n f i g u r e 80; however, t h e degree of v a r i a t i o n a t ind iv idua l wheel
l o c a t i o n s is more o r l e s s comparable t o the v a r i a t i o n experienced by the mass
c e n t e r (point -mass) . In f i g u r e 81, v a r i a t i o n s i n t i r e p r o p e r t i e s a r e
considered. The r e s u l t s i n d i c a t e t h a t peak f r i c t i o n f a c t o r values depend only
weakly on the l a t e r a l e f f e c t i v e n e s s of t h e v e h i c l e ' s t i r e s .

Peak Friction Factors During Double-Lane-Change Baseline: 1273' Radius e = 0.067 56 mph
1 0.087 Baseline 0,047
Superelevation Superelevation
Peak Friction 1 Factors 0.2
Left Front Right Front Point-Mass Left Rear Right Rear
Location
Figure 79. Peak friction factors occurring during obstacle avoidance maneuver; passenger car.

Peak Friction Factors During Double-Lane-Change Baseline : 1273' Radius e = 0.067 56 mph
1 61 mph Baseline 51 mph
Peak 0.4
Friction 0.3
Factors 0.2
0.1
0 .o Left Front Right Front Point-Mass Left Rear Right Rear
Locat ion
Figure 80. Peak f r i c t i o n f a c t o r s occu r r ing du r ing o b s t a c l e avoidance maneuver; passenger c a r .

Peak Friction Factors During Double-Lane-Change Baseline: 1273' Radius e = 0.067 56 mph
Tires Stiffened Baseline Tires Softened 25 X 25%
Peak Friction Factors
Left Front Right Front Point-Mass Left Rear Right Rear
Location
Figure 81. Peak friction factors occurring during obstac avoidance maneuver; passenger car.

L a s t l y , f i g u r e 82 compares peak f r i c t i o n demand f o r ind iv idua l wheel
l o c a t i o n s of the base l ine passenger c a r during the obs tac le avoidance maneuver
with s teady turning f r i c t i o n f a c t o r requirements a t the same wheel locat ions .
The p l o t shows t h a t peak f r i c t i o n demands exceed s teady turning f r i c t i o n
requirements by f a c t o r s of 2 . 5 t o 3.5 depending upon the wheel locat ion. The
peak f r i c t i o n f a c t o r values a l s o e x h i b i t f a r g r e a t e r v a r i a t i o n from wheel-to-
wheel than do the steady turning f r i c t i o n f a c t o r values. Sect ion 6.4 w i l l
examine, by g radua l ly reducing the l e v e l of the a v a i l a b l e t i r e l r o a d f r i c t i o n ,
the minimum f r i c t i o n l e v e l requirement of the t i r e l r o a d su r face such t h a t t h i s
p a r t i c u l a r o b s t a c l e avoidance maneuver can s t i l l be performed i n a s t a b l e
manner . Figures 83 through 86 show a s e t of s i m i l a r p l o t s f o r the base l ine
t r a c t o r - s e m i t r a i l e r ( t h e odd numbered wheel l o c a t i o n s i n these f i g u r e s r e f e r
t o the l e f t s i d e o r i n s i d e wheels). The same b a s i c f ind ings apply t o the
t r a c t o r - s e m i t r a i l e r v e h i c l e wi th the mild exception of f i g u r e 85. The
in f luence of t i r e property v a r i a t i o n s seen i n t h i s f i g u r e i s somewhat s t ronger
than t h a t seen f o r the passenger car. The s e n s i t i v i t y d i f f e r e n c e s observed
here . a r e pr imar i ly a t t r i b u t a b l e t o the previously noted d i f f e r e n c e s i n
v e r t i c a l load s e n s i t i v i t i e s of t ruck t i r e s and passenger c a r t i r e s . F i n a l l y ,
f i g u r e 86 compares peak f r i c t i o n f a c t o r values experienced by t h e t r a c t o r -
s e m i t r a i l e r dur ing the o b s t a c l e avoidance maneuver wi th f r i c t i o n f a c t o r values
required f o r s t eady tu rn ing on the same curve. A s i n t h e passenger c a r case ,
the peak values exceed the s teady turning values by f a c t o r s of 2 .5 t o 3 . 5
depending upon the wheel locat ion. However, un l ike t h e passenger c a r r e s u l t s ,
the t r a c t o r - s e m i t r a i l e r e x h i b i t s s i g n i f i c a n t wheel-to-wheel v a r i a t i o n s i n
f r i c t i o n f a c t o r s f o r s teady tu rn ing a s we l l a s f o r peak f r i c t i o n f a c t o r values
i n the obs tac le avoidance maneuver. The l a r g e s t peak f r i c t i o n f a c t o r value
observed f o r the t r a c t o r - s e m i t r a i l e r , 0.39, i s a t wheel l o c a t i o n 9 (rearmost
i n s i d e wheel), while the maximum value seen f o r t h e passenger c a r i s 0.36 a t
the l e f t f r o n t ( i n s i d e ) wheel loca t ion .

Peak Friction Factors During Double-lane-Change Curvef 1 56 mph
Peak Friction Factors '*' Steady Turning
Peak 0.3
Friction Factors 0.2
0 .o Left Front Right Front Point-Mass Left Rear Right Rear
Location
Figure 82. Peak friction factor comparison; obstacle avoidance maneuver vs steady turning maneuver; passenger car.

Peak Friction Factors During Double-Lane-Change Baseline: 5-Axle Tractor-Semi 1273' Radius e = 0.067 56 mph
1 0.087 a Baseline 0.047 Superelevation Superelevation
Peak 0.4
Friction ,,3 Factors
0.2
0 .1
0 .o 1 2 3 4 5 6 C . G . 7 8 Q 10
Locat ion
Figure 83. Peak friction factors occurring during obstacle avoidance maneuver; tractor-semitrailer.

Peak Friction Factors During Doubleiane-Change Baseline: 5-Axle Tractor-Semi 1273' Radius e = 0.067 56 mph
61 mph Baseline 51
Peak 0.4
Friction ,,3 Factors
0.2
0#1
0 .o 1 2 3 4 5 6 C . G . 7 8 9 1 0
Locat ion
Figure 84. Peak f r i c t i o n f ac to r s occurring during obstacle avoidance maneuver; t rac tor -semi t ra i le r .

Peak Friction Factors During Double-Lane-Change Baseline: 5-Axle Tractor-Semi 1273' Radius e = 0.067 56 mph
Tires Stiffened Baseline @ Tires Softened 25% 25%
Peak 0.3 Friction Factors 0,2
1 2 3 4 5 6 C . G . 7 8 9 1 0 Locat ion
Figure 85. Peak friction factors occurring during obstacle avoidance maneuver; tractor-semitrailer.

Peak Friction Factors During Doubie-lane-Change 5-Axle Tractor-Semi Curve* 1 56 mph
Peak Friction Factors '*' Steady Turning
Peak 0.3
Friction Factors 0.2
0 .o 1 2 3 4 5 6 C.G. 7 8 9 10
Locat ion
Figure 86. Peak friction factor comparison; obstacle avoidance maneuver vs steady turning maneuver; tractor-semitrailer .

6.4 Steady Turning and Obstacle Avoidance Maneuvers Under Low F r i c t i o n
Condit ions
This s e c t i o n p resen t s r e s u l t s of a b r i e f s tudy which examined how - low
f r i c t i o n cond i t ions may in f luence observat ions which he re to fo re assumed t h a t
t h e demanded o r required f r i c t i o n a t each wheel l o c a t i o n was a v a i l a b l e during
s teady tu rn ing and o b s t a c l e avoidance maneuvers. In t h i s s e c t i o n s imulat ion
runs i d e n t i c a l t o those j u s t conducted were performed under low f r i c t i o n
condi t ions . The l e v e l of maximum t i t e l r o a d f r i c t i o n was now lowered t o
var ious values i n the v i c i n i t y of the point-mass f r i c t i o n recorded during the
high f r i c t i o n runs. The purpose of t h i s study was t o examine how wheel-to-
wheel v a r i a t i o n s i n f r i c t i o n f a c t o r values might in f luence the d i r e c t i o n a l
s t a b i l i t y of the d r ive r lveh icbe system under these extreme condi t ions . In
genera l , the r e s u l t s show t h a t a s long a s the maximum t i r e / r o a d su r face
f r i c t i o n l e v e l i s a t l e a s t a s g r e a t a s the point-mass (c.g.) value observed
during the high f r i c t i o n cond i t ions , the same veh ic le maneuver can be
performed i n a s t a b l e manner.
Figure 87 summarizes t h e r e s u l t s f o r t h e s teady turning maneuver under
low f r i c t i o n condit ions. This f i g u r e i n d i c a t e s t h a t s teady turning runs
performed on s u r f a c e s having maximum f r i c t i o n l e v e l s below a c e r t a i n value
r e s u l t e d i n uncon t ro l l ab le veh ic le behavior. The minimum f r i c t i o n l e v e l
needed t o guarantee s t a b l e curve nego t i a t ion f o r t h e passenger c a r under these
condi t ions was approximately equal t o the point-mass f r i c t i o n f a c t o r value.
For the t r a c t o r - s e m i t r a i l e r , t h e necessary f r i c t i o n l e v e l was approximately 10
pe rcen t g r e a t e r than t h a t required f o r the passenger car . Even though c e r t a i n
t i r e s may s a t u r a t e f o r s h o r t per iods of time under these f r i c t i o n condi t ions ,
the d r i v e r / v e h i c l e systems a r e s t i l l ab le t o perform the s teady turning
maneuver wi th no unusual veh ic le o r d r i v e r s t e e r i n g behavior. For f r i c t i o n
l e v e l s below the point-mass value , the na tu re of the i n s t a b i l i t y t h a t does
occur i s , f i r s t , a slow and gradual l o s s of path c o n t r o l wi th the veh ic le
plowing t o t h e ou t s ide of the turn. This i s l a t e r followed by a "spin-out"
or l o s s of d i r e c t i o n a l c o n t r o l , a s the d r i v e r i n c r e a s e s the s t e e r i n g angle
a t tempt ing t o regain the path a s seen i n f i g u r e 88.


t i r e l r o a d f r i c t i o n < point-mass value
Figure 88. Loss of d i r e c t i o n a l con t ro l experienced by passenger ca r under low f r i c t i o n cond i t ions .

Figure 89 summarizes the r e s u l t s of the low f r i c t i o n obstacle avoidance
maneuvers. As observed f o r the steady turning maneuver, the r e s u l t s show tha t
i f the t i r e / road f r i c t i o n coupling i s a t l e a s t as great a s the peak f r i c t i o n
f ac to r value experienced by the mass-center during the high f r i c t i o n runs, the
vehicle maneuver can be performed i n a s t ab l e and near normal manner. Again,
even though several t i r e s undergo shor t periods of l a t e r a l force sa tu ra t ion
during the maneuver, the dr iver lvehic le systems were able to perform the
maneuver very s imi la r ly t o t ha t seen i n the high f r i c t i o n cases. For cases i n
which the t i r e / road f r i c t i o n coupling i s s l i g h t l y l e s s than the minimum value,
the vehicles exhibi ted d i f f e r en t forms of d i r ec t iona l and path i n s t a b i l i t y .
The passenger ca r , f o r example, begins the turn t o the in s ide lane but i s
unable to recover i t s d i r ec t iona l s t a b i l i t y and continues spinning i n the same
direct ion. During the spin, the vehicle mass center moves f i r s t t o the ins ide
lane , and then back across both lanes t o the outside of the curve. The
t rac tor -semi t ra i le r experienced l o s s of l a t e r a l path control during re turn to
the i n i t i a l t r a v e l lane. Although the vehicle did not jackknife, i t did
overshoot i t s re turn to the i n i t i a l lane by a considerable extent (toward the
outs ide of the curve) and would have encountered a guard r a i l or s teep s ide
slope under most ac tua l highway circumstances.
6.5 Analytical F r i c t i on Factor Expressions
From the equations f o r the steady turning models contained i n appendices
A and B, symbolic expressions can be formed which r e l a t e the f r i c t i o n f ac to r
values t o the various model parameters and vehicle response variables .
Unfortunately, most of these expressions can be qu i t e complex i n t h e i r
complete form. Normally, very l i t t l e i n s igh t i s gained by examining such
complicated formulas. However, the simplest of these f r i c t i o n f ac to r
expressions occur fo r the two-axle model and a r e presented here t o i l l u s t r a t e
the nature of the parametric relat ionships. Equations (8) through (11) show
the f r i c t i o n f a c t o r expressions corresponding t o the l e f t f r o n t , r i gh t f r o n t ,
l e f t r ea r , and r igh t rear wheel loca t ions , respect ively, of a passenger car :


The parameters appearing i n these expressions a re defined i n tab le 5.
Since each of these expressions i s simply the r a t i o of l a t e r a l t i r e force,
t o v e r t i c a l t i r e force , FZ, the numerator and denominator expressions a r e F ~ '
simply l a t e r a l and v e r t i c a l t i r e forces expressed i n terms of the model
parameters and response variables. Equations 8 and 9 show tha t f ront t i r e
l a t e r a l forces depend upon s i d e s l i p ve loc i ty , vehicle speed, path curvature,
and f ront wheel s t e e r angle. Rear t i r e l a t e r a l forces depend upon the same
vehicle reponses except f ront wheel s t ee r angle. Since steady turning motion
along most highway curve designs produces l i t t l e load t r ans fe r on a vehicle i n
a f o r e l a f t d i rec t ion and only modest amounts s ide t o s ide , the denominator
expression fo r v e r t i c a l t i r e load i s primarily dominated by the s t a t i c t i r e
load term. Accordingly, a f i r s t order examination of the f r i c t i o n f ac to r
s e n s i t i v i t i e s under the assumed operating conditions should focus on l a t e r a l
t i r e force production, o r the quan t i t i e s appearing i n the numerator of the
above equations. The numerator terms show tha t var ia t ions i n f r i c t i o n fac tor
values can be expressed d i r ec t ly i n terms of var ia t ions i n vehicle s ides l ip ,
path curvature, or s t e e r angle.

Table 5. Parameter and v a r i a b l e d e f i n i t i o n s
f r o n t t i r e corner ing s t i f f n e s s ((0)
r e a r t i r e corner ing s t i f f n e s s (<O)
d i s t a n c e from f r o n t a x l e t o veh ic le mass c e n t e r
d i s t a n c e from r e a r a x l e t o v e h i c l e mass c e n t e r
highway supere leva t ion
f r o n t suspension s t i f f n e s s
r e a r suspension s t i f f n e s s
f r o n t s t a t i c ax le load
r e a r s t a t i c ax le load
veh ic le sprung mass p i t c h angle r e l a t i v e t o the h o r i z o n t a l plane
normal t o the g r a v i t y vec to r
highway grade
f r o n t suspension spread
r e a r suspension spread
f r o n t t i r e t r a c k
r e a r t i r e t r a c k
highway curve rad ius
veh ic le l a t e r a l s i d e s l i p v e l o c i t y a t the body mass c e n t e r
v e h i c l e speed
v e h i c l e sprung mass displacement normal t o t h e road su r face
( r e l a t i v e t o the s t a t i c reference cond i t ion)
height above ground of f r o n t suspension r o l l c e n t e r
height above ground of r e a r suspension r o l l c e n t e r
v e h i c l e f r o n t wheel s t e e r angle
veh ic le sprung mass r o l l angle r e l a t i v e t o t h e hor izon ta l plane
normal t o t h e g r a v i t y vec to r
The above observat ions can be used t o i l l u s t r a t e how e r r o r s i n
experimental e s t ima tes of f r i c t i o n f a c t o r s can occur and how t o i d e n t i f y the
sources of measurement most responsible. Since the methodology used i n t h i s
p r o j e c t f o r determining f r i c t i o n f a c t o r va lues r e l i e d on measuring veh ic le
response q u a n t i t i e s , and then d e r i v i n g the f r i c t i o n f a c t o r e s t ima tes from
express ions s i m i l a r t o those seen above, measurement e r r o r s can be analyzed i n
t h i s same vein. The q u a n t i t i e s v/V, R , and dFW were some of the q u a n t i t i e s

measured dur ing a t y p i c a l v e h i c l e s teady turning t e s t . I f a measurement e r r o r
occurs i n one of these q u a n t i t i e s , the in f luence of the e r r o r on the f r i c t i o n
f a c t o r value w i l l not only be determined by how l a r g e the measurement e r r o r
i s , but a l s o by the manner i n which i t appears i n the above express ions . For
example, equat ion ( 8 ) shows the term df/R appearing i n the numerator. I f df
happens t o be a very smal l q u a n t i t y , s i g n i f i c a n t measurement e r r o r s i n R can
be endured and not adverse ly a f f e c t the e s t i m a t e of t h e f r i c t i o n fac to r .
Reference t o chap te r 5 and curve 1 f o r passenger c a r A shows t h a t the
term V / V ( s i d e s l i p angle) i s about 0.15 degrees , df/R i s about (4/1273)57.3 o r
0.2 degrees , and dFW is approximately 0.4 degrees. Therefore, a s i m i l a r
percentage e r r o r i n each of t h e s e q u a n t i t i e s would mean t h a t e r r o r s i n f r o n t
wheel s t e e r , dFW, would have approximately 2.5 t imes an adverse e f f e c t t h a t
t h e same percentage e r r o r would have i n s i d e s l i p ang le , o r , twice t h e e f f e c t
of a s i m i l a r percentage e r r o r i n path curvature . General ly , t h i s type of
e r r o r i s normally assoc ia ted wi th t r ansducer ga in e r r o r s and i s usua l ly l e s s
common than the o t h e r major source of measurement e r r o r : zero d a t a o f f s e t s .
Measurement o f f s e t e r r o r s tend t o a f f e c t t h e measurements i n approximately the
same manner a s descr ibed above, provided t h a t each of the t ransducer / ins t rumenta t ion ranges a r e sca led a p p r o p r i a t e l y f o r the measured data. Of t h e
t h r e e measured q u a n t i t i e s noted above, measurement of path r a d i u s was
g e n e r a l l y t h e most a c c u r a t e , followed by s i d e s l i p angle , and then f r o n t s t e e r
angle. As a r e s u l t , e r r o r s i n s t e e r angle measurements would be i d e n t i f i e d a s
the g r e a t e s t c o n t r i b u t o r t o e r r o r s i n f r i c t i o n f a c t o r e s t i m a t e s , followed by
s i d e s l i p e r r o r s , and then path r a d i u s e r r o r s .
One way of minimizing t h e l ike l ihood of e r r o r propogation i n a
methodology such a s t h i s one i s t o reduce the number of measured q u a n t i t i e s
c o n t r i b u t i n g t o the i n d i v i d u a l wheel f r i c t i o n f a c t o r s . This can sometimes be
accomplished by p o s i t i o n i n g the sensors a t d i f f e r e n t v e h i c l e loca t ions . For
example, p o s i t i o n i n g t h e t r o l l e y ( s i d e s l i p t r ansducer ) a t t h e f o r e / a f t
l o c a t i o n of a r e a r , o r nonsteered, wheel provides the t i r e s i d e l i p angle
d i r e c t l y with one measurement, thereby avoiding the a d d i t i o n a l dependence on
the path r a d i u s ( o r yaw r a t e ) measurement. The t r o l l e y can a l s o be modified
t o connect d i r e c t l y t o a s t e e r e d wheel i n some cases [ B ] . This would
e l i m i n a t e the dependence on s t e e r angle and yaw r a t e .

6.6 S t e e r i n g Requirements f o r Superelevated Curves
Several s t u d i e s i n t h e t e c h n i c a l l i t e r a t u r e [3 , 10, 111 tend t o
re fe rence the needs and s t e e r i n g behavior of d r i v e r s dur ing supere lvated curve
n e g o t i a t i o n a s reasons f o r poss ib ly modifying c u r r e n t des ign p r a c t i c e . One of
these i tems r e l a t e s t o required s t e e r i n g changes of v e h i c l e s because of the
presence of highway superelevat ion. The o t h e r i tem i s assoc ia ted wi th the
f requen t obse rva t ion t h a t d r i v e r s do not t y p i c a l l y employ a cons tan t o r f ixed
s t e e r i n g wheel angle when normally d r i v i n g a curve. The fol lowing s e c t i o n s
comment on these i s s u e s based upon t h e exper ience and obse rva t ions noted i n
t h i s p ro jec t .
6.6.1 Steady Turn S t e e r i n g Requirements Along Superelevated Curves
Simple s teady tu rn ing a n a l y s i s of a two a x l e v e h i c l e shows t h a t the
required s t e e r i n g angle ( i n degrees ) , dFW, f o r fo l lowing a path of constant
r a d i u s , R , a t cons tan t speed, V , i s given by the fo l lowing express ion:
where,
WB i s the v e h i c l e wheelbase dimension
K i s the unders tee r g r a d i e n t of the v e h i c l e (degrees lg )
and g i s t h e a c c e l e r a t i o n of g rav i ty .
The above equa t ion (12) a p p l i e s t o a h o r i z o n t a l road s u r f a c e con ta in ing no
supere levat ion. I f t h e road s u r f a c e now becomes supere levated an amount, e ,
the above equa t ion i s modified t o the fo l lowing form:
where,
f = ( v ~ / R g - e ) = t h e point -mass f r i c t i o n f a c t o r

Typical values of understeer grad ien t , K , f o r most passenger cars and heavy
trucks l i e i n the range of 1 to 5 degreeslg . Equation (14) can be used t o demonstrate how s t e e r angle requirements
change on superelevated curves a s speed changes occur. The f i r s t term i n
equation (14), 57.3(WB/R), i s the "Ackermann" o r zero-speed component of the
required s t e e r angle, dependent only upon the vehicle wheelbase and curve
radius. This i s the s t e e r angle required of a two-axle vehicle t o t rack a
path of radius R a t zero speed on a road surface containing no superelevation.
On a road surface containing superelevation of an amount, e , the required
zero-speed s t e e r angle becomes,
s ince , a t zero speed, f i s equal to -e. Evaluation of equation (15) f o r curve
s i t e 1 [ R = 1273 f t (388 m); e = 6.7 percent] and vehicle A [WB = 8.3 f t
(2.5 m)] shows tha t the zero-speed s t e e r angle required f o r t h i s curve is 0.17
degrees f o r a vehicle understeer gradient of 3 degreeslg. Even f o r an
understeer gradient as la rge a s 5 degtees/g the required zero-speed s t e e r
angle i s 0.04 degrees.
*
For most AASHTO curve designs one f inds t h a t , unless a vehicle contains
an unusually la rge amount of understeer, s teer ing reversals a r e not general ly
possible , even a t zero speed. As such, previous concerns about s teer ing
reversal along superelevated highway curves appear puzzling [ 3 ] . Certainly,
counter s teer ing i s required on superelevated tangent sec t ions , and perhaps
when superelevated tangents a r e used as t r a n s i t i o n sec t ions t o superelevated
curves, s t ee r ing reversa l con f l i c t s may be an issue. However, once
establ ished on a superelevated curve, even a t low running speeds,
superelevation i t s e l f should never be a cause fo r d r ive r s t o employ s teer ing
displacements away from the d i r ec t ion of tu rn during steady turning maneuvers.

6.6.2 Non-Steady S tee r ing Behavior by Drivers on Superelevated Curves
O s c i l l a t o r y o r non-steady s t e e r i n g behavior by t y p i c a l d r i v e r s has been
argued by some i n v e s t i g a t o r s 11, 101 a s a reason f o r modifying cur ren t des ign
p r a c t i c e f o r h o r i z o n t a l curves. The s t eady t u r n d a t a seen i n appendix E a l s o
r e f l e c t s t h i s behavior by t h e d r i v e r used i n t h i s s tudy , even when a t tempt ing
t o d r i v e each curve i n a smooth manner. Examination of f i g u r e 90, a
r e p r e s e n t a t i v e sample from the time h i s t o r y d a t a of appendix E (curve s i t e 1,
veh ic le A , repea t l ) , shows t h a t the passenger c a r d a t a e x h i b i t s d r i v e r
s t e e r i n g waveforms which vary by amounts of approximately 5 t o 10 percent from
a f ixed value f o r most curves. S imi la r v a r i a t i o n s i n yaw r a t e and l a t e r a l
a c c e l e r a t i o n l e v e l s a r e a l s o seen. This would then imply t h a t the
ins tantaneous v e h i c l e path i s e x h i b i t i n g s i m i l a r v a r i a t i o n s i n t u r n rad ius o r
curvature.
The t r a c t o r - s e m i t r a i l e r d a t a seen i n appendix E e x h i b i t s s i g n i f i c a n t l y
l a r g e r v a r i a t i o n s i n t r a c t o r s t e e r angle (20 t o 30 pe rcen t ) about a constant
l e v e l , However, t h e a r t i c u l a t i o n angle (which can be thought of a s t h e s t e e r
angle of t h e s e m i t r a i l e r ) i s observed t o vary by amounts c l o s e r t o 10 t o 15
percent of i t s s teady values. The same i s genera l ly t r u e of the s e m i t r a i l e r
l a t e r a l a c c e l e r a t i o n and yaw r a t e s igna l s . This suggests t h a t the t r a c t o r -
s e m i t r a i l e r , a s a whole, i s undergoing path curvature v a r i a t i o n s of 10 t o 15
percent , but the d r i v e r t a s k i n s t e e r i n g t h e t r a c t o r u n i t (20 t o 30 percent
v a r i a t i o n s ) through t h e curve i s s i g n i f i c a n t l y more burdensome than t h a t
observed f o r the passenger cars .
Given t h a t most d r i v e r s do e x h i b i t t h i s non-steady s t e e r i n g behavior
along highway curves and t h a t , on average, the v a r i a t i o n s may be l a r g e r than
those observed i n these t e s t s , the argument f o r modifying cur ren t des ign
po l i cy c a l l s f o r use of a modified Rmin (o r Dmax ) value i n the s tandard
"point-mass" des ign equat ion [3] . However, p r i o r t o reaching the s t a g e of
modifying R ~ ~ ~ , the value of Rmin must f i r s t be determined on t h e b a s i s of
assumed values f o r emax and fmax and invocat ion of the des ign equat ion:
max

Steering Wheel Angle (deg)
Ave: - 14.7
0 5 10 2 0 25 30
1
0
- 1
-2 Yaw Am: Rate (deg/s) '3 -3.73
-4
-5 -6
0 5 10 20
Lateral Acceler (g 's )
.04
0
-.04
n -.08 Am: -. I56
-.I2
-.I6
-.2 0 5 . 10 15 2 0
Figure 90. Sample measurement; steady turning; vehicle A.

F a m i l i a r i t y with the process of s e l e c t i n g va lues f o r e and p a r t i c u l a r l y max
fmax , lends some skept ic ism t o arguments t h a t s i n g l e out Rmin a s a value i n
need of adjustment. For example, t h e value of fmax normally s e l e c t e d i s based
upon s u b j e c t i v e eva lua t ions o r c r i t e r i a of d r i v e r comfort and i s usua l ly very
conservat ive (' 0.12). To assume t h a t t h i s p a r t i c u l a r value of f i s max somehow l e s s s u s c e p t i b l e t o v a r i a t i o n and uncer ta in ty than values of Rmin
seems t o r e q u i r e s p e c i a l reasoning.
On the o t h e r hand, i f t h e o v e r a l l i n t e n t and purpose of t h e standard
point-mass des ign equat ion i s t o lend s i m p l i c i t y and reasonable accuracy t o
the process of des igning h o r i z o n t a l curves , va lues of Rmin, a s c u r r e n t l y
derived from the des ign equat ion, seem a s reasonable a s any a l t e r n a t e values
der ived from more p r e c i s e observat ions of a c t u a l veh ic le curvature . This i s
underscored f u r t h e r because of t h e appearance of emax and fmax, two presumably
reasonable , though admit tedly uncer ta in , q u a n t i t i e s wi th in the same equation.
Therefore, un less experimental r e sea rch shows t h a t a c t u a l path curvature
v a r i a t i o n s produced by average d r i v e r s opera t ing f o r extended time per iods
a long super levated curves i s f a r g r e a t e r than t h a t observed dur ing the course
of t h i s p r o j e c t and some o t h e r s [1, 11 1, modif ica t ion of Rmin va lues i n the
s tandard des ign equat ion does not appear warranted. Horizontal curves of very
s h o r t dura t ion , o r a r c l e n g t h , and s u b j e c t t o "corner c u t t i n g , " a r e not viewed
a s f a l l i n g wi th in t h i s category. Such cases a r e perhaps more proper ly
addressed wi thin the genera l a r e a of t r a n s i t i o n s .

Chapter 7
RESEARCH FINDINGS AND CURRENT AASHTO DESIGN POLICY
The purpose of t h i s chap te r i s t o d i s c u s s the resea rch f ind ings of t h i s
p r o j e c t i n r e l a t i o n s h i p t o c u r r e n t AASHTO des ign policy. Findings from o t h e r
r ecen t r e sea rch s t u d i e s f 1 , 21 w i l l a l s o be included t o help c l a r i f y how
s i m i l a r r e sea rch performed i n each of these s t u d i e s r e l a t e t o the work
performed here. The chap te r d i s c u s s e s t o p i c s concerned with t h e AASHTO
h o r i z o n t a l curve des ign a s def ined i n t h e "Green Book" 131.
7.1 "Steady Turning" Driver Behavior and F r i c t i o n Factor Var ia t ions
P r i o r t o d i scuss ing t h i s t o p i c , c e r t a i n c l a r i f i c a t i o n s a r e necessary t o
i d e n t i f y what types of curves and where a long t h e curve t h e f ind ings of t h i s
study and r e l a t e d s t u d i e s apply. F i r s t , t he resea rch r e s u l t s contained i n
t h i s r e p o r t apply s p e c i f i c a l l y t o h o r i z o n t a l curve n e g o t i a t i o n a f t e r
completion of the curve t r a n s i t i o n . Consequently, d r i v e r / v e h i c l e "overshoot"
behavior (exceedance of highway curvature a t t h e beginning of a curve) due t o
t r a n s i t i o n does not f a l l wi th in the realm of t h i s s tudy, even though such
behavior u s u a l l y occurs on the h o r i z o n t a l curve s h o r t l y a f t e r t h e beginning of
t h e simple curve and i s normally a r e s u l t of t h e t r a n s i t i o n . Fur ther , these
resea rch r e s u l t s apply p r imar i ly t o h igh speed h o r i z o n t a l curves of low t o
moderate cu rva tu re conforming t o AASHTO des ign recommendations. F i n a l l y , the
term "steady turning" impl ies a t y p i c a l degree of o s c i l l a t o r y d r i v e r s t e e r i n g
behavior superimposed upon a cons tan t s t e e r l eve l . "Steady turning' ' a l s o
r e f e r s t o the i d e a l i z e d , non-varying s t e e r value when d i scuss ing r e s u l t s from
the s i m p l i f i e d steady-turning model.
Resu l t s of t h e computer ana lyses and experimental measurements show t h a t
modest d i f f e r e n c e s do e x i s t i n wheel-to-wheel f r i c t i o n f a c t o r values on most
v e h i c l e s dur ing s teady tu rn ing condi t ions . The two primary sources of
f r i c t i o n f a c t o r v a r i a t i o n s a re : 1) geometric p r o p e r t i e s of v e h i c l e s , and 2 )
normal d r i v e r s t e e r i n g f l u c t u a t i o n s dur ing curve nego t i a t ion . Consequently,
even when d r i v e r s a r e capable of s t e e r i n g a curve i n an i d e a l manner without

mild s teer ing o s c i l l a t i o n s , wheel-to-wheel f r i c t i o n f ac to r differences would
s t i l l e x i s t because of the basic vehicle cha rac t e r i s t i c s which s e t i t apart
from a "point-mass" object.
A main conclusion i s t ha t despi te the presence of these wheel-to-wheel
f r i c t i o n f ac to r var ia t ions , no evidence was found t o ind ica te tha t the
observed f r i c t i o n f ac to r var ia t ions would lead t o s ign i f icant ly reduced
s t a b i l i t y margins. Even i f the ava i lab le t i r e l road f r i c t i o n leve l was reduced
t o a value below the demand of the t i r e having the g rea t e s t f r i c t i o n
requirement, no vehicle i n s t a b i l i t y would occur. In te res t ing ly , the minimum
leve l of t i re / road f r i c t i o n iden t i f i ed f o r maintaining s t a b i l i t y of passenger
cars was found t o be equal t o the "point-mass" design value f o r the curve.
However, the minimum leve l of f r i c t i o n necessary f o r maintaining s t a b i l i t y of
the f i v e axle t rac tor -semi t ra i le r was approximately 10 percent higher than the
point-mass design value. For example, an AASHTO curve with a design speed of
70 mph (fmax = 0.10) and an assumed wet road f r i c t i o n l eve l of 0.30, the
margin of sa fe ty would be 0.20 g ' s f o r the passenger ear (0.30 - 0.10) and
0.19 g 's f o r the t rac tor -semi t ra i le r (0.30 -0.11). Accordingly, the safe ty
margins provided by the AASHTO design a re seen to be generous f o r both types
of vehicles , even when cont ro l l ing curve designs a r e used. Therefore, changes
t o the standard "point-mass" design equation a re not seen a s necessary.
Again, t h i s conclusion appl ies t o negot iat ion of horizontal curves well a f t e r
the PC and does not apply t o t r ans i t i on sect ions o r overshoot behavior caused
by t r ans i t i ons a t the s t a r t of a horizontal curve.
Increased margins of sa fe ty may appear necessary f o r high center of
grav i ty heavy trucks operating on lower design speed curves; however, the
ex is t ing AASHTO policy still provides ample means f o r reducing s ide f r i c t i o n
demand while a l s o re ta in ing near maximum superelevation rates . Reference t o
Figure 111-8 of the "Green Book" [3] shows tha t if curvature values 20 percent
l e s s than the cont ro l l ing curvature D m a a r e used, f values a r e reduced by
30 percent and the superelevation r a t e remains a t nearly emax. Consequently,
s t rong control over s ide f r i c t i o n demands a r e provided within the ex is t ing
AAHSTO design policy and i s ea s i ly effected by modest changes i n curve radius.
This f l e x i b l e means of retaining increased superelevation r a t e s while

s ign i f i can t ly reducing f r i c t i o n f ac to r requirements i s seen as a strong
fea ture of the AASHTO design policy and i s discussed fu r the r i n sec t ion 7.2 . Experimental measurements performed f o r the two passenger cars and the
t rac tor -semi t ra i le r vehicle showed tha t mild dr iver s teer ing osc i l l a t i ons did
occur f o r each vehicle during curve negotiation. The passenger car t e s t s
exhibited about 5 t o 10 percent va r i a t i ons about the idea l value and the
t rac tor -semi t ra i le r t e s t s exhibited about 10 to 15 percent var iat ions. These
measurements and observations apply t o curve negot iat ion well a f t e r the PC
during "steady" turning conditions. Findings of other researchers , [ I ] , have
experimentally observed (through photographic analyses) t ha t ac tua l dr ivers a t
d i f f e r en t horizontal curve s i t e s of ten achieve instantaneous path r a d i i which
a r e l e s s than the curve radius design.
The same researchers a l so found t h a t on many of the same curve s i t e s
nearly half of a l l d r ive r s did not achieve path curvatures a s severe a s the
highway curve design. This l a t t e r f inding i s understandable on curves of
short length where "corner cut t ing" i s frequent ly used by d r ive r s t o lower
l a t e r a l accelerat ion. However, on curves of g rea t e r length where vehicles
must remain within the confines of a s ing le lane f o r an extended period of
time, minimum (or " c r i t i c a l " [ l ] ) vehicle path r a d i i g rea t e r than the curve
design radius would not seem t o be physically possible.
Nevertheless, the same study revealed tha t fo r ce r t a in small sub-samples
of the t o t a l observations, the " c r i t i c a l path radius" (or momentary minimum
path radius achieved during a curve t r ave r sa l ) could be s ign i f i can t ly l e s s
than the curve radius design value. Most " c r i t i c a l path rad i i " values
occurred shor t ly a f t e r the PC and during the entry t o the horizontal curve
i t s e l f . However, t h i s type of extreme overshoot behavior was not generally
observed once the vehicle was establ ished on the curve. This d i s t i nc t ion i s
important t o keep i n mind i n order to r e l a t e and resolve any apparent
d i f fe rences i n f indings between t h i s study and those reported i n [ I ] .
Basical ly , the findings regarding the extreme " c r i t i c a l path rad i i " reported
i n [ 11 are viewed a s qu i t e reasonable given tha t they apply to a momentary
phenomena induced by t r a n s i t i o n sec t ions and extremes of dr iver behavior.
However, ra ther than modify ex is t ing AASHTO horizontal curve design prac t ice

t o accomodate imperfect t r a n s i t i o n s e c t i o n s o r extreme d r i v e r behavior, t h i s
r epor t i s i n genera l agreement wi th the recommendations of [ I ] , t o encourage
( a ) l e s s use of c o n t r o l l i n g curve des igns , where poss ib le , and (b ) s p i r a l
t r a n s i t i o n s i n p lace of tangent t r a n s i t i o n sec t ions . I n s h o r t , t h e high
f r i c t i o n f a c t o r values repor ted i n [ I ] a r e seen a s a t r a n s i t i o n des ign
"problem" which can b e s t be handled by use of s p i r a l t r a n s i t i o n s . These two
recommendations a r e d iscussed f u r t h e r i n s e c t i o n s 7.2 and 7.3 . 7.2 Larger Radii Hor izonta l Curves
The f i n d i n g s of t h i s s tudy support use of t h e point-mass concept a s a
simple means, not only f o r use i n des igning h o r i z o n t a l curves, but a l s o f o r
understanding the impl ica t ions of changes i n curve design. I n p a r t i c u l a r , the
d i scuss ion i n t h i s s e c t i o n uses the "point-mass" concept i n consider ing the
s a f e t y margins r e s u l t i n g from employing l a r g e r r a d i i whenever poss ible .
Larger r a d i i f o r h o r i z o n t a l curves can r e s u l t from e i t h e r ( 1 ) l e s s use of
minimum, o r near minimum, r a d i i curves a s determined by the AASHTO p o l i c y , o r
( 2 ) the choice of a longer Rmin i e , smal ler D,,,) a s the c o n t r o l l i m i t f o r
a g iven highway.
How might a longer R be determined? To answer t h i s ques t ion , suppose min
t h a t a highway des igner wished t o al low f o r t h e 10% higher l e v e l of minimum
f r i c t i o n needed f o r t h e s t a b i l i t y of heavy trucks. A s t ra igh t fo rward approach
t o provide an a d d i t i o n a l margin of s a f e t y f o r these v e h i c l e s would be t o
reduce fmaX ( a s used i n the AASHTO p o l i c y ) by 10 percent. For example, assume
t h a t the des ign speed i s 70 mph (112 km/h) and emax i s t o be 0.08. For 70 mph
(112 kmlh), t h e AASHTO p o l i c y 131 l i s t s fmax a s 0.10 which would be reduced t o
0.09 t o provide a s a f e t y margin f o r trucks. For f = 0.09, e = 0.08, and V =
70 mph, the "point-masstt equat ion ( i n the form R = vL/ (15(e+f ) ) ) y i e l d s a
r a d i u s , Rmin, equal t o 1922 f e e t (586 m). I f f had been 0.10, e t f would have
been 0.18 and Rmin would equal 1815 f e e t (553 m). I n t h i s s i t u a t i o n , a 10
percent decrease i n fma, r e s u l t s i n a 6 percent inc rease i n Rmin*
I n genera l , the following equat ion i l l u s t r a t e s the r e l a t i o n s h i p between
small changes i n emax o r fmax and Rdn*

where dR i s the change i n Rmin caused by changing e i t h e r emax o r fmax
df i s a smal l change i n s i d e f r i c t i o n f a c t o r
de is a smal l change i n supere leva t ion
e max i s the o r i g i n a l emax
max i s the o r i g i n a l fmax
For cases i n which de = 0 ( supere leva t ion i s f i x e d ) , the r a t i o df/(emax+fmax)
i s equal t o t h e f r a c t i o n a l change i n r ad ius ( ~ R / R , ~ , ) r e s u l t i n g from a small
change i n s i d e f r i c t i o n . The g r e a t e s t i n f l u e n c e s of percentage changes i n
max occur when emax i s smal l and fmax i s l a rge . (Larger fmaX1s correspond t o
lower v e l o c i t i e s i n the AASHTO po l i cy [3] . ) I n t h e preceding example, emax
and fmax were nea r ly equal s o t h a t a 10% change i n fmax produced approximately
a 5% change i n Rmin.
7.3 S p i r a l T r a n s i t i o n s
The use of s p i r a l t r a n s i t i o n s i s recommended and supported by AASHTO
design f o r s e v e r a l reasons: ( a ) s p i r a l paths a r e c l o s e t o a c t u a l paths
t y p i c a l l y s e l e c t e d by d r i v e r s dur ing t r a n s i t i o n d r i v i n g , ( b ) s p i r a l s provide a
d e s i r a b l e means f o r ar ranging supere leva t ion runof f , ( c ) s p i r a l s provide a
convenient method f o r widening pavements, and ( d ) t h e a e s t h e t i c appearance of
the highway curve employing s p i r a l t r a n s i t i o n s i s considered more p leas ing t o
the eye. I n a d d i t i o n t o these reasons , t h r e e o t h e r s i g n i f i c a n t reasons should
be noted. F i r s t , t he s p i r a l t r a n s i t i o n is a point-by-point a p p l i c a t i o n of t h e 1 I point-mass" des ign formula dur ing t h e t r a n s i t i o n process. Thus, a s curve
r a d i u s v a r i e s continuously ( i n propor t ion t o the t r a v e l d i s t a n c e ) a s one moves
along a s p i r a l , so does t h e supere leva t ion , thereby causing a smooth and
c o n s i s t e n t i n t r o d u c t i o n of s i d e f r i c t i o n a s t h e PC of the h o r i z o n t a l curve is
reached. Consequently, d r i v e r l v e h i c l e systems w i l l not encounter any sudden
o r abrupt change i n l a t e r a l a c c e l e r a t i o n demand along a s p i r a l t r a n s i t i o n .
Furthermore, i f t h e supere leva t ion runoff dur ing t h e s p i r a l t r a n s i t i o n i s
c o n s i s t e n t wi th AASHTO supere leva t ion po l i cy f o r h o r i z o n t a l curves , d r i v e r s
w i l l f e e l more comfortable moving from curve t o curve because of r e t e n t i o n of
the point-mass formula throughout the highway system. Therefore, i f d r i v e r s

a r e expected t o become "ca l ib ra ted" t o "point-mass" physics along h o r i z o n t a l
cu rves , the same " c a l i b r a t i o n , " ( o r d r i v e r e x p e c t a t i o n s ) , should be used f o r
t r a n s i t i o n s e c t i o n s a s wel l .
The second a d d i t i o n a l reason f o r us ing s p i r a l t r a n s i t i o n s r e l a t e s
p r imar i ly t o t h e f i n d i n g s by o t h e r r e sea rchers [ l , 41 concerning
d r i v e r / v e h i c l e "overshoot" behavior when e n t e r i n g h o r i z o n t a l curves. I n
g e n e r a l , most f i n d i n g s show t h a t severe "overshoot" behavior i s s i g n i f i c a n t l y
reduced o r e l imina ted when s p i r a l t r a n s i t i o n s a r e used. Computer s imulat ion
r e s u l t s wi th in t h i s s tudy and s e v e r a l o t h e r s 11, 2 , 41 a l s o support the f i e l d
s tudy obse rva t ions conducted i n [ l ] showing s i g n i f i c a n t l y lower v e h i c l e path
overshoot behavior when s p i r a l s a r e used a s t r a n s i t i o n sec t ions . Thus, s p i r a l
t r a n s i t i o n s a r e a d i r e c t and powerful means f o r reducing most d r i v e r / v e h i c l e
overshoot behavior and p a r t i c u l a r l y t h e extreme va lues of " c r i t i c a l pa th
radius" t h a t can occur [ I ] .
F i n a l l y , use of s p i r a l t r a n s i t i o n s e l i m i n a t e t h e need f o r d r i v e r s t o
counter-s teer (oppos i t e t o t h e d i r e c t i o n of t u r n ) a s i s required when tangents
a r e used a s t r a n s i t i o n sec t ions . Because c u r r e n t AASHTO des ign po l i cy f o r
tangent t r a n s i t i o n s recommends 50 - 100 percent (60 - 80 percent p r e f e r r a b l e )
of t h e supere leva t ion runoff t o occur on the t angen t , two adverse f e a t u r e s a r e
introduced. F i r s t , highway des ign should be c o n s i s t e n t wi th d r i v e r
expec ta t ions of v e h i c l e con t ro l . Normally, v e h i c l e s a r e s t e e r e d by d r i v e r s t o
move i n t h e d i r e c t i o n of the s t e e r i n g displacement. On a t r a n s i t i o n tangent
where supere leva t ion i s c o n t i n u a l l y i n c r e a s i n g , d r i v e r s must s t e e r away from
t h e d i r e c t i o n of the approaching curve t o coun te rac t t h e e f f e c t s of
supere leva t ion , p a r t i c u l a r l y i n t r a f f i c where d r i f t i n g o r s p i r a l i n g ac ross
t r a f f i c l a n e s is not poss ible . Highway des ign which c o n f l i c t s wi th t h i s
i n h e r e n t d r i v e r understanding may cause temporary confusion on the p a r t of
some d r i v e r s l ead ing t o unnecessary s t e e r i n g ac t ions . Also, the presence of
t angen t s and a s s o c i a t e d c o u n t e r s t e e r i n g r e q u i r e s t h e v e h i c l e t o adapt more
qu ick ly t o t h e c o r r e c t highway curva tu re once the beginning of t h e curve is
reached. This would t y p i c a l l y cause "overshoot" behavior t o occur f o r most
d r i v e r / v e h i c l e systems a s they entered the f i r s t p o r t i o n of t h e h o r i z o n t a l
curve. Consequently, t h e use of s p i r a l t r a n s i t i o n s , i n p lace of t angen t s ,
e l i m i n a t e s both of these adverse p o s s i b i l i t i e s . By in t roduc ing supere leva t ion

along a s p i r a l i n accordance with AASHTO design policy, d r ive r s w i l l s t e e r
smoothly i n the d i r ec t ion of the approaching turn , even i f constrained t o one
t r a f f i c lane, and a l so avoid the need t o make sharp path curvature correct ions
near the PC.
7.4 Roll S t a b i l i t y Margins f o r Heavy Trucks
Heavy t rucks with high centers of grav i ty may r o l l over a t l eve l s of
l a t e r a l acce lera t ion t h a t approach those given i n the AASHTO design policy fo r
low-speed urban s t r e e t s [ 2 1. Furthermore, heavy t rucks may experience r o l l
s t a b i l i t y problems on low-speed interchange ramps t h a t a r e designed t o
requirements t h a t a r e s l i g h t l y below AASHTO recommendations [3] . The exis t ing
AASHTO policy does not consider and properly address the spec ia l r o l l
s t a b i l i t y concerns appl icable to heavy trucks.
The l a t e r a l acce lera t ion needed f o r curve negot iat ion comes from both e
and f . The port ion of t h i s l a t e r a l acce lera t ion tha t i s due t o f causes the
vehicle t o r o l l t o the outs ide of the turn. In the case of heavy t rucks, the
amount of l a t e r a l acce lera t ion t h a t w i l l cause the vehicle t o r o l l over is
referred t o a s the "rol lover threshold." Rollover thresholds f o r heavily
laden t rucks range from 0.24 t o 0.34 g 121. These ro l lover thresholds can be
viewed as the l e v e l of s ide f r i c t i o n tha t w i l l cause rollover. Since the
ro l lover thresholds f o r heavy t rucks a r e considerably lower than the expected
l e v e l of t i r e l r o a d f r i c t i o n , even on wet pavements with worn t i r e s , the safe ty
margin f o r ce r t a in heavy t rucks is considerably lower than ant icipated i n the
AASHTO policy. With regard t o low-speed interchanges, the designer should be
aware of t h i s lack of sa fe ty margin. Superelevation needs t o be introduced
before the PC, preferably through a s p i r a l i n order t o keep the required f a s
small as possible throughout the curve. Truck d r ive r s may tend to "overdrive"
ramps ( t h a t i s , t r a v e l above the design speed), thereby increasing the
required f and challenging the vehicle 's ro l lover threshold. In addi t ion ,
d r ive r s teer inglcurva ture va r i a t i ons , a s observed i n t h i s study, w i l l cause an
increase i n the maximum l a t e r a l acce lera t ion experienced by the truck. Hence,
conservative designs of ramps a r e espec ia l ly i n order where truck t r a f f i c i s
l i k e l y to be heavy.

7.5 S tee r ing Requirements Along Superelevated Curves a t Reduced Speed
The "Green Book" [31 c u r r e n t l y con ta ins a "misconception" regarding
d r i v e r s t e e r i n g requirements along superelevated curves when opera t ing a t
reduced speeds. The misconception, expressed on pages 163 and 164, i s t h a t
d r i v e r s need t o apply counter-s teer ing (up t h e s lope) t o v e h i c l e s when
t r a v e l i n g a t speeds which cause the "point-mass" f r i c t i o n f a c t o r t o change
p o l a r i t y and a c t i n a d i r e c t i o n toward the c e n t e r of the t u r n (down the
s lope) . The simple a n a l y s i s , ( v e r i f i e d by both computer s imulat ion and
veh ic le t e s t i n g ) , i n chap te r 6 ( s e c t i o n 6.6.2), shows t h a t most t y p i c a l
v e h i c l e s opera t ing on AASHTO curve des igns do not r e q u i r e s t e e r i n g r e v e r s a l s
t o proper ly t r a c k t h e curve des ign r a d i u s , even a t near zero speeds. Although
t r a v e l i n g along a supere levated tangent i n a s t r a i g h t l i n e does requ i re the
descr ibed counter-s teer ing behavior, tu rn ing motion along a c i r c u l a r
supere levated curve does not. The advantage of t h i s t o des igners i s t h a t an
increased r a t e of supere leva t ion does not r e q u i r e r everse s t e e r i n g a c t i o n t o
proper ly t r a c k t h e curve. Consequently, des igners can use h igher r a t e s of
supere leva t ion on AASHTO curves without having t o be concerned t h a t low speed
veh ic les w i l l r e q u i r e s t e e r i n g motion "up the slope" and away from the
d i r e c t i o n of turn . For example, i f a curve des igner p r e f e r s t o use 9 perecnt
ins tead of 8 percent f o r emax a t a p a r t i c u l a r curve s i t e , concern over d r i v e r
s t e e r i n g requirements should not be a reason f o r deciding t o use t h e lower
supere leva t ion r a t e .

Chapter 8
CONCLUSIONS AND RECOMMENDATIONS
The research conducted within t h i s study has led to a number of
conclusions and recommendations which a r e based la rge ly upon findings of
computer model predict ions and fu l l - sca le vehicle t e s t r e s u l t s gathered during
the course of the project.
Conclusions
* Steady turning models and vehicle t e s t s have shown tha t
s ign i f i can t d i f fe rences do e x i s t i n wheel-towhee1 f r i c t i o n
f ac to r values on most vehicles during steady turning maneuvers
along supereleva ted curves. Passenger ca r s and other two-axle
vehicles exhib i t the l e a s t wheel-to-wheel var ia t ion ; commercial
vehicles having mult iple axle suspensions and elevated mass
centers exhib i t the g rea t e s t dispersion.
* The l eve l of va r i a t i on i n individual wheel f r i c t i o n f ac to r s
considered and observed i n t h i s work indicated there was no
s ign i f i can t evidence or f inding t h a t vehicles , o r dr iver /vehic le
systems, a r e l e s s s t ab l e o r otherwise adversly affected by t h i s
pa r t i cu l a r phenomena during steady turning maneuvers along
typ ica l superelevated highway curves.
* No substant ive evidence regarding f r i c t i o n f ac to r dispersion was
iden t i f i ed t o conclude t h a t cur ren t highway curve design
prac t ice , based upon a point laass formulation, should be modified
t o accomodate the observed wheel-to-wheel var iat ions. For
example, a l t e r a t i o n of the standard design equation t o account
f o r l a rge r f r i c t i o n f a c t o r values derived from an individual
wheel ana lys i s , i s not seen as necessary. These conclusions

apply t o h o r i z o n t a l curve nego t i a t ion a f t e r completion of the
curve t r a n s i t i o n . Temporary dis turbances t o dr iver-vehic le
systems dur ing e n t r y i n t o hor izon ta l curves and due t o d i f f e r e n t
curve t r a n s i t i o n des igns were not included i n t h i s study.
* Computer a n a l y s i s of low f r i c t i o n cond i t ions f o r s teady tu rn ing
maneuvers on supere levated curves suggests t h a t a t i t e l r o a d
f r i c t i o n l e v e l approximately equal t o the point-mass value i s
s u f f i c i e n t t o permit s t a b l e d r i v e r l v e h i c l e curve nego t i a t ion f o r
passsenger cars . However, f o r t h e 5-axle t r a c t o r - s e m i t r a i l e r
used i n t h i s s tudy (and presumably s i m i l a r commercial v e h i c l e s ) ,
a minimum f r i c t i o n l e v e l appzoximately 10 percent h igher than
the paint -mass value was genera l ly necessary t o guarantee
s t a b i l i t y f o r the same maneuver and low f r i c t i o n opera t ing
condi t ions .
* Obstacle avoidance maneuvers simulated along an AASHTO des ign
curve under low f r i c t i o n cond i t ions showed t h a t the minimum
t i r e l r o a d f r i c t i o n l e v e l necessary f o r s t a b l e execut ion of t h e
maneuver i s approximately equal t o the peak f r i c t i o n value
required of a point-mass ob jec t undergoing the same maneuver
under adequate f r i c t i o n condit ions. Theref o r e , even though
c e r t a i n t i r e s on a veh ic le may s a t u r a t e f o r s h o r t per iods of time
during a low f r i c t i o n obs tac le avoidance maneuver, the d r i v e r -
veh ic le system i s ab le t o maintain s t a b i l i t y i f t h e minimum
t i r e l r o a d f r i c t i o n l e v e l i s a t l e a s t a s g r e a t a s descr ibed above.
This " rule of thumb" f o r e s t ima t ing the minimum f r i c t i o n l e v e l
needed f o r such maneuvers appl ied more o r l e s s equal ly t o the
passenger c a r and t r a c t o r - s e m i t r a i l e r veh ic les used i n the study.
* Steady tu rn ing computer models developed during the p r o j e c t a r e
viewed a s r e l i a b l e p r e d i c t o r s of s teady tu rn ing v e h i c l e
performance along superelevated curves. The models were employed
t o c a l c u l a t e i n d i v i d u a l wheel f r i c t i o n f a c t o r requirements f o r
s teady turning motion of passenger c a r s and commercial vehic les .
The p r e d i c t i o n s from the s teady tu rn ing models were shown t o

compare favorably with vehicle t e s t data col lected during the
project and ca lcu la t ions from other comprehensive computer
models. Use of these models i s recommended f o r more in-depth
analyses of vehicle / highway in te rac t ions as par t of the highway
curve design process.
* Experimental i den t i f i ca t ion and estimation of individual wheel
f r i c t i o n f ac to r values was shown t o be possible but not highly
accurate and repeatable. The methodology employed i n t h i s
project r e l i ed on d i r e c t measurement of vehicle responses and
derivat ion of the f r i c t i o n f ac to r values from t h i s information.
(Direct measurement of t i r e forces o r wheel loads a r e not
current ly possible due to the l imited accuracy and s ignal
v a r i a b i l i t y of such transducers tha t a r e avai lable . )
* Estimation of individual wheel f r i c t i o n f ac to r s through the use
of steady turning models and representat ive vehicle parameters i s
viewed a s s u f f i c i e n t l y accurate and r e l i a b l e f o r most vehicles.
Further experimental va l ida t ion e f f o r t s a r e not seen as necessary
s ince the s e n s i t i v i t y analyses conducted here f a i l ed to ident i fy
s ign i f i can t adverse e f f e c t s a t t r i b u t a b l e t o modest var ia t ions i n
wheel-to-wheel f r i c t i o n fac tor values.
* Concerns occasionally expressed i n the technical l i t e r a t u r e about
s teer ing reversa l requirements by d r ive r s along supereleva ted
curves during conditions of reduced speed are not supported by
the analyses and observations conducted within t h i s project.
Rather, s teer ing reversals (up the slope) away from the d i rec t ion
of tu rn , even a t very low speeds, a r e not viewed a s generally
possible for the grea t majority of passenger cars and commercial
vehicles. Consequently, highway curve designers can use higher
r a t e s of superelevation on AASHTO curves without being concerned
tha t lower speed vehicles may require s teer ing motion "up the
slope" and away from the d i rec t ion of turn.

* Mild o s c i l l a t o r y s t e e r i n g behavior and accompanying path
curvature v a r i a t i o n s during s teady tu rn ing maneuvers were
observed i n the t e s t da ta co l l ec ted i n t h i s study. The magnitude
of s t e e r i n g o s c i l l a t i o n s observed during each curve nego t i a t ion ,
wel l a f t e r completion of the t r a n s i t i o n , was genera l ly small ( see
Sect ions 6.6 and 7.1). Consequently these measurements do not
suggest a need t o modify e x i s t i n g AASHTO hor izon ta l curve des ign
p r a c t i c e based upon observat ions of dr iver-vehic le behavior on
curves of f ixed radius. Other s t u d i e s , c i t e d and discussed i n
Chapter 7 , have observed much g r e a t e r l e v e l s of o s c i l l a t o r y
dr iver-vehic le behavior but almost exc lus ive ly during e n t r y
t r a n s i t i o n s t o hor izon ta l curves.
* The i s s u e of s p i r a l t r a n s i t i o n s and assoc ia ted b e n e f i t s , while
not s p e c i f i c a l l y s tud ied o r addressed wi th in t h i s p r o j e c t , was
f requen t ly encountered during t h i s study. The t r a n s i t i o n s t o
each of the curve s i t e s i n the t e s t program were not s p i r a l s but
superelevated tangents , and a s such, genera l ly required mild
counter-s teer ing and subsequent overshooting of s t e e r i n g
responses upon e n t r y i n t o each curve , e s p e c i a l l y with the t r a c t o r
- s e m i t r a i l e r . This type of t r a n s i t i o n des ign n e c e s s i t a t e s the
above described behavior which runs counter t o the more n a t u r a l
d r i v i n g process of r equ i r ing s t e e r i n g displacements i n the
d i r e c t i o n of the a n t i c i p a t e d turn. Use of s p i r a l t r a n s i t i o n s t o
1) in t roduce curvature and supere leva t ion i n a manner c o n s i s t e n t
with d r i v e r expec ta t ions , and t o 2 ) r e t a i n the simple physics of
the s tandard des ign equat ion, i s supported.

Recommendations
* Recommendations f o r improving the accuracy and repea tab i l i ty of
the experimental approach used i n t h i s work include:
- use of addi t ional s i d e s l i p t ro l l ey devices per vehicle
- improved f o r e l a f t posi t ioning of these devices a t or near
spec i f i c wheel locat ions
- use of ground-based r o l l motion transducers t o b e t t e r
estimate s ide to s ide v e r t i c a l load t r ans fe r
- use of optimal (Kalman) f i l t e r i n g techniques during data
processing t o improve estimates of the measured vehicle
responses
* Future vehicle or highway s tudies considering the use of a
s i d e s l i p t r o l l e y a re encouraged t o do so based upon the
experiences of t h i s project. However, design modifications have
been recommended to improve i t s ruggedness f o r normal highway
t r ave l and t o lessen i t s noise l eve l due to normal road
disturbances.
* Preservation of the dr iver /vehicle t e s t data col lected during
t h i s project i n a standardized format fo r future reference i s
recommended. This data could be used a s a useful source of
representat ive dr iver lvehic le responses fo r fur ther s tud ies of
highway curve design.

9.0 REFERENCES
1. Glennon,J.C., Neuman,T.R., and Leisch,J.E. "Safety and Operational Considerations for Design of Rural Highway Curves," Final Report, Federal Highway Administration, Contract No. DOT-FH-11- 9575, August 1983.
2. Ervin, R.D. et al., "Impact of Geometric Features at Interchanges," Final Report, Federal Highway Administration, Contract No. DOT- FH61-82-C-00054, August 1985.
3. American Association of State Highway Officials, A Policy on Geometric Design of Highways and Streets, 1984.
4. Segal ,Do J. and Banney,T. A. I' Evaluation of Horizontal Curve Design," Final Report, Federal Highway Administration, Contract No. DOT- FH-11-8501 (Mod. #7), August 1980.
5. MacAdam,C.C. et al., "A Computerized Model fro Simulating the Braking and Steering Dynamics of Trucks, Tractor-semitrailers, Doubles, and Triples Combinations - Users' Manual - Phase 4," Final Report, MVMA Proj. 1197, Highway Safety Research Inst., Univ. of Mich. , Rept. No. UM-HSRI-80-58, September 1980.
6. MacAdam,C.C. "Application of an Optimal Preview Control for Simulation of Closed-Loop Automobile Driving," IEEE Transactions on Systems, Man, and Cyberbetics, VZ 11, June 1981.
7. "Vehicle Dynamics Terminology - SAE 5670," SAE Handbook Supplement, SAE Recommended Practice, June 1978.
8. Little,J. "A Trolley for the Measurement of Vehicle Roll and Slip Angles, and Speed," MIRA Bulletin No. 3, May/June 1970.
9. "Instrumentation of Test Trucks for Measuring Pavement-Vehicle Interactions ,I1 Contract No. FH-11-9289, Systems Technology Inc.
10. Glennon,J.C. and Weaver ,G,D. "Highway Curve Design for Safe Vehicle Operations ," Highway Research Record, 1972.
11. Good. ,M.C. "A Review of Empirical Studies of Driver-Vehicle Behaviour on Road Curves," Australian Road Research Board, Dept. of Mech. Enging., University of Melbourne, April 1975.

10.0 SELECTED BIBLIOGRAPHY
"Side-Friction Factors in the Design of Highway Curves ,I1 NCHRP Research Results Digest, HRB, Digest 55, February 1974.
Lamm, R. "Driving Dynamic Considerations: A Comparison of German and American Friction Coefficients for Highway Design," Transportation Research Record 960.
Zuk,W* "Instability Analysis of a Vehicle Negotiating a Curve with Downgrade Superelevation," Highway Research Record, HRB, 1972.
"Recommended Modification of Superelevation Practice for Long-Radius Curves,'' NCHRP Research Results Digest, Digest 72, May 1975.
Lugner,P. "Investigations into the Steady-State Cornering of a Vehicle on a Banked Curve," ATZ Automobiltechnische Zeitschrift, Vol. 75, No. 8, August 1973.
Zador ,Z. L. et al, "Superelevation and Roadway Geometry: Deficiency at Crash Sites and on Grades," Presented at the Transportation Research Board Meetings, Washington, D.C., January 1985.
Ervin,R.D. et al, "Influence of the Geometric Design of Highway Ramps on the Stability and Control of Heavy Duty Trucks,'' Presented at the TRB Meeting, Denver, Colorado, August 1985.
Good,M,C. "Road Curve Geometry and Driver Behaviour," Australian Road Research Board Report No. 15, May 1978.
Bel1,N.G. "Horizontal Curve Design on Rural Roads: A Critical Examination," Project Rept. 32 79/80, Dept. of Civil Enging., Portsmouth Polytechnic, June 1980.
Literature Review for FHWA Project, "Side Friction for Superelevation on Horizontal Curves," Contract DTFH61-82-C- 00019, January 1983.