on crop height estimation with uavscse.unl.edu/~carrick/papers/anthonyeld2014.pdfon crop height...
TRANSCRIPT

On Crop Height Estimation with UAVs
David Anthony, Sebastian Elbaum, Aaron Lorenz, and Carrick Detweiler
Abstract— Remote sensing by Unmanned Aerial Vehicles(UAVs) is changing the way agriculture operates by increasingthe spatial-temporal resolution of data collection. Micro-UAVshave the potential to further improve and enrich the datacollected by operating close to the crops, enabling the collectionof higher spatio-temporal resolution data. In this paper, wepresent a UAV-mounted measurement system that utilizes alaser scanner to compute crop heights, a critical indicator ofcrop health. The system filters, transforms, and analyzes thecluttered range data in real-time to determine the distance tothe ground and to the top of the crops. We assess the system inan indoor testbed and in a corn field. Our findings indicate thatdespite the dense canopy and highly variable sensor readings,we can precisely fly over crops and measure its height to within5cm of measurements gathered using current measurementtechnology.
I. INTRODUCTION
UAVs are improving modern agriculture production and
research by providing data at higher temporal and spatial
resolution scales, and lower cost, than traditional collection
methods, such as manned aircraft and satellites [1], [2].
Micro-UAVs offer further potential benefits as they lower
costs and operator risks, accelerate deployment times, and are
able to operate closer to crops to increase spatial resolution.
Operating close to the crops also allow UAVs to utilize new
sensors, such as low power, passive devices, that are not
effective with high flying aircraft.
In this work, we develop a crop height measurement
system based on a micro-UAV platform, shown in Fig-
ure 1. Obtaining accurate and timely crop height estimates
is important to characterize plants’ growth rate and health.
Agricultural researchers use this data to measure the impact
of genetic variation in the crops on drought resistance and
responses to environmental stresses. Practitioners may also
use crop height information to assess crop development
and plan treatments [3]. These measurements are currently
obtained through manual measurement, or by driving heavy
equipment through the field. These collection methods are
time consuming and damaging to the crops, and as such, are
not regularly used [4], [5], [6].
D. Anthony, S. Elbaum, and C. Detweiler are members ofthe NIMBUS Lab in the Computer Science and Engineering De-partment at the University of Nebraska–Lincoln, NE 68588, USA.{danthony,elbaum,carrick}@cse.unl.edu
A. Lorenz is a member of the Department of Agronomy andHorticulture at the University of Nebraska–Lincoln, NE 68588, [email protected]
This work was partially supported by USDA #2013-67021-20947,AFOSR #FA9550-10-1-0406, NSF CSR-1217400, a development grant fromORED-UNL, and a UNL Life Sciences Grant. Any opinions, findings, andconclusions or recommendations expressed in this material are those of theauthors and do not necessarily reflect the views of these agencies.
Fig. 1. Micro-UAV measuring crop height
Measuring crops requires height estimates of the tops of
the crop and the ground, the difference of which is the
crop height. Measuring crops from the air to characterize
the top of the canopy benefits from unobstructed movement
that does not damage the crops, but locating the ground is
more challenging as layers of plants’ leaves can obscure the
ground. There are two ways to overcome this challenge. One
way is to increase sensing power by using, for example,
radars or powerful LiDARs. An alternative approach, the one
we have chosen to reduce risk and cost, is to fly a micro-UAV
equipped with less powerful sensors but operating closer to
the crops to exploit small gaps in the crop canopy to directly
sense the ground and the lower levels of the vegetation.
The autonomous crop height measurement system pre-
sented in this work is being developed in conjunction with
agronomy researchers with the goal of computing corn
crop height within 5cm of manual measurements, while
increasing the areas and frequency of measures by two orders
of magnitude. The system utilizes low-cost sensors and a
UAV platform to reduce costs and operator risks, increase
operating ease, and be highly portable. The system is built
using a commercial micro-UAV, laser scanner, barometer,
IMU, and a GPS receiver to effectively operate the UAV over
crops, estimate the UAV altitude, and accurately measure
the crop’s height by applying a series of onboard filters and
transformations. By operating at a low altitude, the system
greatly increases the spatial resolution of the collected data,
when compared to traditional approaches. Furthermore, the
small size and weight of the system limits the risks of
operating the unit.
The contributions of this work are:
• Design and implementation of a micro-UAV mounted
crop measurement system. The system leverages a
downward mounted laser scanner to help maintain the

UAV close to the crops and to characterize the crops
profile. This profile is then processed through a series
of transformations and filters to compute the UAV’s
altitude and the crop’s height.
• Assessment of the system on an indoor testbed and a
field. Our findings show that the system has the potential
to significantly increase the data obtained versus current
mechanisms and still operate within the margin of error
acceptable by agricultural scientists,
II. BACKGROUND
Before discussing the details of our work, we review
related work in using UAVs in agriculture and related fields.
A. UAVs in Agriculture
The use of UAVs in agriculture is an active research
topic [7]. Existing work mostly utilizes UAVs to deliver
aerial imagery of fields in a more timely and lower cost
manner than traditional methods, such as manned aircraft
and satellite imagery. Using a large UAV, it is possible to
classify different vegetation in a field [8]. Differentiating
between vegetation types is used for weed management prac-
tices and coordinating ground robots [9]. Small rotorcrafts
operating at altitudes of 200m above the ground and speeds
of 30km/h are capable of surveying up to 70ha/hr [1]. A
smaller UAV operating at ranges of 10m above the ground
is capable of surveying rice paddies with a multi-spectral
camera [10]. By operating close to the crops, the impact
of atmospheric distortion is reduced, but fast and accurate
altitude measurements are needed.
In our approach, we fly even closer (within 1-2m) to
the crops. This low-altitude operation increases the spatial
resolution of the collected information beyond the limits
of traditional aerial imagery techniques. Flying close to the
crops allows the UAV to exploit gaps in the crops’ foliage
to detect the ground and sense the multiple layers of leaves.
B. Tree Canopy Estimation
In forestry applications there has been a significant amount
of research using 3D LiDARs to measure canopy cover,
biomass, and tree heights. Tree heights have been assessed
using man-portable LiDAR systems [11], collecting data
similar to what we desire to collect for corn crops. This
system is cumbersome as it requires scientists to reposition
the system at all data collection points. Our use of micro-
UAVs significantly reduces the time needed to conduct an
experiment because the UAV can quickly survey a field
without requiring a human to relocate bulky equipment.
LiDARs have been used in conjunction with aerial plat-
forms for forestry experiments as well. LiDARs generally
require larger platforms that are difficult and risky to operate
close to crops, which means they are forced to fly at high
altitudes where the irregularity of the tree shapes makes
feature extraction difficult [12]. These conditions also push
LiDARs outside their recommended operating specifications.
UAVs can mitigate these problems [13] by flying at altitudes
between 10-40m, which produces information with a higher
spatial density. At these altitudes, a heavy and expensive
LiDAR is needed to achieve a high spatial information
density.
Existing work differs from our approach, in that we are
using a laser scanner (2D scan) instead of a LiDAR (3D
image) due to payload limits of micro UAVs. Furthermore,
we are interested in aggregate information about heights of
groups of plants, not individual plants, We also must fly
much closer to the crops to sense the ground between the
plants, which requires more precise altitude control than
these forestry approaches. Finally, the use of small laser
scanners reduces the size and cost of the combined system,
which makes it safer to use for operators.
C. SLAM
Simultaneous localization and mapping (SLAM) algo-
rithms have been an area of intense research. SLAM algo-
rithms using only a laser scanner in an urban environment
[14] are accurate for ground vehicle navigation. Outdoor
SLAM has been accomplished using a combination of vision
and laser ranging data [15], which can increase the accuracy,
at the cost of computational complexity. Actuated planar
laser scanners have been shown to work in unstructured
environments such as forests [16], but require extremely
intensive computation, and are not suitable for real time
navigation for aerial robots requiring precise height control.
SLAM approaches are ill-suited for our work, as we do
not seek to create a detailed map of the entire environment,
but only to extract group statistics, such as crop height from
fields. Furthermore, SLAM approaches do not work well
with the dynamic and complex field environment (e.g., plants
move with the wind, leaves appear different under changing
light conditions), making it more difficult to sense with high
enough precision to extract persistent features from sensor
data. Finally, the computing power necessary to make real
time navigation close to the crops is not viable in the micro-
UAVs. Instead, we rely on GPS to localize the UAV in the
field.
Fig. 2. Corn plant measurement

(a)
−0.75 −0.5 −0.25 0 0.25 0.5 0.75
1
1.5
2
2.5
3
3.5
4
Scan Angle (rad)
Scan R
ange (
m)
Crop Tops
Ground
(b)
0 1 2 3 4 50
0.1
0.2
0.3
0.4
0.5
0.6
0.7
0.8
0.9
1
Distance (m)
CD
F
Upper Leaves
Ground
(c) (d)
Fig. 3. (a) Illustration of UAV measuring corn (b) sensor readings from corn field (c) distribution of sensor data (d) UAV with laserscanner with 90◦
scan angle in red
D. Corn Plant Structure and Measurement
Surveying agricultural fields requires an understanding
of the underlying vegetation. In this paper, we restrict our
studies to corn fields, but we discuss the generalization to
other types of crops in Section VI. A typical mature corn
plant has 12-22 leaves arranged along the stalk that grows
to a height of 2-3m [17]. The point at which a leaf joins the
stalk is referred to as a ‘node.’ As the plant matures, a thin,
long, tassel emerges from the top of the plant.
The structure of a corn plant makes it challenging to
survey fields, not only from the air, but also manually from
the ground. The corn is typically planted in rows that are
spaced 30 or 36 inches (76.2/91.44cm) apart. As the corn
grows, the leaves form a dense canopy between the rows,
which limits an aerial vehicle’s view of the ground. Typically,
the height of the plant is defined as the distance from the
top node to the ground. Figure 2 shows the standard method
of manually measuring the height of corn in a field. This
hand measurement process is labor intensive and error prone.
Tractors with specialized measuring devices can measure the
crops in a field, but will damage both the plants and the
ground [18]. Thus, it is only infrequently performed on a
small subset of plants in a field, despite the large impact
such measurements could have on crop production.
III. UAV ALTITUDE AND CROP HEIGHT ESTIMATION
We now present our measurement system that addresses
the difficulties of using a micro-UAV to survey crops, namely
locating the tops of the crops, and the ground.
A. Locating the top of the crops and the ground
Estimating crop height with an accuracy of 5cm requires
estimates of similar accuracy for the location of the ground
and the plants’ tops to compute their differential. 1
Determining the ground and crop top location, however,
can be challenging. The foliage of the corn fields makes
it difficult to directly sense the true ground location. An
illustration of the problem is shown in Figure 3(a). In this
figure, the UAV is attempting to sense the ground using
multiple sensor readings, represented by the dashed lines.
The layers of leaves block most of the sensor measurements,
1As we shall see in Section III-C, accurate ground measures are alsovaluable to maintain a UAV altitude within a band that is safe but still closeenough to the crops to collect the required data.
represented by the dotted black lines. Only one sensor
measurement, shown in the red dashed line, finds a narrow
gap in the foliage to reach the ground. Similarly, without
enough readings the top of the crop may be missed. From
these readings, statistics such as the crop height can be
computed, and by georeferencing the scans with GPS, height
maps of the field can be constructed.
In practice, the measurements also include noise. Fig-
ure 3(b) shows a single laser scan obtained at a corn field.
The x-axis represents the sample angle in reference to the
UAV’s body. The y-axis represents the distance from the
scanner to a surface. As expected, there is some height
variation across the top of the plants, at some angles the
values are invalid (not plotted), and the corn leaves block
most of the scans at the upper layers of leaves. However,
the single scan reveals that some readings have reached the
ground which in the figure is consistently located at ≈ 3.5m
from the UAV. Clearly, more scans and readings per scan
increase the probability of sensing through the canopy and
better characterizing the crop’s top.
We now use the empirical cumulative distributed function
(CDF) of the scan in Figure 3(b) to get a better sense of how
to interpret it. The distribution in Figure 3(c) makes it easier
to identify the different elements of the crop. The upper layer
of leaves is represented by the sudden jump at the 0.5m mark
in the CDF. The multiple layers of leaves then smooths the
distribution until the 1.75m mark. At this point, the plants
are largely leaf free, so most scans then reach the ground at
around the 3.5m mark. This profile of CDF is characteristic
of the crop scans obtained from the micro-UAV operating
close to corn crops, and it hints at the potential of extracting
plants’ tops and ground estimates from it.
We formalize this problem by representing the scans as a
multinomial distribution. The ranges reported by the sensor
are discretized into a set of k ranges, hk. The leaves’ density
determines the probability pk of the sensor detecting one
of the leaves at height k. The number of readings reported
in each location is the set of n trials for the multinomial
distribution. We seek to find two percentiles, pg and pc,which can be used to estimate the ground and crop top
location from the distribution of the laser scans.
Characterizing the plants in this way places certain re-
quirements on the sensor being used to gather the readings.
First, it must be able to quickly collect many samples from a

1: estimated crop height← 02: num scans← 03: procedure ESTIMATECROPHEIGHT(pg, pc)4: while PendingWaypoints do5: [L]← Scanner() ⊲ Get data from scanner6: (r, p, y)← IMU() ⊲ Get data from IMU7: b← Barometer() ⊲ Get barometric altitude estimate8: (altitude, scan crop height)← ProcessScan([L], r, p, y, b, pg, pc)9: UAV Control(altitude) ⊲ Control the UAV altitude
10: estimated crop height← estimated crop height+ scan crop height11: num scans← num scans+ 112: end while
13: return estimated crop height/num scans ⊲ Return the estimate crop height for the field14: end procedure
15:16: procedure PROCESSSCAN([L],r, p, y, barometer, pg, pc) ⊲ Crop and UAV Height Estimation from laser scans [L],17: ⊲ the roll, pitch, and yaw of the UAV, the barometric pressure derived UAV height estimate,18: ⊲ and the parameters for estimate the location of the ground and the top of the crop19: F ← ConeF ilter([L]) ⊲ Only keep center 90◦ of scans20: Z ← F ∗ EulerRotation(r, p, y) ⊲ Transform from UAV frame to world frame21: P ← Percentile(Z) ⊲ Assign a percentile rank p ∈ P to every range z ∈ Z22: {g, h} ← Estimator(P, Z, pg, pc) ⊲ Ground and top of crop corresponds to specific percentiles in Z23: filtered g ← MedianF ilter(g) ⊲ Pass ground estimate through median filter, length w24: filtered h←MedianF ilter(h) ⊲ Pass crop top estimate through median filter, length w25: scan crop height← filtered g − filtered h ⊲ Estimate the height of the crop in the scan26: altitude = Kalman(filtered h, barometer) ⊲ Estimate UAV’s height based on barometer and laser27: return {altitude, scan crop height} ⊲ Return the two values estimated by the procedure28: end procedure
Algorithm 1: Crop height and altitude estimation system
given area, so that the probability distribution is meaningful.
Second, it must have a narrow sensing radius, so that the
measurements can pass through the small gaps in the leaves,
and thus sense the ground.
B. Platform
Figure 1 shows our complete system operating over crops.
It is based on an Ascending Technologies Firefly hexacopter
[19] which has a maximum payload of 600g, of which we
use 528g. We augmented the UAV with a Hokuyo URG-
04LX-UG01 laser scanner, which is mounted in a downward
facing configuration under the UAV, as shown in Figure 3(d).
The laser scanner produces a 240◦ scan at 10Hz, with an
angular resolution of ≈ 0.36◦, which creates 683 range
readings per scan. The scanner has a maximum range of
5.6m. The scanner has an integrated filter which indicates
which ranges are invalid. While the scanner is intended
for indoor sensing, our tests in Section V show that when
mounted in a downward facing configuration without a direct
view of the sun, it will function effectively in an outdoor
environment. An onboard Atomboard processor interfaces to
and processes data from the laser scanner. The onboard GPS
and IMU are used in conjunction with the laser scanner to
control the UAV height. The software on the Atomboard is
developed in ROS [20], and its functionality is described in
the next section.
We assume that the crops are no more than three meters
tall. By flying the UAV within one meter of the plants’ tops,
the spatial resolution of the laser scans enables stable height
control and accurate estimates of crop height, as we will see
in the following sections.
C. Crop Height and UAV Altitude Estimation
Converting the laser scan information into a crop height
and UAV altitude estimate is a multi-step procedure, as
outlined in Algorithm 1. The measurements from the laser
scanner must be converted to altitude estimates, filtered,
and transformed to extract estimates of the crop height and
UAV altitude. Algorithm 1 presents the high level algorithm
for this procedure. Procedure EstimateCropHeight collects
sensor readings from the onboard sensors and uses the
measurements to process each laser scan, using Procedure
ProcessScan. ProcessScan returns an estimate of the UAV
altitude and the height of the crop in the scan. Estimate-
CropHeight uses the two estimates to control the UAV, and
estimate the height of the crops in the area of interest. Next,
we describe the operation of ProcessScan in detail.
Cone Filter: The ConeFilter procedure on line 19 of
Algorithm 1 decimates each laser scan reading, leaving a
90◦ arc of samples that are within 45◦ of the z-axis of the
UAV. The full 240◦ scan range is shown as a black and white
arc in Figure 3(d), and the used samples are from the region
shown in red. Rejecting all of the scan information from
outside this region eliminates the readings from the UAV’s
body, samples where the ground is outside the maximum
range of the scanner, and other readings that do not sense
the crop. Since the UAV does not aggressively maneuver
during a surveying mission, filtering early significantly cuts
the computational burden of later stages without losing useful
information.
The cone filter, combined with the maximum range of the
laser scanner produce an upper limit to the UAV’s altitude.
Given the difficulties in sensing the ground, all of the scans
in the 90◦ need to have a chance of reaching the ground, in
(a)
0.5 1 1.5 20
0.1
0.2
0.3
0.4
0.5
0.6
0.7
0.8
0.9
1
Distance (m)
CD
F
Top Leaves
Ground
(b)
0 10 20 30 40 50 60 700
0.25
0.5
0.75
1
1.25
1.5
Time (s)
Heig
ht (m
)
True
Estimated
(c)
1 2 3 4 5 6 7 8 9 10 11 120
0.01
0.02
0.03
0.04
0.05
0.06
0.07
0.08
0.09
0.1
Trial
Avera
ge H
eig
ht E
rror
(d)
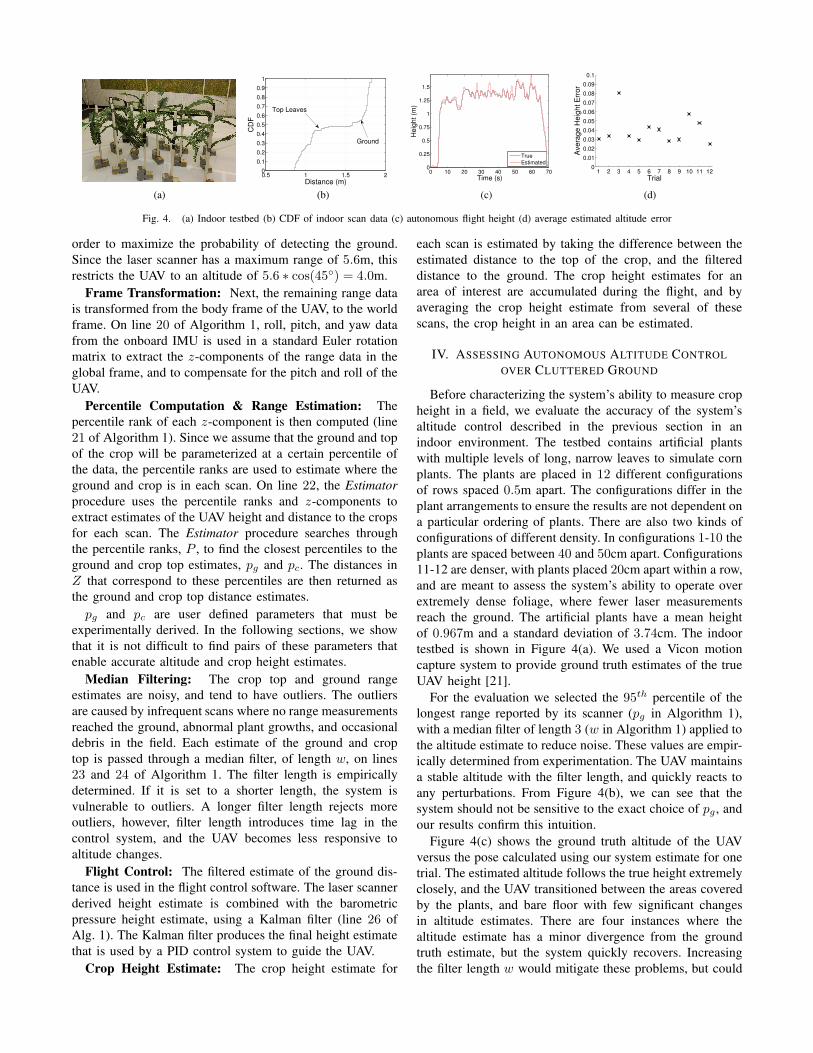
Fig. 4. (a) Indoor testbed (b) CDF of indoor scan data (c) autonomous flight height (d) average estimated altitude error
order to maximize the probability of detecting the ground.
Since the laser scanner has a maximum range of 5.6m, this
restricts the UAV to an altitude of 5.6 ∗ cos(45◦) = 4.0m.
Frame Transformation: Next, the remaining range data
is transformed from the body frame of the UAV, to the world
frame. On line 20 of Algorithm 1, roll, pitch, and yaw data
from the onboard IMU is used in a standard Euler rotation
matrix to extract the z-components of the range data in the
global frame, and to compensate for the pitch and roll of the
UAV.
Percentile Computation & Range Estimation: The
percentile rank of each z-component is then computed (line
21 of Algorithm 1). Since we assume that the ground and top
of the crop will be parameterized at a certain percentile of
the data, the percentile ranks are used to estimate where the
ground and crop is in each scan. On line 22, the Estimator
procedure uses the percentile ranks and z-components to
extract estimates of the UAV height and distance to the crops
for each scan. The Estimator procedure searches through
the percentile ranks, P , to find the closest percentiles to the
ground and crop top estimates, pg and pc. The distances in
Z that correspond to these percentiles are then returned as
the ground and crop top distance estimates.
pg and pc are user defined parameters that must be
experimentally derived. In the following sections, we show
that it is not difficult to find pairs of these parameters that
enable accurate altitude and crop height estimates.
Median Filtering: The crop top and ground range
estimates are noisy, and tend to have outliers. The outliers
are caused by infrequent scans where no range measurements
reached the ground, abnormal plant growths, and occasional
debris in the field. Each estimate of the ground and crop
top is passed through a median filter, of length w, on lines
23 and 24 of Algorithm 1. The filter length is empirically
determined. If it is set to a shorter length, the system is
vulnerable to outliers. A longer filter length rejects more
outliers, however, filter length introduces time lag in the
control system, and the UAV becomes less responsive to
altitude changes.
Flight Control: The filtered estimate of the ground dis-
tance is used in the flight control software. The laser scanner
derived height estimate is combined with the barometric
pressure height estimate, using a Kalman filter (line 26 of
Alg. 1). The Kalman filter produces the final height estimate
that is used by a PID control system to guide the UAV.
Crop Height Estimate: The crop height estimate for
each scan is estimated by taking the difference between the
estimated distance to the top of the crop, and the filtered
distance to the ground. The crop height estimates for an
area of interest are accumulated during the flight, and by
averaging the crop height estimate from several of these
scans, the crop height in an area can be estimated.
IV. ASSESSING AUTONOMOUS ALTITUDE CONTROL
OVER CLUTTERED GROUND
Before characterizing the system’s ability to measure crop
height in a field, we evaluate the accuracy of the system’s
altitude control described in the previous section in an
indoor environment. The testbed contains artificial plants
with multiple levels of long, narrow leaves to simulate corn
plants. The plants are placed in 12 different configurations
of rows spaced 0.5m apart. The configurations differ in the
plant arrangements to ensure the results are not dependent on
a particular ordering of plants. There are also two kinds of
configurations of different density. In configurations 1-10 the
plants are spaced between 40 and 50cm apart. Configurations
11-12 are denser, with plants placed 20cm apart within a row,
and are meant to assess the system’s ability to operate over
extremely dense foliage, where fewer laser measurements
reach the ground. The artificial plants have a mean height
of 0.967m and a standard deviation of 3.74cm. The indoor
testbed is shown in Figure 4(a). We used a Vicon motion
capture system to provide ground truth estimates of the true
UAV height [21].
For the evaluation we selected the 95th percentile of the
longest range reported by its scanner (pg in Algorithm 1),
with a median filter of length 3 (w in Algorithm 1) applied to
the altitude estimate to reduce noise. These values are empir-
ically determined from experimentation. The UAV maintains
a stable altitude with the filter length, and quickly reacts to
any perturbations. From Figure 4(b), we can see that the
system should not be sensitive to the exact choice of pg , and
our results confirm this intuition.
Figure 4(c) shows the ground truth altitude of the UAV
versus the pose calculated using our system estimate for one
trial. The estimated altitude follows the true height extremely
closely, and the UAV transitioned between the areas covered
by the plants, and bare floor with few significant changes
in altitude estimates. There are four instances where the
altitude estimate has a minor divergence from the ground
truth estimate, but the system quickly recovers. Increasing
the filter length w would mitigate these problems, but could

make the system less responsive to true changes in height,
and thus more difficult to control.
Figure 4(d) shows the average difference between the
true height and our system estimated altitude for all twelve
configurations. The system has an average error of 4.1cm
for the first ten sparse configurations, and an error of 3.6cm
for the final two dense configurations. The variance for all
configurations was 0.0003. This small error confirms that
the system is consistently tracking the true ground, and the
choice of pg is valid.
Our indoor evaluation indicates that the system is able to
accurately estimate and control its true altitude, even when
it is flying over cluttered ground. Since the system is able to
control its true altitude, it is able to consistently detect the
ground. We will use the parameterization of pg and w from
this section to estimate the crop’s height in the next section.
V. EXPERIMENTAL HEIGHT ESTIMATION RESULTS
We now evaluate whether the system is able to accurately
measure a crop’s height. The results of the prior section
demonstrate that the system can sense the ground through
severe clutter. If the system is able to reliably track the top
of the plants, it will therefore be able to estimate the crop
height, by taking the difference between the ground estimate
and the crop top distance estimate. The system is evaluated
using both the indoor testbed introduced in the prior section,
and the outdoor field shown in Figure 1.
A. Outdoor Testbed
An outdoor testbed is needed to assess the system’s ability
to measure a real crop, and to test the laser scanner’s
effectiveness outdoor. Initial tests revealed that the scanner
will not function when placed with a direct view of the sun.
However, by mounting the scanner in a downward facing
configuration, the 96.5% of the range measurements in each
scan were valid, on average.
To create the ground truth estimate for the outdoor testbed,
a trained researcher measured the height of 20 plants. The
height of the corn from the ground to the top of the corn
varies between 1.98m and 2.26m, with a mean height of
2.108m and a standard deviation of 8.28cm. The height from
the ground to the tassel of the same plants ranged between
2.33 and 2.65m, with a mean of 2.51m and a standard
deviation of 8.61cm. A 3 × 10m area was surveyed, which
is the size of a typical agronomy phenotyping trial.
To evaluate the scanner in an outdoor setting, a total of
1, 155 scans were taken above the corn field in a sunny
morning in August. The UAV is flown under manual control
multiple times over each row in the area, at approximately the
same speed. The laser scanner continuously scans the region,
and the results from the scans are combined to form an
estimate of the average height of the corn in the region. After
restricting the sample angles to the central 90◦ arc, 295, 680individual range readings were collected. Of these samples,
over 96.5% are valid. The number of valid samples per scan
is shown in Figure 5, as reported by the laser scanner’s
internal filtering process. At least 75% of the possible 256
200 400 600 800 1000190
200
210
220
230
240
250
Scan Number
Num
ber
valid
ranges
Fig. 5. Valid samples per scan
range readings in the 90◦ arc are valid in each scan. Even
when the number of valid samples drops, it quickly recovers,
so the UAV did not encounter prolonged periods of bad
scanner performance. The large number of range readings
in each scan enables the construction of a well defined
distribution, and potentially allows many samples to reach
the ground in each scan. The number of valid samples in
each scan shows that the small laser scanner, when properly
placed, is effective in an outdoor setting.
B. Indoor vs. Outdoor Data Comparison
We first compare the distributions produced from scans of
outdoor data (shown in Figure 3(c)) to indoor data (shown in
Figure 4(b)), to check if the same features are present in both
testbeds. If both locations have similar types of distributions,
it is likely that the same procedure for estimating crop height
and UAV altitude will work in both locations.
Figure 4(b) shows the CDF of a scan taken in the in-
door testbed. This figure shows the same sharp increase in
readings, corresponding to the tops of the leaves, at a range
of 0.9m to 1.1m, as the outdoor corn does. The layers of
leaves cause the same gradual increase in the CDF, until the
last layer is reached, as is seen in Figure 3(c). Finally, the
samples that reach the ground cause a final sharp uptick in
the CDF at long ranges, just as in the outdoor data. The
similar shape of the two distributions suggests that the same
crop height and altitude estimates can be used in both cases,
even though the indoor testbed uses much shorter plants.
C. Crop Height Analysis
We now explore the effect of the input parameters pg and
pc on the estimates of the crop height. Recall that pg and pcare parameters used to choose which samples represent the
ground and the top of the crop.
Table I summarizes the impact of different values for
pg and pc on the crop height estimate. The first row is
the result of taking the two extreme points of each scan,
highest and lowest, and using the difference as the crop
height estimate. This produces unacceptable results, as the
outdoor crop height estimate is 0.77m larger than the actual

pg . pc Est. Indoor Height (m) Est. Outdoor Height (m) Indoor Error (m) Outdoor Error (m)
100 0 1.0545 2.8810 0.0875 0.773099 1 1.0412 2.5026 0.0742 0.394699 2 1.0335 2.4601 0.0665 0.352199 5 0.9888 2.3808 0.0218∗ 0.272895 1 1.0219 2.1849 0.0549 0.076995 2 1.0133 2.1440 0.0463∗ 0.0360∗95 5 0.9690 2.0625 0.0020∗ −0.0455∗90 1 1.0040 1.9077 0.0370∗ −0.200390 2 0.9956 1.8609 0.0286∗ −0.247190 5 0.9514 1.7771 −0.0156∗ −0.3309
TABLE I
IMPACT OF ESTIMATION PARAMETERS ON CROP HEIGHT ESTIMATES. VALUES WITH A * ARE UNDER THE 5CM OF ERROR REQUIREMENT.
crop height. This is the result of the tassels of the corn
and tall corn leaves producing estimates of the plants’
tops that are closest to the UAV. The ground estimate is
also overestimated as it captures holes in the ground, and
furrows in the field, producing long range scan estimates. The
indoor data is similarly affected by noisy measurements, and
overestimates the artificial plant heights. The height estimate
is also unaffected by the imprecise manual control, which
caused the UAV to repeatedly change its altitude over the
field. Despite changing the UAV’s position relative to the
crop, the system was still able to form an accurate height
estimate.
As more data is filtered from the scans, the crop height
estimates converge to the actual values. Of particular interest
are the values around pg = 0.95, which produced a stable
flight from the UAV. Using this parameterization, we can see
that rejecting a small amount of the close scans to the UAV,
pc = 0.02, produces a crop height estimate that is within 4cm
of the true value for the outdoor field. This parameterization
also accurately estimates the indoor testbed’s height.
Table I shows that the system is more sensitive to changes
in pg than to pc in the outdoor setting. We conjecture that
this is due to the dense upper canopy returns many samples
that are a good estimator for the top of the crop. On the
other hand, very few samples reach the ground, so the few
samples reaching the ground have a high probability of being
corrupted by variations in the ground, holes, debris, or even
small plants growing in the field.
Intuitively, the parameters match the physical aspects of
the outdoor field. The top layers of leaves form a dense
canopy, with only a few protrusions by leaves and corn
tassels. Only a small number of measurements in each scan
will reflect from these surfaces, which means pc can be very
small. On the other hand, the ground readings are impacted
by furrows in the field, and the generally uneven ground.
This requires more noise rejection from the ground estimate,
results in pg = 0.95. Given that the corn was in good
health, and mature, the canopy in the field is representative
of the highly cluttered environments the UAV will operate
in. Future studies will examine the impact of different fields
on this parameterization.
VI. CONCLUSIONS AND FUTURE WORK
In this paper we have shown the feasibility of using a
low cost laser scanner, mounted to a small UAV platform,
to measure crop heights and control the height of the UAV
over fields. With appropriate filtering and computation, the
system is able to exploit small gaps in the crop foliage to
directly sense the ground, which enables the UAV to fly at
a fixed altitude, close to the crops. Flying close to the fields
dramatically increases the spatial resolution of the data when
compared to traditional measurements, and enables smaller
and cheaper UAVs to be used in these missions.
In the future, we will exploit the laser scanner’s ability
to sense multiple levels of the crop canopy to generate
multidimensional models of the field. These models can
then be used to evaluate crop development and health.
Additional sensors, such as a camera, will also be added to
the system to allow agronomy researchers a better view of a
field’s development and health. The system will be tested on
other crops to characterize the distribution of scan data for
different plants. These new models will be used to adapt the
existing hardware and software system to a larger variety of
crops. Geo-referencing the combined data will enable new
datamaps to be built, which will enable new insights into
crop development and health.
ACKNOWLEDGEMENT
The authors would like to thank Jon Luetchens and Collin
Lamkey for their assistance in conducting field experiments.
We would also like to thank John-Paul Ore, Adam Taylor,
and Andrew Mittleider in the NIMBUS lab for their flight
and testing assistance. This work was completed utilizing the
Holland Computing Center of the University of Nebraska.
REFERENCES
[1] J. Berni, P. Zarco-Tejada, L. Suarez, and E. Fereres, “Thermal andnarrowband multispectral remote sensing for vegetation monitoringfrom an unmanned aerial vehicle,” IEEE Transactions on Geoscience
and Remote Sensing, vol. 47, no. 3, pp. 722–738, 2009.
[2] J. Soria-Ruiz and Y. Fernandez-Ordonez, “Methodology to generateyield maps of maize crops,” in Geoscience and Remote Sensing
Symposium (IGARSS), 2010 IEEE International, July 2010, pp. 1887–1890.
[3] S. A. Aziz, B. L. Steward, S. J. Birrell, D. S. Srestha, and T. C.Kaspar, “Ultrasonic sensing for corn plant canopy characterization,”in In proceedings of ASAE/CSAE Annual International Meeting, 2004.

[4] D. S. Srestha, B. Steward, and T. Kaspar, “Determination of early stagecorn plant height using stereo vision,” in International COnference on
Precision Agriculture Abstracts and Proceedings, 2002.
[5] D. Srestha and B. Steward, “Shape and size analysis of corn plantcanopies for plant population and space sensing,” Applied Engineering
in Agriculture, vol. 21, pp. 295–303, 2005.[6] R. Wolkowski and B. Lowery, “Soil compaction: Causes, concerns,
and cures,” University of Wisconsin, Tech. Rep. A3367, 2008.[7] F. Costa, J. Ueyama, T. Braun, G. Pessin, F. Osorio, and P. Vargas,
“The use of unmanned aerial vehicles and wireless sensor network inagricultural applications,” in Geoscience and Remote Sensing Sympo-
sium (IGARSS), 2012 IEEE International, 2012, pp. 5045–5048.[8] T. Arnold, M. De Biasio, A. Fritz, and R. Leitner, “UAV-based
multispectral environmental monitoring,” in 2010 IEEE Sensors, 2010,pp. 995–998.
[9] W. Kazmi, M. Bisgaard, F. Garcia-Ruiz, K. Kansen, and A. Cour-Harbo, “Adaptive surveying and early treatment of crops with a teamof autonomous vehicles,” in European Conference on Mobile Robots,Orebro, Sweden, 2010, pp. 253–258.
[10] K. Uto, H. Seki, G. Saito, and Y. Kosugi, “Characterization of ricepaddies by a UAV-Mounted miniature hyperspectral sensor system,”IEEE Journal of Selected Topics in Applied Earth Observations and
Remote Sensing, vol. 6, no. 2, pp. 851–860, 2013.[11] C. M. Listopad, J. B. Drake, R. E. Masters, and J. F. Weishampel,
“Portable and airborne small footprint LiDAR: forest canopy structureestimation of fire managed plots,” Remote Sensing, vol. 3, no. 12, pp.1284–1307, Jun. 2011.
[12] C. Edson and M. G. Wing, “Airborne light detection and ranging
(LiDAR) for individual tree stem location, height, and biomass mea-surements,” Remote Sensing, vol. 3, no. 12, pp. 2494–2528, Nov. 2011.
[13] Y. Lin, J. Hyyppa, and A. Jaakkola, “Mini-UAV-Borne LIDAR forfine-scale mapping,” IEEE Geoscience and Remote Sensing Letters,vol. 8, no. 3, pp. 426–430, 2011.
[14] H. Zhao, M. Chiba, R. Shibasaki, X. Shao, J. Cui, and H. Zha, “SLAMin a dynamic large outdoor environment using a laser scanner,” inIEEE International Conference on Robotics and Automation, 2008.
ICRA 2008, 2008, pp. 1455–1462.[15] P. Newman, D. Cole, and K. Ho, “Outdoor SLAM using visual ap-
pearance and laser ranging,” in Proceedings 2006 IEEE International
Conference on Robotics and Automation, 2006. ICRA 2006, 2006, pp.1180–1187.
[16] M. Song, F. Sun, and K. Iagnemma, “Natural feature based localizationin forested environments,” in 2012 IEEE/RSJ International Conference
on Intelligent Robots and Systems (IROS), 2012, pp. 3384–3390.[17] X. Yin, M. A. McClure, D. D. T. Ngowari Jaja, and R. M. Hayes,
“In-season prediction of corn yield using plant height under majorproduction systems,” Journal of Agronomy, vol. 103, pp. 923–929,2011.
[18] M. Hamza and W. Anderson, “Soil compaction in cropping systems:A review of the nature, causes and possible solutions,” Soil and Tillage
Research, vol. 82, no. 2, pp. 121–145, 2005.[19] “Ascending Technologies.” [Online]. Available: http://www.asctec.de[20] “Robot Operating System.” [Online]. Available: http://www.ros.org/[21] “VICON.” [Online]. Available: http://www.vicon.com