omwi annual report to congress fy 2016 - occ: … promoting equal employment opportunity and the ......
TRANSCRIPT

ANNUAL REPORT
2016
Office of Minority and Women Inclusion

Office of Minority and Women Inclusion2
2016 Annual Report to Congress |
Page intentionally left blank
Office of the Comptroller of the Currency 3
2016 Annual Report to Congress
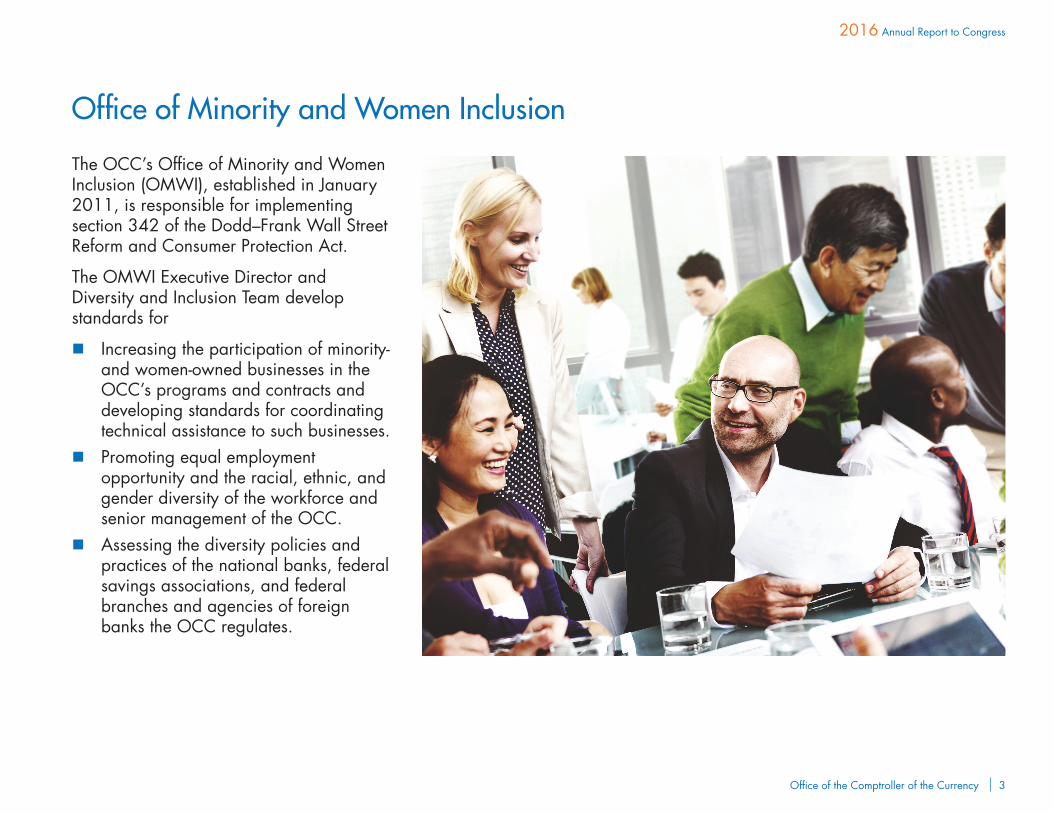
The OCC’s Office of Minority and Women Inclusion (OMWI), established in January 2011, is responsible for implementing section 342 of the Dodd–Frank Wall Street Reform and Consumer Protection Act.
The OMWI Executive Director and Diversity and Inclusion Team develop standards for
n Increasing the participation of minority- and women-owned businesses in the OCC’s programs and contracts and developing standards for coordinating technical assistance to such businesses.
n Promoting equal employment opportunity and the racial, ethnic, and gender diversity of the workforce and senior management of the OCC.
n Assessing the diversity policies and practices of the national banks, federal savings associations, and federal branches and agencies of foreign banks the OCC regulates.
Office of Minority and Women Inclusion

Office of Minority and Women Inclusion4
2016 Annual Report to Congress | Office of Minority and Women Inclusion
Page intentionally left blank
Office of the Comptroller of the Currency 5
2016 Annual Report to Congress
Contents
Introduction .......................................................................................7
Business Activities ..............................................................................8Fiscal Year 2016 Payments ...................................................... 8Five-Year Trend in Payments to MWOBs, MOBs, and WOBs........ 8Five-Year Trend in Payments to MOB Demographic Groups .......... 9Trends in Awards by Classification of Suppliers ........................ 10
Analysis of Number of MOBs, WOBs and Demographic Groups Participating and Dollars Awarded in Top NAICS Codes ............................................................................ 11
Implementation of Standards and Procedures to Ensure Fair Inclusion ............................................................. 13 Successes and Challenges in the OCC’s Supplier Diversity Program ................................................................. 13
Technical Assistance and Outreach Program ....................... 13Plans for Enhancing Opportunities to Contract With and Provide Technical Assistance to MWOBs...................... 14
Workforce Diversity and Inclusion in Employment: Recruitment, Hiring, Career Development, and Retention ................... 15
Current Status ....................................................................... 15Fiscal Year 2016 Focus Areas ................................................ 19
Increasing the Participation of Hispanics ............................ 19Increasing the Participation of Female Bank Examiners ......... 22Increasing the Participation of Females and Minorities in Supervisor Roles and Senior-Level Positions .................... 26
Workforce Environment ......................................................... 30Agency Commitment ........................................................ 30Career Development ........................................................ 32Employee Engagement ..................................................... 33Program Accountability .................................................... 34
Regulated Entities ............................................................................35
Financial Literacy .............................................................................36
Appendixes .....................................................................................37Appendix A: OCC Method and Data Sources for Payments and Awards ........................................................... 37
Payments ........................................................................ 37Awards .......................................................................... 37
Appendix B: OCC Payments, Five-Year Trend ........................... 38Appendix C: OCC Awards, Five-Year Trend ............................. 39Appendix D: OCC Awards by Top Seven NAICS Codes, Five-Year Trend .......................................................... 40Appendix E: Technical Assistance to MWOBs, FY 2016 ............ 43Appendix F: Awards by Demographic Group in the OCC’s Top Seven NAICS Codes, FY 2016 .............................. 45Appendix G: Changes From 2000 to 2010 in Civilian Labor Force .............................................................. 46Appendix H: OCC Workforce Profile, Five-Year Trend ............... 47Appendix I: OCC Workforce Profile as of September 30, 2016 ............................................................ 48Appendix J: OCC FY 2016 EEO-1 Report (Occupational Categories Profile) Distribution by ERI and Gender: Permanent Employees ................................... 49Appendix K: Hispanic Female Profile by Occupation Positions, Five-Year Trend ....................................................... 50Appendix L: Hispanic Male Profile by Occupation Positions, Five-Year Trend ....................................................... 51Appendix M: OCC Participation in Supervisor Positions by EEO Groups, Five-Year Trend ................................ 52Appendix N: OCC Workforce Profile of NB-VI to NB-VII Feeder Grades and SLP, Five-Year Trend ........................ 53Appendix O: Employee Network Groups................................. 54Appendix P: Abbreviations .................................................... 55

VISIONThe OCC is a preeminent prudential supervisor that adds value through proactive and risk-based supervision; is sought after as a source of knowledge and expertise; and promotes a vibrant and diverse banking system that benefits consumers, communities, businesses, and the U.S. economy.
CORE VALUES n Integrity
n Expertise
n Collaboration
n Independence

Office of the Comptroller of the Currency 7
2016 Annual Report to Congress
IntroductionThe Office of the Comptroller of the Currency (OCC) charters, regulates, and supervises national banks and federal savings associations and licenses, regulates, and supervises the federal branches and agencies of foreign banks. The OCC’s mission is to ensure that these institutions operate in a safe and sound manner, provide fair access to financial services, treat customers fairly, and comply with applicable laws and regulations. The OCC is an independent, non-appropriated bureau of the U.S. Department of the Treasury.
1 12 USC 5452.2 The federal financial agencies required to establish an OMWI under section 342 are the Board of Governors of the Federal Reserve System (Board), each of the Federal Reserve Banks, Consumer Financial Protection Bureau (CFPB), Department of the Treasury, Federal Deposit Insurance Corporation (FDIC), Federal Housing Finance Agency (FHFA), National Credit Union Administration (NCUA), OCC, and Securities and Exchange Commission (SEC).
The OCC’s Strategic Plan for Fiscal Years 2015–2019 establishes three primary goals toward achievement of its vision as a preeminent prudential supervisory agency. The strategic goals focus on supporting a vibrant and diverse banking system and economy; enhancing OCC collaboration, innovation, coordination, and process efficiency; and ensuring that the agency continues to operate independently and effectively into the future.
The fulfillment of the agency’s core mission of bank supervision depends on its employment of talented staff with high levels of expertise and experience. To maintain a competent, highly qualified workforce, the OCC is fully committed to using and retaining its employees’ skills, while recruiting the best talent available from a variety of sources. The agency is committed to maintaining an inclusive culture and workplace environment with a diversity strategy that focuses on leadership commitment, recruitment, development, retention, work/life balance, and an engaging culture. The OCC is equally committed to the inclusion of minorities, women, and minority- and women-owned businesses at all levels of the agency’s business activities.
In compliance with section 342 of the Dodd–Frank Wall Street Reform and Consumer Protection Act (Dodd–Frank),1 the OCC established its Office of Minority and Women Inclusion (OMWI) in January 2011 to be responsible for all matters of the agency relating to diversity in management, employment, and business activities. Dodd–Frank requires each OMWI agency2 to submit an annual report to Congress regarding actions taken pursuant to section 342. The OCC’s Fiscal Year 2016 Annual Report to Congress covers such actions and information for the period of October 1, 2015, through September 30, 2016.
Office of Minority and Women Inclusion8
2016 Annual Report to Congress | Business Activities
Business Activities
FISCAL YEAR 2016 PAYMENTS
1. Statement of the total amounts the OCC paid to contractors during the reporting period:
n Total payments to contractors were $154,406,367.63.3
2. Percentage of the OCC’s total payments to minority-owned or women-owned businesses (MWOB); minority-owned businesses (MOB); and women-owned businesses (WOB):
n Payments to MWOBs were $60,595,166.63, representing 39.2 percent of the OCC’s total contractor payments.4
n Payments to MOBs5 were $44,556,544.67, representing 28.9 percent of the OCC’s total contractor payments.
n Payments to WOBs6 were $18,969,244.92, representing 12.3 percent of the OCC’s total contractor payments.
For a detailed explanation of the OCC’s method and data sources for reporting payments, please refer to appendix A.
3 “Payments” are the net amounts, after any discounts, the OCC paid to contractors during the fiscal year, regardless of when the awards were entered into the Federal Procurement Database System—Next Generation (FPDS-NG). Because contractors may submit invoices to the OCC after the close of the fiscal year in which the awards were made, the OCC’s total payments to contractors during a given fiscal year may differ slightly from the total awards. For details of the specific amounts the OCC paid and awarded to MWOBs, MOBs, WOBs, and MOB demographic groups, please refer to appendixes B and C.4 Payments to businesses that are both minority- and women-owned are counted only once in the total dollars paid and percentage paid to MWOBs. For fiscal year 2016, payments to businesses that were neither MOBs nor WOBs were $93,811,201.00, representing 60.8 percent of the OCC’s total contractor payments.5 Payments to MOBs include all businesses that indicate they are minority-owned in the U.S. government’s System for Award Management (SAM).6 Payments to WOBs include all businesses that indicate they are women-owned in the SAM. 7 The percentage differences stated in the narrative of this report are based on underlying data (see appendix B), not the rounded percentages used in figures 1 and 2.
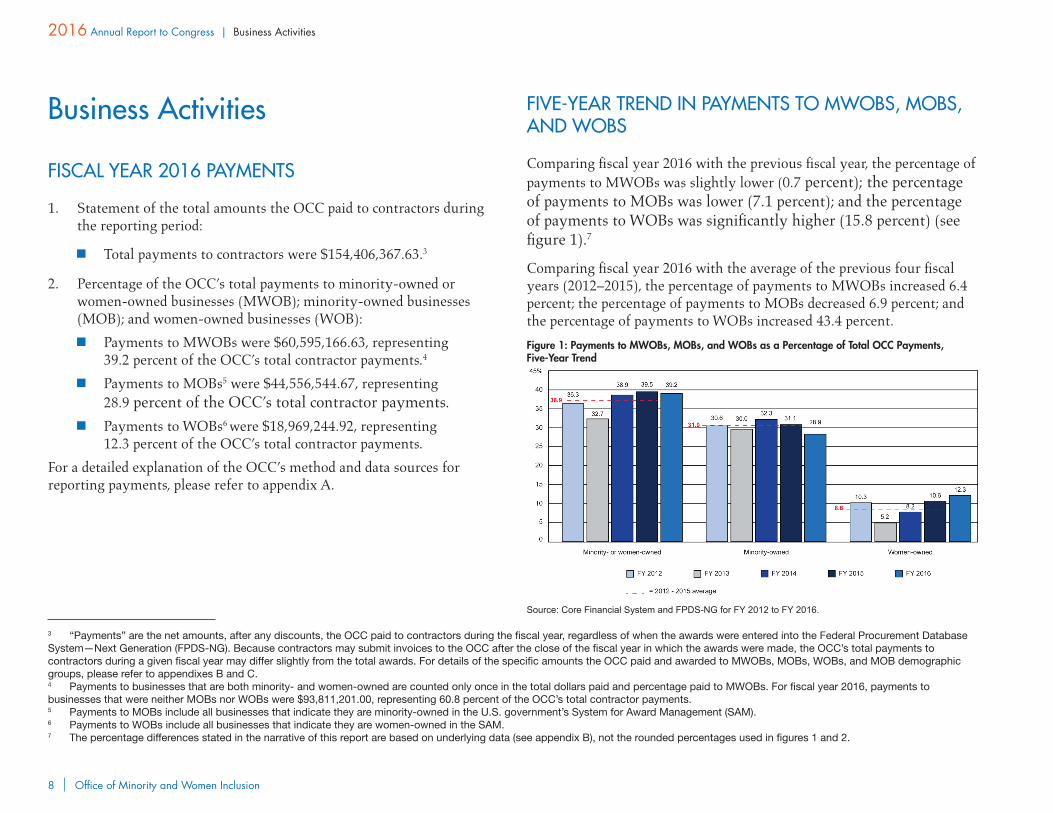
FIVE-YEAR TREND IN PAYMENTS TO MWOBS, MOBS, AND WOBS
Comparing fiscal year 2016 with the previous fiscal year, the percentage of payments to MWOBs was slightly lower (0.7 percent); the percentage of payments to MOBs was lower (7.1 percent); and the percentage of payments to WOBs was significantly higher (15.8 percent) (see figure 1).7
Comparing fiscal year 2016 with the average of the previous four fiscal years (2012–2015), the percentage of payments to MWOBs increased 6.4 percent; the percentage of payments to MOBs decreased 6.9 percent; and the percentage of payments to WOBs increased 43.4 percent.
Figure 1: Payments to MWOBs, MOBs, and WOBs as a Percentage of Total OCC Payments, Five-Year Trend
Source: Core Financial System and FPDS-NG for FY 2012 to FY 2016.

Office of the Comptroller of the Currency 9
Business Activities | 2016 Annual Report to Congress
FIVE-YEAR TREND IN PAYMENTS TO MOB DEMOGRAPHIC GROUPS
In addition to the section 342 requirement to report the total amounts and percentage of payments to MWOBs, MOBs, and WOBs, the OCC also tracks payments to MOB demographic groups (see figure 2). Specifically, the OCC reports payments to Asian American-owned businesses,8 Black American-owned businesses, Hispanic American-owned businesses, Native American-owned businesses,9 and Other MOBs.10
Fiscal Year 2016 Compared With Previous Year Comparing fiscal year 2016 with the previous fiscal year, the percentage of payments to Hispanic American-owned businesses and Native American-owned businesses both increased, and the percentage of payments to Other MOBs remained the same:
n Hispanic American-owned businesses was 1.2 percent compared with 0.6 percent.
n Native American-owned businesses was 4.2 percent compared with 2.8 percent.
n Other MOBs remained at 0.2 percent.
Comparing fiscal year 2016 with the previous fiscal year, the percentage of payments to Asian American-owned businesses and Black American-owned businesses both decreased:
8 “Asian American” means Asian-Pacific Americans (persons with origins from Burma, Thailand, Malaysia, Indonesia, Singapore, Brunei, Japan, China, Taiwan, Laos, Cambodia (Kampuchea), Vietnam, Korea, the Philippines, Republic of Palau, Republic of the Marshall Islands, Federated States of Micronesia, the Commonwealth of the Northern Mariana Islands, Guam, Samoa, Macao, Hong Kong, Fiji, Tonga, Kiribati, Tuvalu, or Nauru) and Subcontinent Asian (Asian-Indian) Americans (persons with origins from India, Pakistan, Bangladesh, Sri Lanka, Bhutan, the Maldives Islands, or Nepal). (See 48 CFR 52.219-1.)9 “Native American” means American Indians, Eskimos, Aleuts, or Native Hawaiians. (See 48 CFR 52.219-1.)10 “Other MOBs” means those businesses designating “minority-owned” in the SAM, but not designating Asian American, Black American, Hispanic American, or Native American.
n Asian American-owned businesses was 20.3 percent compared with 23.0 percent.
n Black American-owned businesses was 3.5 percent compared with 4.7 percent.
Fiscal Year 2016 Compared With Average of Previous Four Fiscal Years Comparing fiscal year 2016 with the average of the previous four fiscal years (2012–2015), the percentage of payments to Hispanic American-owned businesses and Native American-owned businesses both increased and the average percentage of payments to Other MOBs stayed the same. However, the percentage of payments to Asian American-owned businesses and Black American-owned businesses both decreased:
n Hispanic American-owned businesses was 1.2 percent compared with average 1.1 percent.
n Native American-owned businesses was 4.2 percent compared with average 1.9 percent.
n Other MOBs remained at 0.2 percent
n Asian American-owned businesses was 20.3 percent compared with average 23.8 percent.
n Black American-owned businesses was 3.5 percent compared with average 4.2 percent.

Office of Minority and Women Inclusion10
2016 Annual Report to Congress | Business Activities
Figure 2: Payments to MOB Demographic Groups as a Percentage of Total OCC Payments, Five-Year Trend
Source: Core Financial System and FPDS-NG for FY 2012 to FY 2016.
For details of the OCC’s five-year payment trend to MOB demographic groups, please refer to appendix B.
11 The NAICS is the standard that federal statistical agencies use in classifying business establishments for the purpose of collecting, analyzing, and publishing statistical data related to the U.S. business economy. The NAICS is a two- to six-digit hierarchical classification system, offering five levels of detail. Each digit in the code is part of a series of progressively narrower categories, and more digits in the code signify greater classification detail. The first two digits designate the economic sector, the third digit designates the subsector, the fourth digit designates the industry group, the fifth digit designates the NAICS industry, and the sixth digit designates the national industry.12 “Awards” are action obligations, which are the net amount of funds obligated or de-obligated. The FPDS-NG uses the NAICS code categories to track award data. For additional information on the method and data sources for reporting awards, please refer to appendix A.
TRENDS IN AWARDS BY CLASSIFICATION OF SUPPLIERS
Each year the OMWI tracks the North American Industry Classification System (NAICS)11 codes with the highest cumulative dollar amounts awarded by the OCC.12 For fiscal year 2016, computer-related purchases (including other computer-related services; data processing, hosting, and related services; and computer system design services) accounted for nearly two-thirds of the OCC’s total dollars awarded (see figure 3).
The OMWI’s analysis of the NAICS code award categories over the last five years has identified two trends. First, seven NAICS codes consistently account for more than 70.0 percent of the OCC’s awards (see appendix D). Second, computer-related purchases make up the largest expenditures by the OCC.
The OCC reports on the classification of suppliers and includes this information in the OMWI’s outreach materials to help businesses understand the types of industries in which the OCC spends the majority of its contracting dollars.

Office of the Comptroller of the Currency 11
Business Activities | 2016 Annual Report to Congress
Figure 3: NAICS Codes With 1 Percent or Greater of Total OCC Award Dollars, FY 2016
Source: FPDS-NG for FY 2016.
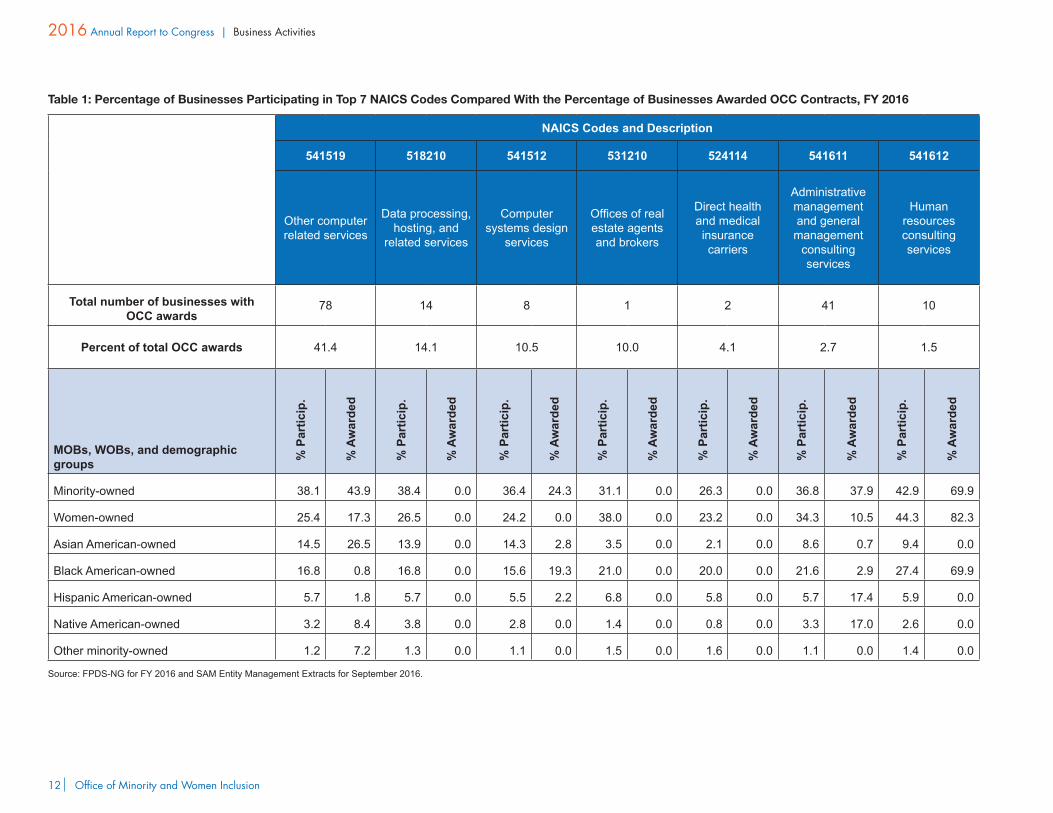
Analysis of Number of MOBs, WOBs, and Demographic Groups Participating and Dollars Awarded in Top NAICS CodesTo identify potential opportunities for increasing MWOB participation, the OMWI analyzed the OCC’s top seven NAICS codes in relation to the demographics of contractors who provide these services. This analysis enables the OMWI to compare the percentage of businesses receiving OCC awards in each NAICS code with the percentage of MWOBs with capabilities in that code.
For example, while MOBs represented 38.1 percent of businesses designated “other computer-related services” (the OCC’s most-used NAICS code), MOBs represented 43.9 percent of OCC award recipients in this category (see table 1). In the OCC’s seventh largest NAICS code, “human resources consulting services,” WOBs made up 44.3 percent of the businesses and 82.3 percent of OCC award recipients.
13 Specifically, Asian American-owned businesses received 26.5 percent; Black American-owned businesses received 0.8 percent; Hispanic American-owned businesses received 1.8 percent; Native American-owned businesses received 8.4 percent; and Other MOBs received 7.2 percent.
The OCC uses these data analyses to develop strategies around NAICS codes where the agency has low percentages of awards to MOBs or WOBs (for example, the OCC will explore the OCC’s awards for “data processing, hosting, and related services” for opportunities where MOBs and WOBs could offer these services).
The OMWI also analyzed data on the OCC’s percentage of dollars awarded in the top seven NAICS codes to MOBs, WOBs, and MOB demographic groups (see appendix F). This analysis shows that there were awards to every demographic group in the NAICS code “other computer-related services”13 (by both total dollars and total number of contractors). The OWMI monitors and is developing procurement strategies that promote diversity and inclusion for both the number of MWOBs and the dollars awarded to MWOBs in each of its top NAICS codes.
Office of Minority and Women Inclusion12
2016 Annual Report to Congress | Business Activities
Table 1: Percentage of Businesses Participating in Top 7 NAICS Codes Compared With the Percentage of Businesses Awarded OCC Contracts, FY 2016
NAICS Codes and Description
541519 518210 541512 531210 524114 541611 541612
Other computer related services
Data processing, hosting, and
related services
Computer systems design
services
Offices of real estate agents and brokers
Direct health and medical insurance carriers
Administrative management and general management
consulting services
Human resources consulting services
Total number of businesses with OCC awards
78 14 8 1 2 41 10
Percent of total OCC awards 41.4 14.1 10.5 10.0 4.1 2.7 1.5
MOBs, WOBs, and demographic groups %
Par
ticip
.
% A
war
ded
% P
artic
ip.
% A
war
ded
% P
artic
ip.
% A
war
ded
% P
artic
ip.
% A
war
ded
% P
artic
ip.
% A
war
ded
% P
artic
ip.
% A
war
ded
% P
artic
ip.
% A
war
ded
Minority-owned 38.1 43.9 38.4 0.0 36.4 24.3 31.1 0.0 26.3 0.0 36.8 37.9 42.9 69.9
Women-owned 25.4 17.3 26.5 0.0 24.2 0.0 38.0 0.0 23.2 0.0 34.3 10.5 44.3 82.3
Asian American-owned 14.5 26.5 13.9 0.0 14.3 2.8 3.5 0.0 2.1 0.0 8.6 0.7 9.4 0.0
Black American-owned 16.8 0.8 16.8 0.0 15.6 19.3 21.0 0.0 20.0 0.0 21.6 2.9 27.4 69.9
Hispanic American-owned 5.7 1.8 5.7 0.0 5.5 2.2 6.8 0.0 5.8 0.0 5.7 17.4 5.9 0.0
Native American-owned 3.2 8.4 3.8 0.0 2.8 0.0 1.4 0.0 0.8 0.0 3.3 17.0 2.6 0.0
Other minority-owned 1.2 7.2 1.3 0.0 1.1 0.0 1.5 0.0 1.6 0.0 1.1 0.0 1.4 0.0
Source: FPDS-NG for FY 2016 and SAM Entity Management Extracts for September 2016.
Office of the Comptroller of the Currency 13
Business Activities | 2016 Annual Report to Congress
IMPLEMENTATION OF STANDARDS AND PROCEDURES TO ENSURE FAIR INCLUSION
Beginning on March 1, 2012, the OCC inserted the “Standards and Procedures for OCC Contractor’s Good Faith Efforts to Include Minorities and Women in the Contractor’s Workforce”14 (Good Faith Efforts clause) into all new contracts of more than $150,000. The OMWI reviews contractors’ good faith efforts, makes a determination whether any contractors have failed to make good faith efforts, and takes appropriate action as authorized by section 342.15
Since the OCC began requiring the Good Faith Efforts clause, the OMWI has reviewed 83 contractor submissions of good faith efforts. Of the 83 reviewed, 39 had more than 50 employees and 44 businesses had fewer than 50 employees. The 39 businesses with more than 50 employees submitted copies of their affirmative action plans and other documentation to demonstrate good faith efforts to include minorities and women in their workforces; and the 44 businesses with fewer than 50 employees submitted other documentation to demonstrate good faith efforts. The OMWI reviewed these submissions and, to date, there have been no instances when a recommendation by OMWI for further action has been necessary.
The majority of the OCC’s contractors (44 of the 83 reviewed) were not required to submit Standard Form 100 (EEO-1) reports to the Equal Employment Opportunity Commission (EEOC)16 and were not subject to the Office of Federal Contract Compliance Programs equal employment opportunity (EEO) requirements.17 Contractors that had not previously been required to establish a written plan or program outlining their diversity efforts and results continue to create some challenges for the OMWI to substantiate their good faith efforts. The OMWI
14 In the Good Faith Efforts clause, contractors affirm their commitment, as well as the commitment of their subcontractors, to make good faith efforts to include minorities and women in their workforces.15 The OCC requires a written affirmative action plan or other written program designed to ensure the fair inclusion of minorities and women in the contractor’s workforce, including outreach, recruitment, and training efforts whereby the contractor sets forth specific, results-oriented policies and procedures.16 The EEOC requires EEO-1 reports for all federal contractors (private employers) who are not otherwise exempt and (1) have 50 or more employees and (2) are prime contractors or first-tier subcontractors and have a contract, subcontract, or purchase order amounting to $50,000 or more.17 The Office of Federal Contract Compliance Programs regulations implementing Executive Order 11246 require supply and service contractors—generally those with 50 or more employees and a contract of $50,000 or more—to develop and maintain written affirmative action programs.
responded to these challenges by answering contractors’ questions on the documentation required for the OMWI to assess good faith efforts. Given that over half of the businesses reviewed have fewer than 50 employees and have limited experience substantiating good faith efforts, the OMWI will continue providing technical assistance on contractors’ compliance with the Good Faith Efforts clause and efforts toward the fair inclusion of minorities and women in their workforces.
SUCCESSES AND CHALLENGES IN THE OCC’S SUPPLIER DIVERSITY PROGRAM
Technical Assistance and Outreach Program
EventsDuring fiscal year 2016, the OMWI engaged in numerous outreach activities to provide technical assistance, enhance awareness, and respond to potential contractors concerning procurement opportunities. Specifically, OMWI representatives hosted, led, or were featured speakers at several events to provide technical assistance to MWOBs and to collaborate and share information with the other agencies’ OMWI offices. OMWI representatives also exhibited and held matchmaking sessions at other external events (see appendix E). The events the OCC hosted or co-hosted received overwhelmingly positive feedback from participants.
n OCC Opportunity Exchange, Washington, D.C. March 9, 2016 and July 19, 2016: The OMWI presented a technical training session titled “Opportunity Exchange” that provided information on doing business with the OCC and the federal government, how to look for opportunities, preparing to compete for
Office of Minority and Women Inclusion14
2016 Annual Report to Congress | Business Activities
opportunities, and how the government conducts market research. A total of 37 MWOB representatives attended the events.
n Supplier Diversity Working Group Best Practices Workshop for OMWI Agency Employees, Washington, D.C. April 7, 2016: The OMWI developed and co-hosted with the NCUA a workshop attended by representatives from all eight OMWI agencies (Board, CFPB, Treasury, FDIC, FHFA, NCUA, OCC, and SEC). The topics included how to (1) establish comprehensive MWOB supplier development process; (2) establish tracking, reporting, and goal-setting mechanisms; (3) establish a continuous improvement plan; and (4) consider second-tier programs.
n Webinar September 23, 2016: The OMWI hosted a technical training session titled “What You Don’t Know about Codes and Awards Used by Agencies Can Hurt You!” that provided information on contracting and procurement terminology to facilitate finding viable contracting opportunities and increase the odds of success. Representatives from 88 MWOBs attended.
In addition to hosting and attending supplier diversity technical assistance events, the OMWI wrote an article for the National Association of Women Real Estate Brokers magazine titled “Considering Doing Business with the Federal Government?” (Vol. 5, Issue 3).
ContractsSince its inception, the OCC’s OMWI technical assistance program and outreach efforts have helped the agency award a total of $9,730,765 to MWOBs, of which $5,842,373 was awarded in fiscal year 2016.
18 Examples of federal contracting vehicles include (1) U.S. General Services Administration Information Technology Schedule 70; (2) National Institutes of Health, National Institutes of Health Information Technology Acquisition and Assessment Center CIO-SP3; and (3) National Aeronautics and Space Administration Solutions for Enterprise-Wide Procurement.19 CPSD is a certification for supply management professionals whose responsibilities include supplier diversity and business professionals with responsibility for strategic diversity initiatives within their organizations. An OMWI staff member attended the Institute for Supply Management Diversity Conference on February 10-12, 2016.20 The Alliance of Supplier Diversity Professionals educates and develops supplier diversity advocates, enabling them to serve as competent liaisons between their company, customers, and organizations that advocate for diverse suppliers and the diverse business community. The CSDP certification examination encompasses the following courses: Introduction to Supplier Diversity; Preparing Subcontracting Plans; Preparing for Customer Reviews; Mentor-Protégé Program; Customer Reporting; and Sourcing Strategies.
Plans for Enhancing Opportunities to Contract With and Provide Technical Assistance to MWOBsOn May 8, 2013, the OMWI developed the OCC Database, which continues to be a resource for early market research used by the OMWI, the OCC Acquisitions Division, and other OCC business units, as well as to support the OMWI’s technical assistance efforts. During fiscal year 2015, the OMWI enhanced the OCC Database to include additional reporting information such as whether businesses have been awarded federal contracting vehicles.18 At the end of fiscal year 2016, there were 591 businesses registered in the OCC Database (155 businesses registered during fiscal year 2016, a 35.6 percent increase from the prior year).
During fiscal year 2017, OMWI representatives will speak at events including the Reservation Economic Summit in March, the Enterprising Women of the Year Awards in April, and the 27th Annual Government Procurement Conference in April. The OMWI will also co-host a Cybersecurity Awareness and Preparedness event in April along with the FDIC and the NCUA. These sessions will provide guidance on government contracting and technical assistance to MWOBs.
The OMWI will continue to collaborate with the other agencies’ OMWI offices through the Supplier Diversity Working Group, which shares information and best practices and collaborates to maximize opportunities for technical assistance to MWOBs. The OCC has also recognized the importance of its supplier diversity program by having an OMWI staff member maintain certification as a Certified Professional in Supplier Diversity (CPSD)19 with the Institute for Supply Management and attain certification as a Certified Supplier Diversity Professional (CSDP) with the Alliance of Supplier Diversity Professionals.20
Office of the Comptroller of the Currency 15
2016 Annual Report to Congress
Workforce Diversity and Inclusion in Employment: Recruitment, Hiring, Career Development, and Retention
CURRENT STATUS
Bank supervision is the OCC’s core mission, and the majority of its employees are bank examiners. Bank examination activities are supported by attorneys, economists, and various operational and administrative occupations referred to as “all other series” in this annual report.
As of September 30, 2016, the OCC’s permanent workforce totaled 3,958 employees, a net change of 3.6 percent above the 3,819 permanent employees at the end of fiscal year 2015. Over the last five years, the participation rate of females (45.2 percent) in the OCC’s workforce has remained fairly stable (a 0.7 percentage point decrease). Minority participation increased by 3.7 percentage points to 34.2 percent. At the end of fiscal year 2016, all major EEO groups were at or near parity with the 2010 national civilian labor force (NCLF) rates,21 with the exception of
21 NCLF data are derived from the 2010 census reflecting persons 16 years of age or older who are employed or are actively seeking employment and adjusted for citizenship, excluding those in the Armed Services. The OCC’s workforce demographics benchmark comparisons are made against the 2010 NCLF availability rates and the occupational CLF (OCLF) availability rates for the OCC’s three major occupational groups—bank examiners, attorneys, and economists. See appendix G for more details.
females and Hispanics. For changes in the OCC’s workforce participation rates from fiscal year 2012 to 2016, please see appendix H.
Although the OCC continued to work to address the low participation of Hispanics in its workforce, their overall participation rate remained below their NCLF rate (see table 2). In fiscal year 2016, the OCC slightly increased its Hispanic participation rate to 6.9 percent, from 6.8 percent in fiscal year 2015, and an improvement from 6.3 percent in fiscal year 2012. Hispanic participation rates are below parity in the following occupational positions—economists (females), bank examiners (females), and “all other series” (males). Similarly, females across EEO groups and Asian males in bank examiner positions participated below their OCLF rates. For a further breakdown of ethnicity and race indicator (ERI) groups and gender by occupational positions in the OCC workforce profile, please refer to appendix I. The fiscal year 2016 EEO-1 Report of OCC Occupational Categories is available in appendix J.
In addition, the Treasury Department provided a more realistic benchmark comparison for the OCC’s overall workforce—the relevant civilian labor force (RCLF) rate. This customized RCLF rate is based on the OCC’s occupational composition and total workforce annually. The 2016 RCLF was calculated by comparing the OCLF availability rate from the 2010 census data with the percentage availability rate of each occupation represented in the OCC’s workforce as of September 30, 2016 (see table 3).

Office of Minority and Women Inclusion16
2016 Annual Report to Congress | Workforce Diversity and Inclusion in Employment: Recruitment, Hiring, Career Development, and Retention
Table 2: OCC Workforce Profile as of September 30, 2016
Participation rates of EEO groups are in percentages.
Total Male Female Asian Black HispanicSmall ERI
groups WhiteOCC workforce 3,958 54.8 45.2a 8.4 17.6 6.9a 1.3a 65.8a
2010 NCLF 51.9 48.1 3.9 12.0 10.0 1.8 72.3Bank examiner 2,616 61.3 38.7a 6.4a 12.9 6.5a 1.2 73.02010 bank examiner OCLF 54.7 45.3 7.7 12.3 6.8 0.9 72.4Attorney 177 52.0a 48.0 6.8 5.7 7.9 0.6a 79.1a
2010 attorney OCLF 66.7 33.3 3.6 4.7 4.3 0.9 86.4Economist 92 66.3a 33.7 33.7 3.3a 4.3a 0.0a 58.7a
2010 economist OCLF 67.1 32.9 7.6 5.5 5.1 0.9 81.0
All other series 1,073 38.5a 61.5 11.4 32.4 7.7a 1.9 46.6a
2010 NCLF 51.9 48.1 3.9 12.0 10.0 1.8 72.3
Source: MD-715 workforce data table as of September 30, 2016.a EEO groups participating at rates below the 2010 NCLF and OCLF rates.Note: Small ERI groups are Native Americans, Native Hawaiians, and persons of two or more races combined.
Table 3: OCC Workforce Profile as of September 30, 2016, Compared With RCLF Rates
Participation rates of EEO groups are in percentages.
Total Male Female Asian Black Hispanic Small ERI groups White
OCC workforce 3,958 54.8 45.2a 8.4 17.6 6.9a 1.3 65.8a
2016 RCLF 42.1 57.9 4.7 9.2 7.3 1.3 77.4
Source: MD-715 workforce data table as of September 30, 2016.a EEO groups participating at rates below the 2016 RCLF rates.Note: Small ERI groups are Native Americans, Native Hawaiians, and persons of two or more races combined.
Office of the Comptroller of the Currency 17
Workforce Diversity and Inclusion in Employment: Recruitment, Hiring, Career Development, and Retention | 2016 Annual Report to Congress
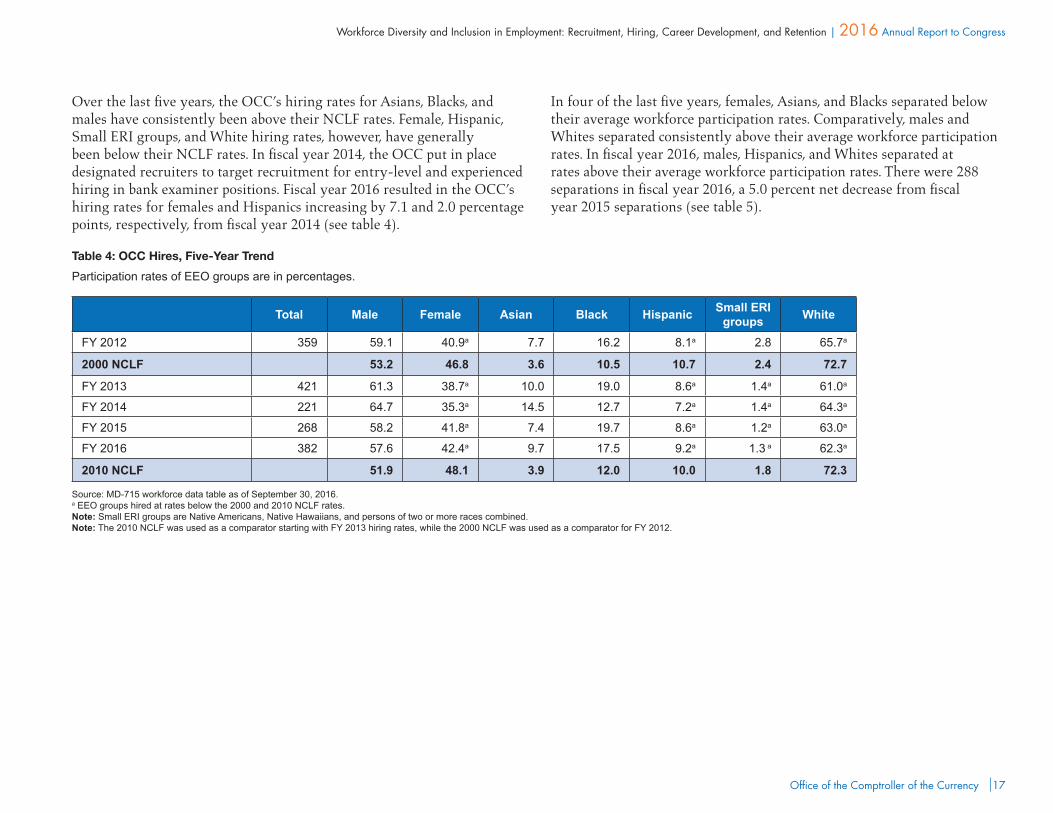
Over the last five years, the OCC’s hiring rates for Asians, Blacks, and males have consistently been above their NCLF rates. Female, Hispanic, Small ERI groups, and White hiring rates, however, have generally been below their NCLF rates. In fiscal year 2014, the OCC put in place designated recruiters to target recruitment for entry-level and experienced hiring in bank examiner positions. Fiscal year 2016 resulted in the OCC’s hiring rates for females and Hispanics increasing by 7.1 and 2.0 percentage points, respectively, from fiscal year 2014 (see table 4).
Table 4: OCC Hires, Five-Year Trend
Participation rates of EEO groups are in percentages.
Total Male Female Asian Black Hispanic Small ERI groups White
FY 2012 359 59.1 40.9a 7.7 16.2 8.1a 2.8 65.7a
2000 NCLF 53.2 46.8 3.6 10.5 10.7 2.4 72.7
FY 2013 421 61.3 38.7a 10.0 19.0 8.6a 1.4a 61.0a
FY 2014 221 64.7 35.3a 14.5 12.7 7.2a 1.4a 64.3a
FY 2015 268 58.2 41.8a 7.4 19.7 8.6a 1.2a 63.0a
FY 2016 382 57.6 42.4a 9.7 17.5 9.2a 1.3 a 62.3a
2010 NCLF 51.9 48.1 3.9 12.0 10.0 1.8 72.3
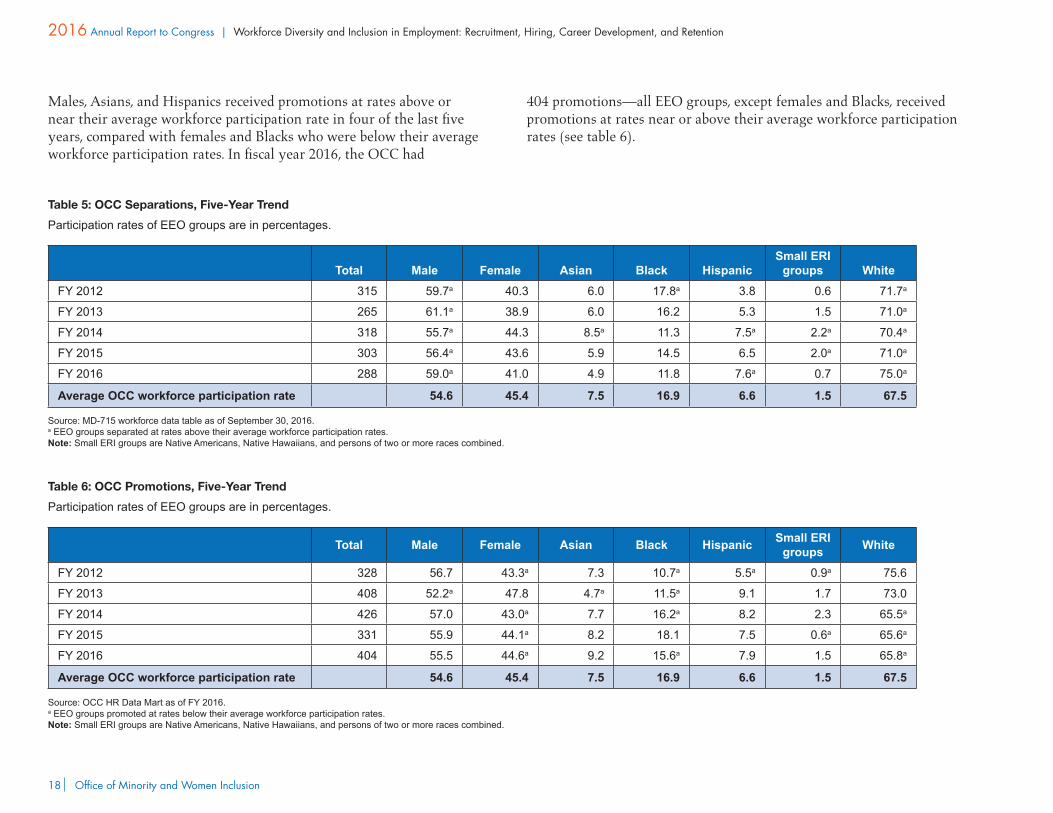
In four of the last five years, females, Asians, and Blacks separated below their average workforce participation rates. Comparatively, males and Whites separated consistently above their average workforce participation rates. In fiscal year 2016, males, Hispanics, and Whites separated at rates above their average workforce participation rates. There were 288 separations in fiscal year 2016, a 5.0 percent net decrease from fiscal year 2015 separations (see table 5).
Source: MD-715 workforce data table as of September 30, 2016.a EEO groups hired at rates below the 2000 and 2010 NCLF rates.Note: Small ERI groups are Native Americans, Native Hawaiians, and persons of two or more races combined.Note: The 2010 NCLF was used as a comparator starting with FY 2013 hiring rates, while the 2000 NCLF was used as a comparator for FY 2012.
Office of Minority and Women Inclusion18
2016 Annual Report to Congress | Workforce Diversity and Inclusion in Employment: Recruitment, Hiring, Career Development, and Retention
Table 5: OCC Separations, Five-Year Trend
Participation rates of EEO groups are in percentages.
Total Male Female Asian Black HispanicSmall ERI
groups WhiteFY 2012 315 59.7a 40.3 6.0 17.8a 3.8 0.6 71.7a
FY 2013 265 61.1a 38.9 6.0 16.2 5.3 1.5 71.0a
FY 2014 318 55.7a 44.3 8.5a 11.3 7.5a 2.2a 70.4a
FY 2015 303 56.4a 43.6 5.9 14.5 6.5 2.0a 71.0a
FY 2016 288 59.0a 41.0 4.9 11.8 7.6a 0.7 75.0a
Average OCC workforce participation rate 54.6 45.4 7.5 16.9 6.6 1.5 67.5
Source: MD-715 workforce data table as of September 30, 2016.a EEO groups separated at rates above their average workforce participation rates.Note: Small ERI groups are Native Americans, Native Hawaiians, and persons of two or more races combined.
Table 6: OCC Promotions, Five-Year Trend
Participation rates of EEO groups are in percentages.
Total Male Female Asian Black Hispanic Small ERI groups White
FY 2012 328 56.7 43.3a 7.3 10.7a 5.5a 0.9a 75.6
FY 2013 408 52.2a 47.8 4.7a 11.5a 9.1 1.7 73.0
FY 2014 426 57.0 43.0a 7.7 16.2a 8.2 2.3 65.5a
FY 2015 331 55.9 44.1a 8.2 18.1 7.5 0.6a 65.6a
FY 2016 404 55.5 44.6a 9.2 15.6a 7.9 1.5 65.8a
Average OCC workforce participation rate 54.6 45.4 7.5 16.9 6.6 1.5 67.5
Source: OCC HR Data Mart as of FY 2016.a EEO groups promoted at rates below their average workforce participation rates.Note: Small ERI groups are Native Americans, Native Hawaiians, and persons of two or more races combined.
Males, Asians, and Hispanics received promotions at rates above or near their average workforce participation rate in four of the last five years, compared with females and Blacks who were below their average workforce participation rates. In fiscal year 2016, the OCC had
404 promotions—all EEO groups, except females and Blacks, received promotions at rates near or above their average workforce participation rates (see table 6).
Office of the Comptroller of the Currency 19
Workforce Diversity and Inclusion in Employment: Recruitment, Hiring, Career Development, and Retention | 2016 Annual Report to Congress
FISCAL YEAR 2016 FOCUS AREAS
Increasing the Participation of HispanicsIn fiscal year 2016, the OCC continued its work to address the low participation rate of Hispanics in its workforce. The OCC slightly increased its Hispanic participation rate to 6.9 percent from 6.8 percent in fiscal year 2015; this rate was a 0.6 percentage point improvement over the fiscal year 2012 rate of 6.3 percent. Even though the agency has made progress in the last five years, the OCC’s Hispanic workforce participation rate (6.9 percent) remains below the NCLF rate of 10.0 percent. When compared with the RCLF rate (7.3 percent), Hispanic participation overall was below parity by 0.4 percentage points in fiscal year 2016 (males, 3.6 percent versus 2.7 percent; and females, 3.2 percent versus 4.5 percent). Hispanics were hired at 9.2 percent in fiscal year 2016, above their hiring rate in fiscal year 2012 and fiscal year 2015 (8.1 percent and 8.6 percent, respectively).
Hispanics were represented well above the OCLF in the attorney occupation (7.9 percent versus 4.3 percent), and at or above parity for Hispanic males in the economist occupation (3.3 percent versus 3.3 percent) and bank examiner occupation (3.8 percent versus 3.1 percent). In fiscal year 2016, Hispanics in all three major occupations were hired at rates greater than their OCLF rates. Hispanic separations were above their workforce participation rate for bank examiners (8.6 percent versus 6.5 percent). No Hispanics separated in attorney and economist occupations. Hispanic males, however, separated at a higher rate than their participation rate in the OCC’s workforce, 4.9 percent versus 3.6 percent.
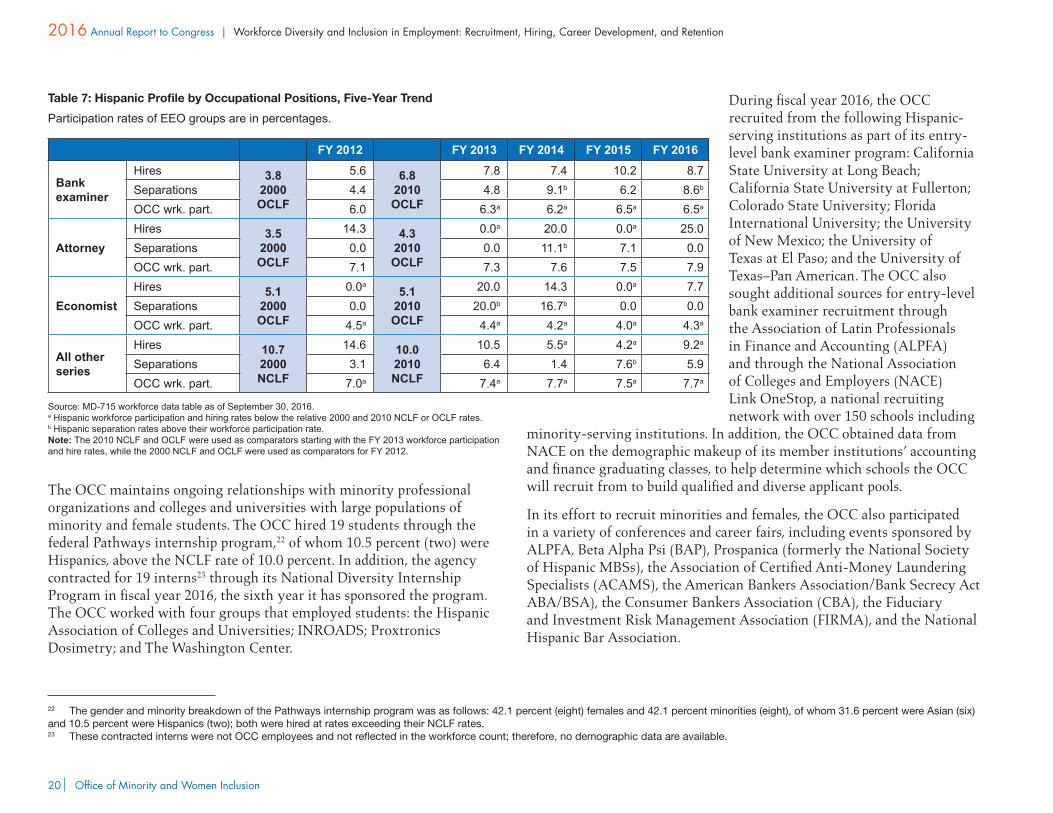
The low workforce participation rate of Hispanics is largely influenced by low participation in the OCC’s non-major occupational groups, all other occupational job series (7.7 percent versus 10.0 percent NCLF rate). Although significantly below parity, Hispanic participation in the non-
major occupational groups increased slightly from the fiscal year 2015 rate of 7.5 percent. Ten Hispanics (9.3 percent) were hired in the non-major occupational groups in fiscal year 2016, slightly below the 10.0 percent NCLF rate, but an increase from the fiscal year 2015 hiring rate of 4.9 percent. Hispanics in the non-major occupational groups separated at 5.9 percent, below the workforce participation rate of 7.7 percent in fiscal year 2016 and the fiscal year 2015 separation rate of 7.6 percent. For a gender breakdown of the OCC’s Hispanic profile, see appendixes K and L.
The Entry-Level Bank Examiner Recruitment Program continued to be a significant source for Hispanic hiring at the OCC. In fiscal year 2016, 10.3 percent (18) of entry-level bank examiners self-identified as Hispanics.
The OCC conducted an applicant flow data analysis by gender, ethnicity (Hispanic and non-Hispanic), and a combination of gender and ethnicity of all its vacancy announcements closed in the first three quarters of fiscal year 2016. The applicant pool for Hispanics was 11.7 percent with a hiring rate of 9.3 percent; both applicant pool and hiring rates were near or above the NCLF rate of 10.0 percent and the RCLF rate of 7.3 percent. In addition, the OCC conducted a separate applicant flow data analysis by gender and ethnicity of the entry-level bank examiner recruitment campaigns in 2016. The applicant pool for Hispanics on average was 15.1 percent, with a hiring rate of 10.3 percent; both applicant pool and hiring rates exceeded the Hispanic OCLF rate of 6.8 percent. The analyses disclosed no evidence of a statistically significant shift in the gender and ethnic composition of the applicant pool as it progressed through the decision process. The OCC concluded that decision points along the hiring process do not pose barriers to the hiring of Hispanics. The results were consistent with those from 2013 through 2015 for all vacancies and the entry-level bank examiner recruitment process. Efforts are under way to establish regular monitoring and analyses of applicant flow data.
Office of Minority and Women Inclusion20
2016 Annual Report to Congress | Workforce Diversity and Inclusion in Employment: Recruitment, Hiring, Career Development, and Retention
Table 7: Hispanic Profile by Occupational Positions, Five-Year Trend
Participation rates of EEO groups are in percentages.
FY 2012 FY 2013 FY 2014 FY 2015 FY 2016
Bank examiner
Hires 3.8 2000 OCLF
5.6 6.8 2010 OCLF
7.8 7.4 10.2 8.7Separations 4.4 4.8 9.1b 6.2 8.6b
OCC wrk. part. 6.0 6.3a 6.2a 6.5a 6.5a
AttorneyHires 3.5
2000 OCLF
14.3 4.3 2010 OCLF
0.0a 20.0 0.0a 25.0Separations 0.0 0.0 11.1b 7.1 0.0OCC wrk. part. 7.1 7.3 7.6 7.5 7.9
EconomistHires 5.1
2000 OCLF
0.0a5.1
2010 OCLF
20.0 14.3 0.0a 7.7Separations 0.0 20.0b 16.7b 0.0 0.0OCC wrk. part. 4.5a 4.4a 4.2a 4.0a 4.3a
All other series
Hires 10.7 2000 NCLF
14.6 10.0 2010 NCLF
10.5 5.5a 4.2a 9.2a
Separations 3.1 6.4 1.4 7.6b 5.9OCC wrk. part. 7.0a 7.4a 7.7a 7.5a 7.7a
Source: MD-715 workforce data table as of September 30, 2016. a Hispanic workforce participation and hiring rates below the relative 2000 and 2010 NCLF or OCLF rates. b Hispanic separation rates above their workforce participation rate. Note: The 2010 NCLF and OCLF were used as comparators starting with the FY 2013 workforce participation and hire rates, while the 2000 NCLF and OCLF were used as comparators for FY 2012.
The OCC maintains ongoing relationships with minority professional organizations and colleges and universities with large populations of minority and female students. The OCC hired 19 students through the federal Pathways internship program,22 of whom 10.5 percent (two) were Hispanics, above the NCLF rate of 10.0 percent. In addition, the agency contracted for 19 interns23 through its National Diversity Internship Program in fiscal year 2016, the sixth year it has sponsored the program. The OCC worked with four groups that employed students: the Hispanic Association of Colleges and Universities; INROADS; Proxtronics Dosimetry; and The Washington Center.
22 The gender and minority breakdown of the Pathways internship program was as follows: 42.1 percent (eight) females and 42.1 percent minorities (eight), of whom 31.6 percent were Asian (six) and 10.5 percent were Hispanics (two); both were hired at rates exceeding their NCLF rates.23 These contracted interns were not OCC employees and not reflected in the workforce count; therefore, no demographic data are available.
During fiscal year 2016, the OCC recruited from the following Hispanic-serving institutions as part of its entry-level bank examiner program: California State University at Long Beach; California State University at Fullerton; Colorado State University; Florida International University; the University of New Mexico; the University of Texas at El Paso; and the University of Texas–Pan American. The OCC also sought additional sources for entry-level bank examiner recruitment through the Association of Latin Professionals in Finance and Accounting (ALPFA) and through the National Association of Colleges and Employers (NACE) Link OneStop, a national recruiting network with over 150 schools including
minority-serving institutions. In addition, the OCC obtained data from NACE on the demographic makeup of its member institutions’ accounting and finance graduating classes, to help determine which schools the OCC will recruit from to build qualified and diverse applicant pools.
In its effort to recruit minorities and females, the OCC also participated in a variety of conferences and career fairs, including events sponsored by ALPFA, Beta Alpha Psi (BAP), Prospanica (formerly the National Society of Hispanic MBSs), the Association of Certified Anti-Money Laundering Specialists (ACAMS), the American Bankers Association/Bank Secrecy Act ABA/BSA), the Consumer Bankers Association (CBA), the Fiduciary and Investment Risk Management Association (FIRMA), and the National Hispanic Bar Association.
Office of the Comptroller of the Currency 21
Workforce Diversity and Inclusion in Employment: Recruitment, Hiring, Career Development, and Retention | 2016 Annual Report to Congress
As part of its entry-level bank examiner program, the OCC also recruited at minority-serving institutions: five institutions serving Asian Americans and Native American Pacific Islanders (California State University, Fullerton; California State University, Long Beach; St. John’s University; University of Illinois, Chicago; and University of Southern California); three institutions serving American Indian and Alaska Natives (Arizona State University; University of Montana, Missoula; and University of Washington); and one institution in the historically black college and university category (Howard University). The OCC also received applications from individuals at other minority-serving institutions that were not part of the OCC’s entry-level bank examiner program (unsolicited applications). These applicants helped to create more diverse applicant pools.
Members of the OCC’s Hispanic staff (8.6 percent) participated in several formal and informal career development programs and training courses that provided learning and continuous growth opportunities in fiscal year 2016. Hispanic employees (8.3 percent) participated in agency-sponsored leadership training courses designed for managers, supervisors, and employees. Hispanic executive employees (1.6 percent) also participated in the agency’s executive coaching program, which is designed to address both immediate tactical issues and strategic long-term issues or opportunities, and to coach leaders to align vision, actions, and performance.
Each year, the OCC sponsors a career forum for precommissioned bank examiners at the end of their third year of employment. The forum provides information about bank examiner career opportunities and explains the Uniform Commission Examination (UCE) preparatory process. Of the 59 bank examiners who successfully passed the UCE, 6.8 percent (four) were Hispanic, slightly above their participation rate in the bank examiner workforce (6.5 percent).
The OCC continued to encourage its bank examiners to complete the cross-credential examination implemented in fiscal year 2012. The process provides an avenue for National Bank Examiners (NBE) to earn the certification of a Federal Thrift Regulator (FTR) to lead the examinations of federal savings associations and, likewise, for FTRs to earn the
certification necessary to serve as examiners-in-charge of national bank examinations. In fiscal year 2016, 54 bank examiners passed the cross-credential examination, of whom 5.6 percent (three) were Hispanic, lower than their participation rate in the bank examiner workforce (6.5 percent).
In fiscal year 2016, the OCC continued to benefit from the many contributions of its Hispanic employee network group (ENG), the Hispanic Organization for Leadership and Advancement (HOLA). HOLA supports the agency in its recruitment, career advancement, and retention strategies for developing a fully engaged Hispanic workforce. In fiscal year 2016, HOLA, in partnership with other ENGs, hosted three national leadership teleconferences that provided briefings on the OCC’s leadership initiative, as part of the groups’ career advancement and retention programs. In fiscal year 2016, HOLA established a Human Capital Committee and enlisted its members to participate in the OCC’s efforts to recruit, retain, and advance a diverse workforce. The committee will present a formal action plan to senior management in fiscal year 2017. HOLA officers have met with the Chief Executive Officer and Senior Vice President of the ALPFA to discuss expanding recruitment strategies. HOLA members served as recruiters/screeners and interview panelists during the entry-level bank examiner and attorney recruitment campaigns and participated in the recruitment and screening process for experienced/industry hires. HOLA members also represented the agency at career forums and fairs and networking events. To support retention, HOLA launched the Discipline Champions Cadre to encourage networking, mentoring, and collaboration among its members. In addition, HOLA published its first newsletter to facilitate the exchange of career information and advice among its members.
Hispanic employees gain value from the agency’s formal and informal mentoring programs, career and leadership development programs (for examiners and non-examiners), career development opportunities, and related resources, including training curriculum and courses.
In fiscal year 2017, the OCC will continue to focus efforts toward increasing the participation rate of Hispanics, with special emphasis on retention activities. The low participation rate of Hispanics generally in the OCC and in two of its mission-critical occupational groups (bank examiners and economists), combined with a historically high separation
Office of Minority and Women Inclusion22
2016 Annual Report to Congress | Workforce Diversity and Inclusion in Employment: Recruitment, Hiring, Career Development, and Retention
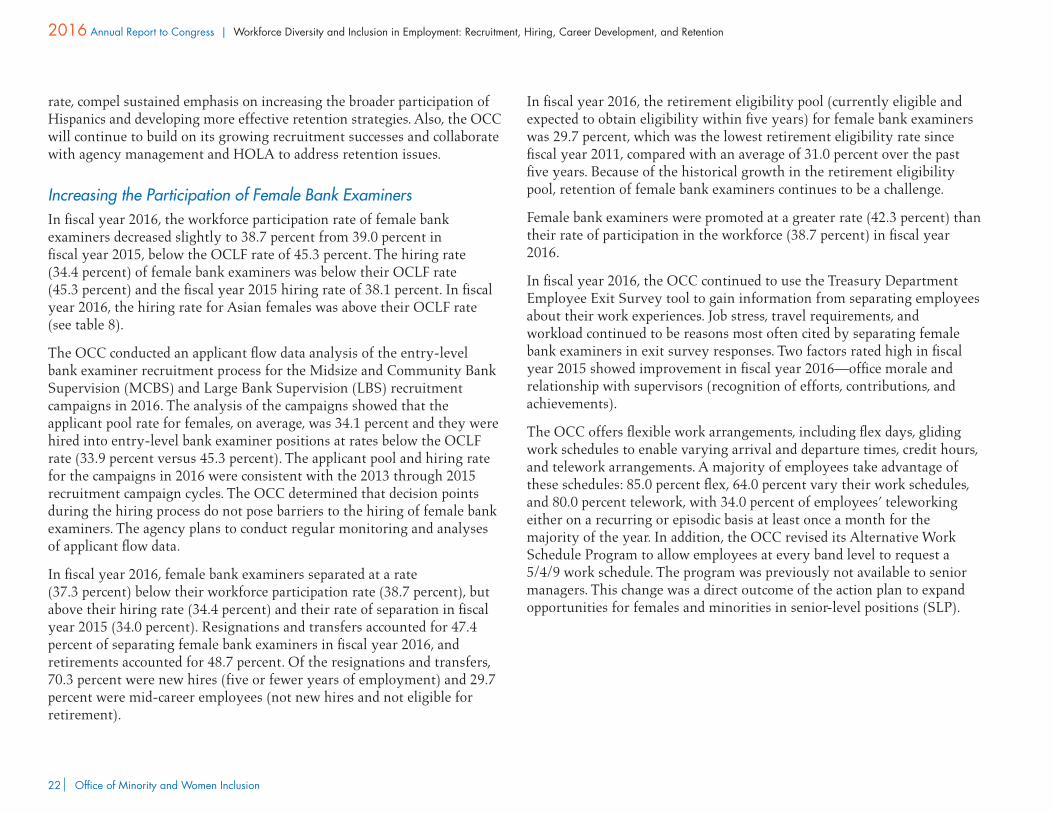
rate, compel sustained emphasis on increasing the broader participation of Hispanics and developing more effective retention strategies. Also, the OCC will continue to build on its growing recruitment successes and collaborate with agency management and HOLA to address retention issues.
Increasing the Participation of Female Bank ExaminersIn fiscal year 2016, the workforce participation rate of female bank examiners decreased slightly to 38.7 percent from 39.0 percent in fiscal year 2015, below the OCLF rate of 45.3 percent. The hiring rate (34.4 percent) of female bank examiners was below their OCLF rate (45.3 percent) and the fiscal year 2015 hiring rate of 38.1 percent. In fiscal year 2016, the hiring rate for Asian females was above their OCLF rate (see table 8).
The OCC conducted an applicant flow data analysis of the entry-level bank examiner recruitment process for the Midsize and Community Bank Supervision (MCBS) and Large Bank Supervision (LBS) recruitment campaigns in 2016. The analysis of the campaigns showed that the applicant pool rate for females, on average, was 34.1 percent and they were hired into entry-level bank examiner positions at rates below the OCLF rate (33.9 percent versus 45.3 percent). The applicant pool and hiring rate for the campaigns in 2016 were consistent with the 2013 through 2015 recruitment campaign cycles. The OCC determined that decision points during the hiring process do not pose barriers to the hiring of female bank examiners. The agency plans to conduct regular monitoring and analyses of applicant flow data.
In fiscal year 2016, female bank examiners separated at a rate (37.3 percent) below their workforce participation rate (38.7 percent), but above their hiring rate (34.4 percent) and their rate of separation in fiscal year 2015 (34.0 percent). Resignations and transfers accounted for 47.4 percent of separating female bank examiners in fiscal year 2016, and retirements accounted for 48.7 percent. Of the resignations and transfers, 70.3 percent were new hires (five or fewer years of employment) and 29.7 percent were mid-career employees (not new hires and not eligible for retirement).
In fiscal year 2016, the retirement eligibility pool (currently eligible and expected to obtain eligibility within five years) for female bank examiners was 29.7 percent, which was the lowest retirement eligibility rate since fiscal year 2011, compared with an average of 31.0 percent over the past five years. Because of the historical growth in the retirement eligibility pool, retention of female bank examiners continues to be a challenge.
Female bank examiners were promoted at a greater rate (42.3 percent) than their rate of participation in the workforce (38.7 percent) in fiscal year 2016.
In fiscal year 2016, the OCC continued to use the Treasury Department Employee Exit Survey tool to gain information from separating employees about their work experiences. Job stress, travel requirements, and workload continued to be reasons most often cited by separating female bank examiners in exit survey responses. Two factors rated high in fiscal year 2015 showed improvement in fiscal year 2016—office morale and relationship with supervisors (recognition of efforts, contributions, and achievements).
The OCC offers flexible work arrangements, including flex days, gliding work schedules to enable varying arrival and departure times, credit hours, and telework arrangements. A majority of employees take advantage of these schedules: 85.0 percent flex, 64.0 percent vary their work schedules, and 80.0 percent telework, with 34.0 percent of employees’ teleworking either on a recurring or episodic basis at least once a month for the majority of the year. In addition, the OCC revised its Alternative Work Schedule Program to allow employees at every band level to request a 5/4/9 work schedule. The program was previously not available to senior managers. This change was a direct outcome of the action plan to expand opportunities for females and minorities in senior-level positions (SLP).

Office of the Comptroller of the Currency 23
Workforce Diversity and Inclusion in Employment: Recruitment, Hiring, Career Development, and Retention | 2016 Annual Report to Congress
Table 8: Female Bank Examiner Profile by EEO Groups, Five-Year Trend
Participation rates of EEO groups are in percentages.
FY 2012 FY 2013 FY 2014 FY 2015 FY 2016
FemaleHires 42.4
2000 OCLF
36.0a45.3 2010 OCLF
35.1a 32.4a 38.1a 34.4a
Separations 31.9 35.1 40.5b 34.0 37.3
OCC wrk. part. 38.8a 39.2a 38.5a 39.0a 38.7a
Asian female
Hires 2.8 2000 OCLF
2.4a4.0
2010 OCLF
3.2a 0.0a 2.5a 4.7
Separations 2.9b 0.5b 3.5b 3.1b 2.4
OCC wrk. part. 2.6a 2.9a 2.7a 2.6a 2.8a
Black female
Hires 6.9 2000 OCLF
6.8a8.7
2010 OCLF
7.8a 9.6 7.1a 6.7a
Separations 5.9 5.8 5.2 7.2b 5.7
OCC wrk. part. 6.0a 6.3a 6.6a 6.7a 6.8a
Hispanic female
Hires 1.6 2000 OCLF
2.4 3.7 2010 OCLF
2.1a 2.2a 4.6 3.2a
Separations 2.0 2.7b 3.0b 1.0 2.9b
OCC wrk. part. 2.5 2.5a 2.4a 2.7a 2.7a
Native American female
Hires 0.2 2000 OCLF
0.0a0.3
2010 OCLF
0.0a 0.0a 0.5 0.0a
Separations 0.0 0.5 0.4 0.0 0.5b
OCC wrk. part. 0.4 0.5 0.4 0.5 0.4
White female
Hires 30.3 2000 OCLF
23.2a28.3 2010 OCLF
21.6a 20.6a 23.3a 19.8a
Separations 21.1 25.0 28.0b 22.2 25.8
OCC wrk. part. 26.9a 26.7a 26.2a 26.3a 25.8a
Source: MD-715 workforce data table as of September 30, 2016.a Female bank examiner workforce participation and hiring rates below the 2000 and 2010 bank examiner OCLF rates.b Female bank examiner separation rates above their workforce participation rates.Note: The 2010 NCLF and OCLF were used as comparators starting with the FY 2013 workforce participation and hire rates, while the 2000 NCLF and OCLF were used as comparators for FY 2012.
Office of Minority and Women Inclusion24
2016 Annual Report to Congress | Workforce Diversity and Inclusion in Employment: Recruitment, Hiring, Career Development, and Retention
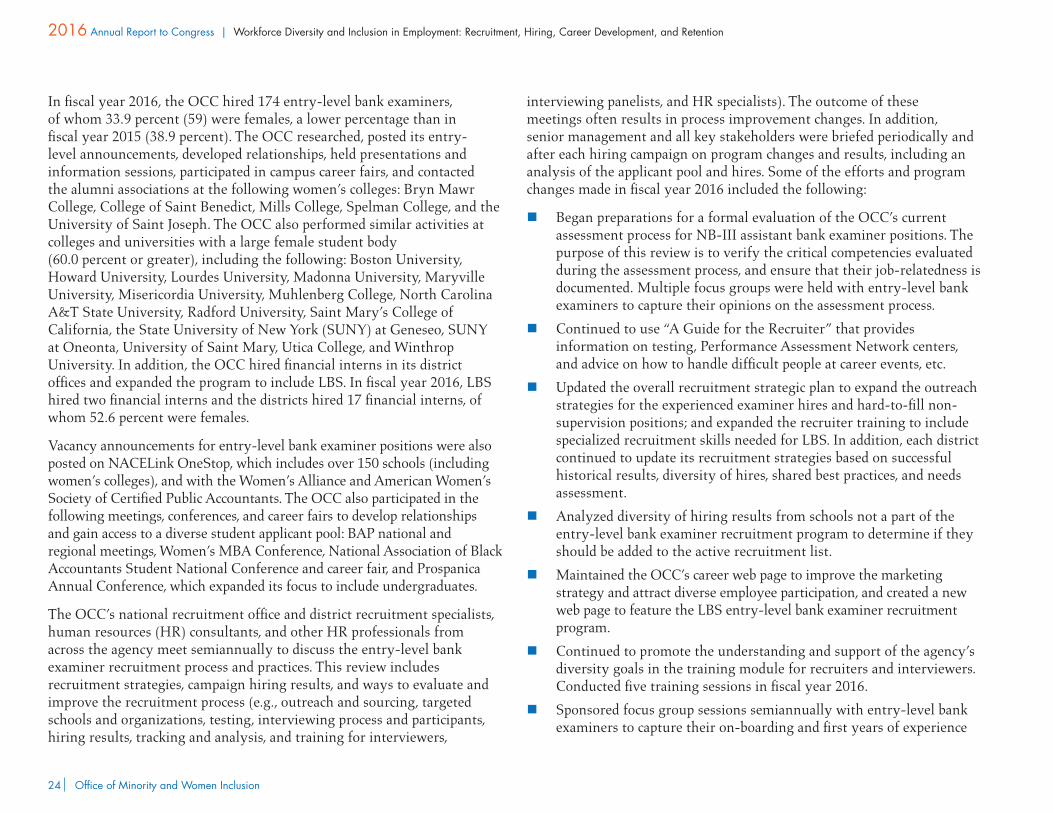
In fiscal year 2016, the OCC hired 174 entry-level bank examiners, of whom 33.9 percent (59) were females, a lower percentage than in fiscal year 2015 (38.9 percent). The OCC researched, posted its entry-level announcements, developed relationships, held presentations and information sessions, participated in campus career fairs, and contacted the alumni associations at the following women’s colleges: Bryn Mawr College, College of Saint Benedict, Mills College, Spelman College, and the University of Saint Joseph. The OCC also performed similar activities at colleges and universities with a large female student body (60.0 percent or greater), including the following: Boston University, Howard University, Lourdes University, Madonna University, Maryville University, Misericordia University, Muhlenberg College, North Carolina A&T State University, Radford University, Saint Mary’s College of California, the State University of New York (SUNY) at Geneseo, SUNY at Oneonta, University of Saint Mary, Utica College, and Winthrop University. In addition, the OCC hired financial interns in its district offices and expanded the program to include LBS. In fiscal year 2016, LBS hired two financial interns and the districts hired 17 financial interns, of whom 52.6 percent were females.
Vacancy announcements for entry-level bank examiner positions were also posted on NACELink OneStop, which includes over 150 schools (including women’s colleges), and with the Women’s Alliance and American Women’s Society of Certified Public Accountants. The OCC also participated in the following meetings, conferences, and career fairs to develop relationships and gain access to a diverse student applicant pool: BAP national and regional meetings, Women’s MBA Conference, National Association of Black Accountants Student National Conference and career fair, and Prospanica Annual Conference, which expanded its focus to include undergraduates.
The OCC’s national recruitment office and district recruitment specialists, human resources (HR) consultants, and other HR professionals from across the agency meet semiannually to discuss the entry-level bank examiner recruitment process and practices. This review includes recruitment strategies, campaign hiring results, and ways to evaluate and improve the recruitment process (e.g., outreach and sourcing, targeted schools and organizations, testing, interviewing process and participants, hiring results, tracking and analysis, and training for interviewers,
interviewing panelists, and HR specialists). The outcome of these meetings often results in process improvement changes. In addition, senior management and all key stakeholders were briefed periodically and after each hiring campaign on program changes and results, including an analysis of the applicant pool and hires. Some of the efforts and program changes made in fiscal year 2016 included the following:
n Began preparations for a formal evaluation of the OCC’s current assessment process for NB-III assistant bank examiner positions. The purpose of this review is to verify the critical competencies evaluated during the assessment process, and ensure that their job-relatedness is documented. Multiple focus groups were held with entry-level bank examiners to capture their opinions on the assessment process.
n Continued to use “A Guide for the Recruiter” that provides information on testing, Performance Assessment Network centers, and advice on how to handle difficult people at career events, etc.
n Updated the overall recruitment strategic plan to expand the outreach strategies for the experienced examiner hires and hard-to-fill non-supervision positions; and expanded the recruiter training to include specialized recruitment skills needed for LBS. In addition, each district continued to update its recruitment strategies based on successful historical results, diversity of hires, shared best practices, and needs assessment.
n Analyzed diversity of hiring results from schools not a part of the entry-level bank examiner recruitment program to determine if they should be added to the active recruitment list.
n Maintained the OCC’s career web page to improve the marketing strategy and attract diverse employee participation, and created a new web page to feature the LBS entry-level bank examiner recruitment program.
n Continued to promote the understanding and support of the agency’s diversity goals in the training module for recruiters and interviewers. Conducted five training sessions in fiscal year 2016.
n Sponsored focus group sessions semiannually with entry-level bank examiners to capture their on-boarding and first years of experience
Office of the Comptroller of the Currency 25
Workforce Diversity and Inclusion in Employment: Recruitment, Hiring, Career Development, and Retention | 2016 Annual Report to Congress
on the job. In fiscal year 2016, seven sessions were conducted, and five are planned for fiscal year 2017.
Process improvement efforts will continue at the national and district/field levels in fiscal year 2017.
In addition to the entry-level recruitment efforts, the OCC continued its efforts to expand sourcing pools for experienced female bank examiners. All of the agency’s district and Headquarters recruitment specialists participate in the following specialty conferences: ACAMS Conference, ABA/BSA Conference, CBA Conference, and the FIRMA Conference. The recruitment specialists sponsored a booth and distributed recruitment materials on experienced specialty examiner jobs. They also sent out marketing e-mails with vacancy announcements to potential job candidates following the conference to solicit their application for employment. In addition, the OCC placed a full-page ad in the Fall 2016 issue of Professional Woman’s Magazine.
The OMWI works collaboratively with management officials in the agency’s Human Capital (HC) and bank supervision departments to identify barriers that may impede the realization of parity for female bank examiners across all EEO groups. OCC management briefings highlighted departmental workforce trends and areas requiring special attention, including targeted recruitment, retention strategies, and succession planning.
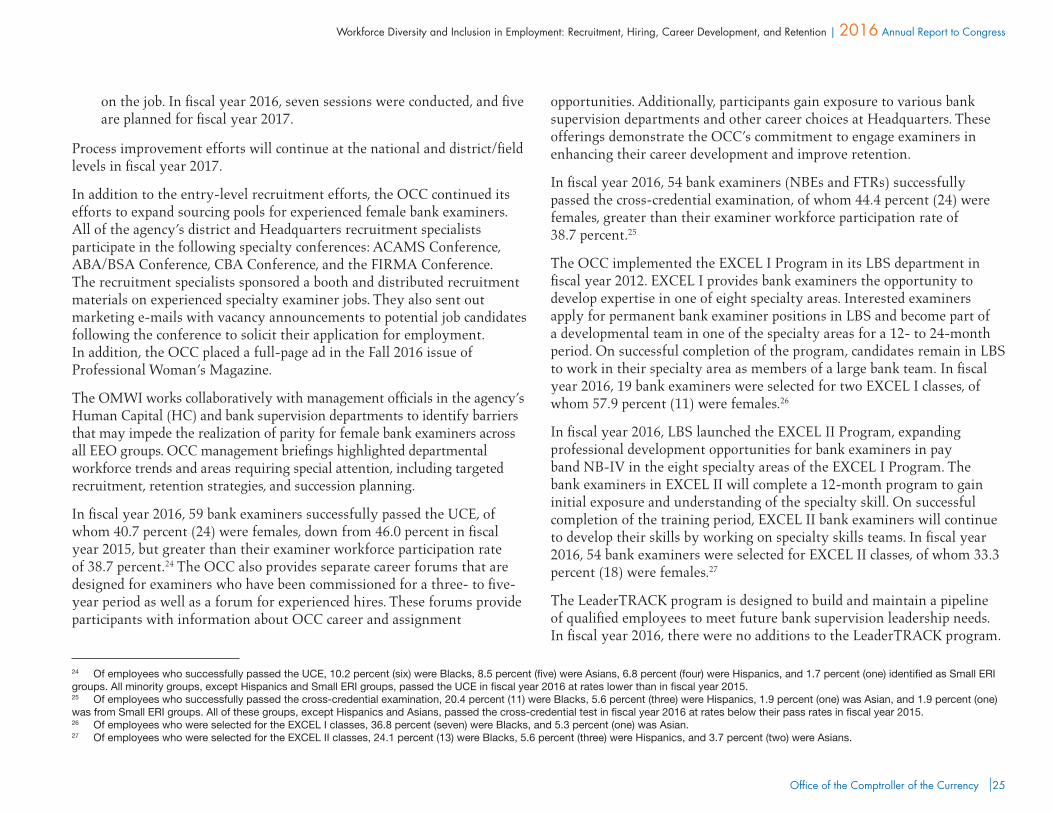
In fiscal year 2016, 59 bank examiners successfully passed the UCE, of whom 40.7 percent (24) were females, down from 46.0 percent in fiscal year 2015, but greater than their examiner workforce participation rate of 38.7 percent.24 The OCC also provides separate career forums that are designed for examiners who have been commissioned for a three- to five-year period as well as a forum for experienced hires. These forums provide participants with information about OCC career and assignment
24 Of employees who successfully passed the UCE, 10.2 percent (six) were Blacks, 8.5 percent (five) were Asians, 6.8 percent (four) were Hispanics, and 1.7 percent (one) identified as Small ERI groups. All minority groups, except Hispanics and Small ERI groups, passed the UCE in fiscal year 2016 at rates lower than in fiscal year 2015.25 Of employees who successfully passed the cross-credential examination, 20.4 percent (11) were Blacks, 5.6 percent (three) were Hispanics, 1.9 percent (one) was Asian, and 1.9 percent (one) was from Small ERI groups. All of these groups, except Hispanics and Asians, passed the cross-credential test in fiscal year 2016 at rates below their pass rates in fiscal year 2015.26 Of employees who were selected for the EXCEL I classes, 36.8 percent (seven) were Blacks, and 5.3 percent (one) was Asian.27 Of employees who were selected for the EXCEL II classes, 24.1 percent (13) were Blacks, 5.6 percent (three) were Hispanics, and 3.7 percent (two) were Asians.
opportunities. Additionally, participants gain exposure to various bank supervision departments and other career choices at Headquarters. These offerings demonstrate the OCC’s commitment to engage examiners in enhancing their career development and improve retention.
In fiscal year 2016, 54 bank examiners (NBEs and FTRs) successfully passed the cross-credential examination, of whom 44.4 percent (24) were females, greater than their examiner workforce participation rate of 38.7 percent.25
The OCC implemented the EXCEL I Program in its LBS department in fiscal year 2012. EXCEL I provides bank examiners the opportunity to develop expertise in one of eight specialty areas. Interested examiners apply for permanent bank examiner positions in LBS and become part of a developmental team in one of the specialty areas for a 12- to 24-month period. On successful completion of the program, candidates remain in LBS to work in their specialty area as members of a large bank team. In fiscal year 2016, 19 bank examiners were selected for two EXCEL I classes, of whom 57.9 percent (11) were females.26
In fiscal year 2016, LBS launched the EXCEL II Program, expanding professional development opportunities for bank examiners in pay band NB-IV in the eight specialty areas of the EXCEL I Program. The bank examiners in EXCEL II will complete a 12-month program to gain initial exposure and understanding of the specialty skill. On successful completion of the training period, EXCEL II bank examiners will continue to develop their skills by working on specialty skills teams. In fiscal year 2016, 54 bank examiners were selected for EXCEL II classes, of whom 33.3 percent (18) were females.27
The LeaderTRACK program is designed to build and maintain a pipeline of qualified employees to meet future bank supervision leadership needs. In fiscal year 2016, there were no additions to the LeaderTRACK program.
Office of Minority and Women Inclusion26
2016 Annual Report to Congress | Workforce Diversity and Inclusion in Employment: Recruitment, Hiring, Career Development, and Retention
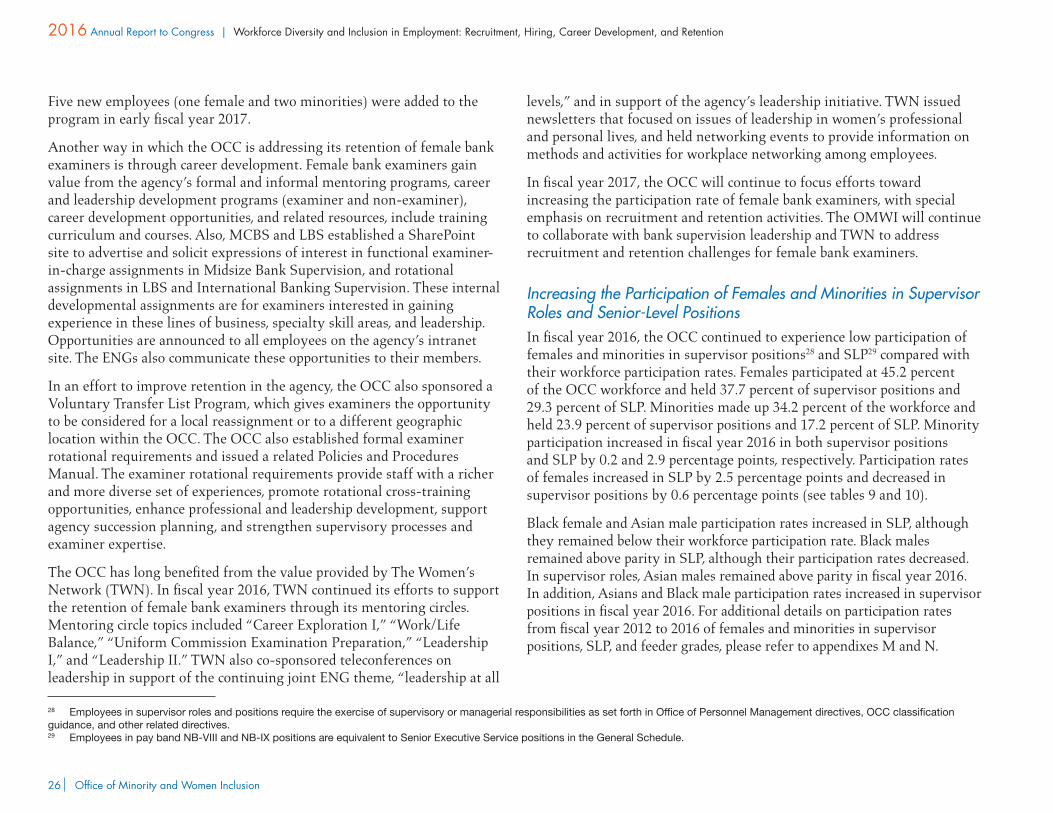
Five new employees (one female and two minorities) were added to the program in early fiscal year 2017.
Another way in which the OCC is addressing its retention of female bank examiners is through career development. Female bank examiners gain value from the agency’s formal and informal mentoring programs, career and leadership development programs (examiner and non-examiner), career development opportunities, and related resources, include training curriculum and courses. Also, MCBS and LBS established a SharePoint site to advertise and solicit expressions of interest in functional examiner-in-charge assignments in Midsize Bank Supervision, and rotational assignments in LBS and International Banking Supervision. These internal developmental assignments are for examiners interested in gaining experience in these lines of business, specialty skill areas, and leadership. Opportunities are announced to all employees on the agency’s intranet site. The ENGs also communicate these opportunities to their members.
In an effort to improve retention in the agency, the OCC also sponsored a Voluntary Transfer List Program, which gives examiners the opportunity to be considered for a local reassignment or to a different geographic location within the OCC. The OCC also established formal examiner rotational requirements and issued a related Policies and Procedures Manual. The examiner rotational requirements provide staff with a richer and more diverse set of experiences, promote rotational cross-training opportunities, enhance professional and leadership development, support agency succession planning, and strengthen supervisory processes and examiner expertise.
The OCC has long benefited from the value provided by The Women’s Network (TWN). In fiscal year 2016, TWN continued its efforts to support the retention of female bank examiners through its mentoring circles. Mentoring circle topics included “Career Exploration I,” “Work/Life Balance,” “Uniform Commission Examination Preparation,” “Leadership I,” and “Leadership II.” TWN also co-sponsored teleconferences on leadership in support of the continuing joint ENG theme, “leadership at all
28 Employees in supervisor roles and positions require the exercise of supervisory or managerial responsibilities as set forth in Office of Personnel Management directives, OCC classification guidance, and other related directives. 29 Employees in pay band NB-VIII and NB-IX positions are equivalent to Senior Executive Service positions in the General Schedule.
levels,” and in support of the agency’s leadership initiative. TWN issued newsletters that focused on issues of leadership in women’s professional and personal lives, and held networking events to provide information on methods and activities for workplace networking among employees.
In fiscal year 2017, the OCC will continue to focus efforts toward increasing the participation rate of female bank examiners, with special emphasis on recruitment and retention activities. The OMWI will continue to collaborate with bank supervision leadership and TWN to address recruitment and retention challenges for female bank examiners.
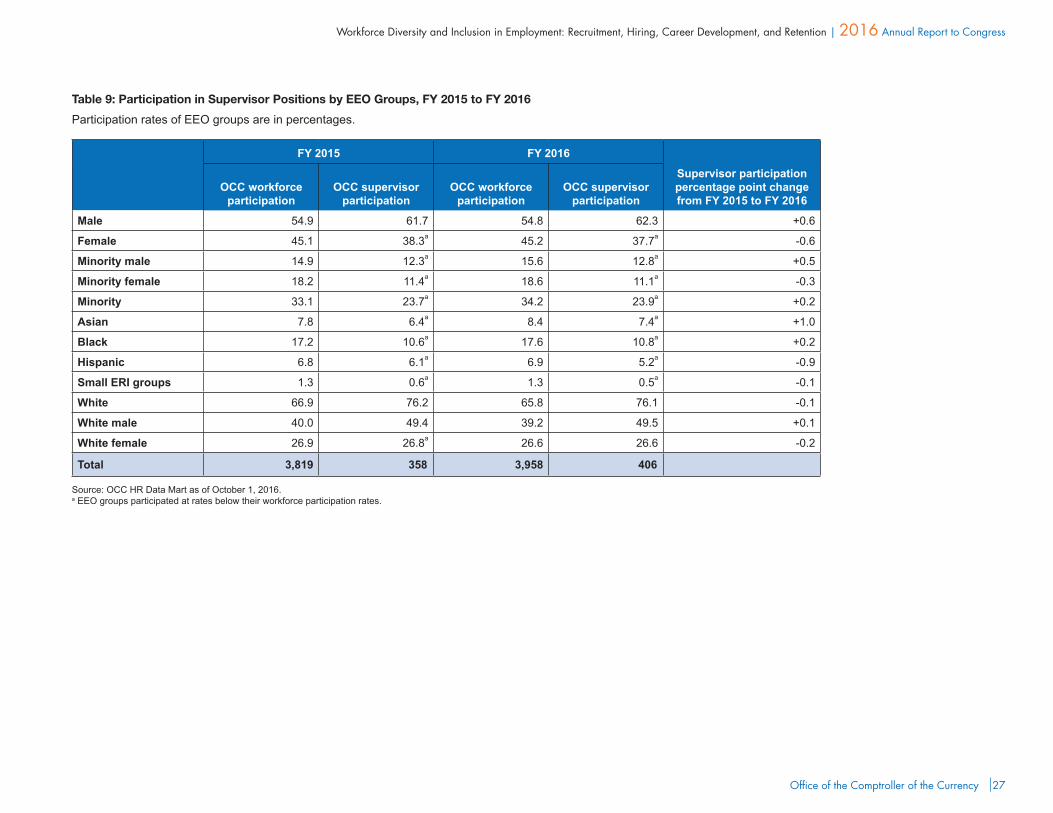
Increasing the Participation of Females and Minorities in Supervisor Roles and Senior-Level Positions In fiscal year 2016, the OCC continued to experience low participation of females and minorities in supervisor positions28 and SLP29 compared with their workforce participation rates. Females participated at 45.2 percent of the OCC workforce and held 37.7 percent of supervisor positions and 29.3 percent of SLP. Minorities made up 34.2 percent of the workforce and held 23.9 percent of supervisor positions and 17.2 percent of SLP. Minority participation increased in fiscal year 2016 in both supervisor positions and SLP by 0.2 and 2.9 percentage points, respectively. Participation rates of females increased in SLP by 2.5 percentage points and decreased in supervisor positions by 0.6 percentage points (see tables 9 and 10).
Black female and Asian male participation rates increased in SLP, although they remained below their workforce participation rate. Black males remained above parity in SLP, although their participation rates decreased. In supervisor roles, Asian males remained above parity in fiscal year 2016. In addition, Asians and Black male participation rates increased in supervisor positions in fiscal year 2016. For additional details on participation rates from fiscal year 2012 to 2016 of females and minorities in supervisor positions, SLP, and feeder grades, please refer to appendixes M and N.
Office of the Comptroller of the Currency 27
Workforce Diversity and Inclusion in Employment: Recruitment, Hiring, Career Development, and Retention | 2016 Annual Report to Congress
Table 9: Participation in Supervisor Positions by EEO Groups, FY 2015 to FY 2016
Participation rates of EEO groups are in percentages.
FY 2015 FY 2016
OCC workforce participation
OCC supervisor participation
OCC workforce participation
OCC supervisor participation
Supervisor participation percentage point change from FY 2015 to FY 2016
Male 54.9 61.7 54.8 62.3 +0.6
Female 45.1 38.3a 45.2 37.7a -0.6
Minority male 14.9 12.3a 15.6 12.8a +0.5
Minority female 18.2 11.4a 18.6 11.1a -0.3
Minority 33.1 23.7a 34.2 23.9a +0.2
Asian 7.8 6.4a 8.4 7.4a +1.0
Black 17.2 10.6a 17.6 10.8a +0.2
Hispanic 6.8 6.1a 6.9 5.2a -0.9
Small ERI groups 1.3 0.6a 1.3 0.5a -0.1
White 66.9 76.2 65.8 76.1 -0.1
White male 40.0 49.4 39.2 49.5 +0.1
White female 26.9 26.8a 26.6 26.6 -0.2
Total 3,819 358 3,958 406
Source: OCC HR Data Mart as of October 1, 2016.a EEO groups participated at rates below their workforce participation rates.

Office of Minority and Women Inclusion28
2016 Annual Report to Congress | Workforce Diversity and Inclusion in Employment: Recruitment, Hiring, Career Development, and Retention
Table 10: OCC Participation in SLP by EEO Groups, FY 2015 to FY 2016
Participation rates of EEO groups are in percentages.
FY 2015 FY 2016
OCC workforce participation
NB VIII-IX (equiv. SLP)
OCC workforce participation
NB VIII-IX (equiv. SLP)
SLP participation percentage point change from FY 2015 to FY 2016
Male 54.9 73.2 54.8 70.7 -2.5
Female 45.1 26.8a 45.2 29.3a +2.5
Minority male 14.9 10.7a 15.6 12.1a +1.4
Minority female 18.2 3.6a 18.6 5.2a +1.6
Minority 33.1 14.3a 34.2 17.3a +3.0
Asian 7.8 1.8a 8.4 3.5a +1.7
Black 17.2 10.7a 17.6 12.1a +1.4
Hispanic 6.8 1.8a 6.9 1.7a -0.1
Small ERI Groups 1.3 0.0a 1.3 0.0a -
White 66.9 85.7 65.8 82.7 -3.0
White male 40.0 62.5 39.2 58.6 -3.9
White female 26.9 23.2a 26.6 24.1a +0.9
Total 3,819 56 3,958 58
Source: MD-715 workforce data table as of September 30, 2016.a EEO groups participated at rates below the workforce participation rates.
Office of the Comptroller of the Currency 29
Workforce Diversity and Inclusion in Employment: Recruitment, Hiring, Career Development, and Retention | 2016 Annual Report to Congress
Females (42.3 percent) and minorities (3.8 percent) in the SLP feeder grade (GS-15 equivalent) participated in several formal career development programs and training courses that provided learning and continuous growth opportunities in fiscal year 2016. Participation rates of females and minorities declined from fiscal year 2015 by 9.2 percentage points and 8.3 percentage points, respectively.
Supported by the Comptroller and the Executive Committee (EC), in fiscal year 2015 the OMWI established an interdisciplinary working group of employees to perform a barrier analysis to improve diversity and promote inclusion in SLP and their pipeline positions. The Diversity and Development Working Group analyzed data, conducted root cause analyses, reviewed agency policies and practices, researched best practices, identified potential solutions, and developed an implementation framework to support the increase of females and minorities in SLP. The working group identified three main causes for the disparity in the participation of females and minorities in SLP and their pipelines: leadership skill barriers, cultural barriers, and career aspirations. The leadership skill barrier includes issues of office morale, encouragement, and the role of leaders. The cultural barrier involves clear recognition of the value of diversity in the organization. The career aspirations barrier includes travel requirements, job stress, geographic relocations and family obligations, and work/life balance. In fiscal year 2016, findings and recommendations of the working group were presented and approved by senior management, and implementation of an action plan began. Execution of the action plan will continue in fiscal year 2017.
The efforts of the working group also addressed the recommendation by the Treasury Department Office of Inspector General (OIG) and the EEOC for the OCC to continue its efforts to increase the participation of minorities and women in supervisor positions and SLP. This recommendation was part of the OIG’s final report from its fiscal year 2014 review of the OCC’s personnel practices and other efforts to increase agency diversity, create a workplace free of systemic discrimination, and provide equal opportunity for minorities and women to obtain SLP. The recommendation was also part of the EEOC’s final report issued in November 2015 based on a status review of the OCC’s EEO program.
The OCC continued efforts to implement the goals and objectives of the leadership initiative, designed to create a systematic and sustainable process for succession planning that enhances continuity, development, and diversity of leadership at all levels of the organization.
The Leadership Developmental Advisory Board (LDAB) provides leadership, guidance, and governance for leadership development. The Executive Director of OMWI serves as a member of the LDAB. In fiscal year 2016, the OCC Leadership Institute was established as an enterprise-wide approach to the systematic development of leaders at all levels through a competency-based curriculum and developmental assignments. The core components of the institute incorporated many of the agency’s career development initiatives that were already under way.
Also, in fiscal year 2017 the agency will develop a competitive Executive Development Program that focuses on key executive competencies. New leadership courses were piloted and launched in fiscal year 2016 for managers, supervisors, and employees; these courses include Career Development Conversations, Career Power, Coaching for Results, Leadership Foundations, Leading and Engaging, and Leveraging Diversity and Creating an Inclusive Work Environment. The OCC also continued to administer a robust Executive Coaching Program, sponsor the Leadership Development Speakers’ Bureau, hold informational manager forums, and publish a quarterly management newsletter, Compass, to educate and inform managers of leadership development opportunities.
The OCC combined its Organizational Development and Leadership Development functions into one new department—Leadership, Executive, and Organizational Development (LE&OD), led by a Deputy Comptroller. The new organization combines the strengths of both groups while expanding executive development and resources. This change emphasizes the importance of leadership, organizational development, and change management at the agency. LE&OD will serve as the key advisor to the Comptroller and senior leadership on the design, development, and implementation of leadership and career development programs, organizational development, and succession management strategies, including enterprise workforce planning.

Office of Minority and Women Inclusion30
2016 Annual Report to Congress | Workforce Diversity and Inclusion in Employment: Recruitment, Hiring, Career Development, and Retention
The ENGs collectively continued “leadership at all levels” as their theme in 2016, to encourage understanding and commitment to the OCC leadership journey. They hosted three national leadership teleconferences related to the OCC’s leadership initiative. The focus was to help employees understand why the OCC needs leaders at every level of the agency and how employees can take advantage of opportunities to identify and develop leaders.
The OCC revisited and promoted its agency-wide Mentoring Resource Toolkit web page, which provides a one-stop shop for information and guidance on becoming a mentee or mentor, or establishing a mentoring program in the agency. The OCC also created a “Quick Guide for Mentoring” that provides guidance on establishing an informal mentoring program from design to evaluation, and a “Quick Guide for Mentoring Relationships” to provide basic information to potential mentors and mentees. Both guides include web links to OCC resources that support mentoring and leadership development. The OCC’s ENGs are an additional resource for mentoring in the agency, given their active involvement in the development and maintenance of meaningful mentoring programs.
In fiscal year 2017, the OCC will continue to execute the goals and objectives of its leadership vision and initiatives, aimed at ensuring continuity, development, and diversity of leadership at all levels of the organization. Also, the OCC will create a leadership and career development policy, formalize and promote the Executive Development Program and Career Development Center, and fully integrate the Leadership Institute with core components of executive, leadership, and career development, mentoring, and coaching.
Also, the OCC will continue to execute the action plan framework and partner with key stakeholders throughout the agency on the implementation process as well as track and monitor the agency’s progress.
WORKFORCE ENVIRONMENT
Agency Commitment The Comptroller supervises all EEO/Diversity and Inclusion matters through the Executive Director for OMWI. The alignment of OMWI
as a direct report to the Comptroller demonstrates commitment from agency leadership and provides direct access to the Comptroller, achieved by regularly scheduled meetings between the OMWI Executive Director and the Comptroller. EEO and diversity agenda items are reviewed with the Human Capital Subcommittee of the EC. In addition, individual business unit meetings and reviews serve to foster executive support and commitment for the EEO/Diversity and Inclusion Program.
The OMWI Executive Director continues to collaborate with the senior leadership team in the Office of Management (OM), when EEO and diversity concerns are discussed as part of the agency’s operations management and human capital plans and initiatives. Such collaboration allows for a more robust exchange of ideas on matters with overarching agency implications. The OMWI and HC offices have a strong partnership to support and address the agency’s human capital needs and challenges.
Diversity briefings are held with senior leadership teams to discuss their departmental workforce trends and areas of special attention, including targeted recruitment, retention strategies, and succession planning. One-on-one EEO/diversity and inclusion discussions are held with senior managers when needed or requested. These reviews have facilitated the integration of the principles of the OCC’s EEO/diversity and inclusion plans and reports into business unit plans. Moreover, the EEO/diversity and inclusion plans and reports are reviewed annually with the Comptroller after input from key agency stakeholders and EC members.
The OCC also benefits from the input of its six ENGs that advance special emphasis programs: the Network of Asian Pacific Americans (NAPA); the Coalition of African American Regulatory Employees (CARE); PRIDE (the Gay, Lesbian, Transgender, and Bisexual Employees network group); HOLA; TWN; and Generational Crossroads (Crossroads). In addition, concerted efforts are under way to establish a veterans-related ENG. The ENGs serve as a collective voice in communicating workplace concerns and providing input to management around diversity and inclusion programs and activities within the OCC. The groups also hold an annual leadership forum with the Comptroller, their EC sponsors, and other EC members to align individual group objectives with agency strategic priorities pertaining to recruitment, career development, and retention. ENG officers also

Office of the Comptroller of the Currency 31
Workforce Diversity and Inclusion in Employment: Recruitment, Hiring, Career Development, and Retention | 2016 Annual Report to Congress
engage in quarterly calls to discuss progress of key activities and share best practices across groups. For additional information about the OCC’s ENGs, please refer to appendix O.
The OCC has allocated sufficient resources to train all employees on the EEO/Diversity and Inclusion Program. Some of the agency’s efforts in fiscal year 2016 included providing EEO, alternative dispute resolution (ADR), and diversity and inclusion training during new hire orientations, new manager orientations, and training sessions for team leaders and assistants. Cumulatively, the sessions provided training on an array of issues: managing and participating in a diverse work environment; discrimination, including workplace harassment; generational diversity; ADR; and conflict resolution tools, including “Crucial Conversations” and Diversity Dialogue sessions. The OCC conducted 30 Diversity Dialogues with more than 500 employees and 30 supervisors/managers in different offices in Headquarters, the districts, and field locations.
In fiscal year 2016, the OCC piloted a leadership course, “Leveraging Diversity and Creating an Inclusive Work Environment,” specifically tailored for managers and rating officials to explore the impact of unconscious bias and leveraging diversity and inclusion in hiring, promotions, performance management, and succession management. The pilot course was very successful, receiving high favorability evaluations. The course will be offered in fiscal year 2017.
All new managers and supervisors are required to complete a four-and-a-half-day Manager Orientation, which includes a review of their responsibilities in creating and managing a diverse workforce, upholding the principles of EEO and ADR, and responding to requests for reasonable accommodations. All new hires are required to complete No FEAR Act training within 60 days of beginning their employment. All employees were required to complete No FEAR Act training in fiscal year 2016 (training is required every two years).
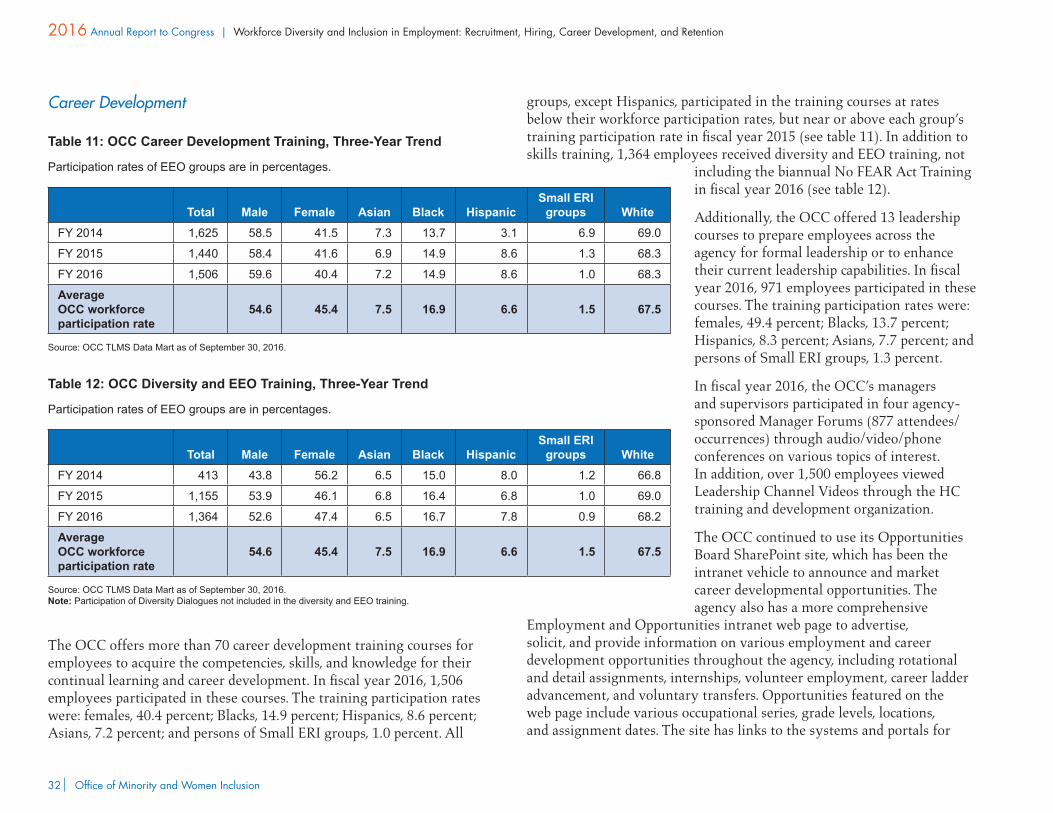
Office of Minority and Women Inclusion32
2016 Annual Report to Congress | Workforce Diversity and Inclusion in Employment: Recruitment, Hiring, Career Development, and Retention
Career Development Table 11: OCC Career Development Training, Three-Year Trend
Participation rates of EEO groups are in percentages.
Total Male Female Asian Black HispanicSmall ERI
groups WhiteFY 2014 1,625 58.5 41.5 7.3 13.7 3.1 6.9 69.0
FY 2015 1,440 58.4 41.6 6.9 14.9 8.6 1.3 68.3
FY 2016 1,506 59.6 40.4 7.2 14.9 8.6 1.0 68.3
Average OCC workforce participation rate
54.6 45.4 7.5 16.9 6.6 1.5 67.5
Source: OCC TLMS Data Mart as of September 30, 2016.
Table 12: OCC Diversity and EEO Training, Three-Year Trend
Participation rates of EEO groups are in percentages.
Total Male Female Asian Black HispanicSmall ERI
groups WhiteFY 2014 413 43.8 56.2 6.5 15.0 8.0 1.2 66.8
FY 2015 1,155 53.9 46.1 6.8 16.4 6.8 1.0 69.0
FY 2016 1,364 52.6 47.4 6.5 16.7 7.8 0.9 68.2
Average OCC workforce participation rate
54.6 45.4 7.5 16.9 6.6 1.5 67.5
Source: OCC TLMS Data Mart as of September 30, 2016.Note: Participation of Diversity Dialogues not included in the diversity and EEO training.
The OCC offers more than 70 career development training courses for employees to acquire the competencies, skills, and knowledge for their continual learning and career development. In fiscal year 2016, 1,506 employees participated in these courses. The training participation rates were: females, 40.4 percent; Blacks, 14.9 percent; Hispanics, 8.6 percent; Asians, 7.2 percent; and persons of Small ERI groups, 1.0 percent. All
groups, except Hispanics, participated in the training courses at rates below their workforce participation rates, but near or above each group’s training participation rate in fiscal year 2015 (see table 11). In addition to skills training, 1,364 employees received diversity and EEO training, not
including the biannual No FEAR Act Training in fiscal year 2016 (see table 12).
Additionally, the OCC offered 13 leadership courses to prepare employees across the agency for formal leadership or to enhance their current leadership capabilities. In fiscal year 2016, 971 employees participated in these courses. The training participation rates were: females, 49.4 percent; Blacks, 13.7 percent; Hispanics, 8.3 percent; Asians, 7.7 percent; and persons of Small ERI groups, 1.3 percent.
In fiscal year 2016, the OCC’s managers and supervisors participated in four agency-sponsored Manager Forums (877 attendees/occurrences) through audio/video/phone conferences on various topics of interest. In addition, over 1,500 employees viewed Leadership Channel Videos through the HC training and development organization.
The OCC continued to use its Opportunities Board SharePoint site, which has been the intranet vehicle to announce and market career developmental opportunities. The agency also has a more comprehensive
Employment and Opportunities intranet web page to advertise, solicit, and provide information on various employment and career development opportunities throughout the agency, including rotational and detail assignments, internships, volunteer employment, career ladder advancement, and voluntary transfers. Opportunities featured on the web page include various occupational series, grade levels, locations, and assignment dates. The site has links to the systems and portals for
Office of the Comptroller of the Currency 33
Workforce Diversity and Inclusion in Employment: Recruitment, Hiring, Career Development, and Retention | 2016 Annual Report to Congress
submitting and tracking expressions of interest and obtaining vacancy and opportunity announcements and related information, such as the MCBS and LBS Assignments SharePoint site. The web page also includes reference material, such as hiring and recruitment policies and procedures, employment policies, and the on- and off-boarding process.
Employee EngagementOCC leadership is committed to the employee engagement process, which is one of several initiatives the Comptroller implemented across the agency to enhance its effectiveness and ensure that the OCC continues to be a great place to work. In fiscal year 2016, OCC employees participated in the engagement survey for a third time and the results show why the OCC is such a strong and highly engaged organization, with core strengths that continue to grow. The overall results showed that employees were satisfied with their jobs and immediate managers and highly focused on external stakeholders. The OCC’s work environment is healthier than previous survey results, with increased levels of respect and professionalism, and employees are becoming more comfortable expressing their opinions. Employees also reported more optimism about training and career development opportunities and expressed more satisfaction with team collaboration and work/life balance.
The survey results indicate that the agency has two areas that require continued attention: (1) processes for handling sensitive issues and (2) leadership communications. Two task forces were established in December 2015 to address these areas; their findings and recommendations were presented and adopted by senior leadership. Execution of the recommendations began in fiscal year 2016 and will continue in fiscal year 2017. One of the key recommendations was to establish an Internal Ombudsman function, which will be launched in fiscal year 2017. In addition, action plans were developed at the work group level for each business unit and for the agency as a whole to build on momentum. The OCC is committed to developing a sustainable and robust employee feedback program to measure engagement and continuously improve the workplace.
The OCC continued efforts to strengthen its culture and ensure a professional environment that is supportive of the needs of its employees. Over the last year, OCC staff worked to enhance agency morale and its sense of shared purpose through improved communication within the agency. To assist in this effort, a Decision Making and Execution Framework was established to ensure that those with the right skills and experiences are included in the decision-making process for key agency issues and that they actively share information and knowledge as they collaborate to address an issue. In addition, the Comptroller and senior executives provided strategic priority status updates periodically to all employees by e-mail.
In 2016, OCC employees participated in the Federal Employee Viewpoint Survey (FEVS), designed to measure employees’ views on topics pertaining to diversity, family-friendly culture, leadership, pay, teamwork, and training and development. The 2016 FEVS invited all permanent OCC employees as of October 31, 2015, to participate. More than 2,000 OCC employees completed the survey, representing a 61.4 percent response rate. OCC employees responded more favorably in all major categories than the rest of the federal government and in all but one category than employees of the Treasury Department. OCC employees responded most favorably to questions in the categories for work/life (81.7 percent), supervisors (79.2 percent), and work experience (73.7 percent). The OCC’s employee engagement index and global satisfaction index scores (both 68.0 percent) exceeded the scores of the Treasury Department (67.0 and 60.0 percent, respectively) and the federal government (65.0 and 61.0 percent, respectively). The FEVS results were also analyzed using a formulated diversity and inclusion index created by the Office of Personnel Management that looks at questions that address fairness, open-mindedness, cooperativeness, supportiveness, and empowerment. Although the OCC’s average diversity and inclusion index rating declined 8.0 percentage points to 62.0 percent, and to a “Fair” overall ranking, the agency’s index rating remains higher than that of the Treasury Department (60.0 percent) and the federal government overall (58.0 percent).
Office of Minority and Women Inclusion34
2016 Annual Report to Congress | Workforce Diversity and Inclusion in Employment: Recruitment, Hiring, Career Development, and Retention
The Partnership for Public Service uses the data from the FEVS to create “The Best Places to Work in the Federal Government” rankings. Based on the 2016 FEVS data, the OCC ranked 95 of 305 agency subcomponents. Of the categories making up the overall rankings, the OCC ranked 86 in support for diversity and 35 in training and development.
Program AccountabilityAll OCC managers, supervisors, and EEO/Diversity and Inclusion Program officials are stakeholders in the effective implementation of the agency’s EEO Program. EEO/diversity and inclusion program officials advise and assist managers and supervisors with their EEO/diversity and inclusion program-related responsibilities. The HC and OMWI offices collaborate to ensure that personnel actions conform to the EEOC management directives. In fiscal year 2016, all OCC supervisors and managers were required to complete training on Prohibited Personnel Practices and Whistleblower Protection Laws.
OMWI staff works with senior managers to identify barriers that may impede the realization of the agency’s EEO, diversity and inclusion goals. The OCC conducts periodic reviews of the agency’s merit promotion program policy and procedures, employee recognition and awards program, and employee development and training programs to address deficiencies or concerns. In fiscal year 2016, the following policies and procedures were reviewed and updated, as appropriate: Employee Administrative Grievance System, Alternative Work Schedule Program, Telework Program, Employee Training Policy, Examination Technician Program, Examiner Rotational Requirements, and the UCE.
Additionally, the Compensation Program and the Incentive Awards policies and procedures remain under review and are expected to be finalized in fiscal year 2017. HC staffing and hiring procedures and directives are also
under review as part of the agency’s effort to continuously improve its hiring process, to include a review of the Merit Promotion Plan, which will be released in fiscal year 2017. One of the most significant policy changes is to the hiring process for experienced bank examiners and the establishment of internal procedures, which will be effective in fiscal year 2017.
Plans for the periodic review of policies and procedures include the development of new guidance and directives based on internal quality control review findings. An Excepted Service policy is also being developed and will be issued in fiscal year 2017. The OCC’s OM will launch an initiative in fiscal year 2017 to review and update all policies and procedures issued by OM offices—HC, Information Technology Services, Financial Management, Workplace Services, and Office of Security. Some of the policies scheduled for review are Position Evaluation Plan, Alternative Location Arrangements, Part-Time Employment, and Reduction-in-Force.
The OCC is undertaking a comprehensive review and redesign of its performance management system, including the performance appraisal process. The OCC started this project in response to employee and manager concerns about the system, such as (1) fairness and consistency in ratings, (2) clarity and overlap in the performance evaluation elements, (3) the quality of performance feedback, and (4) the process for addressing poor performance. The project team has completed a best practices review and an evaluation of the current system. A job analysis to develop new, validated performance appraisal criteria is under way. Recommendations for new performance management and appraisal processes are expected in spring 2017. Generally, all staffing policies, including the merit promotion policy, are reviewed at least annually to ensure compliance with applicable laws, regulations, and other guidance.
Office of the Comptroller of the Currency 35
2016 Annual Report to Congress
Regulated EntitiesThe OCC regulates and supervises 1,429 institutions. Of these institutions, 997 are national banks, 384 are federal savings associations, and 48 are federal branches of foreign banks. These national banks and federal saving associations have combined assets of $11.4 trillion (representing 68.0 percent of total U.S. commercial banking assets), and the federal branches of foreign banks have combined assets of $306 billion.30
Section 342 of Dodd-Frank requires the federal financial agencies, including the OCC, CFPB, FDIC, Board, NCUA, and SEC (collectively, the agencies), to develop standards for assessing the diversity policies and practices of the entities they regulate. In satisfaction of this requirement, the agencies published in the Federal Register the “Final Interagency Policy Statement Establishing Joint Standards for Assessing the Diversity Policies and Practices of Entities Regulated by the Agencies” (joint standards) on June 10, 2015.
The final joint standards recognize and reflect consideration of the varying circumstances of the regulated entities, with regard to governance structure, total assets, workforce size, geographic location, and community characteristics. The standards provide a framework for regulated entities to assess and to create or strengthen their diversity and inclusion policies and practices in these key areas:
30 As of September 30, 2016.
n Organizational commitment to diversity and inclusion
n Workforce profile and employment practices
n Procurement and business practices (supplier diversity)
n Practices to promote transparency of organizational diversity and inclusion
n Entities’ self-assessment process
On July 13, 2016, the Office of Management and Budget approved the collection of voluntary self-assessment information from regulated entities. OCC-regulated entities are encouraged to submit their diversity self-assessments to the OCC and to make this information public through their websites or other communication methods. The OCC designated a web page with instructions for submitting diversity self-assessments and additional information about the diversity self-assessments. The OCC will collect the voluntary 2016 diversity self-assessments and any supporting documents in the second quarter of fiscal year 2017.
The OCC OMWI Executive Director may use bank diversity information to monitor progress and trends in the financial services industry’s diversity and inclusion practices related to employment and contracting activities.
Office of Minority and Women Inclusion36
2016 Annual Report to Congress
Financial Literacy The OCC is one of the 21 federal agencies represented on the U.S. Financial Literacy and Education Commission (FLEC). The focus of the FLEC in fiscal year 2016 was on the financial literacy issues of youth, or “starting early,” building on the experience and resources of FLEC members to help young people learn the financial basics before they join the workforce and begin their careers. One of the major outcomes of the FLEC was its support for community youth workforce development programs that offer financial capability training to participants.
Throughout fiscal year 2016, OCC staff participated in a number of financial literacy and education outreach events where the OCC’s financial literacy and consumer materials were distributed. These events included the following: the Society for Financial Education and Professional Development’s Financial Literacy Conference; Operation Hope’s Global Forum; the Department of Defense Pentagon’s Financial Readiness Fair; Financial Literacy Day on Capitol Hill; and the exhibit hall at the Congressional Black Caucus Foundation Annual Legislative Conference. The OCC also issued news releases supporting Earned Income Tax Awareness Day, America Saves Week, and Financial Literacy Day on Capitol Hill.
OCC staff participated in a number of financial literacy meetings and conferences, including the National Adult Protective Services Association Summit on Elder Financial Exploitation; Age-Friendly Banking Innovation
Labs; Military Saves Quarterly meetings; Earned Income Tax Credit events on Capitol Hill and in New York City; Alliance Against Fraud meetings; American Savings Education Council; National Savings Forum; Department of Defense Financial Readiness Roundtable meetings; World Elder Abuse Awareness day; the Credit Builders Alliance Symposium; and the Corporation for Enterprise Development Assets Learning Conference.
The OCC has educated its staff on a number of financial literacy fronts. For example, the OCC provided information about the importance of savings and encouraged staff participation in financial literacy volunteer activities. During America Saves Week, the OCC published messages on the benefits of saving. Also, the OCC provided information on financial elder abuse that may be useful to OCC employees as they carry out the OCC’s mission or respond to inquiries from financial institutions. Further, the OCC maintains a list of financial literacy volunteer opportunities that interested OCC staff may consider.
In fiscal year 2016, the OCC produced six issues of the bi-monthly Financial Literacy Update enewsletter, which reports on events, initiatives, and related resources of the OCC and other government agencies and organizations. The Financial Literacy Update was sent to about 30,000 subscribers. The OCC also maintained a financial literacy web resource directory on the occ.gov website that provides information on financial literacy resources, issues, and events that are important to bankers, organizations, and consumers of all ages. Additionally, the OCC has reports that cover financial literacy-related topics, such as the “School-Based Bank Savings Programs” Community Development Insights report.
Office of the Comptroller of the Currency 37
2016 Annual Report to Congress
Appendixes
APPENDIX A: OCC METHOD AND DATA SOURCES FOR PAYMENTS AND AWARDS
PaymentsThe OCC uses the Core Financial System to track all agency expenditures, including contractor payments. The OCC pays contractors within 15 days of receipt of an invoice. Because contractors may submit invoices to the OCC after the close of the fiscal year in which the contract actions were reported to the FPDS-NG, the OCC’s total payments to contractors during a given fiscal year may differ from the total awards.
AwardsThe OCC follows the Federal Acquisition Regulation (FAR) for the procurement of goods and services (48 CFR 1). The FAR defines a contract action as “any oral or written action that results in the purchase, rent, or
31 48 CFR 2.101. A change in the micro-purchase threshold from $3,000 to $3,500 was effective October 1, 2015.32 The term “socioeconomic category” identifies certain business ownership characteristics (e.g., WOB, small disadvantaged business, educational institution, and MOB). For more information, see the FPDS-NG Government User’s Manual, version 1.4, p.135 (June 2013).
lease of supplies or equipment, services, or construction using appropriated dollars over the micro-purchase threshold, or modifications to these actions regardless of dollar value. Contract action does not include grants, cooperative agreements, other transactions, real property leases, requisitions from federal stock, training authorizations, or other non-FAR-based transactions” (48 CFR 4.601).
The FPDS-NG website is the central repository of information about federal contracting and contains detailed information on contract awards of more than $3,500.31 The FAR requires federal contracting offices to submit complete and accurate data on contract actions to the FPDS-NG (48 CFR 4.604(3)).
At the end of each fiscal year, the OMWI queries the FPDS-NG for (1) OCC awards or “action obligations,” which are the net amount of funds obligated or de-obligated for all contract actions entered into the FPDS-NG, from October 1 through September 30; and (2) the business owner’s socioeconomic category32 for each award.
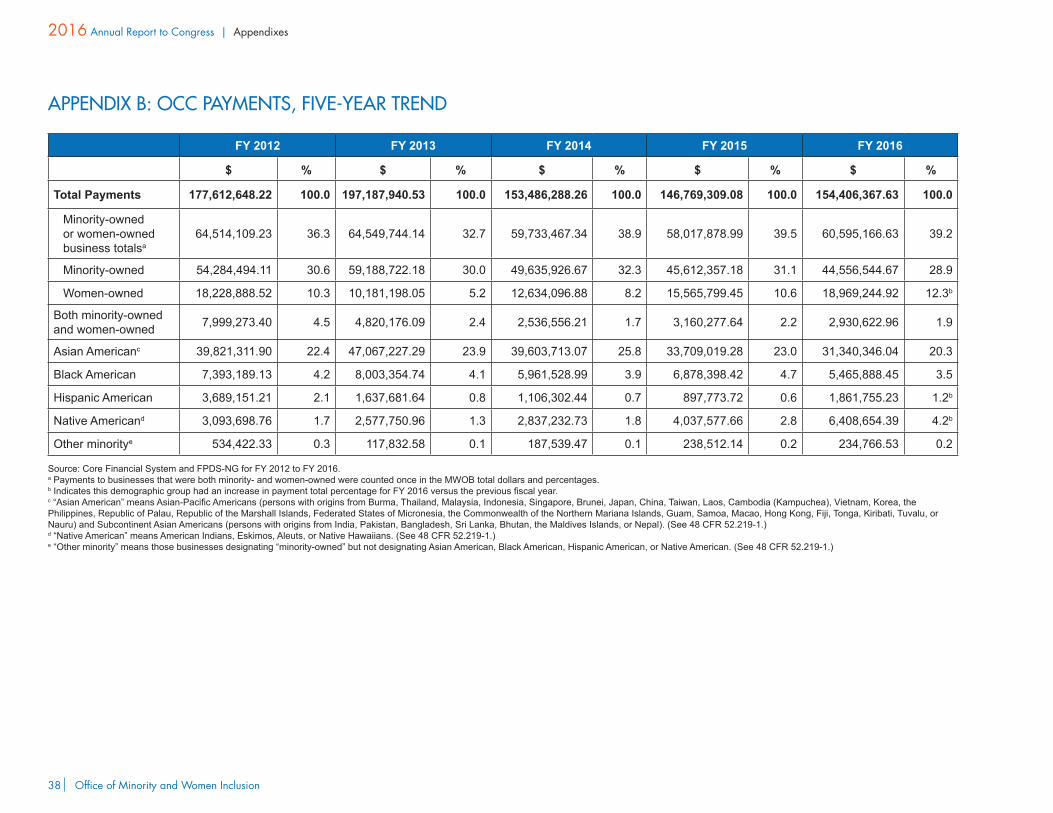
Office of Minority and Women Inclusion38
2016 Annual Report to Congress | Appendixes
APPENDIX B: OCC PAYMENTS, FIVE-YEAR TREND
FY 2012 FY 2013 FY 2014 FY 2015 FY 2016
$ % $ % $ % $ % $ %
Total Payments 177,612,648.22 100.0 197,187,940.53 100.0 153,486,288.26 100.0 146,769,309.08 100.0 154,406,367.63 100.0
Minority-owned or women-owned business totalsa
64,514,109.23 36.3 64,549,744.14 32.7 59,733,467.34 38.9 58,017,878.99 39.5 60,595,166.63 39.2
Minority-owned 54,284,494.11 30.6 59,188,722.18 30.0 49,635,926.67 32.3 45,612,357.18 31.1 44,556,544.67 28.9
Women-owned 18,228,888.52 10.3 10,181,198.05 5.2 12,634,096.88 8.2 15,565,799.45 10.6 18,969,244.92 12.3b
Both minority-owned and women-owned 7,999,273.40 4.5 4,820,176.09 2.4 2,536,556.21 1.7 3,160,277.64 2.2 2,930,622.96 1.9
Asian Americanc 39,821,311.90 22.4 47,067,227.29 23.9 39,603,713.07 25.8 33,709,019.28 23.0 31,340,346.04 20.3
Black American 7,393,189.13 4.2 8,003,354.74 4.1 5,961,528.99 3.9 6,878,398.42 4.7 5,465,888.45 3.5
Hispanic American 3,689,151.21 2.1 1,637,681.64 0.8 1,106,302.44 0.7 897,773.72 0.6 1,861,755.23 1.2b
Native Americand 3,093,698.76 1.7 2,577,750.96 1.3 2,837,232.73 1.8 4,037,577.66 2.8 6,408,654.39 4.2b
Other minoritye 534,422.33 0.3 117,832.58 0.1 187,539.47 0.1 238,512.14 0.2 234,766.53 0.2
Source: Core Financial System and FPDS-NG for FY 2012 to FY 2016.a Payments to businesses that were both minority- and women-owned were counted once in the MWOB total dollars and percentages.b Indicates this demographic group had an increase in payment total percentage for FY 2016 versus the previous fiscal year.c “Asian American” means Asian-Pacific Americans (persons with origins from Burma, Thailand, Malaysia, Indonesia, Singapore, Brunei, Japan, China, Taiwan, Laos, Cambodia (Kampuchea), Vietnam, Korea, the Philippines, Republic of Palau, Republic of the Marshall Islands, Federated States of Micronesia, the Commonwealth of the Northern Mariana Islands, Guam, Samoa, Macao, Hong Kong, Fiji, Tonga, Kiribati, Tuvalu, or Nauru) and Subcontinent Asian Americans (persons with origins from India, Pakistan, Bangladesh, Sri Lanka, Bhutan, the Maldives Islands, or Nepal). (See 48 CFR 52.219-1.)d “Native American” means American Indians, Eskimos, Aleuts, or Native Hawaiians. (See 48 CFR 52.219-1.)e “Other minority” means those businesses designating “minority-owned” but not designating Asian American, Black American, Hispanic American, or Native American. (See 48 CFR 52.219-1.)
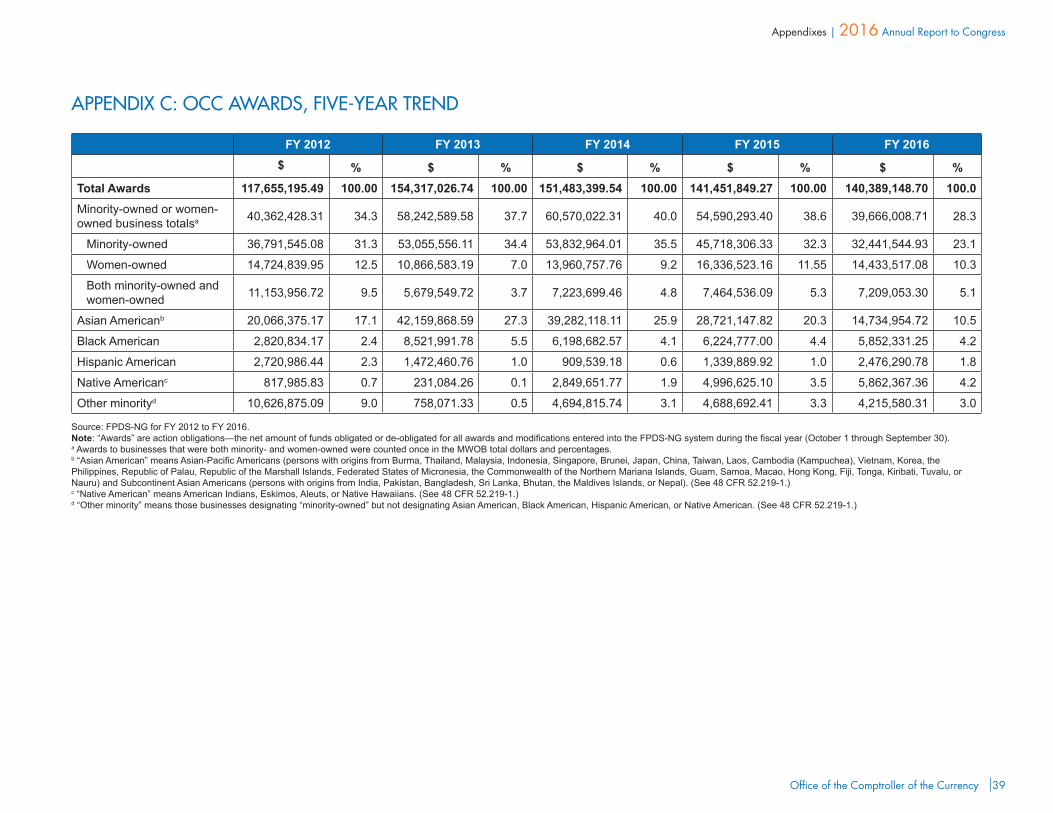
Office of the Comptroller of the Currency 39
Appendixes | 2016 Annual Report to Congress
APPENDIX C: OCC AWARDS, FIVE-YEAR TREND
FY 2012 FY 2013 FY 2014 FY 2015 FY 2016$ % $ % $ % $ % $ %
Total Awards 117,655,195.49 100.00 154,317,026.74 100.00 151,483,399.54 100.00 141,451,849.27 100.00 140,389,148.70 100.0Minority-owned or women-owned business totalsa 40,362,428.31 34.3 58,242,589.58 37.7 60,570,022.31 40.0 54,590,293.40 38.6 39,666,008.71 28.3
Minority-owned 36,791,545.08 31.3 53,055,556.11 34.4 53,832,964.01 35.5 45,718,306.33 32.3 32,441,544.93 23.1
Women-owned 14,724,839.95 12.5 10,866,583.19 7.0 13,960,757.76 9.2 16,336,523.16 11.55 14,433,517.08 10.3
Both minority-owned and women-owned 11,153,956.72 9.5 5,679,549.72 3.7 7,223,699.46 4.8 7,464,536.09 5.3 7,209,053.30 5.1
Asian Americanb 20,066,375.17 17.1 42,159,868.59 27.3 39,282,118.11 25.9 28,721,147.82 20.3 14,734,954.72 10.5
Black American 2,820,834.17 2.4 8,521,991.78 5.5 6,198,682.57 4.1 6,224,777.00 4.4 5,852,331.25 4.2
Hispanic American 2,720,986.44 2.3 1,472,460.76 1.0 909,539.18 0.6 1,339,889.92 1.0 2,476,290.78 1.8
Native Americanc 817,985.83 0.7 231,084.26 0.1 2,849,651.77 1.9 4,996,625.10 3.5 5,862,367.36 4.2
Other minorityd 10,626,875.09 9.0 758,071.33 0.5 4,694,815.74 3.1 4,688,692.41 3.3 4,215,580.31 3.0
Source: FPDS-NG for FY 2012 to FY 2016.Note: “Awards” are action obligations—the net amount of funds obligated or de-obligated for all awards and modifications entered into the FPDS-NG system during the fiscal year (October 1 through September 30).a Awards to businesses that were both minority- and women-owned were counted once in the MWOB total dollars and percentages.b “Asian American” means Asian-Pacific Americans (persons with origins from Burma, Thailand, Malaysia, Indonesia, Singapore, Brunei, Japan, China, Taiwan, Laos, Cambodia (Kampuchea), Vietnam, Korea, the Philippines, Republic of Palau, Republic of the Marshall Islands, Federated States of Micronesia, the Commonwealth of the Northern Mariana Islands, Guam, Samoa, Macao, Hong Kong, Fiji, Tonga, Kiribati, Tuvalu, or Nauru) and Subcontinent Asian Americans (persons with origins from India, Pakistan, Bangladesh, Sri Lanka, Bhutan, the Maldives Islands, or Nepal). (See 48 CFR 52.219-1.) c “Native American” means American Indians, Eskimos, Aleuts, or Native Hawaiians. (See 48 CFR 52.219-1.)d “Other minority” means those businesses designating “minority-owned” but not designating Asian American, Black American, Hispanic American, or Native American. (See 48 CFR 52.219-1.)
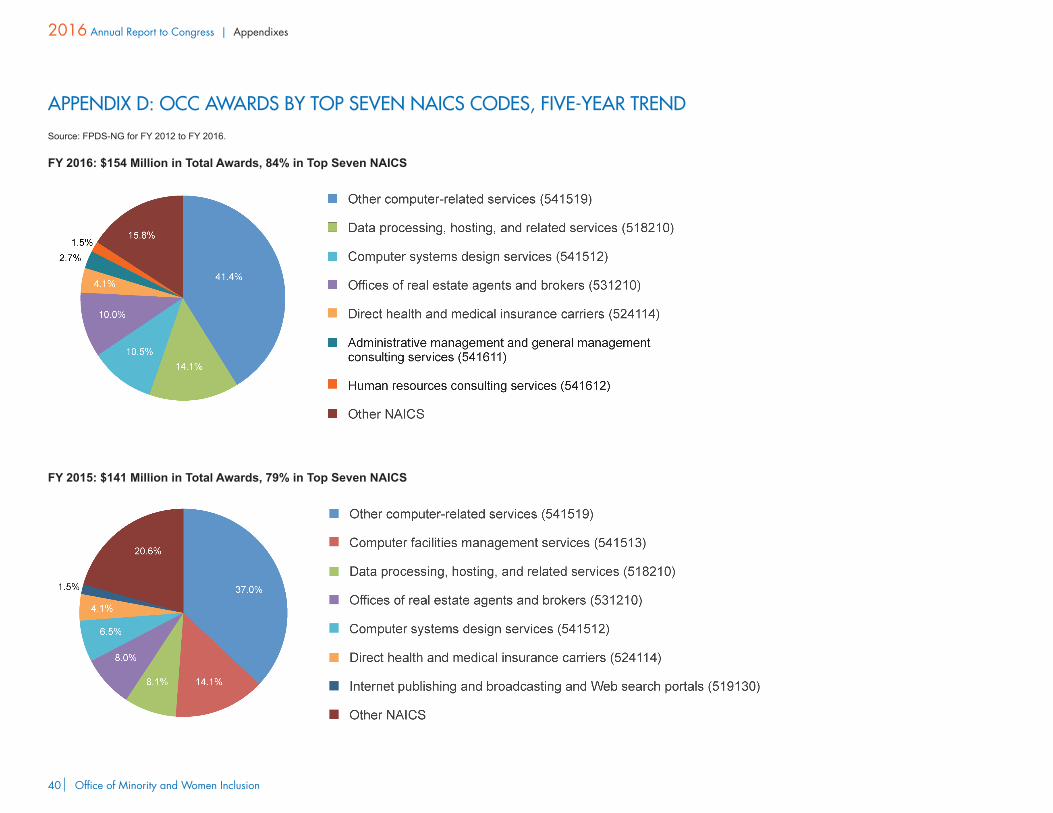
Office of Minority and Women Inclusion40
2016 Annual Report to Congress | Appendixes
APPENDIX D: OCC AWARDS BY TOP SEVEN NAICS CODES, FIVE-YEAR TRENDSource: FPDS-NG for FY 2012 to FY 2016.
FY 2016: $154 Million in Total Awards, 84% in Top Seven NAICS
FY 2015: $141 Million in Total Awards, 79% in Top Seven NAICS
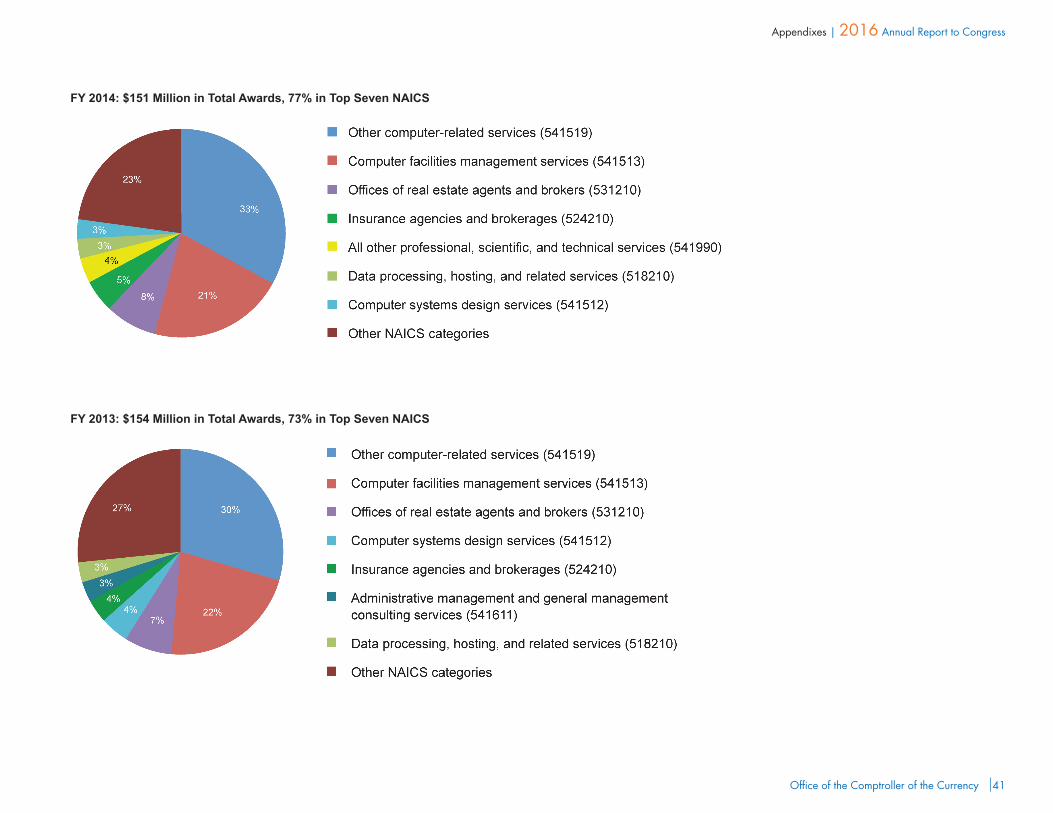
Office of the Comptroller of the Currency 41
Appendixes | 2016 Annual Report to Congress
FY 2014: $151 Million in Total Awards, 77% in Top Seven NAICS
FY 2013: $154 Million in Total Awards, 73% in Top Seven NAICS

Office of Minority and Women Inclusion42
2016 Annual Report to Congress | Appendixes
FY 2012: $118 Million in Total Awards, 80% in Top Seven NAICS
Office of the Comptroller of the Currency 43
Appendixes | 2016 Annual Report to Congress
APPENDIX E: TECHNICAL ASSISTANCE TO MWOBS, FY 2016 OMWI representatives provided technical assistance to MWOBs at the following external events:
n National Minority Supplier Diversity Conference, San Diego, Calif. October 18–21, 2015: OMWI exhibited at event with over 6,000 attendees.
n National Small Business Contracting Summit, Washington, D.C. November 5, 2015: OMWI conducted matchmaking sessions with 10 MWOB representatives.
n National 8(a) Conference, Orlando, Fla. February 8–10, 2016: OMWI conducted matchmaking sessions with eight MWOB representatives.
n Small Business Federal Contract Summit, Washington, D.C. March 17, 2016: OMWI conducted matchmaking sessions with 16 MWOB representatives.
n Women’s Business Enterprise National Council Summit and Salute, Phoenix, Ariz. March 22–24, 2016: OMWI participated in roundtable discussions at event with over 1,500 attendees and conducted matchmaking sessions with five WOB representatives.
n 26th Annual Government Procurement Conference, Washington, D.C. April 6, 2016: OMWI exhibited at event with over 2,000 attendees and conducted matchmaking sessions with eight MWOB representatives.
n HUBZone Conference, Chicago, Ill. April 20–21, 2016: OMWI conducted matchmaking sessions with seven MWOB representatives.
n Florida Small Business Development Center Conference, Tampa, Fla. May 5, 2016: OMWI exhibited at event with over 320 attendees, presented technical training on doing business with the OCC and federal government, and conducted matchmaking sessions with eight MWOB representatives.
n CelebrAsian Conference, Atlanta, Ga. June 1–3, 2016: OMWI exhibited at event with over 800 attendees.
n WBENC National Conference and Business Fair, Orlando, Fla.June 21–23, 2016: OMWI exhibited at event with nearly 4,000 attendees and conducted matchmaking sessions with eight WOB representatives.
n NCMA World Congress, Orlando, Fla. July 26–28, 2016: OMWI conducted matchmaking sessions with seven MWOB representatives.
n Elite Service-Disabled Veteran-Owned Business Conference, San Antonio, Texas August 24–25, 2016: OMWI exhibited and presented during panel discussing supplier diversity to 250 attendees and conducted matchmaking session with eight MWOB representatives.
n Congressional Black Caucus Foundation Annual Legislative Conference, Washington, D.C. September 15–17, 2016: OMWI exhibited at event with over 9,000 attendees.

Office of Minority and Women Inclusion44
2016 Annual Report to Congress | Appendixes
OMWI representatives also provided technical assistance to small disadvantaged businesses33 and small WOBs at the following vendor outreach sessions (VOS) hosted by the Treasury Office of Small and Disadvantaged Business Utilization in Washington, D.C.:
n Treasury VOS November 17, 2015. Matchmaking sessions with 17 representatives (five MOBs, four MWOBs, and two WOBs).
n Treasury VOS January 6, 2016. Matchmaking sessions with 14 representatives (10 MOBs, four MWOBs, and three WOBs).
33 A small disadvantaged business is a small business that is at least 51 percent owned by one or more individuals who are both socially and economically disadvantaged. The term “socially disadvantaged” may include members of the following designated groups: Asian Americans, Black Americans, Hispanic Americans, Native Americans, and members of other groups designated by the Small Business Administration. (See 12 CFR 124.103.)
n Treasury VOS March 2, 2016 (focus on WOBs). Matchmaking sessions with 12 representatives (four MWOBs and eight WOBs).
n Treasury VOS June 3, 2016. Matchmaking sessions with 10 representatives (five MOBs, three MWOBs, and one WOB).
n Treasury VOS July 13, 2016. Matchmaking sessions with 11 representatives (five MOBs, three MWOBs, and one WOB).
n Treasury VOS August 10, 2016. Matchmaking sessions with 13 representatives (five MOBs, three MWOBs, and two WOBs).

Office of the Comptroller of the Currency 45
Appendixes | 2016 Annual Report to Congress
APPENDIX F: AWARDS BY DEMOGRAPHIC GROUP IN THE OCC’S TOP SEVEN NAICS CODES, FY 2016
NAICS Codes and Descriptions541519 518210 541512 531210 524114 541611 541612
Other computer related services
Data processing, hosting, and
related services
Computer systems design services
Offices of real estate agents and
brokers
Direct health and medical
insurance carriers
Administrative management and general management
consulting services
Human resources consulting services
Number of businesses with OCC awards in NAICS
78 14 8 1 2 41 10
Percentage of total OCC awards 41.4 14.1 10.5 10.0 4.1 2.7 1.5
Category
$ A
war
ds
% A
war
ded
$ A
war
ds
% A
war
ded
$ A
war
ds
% A
war
ded
$ A
war
ds
% A
war
ded
$ A
war
ds
% A
war
ded
$ A
war
ds
% A
war
ded
$ A
war
ds
% A
war
ded
Total OCC awards in NAICS 58,100,733.44 41.4 19,730,354.74 14.1 14,723,713.86 10.5 14,050,000.00 10.0 5,779,595.77 4.1 3,737,273.54 2.7 2,063,849.39 1.5
Minority- or women-owned 31,043,109.66 53.4 0.00 0.0 3,581,813.17 24.3 0.00 0.0 0.00 0.0 1,805,639.66 48.3 1,699,172.56 82.3
Minority-owned 25,523,930.64 43.9 0.00 0.0 3,581,813.17 24.3 0.00 0.0 0.00 0.0 1,415,681.68 37.9 1,443,537.71 69.9
Women-owned 10,043,423.61 17.3 0.00 0.0 0.00 0.0 0.00 0.0 0.00 0.0 393,397.98 10.5 1,699,172.56 82.3
Asian American-owned 15,412,035.83 26.5 0.00 0.0 411,851.20 2.8 0.00 0.0 0.00 0.0 25,250.00 0.7 0.00 0.0
Black American-owned 471,953.48 0.8 0.00 0.0 2,844,861.97 19.3 0.00 0.0 0.00 0.0 107,703.86 2.9 1,443,537.71 69.9
Hispanic American-owned 1,040,488.24 1.8 0.00 0.0 325,100.00 2.2 0.00 0.0 0.00 0.0 648,966.08 17.4 0.00 0.0
Native American-owned 4,890,494.20 8.4 0.00 0.0 0.00 0.0 0.00 0.0 0.00 0.0 633,761.74 17.0 0.00 0.0
Other minority-owned 4,162,945.11 7.2 0.00 0.0 0.00 0.0 0.00 0.0 0.00 0.0 0.00 0.0 0.00 0.0
Source: FPDS-NG for FY 2016 and SAM Entity Management Extracts for September 2016.
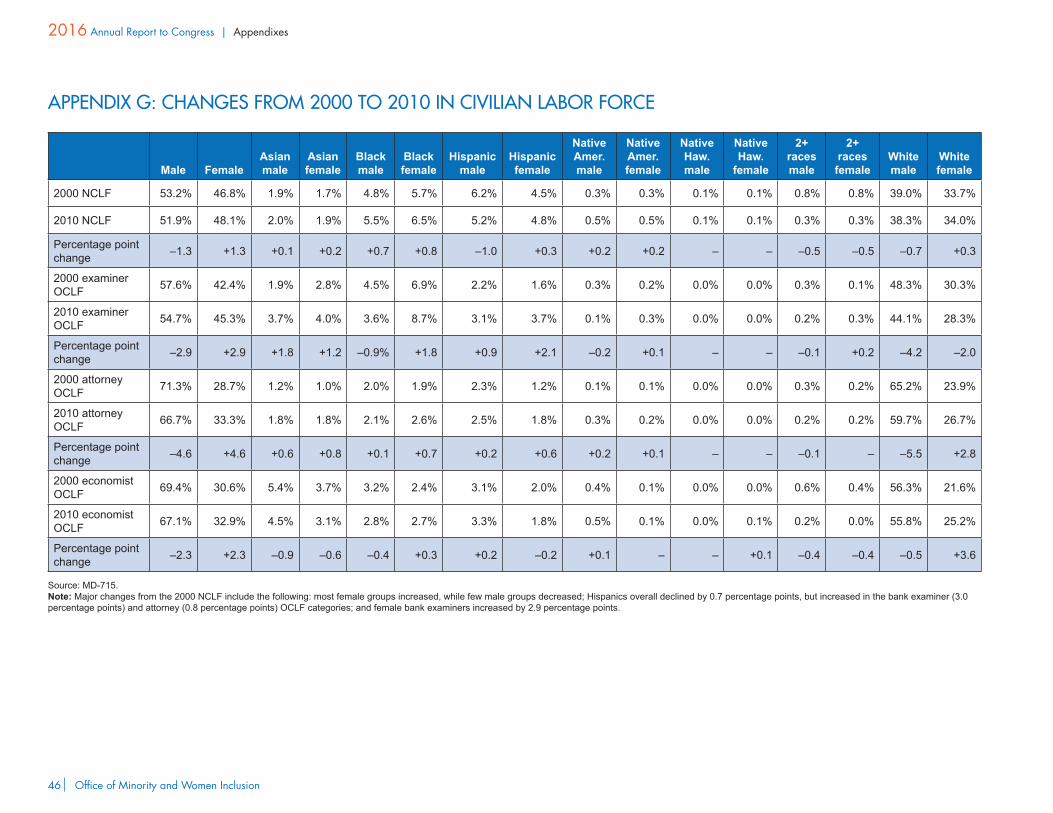
Office of Minority and Women Inclusion46
2016 Annual Report to Congress | Appendixes
APPENDIX G: CHANGES FROM 2000 TO 2010 IN CIVILIAN LABOR FORCE
Male FemaleAsian male
Asian female
Black male
Black female
Hispanic male
Hispanic female
Native Amer. male
Native Amer. female
Native Haw. male
Native Haw.
female
2+ races male
2+ races female
White male
White female
2000 NCLF 53.2% 46.8% 1.9% 1.7% 4.8% 5.7% 6.2% 4.5% 0.3% 0.3% 0.1% 0.1% 0.8% 0.8% 39.0% 33.7%
2010 NCLF 51.9% 48.1% 2.0% 1.9% 5.5% 6.5% 5.2% 4.8% 0.5% 0.5% 0.1% 0.1% 0.3% 0.3% 38.3% 34.0%
Percentage point change –1.3 +1.3 +0.1 +0.2 +0.7 +0.8 –1.0 +0.3 +0.2 +0.2 – – –0.5 –0.5 –0.7 +0.3
2000 examiner OCLF 57.6% 42.4% 1.9% 2.8% 4.5% 6.9% 2.2% 1.6% 0.3% 0.2% 0.0% 0.0% 0.3% 0.1% 48.3% 30.3%
2010 examiner OCLF 54.7% 45.3% 3.7% 4.0% 3.6% 8.7% 3.1% 3.7% 0.1% 0.3% 0.0% 0.0% 0.2% 0.3% 44.1% 28.3%
Percentage point change –2.9 +2.9 +1.8 +1.2 –0.9% +1.8 +0.9 +2.1 –0.2 +0.1 – – –0.1 +0.2 –4.2 –2.0
2000 attorney OCLF 71.3% 28.7% 1.2% 1.0% 2.0% 1.9% 2.3% 1.2% 0.1% 0.1% 0.0% 0.0% 0.3% 0.2% 65.2% 23.9%
2010 attorney OCLF 66.7% 33.3% 1.8% 1.8% 2.1% 2.6% 2.5% 1.8% 0.3% 0.2% 0.0% 0.0% 0.2% 0.2% 59.7% 26.7%
Percentage point change –4.6 +4.6 +0.6 +0.8 +0.1 +0.7 +0.2 +0.6 +0.2 +0.1 – – –0.1 – –5.5 +2.8
2000 economist OCLF 69.4% 30.6% 5.4% 3.7% 3.2% 2.4% 3.1% 2.0% 0.4% 0.1% 0.0% 0.0% 0.6% 0.4% 56.3% 21.6%
2010 economist OCLF 67.1% 32.9% 4.5% 3.1% 2.8% 2.7% 3.3% 1.8% 0.5% 0.1% 0.0% 0.1% 0.2% 0.0% 55.8% 25.2%
Percentage point change –2.3 +2.3 –0.9 –0.6 –0.4 +0.3 +0.2 –0.2 +0.1 – – +0.1 –0.4 –0.4 –0.5 +3.6
Source: MD-715.Note: Major changes from the 2000 NCLF include the following: most female groups increased, while few male groups decreased; Hispanics overall declined by 0.7 percentage points, but increased in the bank examiner (3.0 percentage points) and attorney (0.8 percentage points) OCLF categories; and female bank examiners increased by 2.9 percentage points.

Office of the Comptroller of the Currency 47
Appendixes | 2016 Annual Report to Congress
APPENDIX H: OCC WORKFORCE PROFILE, FIVE-YEAR TREND
Participation rates of EEO groups are in percentages.
Male Female Minority Asian Black HispanicNative
AmericanNative
Hawaiian 2+ races WhiteFY 2012 54.1 45.9a 30.5 6.2 16.0 6.3a 0.8 0.2 1.1a 69.5a
2000 NCLF 53.2 46.8 27.3 3.6 10.5 10.7 0.6 0.2 1.6 72.7FY 2013 54.4 45.6a 32.1 7.4 16.7 6.6a 1.0 0.1a 0.3a 67.9a
FY 2014 54.9 45.1a 32.4 7.7 16.8 6.6a 0.9a 0.1a 0.3a 67.6a
FY 2015 54.9 45.1a 33.1 7.8 17.2 6.8a 0.9a 0.2 0.3a 66.9a
FY 2016 54.8 45.2a 34.2 8.4 17.6 6.9a 0.9a 0.2 0.3a 65.8a
2010 NCLF 51.9 48.1 27.7 3.9 12.0 10.0 1.0 0.2 0.6 72.3Percentage point change from FY 2012 to FY 2016 +0.7 -0.7 +3.7 +2.2 +1.6 +0.6 +0.1 - -0.8 -3.7
Source: MD-715 workforce data table as of September 30, 2016.a EEO groups participating at rates below the 2010 and 2000 NCLF rates.Note: The 2010 NCLF was used as a comparator starting with the FY 2013 workforce participation rates, while the 2000 NCLF was used as a comparator for FY 2012.

Office of Minority and Women Inclusion48
2016 Annual Report to Congress | Appendixes
APPENDIX I: OCC WORKFORCE PROFILE AS OF SEPTEMBER 30, 2016
Participation rates of EEO groups are in percentages.
Total Male FemaleAsian male
Asian female
Black male
Black female
Hispanic male
Hispanic female
Nat. Amer. male
Nat. Amer. female
Nat. Haw. male
Nat. Haw.
female
2+ races male
2+ races female
White male
White female
OCC workforce 3,958 54.8 45.2a 4.7 3.7 6.7 10.9 3.6a 3.2a 0.4a 0.5 0.1 0.1 0.1a 0.2a 39.2 26.6a
2010 NCLF 51.9 48.1 2.0 1.9 5.5 6.5 5.2 4.8 0.5 0.5 0.1 0.1 0.3 0.3 38.3 34.0
Bank examiner 2,616 61.3 38.7a 3.6a 2.8a 6.0 6.8a 3.8 2.7a 0.5 0.4 0.1 0.1 0.1a 0.1a 47.2 25.8a
2010 bank examiner OCLF 54.7 45.3 3.7 4.0 3.6 8.7 3.1 3.7 0.1 0.3 0.0 0.0 0.2 0.3 44.1 28.3
Attorney 177 52.0a 48.0 2.8 4.0 2.3 3.4 5.1 2.8 0.6 0.0a 0.0 0.0 0.0a 0.0a 41.2a 37.9
2010 attorney OCLF 66.7 33.3 1.8 1.8 2.1 2.6 2.5 1.8 0.3 0.2 0.0 0.0 0.2 0.2 59.7 26.7
Economist 92 66.3a 33.7 18.5 15.2 3.3 0.0a 3.3 1.1a 0.0a 0.0a 0.0 0.0a 0.0a 0.0 41.3a 17.4a
2010 economist OCLF 67.1 32.9 4.5 3.1 2.8 2.7 3.3 1.8 0.5 0.1 0.0 0.1 0.2 0.0 55.8 25.2
All other series 1,073 38.5a 61.5 6.5 4.9 9.3 23.1 3.0a 4.8 0.2a 0.7 0.2 0.3 0.1a 0.5 19.2a 27.4a
2010 NCLF 51.9 48.1 2.0 1.9 5.5 6.5 5.2 4.8 0.5 0.5 0.1 0.1 0.3 0.3 38.3 34.0
Source: MD-715 workforce data table as of September 30, 2016.a EEO groups participating at rates below the 2010 NCLF and OCLF rates.
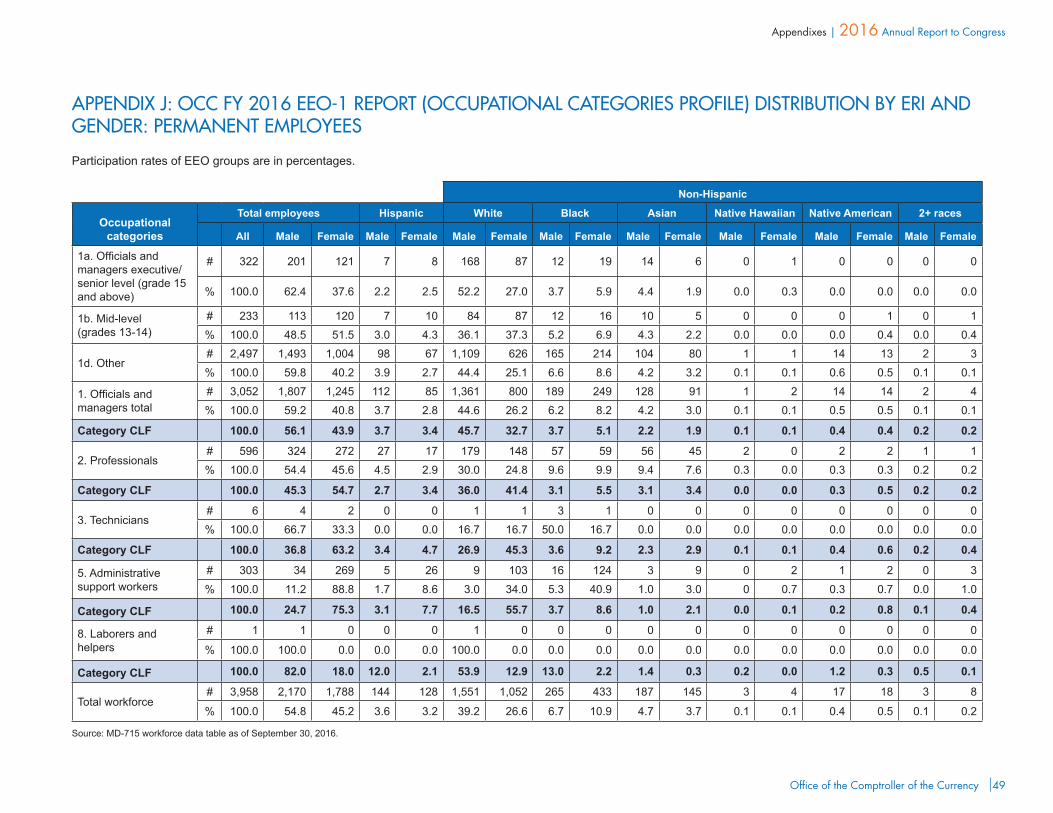
Office of the Comptroller of the Currency 49
Appendixes | 2016 Annual Report to Congress
APPENDIX J: OCC FY 2016 EEO-1 REPORT (OCCUPATIONAL CATEGORIES PROFILE) DISTRIBUTION BY ERI AND GENDER: PERMANENT EMPLOYEES
Participation rates of EEO groups are in percentages.
Non-Hispanic
Occupational categories
Total employees Hispanic White Black Asian Native Hawaiian Native American 2+ races
All Male Female Male Female Male Female Male Female Male Female Male Female Male Female Male Female
1a. Officials and managers executive/senior level (grade 15 and above)
# 322 201 121 7 8 168 87 12 19 14 6 0 1 0 0 0 0
% 100.0 62.4 37.6 2.2 2.5 52.2 27.0 3.7 5.9 4.4 1.9 0.0 0.3 0.0 0.0 0.0 0.0
1b. Mid-level (grades 13-14)
# 233 113 120 7 10 84 87 12 16 10 5 0 0 0 1 0 1
% 100.0 48.5 51.5 3.0 4.3 36.1 37.3 5.2 6.9 4.3 2.2 0.0 0.0 0.0 0.4 0.0 0.4
1d. Other# 2,497 1,493 1,004 98 67 1,109 626 165 214 104 80 1 1 14 13 2 3
% 100.0 59.8 40.2 3.9 2.7 44.4 25.1 6.6 8.6 4.2 3.2 0.1 0.1 0.6 0.5 0.1 0.1
1. Officials and managers total
# 3,052 1,807 1,245 112 85 1,361 800 189 249 128 91 1 2 14 14 2 4
% 100.0 59.2 40.8 3.7 2.8 44.6 26.2 6.2 8.2 4.2 3.0 0.1 0.1 0.5 0.5 0.1 0.1
Category CLF 100.0 56.1 43.9 3.7 3.4 45.7 32.7 3.7 5.1 2.2 1.9 0.1 0.1 0.4 0.4 0.2 0.2
2. Professionals# 596 324 272 27 17 179 148 57 59 56 45 2 0 2 2 1 1
% 100.0 54.4 45.6 4.5 2.9 30.0 24.8 9.6 9.9 9.4 7.6 0.3 0.0 0.3 0.3 0.2 0.2
Category CLF 100.0 45.3 54.7 2.7 3.4 36.0 41.4 3.1 5.5 3.1 3.4 0.0 0.0 0.3 0.5 0.2 0.2
3. Technicians# 6 4 2 0 0 1 1 3 1 0 0 0 0 0 0 0 0
% 100.0 66.7 33.3 0.0 0.0 16.7 16.7 50.0 16.7 0.0 0.0 0.0 0.0 0.0 0.0 0.0 0.0
Category CLF 100.0 36.8 63.2 3.4 4.7 26.9 45.3 3.6 9.2 2.3 2.9 0.1 0.1 0.4 0.6 0.2 0.4
5. Administrative support workers
# 303 34 269 5 26 9 103 16 124 3 9 0 2 1 2 0 3
% 100.0 11.2 88.8 1.7 8.6 3.0 34.0 5.3 40.9 1.0 3.0 0 0.7 0.3 0.7 0.0 1.0
Category CLF 100.0 24.7 75.3 3.1 7.7 16.5 55.7 3.7 8.6 1.0 2.1 0.0 0.1 0.2 0.8 0.1 0.4
8. Laborers and helpers
# 1 1 0 0 0 1 0 0 0 0 0 0 0 0 0 0 0
% 100.0 100.0 0.0 0.0 0.0 100.0 0.0 0.0 0.0 0.0 0.0 0.0 0.0 0.0 0.0 0.0 0.0
Category CLF 100.0 82.0 18.0 12.0 2.1 53.9 12.9 13.0 2.2 1.4 0.3 0.2 0.0 1.2 0.3 0.5 0.1
Total workforce# 3,958 2,170 1,788 144 128 1,551 1,052 265 433 187 145 3 4 17 18 3 8
% 100.0 54.8 45.2 3.6 3.2 39.2 26.6 6.7 10.9 4.7 3.7 0.1 0.1 0.4 0.5 0.1 0.2
Source: MD-715 workforce data table as of September 30, 2016.
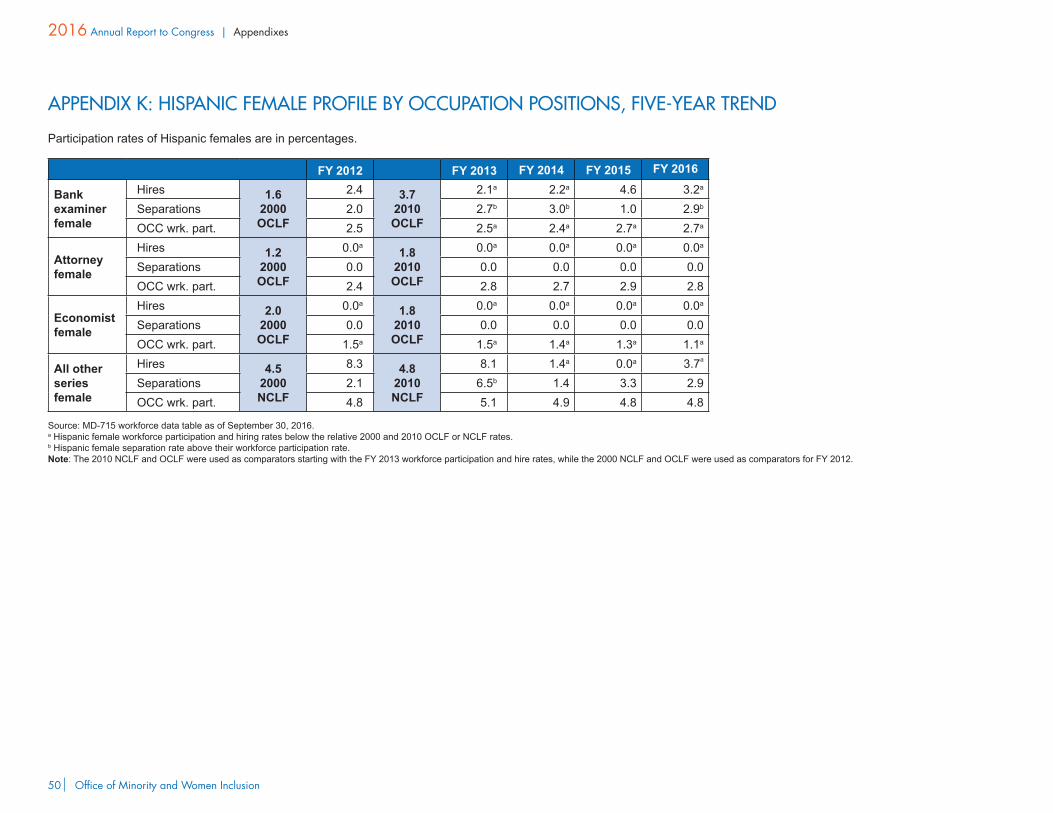
Office of Minority and Women Inclusion50
2016 Annual Report to Congress | Appendixes
APPENDIX K: HISPANIC FEMALE PROFILE BY OCCUPATION POSITIONS, FIVE-YEAR TREND
Participation rates of Hispanic females are in percentages.
FY 2012 FY 2013 FY 2014 FY 2015 FY 2016
Bank examiner female
Hires 1.6 2000 OCLF
2.4 3.7 2010 OCLF
2.1a 2.2a 4.6 3.2a
Separations 2.0 2.7b 3.0b 1.0 2.9b
OCC wrk. part. 2.5 2.5a 2.4a 2.7a 2.7a
Attorney female
Hires 1.2 2000 OCLF
0.0a1.8
2010 OCLF
0.0a 0.0a 0.0a 0.0a
Separations 0.0 0.0 0.0 0.0 0.0OCC wrk. part. 2.4 2.8 2.7 2.9 2.8
Economist female
Hires 2.0 2000 OCLF
0.0a1.8
2010 OCLF
0.0a 0.0a 0.0a 0.0a
Separations 0.0 0.0 0.0 0.0 0.0OCC wrk. part. 1.5a 1.5a 1.4a 1.3a 1.1a
All other series female
Hires 4.5 2000 NCLF
8.3 4.8 2010 NCLF
8.1 1.4a 0.0a 3.7a
Separations 2.1 6.5b 1.4 3.3 2.9OCC wrk. part. 4.8 5.1 4.9 4.8 4.8
Source: MD-715 workforce data table as of September 30, 2016.a Hispanic female workforce participation and hiring rates below the relative 2000 and 2010 OCLF or NCLF rates.b Hispanic female separation rate above their workforce participation rate.Note: The 2010 NCLF and OCLF were used as comparators starting with the FY 2013 workforce participation and hire rates, while the 2000 NCLF and OCLF were used as comparators for FY 2012.

Office of the Comptroller of the Currency 51
Appendixes | 2016 Annual Report to Congress
APPENDIX L: HISPANIC MALE PROFILE BY OCCUPATION POSITIONS, FIVE-YEAR TREND
Participation rates of Hispanic males are in percentages.
FY 2012 FY 2013 FY 2014 FY 2015 FY 2016
Bank examiner male
Hires 2.2 2000 OCLF
3.2 3.1 2010 OCLF
5.7 5.2 5.6 5.5
Separations 2.4 2.1 6.0b 5.2b 5.7b
OCC wrk. part. 3.5 3.8 3.8 3.8 3.8
Attorney male
Hires 2.3 2000 OCLF
14.3 2.5 2010 OCLF
0.0a 20.0 0.0a 25.0
Separations 0.0 0.0 11.1b 7.1b 0.0
OCC wrk. part. 4.7 4.5 4.9 4.6 5.1
Economist male
Hires 3.1 2000 OCLF
0.0a 3.3
2010 OCLF
20.0 14.3 0.0a 7.7
Separations 0.0 20.0b 16.7b 0.0 0.0
OCC wrk. part. 3.0a 2.9a 2.8a 2.7a 3.3
All other series male
Hires 6.2 2000 NCLF
6.3 5.2 2010 NCLF
2.4a 4.1a 4.2a 5.6
Separations 0.0 0.0 0.0 4.3b 2.9
OCC wrk. part. 2.2a 2.3a 2.8a 2.7a 3.0a
Source: MD-715 workforce data table as of September 30, 2016.a Hispanic male workforce participation and hiring rates below the relative 2000 and 2010 OCLF or NCLF rates.b Hispanic male separation rate above their workforce participation rate. Note: The 2010 NCLF and OCLF were used as comparators starting with the FY 2013 workforce participation and hire rates, while the 2000 NCLF and OCLF were used as comparators for FY 2012.
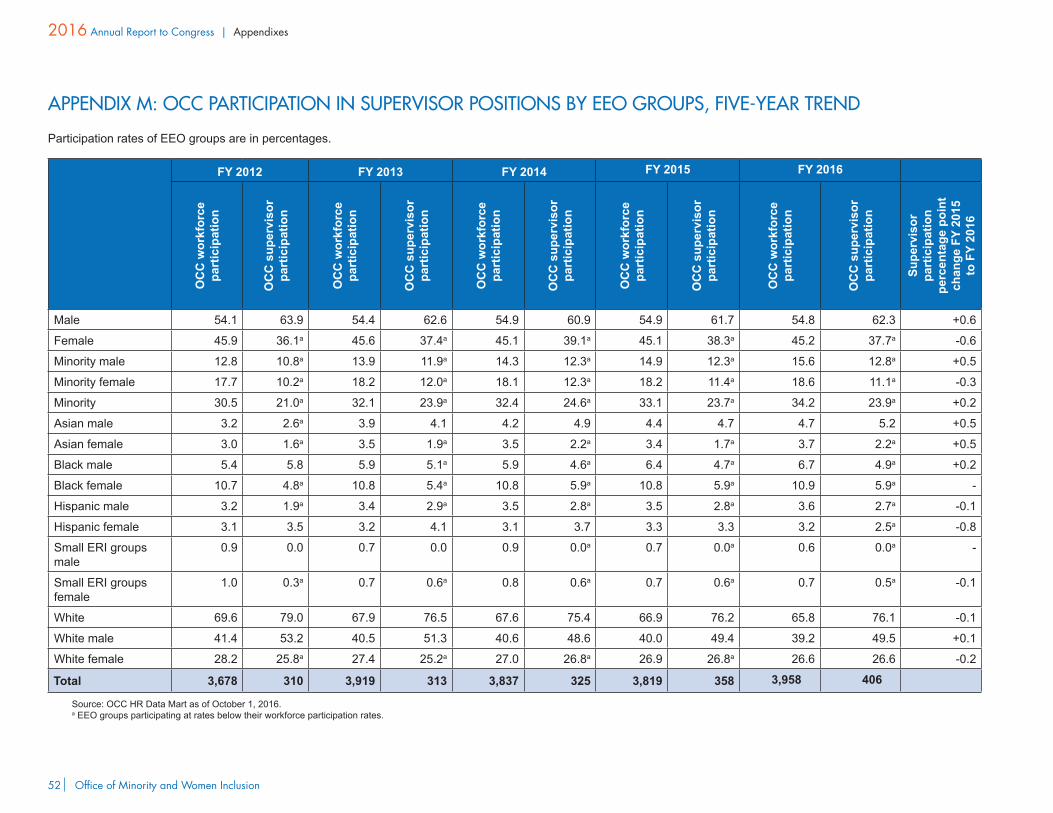
Office of Minority and Women Inclusion52
2016 Annual Report to Congress | Appendixes
APPENDIX M: OCC PARTICIPATION IN SUPERVISOR POSITIONS BY EEO GROUPS, FIVE-YEAR TREND
Participation rates of EEO groups are in percentages.
FY 2012 FY 2013 FY 2014 FY 2015 FY 2016
OC
C w
orkf
orce
pa
rtic
ipat
ion
OC
C s
uper
viso
r pa
rtic
ipat
ion
OC
C w
orkf
orce
pa
rtic
ipat
ion
OC
C s
uper
viso
r pa
rtic
ipat
ion
OC
C w
orkf
orce
pa
rtic
ipat
ion
OC
C s
uper
viso
r pa
rtic
ipat
ion
OC
C w
orkf
orce
pa
rtic
ipat
ion
OC
C s
uper
viso
r pa
rtic
ipat
ion
OC
C w
orkf
orce
pa
rtic
ipat
ion
OC
C s
uper
viso
r pa
rtic
ipat
ion
Supe
rvis
or
part
icip
atio
n pe
rcen
tage
poi
nt
chan
ge F
Y 20
15
to F
Y 20
16
Male 54.1 63.9 54.4 62.6 54.9 60.9 54.9 61.7 54.8 62.3 +0.6
Female 45.9 36.1a 45.6 37.4a 45.1 39.1a 45.1 38.3a 45.2 37.7a -0.6
Minority male 12.8 10.8a 13.9 11.9a 14.3 12.3a 14.9 12.3a 15.6 12.8a +0.5
Minority female 17.7 10.2a 18.2 12.0a 18.1 12.3a 18.2 11.4a 18.6 11.1a -0.3
Minority 30.5 21.0a 32.1 23.9a 32.4 24.6a 33.1 23.7a 34.2 23.9a +0.2
Asian male 3.2 2.6a 3.9 4.1 4.2 4.9 4.4 4.7 4.7 5.2 +0.5
Asian female 3.0 1.6a 3.5 1.9a 3.5 2.2a 3.4 1.7a 3.7 2.2a +0.5
Black male 5.4 5.8 5.9 5.1a 5.9 4.6a 6.4 4.7a 6.7 4.9a +0.2
Black female 10.7 4.8a 10.8 5.4a 10.8 5.9a 10.8 5.9a 10.9 5.9a -
Hispanic male 3.2 1.9a 3.4 2.9a 3.5 2.8a 3.5 2.8a 3.6 2.7a -0.1
Hispanic female 3.1 3.5 3.2 4.1 3.1 3.7 3.3 3.3 3.2 2.5a -0.8
Small ERI groups male
0.9 0.0 0.7 0.0 0.9 0.0a 0.7 0.0a 0.6 0.0a -
Small ERI groups female
1.0 0.3a 0.7 0.6a 0.8 0.6a 0.7 0.6a 0.7 0.5a -0.1
White 69.6 79.0 67.9 76.5 67.6 75.4 66.9 76.2 65.8 76.1 -0.1
White male 41.4 53.2 40.5 51.3 40.6 48.6 40.0 49.4 39.2 49.5 +0.1
White female 28.2 25.8a 27.4 25.2a 27.0 26.8a 26.9 26.8a 26.6 26.6 -0.2
Total 3,678 310 3,919 313 3,837 325 3,819 358 3,958 406
Source: OCC HR Data Mart as of October 1, 2016. a EEO groups participating at rates below their workforce participation rates.
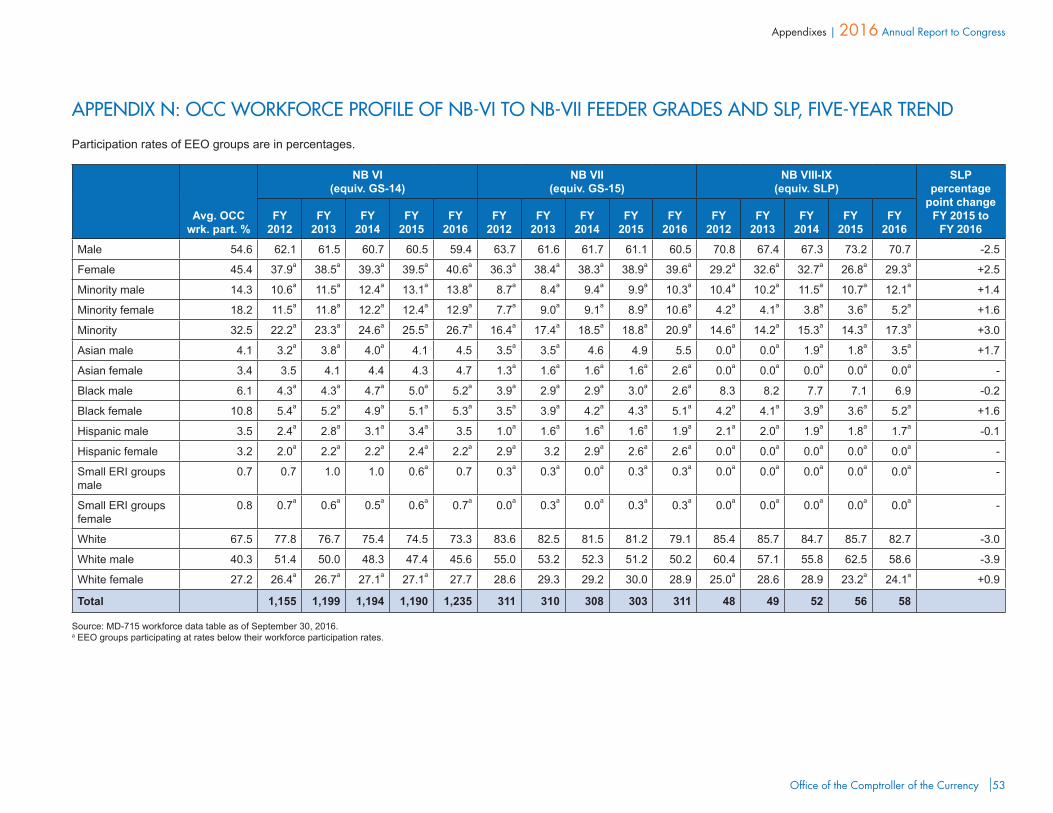
Office of the Comptroller of the Currency 53
Appendixes | 2016 Annual Report to Congress
APPENDIX N: OCC WORKFORCE PROFILE OF NB-VI TO NB-VII FEEDER GRADES AND SLP, FIVE-YEAR TREND
Participation rates of EEO groups are in percentages.
Avg. OCC wrk. part. %
NB VI (equiv. GS-14)
NB VII (equiv. GS-15)
NB VIII-IX (equiv. SLP)
SLP percentage
point change FY 2015 to
FY 2016FY
2012FY
2013FY
2014FY
2015FY
2016FY
2012FY
2013FY
2014FY
2015FY
2016FY
2012FY
2013FY
2014FY
2015FY
2016
Male 54.6 62.1 61.5 60.7 60.5 59.4 63.7 61.6 61.7 61.1 60.5 70.8 67.4 67.3 73.2 70.7 -2.5
Female 45.4 37.9a 38.5a 39.3a 39.5a 40.6a 36.3a 38.4a 38.3a 38.9a 39.6a 29.2a 32.6a 32.7a 26.8a 29.3a +2.5
Minority male 14.3 10.6a 11.5a 12.4a 13.1a 13.8a 8.7a 8.4a 9.4a 9.9a 10.3a 10.4a 10.2a 11.5a 10.7a 12.1a +1.4
Minority female 18.2 11.5a 11.8a 12.2a 12.4a 12.9a 7.7a 9.0a 9.1a 8.9a 10.6a 4.2a 4.1a 3.8a 3.6a 5.2a +1.6
Minority 32.5 22.2a 23.3a 24.6a 25.5a 26.7a 16.4a 17.4a 18.5a 18.8a 20.9a 14.6a 14.2a 15.3a 14.3a 17.3a +3.0
Asian male 4.1 3.2a 3.8a 4.0a 4.1 4.5 3.5a 3.5a 4.6 4.9 5.5 0.0a 0.0a 1.9a 1.8a 3.5a +1.7
Asian female 3.4 3.5 4.1 4.4 4.3 4.7 1.3a 1.6a 1.6a 1.6a 2.6a 0.0a 0.0a 0.0a 0.0a 0.0a -
Black male 6.1 4.3a 4.3a 4.7a 5.0a 5.2a 3.9a 2.9a 2.9a 3.0a 2.6a 8.3 8.2 7.7 7.1 6.9 -0.2
Black female 10.8 5.4a 5.2a 4.9a 5.1a 5.3a 3.5a 3.9a 4.2a 4.3a 5.1a 4.2a 4.1a 3.9a 3.6a 5.2a +1.6
Hispanic male 3.5 2.4a 2.8a 3.1a 3.4a 3.5 1.0a 1.6a 1.6a 1.6a 1.9a 2.1a 2.0a 1.9a 1.8a 1.7a -0.1
Hispanic female 3.2 2.0a 2.2a 2.2a 2.4a 2.2a 2.9a 3.2 2.9a 2.6a 2.6a 0.0a 0.0a 0.0a 0.0a 0.0a -
Small ERI groups male
0.7 0.7 1.0 1.0 0.6a 0.7 0.3a 0.3a 0.0a 0.3a 0.3a 0.0a 0.0a 0.0a 0.0a 0.0a -
Small ERI groups female
0.8 0.7a 0.6a 0.5a 0.6a 0.7a 0.0a 0.3a 0.0a 0.3a 0.3a 0.0a 0.0a 0.0a 0.0a 0.0a -
White 67.5 77.8 76.7 75.4 74.5 73.3 83.6 82.5 81.5 81.2 79.1 85.4 85.7 84.7 85.7 82.7 -3.0
White male 40.3 51.4 50.0 48.3 47.4 45.6 55.0 53.2 52.3 51.2 50.2 60.4 57.1 55.8 62.5 58.6 -3.9
White female 27.2 26.4a 26.7a 27.1a 27.1a 27.7 28.6 29.3 29.2 30.0 28.9 25.0a 28.6 28.9 23.2a 24.1a +0.9
Total 1,155 1,199 1,194 1,190 1,235 311 310 308 303 311 48 49 52 56 58
Source: MD-715 workforce data table as of September 30, 2016.a EEO groups participating at rates below their workforce participation rates.
Office of Minority and Women Inclusion54
2016 Annual Report to Congress | Appendixes
APPENDIX O: EMPLOYEE NETWORK GROUPS
The OCC supports the formation and operation of ENGs to
n allow employees to come together to discuss workplace issues of concern and recommend potential solutions.
n provide input to leadership on matters related to diversity in the workplace.
n promote discussion of views relating to the interests of the group that will contribute to enhanced employee engagement, effectiveness, and agency operations.
n provide leadership opportunities to the officers and members.
The OCC recognizes ENGs as a means of building a more productive and respectful work environment for employees. ENGs are groups of employees who form to address workplace issues that are common to members of that group. The ENGs are governed by a policy that addresses formation and purpose, roles and responsibilities, funding, and permissible
and impermissible activities. Each ENG is required to have a mission statement, bylaws, and purposeful activities and programs. Each ENG has an EC sponsor who provides guidance, advocacy, and support for the group’s activities and programs. The OMWI assists in the formation of new ENGs and provides guidance and support for the groups’ activities and programs to ensure alignment with agency initiatives and objectives for a diverse, inclusive workforce.
The OCC greatly benefits from the input of its six ENGs: HOLA; TWN; NAPA; CARE; PRIDE; and Crossroads. Concerted efforts are under way to establish a veterans-related ENG.
The ENGs provide their perspectives on diversity at the OCC and develop programs and activities to assist in the OCC’s recruitment, career development, and retention efforts. All of the ENGs are active and integral components of the OCC’s diversity and inclusion initiatives. In fiscal year 2016, the membership in ENGs was approximately 1,832, or 46.3 percent of OCC employees.
Office of the Comptroller of the Currency 55
Appendixes | 2016 Annual Report to Congress
APPENDIX P: ABBREVIATIONS
ACAMS Association of Certified Anti-Money Laundering Specialists
ABA/BSA American Bankers Association/Bank Secrecy Act
ADR Alternative dispute resolution
ALPFA Association of Latin Professionals in Finance and Accounting
BAP Beta Alpha Psi
CARE Coalition of African-American Regulatory Employees
CFPB Consumer Financial Protection Bureau
CBA Consumer Bankers Association
CPSD Certified Professional in Supplier Diversity
Crossroads Generational Crossroads
CSDP Certified Supplier Diversity Professional
Dodd–Frank Dodd–Frank Wall Street Reform and Consumer Protection Act of 2010
EC Executive Committee
EEO Equal employment opportunity
EEO-1 EEOC’s Standard Form 100
EEOC Equal Employment Opportunity Commission
ENG Employee network group
ERI Ethnicity and race indicator
FAR Federal Acquisition Regulation
FDIC Federal Deposit Insurance Corporation
FEVS Federal Employee Viewpoint Survey
FHFA Federal Housing Finance Agency
FIRMA Fiduciary and Investment Risk Management Association
FLEC Financial Literacy and Education Commission
FPDS–NG Federal Procurement Data System–Next Generation
FTR Federal Thrift Regulator
HC Human Capital
HR Human Resources
HOLA Hispanic Organization for Leadership and Advancement
LE&OD Leadership, Executive, and Organizational Development
LBS Large Bank Supervision
MCBS Midsize and Community Bank Supervision

Office of Minority and Women Inclusion56
2016 Annual Report to Congress | Appendixes
MOB Minority-owned business
MWOB Minority-owned or women-owned business
NACE National Association of Colleges and Employers
NAICS North American Industry Classification System
NAPA Network of Asian Pacific Americans
NBE National Bank Examiner
NCLF National civilian labor force
NCUA National Credit Union Administration
OCC Office of the Comptroller of the Currency
OCLF Occupational civilian labor force
OIG Office of Inspector General
OM Office of Management
OMWI Office of Minority and Women Inclusion
PRIDE Gay, lesbian, transgender, and bisexual employees’ network group
RCLF Relevant civilian labor force
SAM System for Award Management
SEC Securities and Exchange Commission
SLP Senior-level position
SUNY State University of New York
TWN The Women’s Network
UCE Uniform Commission Examination
WBENC Women’s Business Enterprise National Council
WOB Women-owned business
VOS Vendor outreach session