omv factbook 2017 · omv is an international, integrated oil and gas company. upstream carries out...
TRANSCRIPT

OMV Aktiengesellschaft
FACTBOOK 2017
2 LETTER FROM THE CEO
4 1 — OMV GROUP6 OMV – at a Glance8 Management Board and Corporate Governance
10 Market Environment11 OMV Strategy 202516 Active Portfolio Management18 Innovation & Technology20 Digitalization21 Investments22 Operational Excellence and Cost Efficiency23 Employees24 Integrated Business Model26 Sustainability
28 2 — UPSTREAM 30 Upstream – at a Glance32 Central Eastern Europe34 Middle East and Africa36 North Sea37 Russia38 Australasia
40 3 — DOWNSTREAM42 Downstream Oil50 Downstream Gas
54 4 — FINANCIALS56 OMV on the Capital Markets59 Financing61 Financial Five-Year Summary
66 Abbreviations and Definitions68 Investor Relations Team69 Contacts and Imprint
Contents
Cover picture: OMV high-quality fuels enable mobility – our contribution for a better life.
The OMV Factbook 2017 was published in July 2018.
Note: OMV’s income statement was restructured as of 2017; for comparison purposes only, figures from previous periods are presented in the same structure; figures in tables and graphs throughout the document may not add up due to rounding differences

Integrated and balanced portfolio of Upstream and Downstream ensures financial resilience
High-quality assets and efficient operations in Downstream
Geographically focused and low-cost Upstream assets
Strong organic free cash flow generation
Progressive dividend policy: committed to delivering attractive shareholder returns
Well positioned for long-term growth in attractive regions through strong partnerships
Why Invest in OMV?
1

Dear Investors and Analysts,It’s a great pleasure to present to you the second issue of the OMV Factbook. We want the Fact-book to provide you with a comprehensive picture of OMV Group and give you deeper insights into our two business segments and the drivers behind them. We hope you will find the Factbook useful and that it will help you to better understand our company.
2017 was a successful year for OMV. We made significant progress in further improving the quality of our portfolio, continued to lower cost and substantially improved earnings.
In Upstream, we divested our high-cost UK business and sold non-strategic assets in Tunisia and Romania. The acquisition of an approximately 25% stake in the Yuzhno Russkoye gas field at the end of 2017 was another important milestone in the execution of our strategy, significantly increasing production, lowering production cost and adding substantial reserves. In Downstream, we concluded the sale of OMV Petrol Ofisi, the Turkish retail business, and acquired a 40% stake in the e-mobility provider SMATRICS. Our company-wide cost reduction program was completed successfully, delivering cost savings of EUR 330 mn, considerably more than the original target of EUR 250 mn. We also further reduced our Upstream production cost to USD 8.8 per barrel.
Our clean CCS Operating Result almost doubled to EUR 3 bn. We delivered an organic free cash flow after dividends of EUR 1.2 bn and managed to further reduce our free cash flow break-even oil price after dividends to USD 25 per barrel, a leading value in our sector. Clean CCS earnings per share rose to almost EUR 5. With an increase of 57%, OMV shares showed a very strong performance. Total shareholder return amounted to 61%, substantially above relevant benchmarks. And we increased the dividend for the fiscal year 2017 by 25% to EUR 1.50 per share, the highest dividend ever paid.
At our Capital Markets Day in March 2018, we presented the OMV Strategy 2025. It builds on the proven concept of integration, which ensures strong cash flows and resilience. We will grow both our Upstream and Downstream businesses and substantially internationalize and diversify our production, processing and marketing of oil and gas. We will build a strong gas market presence in Europe. And, we will continue to improve our performance and extend our record of operational excellence. We strive to increase the clean CCS Operating Result to at least EUR 4 bn in 2020 and at least EUR 5 bn in 2025. The growth will be equally driven by Upstream and Downstream and shall be achieved both organically and through acquisitions.
In Upstream, we target production and reserves growth in defined core regions. We aim to increase production to 500 kboe/d by 2020 and 600 kboe/d by 2025 while the production cost will be reduced to below USD 8 per barrel. To ensure a reserve replacement rate of more than 100%, 1P reserves will be almost doubled to 2 bn boe by 2025. We strive to increase the share of natural gas in our portfolio to more than 50% in order to improve the carbon efficiency of our portfolio. The main growth regions are the Middle East and the new development region Australasia. I am very pleased that over recent months we have already achieved important milestones in the imple-mentation of our 2025 strategy. In March, we signed the acquisition of Shell’s upstream business in New Zealand, an important step towards developing Australasia into a new core region. In April, we acquired a 20% interest in two offshore oil fields in Abu Dhabi from our partner ADNOC. Both acquisitions will significantly increase OMV’s production and reserve base. In June, we further optimized our portfolio through the divestment of our Upstream business in Pakistan.
2
OMV FACTBOOK 2017 / LETTER FROM THE CEO
“ OMV is well positioned for profitable growth and committed to attractive shareholder returns.”
Rainer Seele
In Downstream Oil, we will further strengthen our competitive position in Europe. We will invest up to EUR 1 bn until 2025 in our European refineries to increase the production of petrochemical products and aviation fuels. Our refineries in Austria and Germany are best in class, consistently ranked in the top quartile of international benchmark studies. Building on this, we strive to export our successful business model as one of the leading European refiners to international growth mar kets such as the Middle East and Asia. OMV aims to nearly double its refining and petro-chemicals capacity by 2025. In Downstream Gas, we target to significantly expand our gas sales activities and intensify our focus on the sales of our own production. We want to increase our gas sales to over 20 billion cubic meters by 2025 and grow our market share in Germany to 10%.
OMV is right on track and well positioned for future profitable growth. Our integrated business model and geographically diversified growth strategy help us to offset fluctuations in the market, reduce geopolitical risks and move into new, attractive markets and regions. We strive for a positive free cash flow after dividends and a ROACE of at least 12%. A gearing ratio of no more than 30% ensures financial stability. Through our progressive dividend policy we will continue to reward shareholders.
The OMV management team and our more than 20,000 employees are committed to making the OMV Strategy 2025 a success. We thank you for your interest in OMV and look forward to continuing our dialogue with you.
Best regards,
Rainer Seele m.p.Chairman of the Executive Board and Chief Executive Officer OMV
3
OMV FACTBOOK 2017 / LETTER FROM THE CEO

OMV is an international, integrated oil and gas company with a balanced portfolio.
OMV is an international,integrated oil and gascompany with a balancedportfolio.
OMV FACTBOOK 2017 / OMV GROUP

OMV produces and markets oil and gas, innovative energy and high-end petrochemical solutions – in a responsible way. OMV has a balanced interna-tional Upstream portfolio, and its Downstream Oil and Gas business features a European footprint. In 2017, Group sales amounted to more than EUR 20 bn and year- end market capitalization was more than EUR 17 bn. The majority of OMV’s over 20,000 employees work at its integrated European sites.
FREE CASH FLOW AFTER DIVIDENDS (IN 2016: € 0.6 BN)
CLEAN CCS OPERATING RESULT (IN 2016: € 1.5 BN)
DIVIDEND + 25% COMPARED TO 2016
CLEAN CCS NET INCOME ATTRIBUTABLE TO STOCKHOLDERS (IN 2016: € 1.0 BN)
TOTAL SHAREHOLDER RETURN (IN 2016: 34%)
CASH FLOW FROM OPERATING ACTIVITIES (IN 2016: € 2.9 BN)
61 %
€ 3.0 bn € 1.0 bn
€ 1.6 bn € 1.50
€ 3.4 bn
OMV FACTBOOK 2017 / OMV GROUP
5
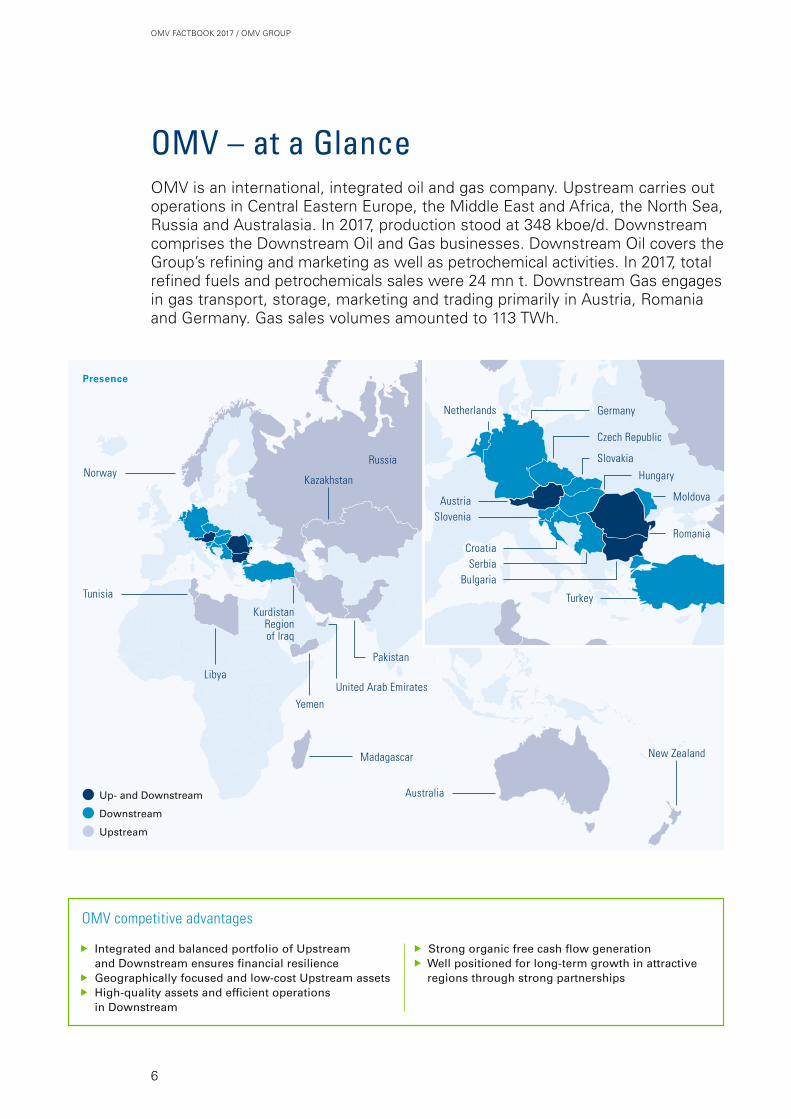
OMV – at a Glance OMV is an international, integrated oil and gas company. Upstream carries out operations in Central Eastern Europe, the Middle East and Africa, the North Sea, Russia and Australasia. In 2017, production stood at 348 kboe/d. Downstream comprises the Downstream Oil and Gas businesses. Downstream Oil covers the Group’s refining and marketing as well as petrochemical activities. In 2017, total refined fuels and petrochemicals sales were 24 mn t. Downstream Gas engages in gas transport, storage, marketing and trading primarily in Austria, Romania and Germany. Gas sales volumes amounted to 113 TWh.
Up- and Downstream
Downstream
Upstream
Libya
Tunisia
Norway
Madagascar
Australia
New Zealand
Yemen
United Arab Emirates
Pakistan
Russia
Kazakhstan
KurdistanRegion of Iraq
Presence
Netherlands
Turkey
CroatiaSerbia
Bulgaria
AustriaSlovenia
Germany
Czech Republic
Moldova
Romania
Slovakia
Hungary
OMV competitive advantages
Integrated and balanced portfolio of Upstream and Downstream ensures financial resilience
Geographically focused and low-cost Upstream assets High-quality assets and efficient operations
in Downstream
Strong organic free cash flow generation Well positioned for long-term growth in attractive
regions through strong partnerships
OMV FACTBOOK 2017 / OMV GROUP
6

Sales per country and regionIn %
20EUR bn
Austria 32Romania 17Germany 15Turkey 1 13Rest of Europe 19Rest of world 4
Clean CCS Operating Result per business segmentIn %
3EUR bn
Fuels 30Petrochemicals 22Gas 7Upstream 41
41
722
30
Upstream production per regionIn %
348kboe/d
Central Eastern Europe 56Middle East and Africa 13North Sea 23Russia 3Australasia 5
1 OMV Petrol Ofisi was divested in June 2017
Downstream Oil sales volumesIn %
24mn t
Fuels 74Petrochemicals 9Fuels OMV Petrol Ofisi 1 17
749
17
OMV: one company – two strong pillars
Upstream Downstream
4+1 core and development regions Central Eastern Europe North Sea Middle East and Africa Russia Australasia (development to core region by 2025)
3 refineriesin Austria, Germany,
Romania
Positioned at the center of Europe’s transmission network
Long-term reliable partnerships with
Europe’s major suppliers
~2,000 filling stations in 10 countries
17.8 mn t Refining capacity
113 TWh Natural gas sales
volume2.5 mn t
Petrochemical capacity 31 TWh Gas storage capacity
348 kboe/d Production
1.15 bn boe Proven reserves
USD 8.8/boe Production cost
116% Reserve replacement rate
three-year average
Oil Gas
51% in the Romanian oil and gas company OMV Petrom S.A.
51% in Gas Connect Austria, the gas pipeline network in Austria
36% in Borealis AG, one of the world's leading producers of polyolefins
Major shareholdings
13
23
53
56
1715
13
194
32
OMV FACTBOOK 2017 / OMV GROUP
7

OMV follows a two-tier system with a transparent and effective separation of company management and supervision between the Executive Board and Supervisory Board. The Executive Board members have joint responsibility. The individual areas of responsibility, the reporting and approval obligations and the procedures are defined in the rules of procedure approved by the Super visory Board.
Management Board and Corporate Governance
The OMV Executive Board
Rainer Seele, *1960 Chairman of the Executive Board and Chief Executive Officer, since July 2015
Experience at OMV: three years Key responsibilities: Strategy, Legal, Human Resources, HSSE, Corporate Affairs, International & Governmental Relations
Johann Pleininger, *1962 Deputy Chairman of the Executive Board, since July 2017 and Executive Board member, since September 2015
Experience at OMV: 41 years Key responsibilities: Upstream (Exploration and Production)
Reinhard Florey, *1965 Chief Financial Officer, since July 2016
Experience at OMV: two years Key responsibilities: Finance, Investor Relations, Procurement, Treasury and Risk Management, Process Management & Systems, Global Solutions
Manfred Leitner, *1960 Executive Board member, since April 2011
Experience at OMV: 33 years Key responsibilities: Downstream (Refining, Marketing, Gas, Petrochemicals)
OMV FACTBOOK 2017 / OMV GROUP
8

Shareholder representatives (status May 2018)
Position in Supervisory Board as well as other current functions 1
Term of office in OMV Supervisory Board
Peter Löscher Chairman; member of the supervisory boards of Sulzer AG and Telefonica S.A.
First elected at the AGM held on May 18, 2016
Gertrude Tumpel-Gugerell
Deputy Chairwoman; member of the supervisory boards of Commerzbank AG and Vienna Insurance Group AG
First elected at the AGM held on May 19, 2015
Alyazia Ali Al Kuwaiti
Deputy Chairwoman; Executive Director Upstream & Integrated Mubadala Investment Company
First elected 2008, reelected at the AGM held on May 22, 2018
Wolfgang C. Berndt – First elected at the AGM held on May 26, 2010Helmut Draxler – First elected at the AGM held on Oct. 16, 1990Marc H. Hall Managing Director, R&EM –
Restructuring & Energy Management e.U. First elected at the AGM held on May 18, 2016
Mansour Mohamed Al Mulla
Member of the Board of Directors of Aldar Properties PJSC, CFO Petroleum & Petrochemicals Mubadala Investment Company PJSC
First elected at the AGM held on May 22, 2018
Karl Rose Strategy Advisor, Abu Dhabi National Oil Company and Managing Director Strategy Lab GmbH
First elected at the AGM held on May 18, 2016
Herbert Werner Deputy Chairman of the supervisory board of Ottakringer Getränke AG, Managing Partner, HCW Verkehrsbetriebe GmbH and Managing Partner HCW Vermögensverwaltungs GmbH
First elected at the AGM held on June 4, 1996
Elif Bilgi Zapparoli Co-Head of Asia Pacific Global Investment and Corporate Banking at Merrill Lynch Asia Pacific Ltd.
First elected at the AGM held on May 13, 2009
1 Includes the appointments to supervisory boards of other domestic or foreign listed companies as well as any management functions held. This overview is based on information received by the Supervisory Board members as of May 2018.
Employee representatives (status May 2018)
Position and committee memberships Term of office
Christine Asperger Chairwoman of the Employees Works Council of OMV Austria Exploration & Production GmbH and the Group Works Council
First appointed 2013
Herbert Lindner Chairman of the Employees Works Council of OMV Refining & Marketing GmbH
First appointed 2013
Alfred Redlich Chairman of Employees Works Council of OMV Gas & Power GmbH
First appointed 2013
Angela Schorna Chairwoman of the Employees Works Council of OMV Aktiengesellschaft
First appointed 2018
Gerhard Singer Chairman of the Employees Works Council of OMV Exploration & Production
First appointed 2016
The OMV Supervisory Board
The Supervisory Board appoints the Executive Board and supervises management’s conduct of business. It consists of ten shareholder representatives elect-ed at the Annual General Meeting (AGM) and five employee representatives delegated by the Group works council. Two of the current shareholders’ representatives were elected at the 2018 AGM. The main considerations in selecting the members of the Supervisory Board are relevant knowledge and experience in executive positions. In addition, aspects of diversity of the Supervisory Board with respect to the internationality of the members, the representation of both genders and the age structure are taken into account. The current Supervisory Board includes five women and three non-Austrian nationals.
15 Supervisory Board
members
4 Executive Board
members
AGM(shareholders)
Report to
Discharge
Report on specific matters, submit draft resolutions to
Appoint, monitor and
supervise
Two-tier board system, key aspects
Elec
t sha
reho
lder
repr
esen
tativ
es,
disc
harg
e
OMV FACTBOOK 2017 / OMV GROUP
9

Market EnvironmentThe world energy demand continues to grow and be supplied predominantly through traditional energy sources. The hydrocarbons oil and gas will remain the main energy source, accounting for more than half of the global primary energy demand.
The growth in global demand for petrochemical products is tied to the general development of the economy. The growing petrochemicals market will also be an important consumer of oil and gas. Ole-fins such as ethylene, propylene and butadiene are major building blocks for the chemical industry. Its derivatives, such as polyolefins, offer unique prop-erties and economic benefits such as low material costs, and easy and fast processing. Petrochemicals are increasingly used, substituting other energy- intensive materials due to their advantageous char-acteristics. They are essential for various industries such as packaging, construction, transportation, health care, pharmaceuticals and electronics.
This growth will be driven by Asia Pacific, following the economic development in the region. Demand in mature markets such as Europe, North America and Japan will continue to stay healthy and develop in line with GDP.
Naphtha, an oil derivative product, is expected to remain the main feedstock for the petrochemical industry. Other feedstocks include coal, primarily in China, associated gas in the Middle East and shale gas in North America.
World energy demand will continue to increase and is expected to rise by 16% until 2030 driven by GDP and population growth. Oil and gas demand continues to increase and will account for more than 50% of global energy demand. Natural gas will be the strongest-growing primary energy source among fossil fuels.
Oil will stay the main primary energy source in the next decade with a market share of about 30% and an annual growth rate at 0.5% until 2030. The increase in consumption will stem primarily from countries in Asia, the Middle East and Africa. The growth in demand for crude oil is the result of increased demand for products from the petro-chemical industry and the transport sector in these emerging markets. While demand for crude oil products is forecast to develop negatively in satu-rated markets such as North America and North-west Europe, the global growth in demand beyond 2030 will come from the emerging markets in Asia, Africa and the Middle East.
Natural gas will be the strongest-growing primary energy source among fossil fuels supported by a de-carbonization policy and stricter emissions stan-dards. Gas demand will grow at an annual rate of 1.6% until 2030. Demand for power generation as the main gas-consuming sector will expand further throughout the world, including Europe, replacing power generation from coal.
Oil and gas demand will continue to
increase in the next decade
Petrochemical products demandIn mn t
2016 2025 2030
Europe Middle East Asia Pacific
Source: JBC Energy, OMV analysis, rounded numbers
550
445
305
Global primary energy demandIn bn toe
2016 2025 2030
Gas Oil Coal Nuclear Renewables
Source: IEA New Policies Scenario, World Energy Outlook 2017
16.015.2
13.8
4.4 4.6 4.7
3.8 3.8 3.9
3.015 25 30
70 80 903.4 3.7
0.7 0.8 0.91.9
220
340
430
2.42.8
OMV FACTBOOK 2017 / OMV GROUP
10

OMV Strategy 2025The OMV Strategy 2025 builds on the proven concept of integration. Based on a balanced growth strategy in Upstream and Downstream, the size and geographical reach of OMV will be expanded considerably to participate in attractive growth opportunities outside Europe. OMV strives to substantially increase the clean CCS Operating Result to at least EUR 5 bn by 2025.
OMV set to become bigger and more valuable
The OMV Strategy 2025 builds on the proven con-cept of integration, which ensures strong cash flows and resilience. OMV aims to grow both the Upstream and the Downstream business. In Up -stream, we target production and reserves growth in defined core regions. In Downstream, the pro-cessing capacities and the geographical reach of OMV will be expanded considerably. Moreover,
Upstream
OMV further aims towards a higher-quality Upstream portfolio with a focus on cash genera-tion. Production will increase to 500 kboe/d by 2020 and 600 kboe/d by 2025. The share of natural gas will successively grow in the portfolio to more than 50% by 2025 to improve long-term carbon efficiency. To ensure a reserve replacement rate of more than 100% (three-year average) in the long term, 1P reserves will be almost doubled to more than 2 bn boe by 2025 along with an average reserve life of eight to ten years.
OMV will build a strong gas market presence in Europe. We will continue to improve our perfor-mance and extend our record of operational excel-lence. OMV strives to increase the clean CCS Oper-ating Result to at least EUR 4 bn in 2020 and at least EUR 5 bn in 2025.The growth will be driven equally by Upstream and Downstream and shall be achieved both organically and through acquisitions. Strategic partnerships will remain an important lever to access attractive projects, with long-term perspectives and value creation.
OMV – Strategy 2025
Drive operating result and cash generation Extend record of operational excellence
Significantly internationalize Upstream and Downstream
Build strong gas market presence in Europe
Leverage on proven concept of integration
348> 420
500
600
> 2 bn boe1P reserves will
be almost doubled by 2025
Production growth In kboe/d
2017 2018 1 2020 2025
Asset base Organic growth Acquisitions
1 Excluding acquisitions and divestments
OMV FACTBOOK 2017 / OMV GROUP
11

The portfolio growth will be primarily achieved through acquisitions in low-cost, hydrocarbon-rich regions. Average production costs will not exceed USD 8/boe. OMV will continue to focus its portfolio on four core regions plus one development region. Portfolio growth with sustainable reserve replace-ment is being pursued with the development of projects in selected regions (such as the Middle East and Russia). Australasia is to be developed into a core region in order to unlock the growth potential of the rapidly growing Asian market. A first step in this direction was expanding our current footprint in New Zealand. Substantial, long-term contribu-tions are expected to come from Achimov IV/V in Russia, Umm Lulu and SARB in Abu Dhabi, as well as from the offshore gas field Neptun in Romania.
Annual investments of EUR 1.3 and 1.7 bn are ear-marked for organic growth and ongoing operations until 2025. OMV plans to invest EUR 300 mn for exploration and appraisal of potential resources, with an average of 15 to 20 exploration drillings expected per year, increasing in relation to the necessity to replace reserves.
Downstream
In Downstream Oil, OMV will further strengthen its competitive position in Europe. Building on our strong expertise as one of the leading European refiners, we strive to export our successful Euro-pean refining and petrochemical business model to international growth markets. In Downstream Gas, we will become the leading integrated supplier with a strong market presence from Northwest to Southeast Europe.
Downstream Oil OMV will modify its European refining assets reflect-ing expected market changes, shifting to higher value products. By 2025, up to EUR 1 bn will be invested in the refineries in Austria, Germany and Romania. Major projects are the capacity expansion for petrochemical products from 2.5 to 2.8 mn t per year and the increase of aviation fuels by 2025. Western refineries will become heavy fuel oil free by 2025. The three refining sites will continue to be operated as one integrated refinery system, optimizing asset utilization through the exchange of intermediate products and maximizing margins.
The retail business will increase the sales of fuels produced by OMV refineries via its filling stations in the premium and discount segment. The number of stations in discount retail will be expanded con-tinually in the coming years. The focus of the pre-mium retail network is to increase market share of the premium product “MaxxMotion” as well as develop additional customer-oriented service and shop offerings. OMV aims to maintain the profit-ability per filling station.
In order to safeguard revenue and profitability in Europe, we will increase the share of our refineries’ production sold through reliable captive sales channels from 47% to 55% by 2025.
Western refineries to be heavy fuel oil
free by 2025
OMV European refining production by 2025
Petrochemicals
Fuels – Jet
Fuels – Gasoline and diesel
OMV European production
volume 2025
2.8 mn t
1.9 mn t
9.8 mn t
Change 2025 volumes
European market
2016 – 2025
+12%
+23%
(5)%
Heavy products0.9
mn t(51)%
OMV FACTBOOK 2017 / OMV GROUP
12

By 2030, fuel demand is expected to grow signifi-cantly in Asia, as well as in the Middle East and Africa, while it is foreseen to decline in Europe. Asia will absorb more than 90% of the growth in global oil demand. Petrochemicals demand is anticipated to increase in all regions, especially driven by Asian markets. Leveraging its leading position in Europe, OMV will export its successful business model to international growth markets such as the Middle East and Asia. OMV aims to nearly double its refining capacity by 2025, estab-lishing 1 – 2 core regions outside Europe. Initial steps in this direction have already been taken, for example, through the MoU signed with ADNOC for evaluating business opportunities in Abu Dhabi.
Downstream Gas In Europe, demand for natural gas is expected to remain stable until 2030, with upside potential of 40 bcm primarily driven by a switch from coal to natural gas in power generation. Consequently, total European demand could reach 500 bcm per year. OMV aims to establish itself as a strong mar-ket player from Northwest to Southeast Europe. By 2025, OMV gas sales will grow to more than 20 bcm, thereby aiming at 10% market share in Germany, Europe’s largest gas market. Increasing equity gas from OMV production in Norway and Romania will be sold through the European grid. The Nord Stream 2 pipeline is advantageous for OMV and it will secure and increase consistent, long-term gas supplies to Europe and the Central European Gas Hub in Baumgarten, Austria.
OMV to become the leading integrated
supplier of natural gas in Europe
Source: JBC Energy OMV analysis; rounded numbers 1 Commonwealth of Independent States and Eastern Europe
+320
+210
In mn t
Asia
Growth in global oil demand >90% from Asia
Growth in petrochemical demand ~70% from Asia
Development of fuels and petrochemicals demand 2016 to 2030
Fuel products
Petrochemicals
+12+32
Americas
+50 +18
Africa
+70
+15
Middle East
+7 +18 1
Russia
(60)
+20
Europe
OMV FACTBOOK 2017 / OMV GROUP
13

The financial strategy will drive performance through its focus on cash, operational excellence and resilience of the portfolio. Maintaining the oil price at USD 25/bbl, at which OMV is free cash flow breakeven after dividends, will be instrumental for ensuring competitiveness. Furthermore, the company will continue to enhance its operating efficiency. The goal of the new efficiency program is to reduce costs by EUR 100 mn in 2020 com-pared with 2017.
OMV targets attractive shareholders returns and aims to increase dividends every year – in line with financial performance, especially the development of the free cash flow and the Group’s net income – or to at least maintain it at the prior year’s level.
A set of strategic and financial criteria are taken into account when taking an investment decision. Growth will be executed on a solid financial base, with a gearing ratio lower or equal to 30%, while maintaining a strong investment-grade credit rating.
≥ 5
≥ 4
3 Capex Acquisitions
Capex Acquisitions
1.8
10
Average CAPEX p.a.In EUR bn
2015 – 2017 2018 – 2025
2.1
2.0 – 2.5
Financial strategy and targets
OMV’s value-driven finance strategy aims to enable growth, drive performance and reward shareholders.
The following long-term targets are the foundation of OMV’s finance strategy:
Positive free cash flow after dividends Clean CCS ROACE of at least 12% Growing clean CCS net income attributable
to stockholders Ensuring financial stability through a gearing
ratio of ≤30%
OMV aims to increase clean CCS Operating Result to at least EUR 4 bn in 2020 and to at least EUR 5 bn in 2025.
Growth will be enabled through capital expendi-tures and acquisitions. For the period 2018 to 2025, OMV plans to make annual investments averaging EUR 2.0 to 2.5 bn. In addition, a total acquisition budget of EUR 10 bn is planned, over a span of eight years, to be split equally between Upstream and Downstream.
Clean CCS Operating Result In EUR bn
2017 2020 2025
Upstream Downstream
AcquisitionsIn EUR bn
2015 – 2017 2018 – 2025
Upstream Downstream
8 years
3 years
EUR ≥ 5 bnclean CCS Operating
Result by 2025
OMV FACTBOOK 2017 / OMV GROUP
14

OMV’s growth strategy is enabled by strong and resilient cash generation as well as a solid financial footing. In 2017, operating cash flow amounted to EUR 3.4 bn and the Group’s gearing ratio stood at 14%, comfortably below the target of below or equal to 30%. Going forward, OMV’s strong cash generation, additional gearing headroom as well as future disposals and cost savings will allow OMV to fund its growth strategy while at the same time reward shareholders. Taking the 2017 operat-ing cash flow as an example for the yearly cash generation for the next three years, plus additional
Financial criteriaStrategic criteria
Balanced Upstream and Downstream portfolio
Focus on low-cost and hydro-carbon-rich countries in defined Upstream regions
Proximity to growing markets in Downstream
Balanced risk profile in terms of geography and applied technology
Free cash flow positive mid-term
Timely cash generation with a focus on:– producing and – fast ramping-up assets
Resilient cash flow generation
Defined investment hurdles considering:– business risks– country risks– technology risks
Value accretive
Strategic fit Cash profile Return profile
≥12%Group ROACE target
gearing headroom and future disposals and cost optimizations, OMV’s sources of cash would amount to more than EUR 14 bn for a period of three years. Cash generation from future acqui-sitions will further increase this number. The cash of at least EUR 14 bn allows OMV to fund its growth plans and reward its shareholders. For the period 2018 to 2020 roughly EUR 6 bn are foreseen as organic CAPEX. This means OMV has at least EUR 8 bn for acquisitions, its progressive dividend policy and maintaining a strong balance sheet.
Funding the growth – mid term perspectiveIndicative 3 years’ cumulative, in EUR bn
1 2017 cash flow from operating activities plus the contribution from Yuzhno Russkoye2 Based on net debt and assuming a gearing ratio of 30% at the end of 20173 Three years sources based on 20174 Excluding purchase price acquisition CAPEX and contingent considerations
Sources of cash Uses cash 2018 – 2020
3x 2017 Operating cash flow 1
Gearing headroom 2
Disposals and cost
optimizations
Cash contribution from M&A 2018 – 2020
>14 3
>8
~6
Allocation optionality M&A and
resulting CAPEX Dividends Deleveraging
CAPEX 4
M&A criteria – focus on cash and value
OMV FACTBOOK 2017 / OMV GROUP
15

Active Portfolio ManagementOMV has a strong track record in portfolio management and is consistently executing its strategy.
Key milestones of OMV's active portfolio management
July 1, 2014
Sale of OMV’s 45% stake in the Bayernoil refinery, Germany; reduction of refinery footprint and focus on highly integrated refineries
October 6, 2016
Sale of 30% of Rosebank;
USD 50 mn received in Q4/16
May, 2016
Takeover of all EconGas shares
November, 2016
Acquisition of remaining second-party shares in four Sirte Basin EPSAs 1 in Libya
October 31, 2013
Acquisition of Statoil, now
Equinor, assets in the North Sea for USD 2.65 bn;
North Sea becomes an
OMV core region
2013
2014 2016
2015
July, 2015
Rainer Seele appointed as new Chairman of the
Executive Board and Chief Executive Officer
July, 2016
Reinhard Florey appointed as new
Chief Financial Officer
September, 2015
Johann Pleininger appointed as new
Executive Board Member Upstream
1 Exploration and Production Sharing Agreement
ACQUISITIONS
DIVESTMENTS –
OMV FACTBOOK 2017 / OMV GROUP
16

Key milestones of OMV's active portfolio management
December 14, 2016
Binding basic asset swap agreement between Gazprom and OMV signed
May 30, 2018
Divestment of Samsun power plant in Turkey
December 30, 2016
Sale of Aliaga terminal in Turkey
June 13, 2017
Divestiture of OMV Petrol Ofisi; net cash con-tribution of EUR 0.9 bn
March 15, 2018
Expanded footprint in New Zealand, buying Shell’s Upstream business for USD 0.6 bn
January 13, 2017
Divestment of OMV’s Upstream UK subsidiary; cash contribution of up to USD ~1 bn
December 15, 2016
Sale of a 49% stake in Gas Connect Austria for EUR 0.6 bn
April 29, 2018
OMV awarded 20% share in two oil fields in Abu Dhabi for USD 1.5 bn
June 28, 2018
Sale of Pakistan Upstream business
November 30, 2017
Acquired 24.99% in Yuzhno Russkoye gas field
for EUR 1.7 bn
2018
2017
OMV FACTBOOK 2017 / OMV GROUP
17

Innovation & TechnologyAt OMV, Innovation & Technology are key enablers of the Group strategy. OMV seeks innovative solutions to optimize operations, explore business opportunities and develop new business models. Investments in innovation, research and development and strategic partnerships are vital to ensure long-term sustain-ability of the business.
crude oil is about 40%, OMV succeeded in increas-ing production rates of wells in the super-mature Matzen field in Austria, pushing ultimate recovery above 55% by using water injection. In 2012, OMV started a polymer pilot project in the Matzen field in Austria. In total, 200,000 boe incremental oil were produced by the end of 2017. Based on the promis-ing results, OMV plans a rollout to different fields. OMV is currently pursuing its Intelligent Water Program by testing a combination of polymer and alkali flooding to increase ultimate recovery.
Artificial liftClose cooperation between OMV experts and external research institutes has yielded impres-sive results in artificial lift methods, including measurable reductions in power consumption and downtime of sucker rod pumps. In 2017, nearly 6,500 wells were equipped with artificial lift sys-tems, leading to considerable savings in operating expenditures. In Austria, the number of well inter-ventions could be decreased by 22% from 190 in 2015 down to 116 in 2017, lowering operating expenditures by 20%. This does not include addi-tional cost savings due to the reduction of pro-duction deferments.
Material managementExtending the lifetime and reliability of materials and facilities is an OMV priority for ensuring safe, sustainable and cost-efficient hydrocarbon produc-tion. OMV implemented extensive corrosion con-trol and material selection programs for optimum equipment performance and maximum service life, saving more than EUR 450 mn over the past 20 years. With the recent increase in sour crude, pipelines and processing equipment degrade faster than usual. OMV is investigating new technologies, such as nanotechnology coatings, to improve material resistance and reliability. This approach has also had a major positive impact on health, environmental and safety issues. Additionally, OMV developed a polymer lining for tubing, patented in 16 countries. Lined tubing is tubing where cross-linked polyethylene pipes are inserted in order to protect the tubing from abrasion and corrosion.
OMV’s approach to drive innovation & technology:
One of OMV’s core ambitions centers on the use of new technologies to continuously enhance recovery rates of mature fields and enable highly efficient oil and gas field explo-ration and production even in challenging envi-ronments. OMV hereby focuses on various Increased Oil Recovery (IOR) and Enhanced Oil Recovery (EOR) methods.
Additionally, in order to develop a competitive and carbon-optimized portfolio for our custom-ers, OMV actively explores new feedstocks (e.g. synthetic crude oil from post-consumer plastics), new technologies (e.g. hydrogen from renewable energy, hydrothermal liquefaction or enzymatic conversion of CO2) and new products (e.g. elec-tricity, advanced liquid and gaseous products).
OMV collaborates with leading international uni-versities (e.g. University of Cambridge, Stanford University, TU Vienna, Montanuniversität Leoben, Johannes Kepler Universität Linz, Uni-versität für Bodenkultur Wien etc.) as well as international research institutes (e.g. Fraunhofer, Forschungszentrum Jülich, Austrian Institute of Technology, Joanneum Graz etc.) and engages in fruitful research collaborations with industry partners and research initiatives globally.
OMV’s innovation & technology portfolio – selected project highlights
Optimized drilling, production and reservesIncreased and enhanced oil recoveryOMV is among the best in the world in terms of achieving high recovery rates in mature fields. While the international average recovery rate for
OMV FACTBOOK 2017 / OMV GROUP
18

NanotechnologyWithin OMV’s recently established nanotechnology department, research is directed to increase integ-rity, improve production and finally reduce operat-ing costs. Initial tests have been started with a successful first pilot in Romania, where the cost for chemicals to avoid paraffin problems could be reduced substantially. Additionally, the number of well interventions could be lowered.
Circular plastics economyCircular economy and urban mining are two important topics at OMV. Within OMV’s feedstock recovery pilot project “ReOil” at Schwechat refin-ery post-consumer and post-industrial plastic is recycled to produce synthetic crude oil in a pyroly-sis process (a proprietary OMV development). This recycled crude can be processed into any desired refinery product, while reducing the dependence on natural resources and improving carbon inten-sity compared to standard oil processing. The mechanical completion of the new pilot plant with a capacity of 100 kg/h was reached at the end of 2017 and represents the next step to gaining further experience for commercial upscaling.
Sustainable refineryCo-processingOMV is continuously investigating new technolo-gies such as co-processing to increase the quality and stability of fuels with biogenic components. Co-processing is an innovative concept, integrated directly into the refinery to produce gasoline and diesel from biogenic feedstock. First field tests were already successfully completed, including a sustainability certification according to the REDcert standard.
Advanced fuelsAdvanced fuels are fuels that are not in competition with food. The principal sources for such advanced fuels are sunlight, water and CO2, elements that were also the source of fossil crude but developed over millions of years. OMV actively explores mul-tiple kinds of alternative feedstocks, technologies and fuels, which are currently mostly in an R&D
stage, with the aim of future scale-up. Selected projects include:
Direct conversion of CO2 and water with solar energy to produce fuels and hydrogen – collaboration with Christian Doppler Laboratory (Cambridge)
Direct conversion of CO2, hydrogen and bio-waste to produce fuels – research collaboration with TU Vienna
Hydrothermal liquefaction of biowaste to pro-duce bio-based crude oil – research collaboration with Montanuniversität Leoben
Utilization of sustainable electric energy to produce e-fuels – research cooperation within the German funded project Kopernikus
Future mobilityOMV has adopted a proactive approach to prepare for a transition to non-hydrocarbon fuel options by exploring multiple future energy sources. In 2017, OMV acquired a 40% interest in SMATRICS, Austria’s leading e-mobility infrastructure provider. Additionally, OMV currently assesses options to intensify its Compressed Natural Gas (CNG) engagement and opportunities for small-scale Liquefied Natural Gas (LNG) within the transport sector. Moreover, OMV pioneered hydrogen infra-structure development in Austria with the current network comprising ten stations in Austria and Germany.
OMV FACTBOOK 2017 / OMV GROUP
19

DigitalizationOMV’s digital transformation is driven by synergetic and orchestrated initiatives across the entire company. By adopting digital technologies, we are continuously improving business performance and customer experience, optimizing operations, increasing asset utilization and changing traditional processes while contribut-ing to our Health, Safety, Security and Environment (HSSE) responsibility.
Transforming OMV into a digital enterprise
Digitalization and Industry 4.0 change the way we run our business. They open up opportunities to unlock value along the entire value chain – in oil and gas exploration, refining and sales and in administrative processes like finance and human resource management. It is OMV’s clear ambition to become a digital leader in key areas. The group-wide digital transformation bundles numerous ini-tiatives in the fields of advanced analytics, cyber-security, process digitization, automation as well as connectivity and sensing. To enable the digital transformation, OMV invests in a unified digital platform and an integrated data management. For OMV, digital transformation is more than applying and scaling technology – it is about people and culture. Therefore, creating a digital mindset and reshaping the talent landscape are an integral part of OMV’s digital transformation as well as the inte-gration of technology partners and startups.
Digitized operations
Today, digitalization already plays a crucial role for OMV. Emerging technologies ensure optimum evaluation and use of digital and analog data in machine control for increased efficiency and avail-ability. Upstream is focusing its digitalization efforts within the global “DigitUP” program. Worldwide digital access to knowledge, tools and people will help us to maximize reserves and production, min-imize costs, and evaluate and mitigate risk. Lever-aging digitalization is also a business imperative for OMV’s downstream division. The newly estab-lished Downstream Digitalization department flags the priority given to digitalization. Today, state-of-the art algorithms and pattern analysis already increase the efficiency of refinery operations and help to prevent damage. Technologies such as block chain, digital tools, robotics and big data analysis, among others, will shape OMV’s future business development in both divisions.
Selected initiatives to drive digitalization
Advanced analytics Improved seismic interpretation with
the state-of the-art 3D Visualization Center opened in 2017
Establishing predictive retail analytics based on point of sales data
Process digitization Cross-linked and optimized hundreds of
processes with the Electronic Turnaround Optimization Platform first used in 2016
Implementing a strong digital core with the SAP S/4 HANA platform
Enabled central recording and monitoring of drilling sites all over the world through OMV’s Drilling Cockpit
Automation and robotics Automating and optimizing processes
throughout the entire Group; first pilot project in finance
Leveraging artificial intelligence (AI) to promote a culture of data-driven insight
Connectivity and sensitivity Establishing a geocloud enabling access
to tools and data anytime and anywhere Information security Minimizing the information security risk
exposure with the cybersecurity program
People and culture Triggering a cultural change and reshaping
the talent landscape Developing new skills such as design think-
ing, agility and collaboration
OMV FACTBOOK 2017 / OMV GROUP
20

The investment focus of OMV is to achieve a sustainable and low-cost resource base in Upstream and to further increase competitiveness and value orientation in Downstream while ensuring a positive free cash flow after dividends. Com-pared to the peak in 2014, organic capital spending has been more than halved. At the same time, exploration expenditure was reduced from an average of EUR 0.6 bn in the period from 2013 to 2015 to an average of EUR 0.3 over the last two years.
Investments
Major acquisitions
From 2013 to 2017, OMV spent EUR 4.3 bn on acqui-sitions. Major acquisitions were made in the North Sea and in Russia. In 2013, OMV purchased a port-folio of assets from Statoil, now Equinor, including a 19% share in the giant Gullfaks field. At the end of 2017, OMV successfully closed the acquisition of a 24.99% interest in the Yuzhno Russkoye gas field, establishing Russia as a new core region in OMV’s Upstream portfolio. The purchase price amounted to EUR 1,719 mn and was largely funded out of proceeds generated from disposals and OMV’s strong cash flow.
Organic capital spending
OMV is continuously optimizing and reviewing its organic capital spending with a clear focus on cash flow management. As a result of the successful restructuring of OMV’s portfolio as well as the high level of cost and capex discipline, the organic capi-tal spending excluding acquisitions was reduced to EUR 1.6 bn in 2017.
Over the last five years, organic capital expendi-ture amounted to roughly EUR 12.8 bn, of which around EUR 8.8 bn were invested in organic growth and EUR 4.0 bn in maintenance and optimization measures. In the given period, roughly EUR 9.5 bn of the overall investments were allocated to Upstream.
Project examples 1
Petrobrazi refinery modernization program, Romania, Downstream Increased competitiveness through processing
of all Romanian crude production Change of the product yield structure to meet
changing market demand Significant reduction of energy consumption Investment from 2010 to 2014: EUR ~600 mn
Burghausen refinery ButaMax project, Germany, Downstream Installation of a new grassroots butadiene unit
with a capacity of 70 kt per year Investment from 2012 to 2016: EUR ~170 mn
Aasta Hansteen, Norway, Upstream Development of the offshore gas field, expected
to be brought on stream in Q4/18 Located in the Norwegian North Sea OMV’s interest: 15% Operator: Equinor
Nawara, Tunisia, Upstream Development of the onshore gas field, first gas
expected in 2019 Located in Southern Tunisia OMV’s interest: 50% Operator: OMV
1 All investments net to OMV
Investments 2013 – 2017 per segment and geographyIn %
17EUR bn
Upstream Central Eastern Europe 28 Upstream North Sea 33 Upstream Middle East and Africa 7 Upstream Russia 10 Upstream Australasia 2 Downstream Central Eastern Europe 15 Downstream Turkey 4
337
10
2
154
28
Investments 2013 – 2017In EUR bn
2013 2014 2015 2016 2017
Downstream Upstream Acquisitions
5.2
3.82.8
1.9
3.4
OMV FACTBOOK 2017 / OMV GROUP
21

OMV focuses on value creation and on further increasing its competitiveness. One of OMV’s corporate principles is accountability: “Act as if it were your own company.” This principle contributes to the foundation for a new company culture. In striving towards excellence in all operations, OMV has substantially improved performance and cost efficiency, reaching one of the lowest free cash flow break-even oil prices of USD 25/bbl 1 on a Group level in 2017.
Operational Excellence and Cost Efficiency
2015 – 2017: Cost efficiency program
As part of OMV’s transformation in response to the major drop in oil prices starting in 2014, OMV launched initiatives in order to strengthen its cost base and operations, making OMV fit to perform even in a potentially prolonged lower oil price environment. Strict cost management measures led to total savings of around EUR 330 mn by the end of 2017 compared to 2015, EUR 80 mn more than the cost savings target of EUR 250 mn. 2
2018 – 2020: New efficiency target
For the years ahead, cost discipline remains an absolute imperative for the entire Group. OMV introduced a new cost savings target of at least EUR 100 mn by 2020 compared to 2017. 4
Focus areas: Operational efficiency in both Upstream and
Downstream Process optimization and harmonization Capture economies of scale and strict manage-
ment of overhead costs Leverage digitalization and optimize IT processes Procurement savings and contractor renegoti-
ations
Achievements
Cost savings of EUR 330 mn compared to 2015 2
CAPEX down to EUR 1.7 bn compared to EUR 2.8 bn in 2015 3
Exploration & Appraisal expenditure reduced to EUR 230 mn, down almost EUR 400 mn compared to 2015Oil price free cash flow break-even more than halved to USD 25/bbl over the last three years 1
1 Calculation of the oil price free cash flow break-even is based on the free cash flow after dividends excl. “Proceeds from sale of non-current assets”, “Net impact from the sale of subsidiaries and businesses, net of cash disposed”, “Acquisitions of subsidiaries and businesses, net of cash acquired” and adjustments such as inflows related to securities and loan repayments or outflows related to Nord Stream 2
2 Based on Operating Cost versus 2015 baseline according to OMV definition on a comparable basis 3 CAPEX including capitalized Exploration and Appraisal expenditures and excluding Yuzhno Russkoye acquisition4 Based on Operating Cost versus 2017 baseline according to OMV definition on a comparable basis
70
3525
Operating cost savings
In EUR mn, compared to 2015 on a comparable basis
2016
2017
Target Delivered
330250
200100
COST SAVINGS TARGET
≥ € 100 mn4
Oil price free cash flow break-even 1
After dividends excluding acquisitions and disposals, in USD/bbl
2015 2016 2017
OMV FACTBOOK 2017 / OMV GROUP
22

OMV employs over 20,000 people from around 70 different countries, the majority of them in Europe, where the Group operates its major integrated oil and gas sites. OMV strives to be a place where people can learn, grow and collaborate to achieve recognized and rewarded top performance in a continuously changing environment.
Employees
Employee structure
At year-end 2017, OMV had 20,721 employees.Roughly 93% of the staff was employed in Romania and Austria. OMV is proud to attract employees
OMV Foundation and People strategy
To support our business strategy and evolve our culture, we clearly articulated our OMV Foundation. Powered by our people, we translate energy into quality of life, and this is key to our People Strategy. An employee survey of Our Principles in June 2017 showed at a glance an overall positive picture. In all five Principles, we achieved an overall rating of 70%, the highest being 76% for Accountability. The outcome confirms that we have set the right priori-ties for our People Strategy to further strengthen leadership, performance culture, development and organizational agility.
To support OMV’s growth and further international-ization we focused on simplification and standard-ization. The setup of an integrated talent manage-ment system in combination with investment into leadership capabilities and development programs accelerates the targeted development of our future leaders and experts.
from 74 different nations. OMV is committed to the Group’s Diversity Strategy and focuses on gender diversity and internationality. As of December 31, 2017, overall women held 25% of the positions, which is above the industry standard.
Key figures employees
2013 2014 2015 2016 2017Total personnel expenses in EUR mn 1,140 1,298 1,260 1,169 1,116 Employees by regionAustria 3,637 3,603 3,515 3,431 3,482Romania/rest of Europe 20,385 19,025 17,967 16,618 15,722Middle East and Africa 2,302 2,352 2,155 2,091 1,093Rest of world 539 521 487 404 424Total number of employees 26,863 25,501 24,124 22,544 20,721DiversityNumber of nationalities 75 73 74 69 74Female in % 22 24 24 25 25Male in % 78 76 76 75 75
74Different
nationalities employed
15,336Employees
participated in training
Headcount by employment typeIn %
20,721employees
White-collar workers Blue-collar workers
DiversityIn %
20,721employees
Male Female
43 25
57 75
Our Purpose
We are the energy –
for a better life
Our Business Reason
OMV is producing and marketing oil and gas,
innovative energy and high-end petrochemical solutions –
in a responsible way.
Team spirit Respect the
individual and act as a team
Accountability Act as if it were your
own companyPassion Put your
heart and mind into it
Pioneering spirit Be open-minded and think in alternatives
Performance Strive for the best,
every day
WHY
WHAT
HOW
Our Principles
OMV FACTBOOK 2017 / OMV GROUP
23

Integrated Business ModelOMV is an international, vertically integrated oil and gas company, with activ ities throughout the value chain from exploration and production to refining, retail and commercial. OMV’s balanced portfolio of Upstream and Downstream activities delivers a strong cash flow and ensures resilience in a volatile market environment.
OMV’s value chain
OMV operates international upstream and down-stream assets. OMV’s fuels and petrochemicals enable mobility, provide heat for living and work-ing, and form the basis for a variety of plastics and high-end petrochemical products used every day.
Vertical integrationOMV’s vertical integration establishes a strategic natural hedge against oil price volatility. OMV generates material and sustainable cash flows and has proven to be resilient in a volatile market envi-ronment. It also has the ability to capture attractive opportunities in two different segments as well as in different markets. OMV’s size results in economies of scale from procurement, financing and staffing. OMV’s knowledge and expertise along the value chain create synergies in operational processes and technology applications.
Physical oil integration In 2017, the Upstream production was 348 kboe/d with an almost equal split between oil and gas. Over 50% of the oil production came from Romania and Austria, where production, refining, logistics and marketing processes are physically integrated. Equi-ty crude oil supplies approximately 90% of the feed-stock required in the Romanian refinery Petrobrazi and nearly 10% in the Austrian refinery Schwechat.
OMV markets fuels of close to 22 mn t 1 through its retail network and to commercial customers. The
Romanian, Austrian and German filling stations account for over 60% of the total filling station net-work of approximately 2,000 stations.
The refineries in Austria and Germany are forward integrated into petrochemicals. In 2017, they pro-duced over 2 mn t of petrochemicals. Key products are ethylene and propylene, which are mainly sold to Borealis under a long-term agreement valid until 2028. Borealis’s sites in Austria and in Germany are in the immediate vicinity of the OMV refineries and connected via pipelines.
The physical integration results in a captive oil demand of 47% for OMV’s total refinery capacity and supports a high utilization.
Gas value chain OMV is producing natural gas and is active in stor-age, transportation and trading, as well as power generation and sales. In 2017, gas production was nearly 170 kboe/d. Over 80% came from Romania, Norway and Austria. OMV owns gas storage capac-ities in Austria and in Germany and a 51% share in Gas Connect Austria, operating a 900 km high- pressure natural gas pipeline network. Gas trading volumes amounted to 113 TWh in 2017. OMV oper-ates one gas-fired power plant in Brazi, Romania, with a capacity of 860 MW and one in Samsun 2, Turkey. With this strong position along the gas value chain, OMV captures the full value of natural gas from wellhead to market for the majority of its equity production.
1 18 mn t excluding OMV Petrol Ofisi, which was divested in June 20172 In May 2018, OMV signed an agreement to divest the Samsun power plant; the transaction is expected to close by the end of 2018 at the latest
Vertical integration
Establishes a natural hedge against oil price volatility
Provides financial strength and resilience Enables countercyclical funding of invest-
ments Supports flexible capital allocation to take
advantage of acquisition opportunities across the entire value chain
Allows OMV to generate and capture more value along the value chain
Physical integration
Secures sales outlets for retail and petro-chemical products
Ensures a high-capacity utilization and efficient operations
Provides market knowledge to optimize the integrated margin
Creates cost benefits
OMV FACTBOOK 2017 / OMV GROUP
24

Equity oil 2017 in % of refining capacity
Retail sales volume 2017 in % of refining capacity
Petrochemical sales volume 2017 in % of refining capacity
Customer allocation in % of refining capacity
Note: Excluding OMV Petrol Ofisi, which was divested in June 20171 BP Europe, ENI Europe, Exxon Europe, Lotos, MOL, NIS, Phillips 66 Europe, PKN Orlen, Repsol Europe, Rompetrol, Shell Europe, Total Europe
CustomersOMV RefineriesEquity Oil Supply
OMV
OMV
OMV
Peers 1
Peers 1
Peers 1
25%
35%
25%
12%
7%
9%
47%Captive demand
53%Merchantmarket
16mn t
Vertical integration delivers strong cash generation
Minimum cash flow of EUR 3 bn every year over the past five years
Balanced portfolio of upstream and downstream assets provides resilience
Strong cash generation despite sharp oil price decline from USD ~110/bbl in 2013 to an average of USD 54/bbl in 2017
In 2017, cash generation close to EUR 4 bn, driven by cost reduction measures and portfolio optimization
Cash generation and oil price development 1
In EUR bn
1 Sources of funds: cash flow from operating activities excluding changes in net working capital
Upstream Downstream Other Oil price in USD/bbl
3.5
3.3 3.2 3.0
3.9
2013 2014 2015 2016 2017
OMV indicator refining margin in USD/bbl
3.0 4.1 7.2 4.7 6.0
10999
5244
54
Strong business integration
OMV FACTBOOK 2017 / OMV GROUP
25
Sustainability strategy
Sustainable business behavior is crucial for OMV to create and protect value in the long term, to build trusting partnerships and to attract customers as well as the best employees, investors and sup-pliers. In 2017, OMV started the process of review-ing the sustainability strategy. We conducted anal-ysis of the topics of utmost importance for the Company and its stakeholders and, as a result, we have identified five focus areas that encompass sustainability aspects related to our activities. Addi-tionally, we are defining long-term targets for these focus areas.
OMV reduced the LTIR by 35% over
the last five years
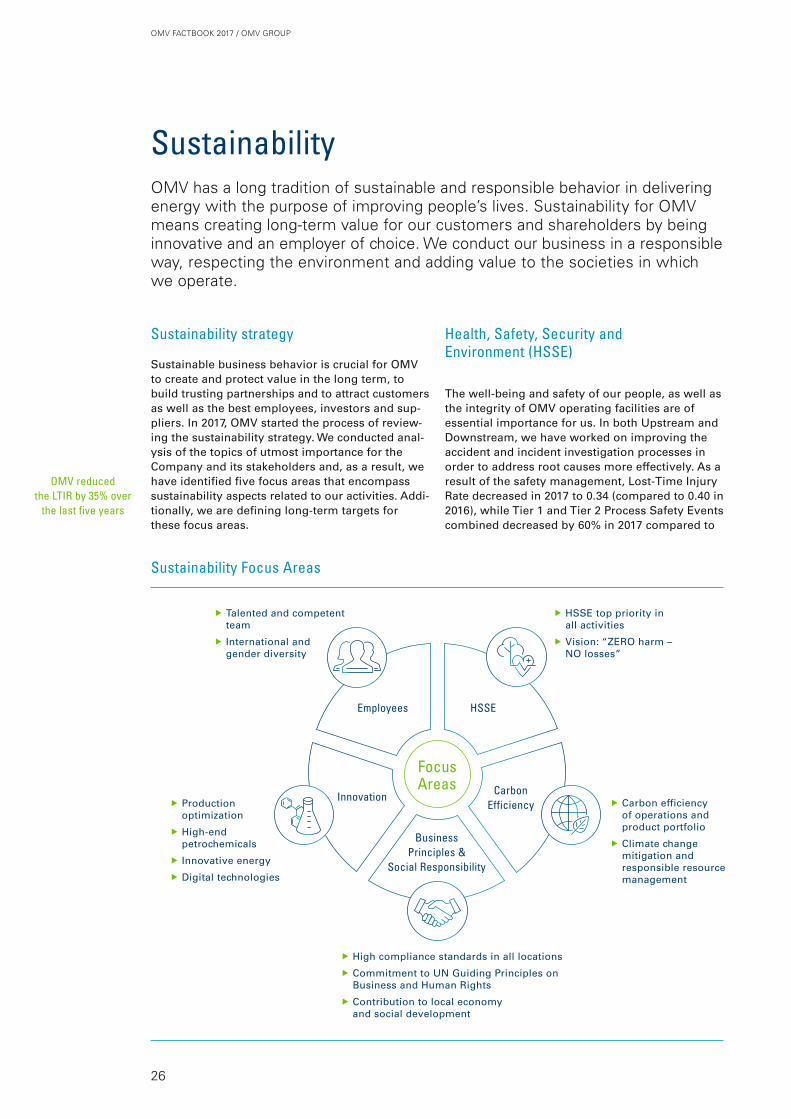
Sustainability Focus Areas
Employees
Business Principles &
Social Responsibility
HSSE
Innovation Carbon Efficiency
Focus Areas
fff Talented and competent team
fff International and gender diversity
fff HSSE top priority in all activities
fff Vision: “ZERO harm – NO losses”
fff Carbon efficiency of operations and product portfolio
fff Climate change mitigation and res ponsible resource management
fff Production optimization
fff High-end petro chemicals
fff Innovative energy
fff Digital technologies
fff High compliance standards in all locations
fff Commitment to UN Guiding Principles on Business and Human Rights
fff Contribution to local economy and social development
Health, Safety, Security and Environment (HSSE)
The well-being and safety of our people, as well as the integrity of OMV operating facilities are of essential importance for us. In both Upstream and Downstream, we have worked on improving the accident and incident investigation processes in order to address root causes more effectively. As a result of the safety management, Lost-Time Injury Rate decreased in 2017 to 0.34 (compared to 0.40 in 2016), while Tier 1 and Tier 2 Process Safety Events combined decreased by 60% in 2017 compared to
OMV has a long tradition of sustainable and responsible behavior in delivering energy with the purpose of improving people’s lives. Sustainability for OMV means creating long-term value for our customers and shareholders by being innovative and an employer of choice. We conduct our business in a respon sible way, respecting the environment and adding value to the societies in which we operate.
Sustainability
OMV FACTBOOK 2017 / OMV GROUP
26

2016. Despite our best efforts, we are saddened to have lost two contractors in 2017. Full investigations were conducted in regard to each incident.
Striving to minimize our impact on the environment, we saved 600 TJ of energy by implementing energy efficiency measures in our three refineries. We continue to work on spill prevention by repairing an aged pipeline infrastructure, in particular in Romania. We recognize preservation of water resources as a critical sustainable development issue and dedicate considerable efforts in enhancing environmental efficiency of our water and wastewater management practices. Modernization of water supply systems is part of our activities aiming to improve water use efficiency, while new infrastructure, such as the water treatment plant at Suplacu de Barcau oil field put into operation in 2017, considerably enhances the quality of wastewater treatment.
Carbon Efficiency
OMV recognizes that climate change is one of the most important global challenges. Acknowledging our share of responsibility, we dedicate an entire focus area of the Company’s sustainability strategy to climate change mitigation activities – the implementation of carbon efficiency measures. OMV strives to improve its carbon footprint and establishes corresponding targets in relation to its operations and product portfolio. OMV has action plans aiming to implement greenhouse gas (GHG) reduction and energy efficiency projects. At the end of 2017, we achieved a 16% reduction in the OMV Group carbon intensity of operations compared to
2010. All GHG emission reduction projects implemented since 2009 delivered a total reduction of 1.2 mn t CO2 equivalent so far. By endorsing the World Bank’s “Zero routine flaring by 2030” initiative, OMV works on reducing routine flaring at existing operations and avoiding it in its new projects. As a result of projects directed at reducing hydrocarbon venting and improved venting tracking, we decreased venting by 35% compared to 2016. OMV decreases carbon intensity of the product portfolio by growing the share of natural gas in its upstream production portfolio to >50% by 2025 and increasing natural gas sales in Europe. Furthermore, OMV will strengthen its European downstream position through a shift to high value added products for industrial use, such as petrochemicals. Additionally, OMV develops low or zero carbon fuel options such as CNG, hydrogen and electro mobility infrastructure, and invests in R&D in the area of synthetic feedstock and advanced fuels.
Environmental, Social and Governance performance
In 2017, OMV achieved the highest score “AAA” from MSCI for the fifth time in a row. OMV’s commitment to climate change mitigation and efficient water management has been recognized by CDP with “A–” (leadership) for both Climate Change and Water. Rated by oekom with C+, OMV is ranked top four out of 148 companies in the energy sector. Furthermore, OMV is a constituent of FTSE4Good, Euronext Vigeo index – Eurozone 120, STOXX® Global ESG Leaders, Ethibel Sustainability Index Excellence Europe and ECPI Indexes.
OMV achieved “A–” (Leadership) both for CDP Climate
Change and Water
Note: For more detailed information, please visit www.omv.com > Sustainability > Sustainability Report 2017
Key Performance Indicators
2013 2014 2015 2016 2017LostTime Injury Rate (LTIR) employees and contractors 1 per mn hours worked 0.52 0.44 0.27 0.40 0.34Total Recordable Injury Rate (TRIR) employees and contractors 2 per mn hours worked 1.24 0.97 0.73 0.70 0.79Energy consumption in PJ 141.5 132.1 137.8 126.8 130.8GHG (direct, Scope 1) 3 in mn t CO2 equivalent 12.9 13.1 12.2 11.0 11.1GHG (indirect, Scope 2) 4 in mn t CO2 equivalent 0.7 0.3 0.4 0.4 0.3GHG (indirect, Scope 3) 5 in mn t CO2 equivalent 174 112 112 113 108Spills volume in liters 52,000 150,000 158,000 103,490 173,909Hydrocarbon flared in t 322,984 636,942 299,825 180,452 185,832Hydrocarbon vented in t 79,411 79,362 61,443 50,173 32,834Environmental protectionexpenditures, excluding depreciation in EUR mn 189 200 210 208 197Environmental investment for assets put into operation in EUR mn 92 110 104 105 57
1 Lost-Workday Injuries: incidents with more than one lost workday; restricted work cases and medical treatment cases2 The Total Recordable Injury Rate includes lost-time injuries, any injuries resulting in fatalities, permanent total disabilities, Lost-Workday cases,
restricted work cases and medical treatment cases3 GHG Scope 1: Direct emissions from operations that are owned or controlled by the organization4 GHG Scope 2: Indirect energy emissions resulting from the generation of purchased or acquired electricity and heating5 GHG Scope 3: Other indirect emissions that occur outside the organization (e.g. from OMV’s product use or purchased goods and services) and services
OMV FACTBOOK 2017 / OMV GROUP
27
OMV’s technological, commercialand stakeholder managementskills ensure safe, profitable andsustainable production in Austriaand worldwide.
OMV FACTBOOK 2017 / UPSTREAM
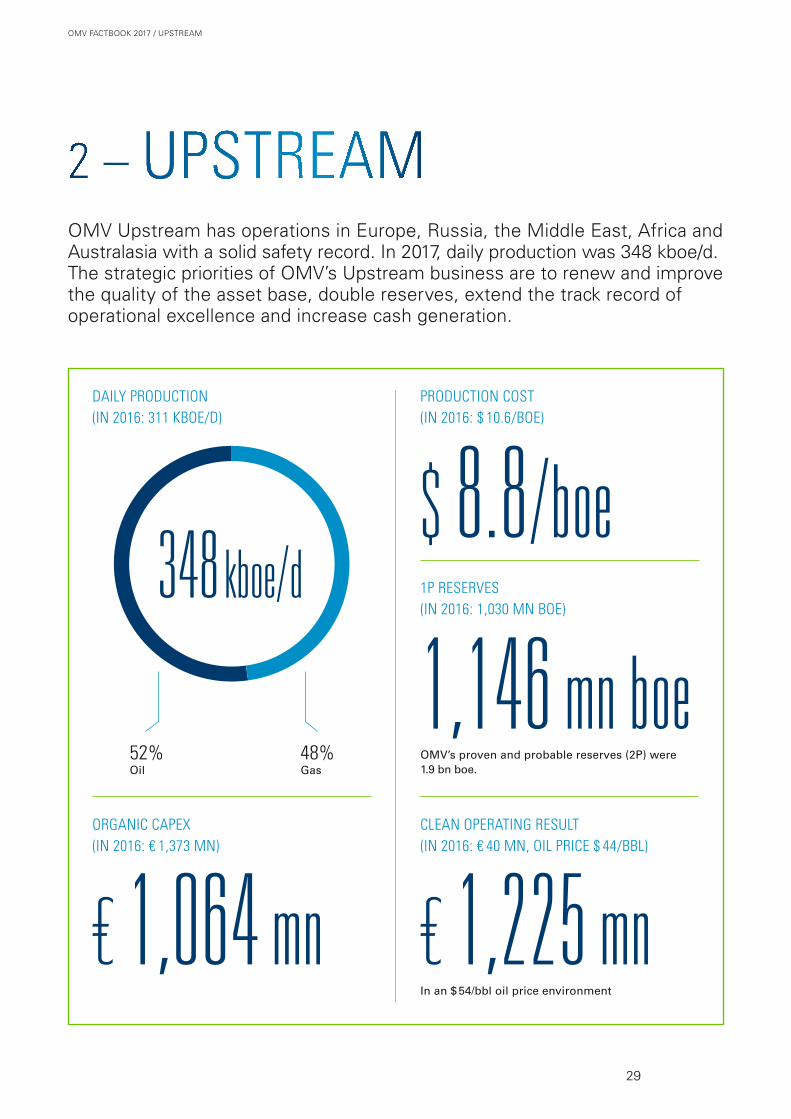
OMV Upstream has operations in Europe, Russia, the Middle East, Africa and Australasia with a solid safety record. In 2017, daily production was 348 kboe/d. The stra tegic priorities of OMV’s Upstream business are to renew and improve the quality of the asset base, double reserves, extend the track record of operational excellence and increase cash generation.
PRODUCTION COST (IN 2016: $ 10.6/BOE)
DAILY PRODUCTION (IN 2016: 311 KBOE/D)
1P RESERVES (IN 2016: 1,030 MN BOE)
CLEAN OPERATING RESULT (IN 2016: € 40 MN, OIL PRICE $ 44/BBL)
ORGANIC CAPEX (IN 2016: € 1,373 MN)
OMV’s proven and probable reserves (2P) were 1.9 bn boe.
In an $ 54/bbl oil price environment
52% Oil
48% Gas
348 kboe/d
€ 1,064 mn
1,146 mn boe
$ 8.8/boe
€ 1,225 mn29
OMV FACTBOOK 2017 / UPSTREAM

Upstream – at a Glance OMV’s Upstream business segment explores, developes and produces crude oil, natural gas liquids and natural gas in five regions. In 2017, OMV continued the portfolio optimization by entering Russia with approximately 100 kboe/d added to total production, the divestment of selected assets and efforts to strengthen partnerships in the Middle East and Africa region.
Norway
Austria
Tunisia
Pakistan
Madagascar
YemenUnited Arab Emirates
Kazakhstan
Russia
Romania
Libya
Upstream presence
New Zealand Central Eastern Europe
Middle East and Africa
North Sea
Russia
Australasia
Bulgaria
Kurdistan Region of Iraq
Australia
Oil Gas
65
35
North Sea
Middle East and Africa
71
29
100
Australasia
47
53
Production and oil and gas splitIn %
45
55
Central Eastern Europe
Russia
9kboe/d
Key achievements 2017
Highest production level in last five years Acquisition of 24.99% share in the Yuzhno Russkoye natural
gas field adding approximately 100 kboe/d to OMV’s daily production
Selected divestments in line with the focus on low-cost pro-duction regions and sustainable reserves replenishment
Further optimization of production costs
Competitive advantages
Focused portfolio with 4 core regions and 1 development region
Well positioned in attractive regions Low production cost Strong partnerships with major players in
hydrocarbon-rich regions
196kboe/d
79kboe/d
17kboe/d
46kboe/d
30
OMV FACTBOOK 2017 / UPSTREAM

OMV will continue to focus its portfolio on five regions with a production of more than 50 kboe/d: Central Eastern Europe, Middle East and Africa, North Sea and Russia. Australasia is to be devel-oped into a core region in order to unlock the growth potential of the rapidly growing Asian market.
Focused international player
The strategic priorities of OMV’s Upstream business are to renew and improve the quality of the asset base, double reserves, extend the track record of operational excellence and increase cash generation.
Financial and operational KPIs
2013 2014 2015 2016 2017Clean Operating Result in EUR mn 2,098 1,641 117 40 1,225Capital expenditure in EUR mn 4,431 2,951 2,140 1,356 2,7811
Exploration expenditure in EUR mn 627 693 607 307 230Production cost 2 in USD/boe 14.0 16.6 13.2 10.6 8.8Finding costs (single year) in USD/boe 20.8 12.7 13.9 6.4 3.2Finding & development costs (single year) in USD/boe 99.7 58.9 57.4 32.0 17.0Reserves replacement cost (single year) in USD/boe 53.3 62.0 57.8 17.1 9.9Hydrocarbon sales volumes in mn boe 99 110 105 109 118Average realized crude price in USD/bbl 100.8 91.3 48.9 39.8 49.9Average realized gas price in USD/1,000 cf 6.1 6.9 5.5 4.5 5.1Average realized gas price in EUR/MWh 15.1 17.0 16.2 13.2 14.8Proven reserves at year-end in mn boe 1,131 1,090 1,028 1,030 1,146Reserves replacement rate (3 years average) in % 93 87 73 70 116LTIR Upstream per mn hours worked 0.66 0.53 0.29 0.33 0.28
1 Including the acquisition of a 24.99% share in the Yuzhno Russkoye field in the amount of EUR 1,719 mn2 In 2016, the reported production cost was USD 11.6/boe; effective January 1, 2017, production cost excludes administrative expenses and selling and
distribution costs; the 2016 production cost figure of USD 10.6/boe presented in the table and throughout the document has been calculated based on the new definition for future comparability
ProductionIn kboe/d
2013 2014 2015 2016 2017Central Eastern Europe
Austria 35 33 32 28 28Romania 171 171 170 166 161Kazakhstan 11 9 9 8 7
Middle East and AfricaLibya 22 9 0 1 25Tunisia 10 9 8 8 7Pakistan 11 16 13 10 8Yemen 5 6 2 0 –Kurdistan Region of Iraq – – – – 7
North SeaNorway 5 35 47 70 79United Kingdom 2 2 1 1 –
Russia – – – – 9Australasia
New Zealand 16 19 20 18 17Total 288 309 303 311 348
Total organic CAPEX per region In EUR mn
1,064EUR mn
North Sea Central and Eastern Europe Middle East and Africa Russia
1P reserves per region In mn boe
1,146mn boe
194279
25
641
186
110
15
624
137
Australasia
31
OMV FACTBOOK 2017 / UPSTREAM

Exploration and production
Exploration and appraisal
Main producing assets
Main exploration and development projects
Tasbulat Aktas
Central Eastern Europe In Central Eastern Europe (CEE), OMV is active in Austria, Romania, Kazakhstan and Bulgaria. With a production of 196 kboe/d in 2017, OMV is among the largest producers in the region. As of December 31, 2017, proved reserves in CEE were 641 mn boe. OMV’s main objectives in CEE focus on maximizing profit-able recovery and on unlocking the Black Sea growth potential.
Romania
Kazakhstan
Presence in Central Eastern Europe
Austria
1 Regional 1P reserves at year-end 2017
Matzen
Neptun Deep
Komsomolskoye
Han Asparuh Turkmenoi
Key facts 2017
OMV is among the largest oil and gas producers in CEE
Production: 196 kboe/d Proven reserves: 641 mn boe 1
Upgrades of key infrastructure led to simplified operations
Strategic directions
Maximize profitable recovery Mature Neptun Deep project Continue active portfolio management
55
45
Austria
57
43
Romania
9
91
Kazakhstan
Production and oil and gas splitIn %
Oil Gas
28kboe/d
Bulgaria
28kboe/d
161kboe/d
7kboe/d
32
OMV FACTBOOK 2017 / UPSTREAM

Austria OMV has been an active player in Austria since the company’s founding over 60 years ago. In 2017, OMV Austria produced 28 kboe/d. Its major pro-ducing asset, Matzen, discovered in 1949, is the largest contiguous onshore oil field in Central Europe, with around 1.9 bn bbl of initial hydro-carbons in place. OMV also operates two under-ground gas storage facilities with a total reservoir capacity of over 2 bcm natural gas – more than one-quarter of Austria’s annual domestic demand.
OMV’s technological, commercial and stakeholder management skills ensure profitable and sustain-able exploration and production. State-of-the-art technologies such as water management, horizontal and casing drilling, as well as the increased uptime of pumping units, drive OMV’s performance. The worldwide research and development activities are located in Austria. In OMV’s research and appli-cation laboratory, experts develop a range of new concepts and technologies (e.g. reserve modeling or pressure main tenance) for application at OMV sites worldwide.
RomaniaIn 2004, OMV acquired a 51% stake in Petrom, southeastern Europe’s leading integrated oil and gas company. Since then, OMV has driven OMV Petrom’s successful transformation from a state-owned company to a modern, competitive Euro-pean oil and gas player. Over the last years es pe-cially, field redevelopment, drilling, workover, suc-cessful exploration projects and major operational excellence initiatives have further stabilized OMV Petrom’s production. Total production amounted to 161 kboe/d.
In 2017, OMV Petrom divested nineteen marginal fields as part of its portfolio optimization focus. Unlocking deep onshore opportunities in existing OMV Petrom’s licenses offers significant growth potential in addition to the Neptun Deep block.
KazakhstanAs a result of the Petrom acquisition, OMV also became operator of four producing onshore oil fields located in the west of Kazakhstan (Tasbulat, Turkmenoi, Aktas and Komsomolskoye), which contributed 7 kboe/d in 2017.
BulgariaIn Bulgaria, OMV holds a non-operated interest (Total, operator at 40%, OMV 30%, Repsol 30%) in the Han Asparuh exploration block, offshore Black Sea, strategically well positioned next to Neptun Deep, offshore, Romania. The exploration well Polsh kov-1 is the first oil discovery in Bulgaria’s sector of the Black Sea.
Licensees ExxonMobil (operator, 50%), OMV Petrom (50%)
Production Estimated gas volumes: 125 – 250 mn boe First gas: expected post 2020
Investments Joint Venture Expenditures to date (Exploration & Appraisal) over USD 1.5 bn Final investment decision expected in 2018
Neptun Deep project, offshore, gas, Romania
Daily production in CEEIn kboe/d
2013 2014 2015 2016 2017
Austria Romania Kazakhstan
171 171 170
35 33 32
11 9 9
217 213 211
166 161
28 28
8 7
202 196
33
OMV FACTBOOK 2017 / UPSTREAM
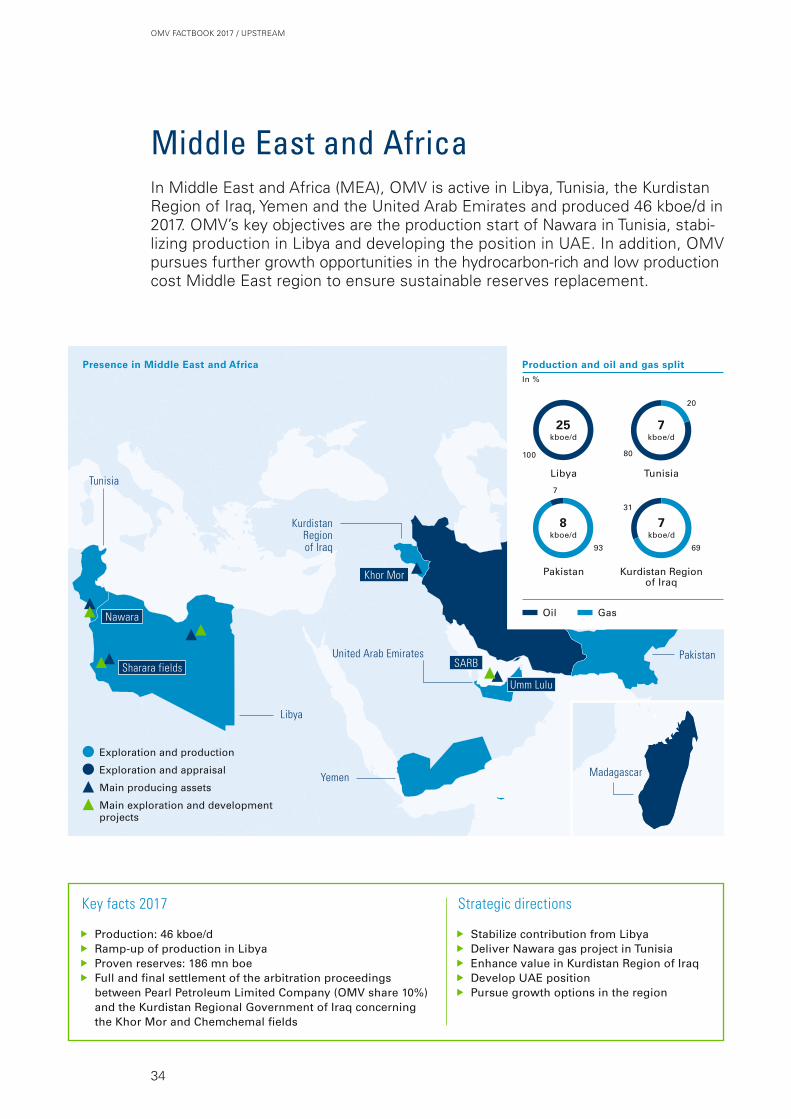
Presence in Middle East and Africa
Pakistan
United Arab Emirates
Kurdistan Region of Iraq
Oil Gas
7
31
93
Pakistan
Tunisia
80
20
69
Production and oil and gas split In %
Libya
Kurdistan Region of Iraq
100
25 kboe/d
7kboe/d
Khor Mor
Madagascar
Key facts 2017
Production: 46 kboe/d Ramp-up of production in Libya Proven reserves: 186 mn boe Full and final settlement of the arbitration proceedings
between Pearl Petroleum Limited Company (OMV share 10%) and the Kurdistan Regional Government of Iraq concerning the Khor Mor and Chemchemal fields
Strategic directions
Stabilize contribution from Libya Deliver Nawara gas project in Tunisia Enhance value in Kurdistan Region of Iraq Develop UAE position Pursue growth options in the region
Exploration and production
Exploration and appraisal
Main producing assets
Main exploration and development projects
In Middle East and Africa (MEA), OMV is active in Libya, Tunisia, the Kurdistan Region of Iraq, Yemen and the United Arab Emirates and produced 46 kboe/d in 2017. OMV’s key objectives are the production start of Nawara in Tunisia, stabi-lizing production in Libya and developing the position in UAE. In addition, OMV pursues further growth opportunities in the hydrocarbon-rich and low production cost Middle East region to ensure sustainable reserves replacement.
Middle East and Africa
Pakistan
7kboe/d
8kboe/d
SARB
Umm LuluSharara fields
Nawara
Libya
Yemen
Tunisia
34
OMV FACTBOOK 2017 / UPSTREAM

8
48
40
23
1
25
8
7
8
10
7
19
46
10
11
5
22
9
13
2
9
16
6
LibyaOMV has been present in Libya since 1975 and holds licenses in the Murzuq and Sirte basins. In 2015 and partially in 2016, production was not possible given the security situation. In September 2016, OMV was able to resume operations in the Sirte Basin. In 2017, OMV was able to steadily ramp up production with an average of around 25 kboe/d for the year.
TunisiaStarting in 2003, OMV acquired exploration and production assets in Tunisia. In 2014, OMV made the final investment decision for the Nawara gas field development. After the divestment of its stake in Ashtart in 2017, OMV holds working interest in one exploration permit and eleven production con-cessions. The production of the year 2017 reached 7 kboe/d.
PakistanIn 2018, as part of the ongoing portfolio optimiza-tion, OMV divested its Upstream business in Paki-stan to Dragon Prime Hong Kong Limited. OMV Pakistan produced 8 kboe/d in 2017 mainly as oper-ator of the producing blocks Mehar, Sawan, Miano, Latif and Tajjal. OMV further held interests in five exploration blocks, of which four were operated.
Kurdistan Region of Iraq OMV holds a 10% share in Pearl Petroleum Com-pany Limited (“Pearl”), a gas field operator. OMV booked Pearl’s reserves for the first time in 2016 and included the Pearl production contribution from 2017 onwards. In 2017, the production of Pearl reached 7 kboe/d.
YemenIn April 2015, OMV had to shut down all produc-tion facilities due to a major deterioration of the security environment (6.4 kbbl/d production in 2014). Since then, OMV continuously monitored the situation and kept wells and facilities main-tained in a constant state of readiness for resump-tion of production once the situation permitted. Comprehensive technical, commercial and security arrangements have been put in place to resume production from Block S2 since April 1, 2018. OMV holds four exploration and production licenses in Yemen.
United Arab EmiratesIn 2017, business development efforts were inten-sively pursued in the United Arab Emirates as major onshore and offshore oil agreements were being renewed. In 2018, OMV was awarded a 20% stake in the offshore concession Abu Dhabi – SARB and Umm Lulu as well as the associated infra- structure. OMV’s share of the reserves for the period of the concession agreement would amount to approximately 450 mn barrel oil. Expected long-term plateau production is 40 kbbl/d, net to OMV.
Licensees OMV (operator, 50%), ETAP (50%)
Production Cumulative production: 40 – 50 mn boe of gas Peak production: ~10 kboe/d First gas: expected 2019
Investments Final investment decision taken in 2014
Nawara project, onshore, gas, Tunisia
MadagascarIn 2015, OMV conducted a 3,000 km² 3D seismic survey in its offshore operated Grand Prix license. Since 2017, OMV undertook continuous efforts to identify a farm-in partner to share the high risks associated to drilling an exploration well in the Grand Prix license.
Daily production in MEAIn kboe/d
2013 2014 2015 2016 2017
Libya Tunisia Pakistan Yemen Kurdistan Region of Iraq
35
OMV FACTBOOK 2017 / UPSTREAM

North SeaOMV is active in exploration, appraisal, development and production projects in Norway and is focusing on bringing Aasta Hansteen on stream, maturing the Wisting discovery and expanding its exploration activities.
5
3547
7079
2
1
10
7
3748
7179
2
NorwayOMV became a major offshore oil and gas producer in Norway in 2013 after the acquisition of the pro-ducing field Gullfaks (19% share) and the Gudrun development (24% share). Also in 2013, OMV made the Wisting discovery in the Barents Sea. The Gudrun and Edvard Grieg (20% share) fields came on stream in 2014 and 2015, respectively. In total, OMV pro-duced an average of 79 kboe/d in 2017. OMV (Norge) AS holds 43 licenses located in the North Sea, the Norwegian Sea and in the Barents Sea. In 2018, OMV discovered gas and condensate in the Norwegian Sea, the Hades and Iris discoveries.
Key facts 2017
Production: 79 kboe/d Proven reserves: 110 mn boe
Strategic directions
Bring Aasta Hansteen on stream Mature Wisting to unlock potential of up to 130 mn bbl total
recoverable oil resources Expand exploration portfolio
Presence in North Sea
Norway
Licensees Equinor (operator, 51%), Wintershall (24%), OMV (15%), ConocoPhillips (10%); includes Polarled pipeline project (OMV share ~9%)
Production Cumulative production: ~43 mn boe of gas Peak production: ~18 kboe/d First gas: expected Q4/18
Investments Final investment decision taken in 2012
Aasta Hansteen project, offshore, gas, Norway
Aasta Hansteen
Wisting
Gullfaks
Gudrun
Edvard Grieg
Exploration and production
Main producing assets
Main exploration and development projects
Daily production in North SeaIn kboe/d
2013 2014 2015 2016 2017
Norway United Kingdom
Production and oil and gas split In %
35
Norway
Oil Gas
79kboe/d
65
36
OMV FACTBOOK 2017 / UPSTREAM

Presence in Russia
In 2017, OMV established Russia as a new core region following the acquisition of approximately 25% in the giant Yuzhno Russkoye gas field. In 2016, OMV signed an asset swap agreement with Gazprom for nearly 25% of the Achimov IV/V development project in Urengoy, one of the world’s largest gas fields. Russia offers abundant remaining hydrocarbon reserves, a low-cost structure and an established pipeline access to the European gas markets.
Russia
Russia
Yuzhno Russkoye On November 30, 2017, OMV completed the acqui-sition of a 24.99% share in the Yuzhno Russkoye natural gas field located in Western Siberia from Uniper SE. The acquisition added more than 100 kboe/d to OMV’s production.
Achimov IV/V In December 2016, OMV reached a binding “Basic Agreement” with Gazprom for an asset swap trans action, consisting of OMV’s acquisition of a 24.98% interest in the Achimov IV/V phase devel-opment in the Urengoy field (Western Siberia) and, in exchange, Gazprom’s 38.5% participation in OMV (NORGE) AS. The giant Urengoy field is a deep reservoir, rich in gas condensate. Production is expected to start in 2020 with a plateau of more than 80 kboe/d to be reached in 2025.
Russia
Oil Gas
100
Yuzhno Russkoye
Production and oil and gas split In %
~100
~150
~100
9kboe/d
Exploration and production
Main producing assets
Main exploration and development projects
Achimov IV/V
1 Subject to closing
Key facts 2017
Acquisition of 24.99% in Yuzhno Russkoye gas field
Production: 9 kboe/d Proven reserves: 194 mn boe
Strategic directions
Realize organic growth potential Continue growth path with Achimov IV/V 1
Contribute >1 bn boe recoverable resources (Achimov IV/V and Yuzhno Russkoye)
Review further acquisition opportunities
Expected daily production in RussiaIn kboe/d
2018 2020 2025
Yuzhno Russkoye Achimov IV/V 1
1 Subject to closing
37
OMV FACTBOOK 2017 / UPSTREAM

Australasia
New ZealandNew Zealand is a strong and stable cash generator with a production of 17 kboe/d in 2017 from three offshore assets in the Taranaki region. Maari is New Zealand’s largest oil field and operated by OMV (69% share). The Pohokura (26% share) and Maui (10% share) fields meet about 60% of New Zea-land’s gas demand.
In March 2018, OMV agreed to acquire Shell’s upstream business in New Zealand comprising of joint venture interest in Pohokura (48%) and Maui (83.75%). OMV intends to assume operatorship in both joint ventures. The transaction is expected to be completed in 2018 and adds recoverable resources of up to 100 mn boe to the region’s portfolio. In parallel OMV has also acquired Shell’s 60.98% interest in the Great South Basin exploration block.
AustraliaOMV is active in two non-operated exploration permits. A new 3D seismic survey acquired in early 2017 will allow further evaluation of the Zola and Bianchi discoveries.
OMV is engaged in exploration and production activities in New Zealand and in exploration in offshore Australia. In 2017, production was 17 kboe/d and proven reserves at year-end were 15 mn boe. Australasia is to be developed into a core region in order to unlock the growth potential of the rapidly growing Asian market.
2016 171819
Presence in Australasia
Australia
New Zealand
47
53
New Zealand
Oil Gas
Production and oil and gas split In %
Key facts 2017
Production: 17 kboe/d Proven reserves: 15 mn boe
Strategic directions
Realize upside of current position in New Zealand Exploit promising exploration potential (approx. 35,000 km2) Develop Australasia into a core region
17kboe/d
Pohokura
Great South Basin
Maari
Maui
Exploration and production
Exploration and appraisal
Main producing assets
Main exploration and development projects
Daily production AustralasiaIn kboe/d
2013 2014 2015 2016 2017
New Zealand
38
OMV FACTBOOK 2017 / UPSTREAM

OMV is exploring and producing oil and gas offshore while maintaining a focus on health, security, safety and environment.
OMV FACTBOOK 2017 / UPSTREAM

OMV’s Schwechat refinery in Austria delivers top industry performance together with the highest safety, environmental and product standards.
OMV FACTBOOK 2017 / DOWNSTREAM

OMV’s Downstream business consists of Downstream Oil and Downstream Gas. Downstream Oil has three refineries in Central Eastern Europe, two of which have strong petrochemical integration. After the sale of its Turkish subsidiary OMV Petrol Ofisi in June 2017, OMV operates a retail network of approximately 2,000 filling stations in Europe. Downstream Gas is active along the entire gas value chain. Gas sales volumes amounted to 113 TWh in 2017.
113 TWh
18 %
90 %
23.8 mn t
CLEAN CCS RETURN ON NET ASSETS (IN 2016: 14%)
CLEAN CCS OPERATING RESULT (IN 2016: € 1.5 BN)
REFINERY UTILIZATION RATE 2 (IN 2016: 89%)
NATURAL GAS SALES VOLUMES (IN 2016: 109 TWH)
REFINED PRODUCT SALES 1 (IN 2016: 30.7 MN T)
€ 1.6 BN Downstream Oil
€ 0.2 BN Downstream Gas 2 Despite planned turnaround activities in Schwechat refinery
1 Including 4 mn t sales of OMV Petrol Ofisi, divested in June 2017
€ 1.8 bn
41
OMV FACTBOOK 2017 / DOWNSTREAM
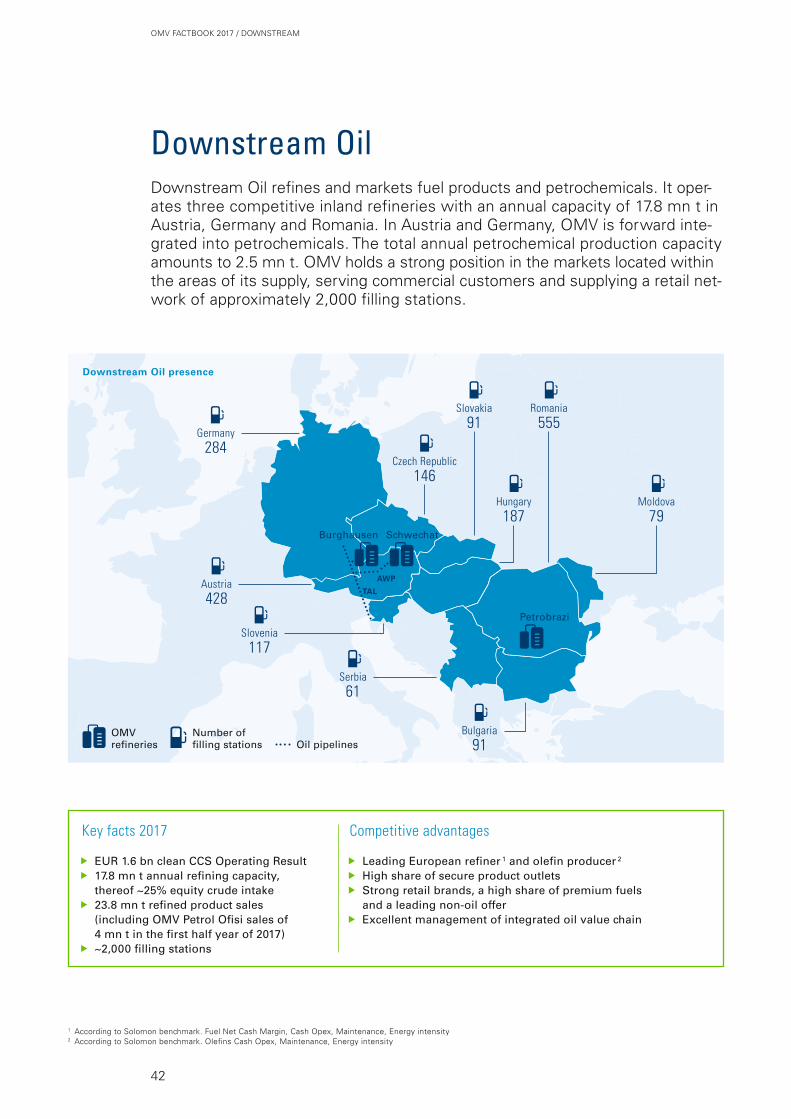
Downstream Oil refines and markets fuel products and petrochemicals. It oper-ates three competitive inland refineries with an annual capacity of 17.8 mn t in Austria, Germany and Romania. In Austria and Germany, OMV is forward inte-grated into petrochemicals. The total annual petrochemical production capacity amounts to 2.5 mn t. OMV holds a strong position in the markets located within the areas of its supply, serving commercial customers and supplying a retail net-work of approximately 2,000 filling stations.
Downstream Oil
Burghausen Schwechat
Petrobrazi
TAL
AWP
OMV refineries
Number of filling stations
Germany284
Czech Republic146
Slovakia91
Hungary187
Romania555
Moldova79
Austria428
Slovenia117
Serbia61
Bulgaria91
Downstream Oil presence
Oil pipelines
Key facts 2017
EUR 1.6 bn clean CCS Operating Result 17.8 mn t annual refining capacity,
thereof ~25% equity crude intake 23.8 mn t refined product sales
(including OMV Petrol Ofisi sales of 4 mn t in the first half year of 2017)
~2,000 filling stations
Competitive advantages
Leading European refiner 1 and olefin producer 2
High share of secure product outlets Strong retail brands, a high share of premium fuels
and a leading non-oil offer Excellent management of integrated oil value chain
1 According to Solomon benchmark. Fuel Net Cash Margin, Cash Opex, Maintenance, Energy intensity2 According to Solomon benchmark. Olefins Cash Opex, Maintenance, Energy intensity
42
OMV FACTBOOK 2017 / DOWNSTREAM

OMV’s Downstream Oil business model is charac-terized by a high degree of physical integration along the value chain from equity crude production to refining, retail and commercial sales. OMV’s comprehensive market and technology expertise is translated into optimizing supplies, balancing demand and production capacities, and offering an optimum product mix. In 2017, a quarter of the crude processed in OMV’s three refineries came from Austrian and Romanian oil fields. The remain-der is supplied seaborne via a reliable and cost- effective pipeline system from the Adriatic Sea.
Total sales volumes, excluding OMV Petrol Ofisi, amounted to 19.8 mn t. In Europe, OMV marketed 6.2 mn t of fuel products plus a broad range of non-fuel products and services through its own network of filling stations. Commercial sales of fuel products totaled 9.5 mn t. Jet fuel contributed 1.9 mn t to total sales volumes and was supplied via pipelines to major airports such as the Vienna and Munich airports. Petrochemical sales were 2.2 mn t in 2017.
Financial and operational KPIs
2013 2014 2015 2016 2017Clean CCS Operating Result in EUR mn 614 709 1,566 1,341 1,554
thereof fuels 1 in EUR mn 193 248 864 588 811thereof petrochemicals in EUR mn 140 148 262 238 246thereof Borealis in EUR mn 152 205 356 399 399thereof OMV Petrol Ofisi 2 in EUR mn 129 108 84 116 98
OMV indicator refining margin in USD/bbl 3.0 4.1 7.2 4.7 6.0Ethylene/propylene net margin in EUR/t 362 397 419 375 427Refinery utilization rate in % 92 89 93 89 90Total refined product sales in mn t 31.5 31.1 30.0 30.7 23.8
thereof retail 1 in mn t 5.6 5.5 5.7 6.0 6.2thereof petrochemicals in mn t 2.2 2.0 2.3 2.3 2.2thereof OMV Petrol Ofisi in mn t 7.5 9.5 10.0 10.7 4.0
Capital expenditure in EUR mn 507 607 546 463 491Number of filling stations 1 2,016 1,998 2,010 2,068 2,039Average throughput per filling station 1 in mn l 3.4 3.3 3.5 3.6 3.7
1 Excluding OMV Petrol Ofisi2 OMV Petrol Ofisi classified as asset held for sale by the end of 2016; depreciation not included in 2017 results
Crude supply Refinery productionProduct supply
and logisticsPetrochemical/com mercial/
retail sales
Equity crude production
4.3 mn t
Crude from third parties
11.7 mn t
Crude oil refining 1
16.0 mn t(90% utilization rate of 17.8 mt
refining capacity)
Storage Rail/truck/ship
Retail
6.2 mn t
Commercial
9.5 mn t
Aviation
1.9 mn t
Petrochemicals
2.2 mn t
1 Internal consumption to be deducted2 Volumes include blending components and exclude purchase of products for OMV Petrol Ofisi
3 OMV Petrol Ofisi divested in June 20174 Retail and petrochemical sales
OMV Petrol Ofisi 3
4.0 mn t
Purchase of products 2
4.0 mn t
Purchase of semi-finished
products
1.5 mn t 1
Captive market 4
47%
wholesale
53%
Customer allocation
in %
Downstream Oil business model
43
OMV FACTBOOK 2017 / DOWNSTREAM

Refining
OMV operates three refineries in Schwechat (Austria), Burghausen (Germany) and Petrobrazi (Romania) with an annual capacity of 17.8 mn t, equaling 370,000 bbl/d. The regional proximity of the three sites allows OMV to operate them as one integrated refining system. Intermediate products are exchanged between the refineries in order to optimize product flows and maximize returns.
Over the last few years, OMV has put a lot of effort into increasing refining profitability and perfor-mance indicators. The challenging market environ-ment during 2012 and 2014 due to overcapacity and high crude oil prices prompted OMV to initiate an efficiency program to increase competitiveness. This resulted in significant cost reductions and an improved margin.
These efforts are reflected in the high ratings of the Schwechat and Burghausen refineries in the Solomon studies, which benchmark refineries worldwide. The two refineries rank in the top two quartiles in Europe in most categories, including personnel intensity, energy efficiency, mainte-nance costs, operational availability and net cash margin.
The geographical location of OMV’s refineries and their connection to a strong pipeline infrastructure ensure sourcing flexibility with access to both domestic and international crude oil supplies. Flex-ible refinery configuration and the access to broad feedstock supplies enable profit optimization along the entire value chain.
A high utilization rate is key to the profitable oper-ation of a refinery. With a utilization rate of around 90%, OMV has been above the European average since 2011, benefiting from the strong petrochemical integration and its marketing activities.
OMV’s refineriesSchwechatSchwechat is Austria’s only refinery. It features a very high conversion rate with low black-product yield and the technical flexibility to process a mix-ture of heavy, medium and light sweet crude oils. In 2017, it processed around 35 types of crudes. The site is connected to the Transalpine (TAL) and Adria-Wien Pipeline (AWP) pipelines, ensuring competitive seaborne crude supply. Schwechat is forward integrated into petrochemical, producing ethylene, propylene, butadiene and aromatic com-ponent. The refinery also supplies fuels to OMV’s strong network of filling stations as well as via pipeline to the Vienna airport, which is in close proximity.
In 2017, Schwechat refinery carried out a planned turnaround, held once every six years. The turn-around not only involved maintenance work and safety inspections, but also saw a range of projects implemented in various operation areas. In the course of the turnaround OMV invested around EUR 110 mn in the Schwechat site, making a key contribution to operational safety and with it the long-term security of the site.
Burghausen The Burghausen refinery, located at the German- Austrian border, is a smaller, specialized facility. It is a heavy fuel oil free refinery (all heavy compo-nents are converted to high-quality calcinate), ranking among the top refineries in the German market. Burghausen processes medium and light crude oils. The refinery is supplied with crude via the Transalpine (TAL) pipeline connected to the marine terminal in Trieste, Italy. Its setup is focused on jet, middle distillates and petrochemical prod-ucts. It does not produce gasoline and heavy fuel oil. The jet fuel output is supplied via pipeline to Munich airport.
PetrobraziThe Petrobrazi refinery, located about 60 km from Bucharest (Romania), processes local equity heavy crude oil into fuel products. The refinery’s yield structure allows the production of gasoline, middle distillates and low sulfur heavy fuel oil. The site is connected to the domestic crude pipeline infra-structure and to the import crude oil pipeline from the Constanta oil terminal. The refinery is highly integrated with the regional fuels marketing busi-ness, which includes over 700 fuel stations in Romania, Moldova, Bulgaria and Serbia.
Competitive advantages refining
Close proximity of the three refineries al-low operation as one integrated system
Forward integration into petrochemicals Competitive cash-cost position Above average net cash margin
3 Sites –
1 Refinery concept
allowing optimization of returns
44
OMV FACTBOOK 2017 / DOWNSTREAM

InvestmentsOver the last five years, OMV has continuously invested in its refineries to improve efficiency and increase integration with petrochemicals. In Schwechat, investments were made in an exten-sion of butadiene capacities and the increase of heavy residue transfers to Burghausen for coking conversion. In Burghausen, most of the spending was focused on the expansion of petrochemical operations, including the construction of a new butadiene plant, which was completed in 2015.
From 2010 to 2014, OMV invested more than EUR 600 mn into the Petrobrazi modernization program. This improved the refinery’s capacity for processing heavy Romanian equity crude and increased middle distillate yields up to 45%. Cur-rently in Petrobrazi, OMV is investing in a polyfuel unit, allowing the conversion of Liquefied Petro-leum Gas (LPG) into more valuable gasoline and middle distillates.
OMV has announced mid-March 2018 investments of up to EUR 1 bn for refinery upgrades over the next 8 years. The Group focuses on strengthening the production of high-value products like jet fuel and petrochemicals, while at the same time plan-ning to minimize the heavy fuel oil volumes. In addition to Burghausen, Schwechat is planned to be heavy fuel oil free by 2025.
OMV plans an expansion of its petrochemical production in Burghausen and is evaluating the possibility of a steam cracker expansion at the Schwechat refinery. Petrochemical upgrades are also currently under assessment in Romania.
Energy efficiency Energy use makes up a significant share of the refinery operating cost and is, aside from feed-stock costs, the second-largest expense factor. Even small gains in energy efficiency can contrib-ute strongly to profitability while also lowering carbon emissions. Over the last few years, OMV has implemented numerous energy efficiency improvements such as optimization of waste heat utilization, essential changes in steam supply and condensation systems, optimization of turbine control and crude gas turbines, and thermal insula-tion. The Burghausen refinery is a leader in energy efficiency among European refineries. Petrobrazi, too, has reduced its energy consumption by approximately 25% since 2009.
OMV is committed to continuously decreasing the energy intensity of OMV production facilities by optimizing operations, technologies and process design.
Refining capacityIn mn t
Schwechat 9.6 Petrobrazi 4.5 Burghausen 3.8
9.6
4.5
3.8
17.8mn t
Integrated refinery yield 1
In %
1 Operated as “3 Sites – 1 Refinery”; LPG and naphtha used as feedstock for petrochemicals
2 Excluding jet fuel3 Thereof 1% low sulfur heavy fuel oil and 1% high sulfur heavy fuel oil
ETOP – Electronic Turnaround Optimization Platform
This state-of-the-art IT system supports pro-cess steps in the context of large refinery projects, by featuring digital recordings of all processes and workflows via touchscreens or tablets directly on site. All technical data and plans as well as the actual status of all work-flows are now readily available anytime and anywhere.
9% Internal consumption
3% Others
9% Heavy products 3
41% Middle distillates 2
9% Jet fuel
17% Gasoline
12% Petrochemicals
45
OMV FACTBOOK 2017 / DOWNSTREAM
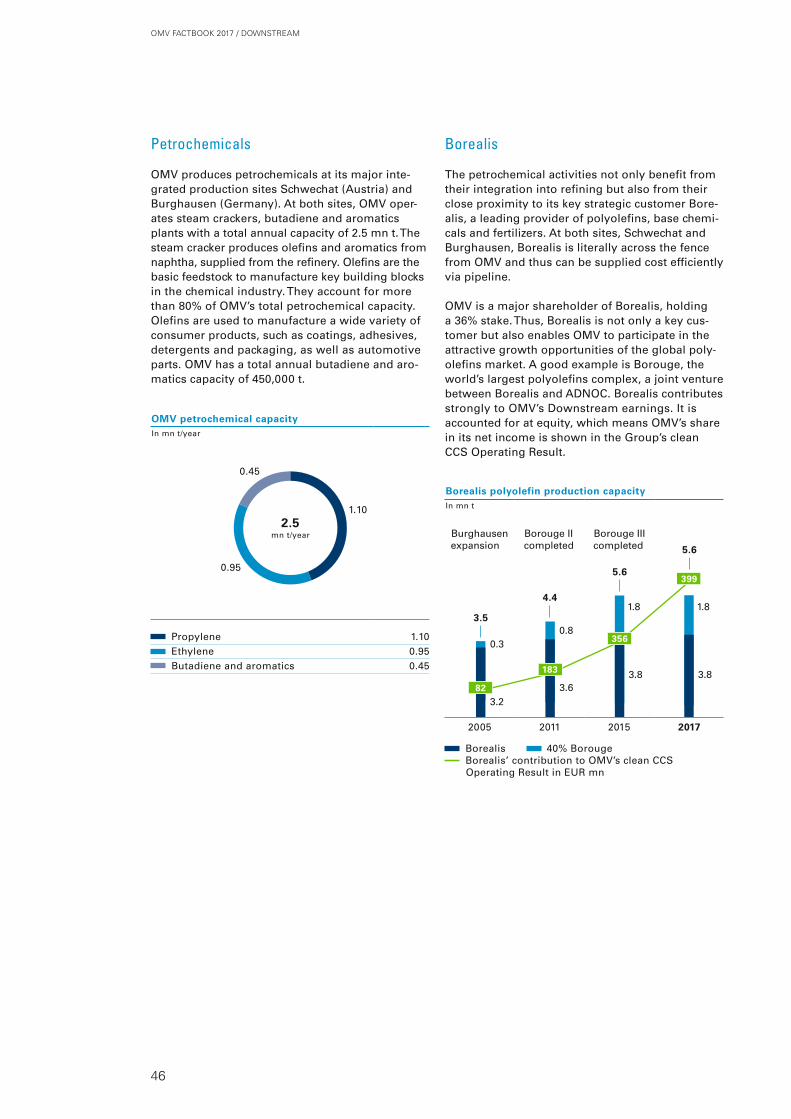
Petrochemicals
OMV produces petrochemicals at its major inte-grated production sites Schwechat (Austria) and Burghausen (Germany). At both sites, OMV oper-ates steam crackers, butadiene and aromatics plants with a total annual capacity of 2.5 mn t. The steam cracker produces olefins and aromatics from naphtha, supplied from the refinery. Olefins are the basic feedstock to manufacture key building blocks in the chemical industry. They account for more than 80% of OMV’s total petrochemical capacity. Olefins are used to manufacture a wide variety of consumer products, such as coatings, adhesives, detergents and packaging, as well as automotive parts. OMV has a total annual butadiene and aro-matics capacity of 450,000 t.
Borealis
The petrochemical activities not only benefit from their integration into refining but also from their close proximity to its key strategic customer Bore-alis, a leading provider of polyolefins, base chemi-cals and fertilizers. At both sites, Schwechat and Burghausen, Borealis is literally across the fence from OMV and thus can be supplied cost efficiently via pipeline.
OMV is a major shareholder of Borealis, holding a 36% stake. Thus, Borealis is not only a key cus-tomer but also enables OMV to participate in the attractive growth opportunities of the global poly-olefins market. A good example is Borouge, the world’s largest polyolefins complex, a joint venture between Borealis and ADNOC. Borealis contributes strongly to OMV’s Downstream earnings. It is accounted for at equity, which means OMV’s share in its net income is shown in the Group’s clean CCS Operating Result.
OMV petrochemical capacityIn mn t/year
Propylene 1.10 Ethylene 0.95 Butadiene and aromatics 0.45
1.10
0.95
0.45
2.5mn t/year
0.30.8
1.8
3.23.6
3.8
3.5
4.4
5.6
1.8
3.8
5.6
Burghausen expansion
Borouge II completed
Borouge III completed
82
183
356
399
Borealis polyolefin production capacityIn mn t
2005 2011 2015 2017
Borealis 40% Borouge Borealis’ contribution to OMV’s clean CCS
Operating Result in EUR mn
46
OMV FACTBOOK 2017 / DOWNSTREAM

Retail and commercial
OMV sells its refined products via its retail filling stations network and to commercial customers. The Group’s total refined product sales amounted to 23.8 mn t in 2017. Around 35% of the total vol-umes were marketed via the retail channel while ~50% were sold via the commercial channel. Petro-chemicals account for the remainder.
RetailAt the end of 2017, OMV operated a network of more than 2,000 filling stations. The Turkish subsid-iary OMV Petrol Ofisi, with roughly 1,700 stations, was divested in June 2017. The current network covers ten countries in Central Eastern Europe. More than half of the filling stations are in OMV’s key markets Austria (428 sites), Romania (555 sites) and Germany (284 sites). Other countries where OMV is active are the Czech Republic, Hungary, Slovakia, Slovenia, Bulgaria, Serbia and Moldova. The filling station network’s geographical focus is on markets close to OMV’s three refineries. This allows the Group to maximize the integrated mar-gins from refineries to the retail network. About one-third of OMV’s refined products is sold via the retail channel.
Over the last five years, OMV has significantly trans-formed its retail business by means of network opti-mization, clear customer segmentation and strate-gic operational improvements. The Group divested about 160 non-strategic sites in the Czech Republic, Croatia and Bosnia-Herzegovina, which did not have competitive advantages or critical mass.
At the same time, OMV strengthened its position in key markets with the acquisition of about 70 un -manned filling stations in Austria and Slovenia in 2016. In June 2017, OMV achieved another import-ant milestone in its active portfolio management with the divestiture of the Turkish OMV Petrol Ofisi subsidiary.
This optimization has improved OMV’s average throughput per station to more than 3.7 mn l per annum and strongly increased the operating result per filling station by 18% compared to 2016.
The retail segment serves as an important and stable distribution channel for fuel products and plays an essential role in building OMV’s brand image. OMV has a multibrand strategy to address different customer needs.
OMVOMV is the Group’s premium brand standing for highest quality fuels, modern convenience stores including a fresh gastro offering and a wide range of other services. OMV’s high-performance Maxx-Motion fuels ensure improved efficiency and lon-gevity of engines. The appealing VIVA convenience stores offer a broad range of items, fresh snacks, coffee and services. OMV operates around 1,300 filling stations under the OMV brand in nine Euro-pean countries.
PetromThe Petrom brand stands for “value for money,” offering high-quality fuels at attractive prices. The Petrom brand is well known in Romania and Mol-dova, where it has been used since 1988 and 2000, respectively.
Avanti and DiskontBoth brands target the discount segment. The unmanned filling stations have no shops and pro-vide customers with a cost- and time efficient way to fill their tank. The majority of the Avanti filling stations are located in Austria. The Diskont filling stations are strategically located at Hofer/Aldi Süd supermarkets, benefiting from a high number of customers and equal customer proposition.
A further expansion of the successful unmanned concept in Austria is planned for Germany, Hungary and Slovenia. Several pilot stations will be built and evaluated in 2018.
Retail Operating Result per filling station 1
In thousand EUR
2013 2014 2015 2016 2017
1 Excluding OMV Petrol Ofisi, which was divested in June 2017
6481
113136
161
Throughput per station 1
In mn liters
2013 2014 2015 2016 2017
1 Excluding OMV Petrol Ofisi, which was divested in June 2017
3.4 3.33.5 3.6 3.7
47
OMV FACTBOOK 2017 / DOWNSTREAM
MaxxMotionAt its technology center in Austria, OMV continu-ously improves its premium fuels with outstanding quality and performance. OMV’s innovation teams work in close collaboration with leading automotive Original Equipment Manufacturers (OEMs), research institutes and universities to be at the forefront of future developments in fuel technology.
The successful MaxxMotion performance fuels are a great example of OMV’s innovation capabilities. MaxxMotion stands for maximum power, a longer engine life and lower emissions. Whether diesel or gasoline, MaxxMotion delivers maximum perfor-mance with a clean combustion process. Maxx-Motion 100plus and MaxxMotion Diesel protect a car’s engine from the inside, as well as remove and minimize harmful deposits. Special, innovative additive formulations keep the engine clean, reduce wear and sustainably prolong the engine’s lifespan.
The new 100-octane gasoline fulfills the highest quality requirements as set out in Category 5 of the Worldwide Fuel Charter. This guideline issued by major automobile and engine manufacturers’ associations for the definition of optimal fuel char-acteristics defines five categories of fuel quality, each with specific fuel properties and values. The excellent winter properties of OMV MaxxMotion Diesel ensure reliable engine operation even at ice-cold temperatures of up to – 40°C (CFPP value according to EN 590).
VIVAFor many years now, OMV filling stations have not only been a place to find first-class fuels but also an increasing range of services to make the stop as convenient as possible for people on the go. VIVA, OMV’s convenience store brand, has established a new filling station culture, where a stop at the ser-vice station offers a welcome break from the daily hustle and bustle, with an appealing atmosphere, a top-quality product range and helpful, service oriented staff. In addition to freshly prepared snacks, VIVA offers more than 1,500 everyday products, exquisite coffee, gifts, the VIVA wine store and much more. There is also an array of services to meet the needs of people on the go. OMV operates around 800 OMV filling stations with VIVA branded convenience stores in nine European countries from Germany to Romania.
The VIVA convenience store concept has devel-oped into a very attractive business and contrib-utes significantly to OMV’s retail earnings. “We
Commercial salesOMV sells fuel products to a broad range of busi-ness customers in Central Eastern Europe. This includes sales to other oil companies and distribu-tors. In 2017, the Group sold around 11.4 mn t of gasoline, diesel, jet and marine fuels, as well as heating oil and specialty products, such as bitumen and petrochemicals.
OMV is the leading diesel and gasoline supplier in its core markets Austria and Romania. The com-mercial business focuses on large industrial cus-tomers in the main segments of road transportation, construction and industries, reseller, marine and petrochemical industry.
In the attractive growing aviation market OMV sup-plies the largest airports in the CEE region. The air-ports in Vienna and Munich are directly supplied via pipeline from OMV’s nearby refineries.
The OMV Card is accepted at about 2,000 OMV, Petrom, Avanti and DISKONT filling stations and at the international ROUTEX partners’ network. To differentiate from the competition in the commodity business the following five customer promises are the core of OMV’s customer value proposition.
Supply security Easy to do business Industry professionals Quality products Competitive conditions
The commercial sales channel allows OMV to ensure high refinery utilization and enables the maximiza-tion of integrated margins along the value chain.
Competitive advantages retail
Clear regional focus, filling stations in close proximity of OMV’s refineries
Strong brands in all markets Above average throughput per station
compared to branded peers High share of premium fuels
(MaxxMotion trademark) Successful convenience store concept with
high contribution to total retail margin
Care More” reflects OMV’s retail philosophy to put the customer at the core of its activities. OMV wants to stand out from the competition by going beyond customers’ expectations and by providing more added value – by caring more about customers’ needs.
– 40°COMV MaxxMotion
Diesel ensuring reliable engine
operations at low temperatures
48
OMV FACTBOOK 2017 / DOWNSTREAM

MaxxMotion Diesel protects a car’s engine from the inside, as well as removes and minimizes harmful deposits.
OMV FACTBOOK 2017 / DOWNSTREAM

Downstream Gas operates across the gas value chain from the wellhead to the end customer with a fully integrated gas sales and logistics business. OMV engages in the regulated gas transportation business in Austria with a share in the infrastructure company Gas Connect Austria and operates storage capacities in Austria and Germany. Its activities also cover the non-regulated business with supply, marketing and trading of gas in Europe and Turkey and financing of the Nord Stream 2 pipeline development. Downstream Gas includes the Group’s power business activities, with one gas-fired power plant in Romania and one in Turkey, which is expected to be divested by the end of 2018.
Downstream Gas
Gas pipelines
Equity gas
LNG terminal
Gas-fired power plant
Gas storage
Germany
Austria
Hungary
Romania
Turkey 1
Croatia
Netherlands
Downstream Gas presence
Key facts 2017
EUR 217 mn clean Operating Result ~31 TWh (~2.7 bcm) gas storage capacities
in Austria and Germany ~80 TWh of equity production 113 TWh gas sales volume in Europe
Competitive advantages
Strongly integrated portfolio along the value chain Market leader in Austria and Romania Long-term reliable partnerships and contracts with Europe’s
major gas suppliers Gazprom and Equinor Positioned at the center of Europe’s transmission network
with a 51% stake in Gas Connect Austria
1 OMV signed divestment agreement for Samsun power plant in Turkey on May 30, 2018
50
OMV FACTBOOK 2017 / DOWNSTREAM

OMV Downstream Gas is active along the entire gas value chain able to capture higher returns for the complete gas supply portfolio. Total gas vol-umes from equity production amounted to 77 TWh, from Romania, Norway and Austria. Third-party volumes are supplied under a number of contracts with Gazprom (Russia) and Equinor (Norway).
OMV runs gas storage facilities with a total capaci-ty of ~31 TWh. Its subsidiary Gas Connect Austria operates a gas pipeline network in Austria. The Group ensures flexibility and short-term balancing
of supply and consumption by using part of its storage capacities and by trading gas on the Euro-pean hubs. Total sales volumes amounted to 113 TWh in 2017. The gas is marketed to end-use customers and commercial customers with a strong focus on industrial customers and munici-palities in six European countries and in Turkey. In the power business, OMV runs one gas-fired power plant in Brazi, Romania, and another one in Samsun, Turkey. In May 2018, OMV signed an agreement to divest the Samsun power plant. Total power output amounted to 7.1 TWh in 2017.
Financial and operational KPIs
2013 2014 2015 2016 2017Clean Operating Result in EUR mn 142 102 (19) 192 217
thereof gas transportation Austria (Gas Connect Austria) in EUR mn 92 101 123 131 97
Natural gas sales volumes in TWh 126 114 110 109 113thereof OMV Gas in TWh 70 57 57 56 57thereof OMV Petrom in TWh 46 44 45 44 45thereof OMV Turkey in TWh 10 13 8 9 11
Natural gas trading volumes in TWh 285 360 493 687 712Average storage volume sold in TWh 8 18 21 22 16Gas supply volumes in TWh 422 492 588 787 843
thereof equity gas in TWh 60 67 67 71 77thereof Russia in TWh 54 44 50 51 71thereof Norway in TWh 5 8 8 8 8thereof other in TWh 303 372 463 656 686
Net electrical output in TWh 4.3 5.8 5.4 5.2 7.1Capital expenditure in EUR mn 270 243 62 49 90
Equity production in Romania
49 TWh
Equity production in Norway
19 TWh
Gas sales to third parties
113 TWh
Sales in Europe 1
57 TWh
Sales in Romania
45 TWh
Sales in Turkey
11 TWh
Equity production in Austria
9 TWh
Purchase from Russia
72 TWh
Purchase from Norway
8 TWh
Internal consumption and
balancing
Gas supply portfolio
157 TWh
Gas pipeline transportation (Gas Connect
Austria)
1,499 TWh
Gas storage volume sold
16 TWh
Gas logistics business (including transit gas)
1 Excluding Romania
Gas supply Gas logistics Gas marketing sales
Downstream Gas business model
51
OMV FACTBOOK 2017 / DOWNSTREAM

Supply, marketing and trading
OMV markets and trades natural gas in six Euro-pean countries and in Turkey. Total gas sales volumes amounted to 113 TWh in 2017. With about 40%, Romania accounted for the lion’s share of sales volumes. In its domestic market, Austria, OMV also holds a leading position. The main trading platforms used are the Central European Gas Hub (CEGH) in Austria and the energy exchange plat-form OPCOM in Romania. OMV holds a 65% stake in CEGH Aktiengesellschaft.
OMV has successfully restructured Downstream Gas, a business confronted with significant adverse market changes in the past years. In 2017, the Group took over the minority shares in EconGas and sub-sequently integrated the company into OMV Gas Marketing & Trading. OMV implemented several steps – such as restructuring the organization, real-izing synergies from the integration of EconGas and amending the long-term gas supply contracts – and placed the gas business on a sound and solid foundation.
Logistics
Gas Connect Austria Gas Connect Austria (GCA) operates a 900 km pipe line network in Austria with a total entry/exit capacity of roughly 151 bcm per year. GCA plays an important role in supplying Austria and other Euro-pean countries, such as Germany, France and Hun-gary, with gas. In the gas infrastructure business, OMV focuses on non-regulated pipelines. In 2016, the Group, therefore, divested a minority stake in GCA to Allianz and Snam and now holds 51%.
The main gas entry and distribution point in Austria is Baumgarten, which is operated by GCA. It plays an important role in European gas supply, as about one-third of all Russian gas exports to Western Europe pass through the Baumgarten hub. The incoming gas is cleaned, dried, measured and compressed for further transport. Gas from Baumgarten is delivered to customers in Austria as well as other European countries, such as Ger-many, France, Hungary, Italy, Slovenia and Croatia.
Nord Stream 2 Pipeline project The project company Nord Stream 2 AG plans to build a twin pipeline through the Baltic Sea, con-necting Russia with Germany. The pipeline will have a capacity of 55 bcm and a length of about 1,200 km, running roughly parallel to the existing Nord Stream 1 pipeline. Nord Stream 2 AG is based in Zug, Switzerland, and fully owned by Gaz-prom. OMV is co-financing the Nord Stream 2 pipeline project together with four other European companies. The European partners are committed to providing long-term financing for 50% of the total project cost, estimated at EUR 9.5 bn. This means each European company will fund up to EUR 950 mn. OMV will receive an attractive interest rate.
As European gas production is declining, more imports are needed. Thus Nord Stream 2 is neces-sary for the security of Europe’s energy supply.
LNG terminal RotterdamOMV also holds a throughput agreement in Gate, a Liquefied Natural Gas (LNG) re-gasification terminal in the Netherlands. The terminal allows OMV full flexibility of gas supply optimization and ensures security of supply.
Growth offensive northwest Europe
The natural gas market in northwest Europe offers significant growth opportunities for OMV. The Group opened a new sales office in Düsseldorf, Germany, the largest natural gas market in Europe. OMV is aiming for a market share of 10% in Germany by 2025, equaling approximately 80 TWh. In 2017, OMV already took a big step towards this target by contracting about 19 TWh with large consumers.
52
OMV FACTBOOK 2017 / DOWNSTREAM

Gas storage OMV operates gas storage facilities in Austria and Germany with a total capacity of about 31 TWh (~2.7 bcm). The Austrian storage facilities are located at the terminals of the major transit pipe-line system (Baumgarten) and in the vicinity of impor tant urban areas of consumption, such as Vienna. In Germany, the gas storage site is well connected to the pipeline grid – not only enabling supply of the German market but also allowing exports to the Netherlands.
Power plants
OMV operates one gas-fired power plant in Brazi, Romania, with a capacity of 860 MW and one in Samsun, Turkey, with a capacity of 890 MW. Both plants use state-of-the-art combined-cycle power processes. With an efficiency of around 60%, both plants are among the most efficient ones in Europe and Turkey. Overall emissions are very low com-pared with other processes. In May 2018, OMV signed an agreement to divest the Samsun power plant; it is expected to close by the end of 2018 at the latest.
OMV is positioned at the center of Europe's gas transmission network
Gas pipelines /corridors in operation
Gas pipelines under construction
CEGH
Gassled pipelines (117 bcma)
to UK: 35 bcma
to EU: 82 bcma
Net4Gas system
Yamal-Europe (33 bcma)
Urengoy-Uzhgorod (100 bcma)
TransBalkan (25 bcma)
TurkStream (32 bcma)
BlueStream (16 bcma)
Nord Stream (55 bcma)
Nord Stream 2 (55 bcma)
OPAL
GAZELLE
WAG
TAG
TAP (10 bcma)
TRANSMED (30 bcma)
SCP (16 bcma)
TANAP (16 bcma)
Iran-Turkey (11 bcma)
HAG
Eustream (71 bcma)
NEL
EUGAL
53
OMV FACTBOOK 2017 / DOWNSTREAM

In 2017, OMV’s share price achieved a 57% increase year on year.
OMV FACTBOOK 2017 / FINANCIALS

14 %
OMV’s financial steering framework is built upon the principles of capital, operational and financing efficiency, as well as a sustainable portfolio management and a comprehensive financial risk and compliance management. With the focus on value enhancement, a strong balance sheet and growth in profitability, the financial steering framework represents a sustainable, risk-monitored and future-oriented value creation for OMV and its stakeholders.
€ 1.2 bn61 %
€ 2.0 bn
€ 1.50
ORGANIC FREE CASH FLOW AFTER DIVIDENDS (IN 2016: € 0.4 BN)
TOTAL SHAREHOLDER RETURN (IN 2016: 34%)
NET DEBT (IN 2016: € 3.0 BN)
CLEAN CCS EARNINGS PER SHARE (IN 2016: € 3.05)
GEARING RATIO (IN 2016: 21%)
PER SHARE DIVIDEND (+25% COMPARED TO 2016)
€ 4.97
55
OMV FACTBOOK 2017 / FINANCIALS

With a market capitalization of around EUR 17 bn at year-end 2017, OMV, listed on Vienna Stock Exchange, is Austria’s largest industrial company. In 2017, OMV’s share price achieved a 57% increase. OMV paid a dividend of EUR 1.50 per share for 2017, 25% more than in 2016. OMV’s total shareholder return – assuming reinvestment of the dividend – was 61%.
OMV on the Capital Markets
OMV stock performance
With an increase of 57%, OMV significantly outper-formed important international benchmark indices. The Austrian ATX gained 31% over 2017. Over the same period, the global industry benchmark FTS-Eurofirst E300 Oil & Gas was basically flat, while FTSEurotop 100 increased by 6%. Measured over
a five-year period, the return of OMV shares out-performed the returns of the indices. The value of the assets of an investor who acquired OMV stock worth EUR 100 at the end of 2012 and reinvested dividends in additional shares has increased to EUR 232 by the end of 2017. This represents an average annual return of 18%.
57%OMV share priceincrease in 2017
Long-term performance of the OMV share compared to indices (average annual increase with dividends reinvested 1)In %
OMV
ATX
FTSEurotop 100
FTSEurofirst E300 Oil & Gas
Five years (December 31, 2012 to December 31, 2017)
1 The data basis is the Total Return Index (RI) from DataStream; the calculation method of the average annual increase with dividends reinvested is the compound annual growth rate method
9.0
10.1
6.2
18.4
OMV share price performance (period January 1, 2017 to December 31, 2017)
180
160
140
120
100
80
60Jan. Feb. Mar. Apr. May Jun. Jul. Aug. Sept. Oct. Nov. Dec.
OMV ATX FTSEurofirst E300 Oil & Gas
EUR 33.56
EUR 52.83
56
OMV FACTBOOK 2017 / FINANCIALS

Dividend
For the fiscal year 2017, OMV paid a dividend of EUR 1.50 per share, an increase of 25% compared to the year before.
Dividend policyOMV is committed to delivering an attractive and predictable shareholder return through the busi-ness cycle. Under its amended dividend policy, OMV aims to increase dividends annually in line with financial performance – especially the devel-opment of free cash flow and the Group’s net income – or to at least maintain the level of the previous year.
Analysts’ recommendation
OMV is covered by 19 financial analysts who regu-larly publish research reports on OMV. This ensures good visibility of OMV in the financial community. At the end of 2017, 39% of analysts recommended buying OMV shares (end of 2016: 6%) and 33% rec-ommended holding the shares (end of 2016: 39%), while 28% had a sell rating (end of 2016: 55%). On December 31, 2017, the average target share price, according to analyst consensus estimates, was EUR 51.90.
Share information
2013 1 2014 2 2015 2016 2017Number of outstanding shares 3 in mn 326.23 326.26 326.36 326.45 326.50Market capitalization 3 in EUR bn 11.35 7.18 8.53 10.96 17.29Average daily trading volume 282,074 370,384 577,362 471,359 407,689Year's high in EUR 39.69 36.06 30.46 34.78 54.14Year's low in EUR 27.85 20.07 20.70 21.45 32.37Year-end in EUR 34.79 22.01 26.13 33.56 52.83Book value per share 3 in EUR 35.60 35.53 35.76 33.44 34.35Earnings Per Share (EPS) in EUR 3.56 0.85 (3.37) (1.24) 1.33Clean CCS Earnings Per Share 4 in EUR 3.41 3.47 3.52 3.05 4.97Cash flow per share 5 in EUR 12.64 11.24 8.68 8.82 10.56Dividend Per Share (DPS) in EUR 1.25 1.25 1.00 1.20 1.50Dividends paid to OMV equity holders in EUR mn 442 458 459 464 529Dividend yield 3 in % 3.59 5.68 3.83 3.58 2.84Payout ratio in % 35 147 n.m. n.m. 113Total Shareholder Return (TSR) 6 in % 31 (34) 24 34 61
1 As of 2014, figures for 2013 were adjusted due to the implementation of IFRS 11 “Joint Arrangements”2 As of 2015, figures for 2014 were adjusted according to IAS 83 As of December 314 Adjusted for special items; clean CCS figures exclude inventory holding gains/losses (CCS effects) resulting from the fuels refineries and OMV Petrol Ofisi5 Cash flow from operating activities6 Assuming reinvestment of the dividend
1.25 1.251.00
1.20
1.50
Yield in %
3.59 5.68 3.83 3.58 2.84
Dividend per shareIn EUR
2013 2014 2015 2016 2017
Analyst recommendationIn %
19financial analysts
Buy Hold Sell
28 39
33
57
OMV FACTBOOK 2017 / FINANCIALS
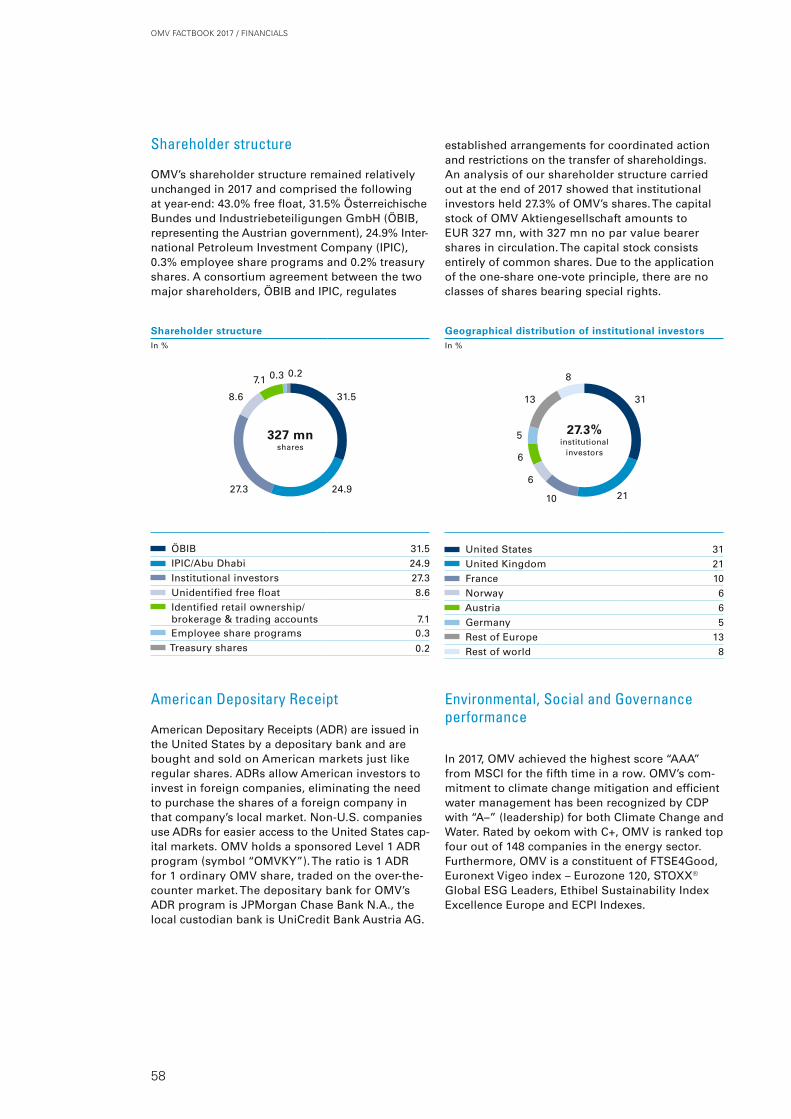
Shareholder structure
OMV’s shareholder structure remained relatively unchanged in 2017 and comprised the following at year-end: 43.0% free float, 31.5% Österreichische Bundes und Industriebeteiligungen GmbH (ÖBIB, representing the Austrian government), 24.9% Inter-national Petroleum Investment Company (IPIC), 0.3% employee share programs and 0.2% treasury shares. A consortium agreement between the two major shareholders, ÖBIB and IPIC, regulates
American Depositary Receipt
American Depositary Receipts (ADR) are issued in the United States by a depositary bank and are bought and sold on American markets just like regular shares. ADRs allow American investors to invest in foreign companies, eliminating the need to purchase the shares of a foreign company in that company’s local market. Non-U.S. companies use ADRs for easier access to the United States cap-ital markets. OMV holds a sponsored Level 1 ADR program (symbol “OMVKY”). The ratio is 1 ADR for 1 ordinary OMV share, traded on the over-the-counter market. The depositary bank for OMV’s ADR program is JPMorgan Chase Bank N.A., the local custodian bank is UniCredit Bank Austria AG.
Environmental, Social and Governance performance
In 2017, OMV achieved the highest score “AAA” from MSCI for the fifth time in a row. OMV’s com-mitment to climate change mitigation and efficient water management has been recognized by CDP with “A–” (leadership) for both Climate Change and Water. Rated by oekom with C+, OMV is ranked top four out of 148 companies in the energy sector. Furthermore, OMV is a constituent of FTSE4Good, Euronext Vigeo index – Eurozone 120, STOXX® Global ESG Leaders, Ethibel Sustainability Index Excellence Europe and ECPI Indexes.
established arrangements for coordinated action and restrictions on the transfer of shareholdings. An analysis of our shareholder structure carried out at the end of 2017 showed that institutional investors held 27.3% of OMV’s shares. The capital stock of OMV Aktiengesellschaft amounts to EUR 327 mn, with 327 mn no par value bearer shares in circulation. The capital stock consists entirely of common shares. Due to the application of the one-share one-vote principle, there are no classes of shares bearing special rights.
Shareholder structureIn %
327 mn shares
ÖBIB 31.5 IPIC/Abu Dhabi 24.9 Institutional investors 27.3 Unidentified free float 8.6 Identified retail ownership/brokerage & trading accounts 7.1
Employee share programs 0.3 Treasury shares 0.2
31.5
24.9
8.6
27.3
7.1 0.3 0.2
Geographical distribution of institutional investorsIn %
27.3%institutional
investors
United States 31 United Kingdom 21 France 10 Norway 6 Austria 6 Germany 5 Rest of Europe 13 Rest of world 8
31
2110
6
13
5
8
6
58
OMV FACTBOOK 2017 / FINANCIALS

14%gearing ratio
year-end 2017
OMV’s financing strategy focuses on cash flow and financial stability. Principal targets are a positive free cash flow after dividends and a strong investment- grade credit rating on the basis of a healthy balance sheet and a long-term gearing ratio below or equal to 30%.
Financing
Financing policy
OMV covers its financing needs on the interna-tional capital and loan markets, aiming at a broad diversification of its debt investor base. Corporate bonds are the key element of the well-balanced debt maturity profile, complemented by ample committed credit facilities and other types of bank funding. All financing and treasury services are managed at the OMV Group level.
Debt is mainly denominated in euros, with the majority of it being subject to fixed interest rates. Net debt at the end of 2017 was EUR 2,005 mn, compared to EUR 2,969 mn at the end of 2016.
As of December 2017, OMV Group had EUR 3.5 bn undrawn committed revolving credit facilities. For medium- and long-term debt financing, OMV predominantly issues senior bonds, currently at EUR 4.75 bn. These were issued under OMV’s Euro Medium Term Note (EMTN) program, which was originally signed on March 31, 2009 and last pro-longed on June 7, 2018. Throughout 2017, OMV has been able to substantially reduce its financing costs. A key contributor for the reduction was the one billion Euro bond issued in December 2017 that was placed at an attractive coupon of 1%. The maturity dates of the issued senior bonds range
from 2018 to 2027. The maturity profile is comfort-able and does not exhibit any significant peaks. The average maturity of OMV Group’s debt port-folio is 4.8 years.
Total interest-bearing debt, except for senior bonds and finance leases, amounted to EUR 937 mn and mainly consisted of the following instruments:
EUR 447 mn term loan and shareholder loans EUR 469 mn multilateral and syndicated loans EUR 21 mn bilateral money market borrowings
Financing policy
2013 2014 2015 2016 2017Debt 1 in EUR mn 5,076 5,551 5,386 5,283 5,986Cash in EUR mn 705 649 1,348 2,314 3,981Net debt in EUR mn 4,371 4,902 4,038 2,969 2,005Gearing ratio in % 30 34 28 21 14
1 Short- and long-term borrowings, bonds and finance leases
Debt breakdown by currency, as of December 31, 2017 1
In %
5.7EUR bn
EUR USD Other
1 Short- and long-term borrowings and bonds
Debt breakdown by type of interest rate, as of December 31, 2017 1
In %
5.7EUR bn
Fixed interest rate Variable interest rate
1 Short- and long-term borrowings and bonds
0.32.3
97.4
6
94
59
OMV FACTBOOK 2017 / FINANCIALS
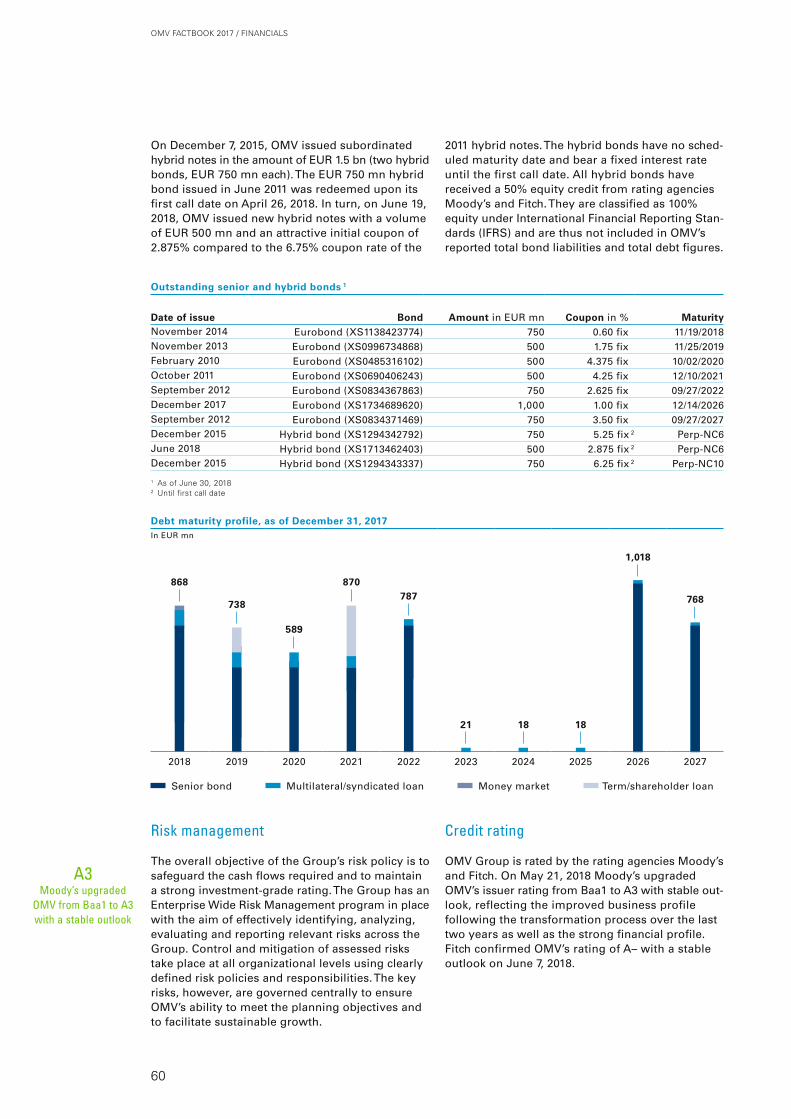
On December 7, 2015, OMV issued subordinated hybrid notes in the amount of EUR 1.5 bn (two hybrid bonds, EUR 750 mn each). The EUR 750 mn hybrid bond issued in June 2011 was redeemed upon its first call date on April 26, 2018. In turn, on June 19, 2018, OMV issued new hybrid notes with a volume of EUR 500 mn and an attractive initial coupon of 2.875% compared to the 6.75% coupon rate of the
2011 hybrid notes. The hybrid bonds have no sched-uled maturity date and bear a fixed interest rate until the first call date. All hybrid bonds have received a 50% equity credit from rating agencies Moody’s and Fitch. They are classified as 100% equity under International Financial Reporting Stan-dards (IFRS) and are thus not included in OMV’s reported total bond liabilities and total debt figures.
Outstanding senior and hybrid bonds 1
Date of issue Bond Amount in EUR mn Coupon in % MaturityNovember 2014 Eurobond (XS1138423774) 750 0.60 fix 11/19/2018November 2013 Eurobond (XS0996734868) 500 1.75 fix 11/25/2019February 2010 Eurobond (XS0485316102) 500 4.375 fix 10/02/2020October 2011 Eurobond (XS0690406243) 500 4.25 fix 12/10/2021September 2012 Eurobond (XS0834367863) 750 2.625 fix 09/27/2022December 2017 Eurobond (XS1734689620) 1,000 1.00 fix 12/14/2026September 2012 Eurobond (XS0834371469) 750 3.50 fix 09/27/2027December 2015 Hybrid bond (XS1294342792) 750 5.25 fix 2 Perp-NC6June 2018 Hybrid bond (XS1713462403) 500 2.875 fix 2 Perp-NC6December 2015 Hybrid bond (XS1294343337) 750 6.25 fix 2 Perp-NC10
1 As of June 30, 20182 Until first call date
A3Moody’s upgraded
OMV from Baa1 to A3 with a stable outlook
Risk management
The overall objective of the Group’s risk policy is to safeguard the cash flows required and to maintain a strong investment-grade rating. The Group has an Enterprise Wide Risk Management program in place with the aim of effectively identifying, analyzing, evaluating and reporting relevant risks across the Group. Control and mitigation of assessed risks take place at all organizational levels using clearly defined risk policies and responsibilities. The key risks, however, are governed centrally to ensure OMV’s ability to meet the planning objectives and to facilitate sustainable growth.
Credit rating
OMV Group is rated by the rating agencies Moody’s and Fitch. On May 21, 2018 Moody’s upgraded OMV’s issuer rating from Baa1 to A3 with stable out-look, reflecting the improved business profile following the transformation process over the last two years as well as the strong financial profile. Fitch confirmed OMV’s rating of A– with a stable outlook on June 7, 2018.
589
870787
21 18 18
1,018
768
868
738
Debt maturity profile, as of December 31, 2017In EUR mn
2018 2019 2020 2021 2022 2023 2024 2025 2026 2027
Senior bond Multilateral/syndicated loan Money market Term/shareholder loan
60
OMV FACTBOOK 2017 / FINANCIALS

In 2017, OMV achieved a successful portfolio management and major improve-ments in financial stability. OMV delivered a strong operational performance, reflected in a five-year high clean CCS Operating Result of EUR 3 bn and a substantially improved cash flow.
Financial Five-Year Summary
Financial performance overview
2013 2014 2015 2016 2017Clean CCS Operating Result 1 in EUR mn 2,815 2,418 1,737 1,535 2,958
thereof Upstream in EUR mn 2,098 1,641 117 40 1,225thereof Downstream in EUR mn 755 812 1,546 1,533 1,770thereof Corporate and Other in EUR mn (46) (48) (43) (50) (16)thereof Consolidation in EUR mn 7 13 116 12 (21)
Clean CCS net income attributable to stockholders 1, 2 in EUR mn 1,112 1,132 1,148 995 1,624Clean CCS EPS 1 in EUR 3.41 3.47 3.52 3.05 4.97Net debt in EUR mn 4,371 4,902 4,038 2,969 2,005Equity ratio in % 46 43 44 43 45Gearing ratio in % 30 34 28 21 14Cash flow from operating activities in EUR mn 4,124 3,666 2,834 2,878 3,448Free cash flow before dividends in EUR mn 142 272 (39) 1,081 1,681Free cash flow after dividends in EUR mn (485) (377) (569) 615 1,013Free cash flow after dividends incl. non-controlling interest changes 3 in EUR mn (619) (401) (581) 1,105 1,013
Income statement summaryIn EUR mn
2013 2014 2015 2016 2017Operating Result 2,772 1,149 (1,661) (32) 1,732
thereof Borealis 152 205 356 399 394Financial Result (481) (357) (248) (198) (246)Taxes (562) (265) 654 47 (634)Net income 1,729 527 (1,255) (183) 853
thereof attributable to non-controlling interests 528 211 (197) 118 315 thereof attributable to hybrid capital owners 38 38 42 103 103thereof attributable to stockholders 1,162 278 (1,100) (403) 435
1 Adjusted for special items; clean CCS figures exclude fuels inventory holding gains/losses (CCS effects) resulting from the refineries and OMV Petrol Ofisi2 After deducting net income attributable to hybrid capital owners and net income attributable to non-controlling interests3 In 2016, the non-controlling interest change mainly includes the cash inflow from the sale of a 49% minority stake in Gas Connect Austria
Economic environment
2013 2014 2015 2016 2017Average Brent price in USD/bbl 108.66 98.95 52.39 43.73 54.19Average Urals price in USD/bbl 108.30 97.95 51.45 42.10 53.23Average EUR-USD FX-rate 1.328 1.329 1.110 1.107 1.130Average EUR-RON FX-rate 4.419 4.444 4.445 4.490 4.569NWE refining margin in USD/bbl 4.02 4.56 7.14 4.93 6.58Average CEGH gas price in EUR/MWh 27.13 22.24 20.65 14.82 18.08Average NCG gas price in EUR/MWh 27.10 21.20 19.99 14.13 17.51Average regulated domestic gas price for households Romania in EUR/MWh 10.73 11.76 12.74 13.36 n.a.Average base load electricity price Romania in EUR/MWh 35.35 34.63 36.41 33.30 48.15
Sources: Reuters/Platts, Central European Gas Hub (CEGH), OPCOM, Net Connect Germany (NCG)
61
OMV FACTBOOK 2017 / FINANCIALS

Statement of financial position In EUR mn
2013 2014 2015 2016 2017AssetsIntangible assets 3,597 3,453 3,275 1,713 2,648Property, plant and equipment 17,051 18,488 16,440 14,613 13,654Equity-accounted investments 1,853 2,131 2,562 2,860 2,913Other financial assets 635 816 846 947 1,959Other assets 113 117 81 70 55Deferred taxes 392 459 850 839 744Non-current assets 23,641 25,464 24,054 21,042 21,972
Inventories 2,456 2,231 1,873 1,663 1,503Trade receivables 3,270 3,042 2,567 2,459 2,503Other financial assets 752 1,782 2,245 1,245 1,140Income tax receivables 82 81 108 32 15Other assets 299 514 374 198 265Cash and cash equivalents 705 649 1,348 2,069 3,972Current assets 7,564 8,298 8,516 7,666 9,398Assets held for sale 643 93 94 3,405 206
Total assets 31,848 33,855 32,664 32,112 31,576
Equity and liabilitiesCapital stock 327 327 327 327 327Hybrid capital 741 741 2,231 2,231 2,231Reserves 10,546 10,523 9,114 8,357 8,658OMV equity of the parent 11,614 11,591 11,672 10,915 11,216Non-controlling interests 2,931 2,924 2,626 3,010 3,118Equity 14,545 14,514 14,298 13,925 14,334
Provisions for pensions and similar obligations 1,022 1,115 1,045 1,057 1,003Bonds 3,318 3,967 3,721 3,725 3,968Interest-bearing debts 581 674 871 1,012 823Provisions for decommissioning and restoration obligations 2,765 3,148 3,342 3,320 3,070Other provisions 306 329 535 553 497Other financial liabilities 224 466 410 409 405Other liabilities 6 176 160 155 148Deferred taxes 673 572 229 122 437Non-current liabilities 8,894 10,449 10,314 10,354 10,352
Trade payables 4,914 4,330 3,380 3,731 3,262Bonds 778 159 295 38 788Interest-bearing debts 217 439 200 222 114Provisions for income taxes 276 286 215 212 140Provisions for decommissioning and restoration obligations 84 78 100 92 110Other provisions 415 474 418 435 349Other financial liabilities 383 1,610 2,341 1,169 1,288Other liabilities 1,189 1,486 1,074 828 775Current liabilities 8,257 8,863 8,021 6,727 6,826Liabilities associated with assets held for sale 151 29 32 1,107 63
Total equity and liabilities 31,848 33,855 32,664 32,112 31,576
62
OMV FACTBOOK 2017 / FINANCIALS
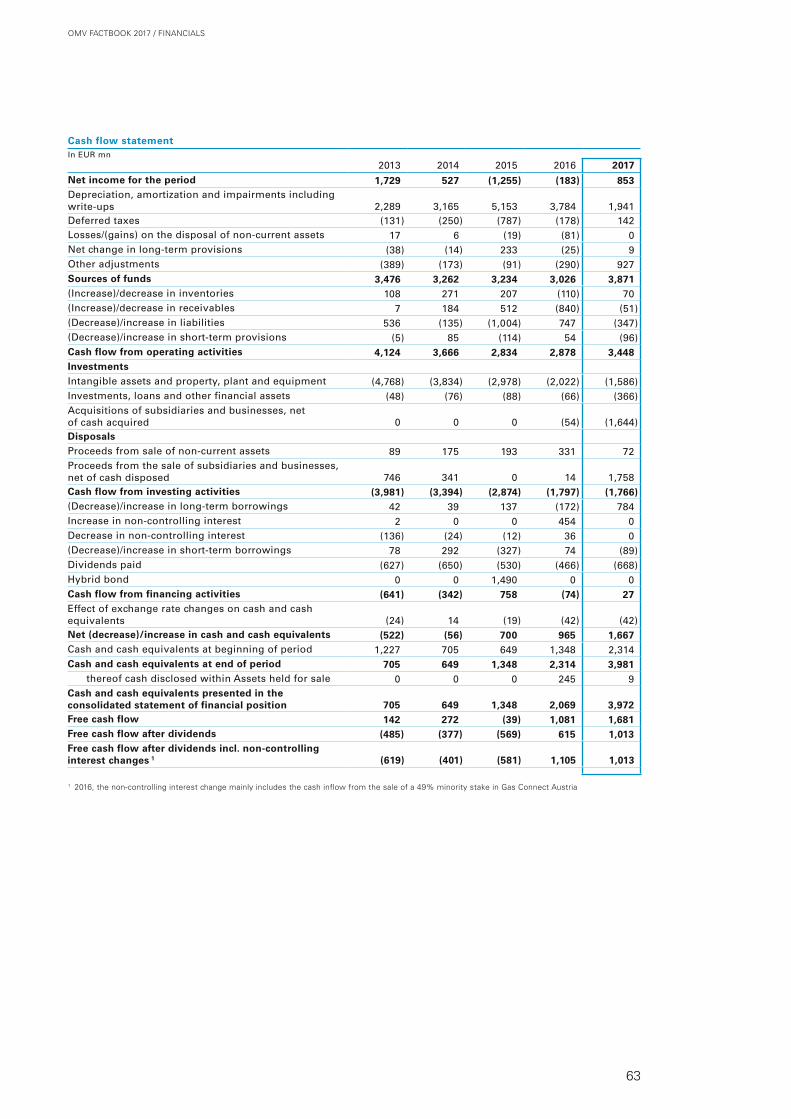
Cash flow statement In EUR mn
2013 2014 2015 2016 2017Net income for the period 1,729 527 (1,255) (183) 853 Depreciation, amortization and impairments including write-ups 2,289 3,165 5,153 3,784 1,941Deferred taxes (131) (250) (787) (178) 142 Losses/(gains) on the disposal of non-current assets 17 6 (19) (81) 0 Net change in long-term provisions (38) (14) 233 (25) 9 Other adjustments (389) (173) (91) (290) 927 Sources of funds 3,476 3,262 3,234 3,026 3,871(Increase)/decrease in inventories 108 271 207 (110) 70 (Increase)/decrease in receivables 7 184 512 (840) (51)(Decrease)/increase in liabilities 536 (135) (1,004) 747 (347)(Decrease)/increase in short-term provisions (5) 85 (114) 54 (96)Cash flow from operating activities 4,124 3,666 2,834 2,878 3,448InvestmentsIntangible assets and property, plant and equipment (4,768) (3,834) (2,978) (2,022) (1,586) Investments, loans and other financial assets (48) (76) (88) (66) (366)Acquisitions of subsidiaries and businesses, net of cash acquired 0 0 0 (54) (1,644)DisposalsProceeds from sale of non-current assets 89 175 193 331 72Proceeds from the sale of subsidiaries and businesses, net of cash disposed 746 341 0 14 1,758Cash flow from investing activities (3,981) (3,394) (2,874) (1,797) (1,766) (Decrease)/increase in long-term borrowings 42 39 137 (172) 784 Increase in non-controlling interest 2 0 0 454 0Decrease in non-controlling interest (136) (24) (12) 36 0(Decrease)/increase in short-term borrowings 78 292 (327) 74 (89)Dividends paid (627) (650) (530) (466) (668)Hybrid bond 0 0 1,490 0 0Cash flow from financing activities (641) (342) 758 (74) 27 Effect of exchange rate changes on cash and cash equivalents (24) 14 (19) (42) (42)Net (decrease)/increase in cash and cash equivalents (522) (56) 700 965 1,667Cash and cash equivalents at beginning of period 1,227 705 649 1,348 2,314Cash and cash equivalents at end of period 705 649 1,348 2,314 3,981
thereof cash disclosed within Assets held for sale 0 0 0 245 9Cash and cash equivalents presented in the consolidated statement of financial position 705 649 1,348 2,069 3,972Free cash flow 142 272 (39) 1,081 1,681Free cash flow after dividends (485) (377) (569) 615 1,013Free cash flow after dividends incl. non-controlling interest changes 1 (619) (401) (581) 1,105 1,013
1 2016, the non-controlling interest change mainly includes the cash inflow from the sale of a 49% minority stake in Gas Connect Austria
63
OMV FACTBOOK 2017 / FINANCIALS
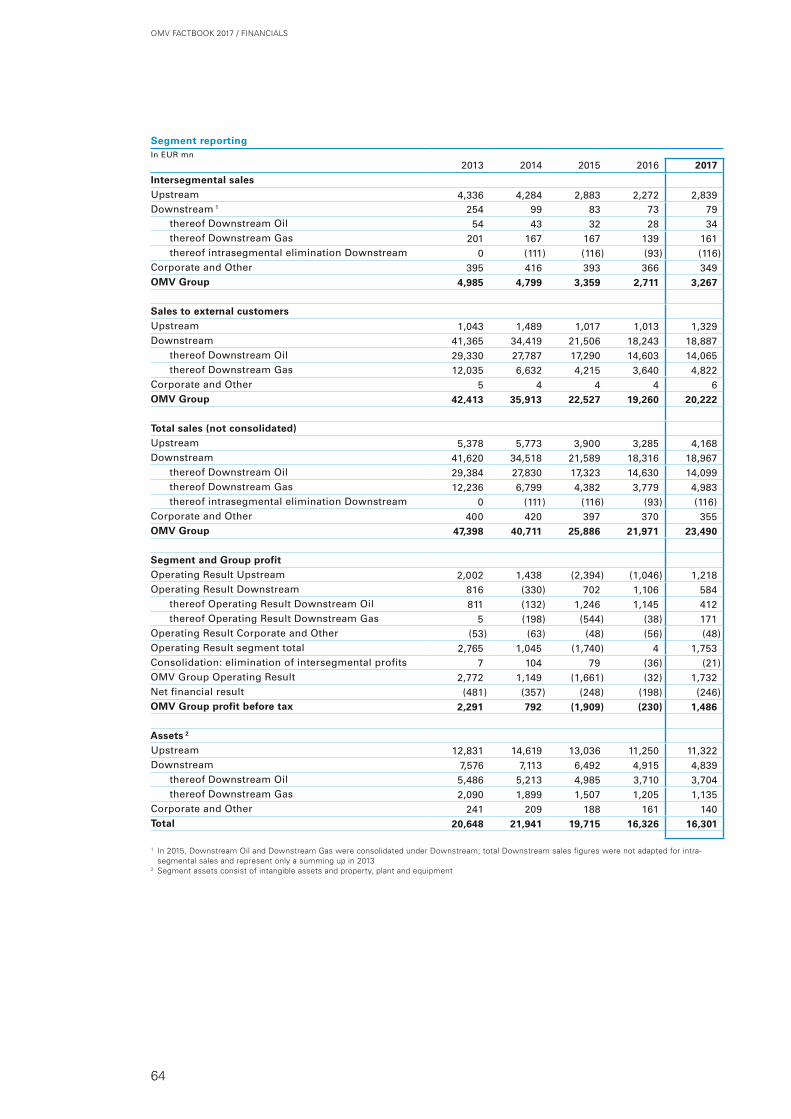
Segment reportingIn EUR mn
2013 2014 2015 2016 2017Intersegmental salesUpstream 4,336 4,284 2,883 2,272 2,839Downstream 1 254 99 83 73 79
thereof Downstream Oil 54 43 32 28 34thereof Downstream Gas 201 167 167 139 161thereof intrasegmental elimination Downstream 0 (111) (116) (93) (116)
Corporate and Other 395 416 393 366 349OMV Group 4,985 4,799 3,359 2,711 3,267
Sales to external customersUpstream 1,043 1,489 1,017 1,013 1,329Downstream 41,365 34,419 21,506 18,243 18,887
thereof Downstream Oil 29,330 27,787 17,290 14,603 14,065thereof Downstream Gas 12,035 6,632 4,215 3,640 4,822
Corporate and Other 5 4 4 4 6OMV Group 42,413 35,913 22,527 19,260 20,222
Total sales (not consolidated)Upstream 5,378 5,773 3,900 3,285 4,168Downstream 41,620 34,518 21,589 18,316 18,967
thereof Downstream Oil 29,384 27,830 17,323 14,630 14,099thereof Downstream Gas 12,236 6,799 4,382 3,779 4,983thereof intrasegmental elimination Downstream 0 (111) (116) (93) (116)
Corporate and Other 400 420 397 370 355OMV Group 47,398 40,711 25,886 21,971 23,490
Segment and Group profitOperating Result Upstream 2,002 1,438 (2,394) (1,046) 1,218 Operating Result Downstream 816 (330) 702 1,106 584
thereof Operating Result Downstream Oil 811 (132) 1,246 1,145 412thereof Operating Result Downstream Gas 5 (198) (544) (38) 171
Operating Result Corporate and Other (53) (63) (48) (56) (48)Operating Result segment total 2,765 1,045 (1,740) 4 1,753Consolidation: elimination of intersegmental profits 7 104 79 (36) (21)OMV Group Operating Result 2,772 1,149 (1,661) (32) 1,732 Net financial result (481) (357) (248) (198) (246)OMV Group profit before tax 2,291 792 (1,909) (230) 1,486
Assets 2
Upstream 12,831 14,619 13,036 11,250 11,322Downstream 7,576 7,113 6,492 4,915 4,839
thereof Downstream Oil 5,486 5,213 4,985 3,710 3,704thereof Downstream Gas 2,090 1,899 1,507 1,205 1,135
Corporate and Other 241 209 188 161 140Total 20,648 21,941 19,715 16,326 16,301
1 In 2015, Downstream Oil and Downstream Gas were consolidated under Downstream; total Downstream sales figures were not adapted for intrasegmental sales and represent only a summing up in 2013
2 Segment assets consist of intangible assets and property, plant and equipment
64
OMV FACTBOOK 2017 / FINANCIALS
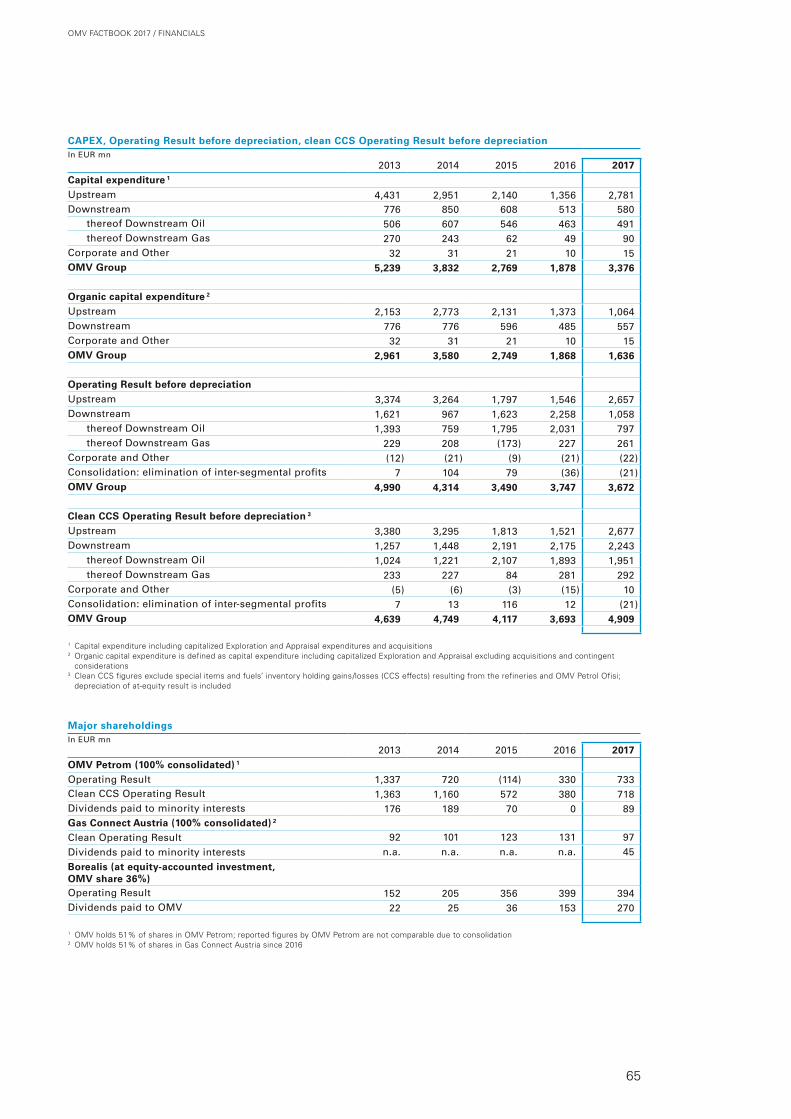
CAPEX, Operating Result before depreciation, clean CCS Operating Result before depreciationIn EUR mn
2013 2014 2015 2016 2017Capital expenditure 1
Upstream 4,431 2,951 2,140 1,356 2,781Downstream 776 850 608 513 580
thereof Downstream Oil 506 607 546 463 491thereof Downstream Gas 270 243 62 49 90
Corporate and Other 32 31 21 10 15OMV Group 5,239 3,832 2,769 1,878 3,376
Organic capital expenditure 2
Upstream 2,153 2,773 2,131 1,373 1,064Downstream 776 776 596 485 557Corporate and Other 32 31 21 10 15OMV Group 2,961 3,580 2,749 1,868 1,636
Operating Result before depreciationUpstream 3,374 3,264 1,797 1,546 2,657Downstream 1,621 967 1,623 2,258 1,058
thereof Downstream Oil 1,393 759 1,795 2,031 797thereof Downstream Gas 229 208 (173) 227 261
Corporate and Other (12) (21) (9) (21) (22)Consolidation: elimination of inter-segmental profits 7 104 79 (36) (21)OMV Group 4,990 4,314 3,490 3,747 3,672
Clean CCS Operating Result before depreciation 3
Upstream 3,380 3,295 1,813 1,521 2,677Downstream 1,257 1,448 2,191 2,175 2,243
thereof Downstream Oil 1,024 1,221 2,107 1,893 1,951thereof Downstream Gas 233 227 84 281 292
Corporate and Other (5) (6) (3) (15) 10Consolidation: elimination of inter-segmental profits 7 13 116 12 (21)OMV Group 4,639 4,749 4,117 3,693 4,909
1 Capital expenditure including capitalized Exploration and Appraisal expenditures and acquisitions2 Organic capital expenditure is defined as capital expenditure including capitalized Exploration and Appraisal excluding acquisitions and contingent
considerations3 Clean CCS figures exclude special items and fuels’ inventory holding gains /losses (CCS effects) resulting from the refineries and OMV Petrol Ofisi;
depreciation of at-equity result is included
Major shareholdingsIn EUR mn
2013 2014 2015 2016 2017OMV Petrom (100% consolidated) 1
Operating Result 1,337 720 (114) 330 733Clean CCS Operating Result 1,363 1,160 572 380 718Dividends paid to minority interests 176 189 70 0 89Gas Connect Austria (100% consolidated) 2
Clean Operating Result 92 101 123 131 97Dividends paid to minority interests n.a. n.a. n.a. n.a. 45
Borealis (at equity-accounted investment, OMV share 36%)Operating Result 152 205 356 399 394Dividends paid to OMV 22 25 36 153 270
1 OMV holds 51% of shares in OMV Petrom; reported figures by OMV Petrom are not comparable due to consolidation2 OMV holds 51% of shares in Gas Connect Austria since 2016
65
OMV FACTBOOK 2017 / FINANCIALS

Abbreviations and Definitions
A
AGMAnnual General Meeting
B
bblBarrel (1 barrel equals approximately 159 liters)
bbl/d Barrel per day
bcm Billion standard cubic meters (32°F/0°C)
bcmaBillion cubic meters per annum (32°F/0°C)
bn Billion
boeBarrel of oil equivalent
boe/d Barrel of oil equivalent per day
C
CAPEX Capital Expenditure
capital employed Equity including non-controlling interests plus net debt
CEGHCentral European Gas Hub
cf Standard cubic feet (60°F/16°C)
CCS/CCS effects/inventory holding gains/(losses) Current Cost of Supply; inventory holding gains and losses represent the difference between the cost of sales cal-culated using the current cost of supply and the cost of sales calculated using the weighted average method after adjusting
Finding & development costsFinding & development costs are calculated as a sum of exploration and development costs, divided by the sum of proven reserves revisions, extensions and discoveries
FXForeign exchange
G
GDP Gross Domestic Product
gearing ratio Net debt divided by equity, expressed as a percentage
GWGigawatt
H
HSSE Health, Safety, Security and Environment
I
IASInternational Accounting Standards
IFRSInternational Financial Reporting Standards
K
kbbl/dThousand barrels per day
kboe/d Thousand barrels of oil equivalent per day
km2
Square kilometer
KPI Key Performance Indicator
for any changes in valuation allowances in case the net real-izable value of the inventory is lower than its cost; in volatile energy markets, measurement of the costs of petroleum prod-ucts sold based on historical values (e.g. weighted average cost) can have distorting effects on reported results (Operating Result, net income, etc.); the amount disclosed as CCS effect represents the difference between the charge to the income statement for inventory on a weighted average basis (adjusted for the change in valu-ation allowances related to net realizable value) and the charge based on the current cost of supply; the current cost of supply is calculated monthly using data from supply and production sys-tems at the Downstream Oil level
clean CCS net income attributable to stockholdersNet income attributable to stockholders, adjusted for the after tax effect of special items and CCS
E
EPS Earnings Per Share; net income attributable to stockholders divided by total weighted aver-age shares
equity ratio Equity divided by balance sheet total, expressed as a percentage
EU European Union
EUR Euro
F
Finding costsFinding costs are calculated as exploration costs, divided by the sum of proven reserves revisions, extensions and discoveries
66
OMV FACTBOOK 2017 / FURTHER INFORMATION
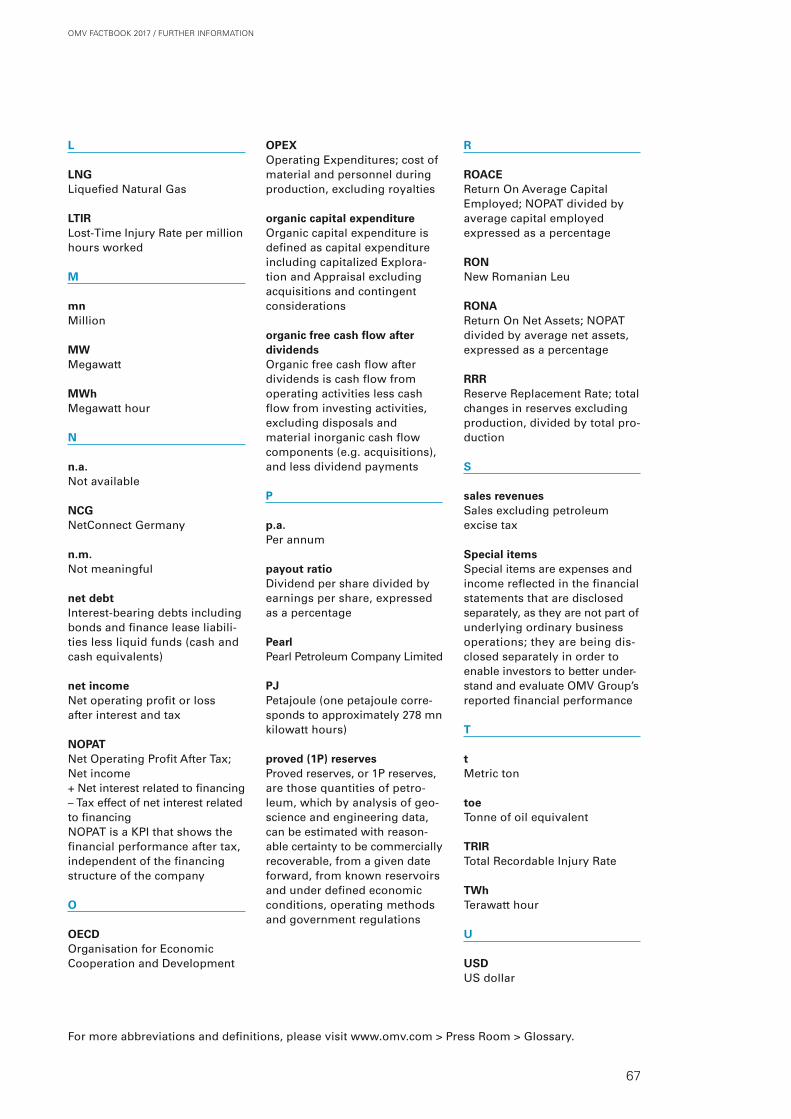
L
LNG Liquefied Natural Gas
LTIR Lost-Time Injury Rate per million hours worked
M
mn Million
MW Megawatt
MWhMegawatt hour
N
n.a.Not available
NCGNetConnect Germany
n.m.Not meaningful
net debt Interest-bearing debts including bonds and finance lease liabili-ties less liquid funds (cash and cash equivalents)
net incomeNet operating profit or loss after interest and tax
NOPATNet Operating Profit After Tax; Net income + Net interest related to financing – Tax effect of net interest related to financing NOPAT is a KPI that shows the financial performance after tax, independent of the financing structure of the company
O
OECDOrganisation for Economic Cooperation and Development
OPEXOperating Expenditures; cost of material and personnel during production, excluding royalties
organic capital expenditureOrganic capital expenditure is defined as capital expenditure including capitalized Explora-tion and Appraisal excluding acquisitions and contingent considerations
organic free cash flow after dividendsOrganic free cash flow after dividends is cash flow from operating activities less cash flow from investing activities, excluding disposals and material inorganic cash flow components (e.g. acquisitions), and less dividend payments
P
p.a.Per annum
payout ratio Dividend per share divided by earnings per share, expressed as a percentage
PearlPearl Petroleum Company Limited
PJ Petajoule (one petajoule corre-sponds to approximately 278 mn kilowatt hours)
proved (1P) reservesProved reserves, or 1P reserves, are those quantities of petro-leum, which by analysis of geo-science and engineering data, can be estimated with reason-able certainty to be commercially recoverable, from a given date forward, from known reservoirs and under defined economic conditions, operating methods and government regulations
R
ROACEReturn On Average Capital Employed; NOPAT divided by average capital employed expressed as a percentage
RONNew Romanian Leu
RONAReturn On Net Assets; NOPAT divided by average net assets, expressed as a percentage
RRRReserve Replacement Rate; total changes in reserves excluding production, divided by total pro-duction
S
sales revenuesSales excluding petroleum excise tax
Special itemsSpecial items are expenses and income reflected in the financial statements that are disclosed separately, as they are not part of underlying ordinary business operations; they are being dis-closed separately in order to enable investors to better under-stand and evaluate OMV Group’s reported financial performance
T
tMetric ton
toe Tonne of oil equivalent
TRIR Total Recordable Injury Rate
TWhTerawatt hour
U
USDUS dollar
For more abbreviations and definitions, please visit www.omv.com > Press Room > Glossary.
67
OMV FACTBOOK 2017 / FURTHER INFORMATION

Florian GregerHead of Investor Relations
Investor RelationsOMV Aktiengesellschaft Trabrennstrasse 6 – 8 1020 Vienna, Austria Tel. +43 1 40440-21600 Fax +43 1 40440-621600 [email protected]
Eric SchmiedchenInvestor Relations Manager
Vlad AlexandruInvestor Relations Manager
Gloria KaluzaSenior Assistant
Nicolas TegelmannInvestor Relations Manager
Stefania BarbuceanuDeputy Head of Investor Relations
Oana GojeInvestor Relations Manager
Christa HanreichEvent Manager
Investor Relations Team
68
OMV FACTBOOK 2017 / FURTHER INFORMATION

OMV Aktiengesellschaft
Q4Quarterly Report 2017
The energy for a better life.
ANNUAL REPORT 2017
OMV Aktiengesellschaft
OMV
Fact
book
201
6
OMV AktiengesellschaftTrabrennstrasse 6–81020 ViennaAustriaTel. +43 1 40440-0www.omv.comwww.omv.com/socialmedia
OMV Aktiengesellschaft
Factbook 2016
THE ENERGYOF OMV
THE ENERGYOF OMV
Share Price
EUR 52.83
Annual Report 2017 Factbook 2016
OMV AktiengesellschaftTrabrennstrasse 6 – 8 1020 Vienna, Austria Tel. +43 1 40440-0 [email protected] www.omv.com
PublisherOMV Aktiengesellschaft, Vienna
Concept and designAnzinger und Rasp, Munich
PhotosTitle: OMV AktiengesellschaftPage 3: Martin StöbichPages 4, 28, 39, 40, 49, 68: OMV archivePage 8: Peter RigaudPage 54: shapecharge/Getty images
Image editingMXM Digital Service, Munich
PrintingVogl, Munich
The OMV Investor Relations app
The app provides you with the latest information on news releases, share price data, reports, presentations, upcoming events and social media.
Download the app for free now!For Android phones play.google.comFor iPhones itunes.apple.com
Features include: Content available online
and offline Investor news Detailed share price data Reports and presentations Financial calendar Management Social media OMV Investor Relations team
Contacts and Imprint
Disclaimer This report contains forward-looking statements. Forward-looking state-ments usually may be identified by the use of terms such as “outlook,” “expect,” “anticipate,” “target,” “estimate,” “goal,” “plan,” “intend,” “may,” “objective,” “will” and similar terms or by their context. These forward-look-ing statements are based on beliefs and assumptions currently held by and infor mation currently available to OMV. By their nature, forward-looking statements are subject to risks and uncertainties, both known and unknown, because they relate to events and depend on circumstances that will or may occur in the future and are outside the control of OMV. Consequently, the actual results may differ materially from those expressed or implied by the
forward-looking statements. Therefore, recipients of this report are cau-tioned not to place undue reliance on these forward-looking statements.
Neither OMV nor any other person assumes responsibility for the accuracy and completeness of any of the forward-looking statements contained in this report. OMV disclaims any obligation to update these forward-looking statements to reflect actual results, revised assumptions and expectations and future developments and events. This report does not contain any rec-ommendation or invitation to buy or sell securities in OMV.
OMV FACTBOOK 2017 / FURTHER INFORMATION

OMV AktiengesellschaftTrabrennstrasse 6 – 81020 ViennaAustriaTel +43 1 40440-0www.omv.comwww.omv.com/socialmedia