omotor food security economic trend
TRANSCRIPT

Munich Personal RePEc Archive
Food Security and Nutition trend in
Nigeria
Omotor, Douglason G.
Univerity of Oxford
25 September 2009
Online at https://mpra.ub.uni-muenchen.de/22669/
MPRA Paper No. 22669, posted 17 May 2010 13:31 UTC

1
FOOD SECURITY AND NUTRITION TREND IN NIGERIA
Douglason G. Omotor Department of Economics,
Delta State University, Abraka, Nigeria. E-mail: [email protected]
+234(0)803 408 3112
Nigeria has a chequered history of food production, sustainability and food security.
This paper discusses the food and nutrition situation of Nigeria, it highlights some of the
socio-economic factors- price, income, employment, demography (population density)
that has influenced the food consumption system (supply, distribution, consumption) and
addresses some of the major issues that would arise therein. It was observed that more
Nigerians live below the poverty line and are food insecure. To overcome the problem of
food insecurity in Nigeria, the paper posits that agriculture deserves all necessary
support to raise its output. The political will of leaders at all levels of governance is also
solicited.

2
FOOD SECURITY AND NUTRITION TREND IN NIGERIA
Introduction
In recent times Nigeria has experienced some rapid changes in her demographic
and socio-economic environment which can be associated with food consumption
patterns. Changing consumption patterns have both positive and negative health
implications (Lopriore and Muehlhoff, 2003). In recent times, a diversity of seasonal
crops, among them fruits and legumes are becoming amore available nationwide due to
improved weather conditions and market fundamentals. There has also been increased
food availability in urban and rural market (Nigeria Food Security Outlook, 2008).
However, food security conditions are still a concern particularly in the far north and the
Niger Delta where household source of food and cash have significantly deteriorated as
food prices remain relatively high. It is therefore not surprising that Nigeria is also listed
by the food and Agricultural Organization (FAO) among nations that are at the moment
technically unable to meet their food needs. In May 2000, according to the Annual
Report of the Central Bank of Nigeria (2007), the FAO signed an agreement with the
Nigerian Government for a Unilateral Trust Fund project worth US$45.2 million with the
aim of attaining food security in the broadest sense and alleviate poverty under the
National Programme for Food Security (NPFS). The NPFS is an initiative of the Federal
Government of Nigeria and the FAO for poverty reduction in line with the thrust of
NEEDS. The NPFS has equally played a central role in achieving Government’s
agricultural policy goals of boosting agricultural production. In 2004 for instance, the
FAO adjudged the NPFS model the best in the world and it was recommended to other
countries (see Annual Report of the Central Bank of Nigeria, 2007:81). Despite these
feat and laudable attempts in recent times, under-nutrition and micronutrient deficiencies

3
are still rampaging while obesity and related chronic diseases like HIV/AIDS are still
significant public health problems in Nigeria.
This paper sets to discuss the food and nutrition situation of Nigeria, highlight
some of the socio-economic factors (price, income, employment, demographic
(population density) that have influenced the food system (supply, distribution,
consumption) and to address some of the major issues that would arise therein.
The rest of the paper is divided into 5 sections. Following the introduction,
Section 2 discusses agricultural support and food insecurity in Nigeria, while in Section
3, causes and consequences of food insecurity shall be reviewed. Section 4 presents the
food and nutrition situation. Section 5 highlights the food security constrains (storage,
processing, preservation, distribution and marketing) and Section 6 concludes the paper
with some remarks.
2. Agricultural Support and Food Insecurity in Nigeria
The importance of agriculture to national development is well documented in the
literature (Omotor, Orubu and Inoni, 2007). Its ultimate goal is to raise the standard of
living and make better the socio-economic well-being of the people. The relation
between agricultural production and food (in)security is indeed inseparable as both terms
could be used interchangeably.
At independence in 1960, Nigeria was purely an agrarian economy. The country
has a land area of 98.3 million ha; with 74 million ha good for farming, but less than half
being explored (www.fao.org/tc/TCA/work 05/Nigeriappt.pdf). The country has a
population of over 140 million with over 60 percent involved in farming. Agricultural
sector contribution to GDP has been over 30 percent since the 1990s (Central Bank of
Nigeria, Statistical Bulletin and Annual Report, Various issues). Incidentally over 54 per

4
cent of the population live on less than US$ 0.7 per day. Youth unemployment is high,
yet output of the small holder farmers is insufficient to feed the nation. In recent times
as portrayed in Figure 1, food import has been relied on the bridge the shortfalls (deficit)
in food supplies. Ironically in the 1960s, food production was high and Nigeria was an
agricultural (food) exporting country. Food was abundant without resort to food
importations. The high production was achieved by mobilizing small scale farmers as
provision of infrastructure, precisely roads and railways were constructed for evacuation
of crops for urban consumption and export purposes. Research institutes and
foundations for agriculture productivity and interventions were priorities of the
government both in the annual budgets and the Development plans. Institutional
programmes in agriculture that were undertaken in the second national development plan
(1970-74) were the National Accelerated Food Production Programme (NAFPP) and the
River Basin Development Authority Programme (RBDA).
The short of food inadequacy in Nigeria started during the civil war (1967-70) as
importation of agricultural inputs and machinery was curtailed in order to conserve
foreign exchange. In addition, farm lands were destroyed as the production base of the
country was equally disrupted and threatened. Some of these problems eased after the

5
civil war but resurfaced in 1974 as windfalls from crude oil export resulted to further
neglect of the agricultural sector (Adeniran and Babatunde, 2007). To ameliorate this,
the Third National Development Plan (1975-1980) by way of institutional intervention
established the Rural Integrated Agricultural Development Programme (ADB), Green
Revolution Programme (GR), Agro Service Centre Programme (ASC), National Seed
Service (NSS) and the National State and Food Production Companies. Before the 3rd
plan, military regime in attempt to boost agricultural production also put in place the
programme of Operation Feed the Nation (OFN).
The period, 1974 to the early 1980s’ witnessed massive movement of labour and
shift of resource from agriculture to other sectors whose returns were higher.
Consequently, there was decline in local food production as food import bill rose from a
mere $0.9 million before 1974 to $7.45 million in 1981 (Adeniran and Babatunde, 2007).
In order to check the negative trend and create an enabling environment for private sector
participation; and stimulate local production, the Federal Government deregulated the
Nigerian economy in 1986 and introduced the Structural Adjustment Programme (SAP).
The success and failure of this programme was the most controversial discourse up to the
late 1990s.
In 1996 and 2000, the National Accelerated Crops Production Programme
(NAICEP) and the Agricultural and Rural Transformation Programme (ARTP) were
established respectively. In 2003/2004, a comprehensive reform package aimed at
encouraging private sector operations – National Economic Empowerment Development
Strategy (NEEDS) was introduced. NEEDS in its framework has series of Presidential
Initiative Programmes with some targeted at various crops like cocoa, groundnut and
cassava.The various public support programmes vis-à-vis the trend of agricultural
development and food security no doubts have been overwhelming.

6
Table 1: Food Security Statistics - Nigeria
Population 1990-1992 1995-1997 2001-2003
Total (millions) 88.7 102.7 120.9
Food Deprivation 1990-1992 1995-1997 2001-2003
Proportion of undernourishment (%) 13 9 9
Number of undernourished (millions) 11.8 8.9 11.5
Food Consumption
Nutrients 1990-1992 1995-1997 2001-2003
Dietary energy consumption (kcal/person/day) 25-40 2720 2700
Dietary protein consumption (g/person/day) 57 62 61
Dietary fat consumption (g/person/day) 62 64 63 Food and Population Growth (Average Annual Rate of Change (%)
1979-1981 to
1990-1992 to
1995-1997 to
1990-1992 1995-1997 2001-2003
Food 4.8 2.7 2.6
Population 2.9 2.9 2.7
Diet Composition (Share in total Dietary Energy Consumption (%) 1990-1992 1995-1997 2001-2003
Non-starchy foods 34 33 35
Food Production and Trade
Food - Production Index Numbers 1990-1992 1995-1997 2001-2003
Net Per-Person PIN, base period 1999-2001 89 99 96
Food Except Fish - Trade Index Numbers 1990-1992 1995-1997 2001-2003
Import value, base period 1989-1991 46 77 132
Export value, base period 1989-1991 48 82 124
3. Causes and Consequences of Food Insecurity
A plethora of literature exists on food insecurity. A scan indicates that food
insecurity is closely linked with issues of hunger and poverty. While this section does not
unnecessarily dwell in water-tight distinction of these concepts, it shall however in the
following paragraphs undertake to discuss the causes and consequences of food
insecurity.
Food insecurity as a working concept in this paper is the absence of food security
and it is used to describe situations where people do not have access to sufficient quality
and quantity of food (POSTNOTE, 2006). On the other hand, according to the CBN
Annual Report and Statement of Accounts, 2007 food security exists when all people, at

7
all times, have access to sufficient, safe and nutritious food preferences for an active and
healthy life. The food health literature also has that lack of access to quality and
appropriate quantity of food has both individual and community (state or country)
impact. The impacts like a chain connection are interwoven with hunger, poverty and
disease. Hunger for instance reduces natural defences against most diseases and is a
major risk factor for illness worldwide (UN World Food Programme, cited in
POSTNOTE, 2006). Hunger equally results to loose in labour productivity and thus
hamper economic growth and promotes poverty. People who live in the poverty bracket
are unable to produce or make enough effective food demand and are susceptible to
disease which eventually also reduces their productivity; while inadequate labour
productivity reduces per capita gross domestic product (GDP) of a country. The
consequences of all these are even adverse on children.
Hungry children suffer poorer overall health status which compromises their
ability to resist illness. Children who do not have access to quality and appropriate
quantity of food (insecure) have elevated occurrence of health problems such as stomach
aches, headaches, colds, ear infections and fatigue (Brown, 2002). Such children also
record greater incidence of hospitalizations (Cook, Black, Casey Frank, Berkowitz and
Cutts, 2001). As some studies have shown (Kleinnam, Murphy, Little, Pegano, Wehler,
Regal and Jellinek, 1998; and Murphy, Pagano, Nachmani, Sperling, Kane and
Kleinnam, 1998), low-income children who are hungry were more likely to exhibit
impaired psychological functioning, including higher levels of anxiety, irritability,
hyperactivity, aggressive and oppositional behaviours (Brown, 2002:7). Such children as
further noted have difficulty in getting along with other children and need more mental
health services. Academically and in learning, hunger diminishes capacity to learn and
impairs cognitive functioning. Hungry children often repeat a grade in school, record

8
high level of absences, tardiness and even school suspension. Lower test scores and
poorer overall school achievement have also been associated with hungry children.
Situations of this nature for a country pose gloomy predicaments and could result to a
wasted future generation.
Other causes of food insecurity in the literature are low agricultural productivity,
low access to food, poor infrastructure base and local markets, barriers to international
trade, HIV/AIDS, savings and investment gaps, lack of health facilities and water
resources, climate change and natural disasters, conflict and persecution, gender
exclusion, illiteracy, socio exclusion among others. The prevalence of some of these
factors in Nigeria is elaborated on below.
Low Rates of Agricultural Production
In the last two decades and half, agricultural output in Nigeria barely grew
proportionately with population increases. The slow growth of agricultural output has
been attributed to poor road networks, lack of functioning markets and storage facilities,
outbreak of pest infections, poor varieties and technology and policy somersault. For
instance, food production index declined from 99 point in 1995 – 1997 to 96 point in
2001 – 2003 using base period of 1999 – 2001. Food (excluding fish) import value using
a base period (1989 – 1991) increased from 77 point in 1995 – 1997 to 132 point in 2001
– 2003. In terms of growth rate, the annual average rate of change was 4.8 percent from
1979 – 1981 to 1990 – 1992. Food growth rate was 2.7 percent from 1990 – 1992 to
1995 – 1997. This represents a decline when compared to the previous rate of 4.8
percent. A 2.6 percent growth rate of food was recorded from 1995 – 1997 to 2001 –
2003; but when compared to the previous period (1990 – 1992/1995 – 1997), this
represents a sharper decline. Population increase for the periods was constant at 2.9
percent in 1979 – 1981 to 1990 – 1992 and 1990 – 19992 to 1995 – 1995. The annual

9
rate of population change during the period 1995 – 1997 to 2001 – 2003 was 2.7 percent.
This decline is marginal and as such, the population increases can barely sustain with the
rate of food growth (see Table 1). As reported in Table 2, the percentage share of
agriculture to total gross domestic product has been on a downward trajectory. In 1980 –
1984, it was 39.9 percent and declined to 26.3 percent in 2000 and dip to 23.2 percent in
2007.1
Table 2. Share of Agriculture to Total GDP (%)
1980-
84 1985-
89 1990-
94 1995 2000 2003 2004 2005 2006 2007
Share of Agric in Total GDP (%) 39.9 32.2 38.8 32.1 26.3 26.4 24.3 22.5 22.5 23.2
Growth of Value Added in Agric (%) 2.5 5.4 2.5 3.6 2.9 4.1 6.6 5.5 5.0 4.5
African Development Bank (2008) Gender, Poverty and Environmental Indicators on African Countries Volume IX, Tunis Tunisia
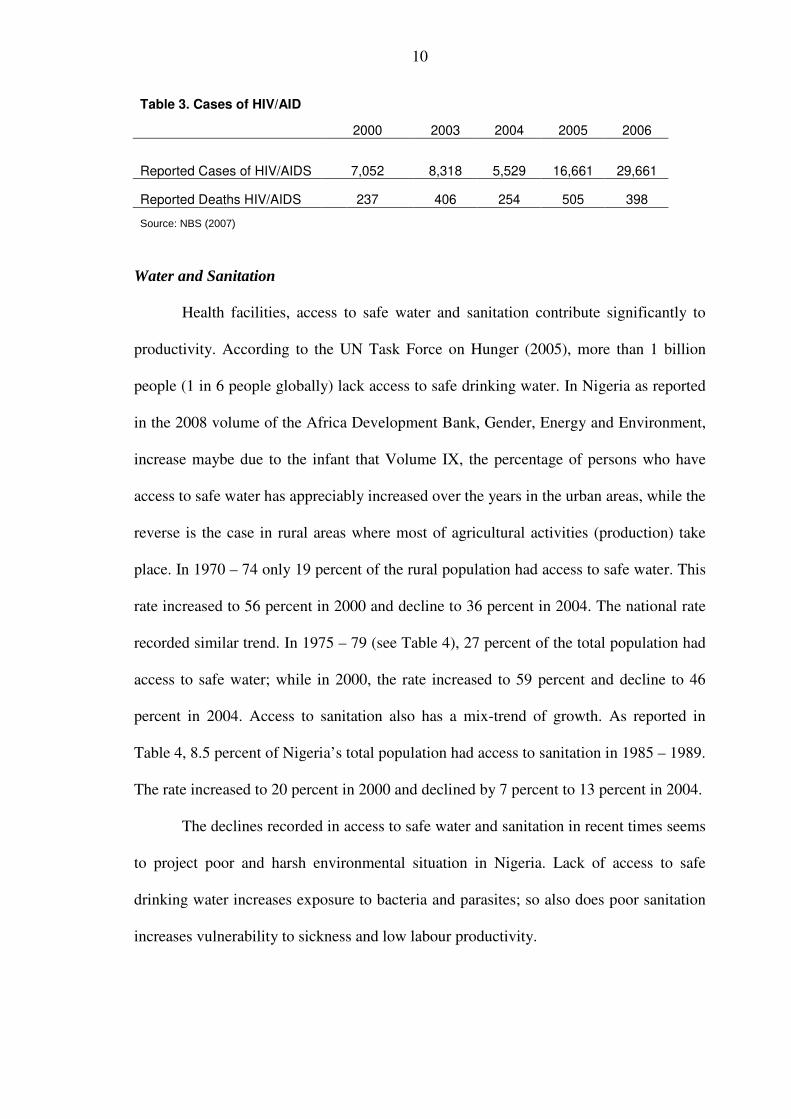
HIV and AIDS
Although ranges of diseases which affect food security are prevalent in Nigeria,
the most commonly recorded in history has been malaria. In recent times, HIV has had
an aggravating toll. In 2002, 7052 cases of HIV/AIDS were reported with 237 reported
deaths. In 2006, the reported cases of HIV/AIDS increased to 20,661 (see Table 3). This
represents over 190 percent growth rate. There are however speculations that most cases
are not even reported or diagnosed. One reason for this unprecedented increase is that
poverty induces transactional sex and this could increase vulnerability to risk of
infection. As the literature has it, (POSTNOTE, 210), HIV/AIDS mainly affects the
economically active group of the population (aged 20 to 49) and this hinders labour
productivity, food security and output growth. Deaths of parent(s) or guardian(s) also
increase the number of orphans and children who most times may be uncared for. This
equally has socio-economic effect for the future.
10
Table 3. Cases of HIV/AID
2000 2003 2004 2005 2006
Reported Cases of HIV/AIDS 7,052 8,318 5,529 16,661 29,661
Reported Deaths HIV/AIDS 237 406 254 505 398
Source: NBS (2007)
Water and Sanitation
Health facilities, access to safe water and sanitation contribute significantly to
productivity. According to the UN Task Force on Hunger (2005), more than 1 billion
people (1 in 6 people globally) lack access to safe drinking water. In Nigeria as reported
in the 2008 volume of the Africa Development Bank, Gender, Energy and Environment,
increase maybe due to the infant that Volume IX, the percentage of persons who have
access to safe water has appreciably increased over the years in the urban areas, while the
reverse is the case in rural areas where most of agricultural activities (production) take
place. In 1970 – 74 only 19 percent of the rural population had access to safe water. This
rate increased to 56 percent in 2000 and decline to 36 percent in 2004. The national rate
recorded similar trend. In 1975 – 79 (see Table 4), 27 percent of the total population had
access to safe water; while in 2000, the rate increased to 59 percent and decline to 46
percent in 2004. Access to sanitation also has a mix-trend of growth. As reported in
Table 4, 8.5 percent of Nigeria’s total population had access to sanitation in 1985 – 1989.
The rate increased to 20 percent in 2000 and declined by 7 percent to 13 percent in 2004.
The declines recorded in access to safe water and sanitation in recent times seems
to project poor and harsh environmental situation in Nigeria. Lack of access to safe
drinking water increases exposure to bacteria and parasites; so also does poor sanitation
increases vulnerability to sickness and low labour productivity.

11
Table 4. Access to Safe Water and Sanitation
Source: ADB 1970-
74 1975-
79 1980-
84 1985-
89 1990-
94 1995 2000 2003 2004 2005
Access to Safe Water (% of total population) 20.0 27.0 - 36.5 53.0 - 59.0 - 46.0 -
% Rural 19.00 26.00 40.00 34.20 55.00 - 56.00 - 36.00 -
% Urban 19.0 36.0 - 48.0 46.0 - 70.0 - 80.0 -
Access to Sanitation (% of population) - - - 8.5 15.0 - 20.0 - 13.0 -
Arable Land (as % of land area) - - 31.11 32.23 33.12 33.12 33.35 33.49 34.04 35.14
Irrigated land (% of Land area) - - 0.22 0.22 0.26 0.26 0.27 0.31 0.31 0.31
Human Development Index (0 to 1) 0.230 0.317 0.376 0.387 0.348 0.419 0.433 0.453 0.448 0.447
Source: ADB
(a) Economic and Social Context: UIS and World Bank
Population Growth and Poverty Spread
Nigeria has experienced one of the highest population growth rates in the last
three decades. The rate of growth has been over 2 percent annually and today more than
140 million people live in the country. The fertility rate is over 4 children per woman and
if the increase is not checked, it is feared that the population may double in the next two
decades.
In 1980, national poverty level was 27.2. The level of poverty increased to 42.7
in 1992 and doubled the 1980 level to 54.4 in 2004 (see Table 5). In terms of spread,
rural areas recorded higher levels of poverty than urban areas. Rural poverty level was
28.3 in 1980 and it almost tripled in 2004 at 63.3. Although the rate of urban poverty is
lower when compared with the rural areas, the rate in the urban area has tripled;
presumably due to rural-urban migration (urban population as percentage of total
increased from 44 percent in 2000 to 49 percent in 2006). As shown in Table 5, urban
poverty level was 17.2 and increased to 58.2 in 1996 and 43.2 in 2004. Incidentally,
poverty level is worst in North East and North West of the country.

12
Table 5: Spread and Trend in Poverty Levels
1980 1985 1992 1996 2004
National 27.2 46.3 42.7 65.6 54.4
Urban 17.2 37.8 37.5 58.2 43.2
Rural 28.3 51.4 46.0 69.3 63.3
South-South 13.2 45.7 40.8 58.2 35.1
South-East 12.9 30.4 41.0 53.3 26.1
South-West 13.4 38.6 43.1 60.9 43.0
North-Central 32.2 50.8 46.0 64.7 67.0
North-East 35.6 54.9 54.0 70.1 72.2
North-West 37.7 52.1 36.5 77.2 71.2
National Bureau of Statistics (2007) Annual Abstract of Statistics Abuja
The gloomy increase in poverty level of Nigeria may not be very surprising. This
is because of the over dependence of the economy on the oil sector (susceptible to
external shocks) at the expense of agricultural production (the mainstay of the economy
in the 1960s to mid 1970s). As presented in Table 4, the economic active population in
the agricultural sector has been on the decline since 1970. In 1970 over 70 percent of the
economic activity population was employed in the agricultural sector. This rate
decreased to 48.5 percent in 1985 and nose dived to 28.9 percent in 2005. In terms of
gender, more male have left employment in the agricultural sector than female. In 1970,
about 44.9 percent of male were employed in the sector but has since declined to 17.8
percent in 2005 (a decrease of over 60 percent); while for the same period, 26.1 percent
of female were employed in the sector in 1970. In 2005, the number of female in the
agricultural sector was 11.1 percent representing a decline of about 57.4 percent from its
1970 level (Table 6).

13
The consequence of the declines given that the drift is not as a result of
industrial/manufacturing labour demand is sharp shortage in food production and
attendance increased hunger and high poverty profile for Nigeria.
Table 6. Gender and Economic Active Population in Agriculture
1970 1975 1980 1985 1990 1995 2000 2003 2004 2005 2006 2007
Total population ('000) 53,763.5 61,162.9 71,064.7 81,598.1 94,454.3 109,010.1 124,772.6 134,659.4 138,001.1 141,356.1 144,720.0 148,092.5
Population Growth Rate-total (%) 2.46 2.77 2.94 2.80 2.93 2.81 2.62 2.50 2.45 2.40 2.35 2.30
Econ.active Pop. In agric. (as % of Total) 71.0 62.5 53.9 48.5 43.0 38.0 33.3 30.6 29.8 28.9 - -
Female (%) 26.1 23.3 20.5 17.9 15.3 13.9 12.5 11.6 11.3 11.1 - -
Male (%) 44.9 39.2 33.5 30.6 27.7 24.1 20.8 19.0 18.4 17.8 - -
Urban population (% of total) - - - - - - 44.00 - - 49.00 -
Source: ADB
(a) Economic and Social Context: UIS and World Bank
4. The Nutrition Situation of Nigeria
Food insecurity remains a significant international problem, with developing
regions including Nigeria enduring most of the burden. Food insecurity affects millions
of people around the world, including children in Nigeria. The situation in Nigeria
though has slightly improved, the progress is slow. This becomes more worrisome given
the fact that inadequate safe and nutritious food availability does not ensure food
accessibility. The literature has it that variety of adequate and quality safe foods are
required to be healthy and well nourished. As observed by Rukandema and Gurken
(2006), food insecurity and malnutrition increases human suffering and account
approximately for 60 percent of all childhood deaths in the developing world. Persistent
undernutrition and malnutrition has a consequence of leaving children weak, stunted,
wasted, vulnerable to disease attacks like diarrhoea, measles, malaria and acute
respiratory infections. Malnutrition in adolescents and adults can lead to decreased
energy levels, growth failure, and decreased ability to resist infections, short life

14
expectancy, powerlessness and even death. This section highlights some of the salient
issues in the nutritious situation of Nigeria.
Undernutrition in Children
High levels of malnutrition among children still persist in Nigeria. According to
the FAO report, over one third of children under five years of age in 2003 are moderately
stunted (38.3 percent), while about one-fifth (19.2 percent) are severely stunted (height-
for-age). Figure 2 shows the prevalence of stunting among children in Nigeria. Equally
reported in Figure 2 are the prevalence of underweight (weight-for-age) and wasting of
undernourished children under the age of 5 year in Nigeria. Over one quarter (28.7
percent) of children is moderately underweight, while 8.9 percent are severely
underweight. Prevalence of wasting (weight-for-height) in children less than five years is
a moderate 9.3 percent while 2.2 percent fall into minus 3 standard deviation (severe)
range.
Source: faostat.fao.org/default.aspx 04-07-09
Overall, the nutritional situation does not reflect an improved situation given that
total population is on the increase.
Malnutrition in Adolescents and Adults
The nutritional status of adolescents and adults is relatively poor in Nigeria. As
displayed in Figure 3, prevalence of malnutrition in female adolescents and adults of 14

15
– 49 years depicts that over 20.5 percent of women using a national level are overweight.
The urban areas have a record of 27.7 percent while rural areas record 16.6 percent. The
high level of urban female women may be due to sedentary lifestyles, eating habits and
quality of food. Akinyele (1998) reported that in Nigeria, two-thirds of the people’s daily
meals are bought from street vendors and fast food chains and this is more prevalent in
urban areas. Olayiwola, Soyibo and Atinmo (2003) corroborated this in their empirical
evidence that the number of registered fast food vendors astronomically increased from
1,342 in 1998 to 5,437 in 2003 in Nigeria.
Obesity in female is equally higher in urban areas than in rural areas of Nigeria.
The 2003 report has it that the national level for female stood at 5.9 percent; with the
urban rate of 9.6 percent almost doubling it. Female obesity in the rural areas is 3.6
percent far below the national record. As noted earlier, the factors highlighted above that
may be responsible for overweight in urban female may equally be responsible for the
relatively higher urban female obesity.
Source: faostat.fao.org/default.aspx 04-07-09
Micronutrients Deficiencies
Micronutrients deficiencies still remain one of the major public health problems
that Nigeria still needs to grapple with despite some progress that have been recorded.
16
The deficiency diseases associated with inadequate micronutrients intake are lack of iron,
vitamin A and iodine. Lack of these nutrients and their deficiencies can lead to impaired
physical and mental growth, blindness, anaemia and even maternal death. Child
mortality and susceptibility to infections and other diseases are some other consequences
of micronutrient deficiencies (Lapriore and Muehlhoff, 2003:6). Micronutrient
deficiencies may thus cause low productivity and slow down economic growth and
development.
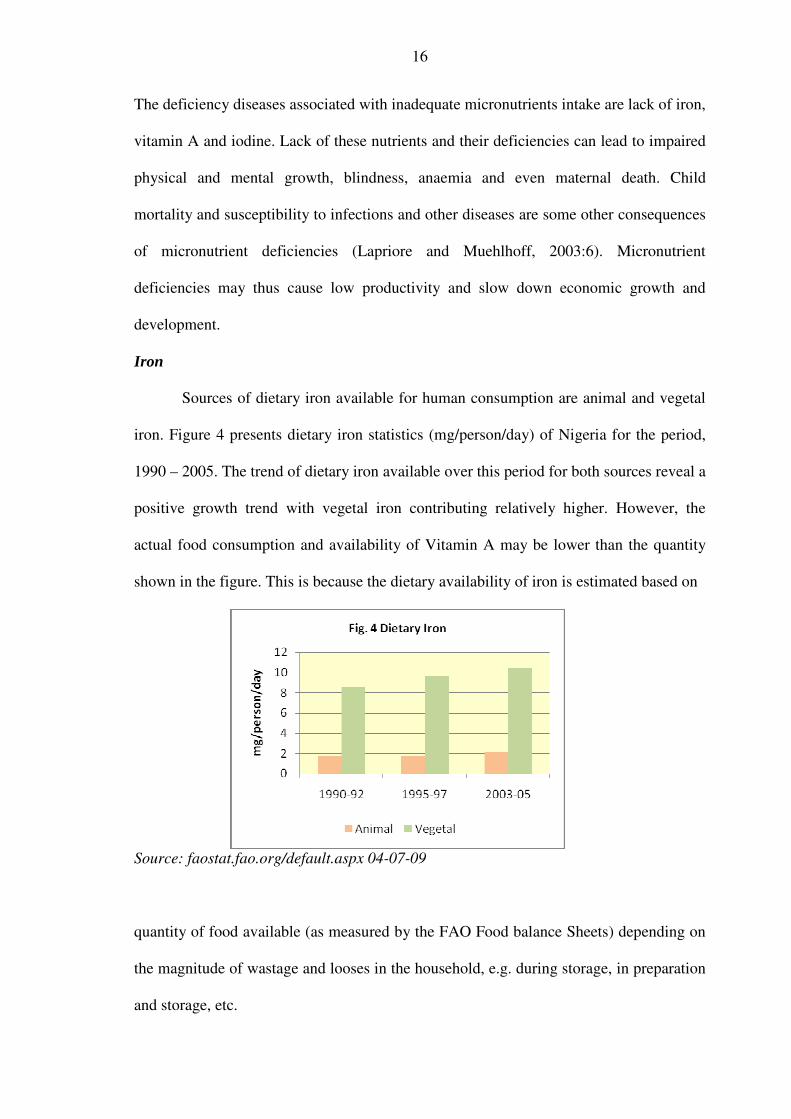
Iron
Sources of dietary iron available for human consumption are animal and vegetal
iron. Figure 4 presents dietary iron statistics (mg/person/day) of Nigeria for the period,
1990 – 2005. The trend of dietary iron available over this period for both sources reveal a
positive growth trend with vegetal iron contributing relatively higher. However, the
actual food consumption and availability of Vitamin A may be lower than the quantity
shown in the figure. This is because the dietary availability of iron is estimated based on
Source: faostat.fao.org/default.aspx 04-07-09
quantity of food available (as measured by the FAO Food balance Sheets) depending on
the magnitude of wastage and looses in the household, e.g. during storage, in preparation
and storage, etc.

17
Vitamin A
It is estimated that approximately 38 percent of children in West Africa are at risk
of Vitamin A deficiency (Lopriore and Muehlhoff, 2003) and over 228,000 deaths of
children under 5 each year are due to lack of Vitamin A (Aguayo, 2003, Sifri, Darnton-
Hill, Baker, Ag Bendech and Aguayo, 2003). Figure 5 presents data of Vitamin A
available for human consumption in Nigeria from 2003 – 2005. Three categories of
ratios are provided by the FAO in the measurements of Vitamin A available for human
consumption.
Categories of Vitamin A – RAE
1. less than 300 mcg RAE/person/day
2. 300 – 600 mcg RAE/person/day
3. more than 600 mcg RAE/person/day.
Nigeria between 1990 and 1992 has less than 300 mcg RAE/person/day; while between
1995 and 2005, Nigeria recorded 300 – 600 mcg RAE/person/day. What this implies is
that Nigeria is still at risk of Vitamin A deficiency.
Source: faostat.fao.org/default.aspx 04-07-09

18
Food Consumption Composition, Quality and Intensity
Inadequate food consumption results in under-nutrition, while inadequate
dietary intake can cause malnutrition particularly diarrhoeal disease in children. The
composition of food consumption in form of dietary protein consumption (g/person/day),
dietary fat consumption (g/person/day) and dietary energy consumption
(kcal/person/day) are presented in Figures 6,7,8 and 9; while Figure 10 show the share in
total dietary energy consumption (%) of carbohydrates, proteins and fats for the period
1990 – 2005. Figure 11 depicts the number of undernourished persons (millions) in
Nigeria from 1990 – 2005. Undernourishment refers to the condition of people whose
dietary energy consumption is continuously below a minimum energy requirement for
maintaining a healthy life and carrying out a light physical activity with minimum body
weight (FAO, 2009). A cursory view of Figure 9 inform us that there are more
undernourished persons in Nigeria in recent times than in the 1990s; when judged vis-à-
vis the total population of Nigeria. During the period 1990 – 92, approximately 14.7
million persons were undernourished in Nigeria. This number declined to 10.8 million in
1995 – 1997 and rose by 15.7 percent to 12.5 million in 2003 – 5. This is an indication of
food insecurity.
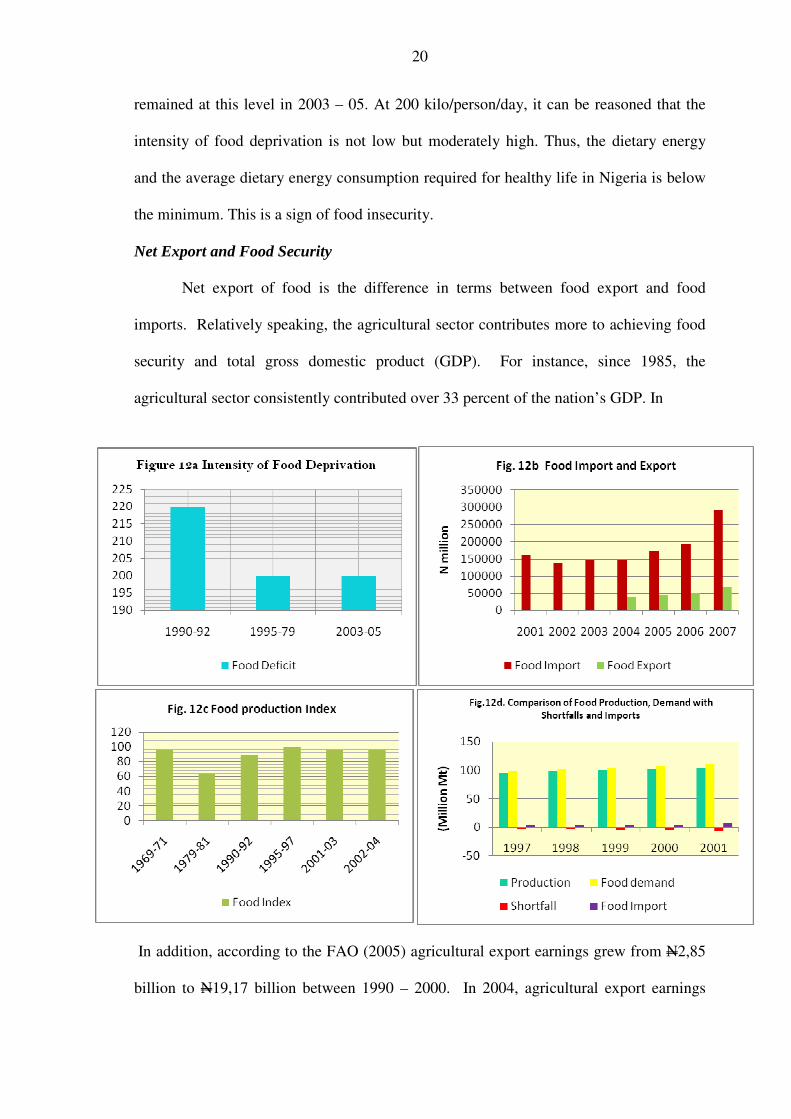
Intensity of food deprivation tells how much food-deprived people lie below the
minimum food needs in terms of dietary energy. According to FAOSTAT, it is measured
as the difference between the minimum dietary energy and the average dietary energy
consumption of food-deprival or undernourished population. The intensity of food
deprivation is low when it is less than 200 kilocalories per person per day and high when
it is higher than 300 kilocalories per person per day. High food deficit is related to health
risks related undernutrition. Since the last decade food deficit or precisely intensity of

19
food deprivation has not been an encouraging one. Food deficit was 220
(kcal/person/day) in 1990 – 92. It marginally declined to 200 (kcal/person/day) and
Source:
faostat.fao.org/default.aspx7-
Source: faostat.fao.org/default.aspx 04-07-09
20
remained at this level in 2003 – 05. At 200 kilo/person/day, it can be reasoned that the
intensity of food deprivation is not low but moderately high. Thus, the dietary energy
and the average dietary energy consumption required for healthy life in Nigeria is below
the minimum. This is a sign of food insecurity.
Net Export and Food Security
Net export of food is the difference in terms between food export and food
imports. Relatively speaking, the agricultural sector contributes more to achieving food
security and total gross domestic product (GDP). For instance, since 1985, the
agricultural sector consistently contributed over 33 percent of the nation’s GDP. In
In addition, according to the FAO (2005) agricultural export earnings grew from N2,85
billion to N19,17 billion between 1990 – 2000. In 2004, agricultural export earnings

21
grew from N37.54 billion to N67.37 billion in 2007. Despite this fundamental increase,
food demand still outstrips food supply as Figure 12 (a-d) adduce. These recorded
differences can only be sustained through imports as the data also relayed. In 2004, the
value of food imports was N147,38 billion; by 2007, food imports had increased to
N290.6 billion. The implication of this is that there may be food deficit in Nigeria and
that food production may not be keeping pace with population growth.
5. Food Security Constraints
The constraints to achieving food security in Nigeria are multi-dimensional.
Some are as common as you may find in other developing countries (see summary in
Table 7 by Treche, Dan-Hartog, Nout and Traore, 2002). Some others are peculiar to the
Nigerian environment. These are lack of political will to implement programmes; policy
summersault, corruption, activities of middlemen and speculators, profiteering
(importers) etc. These factors are self explaining and for space purposes, most are
summarized and included to Table 7.
Table 7: Constraints, needs and actions for the development of small agro-food industries (put in Annex)
Constraints Needs Responsible sector and action required Lack of juridical and Legislative environment (Laws, regulations)
Either excessive, then not attractive for business OR Absent/not enforced, therefore unable to protect SAFI against unfair trading.
a
To guarantee sustainable development of small agro-food industries (SAFI)
National government → establish laws & regulations that protect both consumers and producers.
Government → Poverty reduction strategies, subsidize products.
Low purchasing power of consumers.
a
To translate the need for low-cost foods (particularly ready-made CF) that are locally produced from indigenous ingredients into an effective market demand. Health/Education → raising awareness among
target groups.

22
Assistant from food technologists on the side
of production and marketing (→ small dose packages more adapted to consumer needs/reach).
Problematic access to business financing
a.
To offer flexibility in financial/banking services and micro-credits adapted to SAFI
Banking
High processing and operating costs
a
To facilitate access to high-tech equipments (and maintenance) that are economically viable and sustainable
Trade, Foreign Direct Investment.
Difficulties in supply/distribution of food raw materials
a
To improve domestic production, supply and distribution chains
Agriculture and Infrastructure.
Inadequate technological know-how of entrepreneurs, and complexity of market mechanisms
a
To provide training and build capacity of human resources
Information/Training/Education Networking and international collaborations between Research and Private business.
Poor marketing of processed foods
a
To identify potential market demand for new food products. To improve local production costs vs. retail price in order to offer competitive products (profit margins).
Marketing research
Organizational mixed cropping shifting cultivation, aversion to high risk, lack of rudimentary accounting systems
To improve on agricultural extension services National, state and local governments. Public agencies and NGOs.
Profit to farmers is low despite rising consumer prices of food
b.
To provide subsidy and safe nets to farmers. Governments at all lands, NGOs etc.
Lack of political will in implementing public programmes; policy discontinuity, corruption etc
b.
To awaken national consciousness, strengthen institutions, etc.
Leaders Particularly politicians.
(a) Adapted from Treche et al, 2002 (b) Author.

23
6. Concluding Remarks
Nigeria has a chequered history of food production, sustainability and food
security. Food production, no-doubt has been on the increase, the pace however, has not
been proportionate to the rapid population growth. Government at various times through
various programmes has intervened, but the food deficit augmented by food imports have
remained and seem to be on the trajectory of increase. The consequence is that more
Nigerians live below the poverty line and food insecure. These have attendant
implications on health status of many Nigerians with high prevalence of under-nutrition
and malnutrition. Among the spill-over effects of these; are reduced work capability,
low productivity, low life expectancy that further re-enforce poverty and the food
insecurity vicious cycle. This paper posits that agriculture deserves all necessary support
to raise its output and for Nigeria to be a food secure. The political will of leaders at all
levels of governance is thus solicited. In addition, research support, judicious and
efficient use of adequate funds budgeted for agricultural purpose, strong institutions,
improvement on agricultural systems, extension services; consistent and accurate
database, mechanization and provision of basic infrastructure are prerequisites for the
journey towards achieving food security in Nigeria.
Endnote 1. Data published by the Central Bank of Nigeria on this (see Appendix 1) is
however at variance.
24
References
Adeniran, and O. Babatunde (2007) Assessment of Nigeria Food Security Situation. http:www.tropentag.de/2007/proceedings/node159.html. [28-06-09]
Africa Development Bank (2008) Gender, Energy and Environmental Indicators on
African Countries. Volume IX, Tunis, Tunisia Aguayo, V.M. (2003), Vitamin A Deficiency and Child Mortality in Sub-Saharan Africa.
Reappraisal of Challenges and Opportunities. Annual ECOWAS Nutrition Forum. (available at www.pfnutrition.org/doc/key/chapter7.pdf) [08-07-09]
Akinyele, I.O. (1998), Street Foods and their Contribution to the Food Security and Nutritional Status of Nigerians. West African Journal of Foods and Nutrition. 1(1):6-20 http://faostat.fao.org/site/570/DesktopDefault.aspx?pageID=570 [04-07-09].
Brown, Larry (2002) The Consequences of Hunger and Food Insecurity for Children:
Evidence from Recent Scientific Studies. Centre on Hunger & Poverty Heller School for Social Policy & Management Brabdeis University, June.
Central Bank of Nigeria (2007) Annual Report and Statement of Accounts. Abuja Central Bank of Nigeria: Statistical Bulletin (Various issues) Cook, J. T. Black, M.M., Casey, P.H. Frank, D. A., Berkowitz, C. Cutts, D.B., et al.
(2001, April). Food insecurity and health risks among young children and their caregivers. Paper presented in poster symposium on nutritional issues in underserved populations (abstract #2665), Paediatric Academic Society Annual Meeting, Baltimore, MD.
Kleinman, R.E., Murphy, J.M., Little, M., Pagano, M. Wehler, C.A. Regal, K. &
Jellinek, M.S. (1998). Hunger in Children in the United States: Potential Behavioural and emotional correlates. Paediatrics 101 (1) E3. Available at: http://www.pediatrics.org/cgi/content/full/101/1e3 [10-07-09]
Lopriorea Cristina and Muehlhoffb Ellen (20030 Food security and Nutrition Trends
in West Africa -Challenges and theWay Forward. Theme 1: Improving the year- round availability of nutritionally adequate, safe and affordable food supplies at national and community levels. International Workshop Food- based approaches for a healthy nutrition Ouagadougou, 23-28 / 11 / 2 Murphy, J.M., Pagano, M.E., Nachhmani, J. Sperling, R., Kane, S., & Kleinman, R.E.
(September, 1998). The relationship of school breakfast to psychosocial and academic functioning. Archives of Paediatrics & Adolescent Medicine 152(9), 899-907. Abstract available at: http://archpedi.ama-assn.org/issues/v152n9/abs/pnu7508html.
National Bureau of Statistics (2007) Annual Abstract of Statistics. Abuja.

25
Nigeria’s Agriculture and Food Security Challenges (2005) www.fao.org/tc/TCA/work05/Nigeriappt.pdf[downloaded [28-06-09].
Nigeria Food Security Outlook (2008) USAID: FEWS NET. www.fews.net/nigeria. Olayiwola, K., Soyibo, A. and Atinmo, T. (2003), Impact of globalization on Food
Consumption, Health and Nutrition in Nigeria. Paper prepared for FAO Technical Workshop on “Globalization of Food Systems: Impact on Food Security and Nutrition”. 8 – 10 October, Rome, Italy.
Olayide, S. O. and J.K Olayemi (1978) Economic Aspect of Agriculture and Nutrition: A
Nigerian case study. Food and Nutrition Bulletin. Volume 1. No 1. www-wds.worldbank.org/external/default/.../multi0page.pdf. [10-07-09]
Omotor, D.G., C.O. Orubu and E.O. Inoni (2008) “Policy Reforms and Agricultural Productivity in Nigeria: An Empirical Analysis”. Singapore Economic Review (Forthcoming). POSTNOTE (2006), Food Security in Developing Countries, December, No. 274.
www.parliament.uk/post.
Rukandema, M. and A.A. Gurkan (2006), “Food Emergencies, Food Security and Economic Progress in Developing Countries”. http://www.fao.org/docrep/006/y5117e/y5117e05.htm. [07-07-09]
Sifri, Z., Darnton-Hill,I., Baker, S.K., Ag Bendech, M. and Aguayyo, V.M. (2003), A Concise Overview of Micronutrient Deficiencies in Africa and Future Directions. African Journal of Food and Nutritional Sciences. Online version ISSN 1681-9608, Vol. 2, No. 2.
Treche, S., Den Hartog, A.P., Nout, R.M.J. and Traore, A. (2002), Les petites industries agroalimentaires en Afrique de l’Ouest: situation actuelle et perspectives pour une alimentation saine. Cahiers d’etudes et de recherches
francophones/Agricultures. 5(11):343-8, Notes de recherché. (Also available at http//www.john-libbey-eurotext.fr/fr/revues/agrobiotech/agr/e-docs/00/00/EA/65/resume.md).
Wehler, C. A., Scott, R. I. & Anderson, J.J. (1995). Community Childhood Hunger
Identification Project. Washington, D.C. Food Research and Action Center.
UN Task Force on Hunger (2005), Halving Hunger. It can be done.
UN World Food Programme, What is Hunger? www.wfg.org.
.

26
Appendix 1.
Summary of Agriculture's Annual Budgetary Allocations, 1990-2007
Year Total Budget N'b Allocation to Agric
N'b % of Total Contribution of Agric
to GDP
1990 39.76 1.96 4.95 22.99
1991 38.66 0.67 1.74 34.54
1992 52.03 0.92 1.8 34.66
1993 112.1 2.83 2.53 35.12
1994 110.2 3.71 3.4 35.89
1995 153.49 6.92 4.51 36.33
1996 337.21 5.71 1.7 36.21
1997 428.21 8.66 2.0 36.71
1998 487.11 9.04 1.86 37.1
1999 947.69 12.15 1.28 38.58
2000 701.05 13.6 1.94 37.88
2001 1,018.02 64.94 6.38 37.55
2002 1,018.15 44.8 4.4 37.38
2003 1,226.10 16 1.3 36.51
2004 1,462.00 50 3.42 36.48
2005 1,840.70 76.6 4.16 36.69
2006 1,942.60 107.4 5.53 37.2
2007 2348.2 164.3 7
Sourec: CBN, Statistical Bulletin and Annual Report, Various Issues.