omnicom group annual reports 2004
TRANSCRIPT

Omnicom
A N N U A L R E P O R T
2004
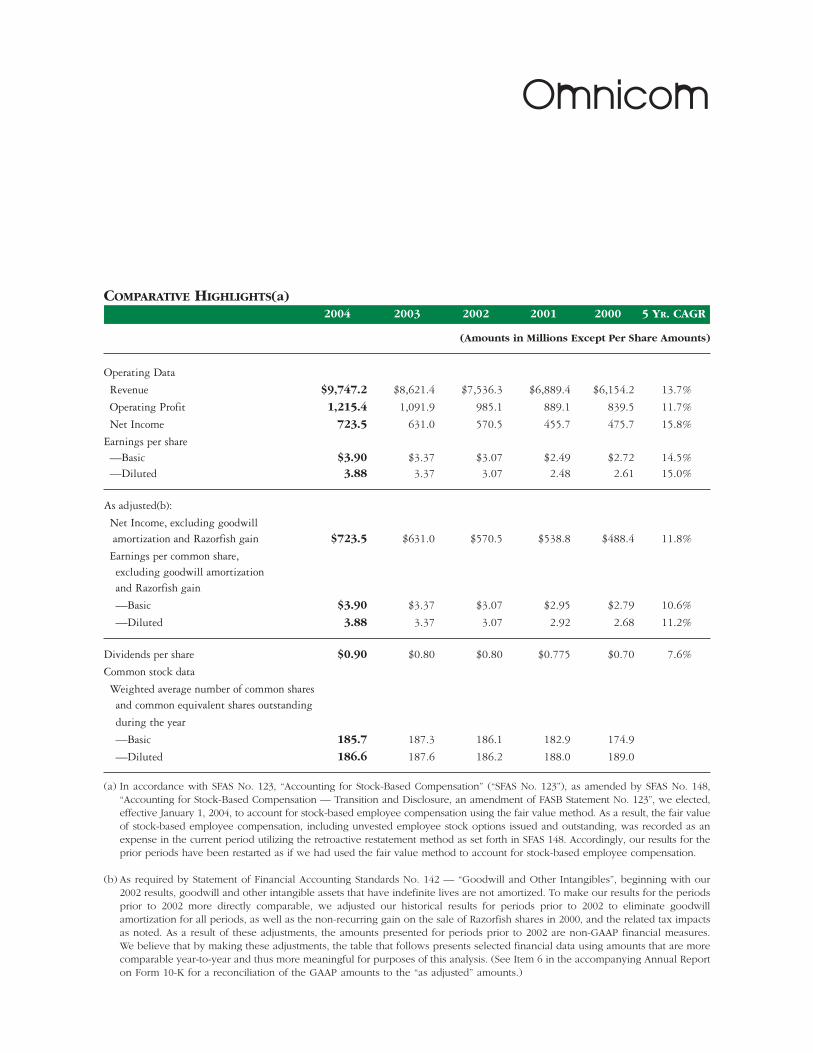
2004 2003 2002 2001 2000 5 YR. CAGR
(Amounts in Millions Except Per Share Amounts)
Operating Data
Revenue $9,747.2 $8,621.4 $7,536.3 $6,889.4 $6,154.2 13.7%
Operating Profit 1,215.4 1,091.9 985.1 889.1 839.5 11.7%
Net Income 723.5 631.0 570.5 455.7 475.7 15.8%
Earnings per share—Basic $3.90 $3.37 $3.07 $2.49 $2.72 14.5%—Diluted 3.88 3.37 3.07 2.48 2.61 15.0%
As adjusted(b):
Net Income, excluding goodwill amortization and Razorfish gain $723.5 $631.0 $570.5 $538.8 $488.4 11.8%
Earnings per common share,excluding goodwill amortizationand Razorfish gain
—Basic $3.90 $3.37 $3.07 $2.95 $2.79 10.6%
—Diluted 3.88 3.37 3.07 2.92 2.68 11.2%
Dividends per share $0.90 $0.80 $0.80 $0.775 $0.70 7.6%
Common stock data
Weighted average number of common sharesand common equivalent shares outstanding
during the year
—Basic 185.7 187.3 186.1 182.9 174.9
—Diluted 186.6 187.6 186.2 188.0 189.0
(a) In accordance with SFAS No. 123, “Accounting for Stock-Based Compensation” (“SFAS No. 123”), as amended by SFAS No. 148,“Accounting for Stock-Based Compensation –– Transition and Disclosure, an amendment of FASB Statement No. 123”, we elected,effective January 1, 2004, to account for stock-based employee compensation using the fair value method. As a result, the fair valueof stock-based employee compensation, including unvested employee stock options issued and outstanding, was recorded as anexpense in the current period utilizing the retroactive restatement method as set forth in SFAS 148. Accordingly, our results for theprior periods have been restarted as if we had used the fair value method to account for stock-based employee compensation.
(b) As required by Statement of Financial Accounting Standards No. 142 — “Goodwill and Other Intangibles”, beginning with our2002 results, goodwill and other intangible assets that have indefinite lives are not amortized. To make our results for the periodsprior to 2002 more directly comparable, we adjusted our historical results for periods prior to 2002 to eliminate goodwillamortization for all periods, as well as the non-recurring gain on the sale of Razorfish shares in 2000, and the related tax impactsas noted. As a result of these adjustments, the amounts presented for periods prior to 2002 are non-GAAP financial measures.We believe that by making these adjustments, the table that follows presents selected financial data using amounts that are morecomparable year-to-year and thus more meaningful for purposes of this analysis. (See Item 6 in the accompanying Annual Reporton Form 10-K for a reconciliation of the GAAP amounts to the “as adjusted” amounts.)
Omnicom
COMPARATIVE HIGHLIGHTS(a)

Dear Fellow Shareholders
Few things are more satisfying as a chief executive than to lookback on the year just past and be able to declare that management’smajor objectives were accomplished. I am pleased to say that 2004was such a year for Omnicom.
Omnicom again increased annual revenues and earnings. Ourstrategy of serving more of the needs of Omnicom’s largest clientsthrough client-centered networks helped drive revenues to recordhighs in 2004. We saw significant benefits from realigning the coststructures of our agencies during the past three years. This in turnenabled us to fulfill our stated goal of substantially increasingincentive compensation so we can continue to attract and retaintop-quality talent at our agencies. Those agencies performedexceptionally well in their own right during 2004, not only gainingmarket share and winning new clients but also commanding anunprecedented share of our industry’s most prestigious awards forcreative excellence.
Though it was not on our strategic agenda, we were also pleasedthat Omnicom was included in Fortune magazine’s list of “America’sMost Admired Companies” for 2004. We led our industry group inthe annual survey with the number one position in seven of eightkey attributes, including innovation, employee talent, financialsoundness and long-term investment.
Consistent operating performanceAfter three years of lagging economic conditions and cautiouscommitments by clients, we began to see the signs of spendinggrowth during 2004. Omnicom’s worldwide revenues increased13 percent in 2004 to $9.7 billion from $8.6 billion in 2003.Domestic revenues increased more than 10 percent to $5.2 billion,while international revenues advanced 16 percent to $4.5 billion.Approximately 10 percent of the increase in international revenuesresulted from foreign exchange impacts, most notably the continuedstrengthening during 2004 of the Euro and British pound against theU.S. dollar.
Letter from the President

Each of our marketing services disciplines contributed to revenuegrowth in 2004. Traditional media advertising grew by more than11 percent and accounted for 43 percent of total revenues.Customer relationship management – about 35 percent of revenueslast year – posted a solid 14 percent gain over 2003. Specialtycommunications had a terrific year, advancing nearly 18 percent duelargely to a strong resurgence in spending from the healthcare andrecruitment sectors. Our public relations companies also performedvery well, posting a 12 percent gain in revenues over 2003 levels.
Net income in 2004 was $723.5 million, a 15 percent increase fromthe $631 million earned in 2003. Diluted earnings per share alsoincreased 15 percent in 2004, to $3.88 per share from $3.37 pershare in 2003. It is worth noting that this strong bottom-lineperformance was achieved despite significant additional expensesrequired to complete Omnicom’s Sarbanes-Oxley Act Section 404certification.
As we announced last year at this time, Omnicom was an earlyadopter of the Financial Accounting Standards Board’s requirementthat stock options awarded to employees be recorded as anexpense on the Company’s income statement. We adopted the newstandard as at January 1, 2004. This change in no way altered ourflexibility to design the competitive compensation packages weneed to attract and keep the best talent required by our agencies tomeet the expectations of our clients.
Sarbanes-Oxley certificationIn late 2004, Omnicom successfully completed its Sarbanes-OxleyAct Section 404 certification process. Section 404 requires seniormanagers of public companies to take responsibility for theeffectiveness of the internal control structures and procedures thatunderlie their companies’ financial reporting. The certificationprocess required documentation and testing across all of ourcompanies around the world in order to make certain that ourdisclosure controls and procedures are effective for the recording,processing, summarization and reporting of information required tobe included in our annual report on Form 10-K.
Letter from the President
The compliance process necessitated a huge expenditure of energyand resources during the past 18-24 months by our financial staffaround the world. In fact, our acquisition activity was curtailedduring this time because of the pressing demands of the certificationprocess. This annual certification and audit procedure has added asubstantial amount of recurring expense to Omnicom’s cost base.
Investing for excellenceI noted in last year’s letter that our agencies made several significantinvestments in hiring senior creative people and their accountteams. As we anticipated, we are seeing significant returns on theseinvestments, not only in new business won but also in the creativeenergy they have brought to their agencies. We intend to continueto invest in Omnicom’s business and people while ensuring that thewhole is also as efficient as possible.
Investments such as these generate substantial returns for Omnicomand its shareholders over the long term. Our business model placesclients at the center of our organization. To make this approach apractical reality for clients, we have invested substantial amounts ofcapital to achieve a balanced mix of top-quality agencies in eachmarketing discipline in major markets around the world, whichenables us to bring together a customized mix of skills to deliverclient messages consistently and cost-effectively. This client-centricapproach is a key factor in the continuing growth in Omnicom’smarket share in all disciplines.
Managing that growth efficiently is an important priority for usbecause it is the engine of new investment. During 2004, we sawthe benefits of our organization-wide efforts to get cost structuresright location by location in a rapidly changing marketplace. Thecredit for Omnicom’s success in achieving alignment between itsresources and business levels must go to the management teams ofour individual agencies. It’s worth noting that many of these menand women have attended Omnicom University programs that gavethem the opportunity to learn the best practices needed to manage
Letter from the President

professional service firms effectively. We expect that ourmulti-million-dollar annual investment in continuing education willdeliver significant returns for many years to come.
Our agencies’ ability to right-size their operations enabled us toimprove operating profits and to substantially increase the incentivecompensation that enables us to attract and retain the creative talentthat is the foundation of our relationships with clients. Ourlong-term strategy of investing to build top creative teams aroundthe world paid off again in 2004. In the annual Gunn Report on theperformance of agency networks in the world’s top creative awards,Omnicom’s networks took the top three places, with the winnertaking an unprecedented total number of awards. In fact, our threenetworks were awarded more than the rest of the top ten networkscombined.
We expect our investment in the future growth of Omnicom willaccelerate in 2005. As we’ve said repeatedly, our over-archingcompetitive strategy is to broaden our business with our largestclients by growing our marketing capabilities and geographic reach.Having a balanced mix of the top agencies in all marketingdisciplines in all key markets enables us not only to competeeffectively for new business with few conflicts of interest but also tocreate overlapping relationships between agencies. It is a strategythat has shown its effectiveness in growing revenues and providingconsistency for Omnicom’s consolidated financial performance. Sowe anticipate that investment in new acquisitions will increase in2005 compared to the previous two years as we acquire newcreative businesses that will help us meet more of the identifiedneeds of our large clients around the world.
Looking aheadWe ended 2004 with a tangible feeling of renewed momentum.Apart from the usual adjustments required by business wins andlosses, the right-sizing necessitated by the challenging globalmarkets of the past three years is substantially behind us. The focusthroughout the Omnicom group of agencies is now sharply ongrowth – profitable growth.
Letter from the President
We have a very solid foundation on which to continue to grow. Ourcreative teams are the best in the business, and we intend to makeinvestments to develop and deepen our creative bench strength.Equally important is our agencies’ ability to work together inclient-centric networks that transcend disciplines and geographiesin pursuit of the very best outcome for clients.
Overall, our objectives and the strategies to meet them will be forthe most part unchanged from those that have delivered manyconsecutive years of improvements in revenues and earnings. Weintend to grow revenues by serving more of the needs of ourlargest clients through client-centered networks of the top creativetalents in major markets around the world. Through hard work at alllevels of Omnicom, we now have a far more sustainable coststructure, and in 2005 we will continue to look for opportunities toimprove on the efficiencies we’ve achieved. This straightforwardapproach to creating value has served our shareholders well for thepast 18 years, and we intend do our very best to ensure that it doesagain in 2005.
Sincerely,
John D. WrenPresident & Chief Executive OfficerApril 2005
Letter from the President
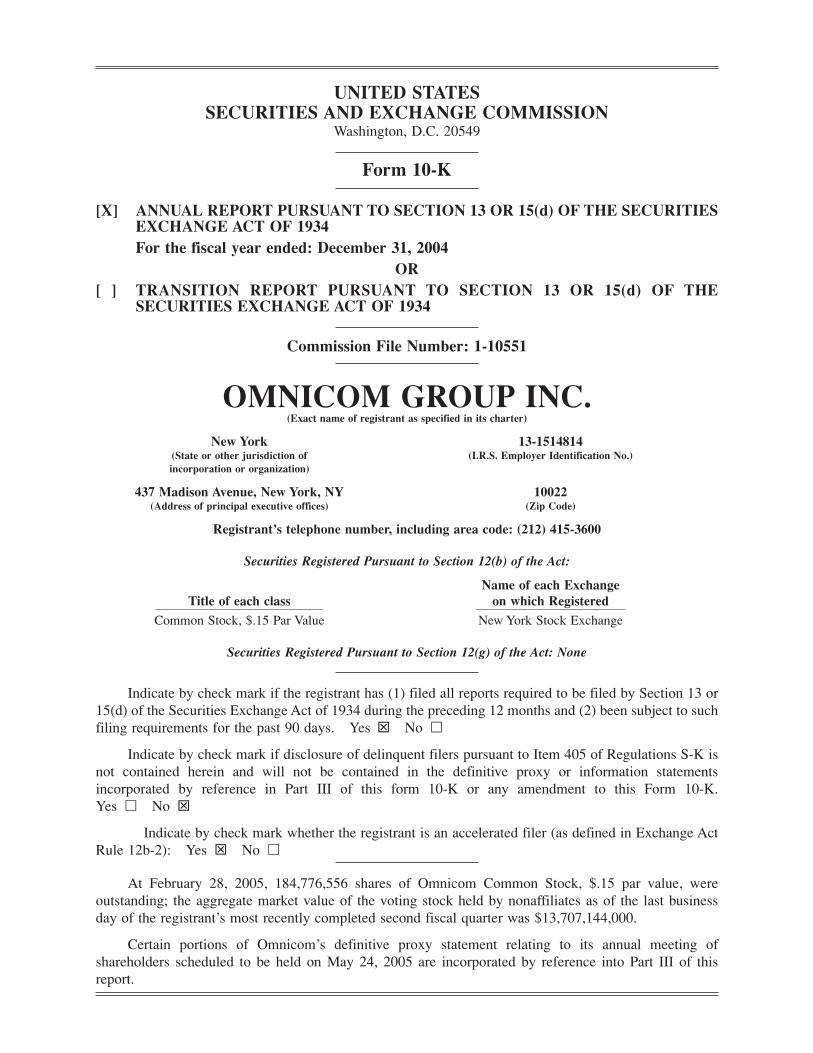
UNITED STATESSECURITIES AND EXCHANGE COMMISSION
Washington, D.C. 20549
Form 10-K
[X] ANNUAL REPORT PURSUANT TO SECTION 13 OR 15(d) OF THE SECURITIESEXCHANGE ACT OF 1934For the fiscal year ended: December 31, 2004
OR[ ] TRANSITION REPORT PURSUANT TO SECTION 13 OR 15(d) OF THE
SECURITIES EXCHANGE ACT OF 1934
Commission File Number: 1-10551
OMNICOM GROUP INC.(Exact name of registrant as specified in its charter)
New York 13-1514814(State or other jurisdiction of (I.R.S. Employer Identification No.)incorporation or organization)
437 Madison Avenue, New York, NY 10022(Address of principal executive offices) (Zip Code)
Registrant’s telephone number, including area code: (212) 415-3600
Securities Registered Pursuant to Section 12(b) of the Act:
Name of each ExchangeTitle of each class on which Registered_______________________________________________________________ ________________________________________________________
Common Stock, $.15 Par Value New York Stock Exchange
Securities Registered Pursuant to Section 12(g) of the Act: None
Indicate by check mark if the registrant has (1) filed all reports required to be filed by Section 13 or15(d) of the Securities Exchange Act of 1934 during the preceding 12 months and (2) been subject to suchfiling requirements for the past 90 days. Yes � No �
Indicate by check mark if disclosure of delinquent filers pursuant to Item 405 of Regulations S-K isnot contained herein and will not be contained in the definitive proxy or information statementsincorporated by reference in Part III of this form 10-K or any amendment to this Form 10-K.Yes � No �
Indicate by check mark whether the registrant is an accelerated filer (as defined in Exchange ActRule 12b-2): Yes � No �
At February 28, 2005, 184,776,556 shares of Omnicom Common Stock, $.15 par value, wereoutstanding; the aggregate market value of the voting stock held by nonaffiliates as of the last businessday of the registrant’s most recently completed second fiscal quarter was $13,707,144,000.
Certain portions of Omnicom’s definitive proxy statement relating to its annual meeting ofshareholders scheduled to be held on May 24, 2005 are incorporated by reference into Part III of thisreport.


OMNICOM GROUP INC.
ANNUAL REPORT ON FORM 10-K FORTHE YEAR ENDED DECEMBER 31, 2004
TABLE OF CONTENTS
Page____
PART I
Item 1. Business .......................................................................................................................... 1Item 2. Properties ........................................................................................................................ 3Item 3. Legal Proceedings .......................................................................................................... 3Item 4. Submission of Matters to a Vote of Security Holders .................................................. 4
PART II
Item 5. Market for Registrant’s Common Equity, Related Stockholder Matters andIssuer Purchases of Equity Securities .................................................................. 5
Item 6. Selected Financial Data.................................................................................................. 5Item 7. Management’s Discussion and Analysis of Financial Condition
and Results of Operations .................................................................................... 8Item 7A. Critical Accounting Policies and New Accounting Pronouncements .......................... 16Item 8. Financial Statements and Supplementary Data ............................................................ 24Item 9. Changes in and Disagreements with Accountants on Accounting and
Financial Disclosure .............................................................................................. 24Item 9A. Controls and Procedures ................................................................................................ 24Item 9B. Other Information .......................................................................................................... 24
PART III
Item 10. Directors and Executive Officers of the Registrant ...................................................... 25Item 11. Executive Compensation ................................................................................................ *Item 12. Security Ownership of Certain Beneficial Owners and Management .......................... *Item 13. Certain Relationships and Related Transactions .......................................................... *Item 14. Principal Accounting Fees and Services........................................................................ *
PART IV
Item 15. Exhibits, Financial Statement Schedules and Reports on Form 8-K............................ 26Index to Financial Statements........................................................................................ 26Index to Financial Statements Schedules ...................................................................... 26Exhibit Index .................................................................................................................. 26
Signatures .............................................................................................................................................. 29Management Report on Internal Controls Over Financial Reporting ................................................ F-1Report of Independent Registered Public Accounting Firm................................................................ F-2Report of Independent Registered Public Accounting Firm................................................................ F-3Consolidated Financial Statements ...................................................................................................... F-4Notes to Consolidated Financial Statements........................................................................................ F-8
* The information called for by Items 10, 11, 12, 13 and 14 to the extent not included in this document, isincorporated herein by reference to the information to be included under the captions “Election of Directors”,“Stock Ownership”, “Director Compensation” and “Executive Compensation” in Omnicom’s definitive proxystatement, which is expected to be filed by April 22, 2005.


PART I
Introduction
This report is both our 2004 annual report to shareholders and our 2004 annual report on Form 10-Krequired under federal securities laws.
We are a strategic holding company. We provide professional services to clients through multiple agenciesoperating in all major markets around the world. Our companies provide advertising, marketing and corporatecommunications services. For simplicity, however, the terms “Omnicom”, “we”, “our” and “us” each refer toOmnicom Group Inc. and our subsidiaries unless the context indicates otherwise.
Statements of our beliefs or expectations regarding future events are “forward-looking statements” withinthe meaning of the federal securities laws. These statements are subject to various risks and uncertainties,including as a result of the specific factors identified under the captions “Risks and Competitive Conditions” and“Management’s Discussion and Analysis of Financial Condition and Results of Operations” on pages 2 and 8and elsewhere in this report. There can be no assurance that these beliefs or expectations will not change or beaffected by actual future events.
1. Business
Our Business: As a strategic holding company, we are one of the largest advertising, marketing andcorporate communications companies in the world. Omnicom was formed as a corporation in 1986 by themerger of several leading advertising, marketing and corporate communications networks. Around that time andthrough the 1990s, the proliferation of media channels, especially print and cable television, effectivelyfragmented mass audiences. This development made it increasingly more difficult for marketers to reach theirtarget audiences in a cost-effective way, and they turned to marketing service providers such as Omnicom for acustomized mix of advertising and marketing communications services that would make best use of their totalmarketing expenditures.
Our agencies provide an extensive range of services which we group into four fundamental disciplines:traditional media advertising; customer relationship management (“CRM”); public relations and specialtycommunications. The services included in these categories are:
1
advertisingbrand consultancycrisis communicationscustom publishingdatabase managementdigital and interactive marketingdirect marketingdirectory advertisingentertainment marketingenvironmental designexperiential marketingfield marketingfinancial / corporate business-to-business advertisinggraphic artshealthcare communicationsinstore design
investor relationsmarketing researchmedia planning and buyingmulti-cultural marketingnon-profit marketingorganizational communicationspackage designproduct placementpromotional marketingpublic affairspublic relationsreal estate advertising and marketingrecruitment communicationsreputation consultingretail marketingsports and event marketing
Although the medium used to reach a given client’s target audience may be different across each of thesedisciplines, the marketing message is developed in the same way — and it is delivered in the same way —through the provision of consultative services.
Omnicom’s business model was built and evolves around its clients. While our companies operate underdifferent names and frame their ideas in different disciplines, we organize our services around our clients. Thefundamental premise of our business is that the specific requirements of our clients should be the central focusin how we structure our business offering and allocate our resources. As clients increase their demands formarketing effectiveness and efficiency, they tend to consolidate their business with larger, multi-disciplinary

2
agencies. Accordingly, our business model demands that multiple agencies within Omnicom collaborate informal and virtual networks that cut across internal organizational structures to execute against our clients’specific marketing requirements. We believe that this organizational philosophy, and our ability to execute on it,is what differentiates us from our competition.
Our agency networks and our virtual networks, provide us with the ability to integrate services across alldisciplines. This means that the delivery of these services can and does take place across agencies, networks andgeographies simultaneously.
Longer term, we believe that our virtual network strategy facilitates better integration of services requiredby the demands of the marketplace for advertising and marketing communications services. Our over-archingstrategy for the business is to continue to use our virtual networks to grow our business relationships with ourclients.
The various components of our business and material factors that affected us in 2004 are discussed underthe caption “Management’s Discussion and Analysis of Financial Conditions and Results of Operations” of thisreport. None of our acquisitions in 2004, 2003 or 2002 were material to our consolidated financial position orresults of operations. For information concerning our acquisitions, see note 2 to our consolidated financialstatements.
Geographic Regions: Our total consolidated revenue is about evenly divided between U.S. and non-U.S.operations. For financial information concerning domestic and foreign operations and segment reporting, seenote 5 to our consolidated financial statements.
Our Clients: Consistent with the fundamentals of our business strategy, our agencies serve similar clients,in similar industries, and in many cases the same clients, across a variety of geographies. Furthermore, in manycases our agencies or networks serve different product groups within the same clients served by other ofOmnicom’s agencies or networks. For example, our largest client was served by more than 90 of our agencies in2004 and represented 4.3% of our 2004 consolidated revenue. No other client accounted for more than 2.8% ofour consolidated 2004 revenue. Each of our top 100 clients were served, on average, by 23 of our agencies in2004. Our top 100 clients represented 45.1% of our 2004 consolidated revenue.
Our Employees: We employed approximately 61,000 people at December 31, 2004. We are not party toany significant collective bargaining agreements. The skill-sets of our workforce across our agencies and withineach discipline are similar. Common to all is the ability to understand a client’s brand, its selling proposition andthe ability to develop a unique message to communicate the value of the brand to the client’s target audience.Recognizing the importance of this core competency, we have established training and education programs forour service professionals around this competency. See our management discussion and analysis beginning onpage 8 of this report for a discussion of the effect of salary and related costs on our historical results ofoperations.
Risks and Competitive Conditions: We face the risks normally associated with global services businesses.The operational and financial performance of our businesses are typically tied to overall economic and regionalmarket conditions, competition for client assignments and talented staff, new business wins and losses and therisks associated with extensive international operations. We do not believe that our international operations as awhole present any material foreign exchange risk to our overall business because they invoice clients and payexpenses in their local currency. However, there are some risks of doing business abroad, including those ofcurrency fluctuations, political instability and exchange controls, which do not affect domestic-focused firms.For financial information on our operations by geographic area, see note 5 to our consolidated financialstatements.
The particular businesses in which we participate are highly competitive. Typically, the financial andtechnological barriers to entry are low. Key competitive considerations for keeping existing business andwinning new business include our ability to develop creative solutions that meet client needs, the quality andeffectiveness of the services we offer, and our ability to efficiently serve clients, particularly large internationalclients, on a broad geographic basis. While many of our client relationships are long-standing, companies puttheir advertising, marketing and corporate communications services business up for competitive review fromtime to time. To the extent that we are not able to remain competitive or to keep key clients, our business andfinancial results would be adversely affected.
Our ability to retain existing clients and to attract new clients may, in some cases, be limited by clients’policies on, or perceptions of, conflicts of interest arising out of other client relationships. We maintain multipleagencies to effectively manage multiple client relationships and avoid potential conflicts of interests. In addition,an important aspect of our competitiveness is our ability to retain key personnel. Our continuing ability to attractand retain these employees may have a material effect on our business and financial results.
Our revenue is dependent upon the advertising, marketing and corporate communications requirements ofour clients and tends to be lowest in the first and third quarters of the calendar year as a result of thepost-holiday slowdown in client activity at the beginning of January and a slowdown in client activity in Augustprimarily as a result of the vacation season. See our management discussion and analysis in Part II of this reportfor a discussion of the effect of market conditions and other factors on our historical results of operations.
Directly or indirectly, government agencies and consumer groups have from time to time affected orattempted to affect the scope, content and manner of presentation of advertising, marketing and corporatecommunications services, whether through regulations or other governmental action. However, these attemptshave not materially affected our agency networks nor do we expect such actions to do so in the future.
2. Properties
We maintain office space in many major cities around the world. The office space requirements of ouragencies are similar across geographies and disciplines and is in suitable and well-maintained condition for ourcurrent operations. This space is primarily used for office and administrative purposes by our employees inperforming professional services. Our principal corporate offices are at 437 Madison Avenue, New York, NewYork and One East Weaver Street, Greenwich, Connecticut. We also maintain executive offices in London,England.
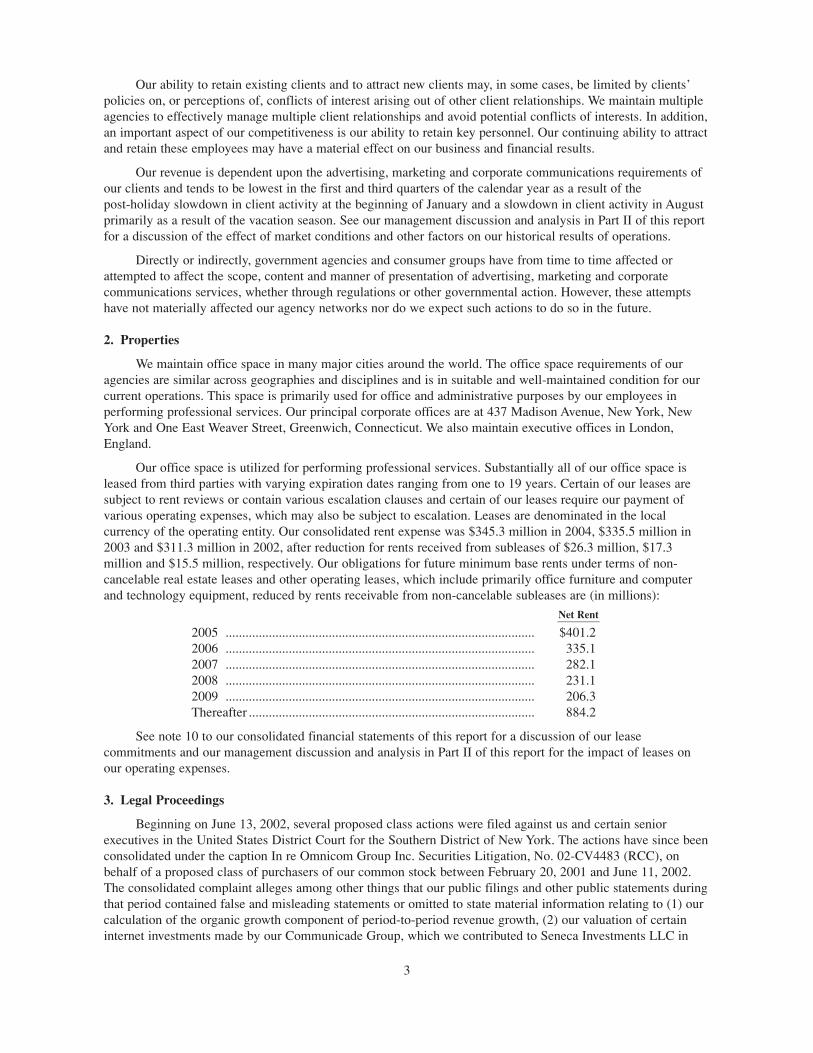
Our office space is utilized for performing professional services. Substantially all of our office space isleased from third parties with varying expiration dates ranging from one to 19 years. Certain of our leases aresubject to rent reviews or contain various escalation clauses and certain of our leases require our payment ofvarious operating expenses, which may also be subject to escalation. Leases are denominated in the localcurrency of the operating entity. Our consolidated rent expense was $345.3 million in 2004, $335.5 million in2003 and $311.3 million in 2002, after reduction for rents received from subleases of $26.3 million, $17.3million and $15.5 million, respectively. Our obligations for future minimum base rents under terms of non-cancelable real estate leases and other operating leases, which include primarily office furniture and computerand technology equipment, reduced by rents receivable from non-cancelable subleases are (in millions):
Net Rent________
2005 ............................................................................................. $401.22006 ............................................................................................. 335.12007 ............................................................................................. 282.12008 ............................................................................................. 231.12009 ............................................................................................. 206.3Thereafter ...................................................................................... 884.2
See note 10 to our consolidated financial statements of this report for a discussion of our leasecommitments and our management discussion and analysis in Part II of this report for the impact of leases onour operating expenses.
3. Legal Proceedings
Beginning on June 13, 2002, several proposed class actions were filed against us and certain seniorexecutives in the United States District Court for the Southern District of New York. The actions have since beenconsolidated under the caption In re Omnicom Group Inc. Securities Litigation, No. 02-CV4483 (RCC), onbehalf of a proposed class of purchasers of our common stock between February 20, 2001 and June 11, 2002.The consolidated complaint alleges among other things that our public filings and other public statements duringthat period contained false and misleading statements or omitted to state material information relating to (1) ourcalculation of the organic growth component of period-to-period revenue growth, (2) our valuation of certaininternet investments made by our Communicade Group, which we contributed to Seneca Investments LLC in
3

2001, and (3) the existence and amount of certain contingent future obligations in respect of acquisitions. Thecomplaint seeks an unspecified amount of compensatory damages plus costs and attorneys’ fees. Defendantshave moved to dismiss the complaint. The court has not yet decided the motion. In addition to the proceedingsdescribed above, a shareholder derivative action was filed on June 28, 2002 in New York State Court in NewYork City, by a plaintiff shareholder, purportedly on the company’s behalf. The complaint alleges, among otherthings, breaches of fiduciary duty, disclosure failures, abuse of control and gross mismanagement in connectionwith the formation of Seneca Investments LLC by certain of our current and former directors. This case isstayed, pending a ruling on the motion to dismiss the proposed class action. On February 18, 2005, anothershareholder filed an action asserting similar claims. No response is yet required.
The defendants in these cases expect to defend themselves vigorously. Currently, we are unable todetermine the outcome of these cases and the effect on our financial position or results of operations. Theoutcome of any of these matters is inherently uncertain and may be affected by future events. Accordingly, wecannot assure investors as to the ultimate effect of these matters on our financial position or results of operations.
We are also involved from time to time in various routine legal proceedings in the ordinary course ofbusiness. We do not presently expect that these proceedings will have a material adverse effect on ourconsolidated financial position or results of operations.
For additional information concerning our legal proceedings, including the class action and derivativeaction described above, see note 14 to our consolidated financial statements, which is incorporated into thissection by reference.
4. Submission of Matters to a Vote of Security Holders
Our annual shareholders meeting has historically been held in the second quarter of the year. No matterswere submitted to a vote of our shareholders during the last quarter of 2004.
4
PART II
5. Market for Registrant’s Common Equity, Related Stockholder Matters and Issuer Purchases of EquitySecurities
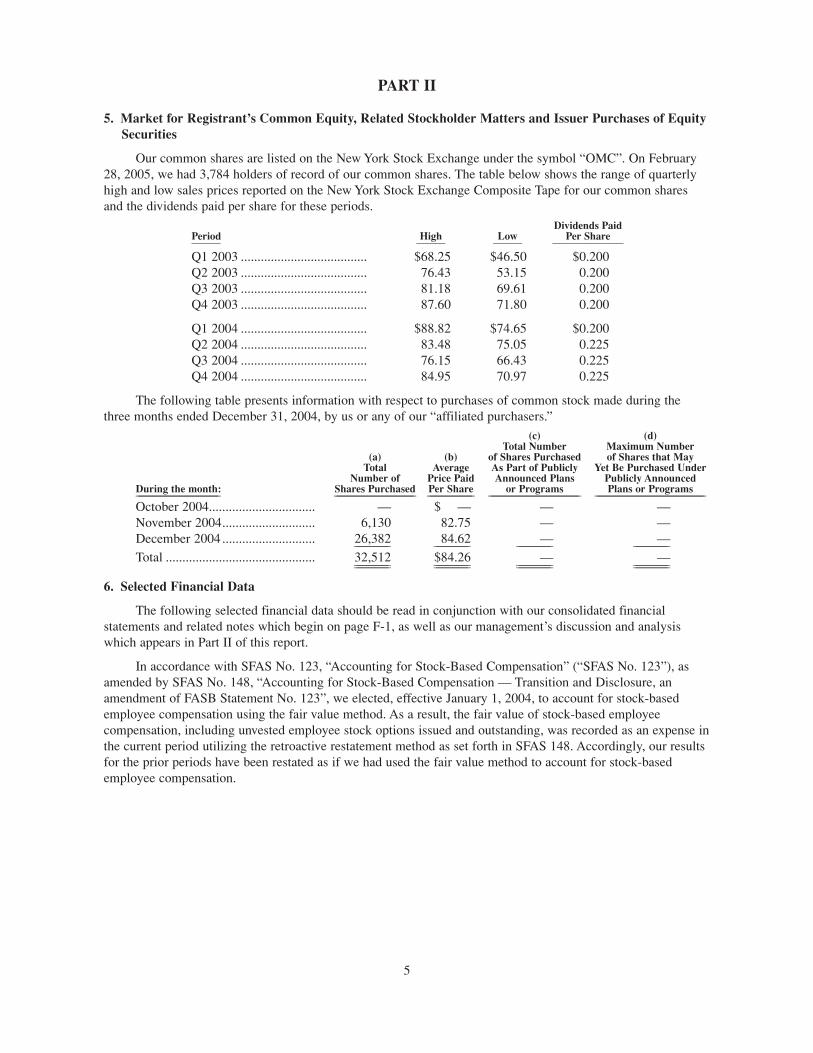
Our common shares are listed on the New York Stock Exchange under the symbol “OMC”. On February28, 2005, we had 3,784 holders of record of our common shares. The table below shows the range of quarterlyhigh and low sales prices reported on the New York Stock Exchange Composite Tape for our common sharesand the dividends paid per share for these periods.
Dividends PaidPeriod High Low Per Share___________ ___________ ___________ ___________________________
Q1 2003 ...................................... $68.25 $46.50 $0.200Q2 2003 ...................................... 76.43 53.15 0.200Q3 2003 ...................................... 81.18 69.61 0.200Q4 2003 ...................................... 87.60 71.80 0.200
Q1 2004 ...................................... $88.82 $74.65 $0.200Q2 2004 ...................................... 83.48 75.05 0.225Q3 2004 ...................................... 76.15 66.43 0.225Q4 2004 ...................................... 84.95 70.97 0.225
The following table presents information with respect to purchases of common stock made during thethree months ended December 31, 2004, by us or any of our “affiliated purchasers.”
(c) (d)Total Number Maximum Number
(a) (b) of Shares Purchased of Shares that MayTotal Average As Part of Publicly Yet Be Purchased Under
Number of Price Paid Announced Plans Publicly AnnouncedDuring the month: Shares Purchased Per Share or Programs Plans or Programs_______________________________ ______________________________ _________________ __________________________________ _________________________________________
October 2004................................ — $ — — —November 2004............................ 6,130 82.75 — —December 2004 ............................ 26,382 84.62 — —_____________ _____________ _____________ _____________
Total ............................................. 32,512 $84.26 — —_____________ _____________ _____________ __________________________ _____________ _____________ _____________
6. Selected Financial Data
The following selected financial data should be read in conjunction with our consolidated financialstatements and related notes which begin on page F-1, as well as our management’s discussion and analysiswhich appears in Part II of this report.
In accordance with SFAS No. 123, “Accounting for Stock-Based Compensation” (“SFAS No. 123”), asamended by SFAS No. 148, “Accounting for Stock-Based Compensation — Transition and Disclosure, anamendment of FASB Statement No. 123”, we elected, effective January 1, 2004, to account for stock-basedemployee compensation using the fair value method. As a result, the fair value of stock-based employeecompensation, including unvested employee stock options issued and outstanding, was recorded as an expense inthe current period utilizing the retroactive restatement method as set forth in SFAS 148. Accordingly, our resultsfor the prior periods have been restated as if we had used the fair value method to account for stock-basedemployee compensation.
5

(Dollars in Millions Except Per Share Amounts)______________________________________________________________For the years ended December 31, 2004 2003 2002 2001 2000________ ________ ________ ________ ________
Revenue ................................................ $9,747.2 $8,621.4 $7,536.3 $6,889.4 $6,154.2Operating Profit .................................... 1,215.4 1,091.9 985.1 889.1 839.5Income After Income Taxes ................ 782.5 696.1 625.0 495.9 519.4Net Income .......................................... 723.5 631.0 570.5 455.7 475.7Net Income per common share:
Basic ................................................ 3.90 3.37 3.07 2.49 2.72Diluted ............................................ 3.88 3.37 3.07 2.48 2.61
Dividends declared per common share.................................. 0.900 0.800 0.800 0.775 0.700
(Dollars in Millions Except Per Share Amounts)______________________________________________________________As of the year ended December 31: 2004 2003 2002 2001 2000________ ________ ________ ________ ________
Cash, cash equivalents andshort-term investments .................... $ 1,739.6 $ 1,548.9 $ 695.9 $ 517.0 $ 576.5
Total assets............................................ 16,002.4 14,620.0 12,056.5 10,686.8 9,899.2Long-term obligations
Long-term debt ................................ 19.1 197.3 197.9 490.1 1,015.4Convertible notes ............................ 2,339.3 2,339.3 1,747.0 850.0 230.0Deferred compensation and
other liabilities ............................ 309.1 326.5 293.6 297.0 296.9
As discussed in footnote 1 of the notes to our consolidated financial statements, as required by statementsof Financial Accounting Standards 142 — “Goodwill and Other Intangibles” (“SFAS 142”), beginning with our2002 results, goodwill and other intangible assets that have indefinite lives are not amortized due to a change ingenerally accepted accounting principles (“GAAP”). To make our results for the periods prior to 2002 moredirectly comparable in the table that follows, we adjusted our historical results for periods prior to 2002 toeliminate goodwill amortization for all periods, as well as a non-recurring gain on the sale of Razorfish shares in2000, and the related tax impacts. As a result of these exclusions, this presentation is a non-GAAP financialmeasure. We believe that by excluding the items noted above, the table below presents selected financial datausing amounts that are more comparable year-to-year and thus more meaningful for purposes of this analysis. Inaddition, as a reminder, “Net Income, as reported, GAAP” includes the effect of our adoption of SFAS No. 123for all prior periods presented below.
(Dollars in Millions Except Per Share Amounts)______________________________________________________________2004 2003 2002 2001 2000________ ________ ________ ________ ________
Net Income, as adjusted:Net Income, as reported, GAAP .... $723.5 $631.0 $570.5 $455.7 $475.7Add-back goodwill amortization,
net of income taxes .................... — — — 83.1 76.5Less: gain on sale of Razorfish
shares, net of income taxes ........ — — — — (63.8)______ ______ ______ ______ ______Net Income, excluding goodwill
amortization and Razorfish gain $723.5 $631.0 $570.5 $538.8 $488.4______ ______ ______ ______ ____________ ______ ______ ______ ______Basic Net Income per share:
as reported, GAAP .................... $3.90 $3.37 $3.07 $2.49 $2.72as adjusted .................................. $3.90 $3.37 $3.07 $2.95 $2.79
Diluted Net Income per share:as reported, GAAP .................... $3.88 $3.37 $3.07 $2.48 $2.61as adjusted .................................. $3.88 $3.37 $3.07 $2.92 $2.68
6

The following is a reconciliation of the “as reported” to “as adjusted” Net Income per share on a basic anddiluted basis.
2004 2003 2002 2001 2000________ ________ ________ ________ ________
Basic Net Income per share, as adjusted:Net Income per common share:
Basic, as reported, GAAP .......... $3.90 $3.37 $3.07 $2.49 $2.72Add-back goodwill amortization
per common share,net of income taxes .................... — — — 0.46 0.44
Less: gain on sale of Razorfishshares, per common share,net of income taxes .................... — — — — (0.37)
Net Income per common share,excluding goodwill amortizationand Razorfish gain:
Basic ...................................... $3.90 $3.37 $3.07 $2.95 $2.79Diluted Net Income per share, as adjusted:
Net Income per common share:Diluted, as reported, GAAP ...... $3.88 $3.37 $3.07 $2.48 $2.61
Add-back goodwill amortizationper common share,net of income taxes .................... — — — 0.44 0.41
Less: gain on sale of Razorfishshares, per common share,net of income taxes .................... — — — — (0.34)_____ _____ _____ _____ _____
Net Income per common share,excluding goodwill amortizationand Razorfish gain:
Diluted .................................... $3.88 $3.37 $3.07 $2.92 $2.68_____ _____ _____ _____ __________ _____ _____ _____ _____
7
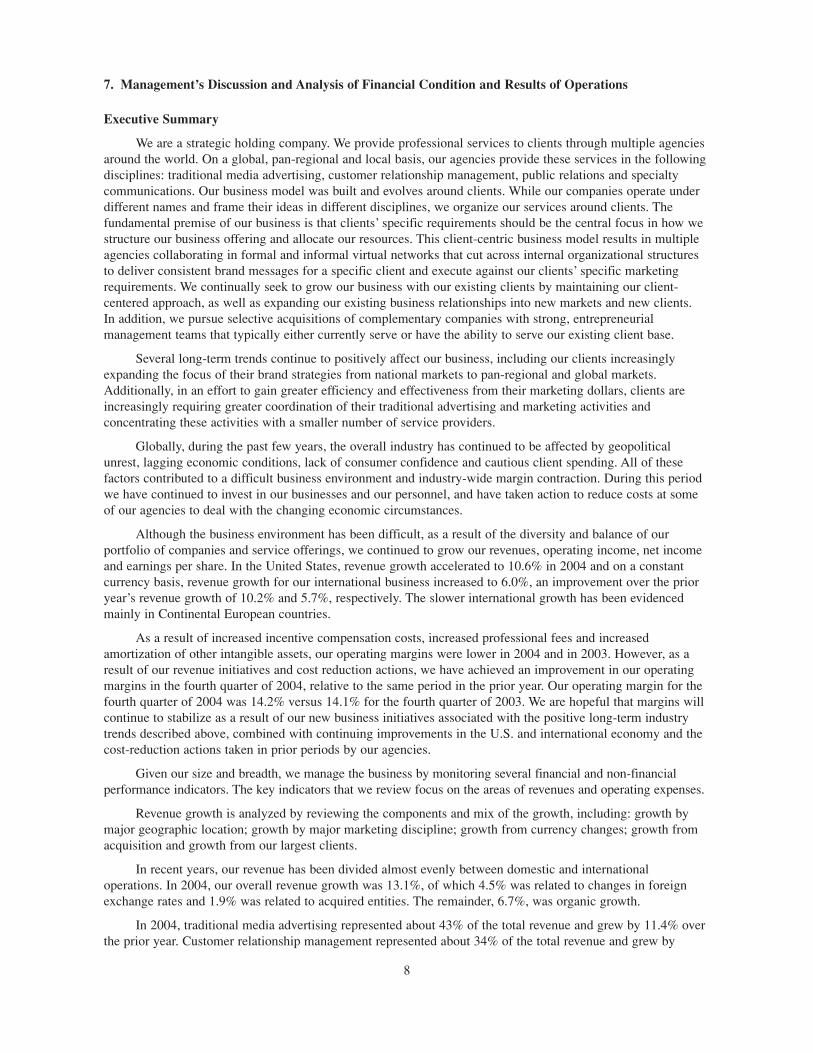
7. Management’s Discussion and Analysis of Financial Condition and Results of Operations
Executive Summary
We are a strategic holding company. We provide professional services to clients through multiple agenciesaround the world. On a global, pan-regional and local basis, our agencies provide these services in the followingdisciplines: traditional media advertising, customer relationship management, public relations and specialtycommunications. Our business model was built and evolves around clients. While our companies operate underdifferent names and frame their ideas in different disciplines, we organize our services around clients. Thefundamental premise of our business is that clients’ specific requirements should be the central focus in how westructure our business offering and allocate our resources. This client-centric business model results in multipleagencies collaborating in formal and informal virtual networks that cut across internal organizational structuresto deliver consistent brand messages for a specific client and execute against our clients’ specific marketingrequirements. We continually seek to grow our business with our existing clients by maintaining our client-centered approach, as well as expanding our existing business relationships into new markets and new clients.In addition, we pursue selective acquisitions of complementary companies with strong, entrepreneurialmanagement teams that typically either currently serve or have the ability to serve our existing client base.
Several long-term trends continue to positively affect our business, including our clients increasinglyexpanding the focus of their brand strategies from national markets to pan-regional and global markets.Additionally, in an effort to gain greater efficiency and effectiveness from their marketing dollars, clients areincreasingly requiring greater coordination of their traditional advertising and marketing activities andconcentrating these activities with a smaller number of service providers.
Globally, during the past few years, the overall industry has continued to be affected by geopoliticalunrest, lagging economic conditions, lack of consumer confidence and cautious client spending. All of thesefactors contributed to a difficult business environment and industry-wide margin contraction. During this periodwe have continued to invest in our businesses and our personnel, and have taken action to reduce costs at someof our agencies to deal with the changing economic circumstances.
Although the business environment has been difficult, as a result of the diversity and balance of ourportfolio of companies and service offerings, we continued to grow our revenues, operating income, net incomeand earnings per share. In the United States, revenue growth accelerated to 10.6% in 2004 and on a constantcurrency basis, revenue growth for our international business increased to 6.0%, an improvement over the prioryear’s revenue growth of 10.2% and 5.7%, respectively. The slower international growth has been evidencedmainly in Continental European countries.
As a result of increased incentive compensation costs, increased professional fees and increasedamortization of other intangible assets, our operating margins were lower in 2004 and in 2003. However, as aresult of our revenue initiatives and cost reduction actions, we have achieved an improvement in our operatingmargins in the fourth quarter of 2004, relative to the same period in the prior year. Our operating margin for thefourth quarter of 2004 was 14.2% versus 14.1% for the fourth quarter of 2003. We are hopeful that margins willcontinue to stabilize as a result of our new business initiatives associated with the positive long-term industrytrends described above, combined with continuing improvements in the U.S. and international economy and thecost-reduction actions taken in prior periods by our agencies.
Given our size and breadth, we manage the business by monitoring several financial and non-financialperformance indicators. The key indicators that we review focus on the areas of revenues and operating expenses.
Revenue growth is analyzed by reviewing the components and mix of the growth, including: growth bymajor geographic location; growth by major marketing discipline; growth from currency changes; growth fromacquisition and growth from our largest clients.
In recent years, our revenue has been divided almost evenly between domestic and internationaloperations. In 2004, our overall revenue growth was 13.1%, of which 4.5% was related to changes in foreignexchange rates and 1.9% was related to acquired entities. The remainder, 6.7%, was organic growth.
In 2004, traditional media advertising represented about 43% of the total revenue and grew by 11.4% overthe prior year. Customer relationship management represented about 34% of the total revenue and grew by
8

14.0% over the previous year. Public relations represented about 11% of the total revenue and grew by 12.0%over the previous year and specialty communications represented about 12% of total revenue and grew by 17.6%over the previous year.
We measure operating expenses in two distinct cost categories, salary and service costs, and office andgeneral expenses. Salary and service costs are primarily comprised of employee compensation related costs andoffice and general expenses are primarily comprised of rent and occupancy costs, technology related costs anddepreciation and amortization. Each of our agencies require service professionals with a skill set that is commonacross our disciplines. At the core is their ability to understand a client’s brand and its selling proposition, andtheir ability to develop a unique message to communicate the value of the brand to the client’s target audience.The office space requirements of our agencies are similar across geographies and disciplines, and theirtechnology requirements are generally limited to personal computers, servers and off-the-shelf software.
Because we are a service business, we monitor these costs on a percentage of revenue basis. Salary andservice costs tend to fluctuate in conjunction with changes in revenues, whereas office and general expenses,which are not directly related to servicing clients, tend to decrease as a percentage of revenue as revenuesincrease because a significant portion of these expenses are relatively fixed in nature. During 2004, salary andservice costs increased to 70.2% of revenue from 68.6% of revenue in 2003 due in part to our efforts to restoreincentive compensation, while office and general expenses declined to 17.3% of revenue from 18.8% in 2003 asa result of our continuing efforts to better align these costs with business levels on a location-by-location basis.
Our net income for 2004 increased by 14.7% to $723.5 million from $631.0 million in 2003 and ourdiluted EPS increased by 15.1% to $3.88 from $3.37.
In accordance with SFAS No. 123, “Accounting for Stock-Based Compensation” (“SFAS No. 123”), asamended by SFAS No. 148, “Accounting for Stock-Based Compensation — Transition and Disclosure, anamendment of FASB Statement No. 123”, we elected, effective January 1, 2004, to account for stock-basedemployee compensation using the fair value method. As a result, the fair value of stock-based employeecompensation, including unvested employee stock options issued and outstanding, was recorded as an expense inthe current period utilizing the retroactive restatement method as set forth in SFAS 148. Accordingly, our resultsfor all prior periods presented have been restated as if we had used the fair value method to account for stock-based employee compensation.
Financial Results from Operations — 2004 Compared with 2003(Dollars in millions, except per share amounts)
Twelve Months Ended December 31, 2004 2003_____ _____Revenue .................................................................................................... $9,747.2 $8,621.4Operating expenses:
Salary and service costs ...................................................................... 6,846.8 5,911.8Office and general expenses ................................................................ 1,685.0 1,617.7______________ ______________
8,531.8 7,529.5______________ ______________Operating profit ........................................................................................ 1,215.4 1,091.9
Net interest expense:Interest expense .................................................................................... 51.1 57.9Interest income .................................................................................... (14.5) (15.1)______________ ______________
36.6 42.8______________ ______________Income before income taxes .................................................................... 1,178.8 1,049.1Income taxes ............................................................................................ 396.3 353.0______________ ______________
Income after income taxes ........................................................................ 782.5 696.1
Equity in earnings of affiliates.................................................................. 17.1 15.1Minority interests ...................................................................................... (76.1) (80.2)______________ ______________
Net income .......................................................................................... $ 723.5 $ 631.0______________ ____________________________ ______________Net Income Per Common Share:
Basic .................................................................................................... $3.90 $3.37Diluted.................................................................................................. 3.88 3.37
Dividends Declared Per Common Share .................................................. $0.90 $0.809

The following year-over-year analysis gives further details and insight into the changes in our financialperformance.
Revenue: When comparing performance between years, we discuss non-GAAP financial measures such asthe impact that foreign currency rate changes, acquisitions/dispositions and organic growth have on reportedrevenues. As we derive significant revenue from international operations, changes in foreign currency ratesbetween the years impact reported results. Reported results are also impacted by our acquisition and dispositionactivity and organic growth. Accordingly, we provide this information to supplement the discussion of changesin revenue period-to-period.
Our 2004 consolidated worldwide revenue increased 13.1% to $9,747.2 million from $8,621.4 million in2003. Foreign exchange impacts increased worldwide revenue by $390.6 million. The effect of acquisitions, netof disposals, increased 2004 worldwide revenue by $163.9 million. Organic growth increased worldwide revenueby $571.3 million. The components of total 2004 revenue growth in the U.S. (“domestic”) and the remainder ofthe world (“international”) are summarized below ($ in millions):
Total Domestic International___________________ ___________________ _________________$ % $ % $ %________ _______ ________ _______ ________ _______
December 31, 2003................................ $8,621.4 — $4,720.9 — $3,900.5 —
Components of Revenue Changes:Foreign exchange impact....................... 390.6 4.5% — — 390.6 10.0%Acquisitions ........................................... 163.9 1.9% 131.9 2.8% 32.0 0.8%Organic................................................... 571.3 6.7% 370.6 7.8% 200.7 5.2%______________ _______ ______________ _______ ______________ _______December 31, 2004................................ $9,747.2 13.1% $5,223.4 10.6% $4,523.8 16.0%______________ _______ ______________ _______ ______________ _____________________ _______ ______________ _______ ______________ _______
The components and percentages are calculated as follows:
• The foreign exchange impact component shown in the table is calculated by first converting the currentperiod’s local currency revenue using the average exchange rates from the equivalent prior period toarrive at a constant currency revenue (in this case $9,356.6 million for the Total column in the table).The foreign exchange impact equals the difference between the current period revenue in U.S. dollarsand the current period revenue in constant currency (in this case $9,747.2 million less $9,356.6 millionfor the Total column in the table).
• The acquisition component shown in the table is calculated by aggregating the applicable prior periodrevenue of the acquired businesses. Netted against this number is the revenue of any business includedin the prior period reported revenue that was disposed of subsequent to the prior period.
• The organic component shown in the table is calculated by subtracting both the foreign exchange andacquisition revenue components from total revenue growth.
• The percentage change shown in the table of each component is calculated by dividing the individualcomponent amount by the prior period revenue base of that component (in this case $8,621.4 millionfor the Total column in the table).
The components of revenue and revenue growth for 2004 compared to 2003, in our primary geographicmarkets are summarized below ($ in millions):
$ Revenue % Growth_________ _________
United States .............................................................. $5,223.4 10.6%Euro Markets.............................................................. 2,058.2 15.0%United Kingdom ........................................................ 1,085.0 15.2%Other .......................................................................... 1,380.6 18.1%______________ _______Total ........................................................................... $9,747.2 13.1%______________ _____________________ _______
As indicated, foreign exchange impacts increased our international revenue by $390.6 million for 2004.The most significant impacts resulted from the continued strengthening of the Euro and the British Pound
10

against the U.S. dollar, as our operations in these markets represented approximately 70.0% of our internationalrevenue. Additional geographic information relating to our business is contained in note 5 to our consolidatedfinancial statements.
Due to a variety of factors, in the normal course, our agencies both gain and lose business from clientseach year. The net result in 2004, and historically each year for us as a whole, was an overall gain in newbusiness. Under our client-centric approach, we seek to broaden our relationships with our largest clients.Revenue from our single largest client represented 4.3% of worldwide revenue in 2004 and 4.7% in 2003 and noother client represented more than 2.8% in 2004 or 2003. Our ten largest and 250 largest clients represented18.3% and 55.9% of our 2004 worldwide revenue, respectively and 18.7% and 53.8% of our 2003 worldwiderevenue.
Driven by clients’ continuous demand for more effective and efficient branding activities, we strive toprovide an extensive range of advertising, marketing and corporate communications services through variousclient centric networks that are organized to meet specific client objectives. These services include advertising,brand consultancy, crisis communications, custom publishing, database management, digital and interactivemarketing, direct marketing, directory advertising, entertainment marketing, environmental design, experientialmarketing, field marketing, financial / corporate business-to-business advertising, graphic arts, healthcarecommunications, instore design, investor relations, marketing research, media planning and buying, multi-cultural marketing, non-profit marketing, organizational communications, package design, product placement,promotional marketing, public affairs, public relations, real estate advertising and marketing, recruitmentcommunications, reputation consulting, retail marketing and sports and event marketing. In an effort to monitorthe changing needs of our clients and to further expand the scope of our services to key clients, we monitorrevenue across a broad range of disciplines and group them into the following four categories: traditional mediaadvertising, customer relationship management, referred to as CRM, public relations and specialtycommunications as summarized below.
(Dollars in millions)____________________________________________________________________Twelve Months Ended December 31,
2004 2003 2004 vs 2003__________________ __________________ ___________________% of % of $ %
Revenue Revenue Revenue Revenue Growth Growth________ ________ ________ ________ _________ _________
Traditional media advertising .............. $4,207.5 43.2% $3,775.7 43.8% $ 431.8 11.4%CRM .................................................... 3,366.1 34.5% 2,953.4 34.2% 412.7 14.0%Public relations .................................... 1,040.5 10.7% 928.6 10.8% 111.9 12.0%Specialty communications .................. 1,133.1 11.6% 963.7 11.2% 169.4 17.6%______________ ______________ ______________
$9,747.2 $8,621.4 $1,125.8 13.1%______________ ______________ ____________________________ ______________ ______________
Certain reclassifications have been made to the 2003 amounts in the tables above to conform the numbersto the 2004 amounts presented.
Operating Expenses: Our 2004 worldwide operating expenses increased $1,002.3 million, or 13.3%, to$8,531.8 million from $7,529.5 million in 2003, as shown below.
(Dollars in millions)_________________________________________________________________________
2004 2003 2004 vs 2003__________________________ __________________________ _________________% of % of
% of Total Op. % of Total Op. $ %Revenue Revenue Costs Revenue Revenue Costs Growth Growth________ ________ _______ ________ ________ _______ _______ _______
Revenue .......................................... $9,747.2 $8,621.4 $1,125.8 13.1%Operating expenses:
Salary and service costs.............. 6,846.8 70.2% 80.3% 5,911.8 68.6% 78.5% 935.0 15.8%Office and general expenses ...... 1,685.0 17.3% 19.7% 1,617.7 18.8% 21.5% 67.3 4.2%______________ _______ _______ ______________ _______ _______ ______________ _______
Total Operating Costs ...................... 8,531.8 87.5% 7,529.5 87.3% 1,002.3 13.3%
Operating profit .............................. $1,215.4 12.5% $1,091.9 12.7% $ 123.5 11.3%______________ ______________ ____________________________ ______________ ______________
Salary and service costs represent the largest part of operating expenses. During 2004, we continued toinvest in our businesses and their personnel. As a percentage of operating expenses, salary and service costs
11

were 80.3% in 2004 and 78.5% in 2003. These costs are comprised of direct service costs and salary and relatedcosts. Most, or $935.0 million and 93.3%, of the $1,002.3 million increase in operating expenses in 2004resulted from increases in salary and service costs. This increase was attributable to increased revenue levels andthe required increases in direct salary and salary related costs necessary to deliver our services, includingincreases in incentive compensation costs, increases in freelance labor costs and increases in costs relating tonew business initiatives and recruiting. This was partially offset by a reduction in severance costs and theexpected positive impact in 2004 of previous cost actions. As a result, salary and service costs as a percentage ofrevenues increased year-to-year from 68.6% in 2003 to 70.2% in 2004.
Office and general expenses represented 19.7% and 21.5% of our operating expenses in 2004 and 2003,respectively. These costs are comprised of office and equipment rent, technology costs and depreciation,amortization of identifiable intangibles, professional fees and other overhead expenses. As a percentage ofrevenue, office and general expenses decreased in 2004 from 18.8% to 17.3% because these costs are relativelyfixed in nature and decrease as a percentage of revenue as revenue increases. In addition, this year-over-yeardecrease resulted from our continuing efforts to better align these costs with business levels on a location-by-location basis. This decrease was partially offset by increased costs incurred in connection with theimplementation of Sarbanes-Oxley Section 404 and $9.9 million of costs incurred in connection with thedisposal of two non-strategic businesses early in 2004.
We expect our efforts to control operating expenses will continue as we continuously look for ways toincrease the variability of our cost structure. We are hopeful that with the continuing improvements in the U.S.economy combined with the cost reduction actions taken by our agencies, margins will continue to stabilize.
Included in office and general expense was a net gain of $13.1 million related to investment activity duringthe first quarter of 2004. In March 2004, in connection with Seneca LLC’s recapitalization, we agreed toexchange our remaining preferred stock in Seneca for a $24.0 million senior secured note and 40% of Seneca’soutstanding common stock. The note, which is due in March 2007, bears interest at a rate of 6.25% per annum.The recapitalization transaction was required to be recorded at fair value and, accordingly, we recorded a pre-taxnet gain of $24.0 million. This gain was partially offset by losses of $10.9 million on other cost-basedinvestments unrelated to our investment in Seneca. Additional information appears in note 6 to our consolidatedfinancial statements.
Excluding the net gain of $13.1 million from investment activity, office and general expenses were 17.4%of revenue in 2004, compared to 18.8% of revenue in 2003, and operating margin decreased to 12.3% of revenuefrom 12.7% of revenue.
Net Interest Expense: Our net interest expense decreased in 2004 to $36.6 million, as compared to$42.8 million in 2003. Our gross interest expense decreased by $6.8 million to $51.1 million. This decrease isattributed to a reduction of $5.1 million in the amortization of interest related payments on our convertible notesfrom $28.1 million in 2003 to $23.0 million in 2004 and reductions resulting from cash management effortsduring the course of the year. This reduction was partially offset by an increase in interest expense relative tothe €152.4 million 5.20% Euro note due to the foreign currency change of the Euro relative to the U.S. dollarin 2004.
As a result of interest related payments made in the second half of 2004 related to our convertible notes,we expect interest expense to increase by $10.4 million in 2005 compared to 2004, as these payments areamortized ratably through their next put dates.
See “Liquidity and Capital Resources” for a discussion of our indebtedness and related matters.
Income Taxes: Our 2004 consolidated effective income tax rate of 33.6% was unchanged from 2003. TheFASB issued two staff proposals on accounting for income taxes to address recent changes enacted by theUnited States Congress. Proposed Staff Position FAS 109-a, Application of FASB Statement No. 109,Accounting for Income Taxes, for the Tax Deduction Provided to U.S. Based Manufacturers by the AmericanJobs Creation Act of 2004, and Proposed Staff Position FAS 109-b, Accounting and Disclosure Guidance for theForeign Earnings Repatriation Provisions within the American Jobs Creation Act of 2004. We believe thatProposed Staff Position FAS 109-a does not apply to our business. We are currently assessing the impact ofProposed Staff Position FAS 109-b, however, we do not believe it will have a material impact on ourconsolidated results of operations or financial position.
12

Financial Results from Operations — 2003 Compared with 2002(Dollars in millions, except per share amounts)_________________________________________________________________________________
Twelve Months Ended December 31, 2003 2002____ ____
Revenue .................................................................................................... $8,621.4 $7,536.3Operating expenses:
Salary and service costs ...................................................................... 5,911.8 5,071.9Office and general expenses ................................................................ 1,617.7 1,479.3______________ ______________
7,529.5 6,551.2______________ ______________Operating profit ........................................................................................ 1,091.9 985.1Net interest expense:
Interest expense .................................................................................... 57.9 45.5Interest income .................................................................................... (15.1) (15.0)______________ ______________
42.8 30.5______________ ______________Income before income taxes .................................................................... 1,049.1 954.6
Income taxes ............................................................................................ 353.0 329.6______________ ______________
Income after income taxes ........................................................................ 696.1 625.0
Equity in earnings of affiliates.................................................................. 15.1 13.8Minority interests ...................................................................................... (80.2) (68.3)______________ ______________
Net income .......................................................................................... $ 631.0 $ 570.5______________ ____________________________ ______________Net Income Per Common Share:
Basic .................................................................................................... $3.37 $3.07Diluted.................................................................................................. 3.37 3.07
Dividends Declared Per Common Share .................................................. $0.80 $0.80
The following year-over-year analysis gives further details and insight into the changes in our financialperformance.
Revenue: Our 2003 consolidated worldwide revenue increased 14.4% to $8,621.4 million from $7,536.3million in 2002. Foreign exchange impacts increased worldwide revenue by $465.6 million. The effect ofacquisitions, net of disposals, increased 2003 worldwide revenue by $271.7 million. Organic growth increasedworldwide revenue by $347.8 million. The components of total 2003 revenue growth in the U.S. (“domestic”)and the remainder of the world (“international”) are summarized below ($ in millions):
Total Domestic International___________________ ___________________ ___________________$ % $ % $ %________ _______ ________ _______ ________ ________
December 31, 2002................................ $7,536.3 — $4,284.6 — $3,251.7 —Components of Revenue Changes:Foreign exchange impact....................... 465.6 6.2% — — 465.6 14.3%Acquisitions ........................................... 271.7 3.6% 174.7 4.1% 97.0 3.0%Organic................................................... 347.8 4.6% 261.6 6.1% 86.2 2.7%______________ _______ ______________ _______ ______________ _______December 31, 2003................................ $8,621.4 14.4% $4,720.9 10.2% $3,900.5 20.0%______________ _______ ______________ _______ ______________ _____________________ _______ ______________ _______ ______________ _______
The components and percentages are calculated as follows:
• The foreign exchange impact component shown in the table is calculated by first converting the currentperiod’s local currency revenue using the average exchange rates from the equivalent prior period toarrive at a constant currency revenue (in this case $8,155.8 million for the Total column in the table).The foreign exchange impact equals the difference between the current period revenue in U.S. dollarsand the current period revenue in constant currency (in this case $8,621.4 million less $8,155.8 millionfor the Total column in the table).
• The acquisition component shown in the table is calculated by aggregating the applicable prior periodrevenue of the acquired businesses. Netted against this number is the revenue of any business includedin the prior period reported revenue that was disposed of subsequent to the prior period.
13
• The organic component shown in the table is calculated by subtracting both the foreign exchange andacquisition revenue components from total revenue growth.
• The percentage change shown in the table of each component is calculated by dividing the individualcomponent amount by the prior period revenue base of that component (in this case $7,536.3 millionfor the Total column in the table).
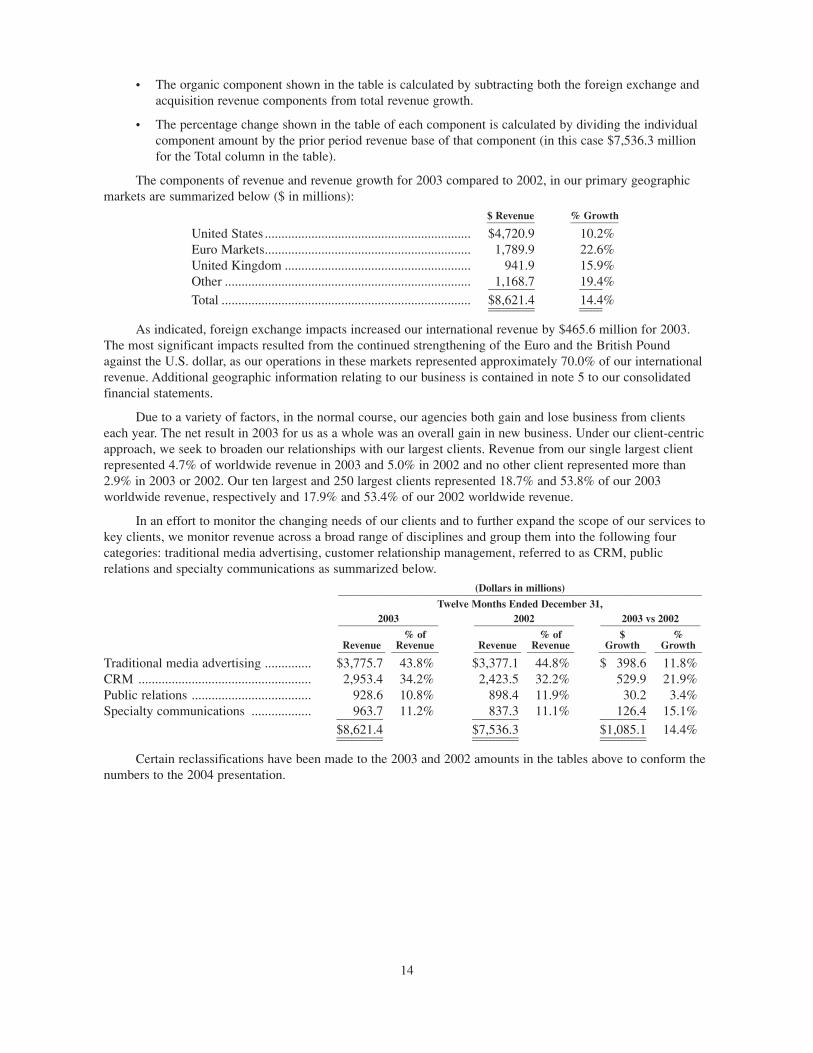
The components of revenue and revenue growth for 2003 compared to 2002, in our primary geographicmarkets are summarized below ($ in millions):
$ Revenue % Growth_________ _________
United States .............................................................. $4,720.9 10.2%Euro Markets.............................................................. 1,789.9 22.6%United Kingdom ........................................................ 941.9 15.9%Other .......................................................................... 1,168.7 19.4%______________ _______Total ........................................................................... $8,621.4 14.4%______________ _____________________ _______
As indicated, foreign exchange impacts increased our international revenue by $465.6 million for 2003.The most significant impacts resulted from the continued strengthening of the Euro and the British Poundagainst the U.S. dollar, as our operations in these markets represented approximately 70.0% of our internationalrevenue. Additional geographic information relating to our business is contained in note 5 to our consolidatedfinancial statements.
Due to a variety of factors, in the normal course, our agencies both gain and lose business from clientseach year. The net result in 2003 for us as a whole was an overall gain in new business. Under our client-centricapproach, we seek to broaden our relationships with our largest clients. Revenue from our single largest clientrepresented 4.7% of worldwide revenue in 2003 and 5.0% in 2002 and no other client represented more than2.9% in 2003 or 2002. Our ten largest and 250 largest clients represented 18.7% and 53.8% of our 2003worldwide revenue, respectively and 17.9% and 53.4% of our 2002 worldwide revenue.
In an effort to monitor the changing needs of our clients and to further expand the scope of our services tokey clients, we monitor revenue across a broad range of disciplines and group them into the following fourcategories: traditional media advertising, customer relationship management, referred to as CRM, publicrelations and specialty communications as summarized below.
(Dollars in millions)_____________________________________________________________________Twelve Months Ended December 31,
2003 2002 2003 vs 2002___________________ ___________________ ___________________% of % of $ %
Revenue Revenue Revenue Revenue Growth Growth_________ _________ _________ _________ _________ _________
Traditional media advertising .............. $3,775.7 43.8% $3,377.1 44.8% $ 398.6 11.8%CRM .................................................... 2,953.4 34.2% 2,423.5 32.2% 529.9 21.9%Public relations .................................... 928.6 10.8% 898.4 11.9% 30.2 3.4%Specialty communications .................. 963.7 11.2% 837.3 11.1% 126.4 15.1%______________ ______________ ______________
$8,621.4 $7,536.3 $1,085.1 14.4%______________ ______________ ____________________________ ______________ ______________
Certain reclassifications have been made to the 2003 and 2002 amounts in the tables above to conform thenumbers to the 2004 presentation.
14

Operating Expenses: Our 2003 worldwide operating expenses increased $978.3 million, or 14.9%, to$7,529.5 million from $6,551.2 million in 2002, as shown below.
(Dollars in millions)_________________________________________________________________________
2003 2002 2003 vs 2002__________________________ __________________________ _________________% of % of
% of Total Op. % of Total Op. $ %Revenue Revenue Costs Revenue Revenue Costs Growth Growth________ ________ _______ ________ ________ _______ _______ _______
Revenue .......................................... $8,621.4 $7,536.3 $1,085.1 14.4%Operating expenses:
Salary and service costs.............. 5,911.8 68.6% 78.5% 5,071.9 67.3% 77.4% 839.9 16.6%Office and general expenses ...... 1,617.7 18.7% 21.5% 1,479.3 19.6% 22.6% 138.4 9.4%______________ _______ _______ ______________ _______ _______ ______________ _______
Total Operating Costs ...................... 7,529.5 87.3% 6,551.2 86.9% 978.3 14.9%
Operating profit .............................. $1,091.9 12.7% $ 985.1 13.1% $ 106.8 10.8%______________ ______________ ____________________________ ______________ ______________
Salary and service costs represent the largest part of operating expenses. During 2003, we continued toinvest in our businesses and their personnel, and took actions to reduce costs at some of our agencies to dealwith the changing economic circumstances. As a percentage of operating expenses, salary and service costs were78.5% in 2003 and 77.4% in 2002. These costs are comprised of direct service costs and salary and related costs.Most, or $839.9 million and 85.9%, of the $978.3 million increase in operating expenses in 2003 resulted fromincreases in salary and service costs. The $839.9 million increase in salary and service costs was attributable toincreased revenue levels, including changes in the mix of our revenues which resulted in greater utilization offreelance labor. In addition, although we incurred increased severance costs and did not reach optimal utilizationlevels for our staff, we continued to make investments in new key personnel. Furthermore, we increasedincentive compensation where performance dictated. As a result, salary and service costs as a percentage ofrevenues increased year-to-year from 67.3% in 2002 to 68.6% in 2003.
Office and general expenses represented 21.5% and 22.6% of our operating expenses in 2003 and 2002,respectively. These costs are comprised of office and equipment rent, technology costs and depreciation,amortization of identifiable intangibles, professional fees and other overhead expenses. As a percentage ofrevenue, office and general expenses decreased in 2003 from 19.6% to 18.8%. This year-over-year decrease,which was offset by increases in professional fees and amortization of other intangible assets, resulted from ourcontinuing efforts to better align these costs with business levels on a location-by-location basis, as well as fromincreased revenue levels.
For the foregoing reasons, our operating margin decreased from 13.1% in 2002 to 12.7% in 2003.
Net Interest Expense: Our net interest expense increased in 2003 to $42.8 million, as compared to $30.5million in 2002. Our gross interest expense increased by $12.4 million to $57.9 million. This increase resultedfrom $25.4 million of additional interest costs associated with the amortization of our payments to qualifiedholders of our convertible notes as incentives to the noteholders not to exercise their put rights. In February2003, we paid $25.4 million to holders of our Liquid Yield Option Notes due 2031 and, in August 2003, we paid$6.7 million to holders of our Zero Coupon Zero Yield Convertible Notes due 2032. These payments are beingamortized ratably over 12-month periods. No such payments were made in 2002. In addition, interest expenserelative to the €152.4 million 5.20% Euro note increased by $2.2 million due to the change in the value of theEuro relative to the U.S. dollar in 2003. These increases were partially offset by lower short-term interest ratesand cash management efforts during the course of the year.
Income Taxes: Our consolidated effective income tax rate was 33.6% in 2003 as compared to 34.5% in2002. This reduction reflects the realization of our ongoing focus on tax planning initiatives including increasingthe efficiencies of our international tax structures.
15

7A. Critical Accounting Policies and New Accounting Pronouncements
Critical Accounting Policies: We have prepared the following supplemental summary of accountingpolicies to assist in better understanding our financial statements and the related management discussion andanalysis. Readers are encouraged to consider this supplement together with our consolidated financial statementsand the related notes to our consolidated financial statements, including our discussion in note 1 setting forth ouraccounting policies in greater detail, for a more complete understanding of accounting policies discussed below.
Estimates: The preparation of our financial statements in conformity with generally accepted accountingprinciples in the United States of America, or “GAAP”, requires management to make estimates andassumptions. These estimates and assumptions affect the reported amounts of assets and liabilities includingvaluation allowances for receivables and deferred tax assets, accruals for bonus compensation and the disclosureof contingent liabilities at the date of the financial statements, as well as the reported amounts of revenue andexpenses during a reporting period. We evaluate these estimates on an ongoing basis and we base our estimateson historical experience, current conditions and various other assumptions we believe are reasonable under thecircumstances. Actual results can differ from those estimates, and it is possible that the differences could bematerial.
A fair value approach is used in testing goodwill for impairment under SFAS 142 and when evaluatingcost based investments, which consist of ownership interests in non-public companies, to determine if an otherthan temporary impairment has occurred. The primary approach utilized to determine fair values is a discountedcash flow methodology. When available and as appropriate, we also use comparative market multiples tosupplement the discounted cash flow analysis. Numerous estimates and assumptions necessarily have to be madewhen completing a discounted cash flow valuation, including estimates and assumptions regarding interest rates,appropriate discount rates and capital structure. Additionally, estimates must be made regarding revenue growth,operating margins, tax rates, working capital requirements and capital expenditures. Estimates and assumptionsalso need to be made when determining the appropriate comparative market multiples to be used. Actual resultsof operations, cash flows and other factors used in a discounted cash flow valuation will likely differ from theestimates used and it is possible that differences and changes could be material. Additional information aboutimpairment testing under SFAS 142 and valuation of cost based investments appears in notes 2 and 13, and notes1 and 6, respectively, to our consolidated financial statements.
Acquisitions and Goodwill: We have historically made and expect to continue to make selectiveacquisitions. In making acquisitions, the price we pay is determined by various factors, including specializedknow-how, reputation, competitive position, geographic coverage and service offerings, as well as ourexperience and judgment. The amount we paid for acquisitions, including cash, stock and assumption of netliabilities totaled $378.1 million in 2004 and $472.3 million in 2003.
Our acquisition strategy has been focused on acquiring the expertise of an assembled workforce in order tocontinue to build upon the core capabilities of our various strategic business platforms and agency brandsthrough the expansion of their geographic reach and/or their service capabilities to better serve our clients.Accordingly, like most service businesses, a substantial portion of the intangible asset value that we acquire isthe know-how of the people, which is treated as part of goodwill and, in accordance with SFAS 141, is notvalued separately. For each of our acquisitions we undertake a detailed review to identify other intangible assetsand a valuation is performed for all such assets identified. The majority of the value of the identifiable intangibleassets that we acquire is derived from customer relationships. In executing our acquisition strategy, one of theprimary drivers in identifying and executing a specific transaction is the existence of, or the ability to, expandour existing client relationships. Additional key factors we consider include the competitive position andspecialized know-how of the acquisition targets. When executing our acquisition strategy, a significant portion ofan acquired company’s revenues is often derived from existing clients. The expected benefits of our acquisitionsare typically shared across multiple agencies as they work together to integrate the acquired agency into ourclient service strategy.
A summary of our contingent purchase price obligations, sometimes referred to as earn-outs, andobligations to purchase additional interests in certain subsidiary and affiliate companies is set forth in the“Liquidity and Capital Resources” section of this report. The amount of contingent purchase price obligations
16

and obligations to purchase additional interests in certain subsidiary and affiliate companies are based on futureperformance. Contingent purchase price obligations are accrued, in accordance with GAAP, when thecontingency is resolved and payment is certain.
Additional information about acquisitions and goodwill appears in notes 1 and 2 to our consolidatedfinancial statements of this report.
Revenue: Substantially all revenue is derived from fees for services. Additionally, we earn commissionsbased upon the placement of advertisements in various media. Revenue is realized when the service isperformed, in accordance with terms of the arrangement with our clients and upon completion of the earningsprocess. This includes when services are rendered, generally upon presentation date for media, when costs areincurred for radio and television production and when print production is completed and collection is reasonablyassured.
In the majority of our businesses, we record revenue at the net amount retained when the fee orcommission is earned. In the delivery of certain services to our clients, we incur costs on their behalf for whichwe are reimbursed. Substantially all of our reimbursed costs relate to purchases on behalf of our clients of mediaand production services. We normally have no latitude in establishing the reimbursement price for theseexpenses and invoice our clients for these expenses in an amount equal to the amount of costs incurred. Thesereimbursed costs, which are a multiple of our revenue, are significant. However, the majority of these costs areincurred on behalf of our largest clients and we have not historically experienced significant losses in connectionwith the reimbursement of these costs.
A small portion of our contractual arrangements with clients includes performance incentive provisionsdesigned to link a portion of our revenue to our performance relative to both quantitative and qualitative goals.We recognize this portion of revenue when the specific quantitative goals are achieved, or when our performanceagainst qualitative goals is determined by our clients. Additional information about revenue appears in note 1 toour consolidated financial statements.
Employee Stock-based Compensation: In accordance with SFAS No. 123, “Accounting for Stock BasedCompensation”, as amended by SFAS No. 148, “Accounting for Stock-Based Compensation — Transition andDisclosure, an amendment of FASB Statement No. 123”, we elected, effective January 1, 2004, to account forstock-based employee compensation using the fair value method. As a result, the fair value of stock-basedemployee compensation, including unvested employee stock options issued and outstanding, were recorded as anexpense in the current period utilizing the retroactive restatement method as set forth in SFAS 148. Accordingly,our results for the prior periods have been restated as if we had used the fair value method to account for stock-based employee compensation. Pre-tax stock-based employee compensation costs for the years ended December31, 2004, 2003 and 2002, were $117.2 million, $131.1 million and $173.5 million, respectively. Also inconnection with the restatement, our December 31, 2003 balance sheet presented reflects an increase in thedeferred tax benefit of $120.5 million, an increase in additional paid-in capital of $434.7 million, an increase inunamortized stock compensation of $92.6 million and a decrease in retained earnings of $221.6 million.Additional disclosures are included in note 7 to our financial statements.
In December 2004, the FASB issued SFAS No. 123 (Revised 2004) — Share-Based Payment (“SFAS123R”) which is effective for reporting periods beginning after June 15, 2005 and generally applies to grantsmade after adoption. SFAS 123R is a revision of FASB No. 123, Accounting for Stock-Based Compensation. Asa result of our adoption of SFAS 123 on January 1, 2004, we believe that the adoption of SFAS 123R will nothave a material impact on our consolidated results of operations or financial position. However, we are in theprocess of assessing the full impact of this revision.
New Accounting Pronouncements:
In addition to those discussed previously, the following pronouncements were either issued by the FASBor adopted by us in 2004 and impact our financial statements as discussed below.
SFAS No. 153, “Exchanges of Nonmonetary Assets, an amendment of APB Opinion No. 29(“SFAS 153”). SFAS 153 amends APB Opinion No. 29, Accounting for Nonmonetary Transactions, to eliminatethe exception from having to apply the fair value accounting provisions of APB 29 for non-monetary exchangesof similar productive assets and replaces it with a general exception for exchanges of non-monetary assets that
17

do not have commercial substance. SFAS 153 is effective for the first reporting period beginning after June 15,2005. We believe that the adoption of SFAS 153 will not have a material impact on our consolidated results ofoperations or financial position. However, we are in the process of assessing the full impact of this amendment.
FASB Interpretation No. 46 — Consolidation of Variable Interest Entities (“FIN 46”). FIN 46 addressesthe consolidation by business enterprises of variable interest entities, as defined in FIN 46, and is based on theconcept that companies that control another entity through interests, other than voting interests, shouldconsolidate the controlled entity. The consolidation requirements apply immediately to FIN 46 interests held invariable interest entities created after January 31, 2003, and to interests held in variable interest entities thatexisted prior to February 1, 2003 and remain in existence as of July 1, 2003. The FASB subsequently issued FIN46R in December 2003 which modified certain provisions of FIN 46. FIN 46R applied to the first reportingperiod after March 15, 2004. The application of FIN 46 as originally issued and as revised by the issuance ofFIN 46R did not have an impact on, or result in, additional disclosure in our consolidated results of operations orfinancial position.
The Emerging Issues Task Force (“EITF”) of the FASB reached a consensus and released interpretiveguidance in 2004 covering several topics that impact our financial statements.
EITF No. 03-6, “Participating Securities and the Two-Class Method under FASB Statement No. 128,Earnings Per Share” is required to be adopted in financial periods beginning after March 31, 2004. The adoptionof EITF No. 03-6 did not have an impact on our consolidated results of operation or financial position.
EITF No. 04-8, “The Effect of Contingently Convertible Instruments on Diluted Earnings per Share” wasrequired to be adopted on December 31, 2004. The adoption did not impact our historical results and ourDecember 31, 2004 quarter-to-date and full-year diluted earnings per share as we amended our ConvertibleNotes due 2031, 2032 and 2033 prior to December 31, 2004. The amendments require us, upon conversion, tosettle the principal of our Convertible Notes in cash and any accretion in shares of our common stock. Foradditional information, see note 4 to our consolidated financial statements. The amendments made the notescompliant with EITF 90-19 “Instrument C” treatment. Compliance with “Instrument C” treatment does not resultin additional dilution to our Diluted EPS because our weighted average share price was less than the conversionprice of the notes for the periods set forth above. In accordance with the transition provisions of EITF 04-8, it isassumed that “Instrument C” treatment occurred at the beginning of the first period presented.
Liquidity and Capital Resources
Cash Requirements, including contractual obligations
Our principal non-discretionary funding requirement is our working capital requirement. In addition, asdiscussed below, we have contractual obligations related to our debt and convertible notes, our recurringbusiness operations primarily related to lease obligations, as well as certain contingent acquisition obligationsrelated to acquisitions made in prior years. Historically, substantially all of our non-discretionary cashrequirements have been funded from operating cash flow.
Our principal discretionary cash requirements include dividend payments to our shareholders, repurchasesof our stock, payments for strategic acquisitions and capital expenditures. In 2004 and 2003, our discretionaryspending was funded from operating cash flow. However, in any given year, depending on the level ofdiscretionary activity, we may use other sources of available funding to finance these activities.
We have a seasonal working capital cycle. Working capital requirements are lowest at year-end and highestduring the second and third quarters. The fluctuation in working capital requirements between the lowest andhighest periods was approximately $1.0 billion in 2004 and 2003. This occurs because in the majority of ourbusinesses we act as agent on behalf of our clients, including when we place media and incur production costson their behalf. We generally require collection from our clients prior to our payment for the media andproduction cost obligations and these obligations are greatest at the end of the year. This pattern was similarduring the past three years. During the year we manage liquidity through our credit facilities as discussed belowunder “Cash Management.”
Contractual Obligations and Other Commercial Commitments: We enter into numerous contractual andcommercial undertakings in the normal course of our business. The following table summarizes information
18

about certain of our obligations as of December 31, 2004 and should be read together with note 3 (bank loansand lines of credit), note 4 (long-term debt and convertible notes), note 10 (commitments and contingentliabilities), note 11 (fair value of financial instruments) and note 12 (financial instruments and market risk) toour consolidated financial statements.
Due in Due in DueLess than 1 to 5 after 5 Total
1 Year Years Years Due_________ _________ _________ _________
Contractual Obligations at December 31, 2004 (in millions)_______________________________________________________________________________________________________________________________
Long-term debt.......................................... $209.2 $ 18.9 $ 0.2 $ 228.3Convertible notes ...................................... — — 2,339.3 2,339.3Lease obligations....................................... 401.2 1,054.6 884.2 2,340.0Other.......................................................... 2.2 6.6 — 8.8____________ _____________ ______________ ______________Total........................................................... $612.6 $1,080.1 $3,223.7 $4,916.4____________ _____________ ______________ __________________________ _____________ ______________ ______________
As more fully described in the discussion below under the heading “Debt Instruments, Guarantees andRelated Covenants”, the holders of the convertible notes included in the table above have the right to cause us torepurchase up to the entire aggregate face amount of the notes then outstanding for par value at certain dates inthe future. If these rights were exercised at the earliest possible future date, as set forth in note 4 to ourconsolidated financial statements, $892.3 million of the convertible notes could be due in less than one year, and$1,447.0 million could be due in the “1 to 5 Years” category above.
Due in Due in DueLess than 1 1 to 5 after 5 Total
1 Year Years Years Due_________ _________ _________ _________
Other Commercial Commitments at December 31, 2004 (in millions)_______________________________________________________________________________________________________________________________
Lines of credit ........................................... $ — $ — $ — $ —Guarantees and letters of credit ................ 0.1 0.1 0.0 0.2_______ _______ _______ _______Total........................................................... $0.1 $0.1 $0.0 $0.2_______ _______ _______ ______________ _______ _______ _______
In the normal course of business, our agencies enter into various contractual media commitments on behalfof our clients at levels substantially exceeding our revenue. These commitments are included in our accountspayable balance when the media services are delivered by the providers. Historically, we have not experiencedsignificant losses for media commitments entered into on behalf of our clients and we believe that we do nothave any substantial exposure to potential losses of this nature in the future as we receive payment in advanceand we monitor the credit worthiness of our clients. In the event that we are committed to the media services andour client has not paid us, we believe that the risk of material loss is minimal because we believe that we havereasonable options available to substantially mitigate potential losses.
Contingent Acquisition Obligations
Certain of our acquisitions are structured with contingent purchase price obligations, often referred to asearn-outs. We utilize contingent purchase price structures in an effort to minimize the risk to us associated withpotential future negative changes in the performance of the acquired entity during the post-acquisition transitionperiod. These payments are not contingent upon future employment. The amount of future contingent purchaseprice payments that we would be required to pay for prior acquisitions, assuming that the businesses performover the relevant future periods at their current profit levels, is approximately $458 million as of December 31,2004. The ultimate amounts payable cannot be predicted with reasonable certainty because it is dependent uponfuture results of operations of subject businesses and is subject to changes in foreign currency exchange rates. Inaccordance with GAAP, we have not recorded a liability for these items on our balance sheet since the definitiveamount is not determinable or distributable. Actual results can differ from these estimates and the actual amountsthat we pay are likely to be different from these estimates. Our obligations change from period to periodprimarily as a result of payments made during the current period, changes in the acquired entities’ performance
19
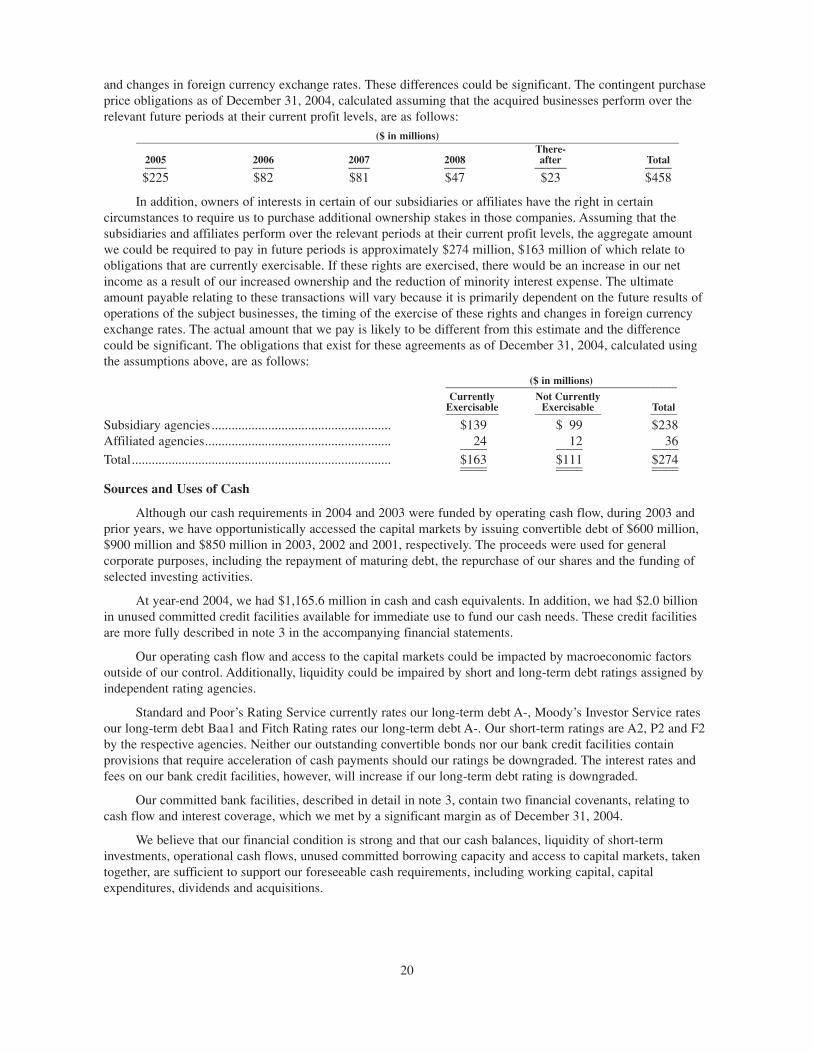
and changes in foreign currency exchange rates. These differences could be significant. The contingent purchaseprice obligations as of December 31, 2004, calculated assuming that the acquired businesses perform over therelevant future periods at their current profit levels, are as follows:
($ in millions)______________________________________________________________________________________________________There-
2005 2006 2007 2008 after Total____ ____ ____ ____ ______ _____
$225 $82 $81 $47 $23 $458
In addition, owners of interests in certain of our subsidiaries or affiliates have the right in certaincircumstances to require us to purchase additional ownership stakes in those companies. Assuming that thesubsidiaries and affiliates perform over the relevant periods at their current profit levels, the aggregate amountwe could be required to pay in future periods is approximately $274 million, $163 million of which relate toobligations that are currently exercisable. If these rights are exercised, there would be an increase in our netincome as a result of our increased ownership and the reduction of minority interest expense. The ultimateamount payable relating to these transactions will vary because it is primarily dependent on the future results ofoperations of the subject businesses, the timing of the exercise of these rights and changes in foreign currencyexchange rates. The actual amount that we pay is likely to be different from this estimate and the differencecould be significant. The obligations that exist for these agreements as of December 31, 2004, calculated usingthe assumptions above, are as follows:
($ in millions)_______________________________________________________________________________________Currently Not Currently
Exercisable Exercisable Total____________________ _________________________ __________
Subsidiary agencies ...................................................... $139 $ 99 $238Affiliated agencies........................................................ 24 12 36________ ________ ________Total.............................................................................. $163 $111 $274________ ________ ________________ ________ ________
Sources and Uses of Cash
Although our cash requirements in 2004 and 2003 were funded by operating cash flow, during 2003 andprior years, we have opportunistically accessed the capital markets by issuing convertible debt of $600 million,$900 million and $850 million in 2003, 2002 and 2001, respectively. The proceeds were used for generalcorporate purposes, including the repayment of maturing debt, the repurchase of our shares and the funding ofselected investing activities.
At year-end 2004, we had $1,165.6 million in cash and cash equivalents. In addition, we had $2.0 billionin unused committed credit facilities available for immediate use to fund our cash needs. These credit facilitiesare more fully described in note 3 in the accompanying financial statements.
Our operating cash flow and access to the capital markets could be impacted by macroeconomic factorsoutside of our control. Additionally, liquidity could be impaired by short and long-term debt ratings assigned byindependent rating agencies.
Standard and Poor’s Rating Service currently rates our long-term debt A-, Moody’s Investor Service ratesour long-term debt Baa1 and Fitch Rating rates our long-term debt A-. Our short-term ratings are A2, P2 and F2by the respective agencies. Neither our outstanding convertible bonds nor our bank credit facilities containprovisions that require acceleration of cash payments should our ratings be downgraded. The interest rates andfees on our bank credit facilities, however, will increase if our long-term debt rating is downgraded.
Our committed bank facilities, described in detail in note 3, contain two financial covenants, relating tocash flow and interest coverage, which we met by a significant margin as of December 31, 2004.
We believe that our financial condition is strong and that our cash balances, liquidity of short-terminvestments, operational cash flows, unused committed borrowing capacity and access to capital markets, takentogether, are sufficient to support our foreseeable cash requirements, including working capital, capitalexpenditures, dividends and acquisitions.
20

Cash Management
We manage our cash and liquidity centrally through treasury centers in North America and Europe. Eachday, operations with excess funds invest these funds with their regional treasury center. Likewise, operations thatrequire funding will borrow funds from their regional treasury center. The treasury centers then aggregate the netposition of our operating companies. The net position is either invested with or borrowed from third partyproviders. To the extent that our treasury centers require liquidity, they have the ability to access local currencylines of credit, our $2.0 billion committed bank facilities, or issue U.S. dollar-denominated commercial paper.This enables us to reduce our consolidated debt levels and minimize interest expense as well as centrally manageour exposure to foreign exchange.
Our cash balance at December 31, 2004 decreased by $77.9 million from the prior year, while our short-term investments at market increased $268.6 million from the prior year. Short-term investments includeinvestments of our excess cash which we expect to convert into cash in our current operating cycle, generallywithin one year.
We manage our net debt position, which we define as total debt outstanding less cash and short-terminvestments, centrally through our treasury centers as discussed above. Our net debt outstanding at December31, 2004 decreased $198.0 million as compared to the prior year-end.
Debt Instruments, Guarantees and Related Covenants
We maintain two revolving credit facilities with a consortium of banks totaling $2,000.0 million asdescribed in note 3 to our consolidated financial statements. These credit facilities are available to provide creditsupport for issuances under our $1,500.0 million commercial paper program, as well as to provide back-upliquidity in case any of our convertible bond issues are put back to us. We fund our daily borrowing needs byissuing commercial paper or drawing down on our revolving credit facilities. During 2004, we issued andredeemed $27.2 billion and the average term was 2.3 days. As of December 31, 2004, we had no commercialpaper or bank loans outstanding under these credit facilities. We had short-term bank loans of $17.5 million atDecember 31, 2004, primarily comprised of bank overdrafts by our international subsidiaries, which are treatedas unsecured loans pursuant to the subsidiaries’ bank agreements.
Our credit facilities contain financial covenants that restrict our ability to incur indebtedness as defined inthe agreements. These financial covenants limit the ratio of total consolidated indebtedness to total consolidatedEBITDA (EBITDA for these purposes being defined as earnings before interest, taxes, depreciation andamortization) to no more than 3.0 times. In addition, they require us to maintain a minimum ratio of EBITDA tointerest expense of at least 5.0 times. At December 31, 2004, we were in compliance with these covenants, asour ratio of debt to EBITDA was 1.9 times and our ratio of EBITDA to interest expense was 27.1 times.
At December 31, 2004, we had a total of $2,339.3 million aggregate principal amount of convertible notesoutstanding, including $847.0 million Liquid Yield Option Notes due 2031, which were issued in February 2001,$892.3 million Zero Coupon Zero Yield Convertible Notes due 2032, which were issued in March 2002 and$600.0 million Zero Coupon Zero Yield Convertible Notes dues 2033, which were issued in June 2003.
The holders of our Liquid Yield Option Notes due 2031 have the right to cause us to repurchase up to theentire aggregate face amount of the notes then outstanding for par value in February of each year beginning in2006. The holders of our Zero Coupon Zero Yield Convertible Notes due 2032 have the right to cause us torepurchase up to the entire aggregate face amount of the notes then outstanding for par value in August of eachyear. The holders of our Zero Coupon Zero Yield Convertible Notes due 2033 have the right to cause us torepurchase up to the entire aggregate face amount of the notes then outstanding for par value on June 15, 2006,2008, 2010, 2013, 2018, 2023 and on each June 15 annually thereafter through June 15, 2032. The Liquid YieldOption Notes due 2031, the Zero Coupon Zero Yield Convertible Notes due 2032 and the Zero Coupon ZeroYield Convertible Notes due 2033 are convertible, at specified ratios, only upon the occurrence of certain events,including if our common shares trade above certain levels, if we effect extraordinary transactions or, in the caseof the Liquid Yield Option Notes due 2031 and the Zero Coupon Zero Yield Convertible Notes due 2032, if ourlong-term debt ratings are downgraded to BBB or lower by Standard & Poor’s Ratings Services, or Baa3 orlower by Moody’s Investors Services, Inc. or in the case of the Zero Coupon Zero Yield Convertible Notes due2033, to BBB- or lower by S&P, and Ba1 or lower by Moody’s. These events would not, however, result in an
21

adjustment of the number of shares issuable upon conversion and would not accelerate the holder’s right to causeus to repurchase the notes. For additional information about the terms of these notes, see note 4 to ourconsolidated financial statements.
On February 21, 2003, we paid $25.4 million to qualified noteholders of our Liquid Yield Option Notesdue 2031, equal to $30 per $1,000 principal amount of notes, as an incentive to the holders not to exercise theirput right. This payment was amortized over the 12-month period ended February 2004. On February 7, 2003, werepurchased for cash, notes from holders who exercised their put right for $2.9 million, reducing the aggregateamount outstanding of the notes due 2031 to $847.0 million.
On August 6, 2003, we paid $6.7 million to qualified noteholders of our Zero Coupon Zero YieldConvertible Notes due 2032, equal to $7.50 per $1,000 principal amount of notes, as an incentive to the holdersnot to exercise their put right. This payment was amortized over the 12-month period ended August 2004. OnAugust 1, 2003, we repurchased for cash, notes from holders who exercised their put right for $7.7 million,reducing the aggregate amount outstanding of the notes due 2032 to $892.3 million.
On August 12, 2004, we paid $25.4 million to qualified noteholders of our Zero Coupon Zero YieldConvertible Notes due 2032, equal to $27.50 per $1,000 principal amount of notes, as an incentive to the holdersnot to exercise their put right and to consent to an amendment to the indenture. This payment is being amortizedover the 12-month period ended August 2005. Under the amendment, we will pay cash to noteholders for theinitial principal amount of the notes surrendered for conversion. The remainder of the conversion value would bepaid in cash or shares at our option. We have also amended the method by which we will pay contingent interest.
On November 16, 2004, we paid $1.2 million to qualified noteholders of our Zero Coupon Zero YieldConvertible Notes due 2033 as an incentive to the holders to consent to an amendment to the indenture. At laterdates in November and December 2004, we paid an additional $0.3 million to the remaining qualifiednoteholders. These payments are being amortized ratably through the next put date of June 2006. Under theamendment, we will pay cash to noteholders for the initial principal amount of the notes surrendered forconversion. The remainder of the conversion value would be paid in cash or shares at our option.
On November 30, 2004, we paid $14.8 million to qualified noteholders of our Liquid Yield Option Notesdue 2031 as an incentive to the holders not to exercise their February 2005 put right and to consent to anamendment to the indenture. This payment is being amortized ratably through the next put date of February2006. Under the amendment, we will pay cash to noteholders for the initial principal amount of the notessurrendered for conversion. The remainder of the conversion value would be paid in cash or shares at our option.We also amended the method by which we will pay contingent interest.
At December 31, 2004, we had Euro-denominated bonds outstanding of €152.4 million or $206.6 million.The bonds pay a fixed rate of 5.2% to maturity in June 2005. The bonds serve as a hedge of our investment inEuro-denominated net assets. While an increase in the value of the euro against the dollar will result in a greaterliability, there will be a corresponding increase in the dollar value of our Euro-denominated net assets. We intendto redeem these Euro-denominated bonds in 2005 utilizing our available cash, our credit facilities or acombination of both.
Our outstanding debt and amounts available under these facilities as of December 31, 2004 ($ in millions)were as follows:
Debt AvailableOutstanding Credit___________ _________
Bank loans (due in less than 1 year) .................................................... $ 17.5 —$1,500.0 million revolver — due May 24, 2009 ................................ — $1,500.0$500.0 million — due May 23, 2005 .................................................. — 500.0€152.4 million 5.20% Euro notes — due June 24, 2005 .................... 206.6 —Convertible notes — due February 7, 2031 ........................................ 847.0 —Convertible notes — due July 31, 2032 .............................................. 892.3 —Convertible notes — due June 15, 2033 .............................................. 600.0 —Loan notes and sundry — various through 2010 ................................ 21.7 —______________ ______________Total...................................................................................................... $2,585.1 $2,000.0______________ ____________________________ ______________
Additional information about our indebtedness is included in notes 3 and 4 of our consolidated financialstatements.
22

Quantitative and Qualitative Disclosures Regarding Market Risk
Foreign Exchange: Our results of operations are subject to risk from the translation to the U.S. dollar ofthe revenue and expenses of our foreign operations, which are generally denominated in the local currency. Theeffects of currency exchange rate fluctuation on the translation of our results of operations are discussed in note12 of our consolidated financial statements. For the most part, our revenues and the expenses incurred related tothose revenues are denominated in the same currency. This minimizes the impact that fluctuations in exchangerates will have on our net income.
While our agencies conduct business in more than 70 different currencies, our major-non-U.S. currencymarkets are the European Monetary Union (EMU), the United Kingdom, Japan, Brazil and Canada. As anintegral part of our treasury operations, we enter into short-term forward foreign exchange contracts whichhedge the intercompany cash movements between subsidiaries operating in different currency markets from thatof our treasury centers from which they borrow or invest. In the limited number of instances where operatingexpenses and revenues are not denominated in the same currency, amounts are promptly settled or hedged in theforeign currency market with forward contracts. At December 31, 2004, we had foreign exchange contractsoutstanding with an aggregate notional principal of $1,453.1 million, most of which were denominated in ourmajor international market currencies with maturities ranging from 2 to 365 days with an average duration ofless than 30 days.
Additionally, at December 31, 2004 we had cross-currency interest rate swaps in place with an aggregatenotional principal amount of 19.1 billion Yen maturing in 2005. See note 12 to our consolidated financialstatements for information about the fair value of each type of derivative instrument.
The forward foreign exchange and swap contracts discussed above were entered into for the purpose ofhedging certain specific currency risks. As a result of these financial instruments, we reduced financial risk inexchange for foregoing any gain (reward) which might have occurred if the markets moved favorably. In usingthese contracts, we exchanged the risks of the financial markets for counterparty risk. To minimize counterpartyrisk, we only enter into these contracts with major well-known banks and financial institutions that have creditratings equal to or better than our credit rating.
These hedging activities are confined to risk management activities related to our international operations.We have established a centralized reporting system to evaluate the effects of changes in interest rates, currencyexchange rates and other relevant market risks. We periodically determine the potential loss from market risk byperforming a value-at-risk computation. Value-at-risk analysis is a statistical model that utilizes historic currencyexchange and interest rate data to measure the potential impact on future earnings of our existing portfolio ofderivative financial instruments. The value-at-risk analysis we performed on our December 31, 2004 portfolio ofderivative financial instruments indicated that the risk of loss was immaterial. This overall system is designed toenable us to initiate remedial action, if appropriate.
Debt Instruments: Our bank credit facilities mentioned above are available to provide credit support forissuances of commercial paper, as well as to provide back-up liquidity in case any of our convertible bond issuesare put back to us. We currently have a $500.0 million 364-day facility with a one-year term out option expiringon May 23, 2005 and a $1,500.0 million 5-year facility expiring on May 24, 2009. Accordingly, we classifyoutstanding borrowings, if any, under these facilities as long-term debt. We normally replace our 364-day facilityeach year with a new 364-day facility with similar provisions.
Our bank syndicates typically include large global banks such as Citibank, JP Morgan Chase, HSBC, ABNAmro, Societe Generale, Barclays, Bank of America and BBVA. We also include large regional banks in theU.S. such as Wachovia, US Bancorp, Northern Trust, PNC and Wells Fargo. We also include banks that have amajor presence in countries where we conduct business such as Sumitomo in Japan, Fortis in Belgium, SanPaolo in Italy, Scotia in Canada and Westpac in Australia.
Our other long-term debt consists principally of convertible notes. The holders of these convertible noteshave the right on specific dates to cause us to repurchase up to the entire aggregate face amount as previouslydiscussed. We may offer the holders of our notes a cash payment or other incentives to induce them not to putthe notes to us in advance of a put date. If we were to decide to pay a cash incentive, the amount of interestexpense incurred will be based on market factors.
23

Since our existing convertible notes do not pay or accrue interest, our interest expense could increase ifnotes are put. The extent, if any, of the increase in interest expense will depend on the portion of the amountrepurchased that was refinanced, when we refinance, the type of instrument we use to refinance and the term ofthe instrument.
The incentive payments made in 2003 and 2004 to qualified noteholders, as described above under “DebtInstruments, Guarantees and Related Covenants”, are one method of keeping the convertible notes outstandingand preserving our liquidity. If we are required to satisfy a put, we expect to have sufficient available cash andunused credit commitments to fund the put, while still preserving ample capacity under these commitments tomeet cash requirements for the normal course of our business operations after the put event.
Our credit commitments support either the issuance of commercial paper or bank loans, and we wouldlikely fund the put initially using some combination of these instruments. We would then evaluate all fundingalternatives available to us to replenish our credit capacity and liquidity. We believe the funding alternativeswould include substantially all forms of debt, equity and convertible instruments available to us by accessing thepublic or private capital markets. Our evaluation would likely include the expected cash flows from the normalcourse of our business operations and the credit capacity to fund additional potential puts on the remainingoutstanding convertible notes.
If we were to replace the convertible notes with another form of debt on a dollar-for-dollar basis, it wouldhave no impact on either our debt to capital ratios or our debt to EBITDA ratio. However, an increase in interestexpense would negatively impact our coverage ratios, such as EBITDA to interest expense, if the replacementdebt were to be interest bearing. Currently our coverage ratios applicable to our current rating levels are wellabove the thresholds since the majority of our long-term debt does not pay or accrue interest other than theinterest expense resulting from the amortization of the prior cash payments. Based on present expectations ofour future operating cash flows and expected access to debt and equity capital markets, we believe any increasein interest expense and reduction in coverage ratios would still place us comfortably above the coverage ratiorequirements. Thus, we do not expect any negative impact on our credit ratings if the convertible notes are put inthe near future.
8. Financial Statements and Supplementary Data
Our financial statements and supplementary data are included at the end of this report beginning on pageF-1. See the index appearing on the following pages of this report.
9. Changes in and Disagreements with Accountants on Accounting and Financial Disclosure
None.
9A. Controls and Procedures
We have established and maintain disclosure controls and procedures and internal controls over financialreporting designed to ensure that information required to be disclosed in our SEC reports is recorded, processed,summarized and reported within applicable time periods. We conducted an evaluation, under the supervision andwith the participation of our management, including our CEO and CFO, of the effectiveness of our disclosurecontrols and procedures as of December 31, 2004. There have not been any changes in our internal controls overfinancial reporting that occurred during our fourth fiscal quarter that has materially affected or is reasonablylikely to materially affect our internal controls over financial reporting. Based on that evaluation, our CEO andCFO concluded that as of December 31, 2004, our disclosure controls and procedures are effective to ensurerecording, processing, summarization and reporting of information required to be included in our Annual Reporton Form 10-K for the period ended December 31, 2004 as appropriate to allow timely decisions regardingrequired disclosure. Our independent registered public accounting firm, KPMG LLP, has audited our financialstatements and issued an attestation report on our assessment of our internal control over financial reporting,which is included herein.
9B. Other Information
None.
24
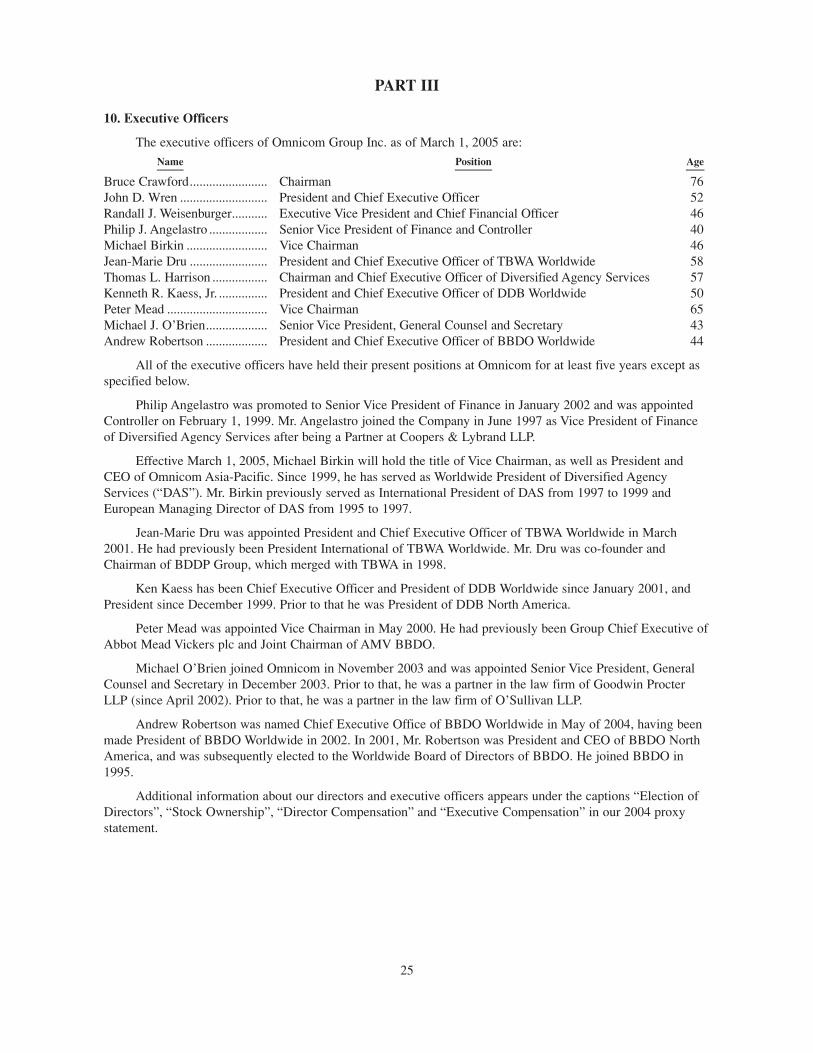
PART III
10. Executive Officers
The executive officers of Omnicom Group Inc. as of March 1, 2005 are:
Name Position Age__________ ______________ _______
Bruce Crawford........................ Chairman 76John D. Wren ........................... President and Chief Executive Officer 52Randall J. Weisenburger........... Executive Vice President and Chief Financial Officer 46Philip J. Angelastro .................. Senior Vice President of Finance and Controller 40Michael Birkin ......................... Vice Chairman 46Jean-Marie Dru ........................ President and Chief Executive Officer of TBWA Worldwide 58Thomas L. Harrison ................. Chairman and Chief Executive Officer of Diversified Agency Services 57Kenneth R. Kaess, Jr. ............... President and Chief Executive Officer of DDB Worldwide 50Peter Mead ............................... Vice Chairman 65Michael J. O’Brien................... Senior Vice President, General Counsel and Secretary 43Andrew Robertson ................... President and Chief Executive Officer of BBDO Worldwide 44
All of the executive officers have held their present positions at Omnicom for at least five years except asspecified below.
Philip Angelastro was promoted to Senior Vice President of Finance in January 2002 and was appointedController on February 1, 1999. Mr. Angelastro joined the Company in June 1997 as Vice President of Financeof Diversified Agency Services after being a Partner at Coopers & Lybrand LLP.
Effective March 1, 2005, Michael Birkin will hold the title of Vice Chairman, as well as President andCEO of Omnicom Asia-Pacific. Since 1999, he has served as Worldwide President of Diversified AgencyServices (“DAS”). Mr. Birkin previously served as International President of DAS from 1997 to 1999 andEuropean Managing Director of DAS from 1995 to 1997.
Jean-Marie Dru was appointed President and Chief Executive Officer of TBWA Worldwide in March2001. He had previously been President International of TBWA Worldwide. Mr. Dru was co-founder andChairman of BDDP Group, which merged with TBWA in 1998.
Ken Kaess has been Chief Executive Officer and President of DDB Worldwide since January 2001, andPresident since December 1999. Prior to that he was President of DDB North America.
Peter Mead was appointed Vice Chairman in May 2000. He had previously been Group Chief Executive ofAbbot Mead Vickers plc and Joint Chairman of AMV BBDO.
Michael O’Brien joined Omnicom in November 2003 and was appointed Senior Vice President, GeneralCounsel and Secretary in December 2003. Prior to that, he was a partner in the law firm of Goodwin ProcterLLP (since April 2002). Prior to that, he was a partner in the law firm of O’Sullivan LLP.
Andrew Robertson was named Chief Executive Office of BBDO Worldwide in May of 2004, having beenmade President of BBDO Worldwide in 2002. In 2001, Mr. Robertson was President and CEO of BBDO NorthAmerica, and was subsequently elected to the Worldwide Board of Directors of BBDO. He joined BBDO in1995.
Additional information about our directors and executive officers appears under the captions “Election ofDirectors”, “Stock Ownership”, “Director Compensation” and “Executive Compensation” in our 2004 proxystatement.
25

PART IV
15. Exhibits, Financial Statement Schedules, and Reports on Form 8-K
(a)(1) Financial Statements: Page_____
Management Report on Internal Controls Over Financial Reporting ................................................ F-1Report of Independent Registered Public Accounting Firm .............................................................. F-2Report of Independent Registered Public Accounting Firm .............................................................. F-3Consolidated Statements of Income for the Three Years Ended December 31, 2004 ........................ F-4Consolidated Balance Sheets at December 31, 2004 and 2003.......................................................... F-5Consolidated Statements of Shareholders’ Equity for the Three Years Ended
December 31, 2004.......................................................................................................................... F-6Consolidated Statements of Cash Flows for the Three Years Ended December 31, 2004 ................ F-7Notes to Consolidated Financial Statements ...................................................................................... F-8Quarterly Results of Operations (Unaudited) .................................................................................... F-28
(a)(2) Financial Statement Schedules:Schedule II — Valuation and Qualifying Accounts (for the three years ended
December 31, 2004) ........................................................................................................................ S-1
All other schedules are omitted because they are not applicable.
(a)(3) Exhibits:ExhibitNumbers Description_______ _________(3)(i) Restated Certificate of Incorporation (Exhibit 3.1 to our Quarterly Report on Form 10-Q for
the quarter ended June 30, 2003 (the “6-30-03 10-Q”) and incorporated herein by reference).
(ii) By-laws (Exhibit 3.2 to our 6-30-03 10-Q) and incorporated herein by reference (File No.1-10551).
4.1 Fiscal Agency Agreement, dated June 24, 1998, in connection with our issuance of1,000,000,000 5.20% Notes due 2005 (the “5.20% Notes”) (Exhibit 4.1 to our QuarterlyReport on Form 10-Q for the quarter ended June 30, 1998 (the “6-30-98 10-Q”) (File No.1-10551) and incorporated herein by reference).
4.2 Subscription Agreement, dated June 22, 1998, in connection with our issuance of the 5.20%notes (Exhibit 4.2 to our 6-30-98 10-Q and incorporated by herein reference).
4.3 Deed of Covenant, dated June 24, 1998, in connection with our issuance of the 5.20% notes(Exhibit 4.3 to the 6-30-98 10-Q and incorporated herein by reference).
4.4 Indenture, dated February 7, 2001, between JPMorgan Chase Manhattan Bank, as trustee,and us in connection with our issuance of $850,000,000 Liquid Yield Option Notes due 2031(the “2031 Indenture”) (Exhibit 4.1 to our Registration Statement on Form S-3 RegistrationNo. 333-55386) and incorporated herein by reference).
4.5 Form of Liquid Yield Option Notes due 2031 (included in Exhibit 4.4 above).
4.6 First Supplemental Indenture to the 2031 Indenture, dated as of February 13, 2004, amongus, Omnicom Capital Inc., Omnicom Finance Inc. and JPMorgan Chase Bank (Exhibit 4.3 toour Registration Statement on Form S-3 (Registration No. 112840) and incorporated hereinby reference).
4.7 Second Supplemental Indenture to the 2031 Indenture, dated November 4, 2004, amongOmnicom Group Inc., Omnicom Capital Inc., Omnicom Finance Inc. and JPMorgan ChaseBank, as trustee, to the 2031 Indenture, as amended by the First Supplemental Indenture tothe 2031 Indenture, dated February 13, 2004 (Exhibit 4.2 to our Quarterly Report on Form10-Q for the quarter ended September 30, 2004 (the “9-30-04 10-Q”) and incorporatedherein by reference).
4.8 Third Supplemental Indenture to the 2031 Indenture, dated November 30, 2004, among us,Omnicom Capital Inc., Omnicom Finance Inc., and JP Morgan Chase Bank, N.S., as trustee,
26

to the 2031 Indenture, as amended by the First Supplemental Indenture to the 2031Indenture dated February 13, 2004, and the Second Supplemental Indenture to the 2031Supplemental Indenture dated November 4, 2004 (Exhibit 4.1 to the Form 8-K (RegistrationNo. 1-10551) dated November 30, 2004 and incorporated herein by reference).
4.9 Indenture, dated March 6, 2002, between JPMorgan Chase Bank as trustee and us inconnection with our issuance of $900,000,000 Zero Coupon Zero Yield Convertible notesdue 2032 (the “2032 Indenture”) (Exhibit 4.6 to our Annual Report on Form 10-K for theyear ended December 31, 2001 and incorporated by reference).
4.10 Form of Zero Coupon Zero Yield Convertible Notes due 2032 (included in Exhibit 4.7).
4.11 First Supplemental Indenture to the 2032 Indenture, dated as of February 13, 2004, amongus, Omnicom Capital Inc., Omnicom Finance Inc. and JPMorgan Chase Bank (Exhibit 4.3 toour Registration Statement on Form S-3 (Registration No. 112841) and incorporated hereinby reference).
4.12 Second Supplemental Indenture to the 2032 Indenture, dated August 12, 2004, among us,Omnicom Capital Inc., Omnicom Finance Inc., and JPMorgan Chase Bank, as trustee, to the2032 Indenture, as amended by the First Supplemental Indenture to the 2032 Indenture,dated February 13, 2004 (Exhibit 4.1 to our 9-30-04 10-Q and incorporated herein byreference).
4.13 Third Supplemental Indenture to the 2032 Indenture, dated November 4, 2003, among us,Omnicom Capital Inc., Omnicom Finance Inc. and JPMorgan Chase Bank, as trustee, to the2032 Indenture, as amended by the First Supplemental Indenture to the 2032 Indenture,dated as of February 13, 2004, and the Second Supplemental Indenture to the 2032Indenture, dated August 12, 2004 (Exhibit 4.3 to our 9-30-04 10-Q and incorporated hereinby reference).
4.14 Indenture, dated as of June 30, 2003, between JPMorgan Chase Bank, as trustee, and us inconnection with our issuance of $600,000,000 Zero Coupon Zero Yield Convertible Notesdue 2033 (the “2033 Indenture”) (Exhibit 4.1 to our Registration Statement on Form S-3(Registration No. 333-108611) and incorporated herein by reference).
4.15 Form of the Zero Coupon Zero Yield Convertible Notes due 2033 (included in Exhibit 4.11above).
4.16 First Supplemental Indenture, to the 2033 Indenture, dated as of November 5, 2003, amongus, Omnicom Capital Inc., Omnicom Finance Inc. and JPMorgan Chase Bank, as trustee,(Exhibit 4.4 to our Registration Statement on Form S-3 (Registration No. 333-108611) andincorporated by reference).
4.17 Second Supplemental Indenture to the 2033 Indenture, dated as of November 4, 2004,among us, Omnicom Capital Inc., Omnicom Finance Inc. and JPMorgan Chase Bank, astrustee, as amended by the First Supplemental Indenture to the 2033 Indenture, datedNovember 5, 2003 (Exhibit 4.4 to our 9-30-04 10-Q and incorporated herein by reference).
4.18 Third Supplemental Indenture to the 2033 Indenture, dated November 10, 2004, among us,Omnicom Capital Inc., Omnicom Finance Inc. and JPMorgan Chase Bank, as trustee, to the2033 Indenture, as amended by the First Supplemental Indenture to the 2033 Indenture,dated November 5, 2003, and the Second Supplemental Indenture to the 2033 Indenturedated November 4, 2004 (Exhibit 4.1 to the Form 8-K (Registration No. 1-10551) datedNovember 10, 2004 and incorporated herein by reference).
10.1 364-day Credit Agreement, dated May 24, 2004, among Omnicom Group Inc., OmnicomCapital Inc., Omnicom Finance PLC, the financial institutions party thereto, Citibank, N.A.,as administrative agent, ABN Amro Bank N.V., as syndication agent and JPMorgan ChaseBank and HSBC Bank USA as co-documentation agents (Exhibit 10.1 to our QuarterlyReport on Form 10-Q for the quarter ended June 30, 2004 (the “6-30-04 10-Q”) andincorporated herein by reference).
10.2 5-year Credit Agreement, dated May 24, 2004, among Omnicom Group Inc., OmnicomCapital Inc., Omnicom Finance PLC, the financial institutions party thereto, Citibank, N.A.,as administrative agent, ABN Amro Bank N.V., as syndication agent and JPMorgan ChaseBank and HSBC Bank USA as co-documentation agents (Exhibit 10.2 to our 6-30-04 10-Qand incorporated herein by reference).
27
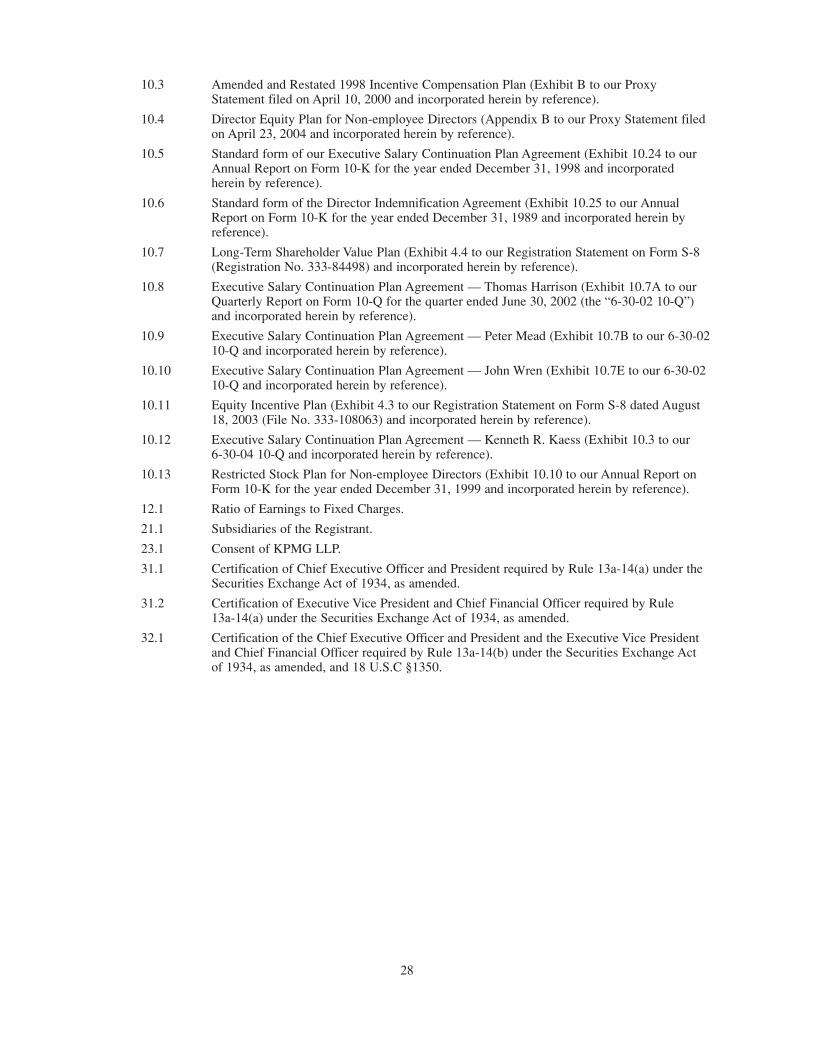
10.3 Amended and Restated 1998 Incentive Compensation Plan (Exhibit B to our ProxyStatement filed on April 10, 2000 and incorporated herein by reference).
10.4 Director Equity Plan for Non-employee Directors (Appendix B to our Proxy Statement filedon April 23, 2004 and incorporated herein by reference).
10.5 Standard form of our Executive Salary Continuation Plan Agreement (Exhibit 10.24 to ourAnnual Report on Form 10-K for the year ended December 31, 1998 and incorporatedherein by reference).
10.6 Standard form of the Director Indemnification Agreement (Exhibit 10.25 to our AnnualReport on Form 10-K for the year ended December 31, 1989 and incorporated herein byreference).
10.7 Long-Term Shareholder Value Plan (Exhibit 4.4 to our Registration Statement on Form S-8(Registration No. 333-84498) and incorporated herein by reference).
10.8 Executive Salary Continuation Plan Agreement — Thomas Harrison (Exhibit 10.7A to ourQuarterly Report on Form 10-Q for the quarter ended June 30, 2002 (the “6-30-02 10-Q”)and incorporated herein by reference).
10.9 Executive Salary Continuation Plan Agreement — Peter Mead (Exhibit 10.7B to our 6-30-0210-Q and incorporated herein by reference).
10.10 Executive Salary Continuation Plan Agreement — John Wren (Exhibit 10.7E to our 6-30-0210-Q and incorporated herein by reference).
10.11 Equity Incentive Plan (Exhibit 4.3 to our Registration Statement on Form S-8 dated August18, 2003 (File No. 333-108063) and incorporated herein by reference).
10.12 Executive Salary Continuation Plan Agreement — Kenneth R. Kaess (Exhibit 10.3 to our6-30-04 10-Q and incorporated herein by reference).
10.13 Restricted Stock Plan for Non-employee Directors (Exhibit 10.10 to our Annual Report onForm 10-K for the year ended December 31, 1999 and incorporated herein by reference).
12.1 Ratio of Earnings to Fixed Charges.
21.1 Subsidiaries of the Registrant.
23.1 Consent of KPMG LLP.
31.1 Certification of Chief Executive Officer and President required by Rule 13a-14(a) under theSecurities Exchange Act of 1934, as amended.
31.2 Certification of Executive Vice President and Chief Financial Officer required by Rule13a-14(a) under the Securities Exchange Act of 1934, as amended.
32.1 Certification of the Chief Executive Officer and President and the Executive Vice Presidentand Chief Financial Officer required by Rule 13a-14(b) under the Securities Exchange Actof 1934, as amended, and 18 U.S.C §1350.
28

SIGNATURES
Pursuant to the requirements of Section 13 or 15(d) of the Securities Exchange Act of 1934, theRegistrant has duly caused this report to be signed on its behalf by the undersigned, thereunto dulyauthorized.
OMNICOM GROUP INC.March 11, 2005
BY: /S/ RANDALL J. WEISENBURGER
Randall J. WeisenburgerExecutive Vice President and Chief Financial Officer
Pursuant to the requirements of the Securities Exchange Act of 1934, this report has been signedbelow by the following persons on behalf of the Registrant and in the capacities and on the datesindicated.
Signature Title Date_________________ ________ ________
/s/ BRUCE CRAWFORD Chairman and Director March 11, 2005(Bruce Crawford)
/s/ JOHN D. WREN Chief Executive Officer March 11, 2005(John D. Wren) and President and Director
/s/ RANDALL J. WEISENBURGER Executive Vice President and March 11, 2005(Randall J. Weisenburger) Chief Financial Officer
/s/ PHILIP J. ANGELASTRO Senior Vice President Finance March 11, 2005(Philip J. Angelastro) and Controller
(Principal Accounting Officer)
/s/ ROBERT CHARLES CLARK Director March 11, 2005(Robert Charles Clark)
/s/ LEONARD S. COLEMAN, JR. Director March 11, 2005(Leonard S. Coleman, Jr.)
/s/ ERROL M. COOK Director March 11, 2005(Errol M. Cook)
/s/ SUSAN S. DENISON Director March 11, 2005(Susan S. Denison)
/s/ MICHAEL A. HENNING Director March 11, 2005(Michael A. Henning)
/s/ JOHN R. MURPHY Director March 11, 2005(John R. Murphy)
/s/ JOHN R. PURCELL Director March 11, 2005(John R. Purcell)
/s/ LINDA JOHNSON RICE Director March 11, 2005(Linda Johnson Rice)
/s/ GARY L. ROUBOS Director March 11, 2005(Gary L. Roubos)
29

[This page intentionally left blank]

F-1
MANAGEMENT REPORT ON INTERNAL CONTROLS OVER FINANCIAL REPORTING
Management is responsible for the preparation of Omnicom’s consolidated financial statements and relatedinformation. Management uses its best judgment to ensure that the consolidated financial statements presentfairly, in all material respects, Omnicom’s consolidated financial position and results of operations inconformity with Generally Accepted Accounting Principles.
The financial statements have been audited by an independent registered public accounting firm inaccordance with the standards of the Public Company Accounting Oversight Board. Their report expresses theindependent accountant’s judgment as to the fairness of management’s reported operating results, cash flowsand financial position. This judgment is based on the procedures described in the second paragraph of theirreport.
Omnicom management is responsible for establishing and maintaining adequate internal control overfinancial reporting, as such term is defined in Exchange Act Rules 13a-15(f). Under the supervision ofmanagement and with the participation of our agencies, we conducted an evaluation of the effectiveness of ourinternal control over financial reporting based on the framework in Internal Control — Integrated Frameworkissued by the Committee of Sponsoring Organizations of the Treadway Commission published in 1987. Basedon that evaluation, our management concluded that our internal control over financial reporting was effective asof December 31, 2004. KPMG, LLP, an independent registered public accounting firm, that audited ourconsolidated financial statements included in this Annual Report on Form 10-K, has issued an attestation reporton management’s assessment of Omnicom’s internal control over financial reporting.
The Board of Directors of Omnicom has an Audit Committee comprised of four non-managementdirectors. The Committee meets periodically with financial management, Internal Audit, and the independentauditors to review accounting, control, audit and financial reporting matters.

F-2
REPORT OF INDEPENDENT REGISTERED PUBLIC ACCOUNTING FIRM
To the Board of Directors and Shareholdersof Omnicom Group Inc.:
We have audited the accompanying consolidated balance sheets of Omnicom Group Inc. and subsidiariesas of December 31, 2004 and 2003, and the related consolidated statements of income, shareholders’ equity andcash flows for each of the years in the three-year period ended December 31, 2004. In connection with ouraudits of the consolidated financial statements, we also have audited the related financial statement schedules.These consolidated financial statements and financial statement schedules are the responsibility of OmnicomGroup Inc.’s management. Our responsibility is to express an opinion on these consolidated financial statementsand financial statement schedules based on our audits.
We conducted our audits in accordance with the standards of the Public Company Accounting OversightBoard (United States). Those standards require that we plan and perform the audit to obtain reasonableassurance about whether the financial statements are free of material misstatement. An audit includesexamining, on a test basis, evidence supporting the amounts and disclosures in the financial statements. An auditalso includes assessing the accounting principles used and significant estimates made by management, as wellas evaluating the overall financial statement presentation. We believe that our audits provide a reasonable basisfor our opinion.
In our opinion, the consolidated financial statements referred to above present fairly, in all materialrespects, the financial position of Omnicom Group Inc. and subsidiaries as of December 31, 2004 and 2003, andthe results of their operations and their cash flows for each of the years in the three-year period endedDecember 31, 2004, in conformity with U.S. generally accepted accounting principles. Also in our opinion, therelated financial statement schedules on page S-1, when considered in relation to the basic consolidatedfinancial statements taken as a whole, present fairly, in all material respects, the information set forth therein.
We also have audited, in accordance with the standards of the Public Company Accounting OversightBoard (United States), the effectiveness of Omnicom Group Inc.’s internal control over financial reporting as ofDecember 31, 2004, based on criteria established in Internal Control-Integrated Framework issued by theCommittee of Sponsoring Organizations of the Treadway Commission (COSO), and our report dated March 11,2005 expressed an unqualified opinion on management’s assessment of, and the effective operation of, internalcontrol over financial reporting.
As discussed in Note 13 to the consolidated financial statements, Omnicom Group Inc. adopted SFASNo. 123, “Accounting for Stock-Based Compensation,” as amended by SFAS No. 148, “Accounting forStock-Based Compensation — Transition and Disclosure,” an amendment of SFAS No. 123.
/s/ KPMG LLP
New York, New YorkMarch 11, 2005

F-3
REPORT OF INDEPENDENT REGISTERED PUBLIC ACCOUNTING FIRM
To the Board of Directors and Shareholdersof Omnicom Group Inc.:
We have audited management’s assessment, included in the accompanying management report, thatOmnicom Group Inc. maintained effective internal control over financial reporting as of December 31, 2004,based on criteria established in Internal Control-Integrated Framework issued by the Committee of SponsoringOrganizations of the Treadway Commission (COSO). Omnicom Group Inc.’s management is responsible formaintaining effective internal control over financial reporting and for its assessment of the effectiveness ofinternal control over financial reporting. Our responsibility is to express an opinion on management’sassessment and an opinion on the effectiveness of Omnicom Group Inc.’s internal control over financialreporting based on our audit.
We conducted our audit in accordance with the standards of the Public Company Accounting OversightBoard (United States). Those standards require that we plan and perform the audit to obtain reasonableassurance about whether effective internal control over financial reporting was maintained in all materialrespects. Our audit included obtaining an understanding of internal control over financial reporting, evaluatingmanagement’s assessment, testing and evaluating the design and operating effectiveness of internal control, andperforming such other procedures as we considered necessary in the circumstances. We believe that our auditprovides a reasonable basis for our opinion.
A company’s internal control over financial reporting is a process designed to provide reasonableassurance regarding the reliability of financial reporting and the preparation of financial statements for externalpurposes in accordance with generally accepted accounting principles. A company’s internal control overfinancial reporting includes those policies and procedures that (1) pertain to the maintenance of records that, inreasonable detail, accurately and fairly reflect the transactions and dispositions of the assets of the company;(2) provide reasonable assurance that transactions are recorded as necessary to permit preparation of financialstatements in accordance with generally accepted accounting principles, and that receipts and expenditures ofthe company are being made only in accordance with authorizations of management and directors of thecompany; and (3) provide reasonable assurance regarding prevention or timely detection of unauthorizedacquisition, use, or disposition of the company’s assets that could have a material effect on the financialstatements.
Because of its inherent limitations, internal control over financial reporting may not prevent or detectmisstatements. Also, projections of any evaluation of effectiveness to future periods are subject to the risk thatcontrols may become inadequate because of changes in conditions, or that the degree of compliance with thepolicies or procedures may deteriorate.
In our opinion, management’s assessment that Omnicom Group Inc. maintained effective internal controlover financial reporting as of December 31, 2004, is fairly stated, in all material respects, based on criteriaestablished in Internal Control-Integrated Framework issued by the Committee of Sponsoring Organizations ofthe Treadway Commission (COSO). Also, in our opinion, Omnicom Group Inc. maintained, in all materialrespects, effective internal control over financial reporting as of December 31, 2004, based on criteriaestablished in Internal Control-Integrated Framework issued by the Committee of Sponsoring Organizations ofthe Treadway Commission (COSO).
We also have audited, in accordance with the standards of the Public Company Accounting OversightBoard (United States), the consolidated balance sheets of Omnicom Group Inc. and subsidiaries as of December31, 2004 and 2003, and the related consolidated statements of income, shareholders’ equity and cash flows foreach of the years in the three-year period ended December 31, 2004, and our report dated March 11, 2005expressed an unqualified opinion on those consolidated financial statements.
/s/ KPMG LLP
New York, New YorkMarch 11, 2005

F-4
The accompanying notes to the consolidated financial statements are an integral part of these statements.
OMNICOM GROUP INC. AND SUBSIDIARIES
CONSOLIDATED STATEMENTS OF INCOMEYears Ended December 31,
(Dollars in MillionsExcept Per Share Data)__________________________________________________________________________________________
2004 2003 2002______________ ______________ ______________REVENUE ............................................................................ $9,747.2 $8,621.4 $7,536.3
OPERATING EXPENSES:Salary and service costs .................................................... 6,846.8 5,911.8 5,071.9Office and general expenses .............................................. 1,685.0 1,617.7 1,479.3______________ ______________ ______________
8,531.8 7,529.5 6,551.2______________ ______________ ______________
OPERATING PROFIT .......................................................... 1,215.4 1,091.9 985.1
NET INTEREST EXPENSE:Interest expense.................................................................. 51.1 57.9 45.5Interest income .................................................................. (14.5) (15.1) (15.0)______________ ______________ ______________
36.6 42.8 30.5______________ ______________ ______________
INCOME BEFORE INCOME TAXES ................................ 1,178.8 1,049.1 954.6
INCOME TAXES .................................................................. 396.3 353.0 329.6______________ ______________ ______________
INCOME AFTER INCOME TAXES.................................... 782.5 696.1 625.0
EQUITY IN EARNINGS OF AFFILIATES ........................ 17.1 15.1 13.8
MINORITY INTERESTS .................................................... (76.1) (80.2) (68.3)______________ ______________ ______________
NET INCOME ...................................................................... $ 723.5 $ 631.0 $ 570.5______________ ______________ ____________________________ ______________ ______________NET INCOME PER COMMON SHARE:
Basic .................................................................................. $ 3.90 $ 3.37 $ 3.07Diluted................................................................................ $ 3.88 $ 3.37 $ 3.07

F-5
The accompanying notes to the consolidated financial statements are an integral part of these statements.
OMNICOM GROUP INC. AND SUBSIDIARIES CONSOLIDATED BALANCE SHEETS
December 31,(Dollars in Millions)____________________________
2004 2003_________________________ ______________________
A S S E T SCURRENT ASSETS:
Cash and cash equivalents ................................................................................ $ 1,165.6 $ 1,243.5Short-term investments at market, which approximates cost............................ 574.0 305.4Accounts receivable, less allowance for doubtful accounts
of $67.8 and $69.7........................................................................................ 4,916.7 4,530.0Billable production orders in process, at cost .................................................. 536.6 440.4Prepaid expenses and other current assets ........................................................ 902.2 766.6________ ________Total Current Assets .......................................................................................... 8,095.1 7,285.9________ ________
FURNITURE, EQUIPMENT AND LEASEHOLD IMPROVEMENTS,at cost, less accumulated depreciation and amortizationof $909.8 and $817.1 ........................................................................................ 636.4 596.8
INVESTMENTS IN AFFILIATES .................................................................................... 162.9 151.2GOODWILL .............................................................................................................. 6,411.4 5,886.2INTANGIBLES, net of accumulated amortization of $164.7 and $127.8 .................. 110.0 121.4DEFERRED TAX BENEFITS ........................................................................................ 303.4 264.7OTHER ASSETS ........................................................................................................ 283.2 313.8________ ________
TOTAL ASSETS .................................................................................................... $16,002.4 $14,620.0________ ________________ ________
L I A B I L I T I E S A N D S H A R E H O L D E R S’ E Q U I T YCURRENT LIABILITIES:
Accounts payable .............................................................................................. $ 6,011.5 $ 5,513.3Advance billings................................................................................................ 874.0 775.2Current portion of long-term debt .................................................................... 209.2 12.4Bank loans ........................................................................................................ 17.5 42.4Accrued taxes .................................................................................................... 217.0 221.7Other liabilities .................................................................................................. 1,414.7 1,197.5________ ________Total Current Liabilities .................................................................................... 8,743.9 7,762.5________ ________
LONG-TERM DEBT .................................................................................................. 19.1 197.3CONVERTIBLE NOTES .............................................................................................. 2,339.3 2,339.3DEFERRED COMPENSATION AND OTHER LIABILITIES ................................................ 309.1 326.5LONG TERM DEFERRED TAX LIABILITY.................................................................... 317.4 204.1MINORITY INTERESTS .............................................................................................. 194.9 187.3SHAREHOLDERS’ EQUITY
Preferred stock, $1.00 par value, 7,500,000 shares authorized, none issuedCommon stock, $0.15 par value, 1,000,000,000 shares authorized,
198,636,936 and 198,663,916 shares issued in 2004 and 2003,respectively .................................................................................................. 29.8 29.8
Additional paid-in capital.................................................................................. 1,824.5 1,832.0Retained earnings .............................................................................................. 2,975.4 2,419.1Unamortized restricted stock ............................................................................ (178.9) (216.4)Accumulated other comprehensive income ...................................................... 268.5 109.7Treasury stock, at cost, 11,561,622 and 8,239,072 shares in
2004 and 2003, respectively ........................................................................ (840.6) (571.2)________ ________Total Shareholders’ Equity ................................................................................ 4,078.7 3,603.0________ ________TOTAL LIABILITIES AND SHAREHOLDERS’ EQUITY .............................................. $16,002.4 $14,620.0________ ________________ ________
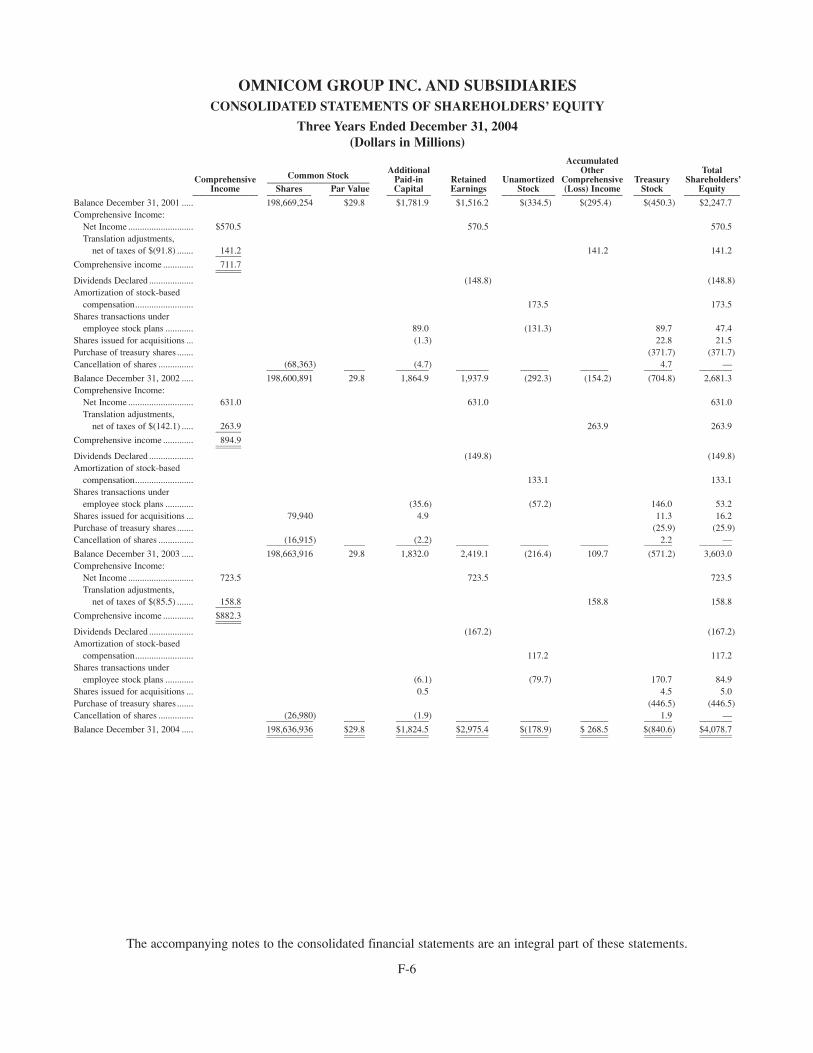
F-6
OMNICOM GROUP INC. AND SUBSIDIARIES CONSOLIDATED STATEMENTS OF SHAREHOLDERS’ EQUITY
Three Years Ended December 31, 2004(Dollars in Millions)
Accumulated
Common Stock Additional Other TotalComprehensive ______________________ Paid-in Retained Unamortized Comprehensive Treasury Shareholders’
Income Shares Par Value Capital Earnings Stock (Loss) Income Stock Equity____________________________ ___________________ _________________ ___________________ _______________ _______________________ __________________________ ________________ ________________________Balance December 31, 2001 ..... 198,669,254 $29.8 $1,781.9 $1,516.2 $(334.5) $(295.4) $(450.3) $2,247.7Comprehensive Income:
Net Income ............................ $570.5 570.5 570.5Translation adjustments,
net of taxes of $(91.8) ....... 141.2 141.2 141.2___________Comprehensive income ............. 711.7______________________Dividends Declared ................... (148.8) (148.8)Amortization of stock-based
compensation......................... 173.5 173.5Shares transactions under
employee stock plans ............ 89.0 (131.3) 89.7 47.4Shares issued for acquisitions ... (1.3) 22.8 21.5Purchase of treasury shares ....... (371.7) (371.7)Cancellation of shares ............... (68,363) (4.7) 4.7 —____________________ _________ ______________ ______________ ____________ ____________ ____________ ______________Balance December 31, 2002 ..... 198,600,891 29.8 1,864.9 1,937.9 (292.3) (154.2) (704.8) 2,681.3Comprehensive Income:
Net Income ............................ 631.0 631.0 631.0Translation adjustments,
net of taxes of $(142.1) ..... 263.9 263.9 263.9___________Comprehensive income ............. 894.9______________________Dividends Declared ................... (149.8) (149.8)Amortization of stock-based
compensation......................... 133.1 133.1Shares transactions under
employee stock plans ............ (35.6) (57.2) 146.0 53.2Shares issued for acquisitions ... 79,940 4.9 11.3 16.2Purchase of treasury shares ....... (25.9) (25.9)Cancellation of shares ............... (16,915) (2.2) 2.2 —____________________ _________ ______________ ______________ ____________ ____________ ____________ ______________Balance December 31, 2003 ..... 198,663,916 29.8 1,832.0 2,419.1 (216.4) 109.7 (571.2) 3,603.0Comprehensive Income:
Net Income ............................ 723.5 723.5 723.5Translation adjustments,
net of taxes of $(85.5) ....... 158.8 158.8 158.8___________Comprehensive income ............. $882.3______________________Dividends Declared ................... (167.2) (167.2)Amortization of stock-based
compensation......................... 117.2 117.2Shares transactions under
employee stock plans ............ (6.1) (79.7) 170.7 84.9Shares issued for acquisitions ... 0.5 4.5 5.0Purchase of treasury shares ....... (446.5) (446.5)Cancellation of shares ............... (26,980) (1.9) 1.9 —____________________ _________ ______________ ______________ ____________ ____________ ____________ ______________Balance December 31, 2004 ..... 198,636,936 $29.8 $1,824.5 $2,975.4 $(178.9) $ 268.5 $(840.6) $4,078.7____________________ _________ ______________ ______________ ____________ ____________ ____________ __________________________________ _________ ______________ ______________ ____________ ____________ ____________ ______________
The accompanying notes to the consolidated financial statements are an integral part of these statements.

F-7
OMNICOM GROUP INC. AND SUBSIDIARIESCONSOLIDATED STATEMENTS OF CASH FLOWS
Years Ended December 31,(Dollars in Millions)_____________________________________________________________________________
2004 2003 2002____________________ ____________________ ____________________
Cash Flows from Operating Activities:Net income.............................................................................................. $ 723.5 $ 631.0 $ 570.5
Adjustments to reconcile net income to net cashprovided by operating activities:
Depreciation of tangible assets .................................................. 130.4 124.4 120.0Amortization of intangible assets .............................................. 41.7 36.5 30.3Minority interests ...................................................................... 76.1 80.2 68.3Earnings of affiliates less than dividends received .................... (3.2) 0.8 3.4Net gain on investment activity.................................................. (13.1) — —Tax benefit on employee stock plans ........................................ 26.2 15.7 14.3Provisions for losses on accounts receivable ............................ 19.3 12.9 21.8Amortization of stock compensation ........................................ 117.2 133.1 173.5Changes in assets and liabilities providing (requiring)
cash net of acquisitions:(Increase) decrease in accounts receivable ................................ (219.1) (207.7) 25.6(Increase) decrease in billable production orders in process .... (83.6) (49.5) 34.0(Increase) decrease in prepaid expenses and other
current assets .......................................................................... (113.1) (116.8) 62.1Net change in other assets and liabilities .................................. 86.8 (50.6) (326.2)Increase (decrease) in advanced billings.................................... 73.7 91.8 (14.9)Net increase (decrease) in accrued and deferred taxes .............. 108.7 23.2 (35.1)Increase in accounts payable...................................................... 316.1 329.2 253.0_______________ ______________ ______________
Net Cash Provided by Operating Activities ...................................... 1,287.6 1,054.2 1,000.6_______________ ______________ ______________Cash Flows from Investing Activities:
Capital expenditures .......................................................................... (159.7) (141.1) (117.2)Payment for purchases of equity interests in
subsidiaries and affiliates, net of cash acquired ............................ (316.0) (410.0) (586.3)Purchases of long-term investments .................................................. (24.5) — —Purchases of short-term investments .................................................. (1,431.2) (301.9) (15.9)Proceeds from sales of short-term investments .................................. 1,172.5 39.0 36.3_______________ ______________ ______________
Net Cash Used in Investing Activities ................................................ (758.9) (814.0) (683.1)_______________ ______________ ______________Cash Flows From Financing Activities:
Net decrease in short-term borrowings .............................................. (25.5) (15.6) (127.7)Proceeds from issuance of debt .......................................................... 8.3 796.3 900.0Repayments of principal of long-term debt obligations .................... (15.3) (234.1) (339.9)Dividends paid .................................................................................... (163.1) (149.3) (148.4)Purchase of treasury shares ................................................................ (446.5) (25.9) (371.7)Other, net ............................................................................................ (7.9) (16.8) (32.1)_______________ ______________ ______________
Net Cash (Used In ) Provided by Financing Activities .................... (650.0) 354.6 (119.8)_______________ ______________ ______________Effect of exchange rate changes on cash and cash equivalents ........ 43.4 (18.3) (2.9)_______________ ______________ ______________
Net (Decrease) Increase in Cash and Cash Equivalents .................. (77.9) 576.5 194.8Cash and Cash Equivalents at Beginning of Year ............................ 1,243.5 667.0 472.2_______________ ______________ ______________Cash and Cash Equivalents at End of Year ...................................... $ 1,165.6 $1,243.5 $ 667.0_______________ ______________ _____________________________ ______________ ______________Supplemental Disclosures:
Income taxes paid .............................................................................. $ 267.1 $ 344.0 $ 338.7Interest paid ........................................................................................ $ 44.6 $ 56.9 $ 42.4
The accompanying notes to the consolidated financial statements are an integral part of these statements.
F-8
OMNICOM GROUP INC. AND SUBSIDIARIESNOTES TO CONSOLIDATED FINANCIAL STATEMENTS
1. Summary of Significant Accounting Policies
Principles of Consolidation. The accompanying consolidated financial statements include the accountsof Omnicom Group Inc. and its domestic and international subsidiaries. Intercompany balances and transactionshave been eliminated.
Revenue Recognition. Substantially all revenue is derived from fees for services. Additionally, we earncommissions based upon the placement of advertisements in various media. Revenue is realized when theservice is performed in accordance with the terms of each client arrangement and upon completion of theearnings process. This includes when services are rendered, upon presentation date for media, when costs areincurred for radio and television production and when print production is completed and collection is reasonablyassured.
A small portion of our contractual arrangements with clients includes performance incentive provisionswhich allow us to earn additional revenues as a result of our performance relative to both quantitative andqualitative goals. We recognize the incentive portion of revenue under these arrangements when specificquantitative goals are achieved, or when performance against qualitative goals is determined by our clients.
Our revenue recognition policies are in compliance with the Securities and Exchange Commissions(“SEC”) Staff Accounting Bulletin (“SAB”) 101, “Revenue and Recognition in Financial Statements” asupdated by SAB 104, “Revenue Recognition”. SAB 101 and 104 summarize certain of the SEC staff’s views inapplying generally accepted accounting principles to revenue recognition in financial statements. Also, in July2000, the Emerging Issues Task Force (“EITF”) of the Financial Accounting Standards Board (“FASB”)released Issue 99-19, “Reporting Revenue Gross as a Principal versus Net as an Agent”. This Issue summarizedthe EITF’s views on when revenue should be recorded at the gross amount billed because revenue has beenearned from the sale of goods or services, or the net amount retained because revenue has been earned from afee or commission. Additionally, in January 2002, the EITF released Issue 01-14, Income StatementCharacterization of Reimbursements Received for “Out-of-Pocket” Expenses Incurred. This Issue summarizedthe EITF’s views on when out-of-pocket expenses should be characterized as revenue. Our revenue recognitionpolicies are in compliance with SAB 101, SAB 104, EITF 99-19 and EITF 01-14. In the majority of ourbusinesses, we act as an agent and record revenue equal to the net amount retained, when the fee or commissionis earned.
Billable Production. Billable production orders in process consist principally of costs incurred on behalfof clients when providing advertising, marketing and corporate communications services to clients. Suchamounts are invoiced to clients at various times over the course of the production process.
Investments Available for Sale. Investments available for sale are comprised of the following twocategories of investments:
Short-term investments and time deposits with financial institutions consist principally of investmentsmade with our excess cash which we expect to convert into cash in our current operating cycle, generally withinone year. Certain of these investments mature at par with maturities longer than one year, however they are resetto par every 49 days or less, with any changes reflected in our interest income. There are no realized gains orlosses, or unrealized gains or losses from these short-term investments because market approximates cost.Therefore, they are classified as current assets.
Long-term investments are included in other assets in our balance sheet and are comprised of minorityownership interests in certain marketing and corporate communications services companies where we do notexercise significant influence over the operating and financial policies of the investee. We account for theseinvestments under the cost method. We periodically evaluate our cost-based investments to determine if therehave been any other than temporary declines in value. A variety of factors are considered when determining if adecline in market value below book value is other than temporary, including, among others, the financialcondition and prospects of the investee, as well as our investment intent.
OMNICOM GROUP INC. AND SUBSIDIARIESNOTES TO CONSOLIDATED FINANCIAL STATEMENTS (Continued)
F-9
Cost-Based Investments. Cost-based long-term investments are primarily comprised of preferred equityinterests in non-public marketing and corporate communications services companies where we do not exercisesignificant influence over the operating and financial policies of the investee. These minority interests areaccounted for under the cost method and are included in other assets in our balance sheet. These investments areperiodically evaluated to determine if there have been any other than temporary declines below book value. Avariety of factors are considered when determining if a decline in fair value below book value is other thantemporary, including, among others, the financial condition and prospects of the investee, as well as ourinvestment intent.
Equity Method Investments. The equity method is used to account for investments in entities in whichwe have an ownership of less than 50% and have significant influence over the operating and financial policiesof the affiliate. The excess of the cost of our ownership interest in the stock of those affiliates over our share ofthe fair value of their net assets at the acquisition date is recognized as goodwill and included in the carryingamount of our investment. Subsequent to the adoption of SFAS 142, equity method goodwill is not amortized.We periodically evaluate these investments to determine if there have been any other than temporary declinesbelow book value. A variety of factors are considered when determining if a decline in fair value below bookvalue is other than temporary, including, among others, the financial condition and prospects of the investee, aswell as our investment intent.
Treasury Stock. We account for treasury share purchases at cost. The reissuance of treasury shares isaccounted for at the average cost. Gains or losses on the reissuance of treasury shares are accounted for asadditional paid-in capital and do not affect reported results of operations.
Foreign Currency Translation. Our financial statements were prepared in accordance with therequirements of Statement of Financial Accounting Standards (“SFAS”) No. 52, “Foreign CurrencyTranslation”. All of our foreign subsidiaries use their local currency as their functional currency in accordancewith SFAS 52. Accordingly, the currency impacts of the translation of the balance sheets of our foreignsubsidiaries to U.S. dollar statements are included as translation adjustments in other accumulatedcomprehensive income. The income statements of foreign subsidiaries are translated at average exchange ratesfor the year. Net foreign currency transaction gains included in pre-tax income were $2.6 million in 2004,$4.7 million in 2003 and $0.6 million in 2002.
Earnings Per Common Share. Basic earnings per share is based upon the weighted average number ofcommon shares outstanding during each year. Diluted earnings per share is based on the above, plus, if dilutive,common share equivalents which include outstanding options and restricted shares. For purposes of computingdiluted earnings per share for the years ended December 31, 2004, 2003 and 2002, respectively, 863,200,297,900 and 151,000 shares were assumed to have been outstanding related to common share equivalents.Additionally, the assumed increase in net income related to the after tax compensation expense related todividends on restricted shares used in the computations was $1.3 million, $1.1 million and $1.0 million for theyears ended December 31, 2004, 2003 and 2002, respectively. The number of shares used in the computationswere as follows:
2004 2003 2002________________________ ________________________ ________________________
Basic EPS computation ............................... 185,724,200 187,258,200 186,093,600Diluted EPS computation ............................ 186,587,400 187,556,100 186,244,600
Gains and Losses on Issuance of Stock in Affiliates and Subsidiaries. Gains and losses on the issuanceof stock in equity method affiliates and consolidated subsidiaries are recognized directly in our shareholders’equity through an increase or decrease to additional paid-in capital in the period in which the sale occurs and donot affect reported results of operations.
Salary Continuation Agreements. Arrangements with certain present and former employees provide forcontinuing payments for periods up to 10 years after cessation of their full-time employment in considerationfor agreements by the employee not to compete with us and to render consulting services during the post-employment period. Such payments, the amounts of which are also subject to certain limitations, including ouroperating performance during the post-employment period, represent the fair value of the services rendered andare expensed in such periods.

OMNICOM GROUP INC. AND SUBSIDIARIESNOTES TO CONSOLIDATED FINANCIAL STATEMENTS (Continued)
F-10
Depreciation of Furniture and Equipment and Amortization of Leasehold Improvements. Depreciationcharges are computed on a straight-line basis over the estimated useful lives of furniture of seven to ten yearsand equipment of three to five years. Leasehold improvements are amortized on a straight-line basis over thelesser of the terms of the related lease or the estimated useful life of these assets.
Goodwill and Other Intangibles. In accordance with SFAS 142, “Goodwill and Other IntangibleAssets”, goodwill acquired resulting from a business combination is not amortized, but is periodically tested forimpairment. Additionally, in accordance with SFAS 141, “Business Combinations”, we allocate the cost of anacquired entity to the assets acquired and liabilities assumed based on their estimated fair values including otheridentifiable intangible assets, as applicable, primarily customer relationships and trade names. Information aboutacquisitions can be found in note 2.
Under SFAS 142, we no longer amortize goodwill and intangible assets with indefinite lives and we arerequired to perform an annual impairment test on goodwill balances and intangible assets with indefinite lives.In performing this impairment test, SFAS 142 requires that we: identify the components of our operatingsegments that are reporting units and their respective carrying value; estimate the fair value of the reportingunits; and compare the fair value to the carrying value of the reporting units to determine if there is a potentialimpairment. If there is a potential impairment, SFAS 142 requires that additional analysis be performed todetermine the amount of the impairment, if any, to be recorded.
In accordance with paragraph 30 of SFAS 142, we identified our regional reporting units as componentsof our operating segments, which are our four agency networks. The regional reporting units are responsible forthe agencies in their region. They report to the segment managers and facilitate the administrative and logisticalrequirements of our client-centric strategy for delivering services to clients in their regions. We then concludedthat for each of our operating segments, their regional reporting units had similar economic characteristics andshould be aggregated for purposes of testing goodwill for impairment at the operating segment level. Ourconclusion was based on a detailed analysis of the aggregation criteria set forth in paragraph 17 of SFAS 131and the guidance set forth in EITF D-101: Clarification of Reporting Unit Guidance in Paragraph 30 of FASBStatement No. 142. Consistent with the fundamentals of our business strategy, the agencies within our regionalreporting units serve similar clients in similar industries, and in many cases the same clients. In addition, theagencies within our regional reporting units have similar economic characteristics, as the main economiccomponents of each agency are the salary and service costs associated with providing professional services, theoffice and general costs associated with office space and occupancy, and the provision of technologyrequirements which are generally limited to personal computers, servers and off-the-shelf software. Finally, theexpected benefits of our acquisitions are typically shared across multiple agencies and regions as they worktogether to integrate the acquired agency into our client service strategy.
We perform our impairment test during the second quarter of each year. In determining the fair value ofour operating segments, we perform a discounted cash flow analysis assuming the reporting units could be soldin a nontaxable transaction between willing parties. When comparing the fair value of our reporting units totheir carrying value, we include deferred taxes in the carrying value of each of our reporting units. Weconcluded, for each year presented in the financial statements, that our goodwill was not impaired. We plan oncontinuing to perform our impairment test during the second quarter of each year unless certain events, asdefined in SFAS 142, trigger the need for an earlier evaluation for impairment.
Deferred Taxes. Deferred income taxes are provided for the temporary difference between the financialreporting basis and tax basis of our assets and liabilities. Deferred tax assets result principally from recordingcertain expenses in the financial statements which are not currently deductible for tax purposes, includingemployee stock-based compensation expense and from differences between the tax and book basis of assets andliabilities recorded in connection with acquisitions. Deferred tax liabilities result principally from non-cash,unrealized financial statement gains associated with financial instruments and investments, basis differencesarising from investments and tangible and deductible intangible assets, capital transactions and expenses whichare currently deductible for tax purposes, but have not yet been expensed in the financial statements.

OMNICOM GROUP INC. AND SUBSIDIARIESNOTES TO CONSOLIDATED FINANCIAL STATEMENTS (Continued)
F-11
Employee Stock Options. Options are accounted for in accordance with SFAS No. 123, “Accounting forStock-Based Compensation”, as amended by SFAS No. 148, “Accounting for Stock-Based Compensation —Transition and Disclosure, an amendment of FASB Statement No. 123”. We elected, effective January 1, 2004,to account for stock-based employee compensation using the fair value method. As a result, the fair value ofstock-based employee compensation, including unvested employee stock options issued and outstanding, wererecorded as an expense in the current year utilizing the retroactive restatement method as set forth in SFAS 148.Accordingly, our results for the prior years have been restated as if we had used the fair value method toaccount for stock-based employee compensation. Pre-tax stock-based employee compensation costs for theyears ended December 31, 2004, 2003, and 2002, were $117.2 million, $133.1 million and $173.5 million,respectively. Also in connection with the restatement, our December 31, 2003 balance sheet presented reflectsan increase in the deferred tax benefit of $120.5 million, an increase in additional paid-in capital of $434.7million, an increase in unamortized stock compensation of $92.6 million and a decrease in retained earnings of$221.6 million. Information about our specific awards and stock plans can be found in note 7.
In December 2004, the FASB issued SFAS No. 123 (Revised 2004) — Share-Based Payment (“SFAS123R”) which is effective for reporting periods beginning after June 15, 2005 and generally applies to grantsmade after adoption. SFAS 123R is a revision of FASB No. 123, Accounting for Stock-Based Compensation. Asa result of our adoption of SFAS 123 on January 1, 2004, we believe that the adoption of SFAS 123R will nothave a material impact on our consolidated results of operations or financial position. However, we are in theprocess of assessing the full impact of this revision.
The table below presents a reconciliation of net income and earnings per share, as reported, to the restatedresults for the years ended December 31, 2003 and 2002.
(Dollars in Millions, Except Per Share Amounts)____________________________________________________________________________________________Earnings Per Common Share__________________________
Net Income Basic Diluted______________________ ________________ ________________
As reported, year ended December 31, 2003... $675.9 $3.61 $3.59Less fair value of stock options issued,
net of taxes ................................................... 44.9 0.24 0.22___________ _________ _________Restated, year ended December 31, 2003........ $631.0 $3.37 $3.37___________ _________ ____________________ _________ _________
As reported, year ended December 31, 2002... $643.5 $3.46 $3.44Less fair value of stock options issued,
net of taxes ................................................... 73.0 0.39 0.37___________ _________ _________Restated, year ended December 31, 2002........ $570.5 $3.07 $3.07___________ _________ ____________________ _________ _________
Cash Flows. Our cash equivalents are primarily comprised of investments in overnight interest-bearingdeposits, commercial paper and money market instruments and other short-term investments with originalmaturity dates of three months or less at the time of purchase.
Concentration of Credit Risk. We provide marketing and corporate communications services tothousands of clients who operate in nearly every industry sector. We grant credit to qualified clients in theordinary course of business. Due to the diversified nature of our client base, we do not believe that we areexposed to a concentration of credit risk as our largest client accounted for 4.3% of our 2004 consolidatedrevenue and no other client accounted for more than 2.8% of our 2004 consolidated revenue.
Derivative Financial Instruments. SFAS No. 133, “Accounting for Derivative Instruments and HedgingActivities” establishes accounting and reporting standards requiring that every derivative instrument (includingcertain derivative instruments embedded in other contracts) be recorded in the balance sheet as either an asset orliability measured at its fair value.
Our derivative financial instruments consist principally of forward foreign exchange contracts and cross-currency interest rate swaps. For derivative financial instruments to qualify for hedge accounting the followingcriteria must be met: (1) the hedging instrument must be designated as a hedge; (2) the hedged exposure must
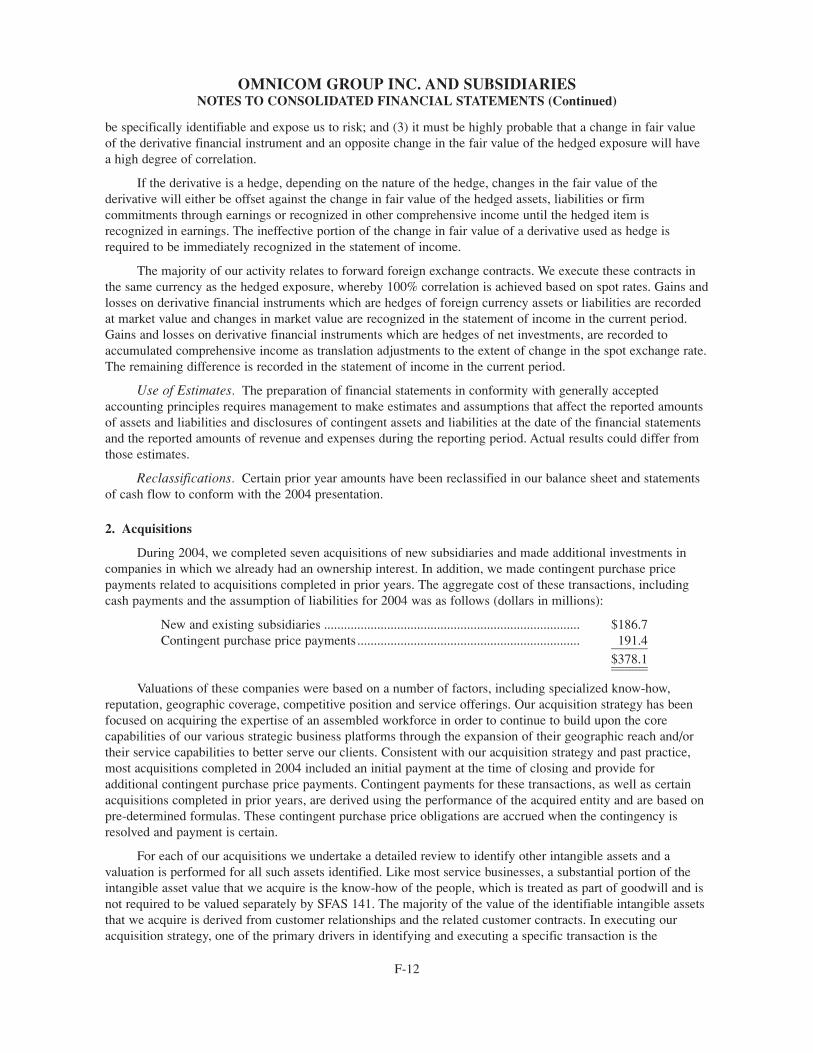
OMNICOM GROUP INC. AND SUBSIDIARIESNOTES TO CONSOLIDATED FINANCIAL STATEMENTS (Continued)
F-12
be specifically identifiable and expose us to risk; and (3) it must be highly probable that a change in fair valueof the derivative financial instrument and an opposite change in the fair value of the hedged exposure will havea high degree of correlation.
If the derivative is a hedge, depending on the nature of the hedge, changes in the fair value of thederivative will either be offset against the change in fair value of the hedged assets, liabilities or firmcommitments through earnings or recognized in other comprehensive income until the hedged item isrecognized in earnings. The ineffective portion of the change in fair value of a derivative used as hedge isrequired to be immediately recognized in the statement of income.
The majority of our activity relates to forward foreign exchange contracts. We execute these contracts inthe same currency as the hedged exposure, whereby 100% correlation is achieved based on spot rates. Gains andlosses on derivative financial instruments which are hedges of foreign currency assets or liabilities are recordedat market value and changes in market value are recognized in the statement of income in the current period.Gains and losses on derivative financial instruments which are hedges of net investments, are recorded toaccumulated comprehensive income as translation adjustments to the extent of change in the spot exchange rate.The remaining difference is recorded in the statement of income in the current period.
Use of Estimates. The preparation of financial statements in conformity with generally acceptedaccounting principles requires management to make estimates and assumptions that affect the reported amountsof assets and liabilities and disclosures of contingent assets and liabilities at the date of the financial statementsand the reported amounts of revenue and expenses during the reporting period. Actual results could differ fromthose estimates.
Reclassifications. Certain prior year amounts have been reclassified in our balance sheet and statementsof cash flow to conform with the 2004 presentation.
2. Acquisitions
During 2004, we completed seven acquisitions of new subsidiaries and made additional investments incompanies in which we already had an ownership interest. In addition, we made contingent purchase pricepayments related to acquisitions completed in prior years. The aggregate cost of these transactions, includingcash payments and the assumption of liabilities for 2004 was as follows (dollars in millions):
New and existing subsidiaries ............................................................................. $186.7Contingent purchase price payments ................................................................... 191.4___________
$378.1______________________
Valuations of these companies were based on a number of factors, including specialized know-how,reputation, geographic coverage, competitive position and service offerings. Our acquisition strategy has beenfocused on acquiring the expertise of an assembled workforce in order to continue to build upon the corecapabilities of our various strategic business platforms through the expansion of their geographic reach and/ortheir service capabilities to better serve our clients. Consistent with our acquisition strategy and past practice,most acquisitions completed in 2004 included an initial payment at the time of closing and provide foradditional contingent purchase price payments. Contingent payments for these transactions, as well as certainacquisitions completed in prior years, are derived using the performance of the acquired entity and are based onpre-determined formulas. These contingent purchase price obligations are accrued when the contingency isresolved and payment is certain.
For each of our acquisitions we undertake a detailed review to identify other intangible assets and avaluation is performed for all such assets identified. Like most service businesses, a substantial portion of theintangible asset value that we acquire is the know-how of the people, which is treated as part of goodwill and isnot required to be valued separately by SFAS 141. The majority of the value of the identifiable intangible assetsthat we acquire is derived from customer relationships and the related customer contracts. In executing ouracquisition strategy, one of the primary drivers in identifying and executing a specific transaction is the

OMNICOM GROUP INC. AND SUBSIDIARIESNOTES TO CONSOLIDATED FINANCIAL STATEMENTS (Continued)
F-13
existence of, or the ability to, expand our existing client relationships. When executing our acquisition strategy,a significant portion of an acquired company’s revenues is often derived from existing clients. The expectedbenefits of our acquisitions are typically shared across multiple agencies and regions.
As of December 31, 2004 and 2003, the components of our intangible assets were as follows:
(Dollars in Millions)______________________________________________________________________________________________________________________________________________________December 31, 2004 December 31, 2003________________________________________________________________________ _____________________________________________________________________
Gross Net Gross Net Carry Accumulated Book Carry Accumulated BookValue Amortization Value Value Amortization Value___________________ ________________________ __________________ ___________________ ________________________ __________________
Intangible assets subject toSFAS 142 impairment tests:
Goodwill .................................... $7,016.8 $605.4 $6,411.4 $6,467.0 $580.8 $5,886.2Other identifiable intangible assets
subject to amortization:Purchased and internally
developed software ................ 207.8 141.4 66.4 188.2 114.5 73.7Customer related and other ........ 66.9 23.3 43.6 61.0 13.3 47.7______________ ___________ ______________ ______________ ___________ ______________Total ............................................ $ 274.7 $164.7 $ 110.0 $ 249.2 $127.8 $ 121.4______________ ___________ ______________ ______________ ___________ ____________________________ ___________ ______________ ______________ ___________ ______________
The other identifiable intangible assets are amortized on a straight-line basis ranging from 5 to 10 years.
3. Bank Loans and Lines of Credit
Bank loans of $17.5 million and $42.4 million at December 31, 2004 and 2003, respectively, are primarilycomprised of the bank overdrafts of our international subsidiaries. These loans are treated as unsecured loanspursuant to our bank agreements. The weighted average interest rate on these bank loans as of December 31,2004 and 2003 was 5.6% and 5.2%, respectively.
At December 31, 2004 and 2003, we had committed and uncommitted lines of credit aggregating $2,401.9million and $2,468.2 million, respectively. The unused portion of these credit lines was $2,384.4 million and$2,425.8 million at December 31, 2004 and 2003, respectively. The lines of credit, including the credit facilitiesdiscussed below, are generally extended to us on terms that the banks grant to borrowers with credit ratingssimilar to ours.
On May 24, 2004, we amended and extended our existing revolving credit facilities with a consortium ofbanks, resulting in a five-year $1,500.0 million revolving credit facility which matures May 24, 2009, and a$500.0 million 364-day revolving credit facility with a maturity date of May 23, 2005. These facilities amendedour previous three-year $835.0 million and $1,200.0 million, 364-day revolving credit facilities. The 364-dayfacility continues to include a provision which allows us to convert all amounts outstanding at expiration of thefacility into a one-year term loan.
The bank consortium for our five-year and 364-day bank facilities consists of 27 banks. Citibank N.A.acts as administrative agent, ABN Amro acts as syndication agent and JPMorgan Chase Bank and HSBC BankUSA act as co-documentation agents for the facilities. Other significant lending institutions include SocieteGenerale, Bank of America, Wachovia and Sumitomo Mitsui. These facilities provide us with the ability toclassify up to $2.0 billion of our borrowings that could come due within one year as long-term debt, when it isour intention to keep the borrowings outstanding on a long-term basis.
These credit facilities provide support for our $1,500.0 million commercial paper program. The grossamount of commercial paper issued and redeemed under our commercial paper program during 2004 was $27.2billion, with an average term of 2.3 days. During 2003, $19.6 billion of commercial paper was issued andredeemed with an average term of 5.9 days. As of December 31, 2004 and 2003, we had no commercial paperborrowings outstanding.

OMNICOM GROUP INC. AND SUBSIDIARIESNOTES TO CONSOLIDATED FINANCIAL STATEMENTS (Continued)
F-14
The credit facilities contain financial covenants limiting the ratio of total consolidated indebtedness tototal consolidated EBITDA (EBITDA for purposes of this covenant being defined as earnings before interest,taxes, depreciation and amortization) to no more than 3.0 times. In addition, we are required to maintain aminimum ratio of EBITDA to interest expense of at least 5.0 times. At December 31, 2004, our ratio of debt toEBITDA was 1.9 times and our ratio of EBITDA to interest expense was 27.1 times. We were in compliancewith these covenants.
4. Long-Term Debt and Convertible Notes
Long-term debt and convertible notes outstanding as of December 31, 2004 and 2003 consisted of thefollowing:
(Dollars in Millions)_____________________________________________________2004 2003_________________ _________________
Euro 152.4 million 5.20% Euro Notes, due June 24, 2005................................................................... $ 206.6 $ 192.0
Other notes and loans at rates from 3.1% to 9.8%,due through 2010............................................................. 21.7 17.7______________ ______________
228.3 209.7Less current portion............................................................. 209.2 12.4______________ ______________
Total long-term debt ........................................................ $ 19.1 $ 197.3______________ ____________________________ ______________Convertible notes — due February 7, 2031 ........................ 847.0 $847.0Convertible notes — due July 31, 2032 .............................. 892.3 892.3Convertible notes — due June 15, 2033 ............................. 600.0 600.0______________ ______________
2,339.3 2,339.3Less current portion............................................................. — —______________ ______________
Total convertible notes..................................................... $2,339.3 $2,339.3______________ ____________________________ ______________
For the years ended December 31, 2004, 2003 and 2002, we incurred gross interest expense on ourborrowings of $51.1 million, $57.9 million and $45.5 million, respectively. Interest expense included $23.0million, $28.1 million and $2.6 million related to our convertible notes in 2004, 2003 and 2002, respectively. Inaddition, interest expense relative to our €152.4 million Euro 5.20% notes was $10.4 million, $10.3 million and$8.1 million in 2004, 2003 and 2002, respectively. The remainder of our interest expense in these years wasrelated to our short-term borrowings.
The 2004 interest expense was impacted by the amortization of a portion of the interest payments of $6.7million and $24.5 million made in August of 2003 and 2004, respectively, related to our convertible notes due2032, amortization of a portion of the interest payment of $1.5 million made in November and December of2004 related to our convertible notes due 2033 and amortization of a portion of the interest payment of $14.8million made in November 2004 related to our convertible notes due 2031. The 2003 interest expense wasimpacted by the amortization of a portion of the interest payments of $25.4 million and $6.7 million made onFebruary 21, 2003 and on August 6, 2003 to qualified noteholders of our convertible notes due 2031 and 2032,respectively.
On June 24, 1998, we issued €152.4 million 5.20% notes. The notes are senior unsecured obligations ofthe Company. Unless previously redeemed, or purchased and cancelled, the notes mature on June 24, 2005.
The $847.0 million aggregate principal amount of Liquid Yield Option notes due February 7, 2031, wereissued by us in February 2001. These notes are senior unsecured zero-coupon securities that are convertible into7.7 million common shares, implying a conversion price of $110.01 per common share, subject to normal anti-dilution adjustments. These notes are convertible at a specified ratio only upon the occurrence of certain events,including if our common shares trade above certain levels, if we effect extraordinary transactions or if our long-term debt ratings are downgraded by at least two notches from their December 31, 2004 level of A- to BBB or

OMNICOM GROUP INC. AND SUBSIDIARIESNOTES TO CONSOLIDATED FINANCIAL STATEMENTS (Continued)
F-15
lower by Standard & Poor’s Ratings Services (“S&P”), or from their December 31, 2004 level of Baa1 to Baa3or lower by Moody’s Investors Services, Inc. (“Moody’s”). These events would not, however, result in anadjustment of the number of shares issuable upon conversion. Holders of these notes have the right to put thenotes back to us for cash in February of each year, beginning in February 2006, and we have agreed not toredeem the notes for cash before February 7, 2009. There are no events that accelerate the noteholders’ putrights. Beginning in February 2006, if the market price of our common shares exceeds certain thresholds, wemay be required to pay contingent cash interest.
The $892.3 million aggregate principal amount of Zero Coupon Zero Yield Convertible Notes due July 31,2032 were issued by us in March 2002. The notes are senior unsecured zero-coupon securities that areconvertible into 8.1 million common shares, implying a conversion price of $110.01 per common share, subjectto normal anti-dilution adjustments. These notes are convertible at a specified ratio only upon the occurrence ofcertain events, including if our common shares trade above certain levels, if we effect extraordinary transactionsor if our long-term debt ratings are downgraded at least two notches from their December 31, 2004 level ofA- to BBB or lower by S&P, or from their December 31, 2004 level of Baa1 to Baa3 or lower by Moody’s.These events would not, however, result in an adjustment of the number of shares issuable upon conversion.Holders of these notes have the right to put the notes back to us for cash in August of each year and we haveagreed not to redeem the notes for cash before July 31, 2009. There are no events that accelerate thenoteholders’ put rights. Beginning in August 2007, if the market price of our common shares exceeds certainthresholds, we may be required to pay contingent cash interest.
The $600.0 million aggregate principal amount of Zero Coupon Zero Yield Convertible Notes due June15, 2033, were issued by us in June 2003. The notes are senior unsecured obligations that are convertible into5.8 million common shares, implying a conversion price of $103.00 per common share, subject to normal anti-dilution adjustments. These notes are convertible at the specified ratio only upon the occurrence of certainevents, including if our common shares trade above certain levels, if we effect extraordinary transactions or ifour long-term debt ratings are downgraded from their current level to Ba1 or lower by Moody’s or BBB- orlower by S&P. The occurrence of these events will not result in an adjustment of the number of shares issuableupon conversion. Holders of these notes have the right to put the notes back to us for cash on June 15, 2006,2008, 2010, 2013, 2018, 2023 and on each June 15 annually thereafter through June 15, 2032 and we have aright to redeem the notes for cash beginning on June 15, 2010. There are no events that accelerate thenoteholders’ put rights. Beginning in June 2010, if the market price of our common shares exceeds certainthresholds, we may be required to pay contingent cash interest.
In August 2004, we amended the indenture to the Zero Coupon Zero Yield Convertible Notes due 2032.In November 2004, we amended the indentures to the Liquid Yield Option Notes due 2031 and the ZeroCoupon Zero Yield Convertible Notes due 2033. The amendments to all three indentures were similar withrespect to settlement of the notes on put or conversion. We amended the provisions regarding payment to thenoteholders in the event of a put. Previously, we could satisfy the put obligation in cash, shares or a combinationof both, at our option. The amendments provide that we can only satisfy the put obligation in cash. We alsoamended the provisions regarding payment to the noteholders in the event the noteholders exercise theirconversion right. Previously, we were required to satisfy the conversion obligation of each note by delivering theunderlying number of shares, as adjusted, into which the note converts. The amendments provide that theconversion obligation is equal to a conversion value determined on the day of conversion, calculated bymultiplying the share price at the close of business on that day by the underlying number of shares into whichthe note converts. We then satisfy the conversion value by paying the initial principal amount of the note in cashand the balance of the conversion value in cash or shares, at our option. At the same time we amended theindenture provisions governing settlement on put or conversion, we also amended the provisions of the LiquidYield Option Notes due 2031 and the Zero Coupon Zero Yield Convertible Notes due 2032 governing thepayment of contingent cash interest.

OMNICOM GROUP INC. AND SUBSIDIARIESNOTES TO CONSOLIDATED FINANCIAL STATEMENTS (Continued)
F-16
Aggregate stated maturities of long-term debt and convertible notes are as follows:
(Dollars in Millions)__________________________________
2005....................................................................................................................... $ 209.22006....................................................................................................................... 1.12007....................................................................................................................... 0.92008....................................................................................................................... 0.52009....................................................................................................................... 0.52010....................................................................................................................... 15.9Thereafter .............................................................................................................. 2,339.5
5. Segment Reporting
Our wholly and partially owned agencies operate within the advertising, marketing and corporatecommunications services industry. These agencies are organized into agency networks, virtual client networks,regional reporting units and operating groups. Consistent with the fundamentals of our business strategy, ouragencies serve similar clients, in similar industries, and in many cases the same clients across a variety ofgeographies. In addition, our agency networks have similar economic characteristics and similar long-termoperating margins, as the main economic components of each agency are the salary and service costs associatedwith providing professional services, the office and general costs associated with office space and occupancy,and the provision of technology requirements which are generally limited to personal computers, servers andoff-the-shelf software. Therefore, given these similarities and in accordance with the provisions of SFAS 131 –Disclosures about Segments of an Enterprise and Related Information, most specifically paragraph 17, weaggregate our operating segments, which are our four agency networks, into one reporting segment.
A summary of our revenue and long-lived assets by geographic area for the years then ended, and as ofDecember 31, 2004, 2003 and 2002 is presented below:
(Dollars in Millions)______________________________________________________________________United Euro United OtherStates Denominated Kingdom International Consolidated___________ ____________ _________ ____________ ___________
2004Revenue ...................................... $5,223.4 $2,058.2 $1,085.0 $1,380.6 $9,747.2Long-Lived Assets ...................... 329.9 110.1 99.5 96.9 636.4
2003Revenue ...................................... $4,720.9 $1,789.9 $941.9 $1,168.7 $8,621.4Long-Lived Assets ...................... 309.2 98.4 95.6 93.6 596.8
2002Revenue ...................................... $4,284.6 $1,458.6 $814.1 $979.0 $7,536.3Long-Lived Assets ...................... 319.7 75.2 86.9 75.9 557.7
6. Equity and Cost Based Investments
We have investments in unconsolidated affiliated companies accounted for under the equity method. Theaffiliated companies offer marketing and corporate communications services similar to those offered by ouroperating companies. The equity method is used when we own less than 50% of the common stock but exercisesignificant influence over the operating and financial policies of the affiliate. The following table summarizesthe balance sheets and income statements of our unconsolidated affiliates, as of December 31, 2004 and 2003and for the years then ended:
(Dollars in Millions)___________________________2004 2003_________ _________
Total net assets .............................................................................. $176.4 $183.5Gross revenue................................................................................ 472.4 493.2Net income .................................................................................... 37.7 46.9

OMNICOM GROUP INC. AND SUBSIDIARIESNOTES TO CONSOLIDATED FINANCIAL STATEMENTS (Continued)
F-17
Our equity interest in the net income of these affiliated companies was $17.1 million and $15.1 million for2004 and 2003, respectively. Our equity interest in the net assets of these affiliated companies was $108.2million and $96.0 million at December 31, 2004 and 2003, respectively. Owners of interests in certain of ouraffiliated companies have the right in certain circumstances to require us to purchase additional ownershipstakes at fair value. The terms of these rights vary for each arrangement and the ultimate amount payable in thefuture also varies based upon the future earnings of the affiliated companies, changes in the applicable foreigncurrency exchange rates and the timing of when these rights are exercised.
Our cost based investments at December 31, 2004 were primarily comprised of preferred interestsrepresenting equity interests of less than 20% in various service companies. This method is used when we ownless than a 20% equity interest and do not exercise significant influence over the operating and financial policiesof the investee. The total cost basis of these investments, which are included in other assets on our balancesheet, as of December 31, 2004 and 2003 was $41.8 million and $27.1million, respectively.
At December 31, 2003, we held a non-voting, non-participating preferred stock interest in SenecaInvestments LLC (“Seneca”). Seneca was initially formed in 2001 from our contribution of Communicade, oursubsidiary that conducted e-services industry investment activities. All of Communicade’s investments at thattime were comprised of minority interests in e-services industry businesses. Upon Seneca’s formation, thetransaction was accounted for in accordance with SFAS 140, Accounting for Transfers and Servicing FinancialAssets and Extinguishments of Liabilities, and resulted in no gain or loss being recognized by us on Seneca’sformation. The preferred stock was non-voting and was entitled to dividends at a rate of 8.5%, compoundedsemi-annually and was redeemable on the 10th anniversary of issuance or earlier upon the occurrence of certainextraordinary events. No cash dividends were paid by Seneca or accrued by us subsequent to Seneca’sformation.
In December 2002, we acquired all of the common stock of Organic, Inc. from Seneca. The transactionwas effected by the redemption of $99.0 million of the preferred stock and the assumption of $7.2 million ofliabilities. In June 2003, we acquired all of the common stock of AGENCY.com from Seneca. The transactionwas effected by the redemption of $181.0 million of the preferred stock and the assumption of $15.8 million ofliabilities.
On Seneca’s formation and for all subsequent periods, the fair value of our investment in Seneca exceededits carrying value. Because our preferred stock did not have a conversion feature, we considered it similar to adebt instrument where it is not probable that the contractual interest payments may be collected as scheduled inthe loan agreement. Accordingly, we applied the cost-recovery method, in accordance with the provisions ofSFAS 114 and SFAS 118 and we did not accrue any dividend income. Under the cost-recovery method,investment income cannot be recorded until it is probable of realization. Consequently, we did not record anyinvestment income related to unpaid dividends and in connection with the purchases of Organic, Inc. andAGENCY.com from Seneca, we applied the redemption of our preferred stock against our remaining carryingvalue of our investment such that at December 31, 2003, our remaining carrying value was reduced to zero.
In March 2004, we exchanged our remaining shares of preferred stock in Seneca for a $24.0 millionsenior secured note due in 2007 that bears interest at a rate of 6.25% and 40% of Seneca’s outstanding commonstock which we are accounting for under the equity method. The senior secured note is accounted for in ourother assets. The restructuring was proposed by the common stockholders of Seneca because the expected valueof the assets that remained in Seneca in early 2004 was insufficient to fund the preferred dividends that hadaccrued to that date and were expected to accrue prior to potential realization events in the future. Therestructuring re-aligned the incentives of the common shareholders with ours because it provided them withadditional incentives to maximize the value of the Seneca assets and to monetize the assets on an acceleratedbasis. The exchange was accounted for at fair value in accordance with EITF 98-3 and we recorded a net pre-taxgain of $24.0 million.
The $24.0 million pre-tax gain, which was included in operating income, was partially offset by losses of$10.9 million from other investment activity unrelated to Seneca.
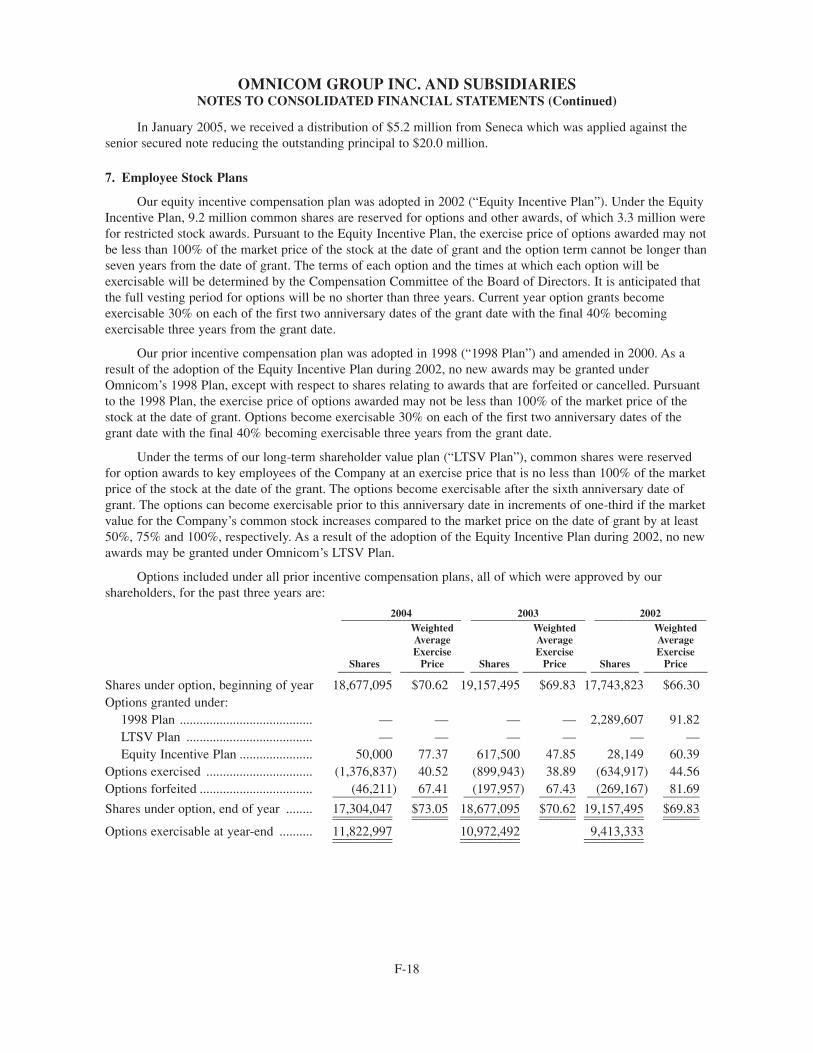
OMNICOM GROUP INC. AND SUBSIDIARIESNOTES TO CONSOLIDATED FINANCIAL STATEMENTS (Continued)
F-18
In January 2005, we received a distribution of $5.2 million from Seneca which was applied against thesenior secured note reducing the outstanding principal to $20.0 million.
7. Employee Stock Plans
Our equity incentive compensation plan was adopted in 2002 (“Equity Incentive Plan”). Under the EquityIncentive Plan, 9.2 million common shares are reserved for options and other awards, of which 3.3 million werefor restricted stock awards. Pursuant to the Equity Incentive Plan, the exercise price of options awarded may notbe less than 100% of the market price of the stock at the date of grant and the option term cannot be longer thanseven years from the date of grant. The terms of each option and the times at which each option will beexercisable will be determined by the Compensation Committee of the Board of Directors. It is anticipated thatthe full vesting period for options will be no shorter than three years. Current year option grants becomeexercisable 30% on each of the first two anniversary dates of the grant date with the final 40% becomingexercisable three years from the grant date.
Our prior incentive compensation plan was adopted in 1998 (“1998 Plan”) and amended in 2000. As aresult of the adoption of the Equity Incentive Plan during 2002, no new awards may be granted underOmnicom’s 1998 Plan, except with respect to shares relating to awards that are forfeited or cancelled. Pursuantto the 1998 Plan, the exercise price of options awarded may not be less than 100% of the market price of thestock at the date of grant. Options become exercisable 30% on each of the first two anniversary dates of thegrant date with the final 40% becoming exercisable three years from the grant date.
Under the terms of our long-term shareholder value plan (“LTSV Plan”), common shares were reservedfor option awards to key employees of the Company at an exercise price that is no less than 100% of the marketprice of the stock at the date of the grant. The options become exercisable after the sixth anniversary date ofgrant. The options can become exercisable prior to this anniversary date in increments of one-third if the marketvalue for the Company’s common stock increases compared to the market price on the date of grant by at least50%, 75% and 100%, respectively. As a result of the adoption of the Equity Incentive Plan during 2002, no newawards may be granted under Omnicom’s LTSV Plan.
Options included under all prior incentive compensation plans, all of which were approved by ourshareholders, for the past three years are:
2004 2003 2002_____________________________________________ ___________________________________________ __________________________________________Weighted Weighted WeightedAverage Average AverageExercise Exercise Exercise
Shares Price Shares Price Shares Price__________ ____________ _________ ____________ _________ ____________
Shares under option, beginning of year 18,677,095 $70.62 19,157,495 $69.83 17,743,823 $66.30Options granted under:
1998 Plan ........................................ — — — — 2,289,607 91.82LTSV Plan ...................................... — — — — — —Equity Incentive Plan ...................... 50,000 77.37 617,500 47.85 28,149 60.39
Options exercised ................................ (1,376,837) 40.52 (899,943) 38.89 (634,917) 44.56Options forfeited .................................. (46,211) 67.41 (197,957) 67.43 (269,167) 81.69__________________ ___________ _________________ ___________ _________________ ___________Shares under option, end of year ........ 17,304,047 $73.05 18,677,095 $70.62 19,157,495 $69.83__________________ ___________ __________________ ___________ __________________ _____________________________ ___________ __________________ ___________ __________________ ___________Options exercisable at year-end .......... 11,822,997 10,972,492 9,413,333__________________ __________________ ____________________________________ __________________ __________________

OMNICOM GROUP INC. AND SUBSIDIARIESNOTES TO CONSOLIDATED FINANCIAL STATEMENTS (Continued)
F-19
OMNICOM GROUP INC. AND SUBSIDIARIESNOTES TO CONSOLIDATED FINANCIAL STATEMENTS (Continued)
The following table summarizes the information above about options outstanding and options exercisableat December 31, 2004:
Options Outstanding Options Exercisable_______________________________________________ ____________________________Weighted Average
Range of Exercise Options Remaining Weighted Average Options Weighted AveragePrices (in dollars) Outstanding Contractual Life Exercise Price Exercisable Exercise Price___________________ ___________ ______________ ______________ __________ ______________
$12.94 to 26.27 140,361 1 year $12.97 140,361 $12.9719.72 200,000 1-2 years 19.72 200,000 19.7224.28 250,000 2-3 years 24.28 250,000 24.2839.75 to 66.40 597,100 3-4 years 43.17 597,100 43.1744.62 to 91.22 2,468,871 4-5 years 78.61 2,457,609 78.6947.74 to 84.00 2,745,600 5-6 years 72.33 2,313,500 76.9162.35 to 87.16 8,727,808 6-7 years 72.65 4,508,270 76.4185.84 to 93.55 2,174,307 7-8 years 91.84 1,356,307 91.81 _________ ________
17,304,047 11,822,997_________ __________________ _________
The weighted average fair value, calculated on the basis summarized below, of each option granted was$20.65, $9.87, and $28.01 for 2004, 2003 and 2002, respectively. The fair value of each option grant has beendetermined as of the date of grant using the Black-Scholes option valuation model and with the followingassumptions (without adjusting for the risk of forfeiture and lack of liquidity):
2004 2003 2002________________________________ ________________________________ ________________________________
Expected option lives......................... 3.5 years 3.5 years 5 yearsRisk free interest rate ......................... 2.2% - 3.4% 2.1% 2.4% - 4.7%Expected volatility ............................. 33.4% - 36.2% 29.00% 28.20% - 35.30%Dividend yield.................................... 1.1% - 1.2% 1.7% 0.9% - 1.3%
Restricted Shares. Changes in outstanding shares of restricted stock for the three years ended December31, 2004 were as follows:
2004 2003 2002___________________ ___________________ ___________________
Restricted shares at beginning of year................ 2,369,348 2,070,844 2,227,022Number granted .............................................. 1,078,230 1,093,128 769,964Number vested ................................................ (900,454) (708,719) (806,626)Number forfeited ............................................ (134,711) (85,905) (119,516)________________ ________________ ________________
Restricted shares at end of year.......................... 2,412,413 2,369,348 2,070,844________________ ________________ ________________________________ ________________ ________________
All restricted shares were sold at a price per share equal to their par value. The difference between parvalue and market value on the date of the grant is charged to shareholders’ equity and then amortized to expenseover the period of restriction. The restricted shares typically vest in 20% annual increments provided theemployee remains in our employ.
Restricted shares may not be sold, transferred, pledged or otherwise encumbered until the forfeiturerestrictions lapse. Under most circumstances, the employee must resell the shares to us at par value if theemployee ceases employment prior to the end of the period of restriction.
ESPP. We have an employee stock purchase plan that enables employees to purchase our common stockthrough payroll deductions over each plan quarter at 85% of the market price on the last trading day of the planquarter. Purchases are limited to 10% of eligible compensation as defined by ERISA. During 2004, 2003 and2002, employees purchased 288,181 shares, 315,566 shares and 349,181 shares, respectively, all of which weretreasury shares, for which $19.0 million, $18.1 million and $22.5 million, respectively, was paid to us. For thisplan, 1,349,224 shares remain reserved at December 31, 2004.
Total pre-tax stock-based employee compensation costs for the years ended December 31, 2004, 2003 and2002, were $117.2 million, $133.1 million and $173.5 million, respectively.
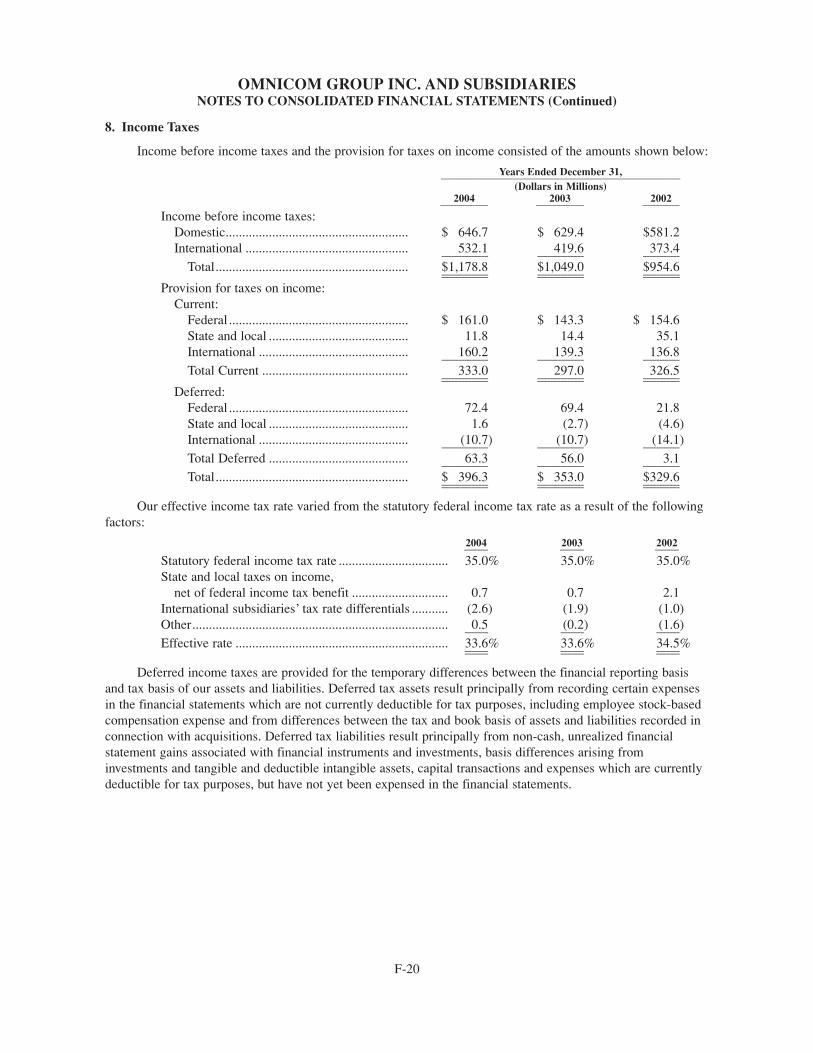
OMNICOM GROUP INC. AND SUBSIDIARIESNOTES TO CONSOLIDATED FINANCIAL STATEMENTS (Continued)
F-20
8. Income Taxes
Income before income taxes and the provision for taxes on income consisted of the amounts shown below:
Years Ended December 31,__________________________________________________________________________________________(Dollars in Millions)
2004 2003 2002__________________ __________________ ______________
Income before income taxes:Domestic....................................................... $ 646.7 $ 629.4 $581.2International ................................................. 532.1 419.6 373.4______________ ______________ ___________
Total.......................................................... $1,178.8 $1,049.0 $954.6______________ ______________ _________________________ ______________ ___________Provision for taxes on income:
Current:Federal ...................................................... $ 161.0 $ 143.3 $ 154.6State and local .......................................... 11.8 14.4 35.1International ............................................. 160.2 139.3 136.8______________ ______________ ___________Total Current ............................................ 333.0 297.0 326.5______________ ______________ _________________________ ______________ ___________
Deferred:Federal ...................................................... 72.4 69.4 21.8State and local .......................................... 1.6 (2.7) (4.6)International ............................................. (10.7) (10.7) (14.1)______________ ______________ ___________Total Deferred .......................................... 63.3 56.0 3.1______________ ______________ ___________Total.......................................................... $ 396.3 $ 353.0 $329.6______________ ______________ _________________________ ______________ ___________
Our effective income tax rate varied from the statutory federal income tax rate as a result of the followingfactors:
2004 2003 2002_________ _________ _________
Statutory federal income tax rate ................................. 35.0% 35.0% 35.0%State and local taxes on income,
net of federal income tax benefit ............................. 0.7 0.7 2.1International subsidiaries’ tax rate differentials ........... (2.6) (1.9) (1.0)Other............................................................................. 0.5 (0.2) (1.6)_______ _______ _______Effective rate ................................................................ 33.6% 33.6% 34.5%_______ _______ ______________ _______ _______
Deferred income taxes are provided for the temporary differences between the financial reporting basisand tax basis of our assets and liabilities. Deferred tax assets result principally from recording certain expensesin the financial statements which are not currently deductible for tax purposes, including employee stock-basedcompensation expense and from differences between the tax and book basis of assets and liabilities recorded inconnection with acquisitions. Deferred tax liabilities result principally from non-cash, unrealized financialstatement gains associated with financial instruments and investments, basis differences arising frominvestments and tangible and deductible intangible assets, capital transactions and expenses which are currentlydeductible for tax purposes, but have not yet been expensed in the financial statements.

OMNICOM GROUP INC. AND SUBSIDIARIESNOTES TO CONSOLIDATED FINANCIAL STATEMENTS (Continued)
F-21
Deferred tax assets and liabilities as of December 31, 2004 and 2003 consisted of the amounts shownbelow (dollars in millions):
2004 2003____________ ____________Deferred tax assets:
Compensation and severance .................................................... $271.4 $240.4Tax loss carryforwards .............................................................. 98.5 116.8Basis differences arising from acquisitions .............................. 83.6 71.3Basis differences from short term assets and liabilities............ 28.4 25.3Other.......................................................................................... 3.5 —___________ ___________
Total deferred tax assets................................................................ 485.4 453.8Valuation allowance .................................................................. (75.3) (84.3)___________ ___________
Total deferred tax assets net of valuation allowance .................... $410.1 $369.5___________ ______________________ ___________Deferred tax liabilities:
Financial instruments ................................................................ 155.6 109.9Basis differences arising from tangible and deductible
intangible assets .................................................................... 96.4 42.4Basis differences arising from investments and
capital transactions................................................................ 65.4 45.7Other.......................................................................................... — 6.1___________ ___________
Total deferred tax liabilities .......................................................... $317.4 $204.1___________ ______________________ ___________
Net current deferred tax assets as of December 31, 2004 and 2003 were $106.7 million and $104.8million, respectively, and were included in prepaid expenses and other current assets. At December 31, 2004, wehad non-current deferred tax assets of $303.4 million and long-term deferred tax liabilities of $317.4 millionand at December 31, 2003, we had non-current deferred tax assets of $264.7 million and long-term deferred taxliabilities of $204.1 million. We have concluded that it is more likely than not that we will be able to realize ourdeferred tax assets in future periods.
A provision has been made for income and withholding taxes on the earnings of international subsidiariesand affiliates that will be distributed.
9. Employee Retirement Plans
Our international and domestic subsidiaries provide retirement benefits for their employees primarilythrough defined contribution plans. Company contributions to the plans, which are determined by the boards ofdirectors of the subsidiaries, have generally been in amounts up to 15% (the maximum amount deductible forU.S. federal income tax purposes) of total eligible compensation of participating employees. Expenses related tothe Company’s contributions to these plans in 2004 were $82.6 million, in 2003 were $65.3 million and in 2002were $63.8 million.
Our pension plans are primarily related to non-U.S. businesses. These plans are not subject to theEmployee Retirement Income Security Act of 1974. Substantially all of these plans are funded by fixedpremium payments to insurance companies which undertake to provide specific benefits to the individualscovered. Pension expense recorded for these plans in 2004 was $10.3 million, in 2003 was $7.3 million and in2002 was $12.4 million.
Certain of our subsidiaries have executive retirement programs under which benefits will be paid toparticipants or to their beneficiaries over periods up to 15 years beginning after cessation of full-timeemployment, at age 65 or death. In addition, other subsidiaries have individual deferred compensationarrangements with certain executives which provide for payments over varying terms upon retirement, cessationof employment or death. The costs related to these benefits, which are accrued during the employee’s service
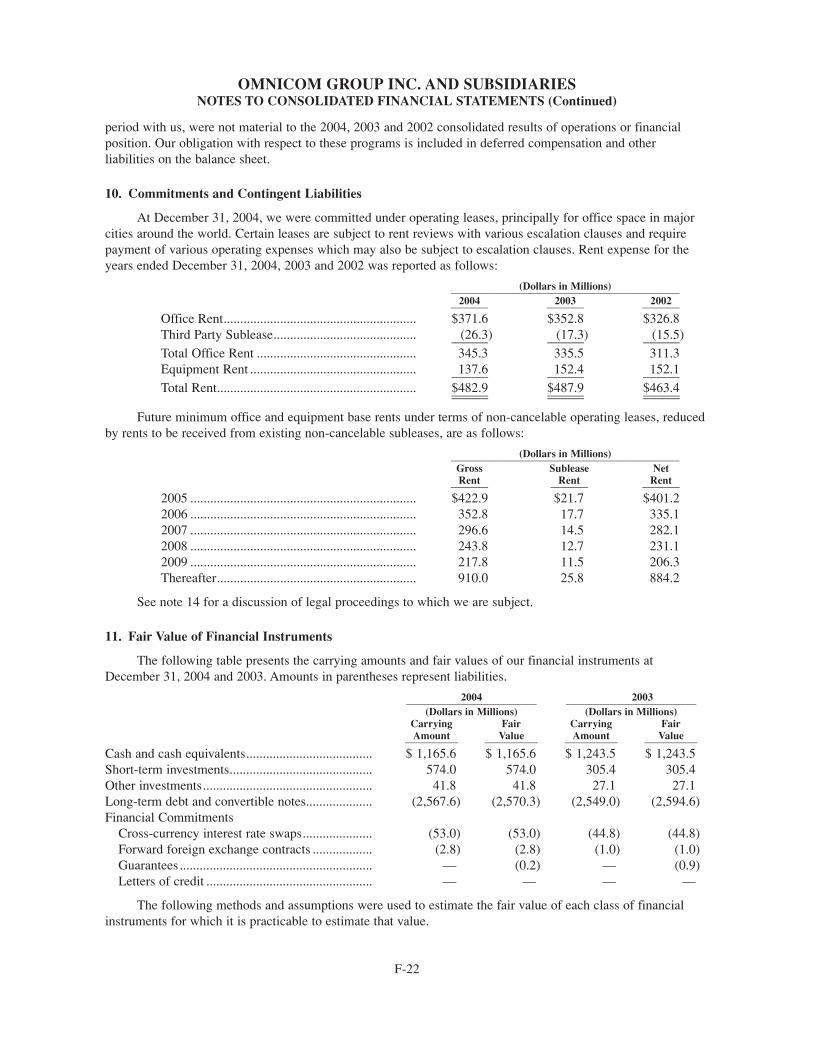
OMNICOM GROUP INC. AND SUBSIDIARIESNOTES TO CONSOLIDATED FINANCIAL STATEMENTS (Continued)
period with us, were not material to the 2004, 2003 and 2002 consolidated results of operations or financialposition. Our obligation with respect to these programs is included in deferred compensation and otherliabilities on the balance sheet.
10. Commitments and Contingent Liabilities
At December 31, 2004, we were committed under operating leases, principally for office space in majorcities around the world. Certain leases are subject to rent reviews with various escalation clauses and requirepayment of various operating expenses which may also be subject to escalation clauses. Rent expense for theyears ended December 31, 2004, 2003 and 2002 was reported as follows:
(Dollars in Millions)______________________________________________________________________________________2004 2003 2002______________ ______________ ______________
Office Rent.......................................................... $371.6 $352.8 $326.8Third Party Sublease........................................... (26.3) (17.3) (15.5)___________ ___________ ___________Total Office Rent ................................................ 345.3 335.5 311.3Equipment Rent .................................................. 137.6 152.4 152.1___________ ___________ ___________Total Rent............................................................ $482.9 $487.9 $463.4___________ ___________ ______________________ ___________ ___________
Future minimum office and equipment base rents under terms of non-cancelable operating leases, reducedby rents to be received from existing non-cancelable subleases, are as follows:
(Dollars in Millions)______________________________________________________________________________________Gross Sublease NetRent Rent Rent______________ ______________ ______________
2005 .................................................................... $422.9 $21.7 $401.22006 .................................................................... 352.8 17.7 335.12007 .................................................................... 296.6 14.5 282.12008 .................................................................... 243.8 12.7 231.12009 .................................................................... 217.8 11.5 206.3Thereafter............................................................ 910.0 25.8 884.2
See note 14 for a discussion of legal proceedings to which we are subject.
11. Fair Value of Financial Instruments
The following table presents the carrying amounts and fair values of our financial instruments atDecember 31, 2004 and 2003. Amounts in parentheses represent liabilities.
2004 2003_________________________________________________ _________________________________________________(Dollars in Millions) (Dollars in Millions)
Carrying Fair Carrying FairAmount Value Amount Value__________ __________ __________ __________
Cash and cash equivalents...................................... $ 1,165.6 $ 1,165.6 $ 1,243.5 $ 1,243.5Short-term investments........................................... 574.0 574.0 305.4 305.4Other investments................................................... 41.8 41.8 27.1 27.1Long-term debt and convertible notes.................... (2,567.6) (2,570.3) (2,549.0) (2,594.6)Financial Commitments
Cross-currency interest rate swaps..................... (53.0) (53.0) (44.8) (44.8)Forward foreign exchange contracts .................. (2.8) (2.8) (1.0) (1.0)Guarantees .......................................................... — (0.2) — (0.9)Letters of credit .................................................. — — — —
The following methods and assumptions were used to estimate the fair value of each class of financialinstruments for which it is practicable to estimate that value.
F-22

OMNICOM GROUP INC. AND SUBSIDIARIESNOTES TO CONSOLIDATED FINANCIAL STATEMENTS (Continued)
Short-term investments:
Short-term investments consist primarily of investments made with our excess cash which we expect toconvert into cash in our current operating cycle, generally within one year. They are carried at market whichapproximates cost.
Other investments:
Other investments are carried at cost, which approximates fair value. Refer to note 6 for additionalinformation about these investments.
Long-term debt and convertible notes:
A portion of our long-term debt includes floating rate debt, the carrying value of which approximates fairvalue. Our long-term debt also includes convertible notes and fixed rate debt. The fair value of these instrumentswas determined by reference to quotations available in markets where these instruments are traded.
Financial commitments:
The estimated fair values of derivative positions in cross-currency interest rate swaps and forward foreignexchange contracts are based upon quotations received from independent, third party banks and represent thenet amount required to terminate the positions, taking into consideration market rates and counterparty creditrisk. The fair values of guarantees and letters of credit are based upon the stated value of the underlyinginstruments. The guarantees, which relate to real estate leases, were issued by us for affiliated companies.Letters of credit, when issued, represent guarantees issued by us on behalf of our operating companies foractivities in the normal course of business.
12. Financial Instruments and Market Risk
Statement Financial Accounting Standard (SFAS) No. 133, “Accounting for Derivative Instruments andHedging Activities” establishes accounting and reporting standards requiring that derivative instruments whichmeet the SFAS 133 definition of a derivative (including certain derivative instruments embedded in othercontracts) be recorded in the balance sheet as either an asset or liability measured at its fair value.
Derivatives that do not qualify for hedge accounting must be adjusted to fair value through earnings. If thederivative is a hedge, depending on the nature of the hedge, changes in the fair value of derivatives will either beoffset against the change in fair value of the hedged assets, liabilities or firm commitments through earnings orrecognized in other comprehensive income until the hedged item is recognized in earnings. The ineffectiveportion of the change in fair value of a derivative used as a hedge is required to be immediately recognized inour statement of income.
Our derivative activities are confined to risk management activities related to our international operations.We enter into short-term forward foreign exchange contracts which hedge our intercompany cash movementsbetween subsidiaries operating in different currency markets from that of our treasury centers from which theyborrow or invest. In the limited number of instances where operating expenses and revenues are notdenominated in the same currency, amounts are promptly settled or hedged in the foreign currency market withforward contracts. Changes in market value of the forward contracts are included in the income statement andare offset by the corresponding change in value of the underlying asset or liability being hedged. The terms ofthese contracts are generally 90 days or less. At December 31, 2004 and 2003, the aggregate amount ofintercompany receivables and payables subject to this hedge program was $1,453.0 million and $1,251.0million, respectively. The table below summarizes by major currency the notional principal amounts of theCompany’s forward foreign exchange contracts outstanding at December 31, 2004 and 2003. The “buy”
F-23

OMNICOM GROUP INC. AND SUBSIDIARIESNOTES TO CONSOLIDATED FINANCIAL STATEMENTS (Continued)
amounts represent the U.S. dollar equivalent of commitments to purchase the respective currency, and the “sell”amounts represent the U.S. dollar equivalent of commitments to sell the respective currency. Refer to note 11for a discussion of the value of these instruments.
(Dollars in Millions)Notional Principal Amount_____________________________________________________
2004 2003______________________________________________ ______________________________________________Company Company Company Company
Buys Sells Buys Sells________ ________ ________ ________U.S. Dollar ................................................ $ 51.2 $ 36.0 $ 41.2 $103.9British Pound ............................................ 551.1 125.9 460.1 160.8Euro........................................................... 36.0 498.8 8.1 273.5Japanese Yen ............................................. 79.0 3.7 74.7 —Other.......................................................... 8.2 63.1 41.2 87.6___________ ___________ ___________ ___________Total........................................................... $725.5 $727.5 $625.3 $625.8___________ ___________ ___________ ______________________ ___________ ___________ ___________
At December 31, 2004 and 2003, we had Japanese Yen 19.1 billion aggregate notional principal amount ofcross-currency interest rate swaps which mature in 2005. The swaps effectively hedge our net investment inJapanese Yen denominated assets.
We have established a centralized reporting system to evaluate the effects of changes in interest rates,currency exchange rates and other relevant market risks. We periodically determine the potential loss frommarket risk by performing a value-at-risk computation. Value-at-risk analysis is a statistical model that utilizeshistoric currency exchange and interest rate data to measure the potential impact on future earnings of ourexisting portfolio of derivative financial instruments. The value-at-risk analysis we performed on our December31, 2004 portfolio of derivative financial instruments indicated that the risk of loss was immaterial.Counterparty risk arises from the inability of a counterparty to meet its obligations. To mitigate counterpartyrisk, we entered into derivative contracts with major well-known banks and financial institutions that have creditratings at least equal to our credit rating. This system is designed to enable us to initiate remedial action, ifappropriate.
The foreign currency and yen swap contracts existing during the years ended December 31, 2004 and2003 were entered into for the purpose of hedging certain specific currency risks. As a result of these financialinstruments, we reduced financial risk in exchange for foregoing any gain (reward) that might have occurred ifthe markets moved favorably. In using these contracts, management exchanged the risks of the financial marketsfor counterparty risk. To minimize counterparty risk, we only enter into these contracts with major well-knownbanks and financial institutions that have credit ratings equal to or better than our credit rating.
13. New Accounting Pronouncements
The following pronouncements were either issued by the FASB or adopted by us in 2002, 2003 and 2004,and impact our financial statements as discussed below: Statement of Financial Accounting Standards No. 142,Goodwill and Other Intangible Assets (SFAS 142); Statement of Financial Accounting Standards No. 143,Accounting for Asset Retirement Obligations (SFAS 143); Statements of Financial Accounting Standards No.144, Accounting for the Impairment or Disposal of Long-Lived Assets (SFAS 144); Statement of FinancialAccounting Standards No. 146, Accounting for Costs Associated with Exit or Disposal Activities (SFAS 146);Statement of Financial Accounting Standards No. 123, Accounting for Stock-Based Compensation (SFAS 123),as amended by SFAS 148, Accounting for Stock-Based Compensation — Transition and Disclosure — AnAmendment of FASB No. 123 (SFAS 148) and as subsequently revised by SFAS No. 123 (Revised 2004) —Share Based Payment (SFAS 123R); Statement of Financial Accounting Standards No. 150, Accounting forCertain Financial Instruments with Characteristics of Both Liabilities and Equity (SFAS 150) and Statement ofFinancial Accounting Standards No. 153, Exchanges of Nonmonetary Assets, an Amendment of APB OpinionNo. 29 (SFAS 153).
F-24

OMNICOM GROUP INC. AND SUBSIDIARIESNOTES TO CONSOLIDATED FINANCIAL STATEMENTS (Continued)
SFAS 142 addresses the financial accounting and reporting for acquired goodwill and other intangibleassets. SFAS 142 supersedes APB Opinion No. 17, Intangible Assets. Effective January 1, 2002, companies areno longer required to amortize goodwill and other intangibles that have indefinite lives, but these assets will besubject to periodic testing for impairment. Additionally, goodwill acquired in a business combination for whichthe acquisition date was after June 30, 2001 is no longer required to be amortized. We adopted SFAS 142effective January 1, 2002. We completed the initial impairment test during the second quarter of 2002 andsubsequent impairment tests at the end of the second quarters of 2003 and 2004, and concluded that there wasno impairment at any of these dates. The results of the impairment testing did not impact our results ofoperations or financial position.
SFAS 144 establishes a single accounting model for the impairment or disposal of long-lived assets,including discontinued operations. Effective January 1, 2002, we adopted SFAS 144. The adoption did not resultin an impairment charge.
SFAS 146 requires costs associated with exit or disposal activities be recognized and measured initially atfair value only when the liability is incurred. SFAS 146 is effective for exit or disposal costs that are initiatedafter December 31, 2002. We adopted SFAS 146 effective January 1, 2003. The adoption did not have a materialimpact on our consolidated results of operations or financial position.
In accordance with SFAS No. 123, as amended by SFAS No. 148, we elected, effective January 1, 2004,to account for stock-based employee compensation using the fair value method. As a result, the fair value ofstock-based employee compensation, including unvested employee stock options issued and outstanding, wererecorded as an expense in the current year utilizing the retroactive restatement method as set forth in SFAS 148.Accordingly, our results for the prior years have been restated as if we had used the fair value method toaccount for stock-based employee compensation. Pre-tax stock-based employee compensation costs for theyears ended December 31, 2004, 2003 and 2002, were $117.2 million, $133.1 million and $173.5 million,respectively. Also in connection with the restatement, our December 31, 2003 balance sheet reflects an increasein deferred tax benefits of $120.5 million, an increase in additional paid-in capital of $434.7 million, an increasein unamortized stock compensation of $92.6 million and a decrease in retained earnings of $221.6 million.
In December 2004, the FASB issued SFAS No. 123R which is effective for reporting periods beginningafter June 15, 2005 and generally applies to grants made after adoptions. SFAS 123R is a revision of FASB No.123, Accounting for Stock-Based Compensation. As a result of our adoption of SFAS 123 on January 1, 2004,we believe that the adoption of SFAS 123R will not have a material impact on our consolidated results ofoperations or financial position. However, we are in the process of assessing the full impact of this revision.
SFAS 150 establishes standards for how an issuer classifies and measures certain financial instrumentswith characteristics of both liabilities and equity. It requires that an issuer classify a financial instrument that iswithin its scope as a liability (or as an asset in some circumstances). We adopted the standard, as modified byFSP 150-3, in the third quarter of 2003. The adoption did not have an impact on, or result in additionaldisclosure in, our consolidated results of operations or financial position.
SFAS 153 amends APB Opinion No. 29, Accounting for Nonmonetary Transactions, to eliminate theexception from having to apply from the fair value accounting provisions of APB 29 for non-monetaryexchanges of similar productive assets and replaces it with a general exception for exchanges of non-monetaryassets that do not have commercial substance. SFAS 153 is effective for the first reporting period beginningafter June 15, 2005. We are in the process of assessing the full impact; however, we believe that the adoption ofSFAS 153 will not have a material impact on our consolidated results of operations or financial position.
The FASB issued two staff proposals on accounting for income taxes to address recent changes enacted bythe United States Congress. Proposed Staff Position FAS 109-a, Application of FASB Statement No. 109,Accounting for Income Taxes, for the Tax Deduction Provided to U.S. Based Manufacturers by the AmericanJobs Creation Act of 2004, and Proposed Staff Position FAS 109-b, Accounting and Disclosure Guidance for theForeign Earnings Repatriation Provisions within the American Jobs Creation Act of 2004. We believe that
F-25

OMNICOM GROUP INC. AND SUBSIDIARIESNOTES TO CONSOLIDATED FINANCIAL STATEMENTS (Continued)
Proposed Staff Position FAS 109-a does not apply to our business and we are currently assessing the impact ofProposed Staff Position FAS 109-b; however, we do not believe it will have a material impact on ourconsolidated results of operations or financial position.
The following FASB Interpretations (“FINs”) were issued in 2002, 2003 and 2004: FIN No. 45,Guarantor’s Accounting and Disclosure Requirements for Guarantees, Including Guarantees of Indebtedness ofOthers — an Interpretation of FASB Statements No. 5, 57 and 107 and Rescission of FASB Interpretation No.34; and FIN 46, Consolidation of Variable Interest Entities — An Interpretation of ARB No. 51.
FIN 45 sets forth the disclosures to be made by a guarantor in its interim and annual financial statementsabout its obligations under guarantees issued. FIN 45, which was effective for periods ending after December15, 2002, also clarifies that a guarantor is required to recognize, at inception of a guarantee, a liability for thefair value of the obligation undertaken. The application of FIN 45 did not have an impact on, or result inadditional disclosure in, our consolidated results of operations or financial position.
FIN 46 addresses the consolidation by business enterprises of variable interest entities, as defined in FIN46, and is based on the concept that companies that control another entity through interests, other than votinginterests, should consolidate the controlled entity. The consolidation requirements apply immediately to FIN 46interests held in variable interest entities created after January 31, 2003 and to interests held in variable interestentities that existed prior to February 1, 2003 and remain in existence as of July 1, 2003. The FASBsubsequently issued FIN 46R in December 2003 which modified certain provisions of FIN 46. The effectivedate of FIN 46R applies to the first reporting period after March 15, 2004. The application of FIN 46 asoriginally issued and as revised by the issuance of FIN 46R did not have an impact on, or result in additionaldisclosure in, our consolidated results of operations or financial position.
The Emerging Issues Task Force (“EITF”) of the FASB released interpretive guidance in 2002, 2003 and2004 covering several topics that impact our financial statements. These topics include revenue arrangementswith multiple deliverables (EITF 00-21), customer relationship intangible assets acquired (EITF 02-17), vendorrebates (EITF 02-16), participating securities and the two-class method (EITF 03-6) and the effect ofcontingently convertible debt on diluted earnings per share (EITF 04-8). The application of this guidance did nothave a material impact on our consolidated results of operations or financial position.
14. Legal Proceedings
Beginning on June 13, 2002, several proposed class actions were filed against us and certain seniorexecutives in the United States District Court for the Southern District of New York. The actions have sincebeen consolidated under the caption In re Omnicom Group Inc. Securities Litigation, No. 02-CV4483 (RCC) onbehalf of a proposed class of purchasers of our common stock between February 20, 2001 and June 11, 2002.The consolidated complaint alleges among other things that our public filings and other public statementsduring that period contained false and misleading statements or omitted to state material information relating to(1) our calculation of the organic growth component of period-to-period revenue growth, (2) our valuation ofcertain internet investments, made by our Communicade Group, which we contributed to Seneca InvestmentsLLC in 2001, and (3) the existence and amount of certain contingent future obligations in respect ofacquisitions. The complaint seeks an unspecified amount of compensatory damages plus costs and attorneys’fees. Defendants have moved to dismiss the complaint. The court has not yet decided the motion. On February18, 2005, another shareholder filed on action asserting similar claims. No response is yet required.
In addition to the proceedings described above, a shareholder derivative action was filed in New YorkState Court on June 28, 2002 by a plaintiff shareholder, purportedly on the company’s behalf against certainformer and current directors. The complaint alleges, among other things, breaches of fiduciary duty, disclosurefailures, abuse of control and gross mismanagement in connection with the formation of Seneca InvestmentsLLC, including as a result of open-market sales of our common shares by our chairman and two formeremployee directors. The complaint seeks the imposition of a constructive trust on profits received in the stock
F-26

OMNICOM GROUP INC. AND SUBSIDIARIESNOTES TO CONSOLIDATED FINANCIAL STATEMENTS (Continued)
sales, an unspecified amount of money damages and attorneys’ fees and other costs. A motion has been filed todismiss this action. Subsequently, the parties and the court agreed to stay further proceedings in this casepending additional developments in the class action cases described above.
The defendants in these cases expect to defend them vigorously. Currently, we are unable to determine theoutcome of these cases and the effect on our financial position or results of operations. The outcome of any ofthese matters is inherently uncertain and may be affected by future events. Accordingly, there can be noassurance as to the ultimate effect of these matters.
We are also involved from time to time in various legal proceedings in the ordinary course of business. Wedo not presently expect that these proceedings will have a material adverse effect on our consolidated financialposition or results of operations.
F-27

OMNICOM GROUP INC. AND SUBSIDIARIESQuarterly Results of Operations (Unaudited)
The following table sets forth a summary of the Company’s unaudited quarterly results of operations forthe years ended December 31, 2004 and 2003, in millions of dollars except for per share amounts.
Quarter___________________________________________________________________________________________________________First Second Third Fourth_________ _________ _________ _________
Revenue2004.................................................................... $2,231.4 $2,407.8 $2,319.0 $2,789.02003.................................................................... 1,937.2 2,149.5 2,028.6 2,506.0
Income Before Income Taxes2004.................................................................... 218.9 336.4 238.6 384.92003.................................................................... 193.9 306.4 205.6 343.1
Income Taxes2004.................................................................... 73.6 113.1 80.3 129.42003.................................................................... 67.1 104.0 68.9 113.2
Income After Income Taxes2004.................................................................... 145.3 223.3 158.3 255.52003.................................................................... 126.8 202.4 136.7 229.9
Equity in Earning of Affiliates2004.................................................................... 2.5 4.9 3.2 6.62003.................................................................... 2.5 1.9 4.0 6.8
Minority Interests2004.................................................................... (12.2) (22.1) (16.2) (25.6)2003.................................................................... (13.8) (24.3) (16.1) (26.0)
Net Income2004.................................................................... 135.6 206.1 145.3 236.52003.................................................................... 115.5 180.0 124.6 210.7
Basic Net Income Per Share2004.................................................................... 0.72 1.10 0.79 1.282003.................................................................... 0.62 0.96 0.66 1.12
Diluted Net Income Per Share2004.................................................................... 0.72 1.10 0.79 1.282003.................................................................... 0.62 0.96 0.66 1.12
F-28

S-1
Schedule IIOMNICOM GROUP INC. AND SUBSIDIARIES
SCHEDULE II — VALUATION AND QUALIFYING ACCOUNTS
For the Three Years Ended December 31, 2004(Dollars in Millions)
Column A Column B Column C Column D Column E
TranslationBalance at Charged Removal of Adjustments BalanceBeginning to Costs Uncollectable (increase) at End of
Description of Period and Expenses Receivables (1) decrease Period
Valuation accounts deducted fromAssets to which they apply —Allowance for doubtful accounts:
December 31, 2004 .................................. $69.7 $19.3 $24.0 $(2.8) $67.8
December 31, 2003 .................................. 75.6 12.9 24.6 (5.8) 69.7
December 31, 2002 .................................. 79.2 21.8 30.1 (4.7) 75.6
(1) Net of acquisition date balances in allowance for doubtful accounts of companies acquired of $0.1 million,$0.6 million and $2.0 million in 2004, 2003 and 2002, respectively.
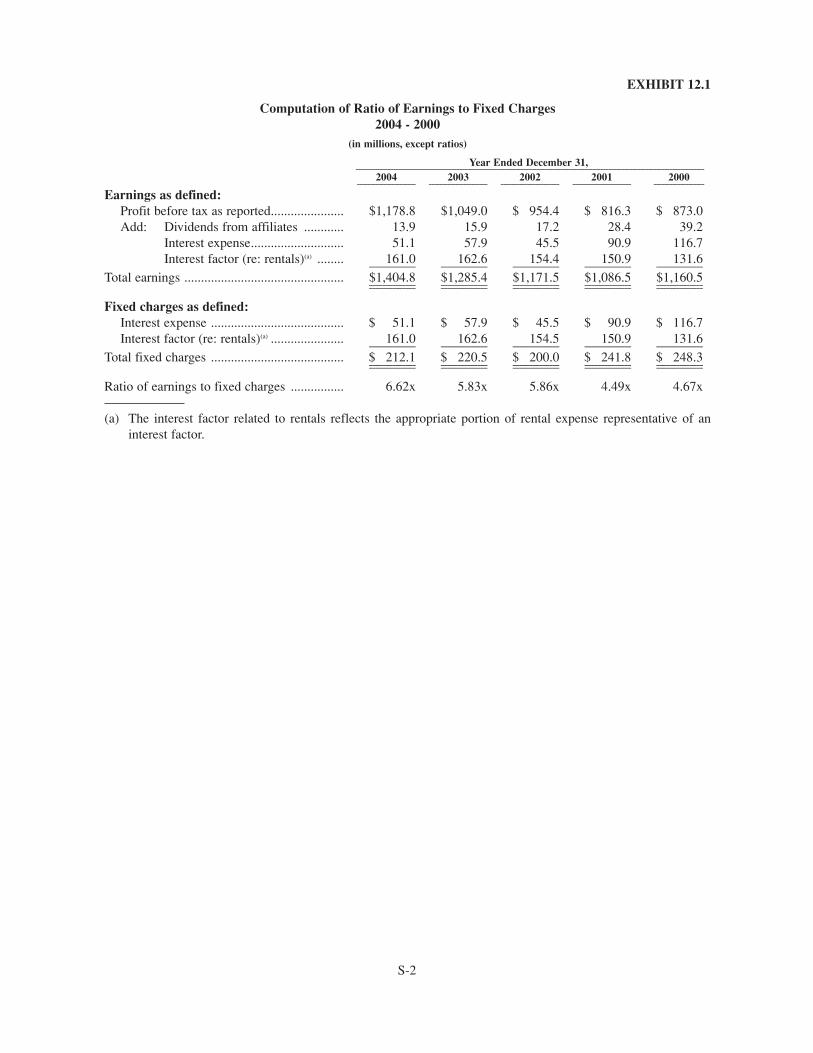
S-2
EXHIBIT 12.1
Computation of Ratio of Earnings to Fixed Charges2004 - 2000
(in millions, except ratios)
Year Ended December 31,___________________________________________________________________________________________________________________________________2004 2003 2002 2001 2000______________________ ______________________ ______________________ ______________________ ___________________
Earnings as defined:Profit before tax as reported...................... $1,178.8 $1,049.0 $ 954.4 $ 816.3 $ 873.0Add: Dividends from affiliates ............ 13.9 15.9 17.2 28.4 39.2
Interest expense............................ 51.1 57.9 45.5 90.9 116.7Interest factor (re: rentals)(a) ........ 161.0 162.6 154.4 150.9 131.6______________ ______________ ______________ ______________ ______________
Total earnings ................................................ $1,404.8 $1,285.4 $1,171.5 $1,086.5 $1,160.5______________ ______________ ______________ ______________ ____________________________ ______________ ______________ ______________ ______________
Fixed charges as defined:Interest expense ........................................ $ 51.1 $ 57.9 $ 45.5 $ 90.9 $ 116.7Interest factor (re: rentals)(a) ...................... 161.0 162.6 154.5 150.9 131.6______________ ______________ ______________ ______________ ______________
Total fixed charges ........................................ $ 212.1 $ 220.5 $ 200.0 $ 241.8 $ 248.3______________ ______________ ______________ ______________ ____________________________ ______________ ______________ ______________ ______________
Ratio of earnings to fixed charges ................ 6.62x 5.83x 5.86x 4.49x 4.67x
(a) The interest factor related to rentals reflects the appropriate portion of rental expense representative of aninterest factor.

S-3
EXHIBIT 23.1
CONSENT OF INDEPENDENT REGISTERED PUBLIC ACCOUNTING FIRM
The Board of DirectorsOmnicom Group Inc.:
We consent to the incorporation by reference in the registration statements (Registration Statement Nos.333-84498, 333-33972, 333-37634, 333-41717, 333-70091, 333-74591, 333-74727, 333-74879, 333-84349,333-90931, 333-108063, 333-115892) on Form S-8, (Registration Statement No. 333-47426) on Form S-4 and (Registration Statement Nos. 333-22589, 333-35670, 333-43883, 333-44481, 333-44483, 333-47047,333-47342, 333-52828, 333-104391, 333-108611, 333-112840, 333-112841) on Form S-3 of Omnicom GroupInc. and subsidiaries of our reports dated March 11, 2005, with respect to the consolidated balance sheets ofOmnicom Group Inc. and subsidiaries as of December 31, 2004 and 2003, and the related consolidatedstatements of income, shareholders’ equity, and cash flows for each of the years in the three-year period endedDecember 31, 2004, and all related financial statement schedules, management’s assessment of the effectivenessof internal control over financial reporting as of December 31, 2004 and the effectiveness of internal control overfinancial reporting as of December 31, 2004, which reports appear in the December 31, 2004 annual report onForm 10-K of Omnicom Group Inc. and subsidiaries.
/s/ KPMG LLP
New York, New YorkMarch 15, 2005
S-4
EXHIBIT 31.1
CERTIFICATION
I, John D. Wren, certify that:
1. I have reviewed this Annual Report on Form 10-K for the period ended December 31, 2004 ofOmnicom Group Inc.;
2. Based on my knowledge, this report does not contain any untrue statement of a material fact or omit tostate a material fact necessary to make the statements made, in light of the circumstances under whichsuch statements were made, not misleading with respect to the period covered by this report;
3. Based on my knowledge, the financial statements, and other financial information included in thisreport, fairly present in all material respects the financial condition, results of operations and cashflows of the registrant as of, and for, the periods presented in this report;
4. The registrant’s other certifying officer and I are responsible for establishing and maintainingdisclosure controls and procedures (as defined in Exchange Act Rules 13a-15(e) and 15d-15(e)) andinternal control over financial reporting (as defined in Exchange Act Rules 13a-15(f) and 15d-15(f))for the registrant and have:
a) Designed such disclosure controls and procedures, or caused such disclosure controls andprocedures to be designed under our supervision, to ensure that material information relating tothe registrant, including its consolidated subsidiaries, is made known to us by others withinthose entities, particularly during the period in which this annual report is being prepared;
b) Designed such internal control over financial reporting, or caused such internal control overfinancial reporting to be designed under our supervision, to provide reasonable assuranceregarding the reliability of financial reporting and the preparation of financial statements forexternal purposes in accordance with generally accepted accounting principles;
c) Evaluated the effectiveness of the registrant’s disclosure controls and procedures and presentedin this report our conclusions about the effectiveness of the disclosure controls and procedures,as of the end of the period covered by this report based on such evaluation; and
d) Disclosed in this report any change in the registrant’s internal control over financial reportingthat occurred during the registrant’s most recent fiscal quarter (the registrant’s fourth fiscalquarter in the case of our annual report) that has materially affected, or is reasonably likely tomaterially affect, the registrant’s internal control over financial reporting; and
5. The registrant’s other certifying officer and I have disclosed, based on our most recent evaluation ofinternal control over financial reporting, to the registrant’s auditors and the audit committee ofregistrant’s board of directors (or persons performing the equivalent functions):
a) All significant deficiencies and material weaknesses in the design or operation of internalcontrol over financial reporting which are reasonably likely to adversely affect the registrant’sability to record, process, summarize and report financial information; and
b) Any fraud, whether or not material, that involves management or other employees who have asignificant role in the registrant’s internal control over financial reporting.
Date: March 11, 2005 /s/ John D. WrenJohn D. Wren
Chief Executive Officer and President

S-5
EXHIBIT 31.2
CERTIFICATION
I, Randall J. Weisenburger, certify that:
1. I have reviewed this Annual Report on Form 10-K for the period ended December 31, 2004 ofOmnicom Group Inc.;
2. Based on my knowledge, this report does not contain any untrue statement of a material fact or omit tostate a material fact necessary to make the statements made, in light of the circumstances under whichsuch statements were made, not misleading with respect to the period covered by this report;
3. Based on my knowledge, the financial statements, and other financial information included in thisreport, fairly present in all material respects the financial condition, results of operations and cashflows of the registrant as of, and for, the periods presented in this report;
4. The registrant’s other certifying officer and I are responsible for establishing and maintainingdisclosure controls and procedures (as defined in Exchange Act Rules 13a-15(e) and 15d-15(e)) andinternal control over financial reporting (as defined in Exchange Act Rules 13a-15(f) and 15d-15(f))for the registrant and have:
a) Designed such disclosure controls and procedures, or caused such disclosure controls andprocedures to be designed under our supervision, to ensure that material information relating tothe registrant, including its consolidated subsidiaries, is made known to us by others withinthose entities, particularly during the period in which this annual report is being prepared;
b) Designed such internal control over financial reporting, or caused such internal control overfinancial reporting to be designed under our supervision, to provide reasonable assuranceregarding the reliability of financial reporting and the preparation of financial statements forexternal purposes in accordance with generally accepted accounting principles;
c) Evaluated the effectiveness of the registrant’s disclosure controls and procedures and presentedin this report our conclusions about the effectiveness of the disclosure controls and procedures,as of the end of the period covered by this report based on such evaluation; and
d) Disclosed in this report any change in the registrant’s internal control over financial reportingthat occurred during the registrant’s most recent fiscal quarter (the registrant’s fourth fiscalquarter in the case of our annual report) that has materially affected, or is reasonably likely tomaterially affect, the registrant’s internal control over financial reporting; and
5. The registrant’s other certifying officer and I have disclosed, based on our most recent evaluation ofinternal control over financial reporting, to the registrant’s auditors and the audit committee ofregistrant’s board of directors (or persons performing the equivalent functions):
a) All significant deficiencies and material weaknesses in the design or operation of internalcontrol over financial reporting which are reasonably likely to adversely affect the registrant’sability to record, process, summarize and report financial information; and
b) Any fraud, whether or not material, that involves management or other employees who have asignificant role in the registrant’s internal control over financial reporting.
Date: March 11, 2005 /s/ Randall J. WeisenburgerRandall J. Weisenburger
Executive Vice President and
Chief Financial Officer

S-6
EXHIBIT 32.1
CERTIFICATION OFANNUAL REPORT ON FORM 10-K
Pursuant to 18 U.S.C. ss. 1350, as adopted pursuant to ss. 906 of the Sarbanes-Oxley Act of 2002, inconnection with the filing of Omnicom Group Inc.’s Annual Report on Form 10-K for the year ended December31, 2004, as filed with the Securities and Exchange Commission on the date hereof (the “Report”), each of theundersigned officers of Omnicom Group Inc. certifies that, to such officer’s knowledge:
• the Report fully complies with the requirements of Section 13(a) or 15(d) of the Securities ExchangeAct of 1934; and
• the information contained in the Report fairly presents, in all material aspects, the financial conditionand results of operations of Omnicom Group Inc. as of the dates and for the periods expressed in theReport.
Executed as of March 11, 2005.
/s/ John D. Wren________________________________Name: John D. WrenTitle: Chief Executive Officer and President
/s/ Randall J. Weisenburger________________________________Name: Randall J. WeisenburgerTitle: Executive Vice President and
Chief Financial Officer

Omnicom
Board Of Directors
BRUCE CRAWFORDChairman,Omnicom Group
JOHN D. WRENPresident and Chief Executive Officer,Omnicom Group
ROBERT CHARLES CLARKHarvard University Distinguished Service Professor,Harvard Law School
LEONARD S. COLEMAN, JR.Senior Advisor, Major League Baseball,Former Chairman, Arena Co.
ERROL M. COOKPrivate Investor and Consultant,Former Managing Director,Warburg Pincus & Company
SUSAN S. DENISONPartner, Cook Associates
MICHAEL A. HENNINGFormer Deputy Chairman, Ernst & Young
JOHN R. MURPHYVice Chairman,National Geographic Society
JOHN R. PURCELLChairman and Chief Executive Officer,Grenadier Associates Ltd.
LINDA JOHNSON RICEPresident and Chief Executive Officer,Johnson Publishing Company, Inc.
GARY L. ROUBOSFormer Chairman,Dover Corporation
Committees Of The Board
AUDITJohn R. Murphy, Chairman Robert Charles ClarkErrol M. Cook Michael A. Henning
COMPENSATIONGary L. Roubos, ChairmanLeonard S. Coleman, Jr.Susan S. DenisonLinda Johnson Rice
FINANCEBruce Crawford, Chairman John R. Purcell Gary L. Roubos
GOVERNANCEJohn R. Purcell, ChairmanRobert Charles ClarkLeonard S. Coleman, Jr.Susan S. DenisonJohn R. MurphyLinda Johnson Rice
Omnicom Officers
JOHN D. WRENPresident and Chief Executive Officer
RANDALL J. WEISENBURGERExecutive Vice President andChief Financial Officer
MICHAEL BIRKINVice Chairman
PETER MEADVice Chairman
BRUCE REDDITTExecutive Vice President
SUSAN SMITH ELLISExecutive Vice President
PHILIP J. ANGELASTROSenior Vice President Finance and Controller
MICHAEL J. O’BRIENSenior Vice President, General Counsel andSecretary
PHILIP J. GEORGETax Counsel
DENNIS E. HEWITTTreasurer

Omnicom
CORPORATE INFORMATION
PRINCIPAL EXECUTIVE OFFICES
437 Madison AvenueNew York, New York 10022212.415.3600
One East Weaver StreetGreenwich, Connecticut 06831203.618.1500
239 Old Marylebone RoadLondon NW1 5QT44 (0) 20 7928 7007
www.omnicomgroup.com
ANNUAL MEETING
The Annual Meeting of Stockholders will beheld on Tuesday, May 24, 2005, at10:00 a.m. Central Time atOmnicom Management ServicesHarwood CenterSuite 17001999 Bryan StreetDallas, Texas 75201
SEC CERTIFICATIONS
The certifications by the Chief Executive Officerand President and the Executive Vice Presidentand Chief Financial Officer of Omnicom GroupInc., required under Section 302 of the Sarbanes-Oxley Act of 2002, have also been filed asexhibits to the company’s 2004 Annual Reporton Form 10-K.
NYSE CERTIFICATION
The Chief Executive Officer and President ofOmnicom Group Inc. made an unqualifiedcertification to the New York Stock Exchange(NYSE) with respect to the company’scompliance with the NYSE CorporateGovernance listing standards in June 2004.
STOCK LISTING
Omnicom common stock istraded on the New York Stock Exchange.The ticker symbol is OMC.
TRANSFER AGENT & REGISTRAR
Mellon Investor Services LLC85 Challenger RoadRidgefield Park, New Jersey 07660 www.melloninvestor.com
INVESTOR SERVICES PROGRAM
An Investor Services Program, which includesdirect stock purchase and dividend reinvestmentfeatures, is available to stockholders of recordand other interested investors. For furtherinformation, please contact Mellon InvestorServices at 877.870.2370 or go towww.melloninvestor.com.
STOCK TRANSFER MATTERS/CHANGE OF ADDRESS
To assist you in handling matters relating tostock transfer or change of address, pleasewrite to or call our transfer agent:Mellon Investor Services LLCShareholder Relations Dept.P.O. Box 3315South Hackensack, New Jersey 07606-1915877.870.2370
INDEPENDENT AUDITORS
KPMG LLP345 Park AvenueNew York, New York 10154
Printed on Recycled Paper