ommonwealth education poll 2016-17 - news.vcu.edu
TRANSCRIPT

COMMONWEALTH EDUCATION POLL 2016-17
A survey of Virginians conducted by the Commonwealth Educational Policy Institute at Virginia Commonwealth University’s L. Douglas Wilder School of Government and Public Affairs cepi.vcu.edu Contact: Robyn McDougle, Ph.D. – Interim Executive Director, Commonwealth Educational Policy Institute; (804) 827-3290 or [email protected] Farrah Stone Graham, Ph.D. – Survey Director, (804) 828-1989; (804) 305-3447 (cell); or [email protected]
Table of Contents Citizens Believe Virginia’s Higher Ed Institutions Do a Good Job Preparing Students for Success in the Workforce ........................................................................................................................2
Perspectives on Workforce Readiness and Development ..........................................................4
Majority Don’t See High School Graduates as Ready for Workforce; Community College and Four-Year College Graduates are Seen as Equally Ready ...............................................4
Almost Half of Virginians Want Expansion of Workforce Training and Education to Receive the Most Emphasis When Using State Economic Development Funds .................................7
Perspectives on Higher Education ..............................................................................................9
Evaluating the Performance of Higher Education.................................................................9
Majority Have “Some” or “Quite a Lot” of Knowledge about the College Transfer Process; Of Those, 66% Say Process is Very or Somewhat Easy .......................................................12
Public Equally Split on Knowledge about Dual Enrollment Opportunities...........................14
Majority Willing to Pay More to Increase Need-Based Financial Aid ..................................15
Public Wants Universities to Invest Non-Public Funds in Reducing Tuition .........................16
Public Perception of Campus Safety Hits New High ...........................................................17
Methodology of the Commonwealth Education Poll................................................................19
Tables with Subgroup Analysis .................................................................................................25

Commonwealth Education Poll 2016-2017 Page 2
Embargoed until 11:30 a.m., Thursday, January 26, 2017
COMMONWEALTH EDUCATION POLL 2016-17
A survey of Virginians conducted by the Commonwealth Educational Policy Institute at Virginia Commonwealth University’s L. Douglas Wilder School of Government and Public Affairs Contact: Robyn McDougle, Ph.D. – Interim Executive Director, Commonwealth Educational Policy Institute; (804) 827-3290 or [email protected] Farrah Stone Graham, Ph.D. – Survey Director, (804) 828-1989; (804) 305-3447 (cell); or [email protected]
Citizens Believe Virginia’s Higher Ed Institutions Do a Good Job Preparing Students for Success in the Workforce
In the latest Commonwealth Education Poll, a majority of respondents say Virginia colleges and universities are doing a good job providing students with skills to succeed in the workplace and beyond. Five areas were identified as particular strengths:
Producing graduates in scientific fields – 75 percent
Preparing students for the workforce needs for the future – 64 percent
Providing the skills that will be useful in obtaining a job – 67 percent
Developing students’ writing and communication skills – 63 percent
Preparing students to be engaged citizens – 61 percent
“This poll shows the trust citizens have in our colleges and universities to prepare students for the careers of the future,” said Virginia Secretary of Education Dietra Trent. “Working over the last three years to bring education into the 21st century, Governor McAuliffe has helped to lay the groundwork for a strong talent pipeline from the classroom to the workforce.”
Poll responses also indicate that the public sees Virginia colleges as a key catalyst for workforce readiness. Almost three in four members of the public say community college graduates (74 percent) and four-year college graduates (73 percent) are ready to join the workforce. This contrasts with only 36 percent who believe that high school graduates are ready for the world of work. “Colleges and universities in Virginia as a whole are perceived positively by a large majority of the public in terms of outcomes that support the state’s economy and civic life,” said Robyn McDougle, Ph.D.,

Commonwealth Education Poll 2016-2017 Page 3
interim executive director of the Commonwealth Educational Policy Institute and associate professor at the L. Douglas Wilder School of Government and Public Affairs at Virginia Commonwealth University. “These responses also show that the public’s estimate of workforce readiness is equally positive for both community college and four-year college graduates but not for high school graduates,” she said. “The system of higher education clearly provides a significant added value to its students.” While high school graduates aren’t seen as ready for the workforce, a majority of 60 percent of the public thinks a high school graduate is ready for college. That number reaches 88 percent for community college graduates being ready for a four-year college. The value of a higher education degree also drives policy discussions about how to increase access to college for more students. One often cited barrier is cost and two poll questions showed:
A narrow majority of the public in Virginia (54 percent) is willing to pay higher taxes in order to drive down costs through need-based financial aid.
A strong majority of the public (74 percent) wants college administrators to spend privately raised, non-taxpayer sources of available funding on reducing tuition and fees. This compared to only 15 percent who preferred a focus on expanding teaching faculty and resources to provide access to more students and 7 percent who preferred a focus on building new facilities to attract the highest quality students.
“College administrators face constant tradeoffs in deciding whether to focus finite resources on facilities that attract the highest quality students, expanding classrooms and faculty so more students can attend, or reducing the cost of attendance,” McDougle said. "Those are tough choices, but the responses here show the public is most clearly concerned about reducing the cost of attendance.” Other higher education findings of the Commonwealth Education Poll include:
74 percent of respondents said they believe college and university campuses in Virginia are safe, up from 67 percent in last year’s poll. Only 3 percent felt that campuses were “not safe at all”.
Fifty-four percent of Virginians report knowing quite a lot or some about the process of transferring from a two-year to four-year school, an increase of 9 percentage points from a 2013 survey. Of those respondents, 66 percent reported that the transfer process was very or somewhat easy.
Forty-nine percent of Virginians report knowing quite a lot or some about dual enrollment opportunities, whereby high school students take college courses for credits toward both a high school diploma and a bachelor’s degree.
These findings are part of a new statewide survey conducted by Virginia Commonwealth University. The Commonwealth Education Poll was conducted by landline and cell telephone from November 8-17, 2016, with a random sample of 806 adults in Virginia. The margin of error for the poll is plus or minus 4.3 percentage points. This poll is conducted annually by VCU’s Commonwealth Educational Policy Institute, which is part of the L. Douglas Wilder School of Government and Public Affairs. Portions of the poll related K-12 funding and policy were released on Tues., Jan. 24. For a PDF of the 42-page report including complete question wording and detailed tables of results see http://cepi.vcu.edu/publications/polls/.

Commonwealth Education Poll 2016-2017 Page 4
Perspectives on Workforce Readiness and Development
Majority Don’t See High School Graduates as Ready for Workforce; Community College and Four-Year College Graduates are Seen as Equally Ready
Workforce readiness is a key area for policymakers because of its connection to attracting
business to the commonwealth and long-term economic growth. Workforce development, though
often thought of in terms of higher education, is also a topic in K-12 discussions both in terms of
immediate readiness to join the workforce and preparation to pursue further training in college. This
year we again gauged public perception on whether graduates of high school, community college and
four-year colleges are ready to move into the next potential phases.
The responses suggest that the public generally thinks high school graduates are not ready to
join the workforce, but are prepared to go to college. College graduates, whether from a community
college or a four-year institution, are perceived as ready for the working world. Additionally, community
college graduates are almost unanimously perceived as being ready to continue their studies at a four-
year college.
A strong majority (62 percent) think that high school graduates are not prepared for the
workplace, strongly or somewhat disagreeing with the statement that high school graduates are ready
for the world of work. Household income levels mark a difference of opinion on the question. Sixty-
Ready for the Next Phase? Thinking about students and their future, please tell me how much you agree or disagree with each of the following statements…?
Source: Commonwealth Education Poll 2016-17
36
60
74
87
73
62
38
24
10
26
0 20 40 60 80 100
High school grad - ready for work
High school grad - ready for college
Comm. college grad - ready for work
Comm. college grad - ready for 4-year college
4-Year College grad - ready for work
Strongly/somewhat agree Strongly/somewhat disagree DK/Refused
Commonwealth Education Poll 2016-2017 Page 5
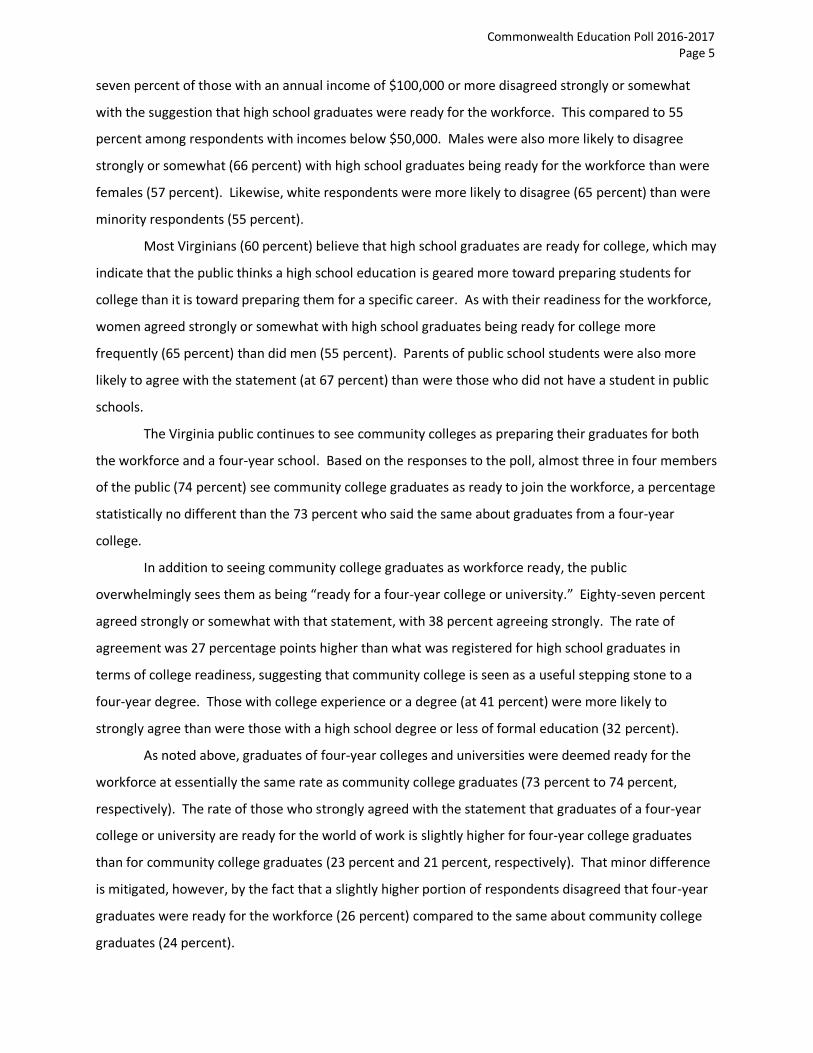
seven percent of those with an annual income of $100,000 or more disagreed strongly or somewhat
with the suggestion that high school graduates were ready for the workforce. This compared to 55
percent among respondents with incomes below $50,000. Males were also more likely to disagree
strongly or somewhat (66 percent) with high school graduates being ready for the workforce than were
females (57 percent). Likewise, white respondents were more likely to disagree (65 percent) than were
minority respondents (55 percent).
Most Virginians (60 percent) believe that high school graduates are ready for college, which may
indicate that the public thinks a high school education is geared more toward preparing students for
college than it is toward preparing them for a specific career. As with their readiness for the workforce,
women agreed strongly or somewhat with high school graduates being ready for college more
frequently (65 percent) than did men (55 percent). Parents of public school students were also more
likely to agree with the statement (at 67 percent) than were those who did not have a student in public
schools.
The Virginia public continues to see community colleges as preparing their graduates for both
the workforce and a four-year school. Based on the responses to the poll, almost three in four members
of the public (74 percent) see community college graduates as ready to join the workforce, a percentage
statistically no different than the 73 percent who said the same about graduates from a four-year
college.
In addition to seeing community college graduates as workforce ready, the public
overwhelmingly sees them as being “ready for a four-year college or university.” Eighty-seven percent
agreed strongly or somewhat with that statement, with 38 percent agreeing strongly. The rate of
agreement was 27 percentage points higher than what was registered for high school graduates in
terms of college readiness, suggesting that community college is seen as a useful stepping stone to a
four-year degree. Those with college experience or a degree (at 41 percent) were more likely to
strongly agree than were those with a high school degree or less of formal education (32 percent).
As noted above, graduates of four-year colleges and universities were deemed ready for the
workforce at essentially the same rate as community college graduates (73 percent to 74 percent,
respectively). The rate of those who strongly agreed with the statement that graduates of a four-year
college or university are ready for the world of work is slightly higher for four-year college graduates
than for community college graduates (23 percent and 21 percent, respectively). That minor difference
is mitigated, however, by the fact that a slightly higher portion of respondents disagreed that four-year
graduates were ready for the workforce (26 percent) compared to the same about community college
graduates (24 percent).

Commonwealth Education Poll 2016-2017 Page 6
For four-year college graduates, women (77 percent) were again more likely to strongly or
somewhat agree that graduates were ready for the workforce than were men (68 percent). Those with
a college degree or more (78 percent) were more likely to judge four-year graduates workforce ready
than were those who have a high school degree or less of formal education (68 percent). Likewise,
Democrats (at 80 percent) were more likely to see four-year graduates as ready for the world of work
than were Republicans (68 percent) or Independents (64 percent).
Majority Willing to Pay More in Taxes to Keep Funding for Workforce Training and Development at Current Level
For the first time, the 2016-17 Commonwealth Education Poll asked respondents whether they
would be willing to pay more in taxes in order to keep programs for workforce training and development
going at the current level.
A clear majority
(58 percent) of
respondents said they
would be willing.
Several demographic
factors showed significant
differences in responses.
Democrats (at 69 percent)
were much more likely to
be willing to pay more in
taxes than Republicans (46
percent), with
Independents (60 percent
willing) roughly falling in
the middle. A significantly
greater portion of minority
respondents (at 66
percent) said they were
willing than was the case
Willingness to Pay for Workforce Training & Development
As I mention a few areas that receive money from the state government, tell me if you would be willing or not willing to pay more in taxes in order to keep programs for workforce training and development going at the current level?
Source: Commonwealth Education Poll 2016-17; map shows geographic definition of regions listed above.
49
57
59
60
65
50
61
66
5160
63
55
66
4660
69
58
51
38
37
37
29
47
34
32
4635
32
41
32
4934
28
38
0% 20% 40% 60% 80% 100%
Northwest
Northern VirginiaWest
Tidewater
South Central
Public School Parent
Not Public School parent
65+
45-64
35-44
18-34
White
Minority
Republicans
Independents
Democrats
All adults
Willing Not willing Don't know
Commonwealth Education Poll 2016-2017 Page 7
with white respondents (55 percent).
While most age categories had 60 percent or more of respondents say they would be willing to
pay more in taxes to keep current funding levels for workforce training, only 51 percent of those ages
45-64 said they were willing. Those who did not report having a child in public school were also more
willing to pay more in taxes (at 61 percent) than were parents of public school students.
In four geographic regions, a majority were willing to pay more in taxes for this area of state
programs but respondents from the Northwest region were evenly split (49 percent willing, 51 percent
not willing).
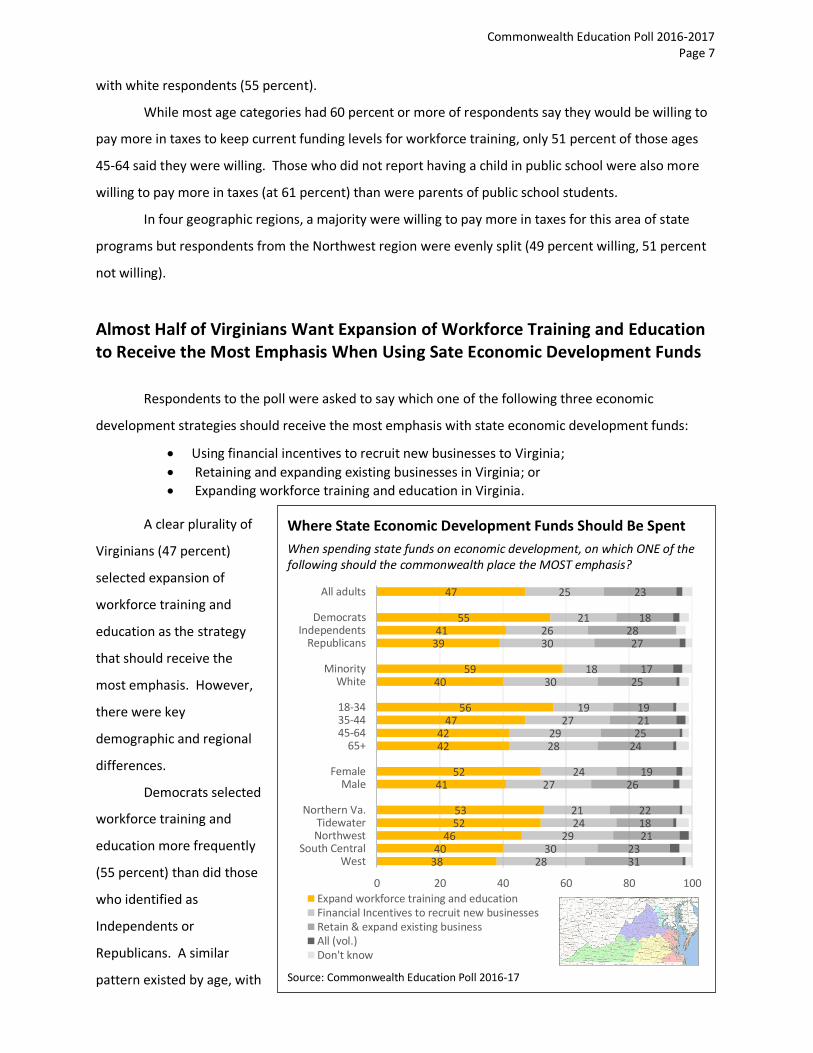
Almost Half of Virginians Want Expansion of Workforce Training and Education to Receive the Most Emphasis When Using Sate Economic Development Funds
Respondents to the poll were asked to say which one of the following three economic
development strategies should receive the most emphasis with state economic development funds:
Using financial incentives to recruit new businesses to Virginia;
Retaining and expanding existing businesses in Virginia; or
Expanding workforce training and education in Virginia.
A clear plurality of
Virginians (47 percent)
selected expansion of
workforce training and
education as the strategy
that should receive the
most emphasis. However,
there were key
demographic and regional
differences.
Democrats selected
workforce training and
education more frequently
(55 percent) than did those
who identified as
Independents or
Republicans. A similar
pattern existed by age, with
Where State Economic Development Funds Should Be Spent
When spending state funds on economic development, on which ONE of the following should the commonwealth place the MOST emphasis?
Source: Commonwealth Education Poll 2016-17
3840
465253
4152
4242
4756
4059
3941
55
47
2830
292421
2724
2829
2719
3018
3026
21
25
3123
211822
2619
24252119
2517
2728
18
23
0 20 40 60 80 100
WestSouth Central
NorthwestTidewater
Northern Va.
MaleFemale
65+45-6435-4418-34
WhiteMinority
RepublicansIndependents
Democrats
All adults
Expand workforce training and educationFinancial Incentives to recruit new businessesRetain & expand existing businessAll (vol.)Don't know
Commonwealth Education Poll 2016-2017 Page 8
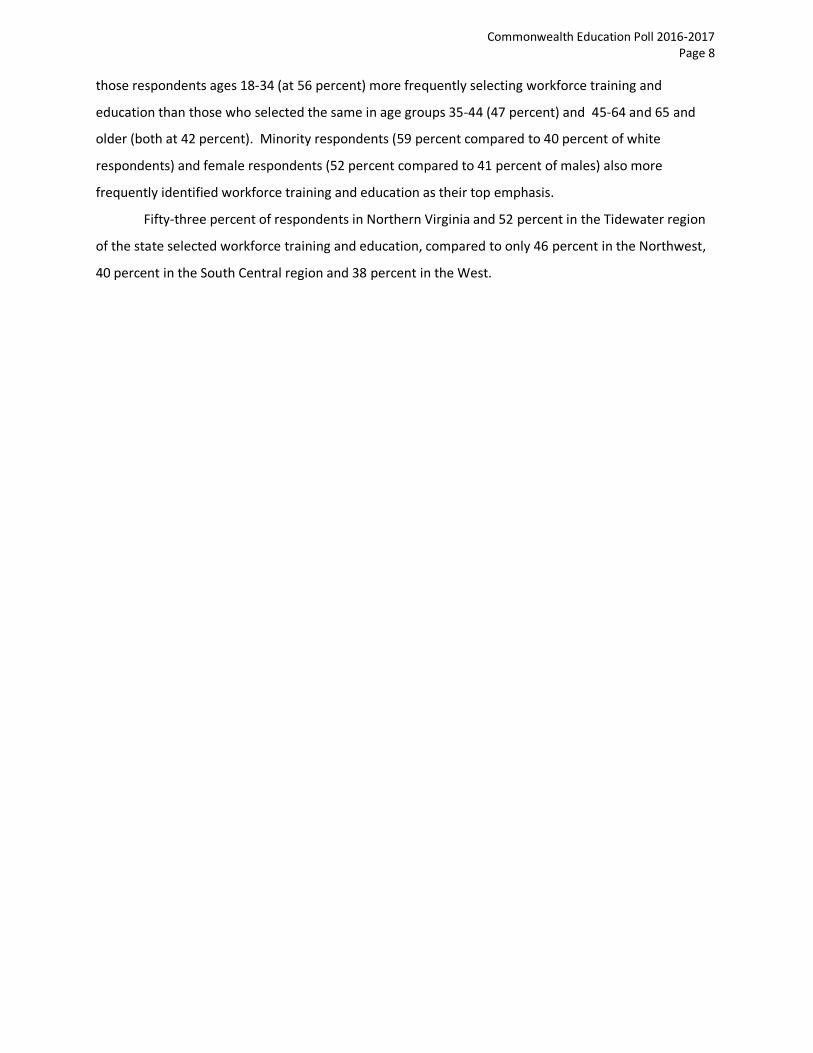
those respondents ages 18-34 (at 56 percent) more frequently selecting workforce training and
education than those who selected the same in age groups 35-44 (47 percent) and 45-64 and 65 and
older (both at 42 percent). Minority respondents (59 percent compared to 40 percent of white
respondents) and female respondents (52 percent compared to 41 percent of males) also more
frequently identified workforce training and education as their top emphasis.
Fifty-three percent of respondents in Northern Virginia and 52 percent in the Tidewater region
of the state selected workforce training and education, compared to only 46 percent in the Northwest,
40 percent in the South Central region and 38 percent in the West.

Commonwealth Education Poll 2016-2017 Page 9
Perspectives on Higher Education
Evaluating the Performance of Higher Education
Higher education plays a key role in developing a competitive workforce and equipping students
for success in a career. But society also looks to higher education to develop its students’ broad general
skills, such as writing and
communication, as well as
attitudes such as civic
engagement. When it
comes to specific
outcomes across these
areas, strong majorities
say Virginia colleges and
universities are doing a
good job in five important
areas. Seventy-five
percent of Virginians say
colleges and universities
are doing a good job in
producing graduates in
scientific fields and 64
percent said the same
about preparing students
for the workforce needs
for the future. Sixty-
seven percent say the
state schools do a good
job providing the skills
that will be useful in
obtaining a job. A slightly
smaller majority (63
How are Virginia’s Colleges and Universities Doing? Overall, do you think the colleges and universities in Virginia are doing a good job or a bad job in following areas?
Source: Commonwealth Education Poll 2016-17
61
63
64
67
75
32
29
27
26
16
0 20 40 60 80 100
Preparing students to be engagedcitizens
Developing students' writing andcommunication skills
Preparing students for workforce needsof the future
Providing the skills useful in obtaining ajob
Producing graduates in scientific fields
Good job Bad job Don't Know
How are Virginia’s Colleges and Universities Doing?
Overall, do you think the colleges and universities in Virginia are doing a good job or a bad job in following areas? (Percent saying Good Job)
2017 2016 2015 2014 2013 Producing graduates in scientific fields
75 72 72 72 67
Preparing students for the workforce needs of the future
64 70 65 69 62
Providing the skills useful in obtaining a job
67 68 69 72 65
Developing students’ writing and communication skills
63 65 62 63 59
Preparing students to be engaged citizens [new in 2017]
61 --- --- --- ---
Source: Commonwealth Education Poll 2016-17

Commonwealth Education Poll 2016-2017 Page 10
percent) thinks they are doing a good job developing students’ writing and communication skills while
61 percent feel that they are doing a good job of preparing students to be engaged citizens.1
Public opinion on these factors is largely steady (all variation is within the poll’s margin of error).
One possible exception is the category of producing graduates in scientific fields, which grew by 8
percentage points over the past five years and is right at the edge of the poll’s margin of error. This may
indicate that a sustained emphasis from political leaders and higher education administrators on
producing graduates in the Science, Technology, Engineering and Mathematics (STEM) fields is having an
impact on public perceptions.
Different age groups evaluated higher education outcomes somewhat differently. Respondents
in the 18- to 34-year-old group were significantly more positive about the performance of colleges and
universities in the area of developing students’ writing and communication skills (78 percent said
colleges were doing a good job). Older age groups were less likely to say the same, where only 53
percent of the 65 or older group felt colleges were doing a good job in this area.
Relative to the same outcome area of communication/writing skills, there was also a difference
along political party and racial/ethnic lines. Minority respondents (72 percent) and Democrats (68
percent) were more likely to see colleges and universities as doing a good job than were white
respondents (60 percent) and either Republicans (59 percent) or Independents (56 percent).
In similar fashion to communication, those ages 18-34 were more likely (at 80 percent) to say
colleges are doing a good job in turning out STEM graduates than were those older than 65 years (70
percent). Two other demographic delineations showed significant differences when asked about
producing STEM graduates. Respondents from the West region and Northern Virginia (80 percent for
each) were more likely to say colleges and universities were doing a good job in this area than were
respondents from the South Central (67 percent) and Northwest regions (68 percent). Party affiliation
also mattered, with Democrats and Republicans being more likely to say that universities were doing a
good job (79 percent and 74 percent, respectively) than were Independents (66 percent).
In the area of preparing students for the workforce needs of the future and in providing skills
useful in obtaining a job, there was a significant difference in perspective based on income. Those
making more than $100,000 in annual household income were more likely to say colleges and
universities were doing a good job in relation to workforce needs (73 percent) and in skills useful in
obtaining a job (75 percent) compared to those in the middle income bracket (54 percent and 64
percent, respectively) and those in the lower income bracket (62 percent and 66 percent, respectively).
Finally, a number of demographic differences, including race, education level and political
identity, existed in regards to whether respondents were more or less likely to say colleges and
1 The 2016-17 poll was the first time this question was asked.

Commonwealth Education Poll 2016-2017 Page 11
universities are doing a good job in preparing students to be engaged citizens. Those with a high school
degree or less in formal schooling were most likely (67 percent) to see a good job being done in this
area, compared to those with some college (56 percent) and those with a college degree (59 percent).
Minority respondents were also more likely (at 70 percent) than were whites (at 58 percent) to
see colleges and
universities doing a good
job in preparing students
to be engaged citizens.
Finally, a significant gap
existed on this question
between Democrats (70
percent feel colleges and
universities are doing a
good job) and both
Independents (55 percent
said the same) and
Republicans (51 percent
said the same).
Evaluating Higher Education Outcomes
Overall, do you think the colleges and universities in Virginia are doing a good job or bad job in preparing students to be engaged citizens?
Source: Commonwealth Education Poll 2016-17
51
55
70
58
70
59
56
67
61
42
35
23
34
24
34
38
24
32
0 20 40 60 80 100
Republicans
Independents
Democrats
White
Minority
College degree
Some college
High School
All adults
Good job Bad job Don't Know

Commonwealth Education Poll 2016-2017 Page 12
Majority Have “Some” or “Quite a Lot” of Knowledge about the College Transfer Process; Of Those, 66% Say Process is Very or Somewhat Easy
Amid concerns about the affordability of college for the current generation of students, some
have pointed out that students could potentially save money by spending their first year or two at a
more affordable community college before transferring to a four-year school to finish their bachelor’s
degree. Being able to do so presumes that students, their parents, or members of the community at
large are knowledgeable about the transfer process. Responses to the Commonwealth Education Poll
show that a majority (54 percent) of Virginians say they have “some” or “quite a lot” of knowledge
about the transfer process. This is a 9 percentage point increase in the portion of the public that report
this level of awareness compared to the findings of a 2013 Virginia Community Colleges survey.2
2 Perceptions of Community Colleges in VA, November 7-14, 2013. N=801 Virginia residents.
College Transfer Process – Knowledge of Process
How much do you know about the process of transferring from a two-year to a four-year school—quite a lot, some, very little, or nothing at all?
Source: Commonwealth Education Poll 2016-17
23
28
10
26
37
20
28
28
17
22
34
27
24
29
32
25
33
32
24
31
31
24
32
23
34
30
28
23
34
25
19
32
28
19
34
25
21
27
26
20
16
29
15
11
22
12
23
25
20
19
13
19
0 20 40 60 80 100
Not a parent
Parent of VA college student
H.S. or less
Some college
College degree
Under $50K
$50K to $100K
$100K or more
65+
45-64
35-44
18-34
All
Quite a lot Some Very little Nothing at all DK/Refused

Commonwealth Education Poll 2016-2017 Page 13
Younger respondents reported knowing more about the process than did older respondents.
Sixty-one percent of 18- to 34-year-olds and 57 percent of 35- to 44-year-olds reported knowing “quite a
lot” or “some” about the process, compared with 54 percent for those ages 45-64 and 41 percent for
those 65 or older.
Unsurprisingly, those who have never gone to college know less about the process.
Respondents with some college (at 59 percent) or with a college degree (69 percent) were more likely to
report knowing “some” or “quite a lot” about the transfer process, compared to only 35 percent of
those with a high school degree or less who said the same. Parents of Virginia college students were
more likely, at 60 percent, to say they knew “some” or “quite a lot” about the process than were non-
parents (52 percent).
Finally, those with lower incomes knew less about the process. Those reporting less than
$50,000 in annual household income said “some” or “quite a lot” only 44 percent of the time, compared
with 59 percent for those with incomes above $50,000.
Of those in the overall sample who reported knowing “some” or “quite a lot” about the transfer
process, two-thirds (66
percent) reported that the
process was very or
somewhat easy.
However, half (50
percent) said it was
somewhat easy rather
than very easy. Twenty-
eight percent thought the
process was somewhat
difficult, while only 3
percent felt it was very
difficult.
College Transfer Process – Ease of Process
[Of those with “a lot” or “some” knowledge or process – N=472] - How would you rate the process of transferring from a community college to a four-year college or university? Would you say it is very easy, somewhat easy, somewhat difficult or very difficult?
Source: Commonwealth Education Poll 2016-17
16 50 28 3
0 20 40 60 80 100
All
Very easy Somewhat easy Somewhat difficult
Very Difficult DK/Refused

Commonwealth Education Poll 2016-2017 Page 14
Public Equally Split on Knowledge about Dual Enrollment Opportunities
Another opportunity for students to reduce the cost of college is to take college courses while
still in high school. Dual enrollment is a process where a student gets both college and high school
credit for the same
course, leaving
students with fewer
classes to take for a
college degree.
A slightly
smaller portion of the
population (49
percent) report
knowing “some” or
“quite a lot” about
dual enrollment
opportunities and said
the same about the
college transfer
process (54 percent).
However, the age
breakdown suggests
that dual enrollment
has its greatest
awareness among the
youngest cohort. Fifty-
nine percent of those
ages 18-34 reported
“some” or “quite a lot” of knowledge about dual enrollment, compared to 46 percent of 45- to 64-year-
olds; 44 percent of 35- to 44-year-olds; and 42 percent of those 65 or older.
Similar to familiarity with the transfer process, those with a college degree (59 percent) and
those who are parents of a Virginia college student (58 percent) were more likely to report “some” or
“quite a lot” about the options for dual enrollment than were others (50 percent and 38 percent,
respectively, for those with some college and a high school degree or less; 45 percent for non-parents).
Knowledge about Dual Enrollment Opportunities Virginia’s dual-enrollment program gives qualifies students the opportunity to complete courses for college credit while they are still in high school. How much do you know about Virginia’s dual-enrollment program? (Percentage saying each)
Source: Commonwealth Education Poll 2016-17
20
29
16
22
31
17
24
24
27
31
16
21
19
32
23
25
29
22
28
28
25
23
24
26
32
26
25
25
27
26
30
25
32
29
26
36
24
30
28
22
31
31
31
24
29
25
16
30
21
15
23
30
22
22
15
26
23
25
17
22
0 20 40 60 80 100
Not a parent
Parent of VA college student
H.S. or less
Some college
College degree
Northern Va.
Northwest
West
Tidewater
South Central
65+
45-64
35-44
18-34
All
Quite a lot Some Very little Nothing at all DK/Refused

Commonwealth Education Poll 2016-2017 Page 15
There were also regional differences in reported knowledge about dual enrollment options. The
South Central region (at 63 percent) had the greatest likelihood of respondents saying they knew some
or quite a lot about such opportunities. This was followed by Tidewater (53 percent), the West and
Northwest region (48 percent and 47 percent, respectively). Those in Northern Virginia (42 percent)
were least likely to report a similar knowledge about dual enrollment opportunities.
Majority Willing to Pay More to Increase Need-Based Financial Aid The affordability of college remains a significant concern to both policymakers and the public
but budget constraints at the state have reduced public funding for state colleges and universities
significantly over the past two decades. Facing a statewide budget shortfall, the governor recently
proposed budget amendments that would cut previously authorized funding for most public colleges
and universities by 5 percent. As noted above on page 9, only 45 percent of Virginians would be willing
to pay increased taxes in order to keep university and higher education funding from the state at current
levels (51 percent were not willing). To
see whether Virginians are more willing
to pay taxes for a focused priority
within higher education that responds
to concerns about affordability, we
asked whether respondents would be
willing or not willing to pay more in
taxes to increase need-based financial
aid for college students.
A slight majority of respondents
(54 percent) said they would be willing
to pay more in taxes for this specific
higher education focus, compared to 45
percent who said they would not be
willing. As with other tax-related
questions, the portion of respondents
willing to pay more differed between
minority respondents (71 percent willing) and white respondents (48 percent willing). Political identity
also created differences—Democrats (at 69 percent) were more often willing to pay more in taxes for
increased need-based financial aid than were Independents (55 percent) and Republicans (40 percent).
More Taxes to Increase Need-Based Financial Aid? Many families struggle to afford a college education. Would you be willing or not willing to pay more in taxes to increase need-based financial aid for college students? (Percentage saying each)
Source: Commonwealth Education Poll 2016-17
40
55
69
48
71
54
60
42
30
51
29
45
0 20 40 60 80 100
Republicans
Independents
Democrats
White
Minority
All adults
Willing Not Willing Don't know

Commonwealth Education Poll 2016-2017 Page 16
Public Wants Universities to Invest Non-Public Funds in Reducing Tuition
University administrators face difficult choices in directing available funds, often facing calls to
make college more affordable, to increase the number of students admitted (which requires additional
teaching and classroom resources) and to build new facilities that are attractive to high-quality
prospective students. Public universities use both taxpayer money (on which legislators can set certain
restrictions) and privately donated funds from alumni or other non-taxpayer sources to pursue all of
these objectives, but private funds are less subject to public oversight. In order to get a sense of where
the public would come down on this question that constantly faces administrators, we asked
respondents to pick which area (affordability, access or attracting quality students) they think should
receive the most emphasis.
Almost three of every four respondents (74 percent) selected reducing tuition and fees to make
college attendance more affordable for Virginians as their preferred emphasis. Placing a distant second
was expansion of faculty and resources to admit a greater number of students (15 percent) while only 7
percent preferred an emphasis on building new facilities to attract the highest quality students.
On What Should Universities Spend Non-Public Funds? If a public university has funds donated by alumni or other private, non-taxpayer sources, should the university place the most emphasis on (1) building new facilities to attract the highest quality students, (2) reducing the tuition rate and fees to make attendance more affordable for Virginia residents OR (3) expanding teaching faculty and classroom resources in order to admit a greater number of students? (Percentage saying each)
Source: Commonwealth Education Poll 2016-17
72
80
67
75
80
74
17
10
17
15
14
15
6
8
11
5
3
7
0 20 40 60 80 100
Not a parent
Parent of VA college student
H.S. or less
Some college
College degree
All
Reducing Tuition and Fees Expanding teaching faculty and resources
Building new facilities None (Vol.)
All (Vol.) DK/Refused

Commonwealth Education Poll 2016-2017 Page 17
Those respondents with a college degree (at 80 percent) were most likely to select the reduction
of tuition and fees, while 75 percent of those with some college education and 67 percent of those with
a high school degree or less said the same. Responses also diverged significantly if the respondent had a
child who currently or in the past attended a college or university in Virginia—80 percent of parents of a
Virginia college student favored reducing tuition, compared to 72 percent of those who were not.
Public Perception of Campus Safety Hits New High
Despite continued concerns about the possibility of mass shootings or other attacks on college
campuses, a strong majority
of Virginians (74 percent)
believes that the state’s
college and university
campuses are safe or very
safe, with 16 percent saying
very safe. This is up from
2016, when 67 percent
judged campuses safe or
very safe, and marks the
highest perception of
safety found in four years
of asking this question.
This year only 24 percent of
respondents said that
campuses are not very or
not at all safe, down from
30 percent last year. Both
shifts are just inside the
statistical margin error, so
examining the same
question next year will be
important for establishing
whether the increase in
those seeing campuses as
How Safe are College Campuses? (Regional breakdown) Based on what you know, how safe are college and university campuses in Virginia? (Percentage saying each)
Source: Commonwealth Education Poll 2016-17
17
14
19
13
13
21
17
14
19
16
52
58
63
53
60
60
46
62
57
58
26
24
15
28
19
16
28
20
19
21
3
2
4
4
4
3
2
3
0 20 40 60 80 100
Under $50K
$50K to $100K
$100K or more
H.S. or less
Some college
College degree
Independents
Republicans
Democrats
All adults
Very Safe Safe Not Very Safe Not at All Safe Don't Know
How Safe are College Campuses?
Based on what you know, how safe are college and university campuses in Virginia?
2017 2016 2015 2014
Very safe 16 14 11 12
Safe 58 53 55 58
Not very safe 21 27 28 22
Not safe at all 3 3 4 3
Don’t know/Refused 2 3 2 4
Source: Commonwealth Education Poll 2016-17

Commonwealth Education Poll 2016-2017 Page 18
safe is an actual change, or whether it is simply statistical variation.
Perceptions of campus safety diverge somewhat based on partisan identity with Independents
(at 63 percent) less likely to describe campuses as safe or very safe, compared to 76 percent for both
Republicans and Democrats.
Additionally, those with personal experience on a college campus had a higher estimation of
safety. Respondents with some college (73 percent) or a college degree or more (81 percent) were
more likely to say campuses were safe or very safe, compared to those with a high school diploma or
less (66 percent).
Respondents in the highest household income category ($100,000 or more annual income) were
significantly more positive about campus safety (82 percent said campuses are safe or very safe) than
were those with household income in the $50,000 to $100,000 range (72 percent) or the under $50,000
range (69 percent).

Commonwealth Education Poll 2016-2017 Page 19
Methodology of the Commonwealth Education Poll
The Commonwealth Education Poll 2016-17, sponsored by Virginia Commonwealth University (VCU), obtained
telephone interviews with a representative sample of 806 adults, age 18 or older, living in Virginia. Telephone interviews were
conducted by landline (400) and cell phone (406, including 197 without a landline phone). The survey was conducted by
Princeton Survey Research Associates International (PSRAI). Interviews were done in English by Princeton Data Source from
November 8-17, 2016. Statistical results are weighted to correct known demographic discrepancies. The margin of sampling
error for the complete set of weighted data is ± 4.3 percentage points.
A combination of landline and cellular random digit dial (RDD) samples was used to represent all adults in Virginia
who have access to either a landline or cellular telephone. Both samples were provided by Survey Sampling International, LLC
(SSI) according to PSRAI specifications. Numbers for the landline sample were drawn with probabilities in proportion to their
share of listed telephone households from active blocks (area code + exchange + two-digit block number) that contained three
or more residential directory listings. The cellular sample was not list-assisted, but was drawn through a systematic sampling
from dedicated wireless 100-blocks and shared service 100-blocks with no directory-listed landline numbers.
The data are weighted to adjust for unequal probabilities of selection due to multiple adults living in landline
households and for frame size of the landline and cell phone sampling frames. In addition, the data are weighted on sex, age,
education, race, Hispanic origin, region of residence and population density to reflect the demographic composition of the adult
population in Virginia. Percentages reported in the text and tables are weighted, while the number of cases shown in the tables
for various subgroups is the actual number of respondents.
Questions answered by the full sample of adults are subject to a sampling error of plus or minus 4.3 percentage
points at the 95 percent level of confidence. This means that in 95 out of 100 samples like the one used here, the results
obtained should be no more than 4.3 percentage points above or below the figure that would be obtained by interviewing all
Virginian residents with telephones. Where the answers of subgroups are reported, the sampling error would be higher.
Because of non-response (refusals to participate, etc.), standard calculations of sampling error are apt to understate the actual
extent to which survey results are at variance with the true population values. Surveys are also subject to errors from sources
other than sampling. While every effort is made to identify such errors, they are often difficult or impossible to measure.
Readers making use of the results are urged to be mindful of the limitations inherent in survey research.

Commonwealth Education Poll 2016-2017 Page 20
Commonwealth Education Poll 2016-17 Statewide survey of Virginians3
November 8-17, 2016 Number of Respondents: 806
Q5. As I mention a few areas that receive money from the state government, tell me if you would be willing or not
willing to pay more in taxes in order to keep the program going at its current level. (First, / Next,) [INSERT ITEM;
RANDOMIZE]… READ FOR FIRST ITEM, THEN IF NECESSARY: Would you be willing or not willing to pay more in
taxes in order to keep this program going at its current level?
Willing Not willing DK Willing Not willing DK % % % % % %
c. Universities and higher education4 d. Programs for workforce training and development5
16-17 45 51 4 16-17 58 38 4
15-16 50 49 1 14-15 48 50 3 13-14 49 49 2 12-13 50 46 4 11-12 49 47 4 10-11 50 44 6 09-10 48 49 3 08-09 46 49 5
3 Percentages may add to 99 or 101 due to rounding. Cells that are blank contain no cases. Cells with a zero percent entry contain cases, but the percentage is less than 0.5%. 4 “Public” was added to the 2010-2011 wording. 5 New in 2016-17.
Commonwealth Education Poll 2016-2017 Page 21
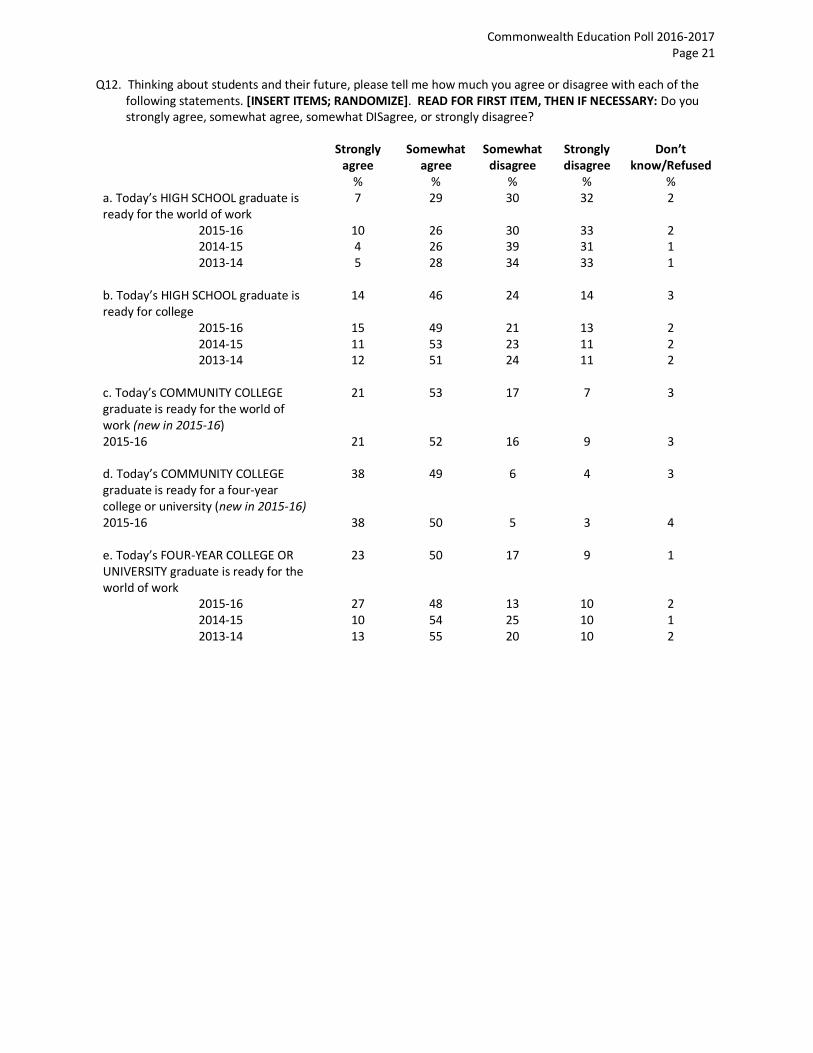
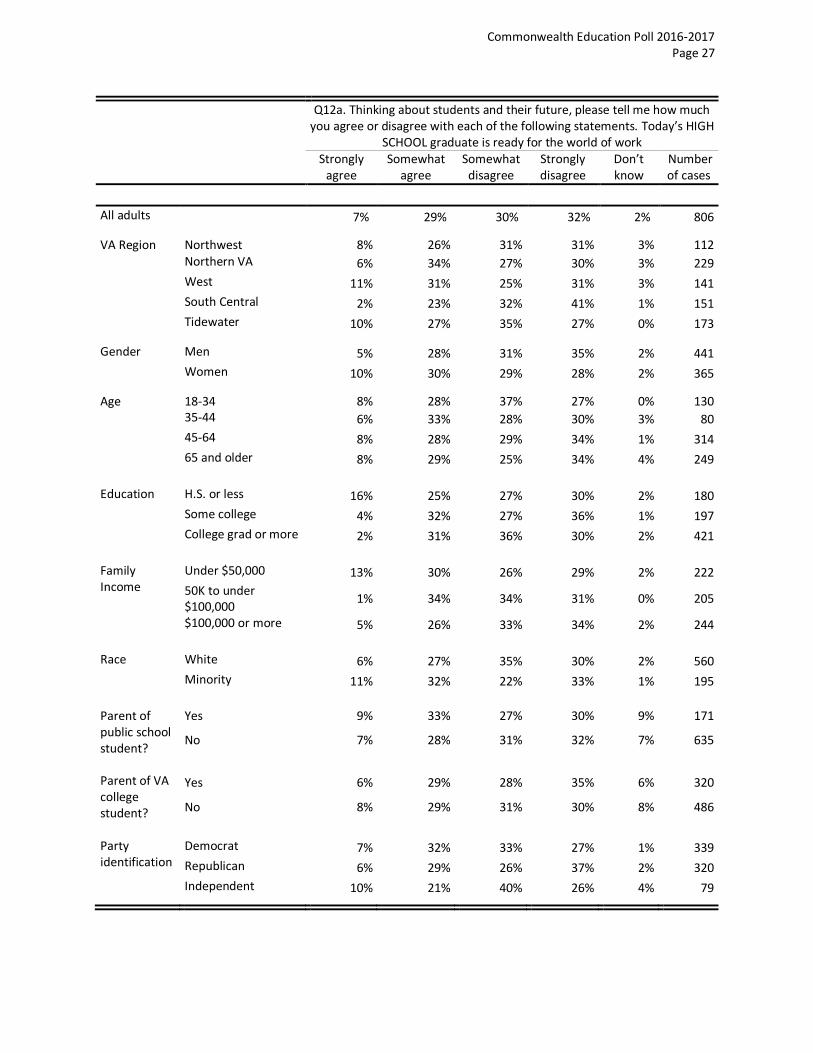
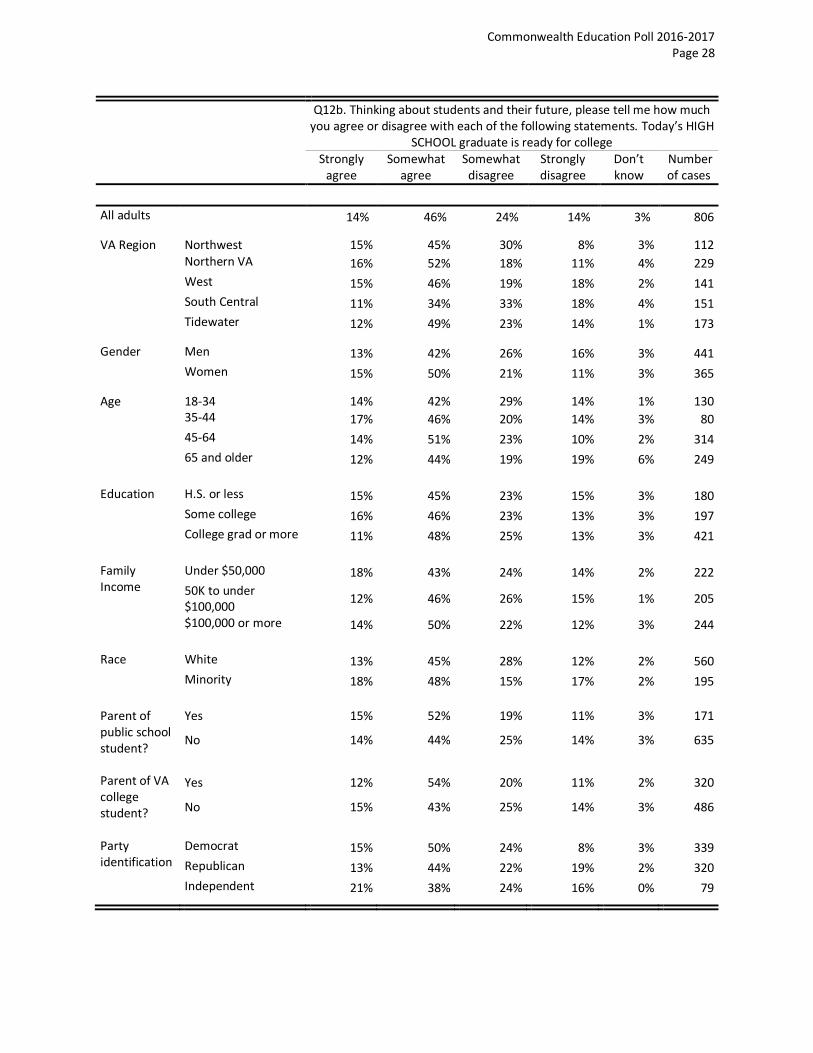
Q12. Thinking about students and their future, please tell me how much you agree or disagree with each of the following statements. [INSERT ITEMS; RANDOMIZE]. READ FOR FIRST ITEM, THEN IF NECESSARY: Do you strongly agree, somewhat agree, somewhat DISagree, or strongly disagree?
Strongly agree
Somewhat agree
Somewhat disagree
Strongly disagree
Don’t know/Refused
% % % % % a. Today’s HIGH SCHOOL graduate is ready for the world of work
7 29 30 32 2
2015-16 10 26 30 33 2 2014-15 4 26 39 31 1 2013-14 5 28 34 33 1
b. Today’s HIGH SCHOOL graduate is ready for college
14 46 24 14 3
2015-16 15 49 21 13 2 2014-15 11 53 23 11 2 2013-14 12 51 24 11 2
c. Today’s COMMUNITY COLLEGE graduate is ready for the world of work (new in 2015-16)
21 53 17 7 3
2015-16 21 52 16 9 3 d. Today’s COMMUNITY COLLEGE graduate is ready for a four-year college or university (new in 2015-16)
38 49 6 4 3
2015-16 38 50 5 3 4 e. Today’s FOUR-YEAR COLLEGE OR UNIVERSITY graduate is ready for the world of work
23 50 17 9 1
2015-16 27 48 13 10 2 2014-15 10 54 25 10 1 2013-14 13 55 20 10 2

Commonwealth Education Poll 2016-2017 Page 22
Now, thinking about colleges and universities in Virginia…
Q14. Overall do you think that colleges and universities in Virginia are doing a good job or bad job...
Good job
Bad job
Don’t know
% % % a. In providing the skills that will be useful in obtaining a job 67 26 7
15-16 68 22 10
14-15 69 22 10
13-14 72 18 10
12-13 65 18 16
11-12 68 19 13
b. In developing students’ writing and communication skills 63 29 8
15-16 65 24 12
14-15 62 28 11
13-14 63 25 12
12-13 59 24 17
11-12 57 25 18
c. In producing graduates in scientific fields, such as engineering, math and technology
75 16 10
15-16 72 16 12
14-15 72 16 12
13-14 72 12 16
12-13 67 12 20
11-12 68 12 21
d. In preparing students for the workforce needs of the future 64 27 9
15-16 70 20 10
14-15 65 26 9
13-14 69 21 11
12-13 62 21 16
11-12 66 20 14
e. In preparing students to be engaged citizens6 61 32 8
6 New in 2016-17.

Commonwealth Education Poll 2016-2017 Page 23
Q15. How much do you know about the process of transferring from a two-year to a four-year school—quite a lot,
some, very little, or nothing at all?
16-17 VCCS 20137 % %
Quite a lot 24 15 Some 30 29 Very little 26 31 Nothing at all 19 23 Don’t Know/Refused 1 1
ASK IF Q15=1, 2
Q16. How would you rate the process of transferring from a community college to a four-year college or
university? Would you say it is very easy, somewhat easy, somewhat difficult or very difficult?
16-17 VCCS 20138 % %
Very easy 16 18 Somewhat easy 50 53 Somewhat difficult 28 18 Very difficult 3 0 Don’t Know/Refused 3 10
On another topic…
Q17. Virginia’s dual enrollment program gives qualifies students the opportunity to complete courses for college
credit while they are still in high school. How much do you know about Virginia’s dual enrollment program?
16-17 %
Quite a lot 23 Some 26 Very little 29 Nothing at all 22 Don’t Know/Refused 0
Q18. Many families struggle to afford a college education. Would you be willing or not willing to pay more in taxes
to increase need-based financial aid for college students?
16-17 % Willing 54 Not willing 45 Don’t Know/Refused 1
7 Perceptions of Community Colleges in VA, November 7-14, 2013. N=801 Virginia residents. 8 Perceptions of Community Colleges in VA, November 7-14, 2013. N=801 Virginia residents.

Commonwealth Education Poll 2016-2017 Page 24
Q19. If a public university has funds donated by alumni or other private, non-taxpayer sources, should the
university place the most emphasis on [READ AND RANDOMIZE]?
16-17 % Building new facilities to attract the highest quality students 7 Reducing the tuition rate and fees to make attendance more affordable for Virginia residents
74
Expanding teaching faculty and classroom resources in order to admit a greater number of students
15
None of these (Volunteered) 1 All of these (Volunteered) 1 Don’t Know/Refused 2
Q20. Based on what you know, how safe are college and university campuses in Virginia?
16-17 15-16 14-15 13-14 12-13* 11-12* % % % % % % Very safe 16 14 11 12 22 25 Safe 58 53 55 58 58 53 Not very safe 21 27 28 22 12 13 Not at all safe 3 3 4 3 4 4 Don’t Know/Refused 2 3 2 4 4 5
*Response wording was “somewhat safe” instead of “safe.”
Switching gears… Q22. Next, when spending state funds on economic development, on which ONE of the following should the
Commonwealth place the MOST emphasis? [READ AND RANDOMIZE]
16-17 % Using financial incentives to recruit new businesses to Virginia 25 Retaining and expanding existing businesses in Virginia 23 Expanding workforce training and education in Virginia 47 None of these (Volunteered) 0 All of these (Volunteered) 2 Don’t Know/Refused 3

Commonwealth Education Poll 2016-2017 Page 25
Tables with Subgroup Analysis
Q5c. As I mention a few areas that receive money from the state government, tell me if you would be willing or not willing to pay
more in taxes in order to keep the – universities and higher education - program going at its current level.
Yes, willing to pay more in taxes No, not willing Don’t know
Number of cases
All adults 45% 51% 4% 806
VA Region
Northwest 40% 57% 3% 112 Northern VA 51% 46% 3% 229
West 40% 54% 6% 141
South Central 46% 52% 2% 151
Tidewater 44% 52% 4% 173 Gender Men 44% 53% 3% 441
Women 46% 49% 4% 365 Age 18-34 54% 43% 2% 130
35-44 51% 43% 6% 80
45-64 37% 59% 4% 314
65 and older 43% 56% 2% 249 Education
H.S. or less 47% 49% 4% 180
Some college 41% 56% 3% 197
College grad or more 48% 49% 3% 421 Family Income Under $50,000 42% 54% 4% 222
50K to under $100,000 47% 49% 4% 205
$100,000 or more 51% 48% 2% 244 Race White 41% 55% 4% 560
Minority 56% 42% 2% 195 School employee or retiree?
Yes 49% 46% 5% 179
No 44% 53% 3% 624 Parent of public school student?
Yes 46% 52% 3% 171
No 45% 51% 4% 635 Party identification
Democrat 58% 39% 3% 339
Republican 29% 67% 4% 320
Independent 54% 40% 6% 79

Commonwealth Education Poll 2016-2017 Page 26
Q5d. As I mention a few areas that receive money from the state government, tell me if you would be willing or not willing to pay
more in taxes in order to keep the – Programs for workforce training and development - program going at its current level.
Yes, willing to pay more in taxes No, not willing Don’t know
Number of cases
All adults 58% 38% 4% 806
VA Region
Northwest 49% 51% 1% 112 Northern VA 57% 38% 6% 229
West 59% 37% 4% 141
South Central 65% 29% 6% 151
Tidewater 60% 37% 3% 173 Gender Men 58% 39% 4% 441
Women 59% 37% 4% 365 Age 18-34 63% 32% 5% 130
35-44 60% 35% 5% 80
45-64 51% 46% 3% 314
65 and older 66% 32% 3% 249 Education
H.S. or less 59% 38% 3% 180
Some college 57% 39% 4% 197
College grad or more 59% 36% 6% 421 Family Income Under $50,000 61% 37% 2% 222
50K to under $100,000 57% 38% 4% 205
$100,000 or more 59% 37% 3% 244 Race White 55% 41% 5% 560
Minority 66% 32% 2% 195 School employee or retiree?
Yes 61% 34% 5% 179
No 57% 39% 4% 624 Parent of public school student?
Yes 50% 47% 3% 171
No 61% 34% 5% 635 Party identification
Democrat 69% 28% 3% 339
Republican 46% 49% 4% 320
Independent 60% 34% 6% 79
Commonwealth Education Poll 2016-2017 Page 27
Q12a. Thinking about students and their future, please tell me how much you agree or disagree with each of the following statements. Today’s HIGH
SCHOOL graduate is ready for the world of work Strongly
agree Somewhat
agree Somewhat
disagree Strongly disagree
Don’t know
Number of cases
All adults 7% 29% 30% 32% 2% 806
VA Region
Northwest 8% 26% 31% 31% 3% 112 Northern VA 6% 34% 27% 30% 3% 229
West 11% 31% 25% 31% 3% 141
South Central 2% 23% 32% 41% 1% 151
Tidewater 10% 27% 35% 27% 0% 173 Gender Men 5% 28% 31% 35% 2% 441
Women 10% 30% 29% 28% 2% 365 Age 18-34 8% 28% 37% 27% 0% 130
35-44 6% 33% 28% 30% 3% 80
45-64 8% 28% 29% 34% 1% 314
65 and older 8% 29% 25% 34% 4% 249 Education
H.S. or less 16% 25% 27% 30% 2% 180
Some college 4% 32% 27% 36% 1% 197
College grad or more 2% 31% 36% 30% 2% 421 Family Income
Under $50,000 13% 30% 26% 29% 2% 222
50K to under $100,000
1% 34% 34% 31% 0% 205
$100,000 or more 5% 26% 33% 34% 2% 244 Race White 6% 27% 35% 30% 2% 560
Minority 11% 32% 22% 33% 1% 195 Parent of public school student?
Yes 9% 33% 27% 30% 9% 171
No 7% 28% 31% 32% 7% 635
Parent of VA college student?
Yes 6% 29% 28% 35% 6% 320
No 8% 29% 31% 30% 8% 486 Party identification
Democrat 7% 32% 33% 27% 1% 339
Republican 6% 29% 26% 37% 2% 320
Independent 10% 21% 40% 26% 4% 79
Commonwealth Education Poll 2016-2017 Page 28
Q12b. Thinking about students and their future, please tell me how much you agree or disagree with each of the following statements. Today’s HIGH
SCHOOL graduate is ready for college Strongly
agree Somewhat
agree Somewhat
disagree Strongly disagree
Don’t know
Number of cases
All adults 14% 46% 24% 14% 3% 806
VA Region
Northwest 15% 45% 30% 8% 3% 112 Northern VA 16% 52% 18% 11% 4% 229
West 15% 46% 19% 18% 2% 141
South Central 11% 34% 33% 18% 4% 151
Tidewater 12% 49% 23% 14% 1% 173 Gender Men 13% 42% 26% 16% 3% 441
Women 15% 50% 21% 11% 3% 365 Age 18-34 14% 42% 29% 14% 1% 130
35-44 17% 46% 20% 14% 3% 80
45-64 14% 51% 23% 10% 2% 314
65 and older 12% 44% 19% 19% 6% 249 Education
H.S. or less 15% 45% 23% 15% 3% 180
Some college 16% 46% 23% 13% 3% 197
College grad or more 11% 48% 25% 13% 3% 421 Family Income
Under $50,000 18% 43% 24% 14% 2% 222
50K to under $100,000
12% 46% 26% 15% 1% 205
$100,000 or more 14% 50% 22% 12% 3% 244 Race White 13% 45% 28% 12% 2% 560
Minority 18% 48% 15% 17% 2% 195 Parent of public school student?
Yes 15% 52% 19% 11% 3% 171
No 14% 44% 25% 14% 3% 635
Parent of VA college student?
Yes 12% 54% 20% 11% 2% 320
No 15% 43% 25% 14% 3% 486 Party identification
Democrat 15% 50% 24% 8% 3% 339
Republican 13% 44% 22% 19% 2% 320
Independent 21% 38% 24% 16% 0% 79

Commonwealth Education Poll 2016-2017 Page 29
Q12c. Thinking about students and their future, please tell me how much you agree or disagree with each of the following statements. Today’s
COMMUNITY COLLEGE graduate is ready for the world of work Strongly
agree Somewhat
agree Somewhat
disagree Strongly disagree
Don’t know
Number of cases
All adults 21% 53% 17% 7% 3% 806
VA Region
Northwest 21% 56% 12% 8% 4% 112 Northern VA 19% 56% 16% 4% 5% 229
West 19% 58% 17% 7% 0% 141
South Central 12% 56% 20% 11% 1% 151
Tidewater 32% 41% 19% 6% 2% 173 Gender Men 23% 49% 16% 10% 3% 441
Women 18% 57% 18% 4% 3% 365 Age 18-34 21% 56% 18% 3% 3% 130
35-44 25% 47% 19% 7% 2% 80
45-64 18% 55% 16% 9% 2% 314
65 and older 22% 50% 15% 8% 4% 249 Education
H.S. or less 25% 47% 16% 9% 3% 180
Some college 21% 57% 18% 4% 0% 197
College grad or more 16% 57% 17% 7% 4% 421 Family Income
Under $50,000 25% 50% 15% 8% 2% 222
50K to under $100,000
19% 55% 18% 8% 1% 205
$100,000 or more 20% 54% 19% 5% 2% 244 Race White 19% 55% 16% 7% 4% 560
Minority 24% 52% 19% 5% 0% 195 Parent of public school student?
Yes 20% 57% 16% 6% 2% 171
No 21% 52% 17% 7% 3% 635
Parent of VA college student?
Yes 23% 52% 15% 8% 2% 320
No 19% 54% 18% 6% 3% 486 Party identification
Democrat 21% 55% 18% 4% 2% 339
Republican 19% 57% 15% 7% 2% 320
Independent 25% 41% 21% 12% 1% 79

Commonwealth Education Poll 2016-2017 Page 30
Q12d. Thinking about students and their future, please tell me how much you agree or disagree with each of the following statements. Today’s
COMMUNITY COLLEGE graduate is ready for a four-year college or university
Strongly agree
Somewhat agree
Somewhat disagree
Strongly disagree
Don’t know
Number of cases
All adults 38% 49% 6% 4% 3% 806
VA Region
Northwest 35% 50% 10% 2% 3% 112 Northern VA 39% 48% 3% 3% 7% 229
West 38% 46% 10% 5% 1% 141
South Central 32% 55% 9% 3% 2% 151
Tidewater 44% 47% 4% 5% 1% 173 Gender Men 38% 47% 6% 6% 4% 441
Women 39% 51% 7% 1% 2% 365 Age 18-34 46% 44% 5% 3% 3% 130
35-44 39% 53% 1% 3% 4% 80
45-64 36% 51% 9% 3% 2% 314
65 and older 30% 49% 9% 7% 5% 249 Education
H.S. or less 32% 51% 8% 5% 4% 180
Some college 41% 51% 5% 2% 1% 197
College grad or more 41% 45% 6% 4% 3% 421 Family Income
Under $50,000 37% 52% 5% 4% 2% 222
50K to under $100,000
39% 47% 11% 2% 2% 205
$100,000 or more 43% 46% 3% 4% 4% 244 Race White 39% 48% 7% 2% 4% 560
Minority 40% 49% 4% 6% 1% 195 Parent of public school student?
Yes 39% 54% 3% 2% 2% 171
No 38% 47% 8% 4% 4% 635
Parent of VA college student?
Yes 39% 48% 8% 4% 2% 320
No 38% 49% 6% 4% 4% 486 Party identification
Democrat 41% 49% 4% 4% 3% 339
Republican 37% 50% 8% 2% 2% 320
Independent 32% 50% 10% 6% 1% 79

Commonwealth Education Poll 2016-2017 Page 31
Q12e. Thinking about students and their future, please tell me how much you agree or disagree with each of the following statements. Today’s
FOUR-YEAR COLLEGE OF UNIVERSITY graduate is ready for the world of work
Strongly agree
Somewhat agree
Somewhat disagree
Strongly disagree
Don’t know
Number of cases
All adults 23% 50% 17% 9% 1% 806
VA Region
Northwest 27% 43% 17% 10% 4% 112 Northern VA 28% 45% 20% 5% 2% 229
West 25% 53% 12% 9% 0% 141
South Central 12% 58% 15% 14% 1% 151
Tidewater 22% 51% 17% 9% 0% 173 Gender Men 20% 48% 18% 12% 1% 441
Women 26% 51% 15% 6% 2% 365 Age 18-34 30% 43% 22% 5% 0% 130
35-44 19% 60% 11% 11% 0% 80
45-64 21% 52% 16% 10% 1% 314
65 and older 23% 48% 14% 11% 4% 249 Education
H.S. or less 25% 43% 18% 11% 2% 180
Some college 23% 48% 17% 11% 1% 197
College grad or more 21% 57% 14% 6% 1% 421 Family Income
Under $50,000 27% 45% 16% 10% 1% 222
50K to under $100,000
15% 58% 18% 9% 0% 205
$100,000 or more 24% 53% 16% 7% 0% 244 Race White 19% 51% 18% 10% 2% 560
Minority 32% 48% 14% 6% 0% 195 Parent of public school student?
Yes 28% 51% 14% 7% 1% 171
No 22% 49% 18% 10% 2% 635
Parent of VA college student?
Yes 22% 54% 17% 7% 0% 320
No 24% 48% 16% 10% 2% 486 Party identification
Democrat 29% 51% 14% 6% 0% 339
Republican 18% 50% 18% 12% 1% 320
Independent 24% 40% 21% 10% 4% 79

Commonwealth Education Poll 2016-2017 Page 32
Q14a. Overall do you think the college and universities in Virginia are doing a good job or bad job… in providing skills that will be
useful in obtaining a job?
Good job Bad job Don’t know Number of
cases
All adults 67% 26% 7% 806
VA Region
Northwest 70% 19% 11% 112 Northern VA 69% 25% 6% 229
West 67% 24% 10% 141
South Central 60% 35% 5% 151
Tidewater 71% 25% 4% 173 Gender Men 65% 27% 7% 441
Women 69% 24% 6% 365 Age 18-34 69% 27% 3% 130
35-44 64% 29% 7% 80
45-64 68% 24% 8% 314
65 and older 71% 20% 9% 249 Education
H.S. or less 70% 23% 7% 180
Some college 67% 27% 6% 197
College grad or more 66% 27% 7% 421 Family Income Under $50,000 66% 28% 6% 222
50K to under $100,000 64% 30% 6% 205
$100,000 or more 75% 20% 5% 244 Race White 68% 22% 10% 560
Minority 71% 27% 1% 195 Parent of VA college student
Yes 68% 25% 7% 320
No 67% 26% 7% 486 Party identification
Democrat 70% 25% 5% 339
Republican 68% 26% 6% 320
Independent 65% 24% 11% 79

Commonwealth Education Poll 2016-2017 Page 33
Q14b.Overall do you think the college and universities in Virginia are doing a good job or bad job… in developing students’ writing
and communication skills?
Good job Bad job Don’t know Number of
cases
All adults 63% 29% 8% 806
VA Region
Northwest 71% 25% 4% 112 Northern VA 59% 30% 11% 229
West 66% 25% 8% 141
South Central 64% 30% 6% 151
Tidewater 59% 33% 8% 173 Gender Men 62% 29% 8% 441
Women 64% 29% 8% 365 Age 18-34 78% 17% 5% 130
35-44 56% 33% 12% 80
45-64 61% 34% 6% 314
65 and older 53% 34% 13% 249 Education
H.S. or less 66% 25% 10% 180
Some college 64% 31% 5% 197
College grad or more 59% 32% 9% 421 Family Income Under $50,000 68% 24% 8% 222
50K to under $100,000 57% 36% 6% 205
$100,000 or more 64% 27% 10% 244 Race White 60% 32% 8% 560
Minority 72% 19% 9% 195 Parent of VA college student
Yes 62% 32% 6% 320
No 63% 28% 9% 486 Party identification
Democrat 68% 24% 8% 339
Republican 59% 33% 8% 320
Independent 56% 40% 4% 79

Commonwealth Education Poll 2016-2017 Page 34
Q14c.Overall do you think the college and universities in Virginia are doing a good job or bad job… in producing graduates in scientific
fields, such as engineering, math and technology?
Good job Bad job Don’t know Number of
cases
All adults 75% 16% 10% 806
VA Region
Northwest 68% 22% 10% 112 Northern VA 80% 11% 10% 229
West 80% 11% 9% 141
South Central 67% 22% 11% 151
Tidewater 75% 15% 10% 173 Gender Men 71% 20% 9% 441
Women 78% 11% 10% 365 Age 18-34 80% 15% 4% 130
35-44 72% 16% 12% 80
45-64 74% 15% 11% 314
65 and older 70% 16% 13% 249 Education
H.S. or less 74% 16% 10% 180
Some college 75% 17% 9% 197
College grad or more 76% 14% 11% 421 Family Income Under $50,000 75% 17% 8% 222
50K to under $100,000 69% 21% 10% 205
$100,000 or more 77% 12% 11% 244 Race White 75% 14% 11% 560
Minority 76% 16% 9% 195 Parent of VA college student
Yes 73% 18% 9% 320
No 76% 14% 10% 486 Party identification
Democrat 79% 14% 7% 339
Republican 74% 16% 10% 320
Independent 66% 13% 21% 79

Commonwealth Education Poll 2016-2017 Page 35
Q14d.Overall do you think the college and universities in Virginia are doing a good job or bad job… in preparing students for the
workforce needs of the future?
Good job Bad job Don’t know Number of
cases
All adults 64% 27% 9% 806
VA Region
Northwest 55% 33% 12% 112 Northern VA 68% 23% 10% 229
West 65% 27% 8% 141
South Central 63% 30% 6% 151
Tidewater 63% 27% 9% 173 Gender Men 60% 31% 10% 441
Women 68% 24% 8% 365 Age 18-34 67% 28% 4% 130
35-44 59% 27% 14% 80
45-64 66% 25% 9% 314
65 and older 62% 29% 9% 249 Education
H.S. or less 62% 29% 9% 180
Some college 65% 27% 8% 197
College grad or more 66% 26% 9% 421 Family Income Under $50,000 62% 30% 8% 222
50K to under $100,000 54% 37% 9% 205
$100,000 or more 73% 19% 7% 244 Race White 64% 26% 10% 560
Minority 66% 27% 7% 195 Parent of VA college student
Yes 66% 27% 8% 320
No 63% 28% 9% 486 Party identification
Democrat 66% 26% 7% 339
Republican 64% 29% 7% 320
Independent 58% 22% 20% 79
Commonwealth Education Poll 2016-2017 Page 36
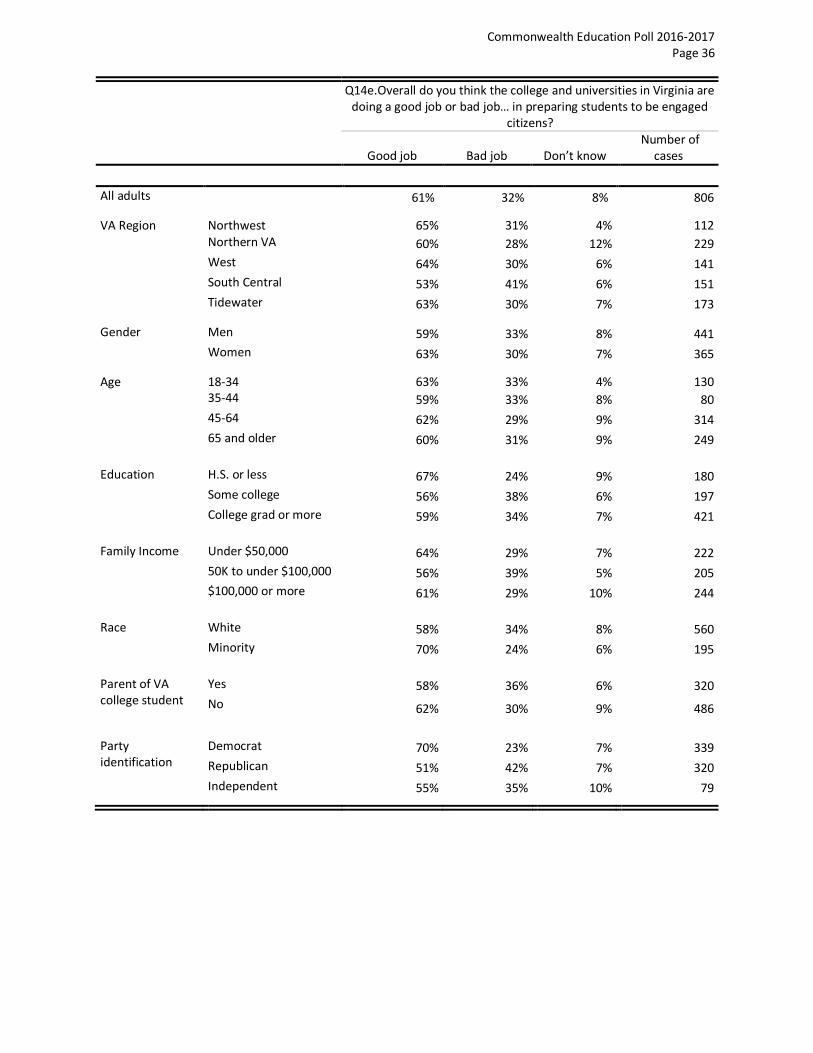
Q14e.Overall do you think the college and universities in Virginia are doing a good job or bad job… in preparing students to be engaged
citizens?
Good job Bad job Don’t know Number of
cases
All adults 61% 32% 8% 806
VA Region
Northwest 65% 31% 4% 112 Northern VA 60% 28% 12% 229
West 64% 30% 6% 141
South Central 53% 41% 6% 151
Tidewater 63% 30% 7% 173 Gender Men 59% 33% 8% 441
Women 63% 30% 7% 365 Age 18-34 63% 33% 4% 130
35-44 59% 33% 8% 80
45-64 62% 29% 9% 314
65 and older 60% 31% 9% 249 Education
H.S. or less 67% 24% 9% 180
Some college 56% 38% 6% 197
College grad or more 59% 34% 7% 421 Family Income Under $50,000 64% 29% 7% 222
50K to under $100,000 56% 39% 5% 205
$100,000 or more 61% 29% 10% 244 Race White 58% 34% 8% 560
Minority 70% 24% 6% 195 Parent of VA college student
Yes 58% 36% 6% 320
No 62% 30% 9% 486 Party identification
Democrat 70% 23% 7% 339
Republican 51% 42% 7% 320
Independent 55% 35% 10% 79

Commonwealth Education Poll 2016-2017 Page 37
Q15. How much do you know about the process of transferring from a two-year to a four-year school—quite a lot, some, very little, or nothing at
all? Quite a
lot Some Very Little Nothing At
All Don’t know
Number of cases
All adults 24% 30% 26% 19% 1% 806
VA Region
Northwest 19% 24% 36% 21% 0% 112 Northern VA 23% 31% 25% 19% 2% 229
West 20% 28% 27% 23% 2% 141
South Central 33% 32% 20% 16% 0% 151
Tidewater 26% 31% 27% 15% 1% 173 Gender Men 21% 31% 31% 15% 1% 441
Women 27% 28% 22% 22% 1% 365 Age 18-34 27% 34% 27% 13% 0% 130
35-44 34% 23% 21% 19% 3% 80
45-64 22% 32% 25% 20% 2% 314
65 and older 17% 24% 34% 25% 0% 249 Education
H.S. or less 10% 25% 34% 29% 1% 180
Some college 26% 33% 25% 15% 1% 197
College grad or more 37% 32% 19% 11% 1% 421 Family Income
Under $50,000 20% 24% 32% 22% 1% 222
50K to under $100,000 28% 31% 28% 12% 1% 205
$100,000 or more 28% 31% 19% 23% 0% 244 Race White 23% 29% 26% 21% 1% 560
Minority 27% 30% 27% 15% 1% 195 Parent of VA college student
Yes 28% 32% 23% 16% 1% 320
No 23% 29% 28% 20% 1% 486 Party identification
Democrat 24% 28% 29% 18% 1% 339
Republican 24% 35% 24% 17% 1% 320
Independent 27% 21% 24% 28% 0% 79

Commonwealth Education Poll 2016-2017 Page 38
Q17. Virginia’s dual enrollment program gives qualifies students the opportunity to complete courses for college credit while they are still in high school. How much do you know about Virginia’s dual enrollment
program? Quite a
lot Some Very Little Nothing At
All Don’t know
Number of cases
All adults 23% 26% 29% 22% 0% 806
VA Region
Northwest 24% 23% 24% 30% 0% 112 Northern VA 17% 25% 36% 23% 0% 229
West 24% 24% 30% 22% 1% 141
South Central 31% 32% 22% 15% 0% 151
Tidewater 27% 26% 28% 22% 0% 173 Gender Men 21% 25% 28% 26% 0% 441
Women 25% 27% 29% 19% 0% 365 Age 18-34 32% 27% 24% 17% 0% 130
35-44 19% 25% 31% 25% 0% 80
45-64 21% 25% 31% 23% 0% 314
65 and older 16% 26% 31% 26% 0% 249 Education
H.S. or less 16% 22% 32% 30% 0% 180
Some college 22% 28% 29% 21% 0% 197
College grad or more 31% 28% 26% 15% 0% 421 Family Income
Under $50,000 18% 20% 35% 27% 0% 222
50K to under $100,000 23% 31% 30% 16% 0% 205
$100,000 or more 28% 29% 22% 21% 0% 244 Race White 21% 27% 29% 22% 0% 560
Minority 27% 24% 26% 22% 0% 195 Parent of VA college student
Yes 29% 29% 25% 16% 0% 320
No 20% 25% 30% 25% 0% 486 Party identification
Democrat 23% 26% 28% 23% 0% 339
Republican 24% 28% 28% 20% 0% 320
Independent 15% 17% 36% 31% 0% 79

Commonwealth Education Poll 2016-2017 Page 39
Q18. Many families struggle to afford a college education. Would you be willing or not willing to pay more in taxes to increase need-
based financial aid for college students?
Willing Not Willing Don’t know Number of
cases
All adults 54% 45% 1% 806
VA Region
Northwest 55% 45% 0% 112 Northern VA 56% 43% 1% 229
West 52% 45% 3% 141
South Central 55% 43% 1% 151
Tidewater 53% 47% 1% 173 Gender Men 53% 45% 2% 441
Women 55% 44% 1% 365 Age 18-34 64% 35% 1% 130
35-44 64% 34% 2% 80
45-64 44% 56% 1% 314
65 and older 53% 45% 2% 249 Education
H.S. or less 55% 44% 1% 180
Some college 56% 43% 1% 197
College grad or more 52% 46% 2% 421 Family Income Under $50,000 62% 38% 0% 222
50K to under $100,000 52% 47% 1% 205
$100,000 or more 52% 48% 0% 244 Race White 48% 51% 2% 560
Minority 71% 29% 1% 195 Parent of VA college student
Yes 52% 47% 1% 320
No 55% 44% 2% 486 Party identification
Democrat 69% 30% 1% 339
Republican 40% 60% 1% 320
Independent 55% 42% 2% 79

Commonwealth Education Poll 2016-2017 Page 40
Q19. If a public university has funds donated by alumni or other private, non-taxpayer sources, should the university place the most
emphasis on . . .?
Building new
facilities
Reducing tuition and
fees
Expanding teaching
faculty and resources
None of
these (Vol.)
All of these (Vol.)
Don’t know
Number of cases
All adults 7% 74% 15% 1% 1% 2% 806
VA Region
Northwest 5% 73% 16% 1% 3% 1% 112 Northern VA 7% 72% 18% 1% 1% 1% 229
West 5% 76% 9% 2% 1% 6% 141
South Central 11% 71% 15% 1% 2% 1% 151
Tidewater 4% 78% 17% 0% 0% 1% 173 Gender Men 9% 71% 16% 1% 1% 2% 441
Women 4% 77% 14% 1% 2% 2% 365 Age 18-34 4% 73% 20% 1% 2% 0% 130
35-44 5% 66% 20% 2% 3% 4% 80
45-64 7% 79% 12% 1% 1% 1% 314
65 and older 10% 75% 10% 1% 0% 4% 249 Education
H.S. or less 11% 67% 17% 1% 3% 2% 180
Some college 5% 75% 15% 1% 1% 2% 197
College grad or more 3% 80% 14% 0% 0% 2% 421 Family Income
Under $50,000 7% 75% 14% 0% 2% 2% 222
50K to under $100,000 6% 77% 13% 1% 1% 1% 205
$100,000 or more 7% 73% 15% 2% 2% 1% 244 Race White 6% 77% 13% 1% 2% 2% 560
Minority 7% 72% 18% 0% 1% 2% 195 Parent of VA college student
Yes 8% 80% 10% 0% 1% 2% 320
No 6% 72% 17% 1% 2% 2% 486 Party identification
Democrat 7% 72% 17% 0% 1% 2% 339
Republican 7% 75% 13% 2% 3% 1% 320
Independent 1% 77% 16% 3% 0% 2% 79

Commonwealth Education Poll 2016-2017 Page 41
Q20. Based on what you know, how safe are college and university campuses in Virginia?
Very Safe Safe
Not Very Safe
Not At All Safe
Don’t know
Number of cases
All adults 16% 58% 21% 3% 2% 806
VA Region
Northwest 16% 58% 20% 4% 2% 112 Northern VA 18% 62% 16% 1% 4% 229
West 14% 57% 23% 2% 4% 141
South Central 18% 52% 25% 5% 0% 151
Tidewater 14% 56% 24% 4% 1% 173 Gender Men 21% 51% 20% 4% 3% 441
Women 11% 64% 22% 2% 2% 365 Age 18-34 15% 62% 19% 3% 0% 130
35-44 18% 59% 18% 0% 5% 80
45-64 17% 57% 21% 3% 2% 314
65 and older 15% 52% 26% 4% 3% 249 Education
H.S. or less 13% 53% 28% 4% 1% 180
Some college 13% 60% 19% 4% 3% 197
College grad or more 21% 60% 16% 1% 3% 421 Family Income
Under $50,000 17% 52% 26% 3% 2% 222
50K to under $100,000 14% 58% 24% 2% 2% 205
$100,000 or more 19% 63% 15% 1% 2% 244 Race White 17% 57% 20% 2% 3% 560
Minority 14% 60% 22% 3% 1% 195 Parent of VA college student
Yes 13% 61% 21% 3% 2% 320
No 17% 56% 21% 3% 2% 486 Party identification
Democrat 19% 57% 19% 2% 3% 339
Republican 14% 62% 20% 3% 1% 320
Independent 17% 46% 28% 4% 6% 79

Commonwealth Education Poll 2016-2017 Page 42
Q22. Next, when spending state funds on economic development, on which ONE of the following should the Commonwealth place the
MOST emphasis on . . .? Financial
incentives to recruit
new businesses
Retain & expand existing business
Expand workforce training & education
None of
these (Vol.)
All of these (Vol.)
Don’t know
Number of cases
All adults 25% 23% 47% 0% 2% 3% 806
VA Region
Northwest 29% 21% 46% 0% 3% 1% 112 Northern VA 21% 22% 53% 0% 1% 3% 229
West 28% 31% 38% 0% 1% 2% 141
South Central 30% 23% 40% 0% 3% 5% 151
Tidewater 24% 18% 52% 0% 1% 4% 173 Gender Men 27% 26% 41% 0% 2% 4% 441
Women 24% 19% 52% 0% 2% 3% 365 Age 18-34 19% 19% 56% 0% 1% 4% 130
35-44 27% 21% 47% 0% 3% 1% 80
45-64 29% 25% 42% 0% 1% 2% 314
65 and older 28% 24% 42% 0% 1% 4% 249 Education
H.S. or less 26% 23% 45% 0% 1% 4% 180
Some college 26% 22% 48% 0% 3% 1% 197
College grad or more 24% 22% 48% 0% 1% 4% 421 Family Income
Under $50,000 23% 22% 50% 0% 2% 3% 222
50K to under $100,000 25% 21% 50% 0% 1% 3% 205
$100,000 or more 25% 26% 46% 0% 1% 2% 244 Race White 30% 25% 40% 0% 1% 3% 560
Minority 18% 17% 59% 0% 3% 3% 195 Party identification
Democrat 21% 18% 55% 0% 2% 3% 339
Republican 30% 27% 39% 0% 2% 2% 320
Independent 26% 28% 41% 0% 0% 3% 79