omics international welcomes submissions that are … · schematic representation of sequential...
TRANSCRIPT

OMICS International welcomes submissions that are original
and technically so as to serve both the developing world and
developed countries in the best possible way.
OMICS Journals are poised in excellence by publishing high
quality research. OMICS International follows an Editorial
Manager® System peer review process and boasts of a strong
and active editorial board.
Editors and reviewers are experts in their field and provide
anonymous, unbiased and detailed reviews of all submissions.
The journal gives the options of multiple language translations
for all the articles and all archived articles are available in
HTML, XML, PDF and audio formats. Also, all the published
articles are archived in repositories and indexing services like
DOAJ, CAS, Google Scholar, Scientific Commons, Index
Copernicus, EBSCO, HINARI and GALE.
For more details please visit our website: http://omicsonline.org/Submitmanuscript.php
OMICS Journals are welcoming Submissions

Krishna Nath
Western Michigan University, Kalamazoo, MI 49008, USA

Energy trapped, excitation of PSII and PSI, Electron transport, reduction of NADP to NADPH and the accumulation of protons in thylakoids lumen
The resulting proton motive force is used to make ATP by driving protons back across the membrane through ATPase.
Rubisco catalyzes the assimilation of CO2 with RuBP in the carboxylation reaction of the photosynthetic carbon reduction cycle in stroma.
Photosynthesis and aging

At first, there's nothing much to be said about photosynthesis during natural or dark induced senescence. It goes down. That's it. But look closer and it gets a bit more complicated and interesting.
Photosynthesis vs Senescence
Something that was noticed in the early physiological studies of senescence is that photosynthetic capacity generally begins to decline in leaf development earlier than symptoms of senescence become apparent.

Photosynthesis vs Senescence
Leaf Yellowing, Loss of Chl, Impaired ETR, NPQ, CO2 fixation capacity begins to turn down, decreasing nitrogen content, loss of Rubisco.
Whole photosynthetic performance declined
water and nutrients are drawn into young organs such as bud, seeds etc.
Senescence
Yet, the dynamics behavior and utilization of photosynthetic complexes along with leaf aging is largely unknown
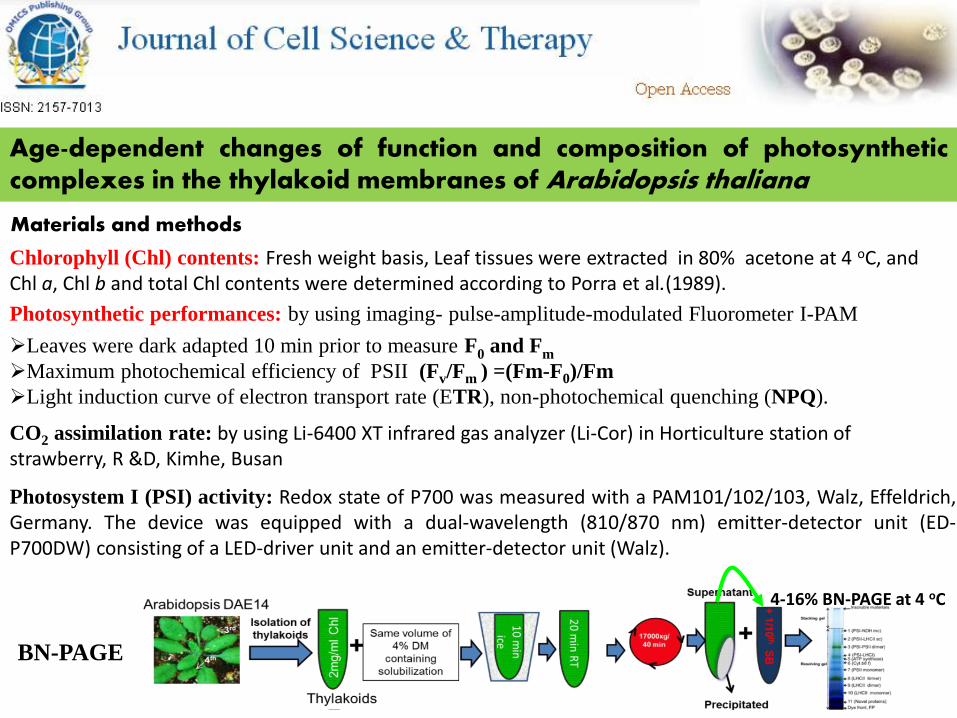
Chlorophyll (Chl) contents: Fresh weight basis, Leaf tissues were extracted in 80% acetone at 4 oC, and Chl a, Chl b and total Chl contents were determined according to Porra et al.(1989).
Photosynthetic performances: by using imaging- pulse-amplitude-modulated Fluorometer I-PAM
Leaves were dark adapted 10 min prior to measure F0 and Fm
Maximum photochemical efficiency of PSII (Fv/Fm ) =(Fm-F0)/Fm
Light induction curve of electron transport rate (ETR), non-photochemical quenching (NPQ).
4-16% BN-PAGE at 4 oC
BN-PAGE
CO2 assimilation rate: by using Li-6400 XT infrared gas analyzer (Li-Cor) in Horticulture station of strawberry, R &D, Kimhe, Busan
Photosystem I (PSI) activity: Redox state of P700 was measured with a PAM101/102/103, Walz, Effeldrich, Germany. The device was equipped with a dual-wavelength (810/870 nm) emitter-detector unit (ED-P700DW) consisting of a LED-driver unit and an emitter-detector unit (Walz).
Age-dependent changes of function and composition of photosynthetic complexes in the thylakoid membranes of Arabidopsis thaliana
Materials and methods

Age-dependent changes of function and composition of photosynthetic complexes in the thylakoid membranes of Arabidopsis thaliana
•Here, we reported functional and structural changes of
photosynthetic complexes along aging.
•Also, relationship between Chl content and Fv/Fm ration,
and RC/LHC and Chl a/b ratios leaf aging.
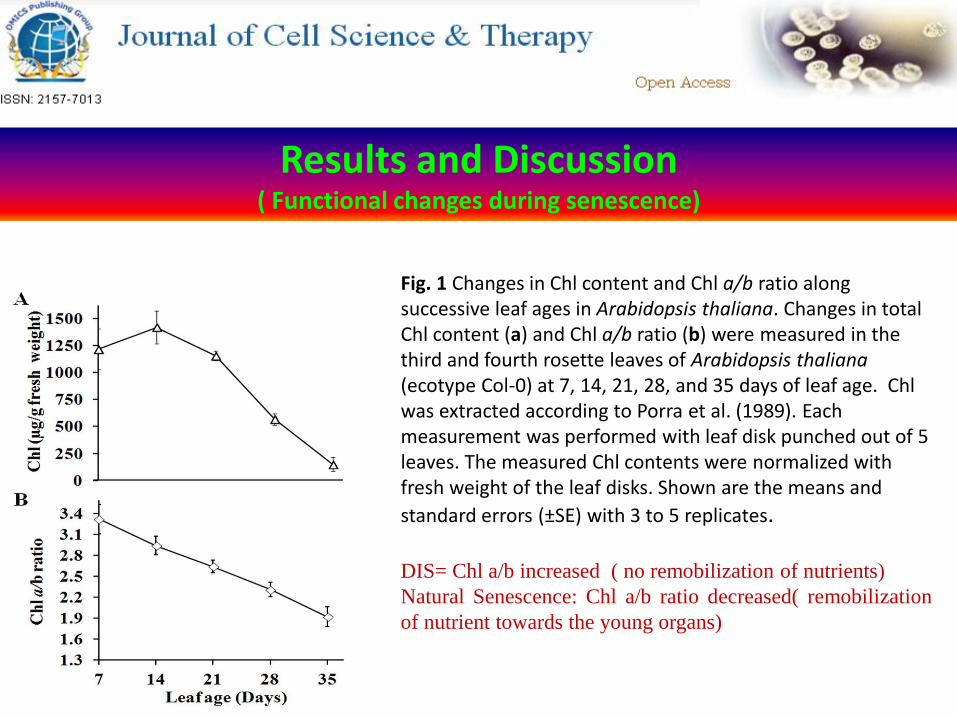
Results and Discussion ( Functional changes during senescence)
Fig. 1 Changes in Chl content and Chl a/b ratio along successive leaf ages in Arabidopsis thaliana. Changes in total Chl content (a) and Chl a/b ratio (b) were measured in the third and fourth rosette leaves of Arabidopsis thaliana (ecotype Col-0) at 7, 14, 21, 28, and 35 days of leaf age. Chl was extracted according to Porra et al. (1989). Each measurement was performed with leaf disk punched out of 5 leaves. The measured Chl contents were normalized with fresh weight of the leaf disks. Shown are the means and
standard errors (±SE) with 3 to 5 replicates. DIS= Chl a/b increased ( no remobilization of nutrients)
Natural Senescence: Chl a/b ratio decreased( remobilization
of nutrient towards the young organs)

Fig. 2 Change of photochemical efficiency estimated from Chl fluorescence along successive leaf ages. a. Visible symptoms (top) and the false color images of minimum fluorescence (F0), maximum fluorescence (Fm), and maximum photochemical efficiency of PSII (Fv/Fm) are shown at the indicated ages of the leaves. Shown at the bottom is intensity scale for Fv/Fm. b. The quantified values of F0, Fm, and Fv/Fm. The values were taken from the circled areas of the Chl fluorescence images of the leaves, as indicated at the top panel in (a). Each measurement was performed with the images of 5 leaves. Shown are the means and standard errors (±SE) with 3 to 5 replicates. The asterisks indicate the level of the statistical significance by t test (at http://vassarstats.net/) for the difference of the F0, Fm, and Fv/Fm values between the leaves at 14 days and the indicated ages; triple (P < 0.0005), double (P < 0.005) and single (P < 0.05).
F0 = minimal Chl fluorescence of a dark-
adapted leaves with fully opened PSII reaction
centers.
Fm = maximal fluorescence of a dark-adapted
leaves with fully closed PSII reaction centers.
Maximum photochemical efficiency of PSII =Fv/Fm
=(Fm-F0)/Fm
Results and Discussion ( Functional changes during senescence)

Results and Discussion ( structural changes during senescence)
1. There were no gross differences along leaf aging in the nature of the photosynthetic complexes, which may have been detected by appearance of new bands in BN-PAGE. 2. On the basis of the differential degree of decrease in the amount of the photosynthetic complexes along aging, we grouped them into three classes; (i) PSI-PSII dimer and Cyt b6f complexes that show the highest rate of decrease, (ii) PSI core, PSII monomer, and ATPase complexes that show the lowest rate, and (iii) LHCII trimmer that show an intermediate rate.
Fig. 3 Differential utilization and stability of different photosynthetic complexes in thylakoid membrane proteins by BN-PAGE analysis

Fig. 4 Differential change of major photosynthetic proteins along successive stages of leaf
development. D1, Cyt b6f, PsaA/B, ATPase, Lhcb1-Lhcb4, and Lhca1-Lhca4 are
representative of PSII reaction center complex, Cyt b6f complex, PSI reaction center
complex, ATP synthase complex, LHCII complex and LHCI complex, respectively.
To confirm the changes of major photosynthetic protein complexes in details, we checked the changes of quantity of specific protein components of each photosynthetic complex by immunoblotting assay using specific antibodies (Fig. 4). We observed a rapid decrease in D1 and Cyt b6f after 28 days of leaf age along with the rapid decrease of RbcL, a positive control for the senescence-associated decrease of photosynthetic function. Note that the amount of proteins loaded in each lane is relative to total Chl contents (Fig. 3) and thus a moderate decrease in the assay actually means a drastic decrease. Interestingly, we observed that there is no or only residual amount of D1 and Cyt b6f, respectively, at 35 days of age.

Fig. 5: Change of ETR, NPQ, and CO2 assimilation rate along successive leaf ages. ETR, electron transport rate. NPQ, non-photochemical quenching. The values at each age note the maximum values of ETR and NPQ obtained from light induction curves. Shown are the means and standard errors (±SE) with 3 to 5 replicates. Each measurement was performed with 5 leaves. The asterisks indicate the level of the statistical significance by t test (at http://vassarstats.net/) for the difference of the values between the leaves at 14 days and the indicated ages; double (P < 0.005) and single (P < 0.05).

Importance of STN8 kinase mediated photosystem II (PSII) core protein phosphorylation in PSII repair
Schematic representation of sequential events in PSII repair cycle during photoinhibition.

Fig .1 Characterization of STN8 mutant in rice


Super oxide By NBT H2O2 by BAB
Fig. 3: Measurement of ROS and oxidation of thylakoid membrane proteins. (A, B) Qualitative histochemical
assays for superoxide anion radicals and H2O2 by NBT and DAB staining, respectively, before (GL) and after HL
illumination of leaf segments. (C, D) Quantitative analysis of superoxide anion radicals and H2O2 in vitro by
measuring the relative fluorescence of DHE and DCFDA in the thylakoids, respectively. (E) Immunoblotting analysis
of oxidation of thylakoid membrane proteins in WT and osstn8 mutant plants (upper), and SDS-PAGE after
Coomassie blue staining (lower).

Fig.4
Fig. 4. Separation of photosynthetic complexes and measurements of ROS from isolated fractions. Isolated PSI and PSII fractions by SDGU
(A). Superoxide anion radicals produced from
PSII (B) and PSI (C). (D) Separation of PSII-LHCII
supercomplexes from lincomycin infiltrated leaf fragments by BN-PAGE. (E) Isolated PSII-LHCII supercomplexes by SDGU. (F) Superoxide anion radicals produced from PSII-LHCII supercomplex.

Fig. 5. Transmission electron microscope analysis of chloroplasts from WT and osstn8 mutant plants. Transmission electron micrograph of ultrathin sections from five week-old WT and osstn8 plants before (-) and after (+) HL illumination (see Methods). (A-F) Sections from WT and osstn8 plants before HL illumination. (G-L) Sections from WT and osstn8 plants after illumination. (A, B, G, H) Low resolution (bar, 500 nm); (C, D, I, J) intermediate resolution (bar, 200 nm); (E, F, K, L) high resolution (bar, 100 nm).

Cell Science & Therapy Related Journals
Cell & Developmental Biology Single Cell Biology Journal of Stem Cell Research &
Therapy

http://www.conferenceseries.com/
Cell Science & Therapy
Upcoming Conferences

OMICS Group Open Access Membership
OMICS publishing Group Open Access Membership
enables academic and research institutions, funders
and corporations to actively encourage open access in
scholarly communication and the dissemination of
research published by their authors.
For more details and benefits, click on the link below:
http://omicsonline.org/membership.php