omar capacity management practices and customer
TRANSCRIPT

i
CAPACITY MANAGEMENT PRACTICES AND CUSTOMER SATISFACTION
AMONG THE SHOPPING MALLS IN NAIROBI, KENYA
By
ALI OMAR BOFULO
D61/77400/2015
A RESEARCH PROJECT SUBMITTED IN PARTIAL FULFILMENT
OF THE REQUIREMENT FOR THE AWARD OF THE DEGREE OF
MASTER OF BUSINESS ADMINISTRATION, SCHOOL OF
BUSINESS, UNIVERSITY OF NAIROBI
2016

ii
DECLARATION
This research project is my original work and has not been submitted for a degree in this
or any other University.
……………………………………….. …………………………
ALI OMAR BOFULO Date
D61/77400/2015
This project has been submitted for Examination with my approval as the University
Supervisor
……………………………………….. ………………………………..
DR X N IRAKI Date
Senior Lecturer, Department of Management Science, University of Nairobi, School of
Business & Fulbright Scholar

iii
ACKNOWLEDGEMENTS
I would like to give gratitude to Allah for giving me good health, the opportunity, ability,
resources and time, to undertake and complete this project and my academic work for the
award of MBA - Operations Management.
Special thanks to my supervisor, Senior lecturer, Dr. X.N. Iraki for his guidance, patience
and understanding during the course of this project. I would also extend my gratitude to
my fellow students and friends who offered support, and encouraged me to soldier on and
to David Ngigi, for urging me to go back to the "trenches" (corridors of knowledge). My
employer, iWayAfrica/Gondwana International Networks, for providing me conducing
and supporting environment to undertake this course.
May the Almighty bless you all abundantly today in this world and the hereafter.
iv
DEDICATION This research project is dedicated to my family, especially my wife Yusra Ahmed
Abdalla; Son(s), Master Omar and Master Ahmed; Daughter Miss Fatma; My parents,
Mr. Omar Mwinyi Mwanyoha (Bofulo) and Mrs. Fatuma Bakari Gakurya (Nigala) and
my Brothers, Mwinyi (May God grant him Jannatul Firdous), Abubakar,Baraka and
sisters, Mwaka and Mesaid. In laws Mr. Ahmed and Khadija Bakhshuwein. All who have
unreservedly supported me on one way or the other throughout my life.

v
TABLE OF CONTENTS
DECLARATION.................................................................................................................... ii
ACKNOWLEDGEMENTS ................................................................................................. iii
DEDICATION....................................................................................................................... iv
LIST OF FIGURES ............................................................................................................. vii
LIST OF TABLES .............................................................................................................. viii
LIST OF ACRONYMS ........................................................................................................ ix
ABSTRACT ............................................................................................................................ x
CHAPTER ONE: INTRODUCTION .................................................................................. 1
1.1 Background of the Study ................................................................................................ 1
1.1.1 Capacity Management Practices (CMPs) ................................................................ 2
1.1.2 Customer Satisfaction .............................................................................................. 3
1.1.3 Shopping malls in Nairobi ....................................................................................... 4
1.2 Research Problem ........................................................................................................... 6
1.3 Research Objectives ....................................................................................................... 7
1.4 Value of the Study .......................................................................................................... 7
CHAPTER TWO: LITERATURE REVIEW ..................................................................... 9
2.1 Introduction .................................................................................................................... 9
2.2 Theoretical Review ........................................................................................................ 9
2.2.1 Customer Satisfaction theories ................................................................................ 9
2.2.2 Space optimization models .................................................................................... 10
2.2.3 Theory of Constraints ............................................................................................ 11
2.3 Capacity Management practices................................................................................... 12
2.3.1 Shifting Capacity ................................................................................................... 14
2.3.2 Offloading Capacity .............................................................................................. 15
2.3.3 Sub-Contracting Capacity ...................................................................................... 16
2.4 Emerging Concepts in Capacity Management ............................................................. 17
2.5 Capacity Management Practices and Customer Satisfaction ....................................... 17
2.6 Empirical Review ......................................................................................................... 20
2.7. Summary of the Knowledge Gap ................................................................................ 24

vi
CHAPTER THREE: RESEARCH METHODOLOGY .................................................. 25
3.1 Introduction .................................................................................................................. 25
3.2 Research Design ........................................................................................................... 25
3.3 Population..................................................................................................................... 25
3.4 Sampling....................................................................................................................... 26
3.5 Data Collection ............................................................................................................. 26
3.6 Data Analysis ............................................................................................................... 27
CHAPTER FOUR: DATA ANALYSIS, RESULTS AND DISCUSSION ..................... 29
4.1 Introduction .................................................................................................................. 29
4.2 Respondents Demographics ......................................................................................... 30
4.3 Customer satisfaction ................................................................................................... 33
4.4 Capacity Management Practices .................................................................................. 39
4.5 Capacity management practices and customer satisfaction in the shopping malls ...... 42
4.6 Discussion of Findings ................................................................................................. 44
CHAPTER FIVE: SUMMARY, CONCLUSION AND RECOMMENDATIONS ....... 48
5.1 Introduction .................................................................................................................. 48
5.2 Summary of the Findings ............................................................................................. 48
5.3 Conclusion .................................................................................................................... 50
5.4 Recommendations ........................................................................................................ 52
5.5 Limitations of the Study ............................................................................................... 54
5.6 Suggestions for Further Research ................................................................................ 55
REFERENCES ..................................................................................................................... 56
APPENDICES ...................................................................................................................... 58
Appendix I: Introduction Letter ......................................................................................... 58
Appendix II: Customer Satisfaction Questionnaire .......................................................... 58
Appendix III: Interview Guide ........................................................................................... 61
Appendix IV: List of Shopping Malls in Nairobi .............................................................. 64

vii
LIST OF FIGURES
Figure 2.1: Conceptual Model .............................................................................................. 23

viii
LIST OF TABLES
D
Table 4.1: Respondents Demographics.................................................................................. 30
Table 4.2: Definition of variables .......................................................................................... 34
Table 4.3: Estimates of the binary probit model on shopping mall image ............................ 36
Table 4.4: Capacity Management Practices ........................................................................... 39
Table 4.5: Shifting and offloading strategies ......................................................................... 40
Table 4.6: Sub-contracting strategies .................................................................................... 41
Table 4.7: Effects of capacity management practices on customer satisfaction .................... 43
Table 4.8: Effects of capacity management practices on customer satisfaction .................... 43

ix
LIST OF ACRONYMS
NCBD- Nairobi Central Business District
CMPs - Capacity Management Practices
ICSC- International Council of Shopping Centers
GLA- Gross Leasing Area
TOC- Theory of Constraints
ICT- Information Communication Technology
NCCLD- Nairobi City County Licensing Department
CDF- Cumulative Distribution Function

x
ABSTRACT
This study sought to determine the capacity management practices commonly used by
shopping malls in Nairobi, Kenya, and the relationship between capacity management
practices and customer satisfaction in the shopping malls. The study was conducted using
a Cross Sectional research design. It was based on 20 major shopping malls in Nairobi.
Collection of the first hand data from the field was conducted by the help of interview
guide and a semi structured questionnaire. To analyse the collected data, content model
of analysis was. The study ascertained that the widely used capacity management practice
to manage customer satisfaction in malls is the shifting capacity. Moreover, the practices
for achieving capacity management objectives had been fairly useful on customer
satisfaction, space management, process time and response time. The strategies used to
operationalize shopping malls capacity management requirements and customer
satisfaction were; scheduling activities, a flexible workforce and remodelling of
equipment. Shifting capacity majorly led to service flexibility and service time while
flexible workforce was useful in achieving response time and service time. Capacity
management strategies such as clear marking of walkways majorly led to customer
safety, variable shift responded to quick clearance, subcontracting led to reduced
complains and continuous service, whereas flexible workforce helped in meeting service
time. However, queuing strategy did not quite effective respond to customer needs, other
than enhancing continuous service. The study established that there were one main
challenge that shopping malls faced during capacity management implementation;
bottlenecks. The only action that shopping malls took to solve problems or challenges of
bottleneck in operation was the best capacity management strategy. The management of
the shopping malls should consider putting in place the recommended capacity
management practices (shifting, offloading and subcontracting) to even better its
customer satisfaction by enhancement of capacity management practices that have not
been fully embraced by some shopping malls such as offloading capacity. The findings
show that capacity management strategies are in use in these shopping malls, though it
was evident that some elements of capacity management strategies needs to be
strengthened to help fortify their effects on enhancing the customer satisfaction in the
malls.

1
CHAPTER ONE
INTRODUCTION
1.1 Background of the Study
The rising business rivalry and changes in technology as well as changing business
environmental factors have forced organizations to shift gears and becoming more
focused on the customer satisfaction through capacity management approaches that are
customer centric. One of the approaches that is used by business units is to effectively
manage the organizations capacity. In service operations, capacity management basically
looks at striking a balance between capacity of service delivery and the customer demand
aimed at lowering waste of time and minimizing idle space or intellect (human resource)
with the aim of reducing operating costs while increasing the quality of service delivered.
A firm‘s capacity management has a significant impact on customer satisfaction
especially across Shopping malls and industries engaged in merchandising business
(Gronholdt, et al., 2012). Indeed in a competitive market, increased level of satisfaction to
customers is a milestone in differentiation and a strategic business positioning. Bloemer
et al. (2008) in their study investigated the brand related issues in supermarkets, which
are just like shopping malls, and pointed out that an effective capacity management of a
supermarket significantly improves perceived service quality;. Equally, the significance
of customer buying behavior has been a key factor to consider by the retailers in the
present business environment. Shopping malls are spending a lot in research to
understand the customer needs and how to eventually increase their level of satisfaction
(Da Silva, 2010). The service delivery process of a shopping mall should be characterized
with a number of strategic business approaches like faster and convenient service

2
delivery to the customer and this has stood out as key factor of strategic competition.
Adoption of a flexible Capacity management practices in shopping mall management is
critical to develop a winning approach in attaining a strategic lead time performance with
the aim of minimizing operating costs (Gant‘s et al, 2003).
The growth of shopping malls in Kenya over the last decade can be described as having
been tremendous. However, with the growth and expansion of shopping malls in virtually
every major road from the Nairobi Central Business District (NCBD), means the business
environment has continually changed, bringing more and more challenges to the players
due to the new entrants into the sector as well as from emerging smaller supermarkets
and business units that offer similar products and services that are offered by the
shopping malls.
1.1.1 Capacity Management Practices (CMPs)
CMPs can generally be referred to as the methods applied by a firm or company to
address the potential of the firm or company to carry out a task or work, expressed in
terms of time and output. CMPs depends solely on the main factors of the capacity
management plan. For instance, in shopping malls, space management plan is a
documented plan that oversees and reviews output, forecasts, customer satisfaction
requirements, time variations and human resource, (Kolev and Paiva, 2008). The capacity
management practices advocates the need of balancing capacity availability and the
demand for the same considering other factors accruing to quality service viz a viz cost
and time variations. Fitzsimmons and Fitzsimmons (2012), opine that in the service

3
sector, the core service capacity management practices will entail five elements
comprising supporting facilities such as décor, facilities layout, support technology and
equipment. In addition to offering implicit services such as comfort, status, convenience,
comfort and the general wellbeing of the customers.
1.1.2 Customer Satisfaction
In his study, Ray (2009) defined customer satisfaction as the aftermath experience of a
service whether it has met the needs intended for or not. Ray noted that the moment of
truth is critical in determining whether customers‘ expectations have been met or over
met. This depicts that customer experience after the service or product determines a
repeat purchase or none, and therefore a business should strive to encourage a customer
to make a repeat purchase by offering service or products what the customer expects i.e.
not only meet expectations but exceed expectations. A customer evaluates the first
experience of a service or a product and makes a decisions considering other options
depending on his or her expectations. Hernard and Symanski, (2009) observed that
previous research on satisfaction of customer needs only looked at the influence of
needs/wants, performance, customer expectation among other things. Further studies by
Diets, (2004) indicated that consumer expectations are like pre-trial beliefs pointing to
the product or service which operates as a benchmark for moment of truth during service
delivery or product evaluation. Many studies and scholars have concluded that consumers
of a service or product are satisfied when the service or the product performs above
expectations and dissatisfied if expectations of customers exceeded real performance of
the products or services (Oliver, 2007).

4
Parasuraman, Zeithaml and Berry, (2001) identified five determinants of service quality
that lead to increased customer satisfaction, by order of importance namely; reliability,
the need to assist clients or customers and unfailing product or service assurance, the
power to keep trust, customer concern and unlimited customer focus. Academia have
observed that shopping malls that are well operated stand out exceptionally well as
compared to the competitors in the industry and they always have but not limited to the
following aspects; support from the top management, exceptional service delivery,
product or service review systems, prompt customer complaints services and internal
customer satisfaction among others On his part, Kotler (2002) note that shopping malls
and other service providers encounter several issues among then differentiation (of
product or service), quality and production capability. Being different is basically adding
or incorporating secondary service features to the primary service. Delivery
differentiation is where the company hires and trains people to deliver the services or
through image differentiation by symbols and branding.
1.1.3 Shopping malls in Nairobi
According to the International Council of Shopping Centers (ICSC, 2015) a shopping
mall is closed shopping center with shopping streets and alleys which has a Gross
Leasing Area (GLA) of between 400,000 to 800,000 square feet for Super Regional
Malls. Two Rivers at 620,000 square feet, Garden City and Sarit Center each at 500,000
square feet, fall into the category of a regional mall. Nairobi has the highest number of
shopping mall development hot-spots in East Africa and among the best in the region a
global property consultancy firm Knight Frank in a report titled Shop Africa, (2016).

5
Knight Frank notes that there are 20 major malls located within Nairobi City County and
it‘s environ (Appendix IV). The city is said to have a mall space of close to 400,000sq
meters and among the malls included is the Sarit Center, among others.
Demand for the mall space has been indicated as shooting up with international brands
entering into Kenya hence encouraging construction of more space in the city, as
observed by Regnald, (2016). He also noted that the business of shopping malls in Kenya
is still dominated by the domestic entrepreneurs and home-grown retailers such as
Nakumatt, Tuskys and Uchumi, however global businesses are showing great interest in
the Kenyan business field, for regional chains like South Africa‘s Shoprite, Pick n Pay,
Game and Woolworths, which are venturing into the Kenyan markets . Also, as per Ark
consultants, (2016) international brands, like the French retailer Carrefour who is the
main (anchor) tenant in the newly launched Two Rivers mall and the Hub, are also
venturing into Kenya. Oxford Business Group, (2016) observed that the large number of
major shopping malls in Kenya are mostly located in the CBDs of Nairobi, Mombasa as
well as Kisumu. The survey noted that other big towns like Eldoret and Nakuru have
shown potential for larger development in the near future. Oxford Business Group,
(2016) further notes that, this is attributed to the devolution factor which is attracting
more investors in the counties targeting the local market with retail space. Reginald,
(2016) contend that there is a gap in the retail sector and Kenya is seen to be the next
shopping hub in Africa. However, players should conduct thorough research especially in
the element of space given that occupancy in some existing malls is still low.

6
1.2 Research Problem
Different businesses encounter distinct market environmental factors which lead them in
offering distinct products or services and there is need therefore to examine the
interaction of different aspects of a firms operations Huffman, (2010). Indeed, there has
been a significant relationship between CMPs, quality management and human resource
management which is the cornerstone of process planning and process control and
operations in managing of services. CMPs together with operations of services is a
management test for capacity managers in the sense that the characteristics of service
delivery and processes incorporating the consumers in the process of service delivery is
seen as a wall blocking the choices open for control and aligning supply with customer
demand in the entire service delivery process or system. (Kolev and Paiva, 2008). Kolev
and Paiva noted that in managing an organizations capacity, there are several operational
issues among them is; capacity altering, holding inventory or stock, queuing for service
delivery, or demand manipulation. These management reviews are meant to improve the
level of customer service and eventually customer satisfaction. Several studies have been
conducted on capacity management practices. A study done by Glyn and Bradly, (2000)
looked at a Brownian motion approximation to determine the optimal control of stock
and capacity management in a make-to-stock process with an outsourcing option.
Additionally, Alp and Tan (2009) researched on the combined capacity management plus
inventory management shortcomings of a make-to –stock system. Wairimu (2014)
researched on the CMPs and quality of service provided in the oil sector in Kenya. Mutali
(2013) researched on the factors that influence the service quality in Kenyan commercial
supermarkets.

7
The studies found out that management of capacity in the sector of service business the
two parameters able to physically come into contact during the moment of truth and that
can affect the perceived quality in the service rendered or expected. The research gap and
interest of this proposed research was to further investigate the relationship between
capacity management practices and customer satisfaction in shopping malls in Nairobi. It
is clear from the findings that there is no existing literature or study explaining the
particular situation under investigation. Therefore the main objective of this research was
to find out the capacity management practices commonly used by shopping malls in
Nairobi and determine the relationship between capacity management practices and
customer satisfaction in the shopping malls in Nairobi, Kenya.
1.3 Research Objectives
i. To determine the capacity management practices commonly used by shopping
malls in Nairobi, Kenya.
ii. To find out the relationship between capacity management practices and
customer satisfaction in the shopping malls in Nairobi Kenya
1.4 Value of the Study
The findings of this study gives policy makers a glimpse of how capacity management
affects the level of customer satisfaction in Kenya and consequently identify mechanism
that can be harnessed by the regulators to achieve improved performance of private sector
organizations which is a critical blue print for the economic growth and development in
Kenya.
8
The findings of the study enables the owners and management of the various shopping
malls to identify the key factors to consider in service delivery in achieving optimal
utilization of shareholders‘ funds and resources.
It also enables customers of the shopping malls demand the right quality of service to
guarantee their satisfaction from the service they receive and make appropriate decisions
on their choice of service provider.
To the scholars and academicians, this study is useful in enriching the body of knowledge
and also helping them in carrying out further and related studies in capacity management
as this study avails important information in formulation of public policies and
regulations in mall space management.

9
CHAPTER TWO
LITERATURE REVIEW
2.1 Introduction
This chapter addresses the following; empirical review, critical review and a conceptual
framework is given at the end of the chapter, which brings out the main variables
discussed in the study.
2.2 Theoretical Review
2.2.1 Customer Satisfaction theories
This study was built on assimilation theory, in which Festinger,(1957) opined that
customer satisfaction is influenced by customer wants or needs and the product or service
characteristics or features. Looking at the shopping mall or retail industry, several
research have been conducted to investigate what the customers in the industry figures
out as an important factor for satisfaction. Quality of the service and consumer
satisfaction are different parameters however the two are said to be closely related. In his
study, Atknson (1988) observed that hygiene, security aspect, value for the money paid
for a service and staff courteousness are the key determinants of satisfaction. This theory,
according to Fesinger (1957) dissonance theory, observed that customers make cognitive
choices between the product expectations and the perceived performance of the product.
The idea of customer aftermath evaluation is incorporated in the customer satisfaction
studies in the form of assimilation theory. A study by Andersan (1973), he observed that
customers try to deviate from dissonance by trying to adjust their perceptions towards a

10
particular product to relate it more with their expectations. Customers are also said to be
trying to minimize the fear attributed to the difference between what they expect from
service or a product and the moment of truth or actual performance of the product. They
do this by either twisting their expectations in order to correspond with the perceived
performance of the product or either by increasing their level of satisfaction through
lowering the importance of disconfirmation experienced. Payton et al (2003) argues that
Assimilation theory has a number of shortcomings. First, the approach assumes that there
is a relationship between expectation and satisfaction but does not specify how
disconfirmation of an expectation leads to either satisfaction or dissatisfaction. Second,
the theory also assumes that consumers are motivated enough to adjust either their
expectations or their perceptions about the performance of the service. A number of
researchers have found that controlling for actual product/service performance can lead to
a positive relationship between expectation and satisfaction. Therefore, it would appear
that dissatisfaction could.
2.2.2 Space optimization models
Shelf-space model is was among the very first models of optimization by Hanse and
Heinsbrok, (1979) Constraints of total available space, minimum allocations, and integer
solutions are taken into account. Binary variables for handling assortment decisions are
also included. The model of Corstjens and Doyle, (1983) incorporates both space- and
cross-elasticities and takes into account constraints similar to those considered by Hansen
and Heinsbroek, (1979). In addition, they explicitly consider substitution effects due to
temporary or permanent unavailability of products. The resulting model optimizes return

11
on inventory and is solved using the simulated annealing heuristic procedure. Yang and
Chen, (1999) simplify the model of Corstjens and Doyle, (1983).
The authors disregard cross-elasticity and assume that a product‘s profit is linear within a
small number of facings, which are constrained by the product‘s lower and upper bound.
They allow the profit of each product to vary when allocated to different shelves by
formulating the shelf space allocation problem in a way similar to a knapsack problem.
Allowing profit to depend on shelf placement is consistent with the experimental study of
Dr`eze et al, (1989) who conclude that the location of products on the shelves is more
important for determining sales of a product than the amount of space allocated to the
product. With respect to the discussed models of optimization it is imperative for the
Kenyan mall developers to learn the significance of the correct mix of shopping mall
categories viz a vis food and beverages and entertainment. Knight Frank, (2016) observed
that, Nairobi is now witnessing creativity in utilizing space.
2.2.3 Theory of Constraints
This theory (TOC) is referred to as a systems management philosophy pioneered by
Eliahu Goldrat, (1980). Eliahu observed that theory of constraints was keen on addressing
performance optimization with respect to the outlined set of limitations of processes and
product offerings. Theory of constraints management systems basically is made up of the
following aspects; problem solving aspect, project management aspect, market
segmentation aspect, and measurement of performance aspect. Eliyahu Goldratt, (1980)
theory of constraint has a wide scope to the purpose of shopping malls. It therefore has

12
diverse advantages such as minimum lead time in production, good quality of services
and products, rising profits and revenues, low stock or inventory margin, minimum
bottlenecks, good management of limitations/constraints, keeping in check of statistical
fluctuations, exceptional competitive edge, making easier for strategic marketing and
operational decisions, establishing price margin approach and purpose of continuous
improvement at the supply chain management level.
According to this theory, working with large number of customers or buffer under theory
of constraints is the foundation for the shopping space control. Generally, resources that
are not constrained are put in place to make sure that they are working on the intended
areas of functionalities at the planned times in the process and in the correct production
quantities in order to address the requirements of limited resources as planned and with
respect to customer service needs. Theory of constraints involves five steps which assists
operations managers to do planning for the entire process and to direct their concentration
on the resources which have greater capability to be influenced by variations in the
system. The steps are; Identify the system‘s constraints, decide how to exploit the
constraint, alter or manage the system‘s policies, processes, and/or other resources to
support the above decisions, add capacity or otherwise change the status of the original
resources as the dominating primary constraint.
2.3 Capacity Management practices
Customers are keen on the ambience, product variations, entertainment, food, beverages,
and social activities apart from shopping alone. The aforementioned parameters are the
13
strategic differentiation approaches for shopping malls in Kenya according to Knight
Frank, (2016). The survey notes that shopping mall owners should be more innovative on
matters space, layout, materials used among others, and also improve on the activities in
the malls to attract more customers A Nairobi-based market intelligence firm Sagaci,
(2016) contends that malls should have a paradigm shift from traditional way of doing
business and be more focused on technology adoption (online/ offline shopping)
holograms, virtual interactions, social network shopping, 3d experience among other
innovative plans in the stores. In the management of capacity, it is advisable to note that
in times of capacity constraint, the prime concern should be towards demand in order to
strike a balance between the two variables (capacity and demand) whereas when there is
oversupply or the capacity is a surplus, there is need to change the aspect of demand in
order to also strike a balance with supply. Operations manager should be more focused
on on the mix of capacity and the level to which thet can be altered and also the urgency
of their reaction as well as cost involved (Slak, 2007)
Heskett et al., (2003) however observe that, it may not be possible to match the capacity
with the demand finely and under such a circumstance, a coping mechanism may be
employed which may alter the nature of the service delivered from the original design
and hence the customers perception of the service quality. It therefore means that the
management must be fully focused on any repercussions of any possible changes in their
operations plans. This study focused on aspect of space because managing a shopping
mall space is a central aspect aimed to attract customers and maximize profits. The more

14
customer demand is impulse-driven, the more it is space-dependent and the more it is
subject to variation (Knight Frank, 2016)
2.3.1 Shifting Capacity
The Shifting capacity management strategy is concerned with checking the degree of
capacity and changing the level of available resources through; use of part time staff,
changing the number of service providers including the number of hours worked, also
distributing capacity between various sections of the process and moving resources from
either back or front offices.
Hence the aim of shifting capacity management process is to check and maintain capacity
as close as possible to be at par with effective capacity and at the same time maintaining
high level of performance and service quality levels (Alp & Ton, 2006). In addition, the
shifting capacity management may involve the shopping mall or any other service firm to
focus on downtime in the periods of decreasing or low demand, use of semi-permanent
staff (staff on contract basis) other than the regular staff or even acquire or lease
resources that are idle. Similarly, staff can be trained to handle multiple functions at the
same time. (Lovelok, 2002). This could also be applied where capacity is constrained and
here the concentration should be directed towards affecting demand to strike a balance
and be at par with capacity taking measures to influence demand of the customers.
Additionally, operation managers should be aware of the mixed approaches of the
capacity management, the level to which it can be altered, urgency of the action, Slak,
(1989), and the costs involved Hesket, (2000). In this approach, number of participants

15
(staff) need to be transferred to uplift the existing levels of service delivery and also the
development of a new facility will also shift the increase in demand which is expected
due to new businesses downturn.
2.3.2 Offloading Capacity
The offloading capacity strategy recognizes real constraints in altering effective capacity
and seeks to influence the level of demand by way of for example, price changes,
advertising and promotion, developing off peak demand, use of appointment and
reservation systems and making customers queue for the service (Heskett, 2000).
Consequently, the offloading capacity strategy is increasingly linked to yield
management systems where effective capacity is constrained, for example in airlines,
hotels, and car rental. In yield management the aim is not necessarily to gain the highest
utilisation from the limited resource but rather to maximize the revenue yield from
pricing differentials. This brings with it an additional control mechanism of
―overbooking‖ which may result in customers not being served at the time they expect
(Ong‘ondo, 2013).
The coping action map is an attempt to present a way of developing coping strategies
which recognize changing operational focus, capacity strategies and customer service
dimensions within a total service delivery (Alp and Tan, 2006). The four general options
for operational control are altering the capacity, holding inventory in anticipation of
demand, requiring customers to wait for the service, or influencing demand in other
ways. In service delivery there is not the possibility of producing the complete service

16
package in advance of demand and holding it as an inventory. This real time element of
service production makes the matching of supply and demand very important,
particularly in capacity-constrained services, such as airlines, retail outlets, hotels, and
professional services, where the profitability of the operation is closely linked to the use
of the current capacity (Cagliano et al., 2001).
2.3.3 Sub-Contracting Capacity
Sub-contracting is a contract involving a vendor (external) and a business whereby the
vendor takes charge of more than one business functions of an enterprise (Janes & Whire,
2006). It basically deals with subcontracting of non-core business activities (Jonsen,
2007). This is expected to improve the level of delivery of goods and services to
customers and hence increase their competitive advantage. Savage (2006) support the
concept of service improvement through outsourcing in a study of a hospital involved in
an outsourcing arrangement finds resulting improvements in operations above
comparative in-house arrangements. He further finds that sub-contracting in the health
industry reduces costs through the sharing of expensive equipment. Despite these positive
findings associated with outsourcing, other authors list some associated negatives. One
negative relates to increased dependency, in that an organization may become too
dependent on a single vendor supplier leading to a potential loss of core competencies in-
house (Prahalad and Hamel, 2004). This means that future flexibility is in doubt, as the
organization loses its ability to respond to change. A second negative is that outsourcing
may result in a loss of control over the service process, as scheduling and time
management issues may no longer be able to be solved by one organization (Rothery and

17
Robertson, 1995). Chase and Aquilano (1992) suggest that improvement of the process,
in contrast to Savage's (1996).
2.4 Emerging Concepts in Capacity Management
Information Communication Technology (ICT) is used in the improving and building
capacity management practices in a number of ways; modelling and simulation,
performance testing, queuing systems, capacity scheduling, forecasting workload to
achieve Continuous, predictive Capacity Management, Just in Time, Quality
Management (to ensure elimination of wastage e.g. repeat work and enhanced efficiency)
or application of robotics and software/IT infrastructure to automate work and efficient
use of space. In the banking sector, the use of agency banking, Automated Teller
Machines (ATMs), Mobile Baking and Online Banking have been effectively used to
manage capacity in the banks through reduced customer walk in banking halls, hence less
queues in baking halls, make service easily available (nearness to customer); leading to
improve service delivery and customer satisfaction as well as profits (reduced costs, and
expanded revenues base by tapping on the many unbanked).
2.5 Capacity Management Practices and Customer Satisfaction
Ark consultants, (2016) having a clear understanding that a shopping mall is a shopping
center and that tenants get shops that are either too big or too small or layout of shops are
not appealing to shoppers, then operations managers can now evaluate whether, Nairobi
still needs more malls and diverse plans for managing capacity management in order to
achieve the rising demand. Capacity management practices calls upon the need for

18
balancing capacity availability with capacity demand and considers the related capacity
costs including the costs for short-term (intra-period) capacity adjustments. In a
supermarket context therefore, a client satisfaction is measured through overall
satisfaction toward the services. Yi, (2000) mentioned that customer‘s satisfaction is
influenced experiences and expectations with service performance. Thus, satisfaction is
similar to an attitude, as it can be assessed as the sum of the satisfactions with the various
attributes of the product or service. This therefore means that customer satisfaction is
expectation before purchase and perception about performance after purchase. In the
service environment, customer satisfaction has been seen as a special form of customer
attitude. It is a phenomenon of post-purchase reflection on how much the customer likes
or dislikes the service after experiencing it, and it can be treated as a fulfillment of
consumptive goals as experienced and described by customers (Oliver, 2003). Various
firms employ diverse mechanisms to evaluate customer satisfaction.
According to Cacioppo (2010), assessment of customer satisfaction is one of the key
mechanisms for successful organizations in the current economy in the world.
Measurement of customer satisfaction can help to hold existing customer and may
provide directions about how to attract new customers from the competitive business
environment. As mentioned by Dick and Basu (2014), measurement of customer
satisfaction and understanding the extent may help organizations to improve their
customer services. It is argued that a satisfied customer certainly recommend the product
or service to their relatives and friends. It is therefore, the marketing strategies should be
focused on increasing customer satisfaction level. The target market of a firm will

19
influence how a company segments its products and also use common attributes or
demographics like income, age, and education to tailor their products to meet customer
satisfaction.
Practitioners in retail banking, for example, frequently split customers into mass, middle,
and upscale market segments. In contrast, service organization practitioners (Chase et al.
1998; Schmenner 1995) segment customers based on operational attributes such as
degree of customer contact, degree of process labor intensity, and/or customization. Pine
and Gilmore (1999) take psychographics seemingly to the limits, suggesting that service
providers can target customers based on how they experience—think and feel about—
services in personal ways. All these classification aims in tailoring products and delivery
process to meet customer satisfaction.
Cacioppo (2010) noted that retail customer satisfaction is determined by customer
service, brand variety, store environment, convenient location and shopping convenience.
Retail customer satisfaction depends on location, product quality, reliability, and process
and personnel services. Wan and Schell (2013) pointed out that customer satisfaction
resulted from the measurement of products and service according to the customer's
previous experiences as well as the overall evaluation on the consuming experience. They
indicated that an enterprise providing a good service quality could really satisfy the
diverse needs of customers, and customer satisfaction was the overall evaluation of the
product and the service based on the customer's past experiences. According to Kotler
(2002) there are seven approaches to increasing customer satisfaction, these are having

20
skillful workers through the process of recruitment and selection, increasing service
quality by offering value for money , industrializing the services, reducing or making
absolute the service need by inventing a product solution, designing of more effective
services, presenting customers with incentives to substitute own labour with company
labour and also harnessing power of technology to give customers better services.
Kotler (2002) also says that a service is any act or performance that one party can offer to
another that is essentially intangible and does not result in the ownership of anything. An
organization must be consistent in delivering quality service in conformity with
turbulence of its internal and external environment. As Spreng (2006) noted, the quality
of a service is of significant and strategic concern, an important indicator of customer‘s
satisfaction. According to Berry Parasuraman (2002) in order to exceed customer
expectation, companies need to present a realistic picture of their service to customers by
checking the promotional messages for accuracy, performing the service right to
customers by stressing to employees to provide reliable service, effectively
communicating with customer to ascertain their needs by using the service delivery
process as an opportunity to impress on customers and also continuously evaluating and
improving their performance against customer expectations.
2.6 Empirical Review
Ong‘ondo (2013) conducted a study on effect of capacity management strategies on
service quality in Safaricom. The study intended to determine the extent of adoption of
capacity management strategies, factors influencing implementation of capacity

21
management strategies and to establish the effect of capacity management strategies on
service quality in Safaricom retail outlets. Though the findings showed that various
capacity management strategies were in use at its facilities, it was evident that some
elements of capacity management strategies investigated were still in their initial stages
of implementation and therefore needs to be strengthened to help fortify their effects on
enhancing the quality of service provision.
Kawila (2014) researched on the effect of capacity management on service delivery of
commercial banks in Kenya. Using descriptive analysis, the study sought to establish how
the adoption of capacity management among the commercial banks and the utilization of
bank resources influenced the service delivery level in the banks. The study found that
shifting capacity practices that were commonly employed by the banks include
enhancement of employee capacity through offering staff training that will enable them to
handle more than one task and therefore being able to be redeployed when the need arise,
offering overtime services to the staff such as paying them at a premium in times when
they work outside the normal working hours as well as providing transport services for
the staff. Wairimu (2014) also studied on capacity management and service quality in
petroleum distribution firms. Using discriminant analysis approach, the study established
that the capacity management strategy mostly employed by the firms in the oil
distribution sector in Kenya is chase capacity management strategy and that capacity
management approach and service context can interact and the interaction positively
influences perceived service quality.

22
Klassen and Rohleder (2002) did a study aimed to establish how the demand and capacity
management decisions operate together. They used a simulation theory and literature
insights to find out the effect of capacity management decisions on operations and
profitability. They focused on how demand options such as reservations, price
differentials and advertisement interact with one another, and how capacity management
practices like; scheduling, hiring or laying off employees and renting or sharing capacity
affect one another, whether some options are more effective than others, and to what
degree various options should be implemented in various scenarios. They concluded that
demand and capacity management decisions are closely related.
Adenso-Diaz et al (2002) sought to model capacity requirements based on the nature of
services and service demand. The model was tested in an internal medicine unit in a
hospital nursing department and in a hotel both based in Spain. Delphi methodology was
applied to determine the standard execution times of the different general nursing tasks
and the frequency of each task with respect to the type of dependency of the sick person
In both studies, total quality functions were developed to come up with a lean staff
required to oversee the work.. In conclusion they argue that their model can be applied in
diverse service sectors where there is a flexible workforce with limited staff and variable
activities are carried out depending on the type of customer therefore requiring adequate
allocation of capacity that maximizes perceived quality. The main problem identified in
this study is that their model is limited to only one capacity type, staff; while capacity is
made up of several others elements such as physical facilities, equipment and space.
Chase capacity practice was used in the two case studies as they concentrated on the

23
ability to assign staff on the basis of the demand that may arise. Whether the model can
be applied in all service sectors, in different geographical contexts require testing.
Figure 2.1: Conceptual Model
Source: author, (2016)
Customer complaints
Customer Compliments
Quality product/service
Pricing
Shifting Capacity Practices
Alternative Service
providers
Sub-contracting Capacity
Practices
Machines
Floor space
Temporary staff
Dependent variable Independent variable
Offloading Capacity Practices
Price Changes
Off-peak demand
Customer Satisfaction
Capacity Management Practices

24
2.7. Summary of the Knowledge Gap
In summary the reviewed literature on capacity management strategies showed that the
ability of a firm to effectively utilize its capacity management to be in line with customer
demand is the main function of the operations manager at all cost meaning that if it
succeeds or fails it will automatically impact the achievement of strategic competitive
edge aimed towards quality services and customer satisfaction The chase and level
strategies of service organizations are in themselves inadequate to handle the limits of
effective capacity and consequently the coping strategy has lately been presented as the
additional tool on the basis of observations of operation managers in service
organizations. In addition, the literature on capacity management strategies reveals that
capacity management and demand influence one another and identifies different
approaches to capacity management strategies. It also establishes a model to determine
the lowest capacity management levels below which quality may be influenced.
Finally a link is identified between perceived customer satisfaction and capacity
management strategies adopted as well as the contextual factors that influence this
relationship. Although an attempt has been made to link capacity management in
organizations and such attributes as organizational performance (Ermistace and Clark,
1992), service quality (Mwikali, 2014), different facets of capacity management such as
Sub-Contracting (Keizers, 2000); there has been no study that sought to establish the link
between capacity management and customer satisfaction. The study therefore sought to
fill the existing research gap by establishing the effects of capacity management practices
and the level of customer satisfaction among in the shopping malls Nairobi, Kenya.
25
CHAPTER THREE
RESEARCH METHODOLOGY
3.1 Introduction
The chapter has various sections addressed showing the methodology used to undertake
this particular study with the goal of answering the key objectives of the study. The
sections are; research design, target population, sampling, data collection instruments,
and data analysis.
3.2 Research Design
A Cross Sectional Research design was used to establish the nature and extent of capacity
management practices in the Shopping Malls and its relationship with Customer
Satisfaction. A cross sectional research designed was adopted because in the study the
researchers was interested in the distribution and existence of capacity management
practices in the shopping malls and customer satisfaction at a particular point in time. In
this research study, Shopping Malls and Shopping Mall Customers were identified from
whom data was collected to help answer research objectives.
3.3 Population
According to Nairobi City County Licensing Department (NCCLD, 2015) there are 21 major
malls located within Nairobi City County and it‘s environ (Appendix IV), which made the
population of the study. A shopping mall was herein defined as a modern shopping building
with many apartments of distinct businesses under one roof forming a complex of shops with
diverse walkways that ease movement inside the building and with a parking space and a

26
modern shopping indoor version (Government of Kenya, 2015). The reason for targeting
Nairobi was simply because the city has become a regional hub as noted by a survey
conducted by Knight Frank titled, "The Shop Africa 2016 report, assessing Sub-Saharan
Africa‘s retail markets", Nairobi leads the way for shopping malls in sub-Saharan Africa
and this therefore was considered representative of the population.
3.4 Sampling
The researcher used a non-probability sampling strategy in which for the Capacity
Management Practices and Customer Satisfaction, the researcher targeted the shopping
malls (as provided in the Appendix IV, List of Shopping Malls in Nairobi, but excluding
Highway Mall Mombasa Road, which was not operational) and used a quota sampling
method to select respondents from the following categories of tenants of the shopping
malls: Restaurants, Shops, Pharmacies and Entertainment; giving us a total sample size of
80 (Eighty) respondents which was considered adequate for this particular study, given
the time and cost implications to involve many participants. According to Hum (2015),
stated that using too many participants in a study is expensive. This is also amplified by
Russel (2001) who observed that a study should be of an adequate size relative to the
objectives of the study.
3.5 Data Collection
This study used primary data that was collected using a questionnaire and interview guide
(Appendix II & III) for an in-depth discussion with managers of the shopping malls and
tenants in respective shopping malls (Appendix IV). Specifically, the study aimed at
selecting a senior manager in each of the shopping malls or tenants/customers of the

27
shopping malls who knew or could respond about the effective utilization of the malls
capacity. The Questionnaire and interview guide was administered to tenants of the
shopping malls. A pilot test of the questionnaire and interview guide to make sure they
were understandable and acceptable to the intended audience was conducted.
3.6 Data Analysis
The questionnaires were first edited then coded to facilitate statistical analysis. Data
collected was both qualitative and quantitative. Qualitative data was analyzed through
content analysis. Quantitative data was analyzed through the use of frequency
distribution, mean scores and standard deviations. Specifically Probit model of analysis
was applied to analyze binomial response from the data findings. With the help of (SPSS)
the findings were presented in frequency distribution tables. The data was then
summarized according to the study‘s specific objectives.
3.6.1 PROBIT Model.
Probit model was applied to analyse the level of customer satisfaction for services
rendered by the shopping mall and also relationship between capacity management
practices and customer satisfaction with the aim of answering the second objective of the
study i.e. relationship between capacity management practices and customer satisfaction
in the shopping malls in Nairobi Kenya)
The main reason for choosing Probit in this study is because our customer satisfaction
questionnaire was based on binary response. i.e. YES/NO. Probit model according to
McFadden and Daniel (1973), is developed to analyze Latent (qualitative) variables.

28
These are variables that are non-observable. McFadden applied probit model in his study
titled ―modelling the choice of residential location‘. In his study, MaFadden wanted to
determine the factors influencing customer satisfaction when it comes to choosing
housing location. It is also useful when applied to social studies/research cases, where the
options are two either Yes or No and hence easy to code the response into binary
response of either 1(one) or 0(zero)

29
CHAPTER FOUR
DATA ANALYSIS, RESULTS AND DISCUSSION
4.1 Introduction
This chapter discusses the research findings from the data collected and as per the
objectives of the study, it is aimed at determining the capacity management practices
used by the shopping malls and to establish the relationship between capacity
management practices and customer satisfaction ain the major shopping malls in Nairobi,
Kenya. The chapter presents the analysis of the findings guided by interview guides and
questionnaire responses. The analysis was divided into four sections. First section
analysed respondents demographics, second section analysed capacity management
practices, then customer satisfaction levels and finally, the last section did a detailed
analysis of the relationship between capacity management practices and customer
satisfactions.
To analyse the level of customer satisfaction for services rendered by the shopping mall
as a factor of capacity management practices, this study utilized probit model
methodology. Qualitative content analysis was used to analyse the demographics
characteristics, the nature and extent of capacity management practices in the Shopping
Malls and Customer Satisfaction levels. This was done through coding manually by
grouping familiar or similar responses or parameters together in order to draw
comparisons with ease.
To maintain confidentiality and mitigate against any biasness, during content analysis
process, the shopping malls were referred to as Mall A, through T.

30
4.2 Respondents Demographics
When analysing respondents‘ demographics from each mall. Demographics were divided
into 7 (seven) themes that is, (1) gender, (2) age, (3) education level, (4) job position, (5)
duration holding the same position , (6) years worked for the business, (7) the years
worked in the mall. Gender of the respondents was grouped together under two
categories; male and female. Age of the respondents was grouped under 4 categories (20-
29, 30-39, 40-49, 50 years and above). Education level was grouped into categories
(masters, degree holder, diploma holder, and certificate holder). Job or business position
was grouped into 4 categories (director, manager, head of department and subordinate).
Years worked for the business, duration holding the same position and the years worked
in the mall were grouped as follows; less than 2 years, 3-5, 6-10, more than ten years.
Table 4.1 below provides a summary of the demographics as explained below.
Table 4.1: Respondents Demographics
Variable Frequency Percentage
Gender
Male
Female
20
60
25
75
Age
20-29
30-39
40-49
Above 50
Education
Masters holder
Degree holder
Diploma holder
Certificate
Others
Job/Business position
Director
Manager
Head of business portfolio /department
Subordinate
20
25
35
0
10
35
20
10
5
15
25
25
15
25
31.25
43.75
0
12.25
43.75
25
12.25
6.125
18.375
31.25
31.25
18.375

31
The results revealed that male respondents made up 25% out of the total employees
interviewed, while, the female respondents made 75% of the total respondents. The
findings revealed that 25% of the total respondents interviewed were in the age bracket
20-29 years, while 31.25% fall under the age bracket of 30-39 years and the 40 and 49
age bracket constituted 43.75 percent of the total respondents interviewed in all the
shopping malls A through T. None of the respondents interviewed was over 50 years.
The average age was 44.4 years.
Education levels were divide into five categories, that is masters graduates (12.25%),
degree holders (43.75%), diploma graduates (25%), certificate holders (12.25%), and
others (6.125%) as indicated in the Table 4.1 above. Level of education was significant to
this study because educate respondents have the higher capability in process information
and are able to make substantive decisions and therefore this depicts that education can
influence adoption of capacity management in the various shopping malls. Directors of
various businesses and subordinates constituted each 18.375 percent of total respondents,
Duration holding the same job position
Less than 2yrs
3-5
6-10
More than 10
Duration worked in the shopping mall
Less than 2yrs
3-5
6-10
More than 10
Duration business has been in operation in the shopping mall.
Less than 2yrs
3-5
6-10
More than 10
10
25
25
20
9
11
33
27
5
11
33
31
12.25
31.25
31.25
25
11.25
13.75
41.25
33.75
6.125
11.25
41.25
38.75

32
managers constituted 31.25 percent while the heads of business portfolios and
departments constituted 31.25 percent of the total respondents interviewed. The survey
results majority of the respondents interviewed were managers and heads of various
departments or business portfolios.
Survey results showed that 20% of the respondents had held their job positions for more
than ten years during the time of interview. Most of the respondents (31.25) had been in
the same job position for a period of between 6 and 10 years. While 12.25% indicated
that they had been in their current position for less than two years when this study was
being carried out. The survey also reveal that most (41.25) of the businesses had been in
operation for a period of between 6 and 10 years inside the mall. Only 6.12% of the
respondents interviewed indicated that their businesses had been in operation for less than
two years in the particular mall. Most (41.25%) of the employees interviewed indicated
that they had worked in the shopping mall for a period of between 6 and 10 years. Only 9
out of the 80 respondents interviewed indicated that they had worked for the shipping
mall for less than two years (Table 4.1).
Demographic characteristics are very key in this study for various reasons. The length of
service that the respondent had served in the shopping mall or in the business gives
credence to the response provided because it is assumed that, ceteris paribus, the longer
an employee worked in an organization the better the understanding of the operations of
the organization and in this case, the service delivery mechanism of the entity aimed to
satisfy customers. It also affects/impacts their expectations as a customer, in that things

33
that would otherwise be considered unsatisfactory are considered normal, due to getting
used to the same. The duration in which a shopping mall has operated gives an indication
of its experience in service operations and managing customer expectations / customer
satisfaction, and it is expected that capacity management practices would have been
adequately developed/matured over time.
4.3 Customer satisfaction
In this particular area, the researcher was interested on the following key aspects with
regard to customer satisfaction; accessibility of the mall, location of the mall, security of
the mall, space for tenants, ambience, aesthetics, ventilation, opening and closing hours,
rental cost, product/ service variety, customer care services, parking space, logistics
inside the mall and direction marking inside the mall. The researcher used probit model
for binary unit (YES/ NO) ‗‘YES‘‘ preference was taken as 1, while ‗‘NO‘‘ as 0.
4.3.1 How probit was applied to analyse Customer Satisfaction
Probit model is used to calculate the maximum likelihood estimates of parameters β and
ε whereby β is the vector of parameter estimates and ε is known as the latent variable.
The probability of selecting a parameter or otherwise can be computed as the following:
F(Y) = Y = Xβ + ε
Where-: F(Y) = Φ−1(Y) - this is known as probit link.
Our customer satisfaction parameters were as follows:
accessibility of the mall, location of the mall, security of the mall, space for tenants,
ambience/aesthetics, ventilation, opening and closing hours, rental cost, product/ service

34
variety, customer care services, parking space, logistics inside the mall and direction
marking inside the mall.
In our probit function shown above, Y is our dependent variable (Customer satisfaction)
being tested (using the probit function F(Y) = Y = Xβ + ε) to see whether it is positive or
negative against the mentioned customer satisfaction indicators)
Firstly, mean scores were calculated for each customer satisfaction parameter (as shown
in table 4.2) - by getting the sum/total count of the significant responses (i.e. YES) and
calculating the average by dividing the total YES of each parameter with the sample size
(80, in our case), as shown in Table 4.2 below.
Table 4.2 Mapping of Customer Satisfaction Indicators to Probit Model
Variables Definition Mean
values
Easily /conveniently accessible YES =1, NO=0 0.3637
Strategically located YES =1, NO=0 0.0114
Good floor plan YES =1, NO=0 0.2135
Adequate security YES =1, NO=0 0.0068
Ample parking space for tenants and customers YES =1, NO=0 0.1287
Sufficient and clean washrooms YES =1, NO=0 0.0678
Spacious and clearly marked walk ways YES =1, NO=0 0.0020
Sufficient , easy to use and working lifts YES =1, NO=0 0.0604
Easily identifiable and clearly marked fire exits YES =1, NO=0 0.6480
Caters for all persons (Disabled, Children, Old) YES =1, NO=0 0.0206
Good ambience and aesthetics YES =1, NO=0 0.5195
Appropriate ventilation YES =1, NO=0 0.3637
Satisfactory opening and closing hours YES =1, NO=0 0.0114
Attracts high caliber /quality tenants for the target
market
YES =1, NO=0 0.3737
provides fair value for rental costs YES =1, NO=0 0.1287
Good quality /wide product and service variety YES =1, NO=0 0.2135
Provides easily accessible, friendly customer care
services
YES =1, NO=0 0.0068
Management handles customer complains swiftly
and satisfactorily
YES =1, NO=0 0.0034
Provides satisfactory service YES =1, NO=0 0.2321
I would recommend the shopping Mall to other
prospective tenants
YES =1, NO=0 0.2233

35
Further, selecting the intercept at 0.5, (that is at 95.5% confidence level) so that any mean
scores above 0.5 would indicate a positive attitude to this variable while a mean score
below 0.5 would indicate a negative attitude to the variable.
Then to calculate the probit estimates (also known as probability of the parameters), as
per Table 4.3 below; firstly, we calculated CDF (cumulative distribution function) by
taking the sum of all mean scores of the parameters calculated above and dividing the
sum with a mean score of each individual parameter. NOTE that the higher the probit
estimate value, the more likely the response was accurate or true. And that is why I was
ranking the parameters considering how large the probit value is. Rank number 1(one)
means that the probit estimate is bigger than others and this means that most respondents
had a positive attitude towards that particular parameter.
Next step was to get the standard error. I used a simple formula: SE = Mean score
(squared) divided by square root of our sample size (80).
To get the z-statistics for each parameter I applied a simple formula, cumulative mean
scores of all parameters in Table 4.2 minus the mean score of each single parameter and
dividing the difference with the standard error of the respective parameter.
The z- statistics is useful in this study to assist us know whether the response of each
parameter is below or above the mean score of each parameter. And also to determine
whether means of each parameter is different from the other parameter.
Lastly I calculated the Marginal effect of each parameter. Marginal effect is the unit
change of the parameter on the probability given that all other parameters remain
constant. To calculate marginal effect I applied a simple formulae; probit estimate value
of each parameter multiply with the mean score of each particular parameter.

36
Table 4.3 Estimates of the probit model on customer satisfaction indicators
Variable Probit Estimates Standard
error
Z-
statistics
Marginal
effects
Easily /conveniently accessible 0.484 37.1030 0.897 0.5774
Strategically located 0.35 2.3568 0.986 -0.4311
Good floor plan -0.114 2.4567 0.356 -0.4332
Adequate security 0.7886 0.4311 0.213 0.3312
Ample parking space for tenants and
customers
0.5433 0.2133 0.124 0.5786
Sufficient and clean washrooms -0.677 30.2321 0.675 0.7644
Spacious and clearly marked walk
ways
0.399 5.7865 0.234 0.13478
Sufficient , easy to use and working
lifts
0.295 2.3456 0.356 0.0222
Easily identifiable and clearly marked
fire exits
0.324 6.7865 0.986 0.5515
Caters for all persons (Disabled,
Children, Old)
0.0789 0.5644 0.312 0.0832
Good ambience and aesthetics 0.2034 2.4533 0.782 0.6783
Appropriate ventilation -2.4364 5.6744 0.367 -0.5722
Satisfactory opening and closing hours 0.3466 30.5690 0.213 0.5788
Attracts high caliber /quality tenants
for the target market
0.0766 0.6521 0.455 0.6213
provides fair value for rental costs -0.6655 0.6777 0.321 0.9854
Easy to navigate 0.4321 0.2371 0.289 -0.9321
Provides easily accessible, friendly
customer care services
0.3655 0.2321 0.234 0.7211
Management handles customer
complains swiftly and satisfactorily
0.4321 30.5633 0.356 0.0211
Good product variations 0.2316 2.5541 0.678 0.0031
Entertainment 0.4601 0.2311 0.321 0.6213
I would recommend the shopping Mall
to other prospective tenants
0.3334 30.5542 0.453 0.8012

37
As per the probit estimates (which in this model and our research mean that the higher the
probit value the more likely the response is correct), the results revealed that most of the
respondents interviewed indicated adequate security (with a probit estimates score of
0.7886) as a key factor in choosing where to do shopping. Majority of the respondents
who chose this parameter attributed this to convenience when doing shopping and also
relaxed minds in social activities and entertainment. Further findings also revealed that
product variations and preferred brands played part during the decisions to choose one
shopping mall over another. They indicated that in choosing a shopping mall the most
important issue was availability of preferred followed by ample parking space for tenants
and customers (with a probit estimates score of 0.5433). The ambience was basically the
physical appearance of the shopping mall both inside and outside i.e. decorations,
attractive interior designs and attractive gardens and flowers.
Many (0.2034) of the customers running restaurants in the shopping mall indicated that
image was very key and customer satisfaction dependent partly on attractiveness of the
shopping mall. Third key factor to consider was accessibility of the shopping mall
(0.484) basically looking at the convenience of the location of the shopping mall,
infrastructures (roads) and availability of parking space. Entertainment also came in
fourth (0.4601) popular factor and respondents indicated that entertainment was key to
attracting customers to the shopping mall through a variety of services like catering, and
recreational services for children and adults as well
Convenience (a probit estimates score of.4321) inside the mall also drew a lot of concern
by the respondents interviewed citing convenience and navigation within the shopping
mall facilitated ease of movement from one store to the other, comfortable escalators, and

38
lifts from one floor to another. Most (a probit estimates score of, 0.399) of the respondents
interviewed indicated that the mall had spacious and clearly marked walk ways. A
number of respondents (a probit estimates score of 0.4321) also agreed with the statement
that the management handles customer complains swiftly and satisfactorily. The study
showed that most of the shopping malls had a good performance to the knowledge of
customers, equipment efficiency and preparedness in case of emergency, as represented
by proportions of 0.3655, 0.295 and 0.324 respectively. On product variation, 0.2316 each
of respondents pointed out that there was either a fair or good performance. For price
differentiation and accessibility of location, customer attributed shopping mall
performance was not fair. This constituted negative response (a probit estimates score of
-0.6655) from across the malls targeted.
The smallest Standard error (SE) (Standard error is, margin of error), meaning that the
smaller the margin the higher the accuracy (and vice versa); which was a probit estimates
score of, 0.2133 for ample parking space for tenants and customers indicating the high
level of accuracy and confidence by the respondents on this particular variable. In
Summary, the response on the various variables demonstrated small margins of error
except for accessibility of the shopping malls (37.1030), washrooms (30.2321), opening
and closing hours (30.5690), handling customer complaints (30.5633) and on
recommending the shopping Mall to other prospective tenants (30.5542). Accessibility of
the mall demonstrate the largest SE which was attributed to mix thoughts of the
respondents concerning the variable hence compromising the accuracy of the response.
Similarly, the highest probability of z-statistics (a Z score is the distance or the deviation
from the mean scores). It is also referred to as standard deviation. In our analysis it shows
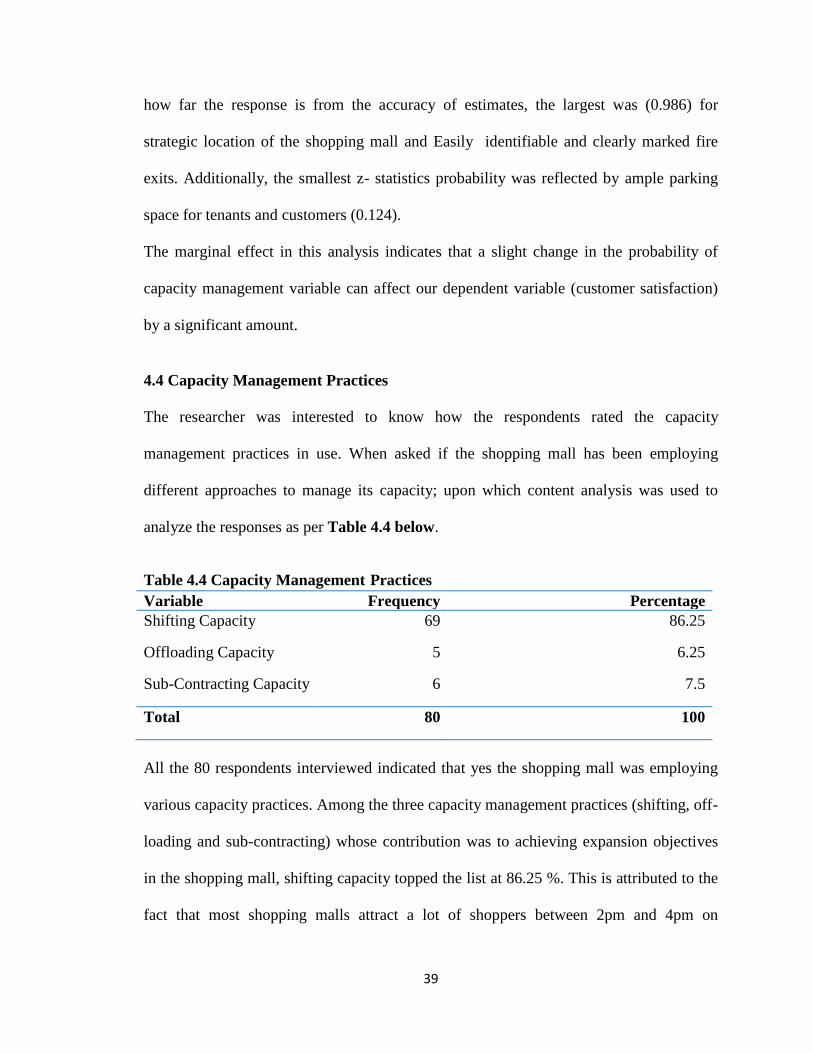
39
how far the response is from the accuracy of estimates, the largest was (0.986) for
strategic location of the shopping mall and Easily identifiable and clearly marked fire
exits. Additionally, the smallest z- statistics probability was reflected by ample parking
space for tenants and customers (0.124).
The marginal effect in this analysis indicates that a slight change in the probability of
capacity management variable can affect our dependent variable (customer satisfaction)
by a significant amount.
4.4 Capacity Management Practices
The researcher was interested to know how the respondents rated the capacity
management practices in use. When asked if the shopping mall has been employing
different approaches to manage its capacity; upon which content analysis was used to
analyze the responses as per Table 4.4 below.
Table 4.4 Capacity Management Practices Variable Frequency Percentage
Shifting Capacity 69 86.25
Offloading Capacity 5 6.25
Sub-Contracting Capacity 6 7.5
Total 80 100
All the 80 respondents interviewed indicated that yes the shopping mall was employing
various capacity practices. Among the three capacity management practices (shifting, off-
loading and sub-contracting) whose contribution was to achieving expansion objectives
in the shopping mall, shifting capacity topped the list at 86.25 %. This is attributed to the
fact that most shopping malls attract a lot of shoppers between 2pm and 4pm on

40
weekends. Shoppers are also likely to stay out late shopping on weeknights, making
purchases and this therefore called for a versatile strategy like shifting capacity
management strategy; which collaborated our findings. When the respondents were asked
which Capacity Management strategies i.e. of the shifting, Sub Contracting and
offloading practices had been used. The response was as follows.
Table 4.5: shifting and offloading strategies
Variable Frequency Percentage
The shopping mall alters the number of service
providers during peak times to meet the customer
demands
7 8.25
The shopping mall employs part time staff on part
time basis during periods of increased demands
5 6.25
The shopping malls shares facilities that are idle with
the other sections of the mall that are in need of the
spare capacity.
15 18.25
The shopping mall adopts ―do it yourself procedure‖
to customers and this releases various resources to be
utilized at different levels
9 11.25
During periods of high demand for services by the
customers- both internal and external customers, the
shopping mall offers overtime facilities to its staff to
cope with the increased demand
13
16.25
The shopping mall continuously trains and develops
its employee to improve their capacity to handle more
than one task at a time
11 13.75
The Shopping Mall management charges different
price for space that is strategically located in the same
floor
7 8.25
The shopping mall requires customers to wait for the
service in a queue and this improves the quality of
services offering
0 0
The staff in the shopping mall are always rescheduled
to increase the service levels at any given time in the
mall and can be moved from one point to a point
where there is a deficit
3 3.75
The shopping mall strives to understand what suffers
the customer to establish whether the front line staff
have a role to play
9 11.25
Total 80 100

41
Capturing unused capacity through facilities that are idle with the other sections of the
mall that are in need of the spare capacity was only an effective method as agreed by
15% of the respondents. Interestingly, rescheduling of staff did not contribute to
achieving expansion objectives in the shopping malls. There were three main strategies
used to operationalize shopping mall capacity requirements, of which all the 20 shopping
malls surveyed indicated that they scheduled their activities and also had a flexible
workforce. Another strategy used is altering number of service providers during peak
times to meet the customer demands, as agreed by 7% of the respondents. No (0%)
respondent agreed with the statement that shopping mall requires customers to wait for
the service in a queue and this improves the quality of services offering.
When the respondents were asked to what extent the sub-contracting strategies to manage
capacity had been useful in its achievements. The response was as per Table 4.6 below.
Table 4.6: sub-contracting strategies
Variable Frequency Percentage
The mall aims at improving the size of the service
delivery point to its customers by pursuing acquisition of
spaces facility in the nearby buildings and floors to meet
the customers demand
21 26.25
The shopping mall offers limited number of services and
encourages self- service by the customers
5 6.25
The Mall engages different contractors in service
provision to the establishment and its customers
15 18.75
Sub-contracting of services by the mall has led to the loss
of control over the service process
15 18.75
The use of experts in areas such as taxation, treasury and
operational decisions enables the mall to deliver quality
services to its clients and therefore increase its
competitiveness
24
30
The mall shares some of its equipment such as servers
with other firms to reduce its operational cost.
12 15
Total 80 100

42
The strategy of acquisition of spaces facility in the nearby buildings and floors enables
the shopping mall to meet the customers demand as indicated by 21% of the respondents.
Use of experts in areas such as taxation, treasury and operational decisions enables the
mall to deliver quality services to its clients and therefore increase its competitiveness as
noted by (24%) of the respondents interviewed. The usefulness of contractors in service
provision was represented by 15% of the respondents interviewed. However, issue of
self- service by the customers as a capacity management strategy was not quite effective
as only 5% of the respondents indicated that it was used.
4.5 Capacity management practices and customer satisfaction in the shopping malls
Having shown from the above trend analysis of the key customer satisfaction indicators
and determined the capacity management practices commonly used in the shopping malls
in Nairobi, the researcher now sought to test and establish the relationship between the
identified capacity management practices in the shopping malls and customer satisfaction
using the probit regression model. Two sets of data were used for this analysis. Firstly,
the data collected from customers satisfaction indicator made up of five key parameters
(i.e. customer complaints, customer compliments, pricing and quality product or services)
while the second set is the capacity management practices which were then subjected to
the probit regression model, as per Table 4.7 an 4.8 below.
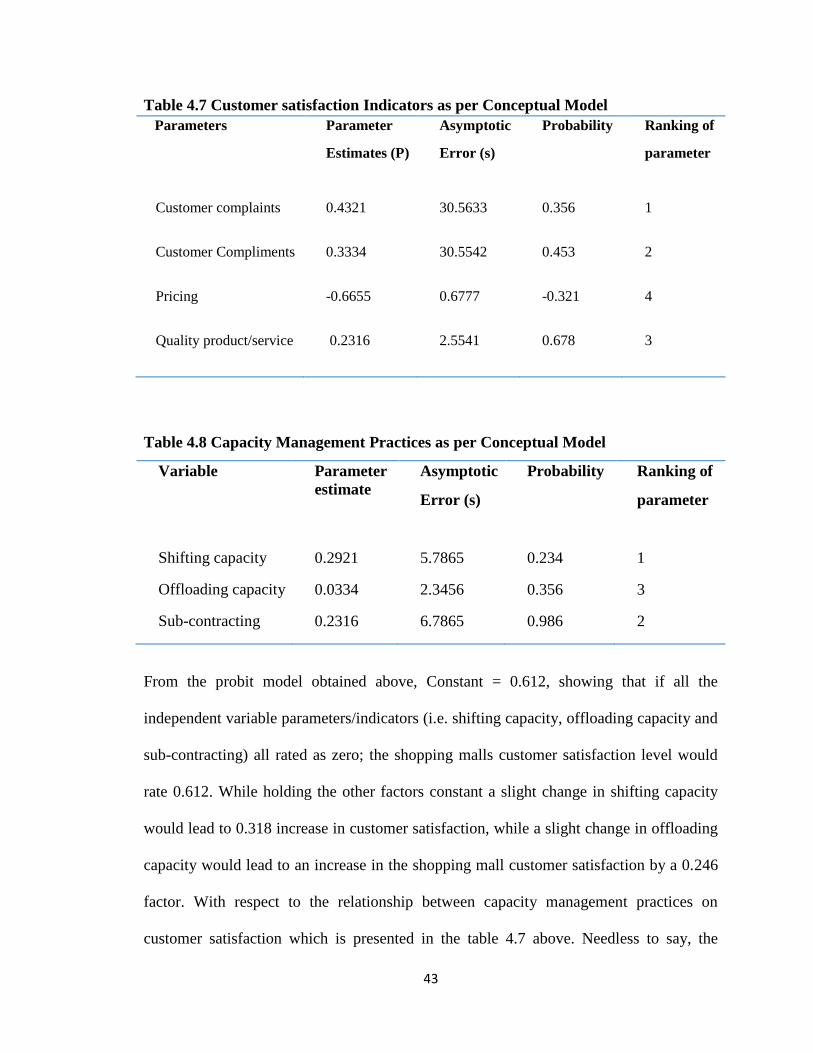
43
Table 4.7 Customer satisfaction Indicators as per Conceptual Model
Parameters Parameter
Estimates (P)
Asymptotic
Error (s)
Probability Ranking of
parameter
Customer complaints
0.4321 30.5633 0.356 1
Customer Compliments
0.3334 30.5542 0.453 2
Pricing
-0.6655 0.6777 -0.321 4
Quality product/service
0.2316 2.5541 0.678 3
Table 4.8 Capacity Management Practices as per Conceptual Model
Variable Parameter
estimate
Asymptotic
Error (s)
Probability Ranking of
parameter
Shifting capacity 0.2921 5.7865 0.234 1
Offloading capacity 0.0334 2.3456 0.356 3
Sub-contracting 0.2316 6.7865 0.986 2
From the probit model obtained above, Constant = 0.612, showing that if all the
independent variable parameters/indicators (i.e. shifting capacity, offloading capacity and
sub-contracting) all rated as zero; the shopping malls customer satisfaction level would
rate 0.612. While holding the other factors constant a slight change in shifting capacity
would lead to 0.318 increase in customer satisfaction, while a slight change in offloading
capacity would lead to an increase in the shopping mall customer satisfaction by a 0.246
factor. With respect to the relationship between capacity management practices on
customer satisfaction which is presented in the table 4.7 above. Needless to say, the

44
capacity management hypothesis that each of the practices adopted by the shopping malls
will have positive effects on the probability of customer satisfaction in the shopping
malls. As observed in this analysis, the co-efficient of most of the customer satisfaction
parameters are positive except pricing (-0.321). In assessing the relationship that the
capacity management practices have on customer satisfaction as presented in table 4.8.
The hypothesis that shifting capacity, subcontracting capacity and offloading capacity
management strategies will have positive effects on customer satisfaction in the shopping
malls. Their coefficient are all positive with the probit estimates of; 0.234, 0.356 and
0.986 respectively. The most influential capacity management practice that explains
customer satisfaction in the shopping malls is the shifting capacity management followed
by the sub-contracting capacity as shown by the ranking of the variables in the Table 4.8.
above.
4.6 Discussion of Findings
This findings showed that many respondents interviewed indicated security (with a probit
estimate of 0.7886) as the most significant parameter attributed in choosing the shopping
mall. This finding is in line with a study by Cacioppo (2010) which revealed that retail
customer satisfaction is determined by store environment, convenient location, customer
service, brand variety, and shopping convenience. He argued that retail customer
satisfaction depends on location, security, product quality, reliability, and process and
personnel services.

45
The findings further showed that many of the customers running restaurants in the
shopping mall indicated image (with a probit estimate of 0.2034) as very key and
customer satisfaction dependent partly on attractiveness of the mall. This findings are
amplified by Wan and Schell (2013) who observed that customer satisfaction was as a
result of the perceived measurement of services and products with regard to the previous
experience and the overall evaluation of consumer experience accompanied by the
ambience or the attractiveness of the shopping mall. They noted that a shopping mall or a
service provider offering quality service in a good environment was in a position to meet
customers‘ expectations of which customer satisfaction was the objective of the service
or the product based on the customer‘s past experience. Regular staff training on issues
such as capacity utilization, customer relations and safety measures was inevitable as it
ensured the malls had a competent staff, otherwise the need to replace non-performers.
The study revealed that most shopping malls had a good performance to staff knowledge
of customers, equipment efficiency and preparedness in case of emergency as represented
by proportions of 0.3655, 0.295 and 0.324 respectively. According to Kotler (2002) there
are seven approaches to increasing customer satisfaction, these are having skillful
workers through the process of recruitment and selection, increasing quantity of service
by surrendering quality, industrializing the services, reducing or making absolute the
service need by inventing a product solution, designing of more effective services,
presenting customers with incentives to substitute own labour with company labour and
also harnessing power of technology to give customers better services.

46
The findings reveal that the most popular capacity management practice was the shifting
capacity. All the 80 respondents interviewed revealed that shopping mall was employing
various capacity management practices and aamong the three practices (shifting, off-
loading and sub-contracting), shifting capacity topped the list at 86.25 %. This finding is
amplified by a survey done on Kenyan shopping malls by Knight Frank, (2016) the
survey found out that there was an improvement and creative utilization of unused mall
spaces and even parking space to incorporate newer retail categories to attract consumers
and drive additional revenue. Offloading capacity was the least popular according to the
findings, only 5 out the total respondents interviewed mentioned it as being employed by
the shopping malls. This view was shared by Alp and Tan (2006) who observed that
offloading capacity strategy is being used by airlines to increase their performance in
situation where there exist a constrained capacity. Therefore our study points to the fact
that this strategy is not popular in the shopping malls because most of the services sort by
the customers is not booked by the clients like in the airline, and car rental.
In assessing the relationship that capacity management practices have on customer
satisfaction as presented in Table 4.8 above; as observed in this analysis, the co-efficient
of most of the customer satisfaction parameters are positive in presence of capacity
management practices. The analysis shows that if all the independent variables,
parameters or indicators (i.e. shifting capacity, offloading capacity and sub-contracting)
all rated as zero; customer satisfaction level would rate 0.612. While holding the other
factors constant a unit increase in shifting capacity would lead to 0.318 increase in
customer satisfaction. A unit increase in offloading capacity would lead to an increase in

47
the shopping malls customer satisfaction by a 0.246 factor. Our statistics show that, a unit
change in either shifting, offloading or subcontracting could lead to a change in customer
satisfaction parameters (customer complaints, customer compliments, product/service
quality). These findings are in line with a study conducted by Yi, (2000) He mentioned
that customer‘s satisfaction is influenced by experiences and expectations with service
performance. Thus, satisfaction is similar to an attitude, as it can be assessed as the sum
of the satisfactions with the various attributes of the product or service.
48
CHAPTER FIVE
SUMMARY, CONCLUSION AND RECOMMENDATIONS
5.1 Introduction
This chapter presents the summary of the study, conclusion drawn from the findings
highlighted and recommendation made there-to. The conclusions and recommendations
drawn were focused on addressing the purpose of this study which was to establish the
relationship between capacity management practices and customer satisfaction in the
shopping malls in Nairobi, Kenya.
5.2 Summary of the Findings
There were several capacity management strategies that responded to customer needs in
shopping malls.
The first objective on determining the capacity management practices commonly used by
shopping malls in Nairobi, Kenya. All the respondents noted that the shopping malls
employed various capacity management practices among them was shifting capacity,
offloading and sub-contracting. The findings revealed that shifting capacity was most
popular among the 20 shopping malls investigated.
Various strategies on implementing the capacity management practices were employed in
the shopping malls aimed to enhance customer satisfaction. The strategy of the shopping
mall continuously training and developing its employee to improve their capacity to
handle more than one task at a time majorly led to customer safety, whereas altering

49
number of service providers during peak times to meet the customer demands responded
to quick clearance. In the meantime, subcontracting responded to customer needs like
handling complains and continuous service. Rescheduling of activities helped in
achieving service flexibility and response time. Flexible workforce on the other hand
helped in meeting service time. However, do it yourself procedure did not quite effective
respond to customer needs, other than enhancing continuous service. The study revealed
that most shopping malls had a good performance to staff knowledge of customers,
equipment efficiency and preparedness in case of emergency. On product/ service
variation, each of respondents pointed out that there was either a fair or good
performance. For fair value for rental costs and price differentiation, customer attributes
shopping mall performance was not fair.
Regular staff training on issues such as capacity utilization, customer relations and safety
measures was inevitable as it ensured the malls had a competent staff, otherwise the need
to replace non-performers.
Objective two was aimed at finding out the relationship between capacity management
practices and customer satisfaction in the shopping malls. The findings revealed that
there was a significant relationship between capacity management practices employed by
the shopping malls and customer satisfaction parameters. As observed in the analysis, the
co-efficient of most of the customer satisfaction parameters are positive in presence of
capacity management practices. The analysis shows that if all the independent variables,
parameters or indicators (i.e. shifting capacity, offloading capacity and sub-contracting)
50
all rated as zero; customer satisfaction level would rate 0.612. While holding the other
factors constant a slight change in shifting capacity would lead to to 0.318 increase in
customer satisfaction. A slight change or increase in offloading capacity would lead to an
increase in the shopping malls‘ customer satisfaction index by a 0.246 factor. Our
statistics show that, a unit change in either shifting, offloading or subcontracting could
lead to a change in customer satisfaction parameters (customer complaints, customer
compliments, product/service quality).. The findings further indicated that the most
popular capacity management practice that explains customer satisfaction in the shopping
malls is the shifting capacity management followed by the sub-contracting capacity. 69
out of 80 respondents interviewed mentioned shifting capacity as being employed in the
shopping mall. The analysis shows that in order to increase the probability of customer
satisfaction in the shopping malls, efforts must be geared towards enhancing pricing or
cost effectiveness of the malls. The probit estimates show (-0.6655) indicating a negative
response by respondents towards fair value for rental costs as provided by shopping
malls. As observed in this analysis, the co-efficient of most of the customer satisfaction
parameters are positive attributed to capacity management practices being employed.
5.3 Conclusion
The study concludes that the main capacity management practice widely employed by
shopping malls is shifting capacity management. Moreover, the strategies for managing
space in the shopping malls had been fairly useful on customer satisfaction, process time
and response time. The usefulness of the capacity management strategies was good in
service flexibility. The practices used to manage capacity requirements were; shifting

51
capacity, offloading capacity and sub-contracting. Rescheduling of activities majorly led
to service flexibility and service time. Capacity strategies such as easily identifiable and
clearly marked fire exits majorly led to customer safety. Shifting capacity majorly
responded to quick clearance while contractors in service provision led to reduced
complains and continuous service, whereas flexible staff helped in meeting service time.
However, queuing did not quite effective respond to customer needs, other than
enhancing minimum service. With respect to the relationship between capacity
management practices and customer satisfaction, findings were clear that capacity
management practices especially the shifting capacity does play a significant role in
gluing the customers to the shopping malls.
The analysis shows that 18.25% of the total respondents interviewed revealed that the
shopping malls shares facilities that are idle with the other sections of the mall that are in
need of the spare capacity. Another 16.25% of respondents noted that during periods of
high demand for services by the customers- both internal and external customers, the
shopping mall offers overtime facilities to its staff to cope with the increased demand.
Out of the 80 respondents interviewed none (0%) agreed that shopping mall requires
customers to wait for the service in a queue and this improves the quality of services
offering. In contrast, the shopping mall strives to understand what suffers the customer to
establish whether the front line staff have a role to play as 11.25% of respondents
indicated.
52
5.4 Recommendations
Due to the increasing advancement in information technology, automation through Smart
cards, online payment and ability to place orders directly without having to travel to a
shopping mall for deliveries should be exploited by shopping malls with large economies
of scale. There is need for the shopping malls management to understand what the
customers want so as to translate these expectations into customer satisfaction, good
process and response time and service flexibility.
The strategies shopping malls use to manage capacity requirements should be relooked
into. The employees should be adequately motivated to enhance a flexible workforce, and
new safe equipment be purchased which in turn leads to service flexibility, improved
service and response time and improve customer satisfaction.
The management of the shopping malls should consider putting in place the
recommended capacity management practices (shifting, offloading and subcontracting) to
even better its customer satisfaction by enhancement of capacity management practices
that have not been fully embraced by some shopping malls such as offloading capacity.
The findings show that capacity management strategies are in use in these shopping
malls, though it was evident that some elements of capacity management strategies needs
to be strengthened to help fortify their effects on enhancing the customer satisfaction in
the malls. Such strategies like, ―Do it Yourself‖ procedures to customers in relation to
offloading capacity strategy. Others include enhanced use of the element of equipment

53
sharing with regard to sub-contracting strategy as well as alter of operations with
fluctuating demand relative to level strategy.
It is therefore imperative that every shopping mall pays good attention not just to the
implementation of capacity management practices but also in ensuring that such
implementation are thorough by breaking it down into its respective variables and
measure the impact of each of the strategy or capacity management practice so as to
know the significant level of each practices. It is therefore safe to conclude that proper
implementation of capacity management practices in a shopping mall will result in
improved customer satisfaction.
For customer satisfaction the indication is that in order to increase the probability of
customer satisfaction in the shopping malls, efforts must be geared towards enhancing
pricing or cost effectiveness of their malls. Continuously training and retraining of
employees working in the shopping malls must be engaged on fine tuning their
responsiveness to customer compliments and customer complains (which happen to be
the most influential parameters in this respect). Equally, the shopping malls management
must enhance their sub-contracting capacity management strategies on quality of product/
services and constantly fine tune pricing of the malls approach.
During capacity changes, shopping malls should uphold strategies such as benchmarking,
involving employees, customers and other stake holders while taking into account the
impact of proposed change. Customer safety, service time and quick clearance are some
of the main factors a consumer considers before entering a shopping mall. The capacity
54
management strategies adopted should adequately address these concerns above board.
To achieve a continuous good performance, staff training is inevitable. Further, teamwork
and effective, prompt communication should be done within all the management levels
.The main challenges that shopping malls face ought to be carefully addressed to ensure
that resources are utilized as efficiently as possible and customers are satisfied.
5.5 Limitations of the Study
The aim of the research was to find out the various capacity management practices
employed by shopping malls in Kenya and the relationship between capacity
management practices and customer satisfaction. Therefore the research was limited to
capacity management and customer satisfactions in shopping malls. Future research
should concentrate more on other sectors apart from service industry. Secondly, there was
biasness in filling some of the questions in the questionnaire by the respondents. Many
respondents attributed this to their busy schedule in the business and they did not have
much time to take good time in reading through the questions keenly. Future research
focusing on this particular topic should come up with a slim interview guide and a
questionnaire. Thirdly, this study focused on the three capacity management practices
(shifting, offloading and sub-contracting), however, mall capacity management is subject
to change over a period of time due to a number of reasons like experience gained over
time and therefore it would be more important to do a research on the particular shopping
malls at various and different times. A good area for further research is the investigation
of the relationship between the same variables for the various businesses within the
shopping malls. Even though there is some evidence that shopping mall capacity

55
management practices and customer satisfaction have a relatively close relationship, it is
still not clear to what extent.
5.6 Suggestions for Further Research
This study concentrated on the relationship between capacity management practices and
customer satisfaction in the shopping malls. Further studies should be carried on the
challenges of capacity management since this was not adequately exhausted. Also, this
study was a descriptive survey research study; further studies on the same objectives
should be undertaken focusing on a different service sector apart from shopping malls,
the research should be extended to capture capacity management practices and customer
satisfaction in the eyes of customers in commercial banks, hospitals and other service
providing organizations, other than just shopping malls.
Technological change as well as External environment factors surveys need to be carried
out so as to ascertain the best operational capacity management practices to employ in
consideration of these factors. That is, while it is prudent to determine the physical
location, space, stores and store procedures, machinery and equipment aspects of
information system, human resource and quality assurance should also be addressed.

56
REFERENCES
Adenso-Díaz,T.R González-Torre & García (2012). A capacity management model in
service industries, International Journal of Service Industry Management, 13 (3),
286 – 302.
Alp B.N., Anderson & Tan (2010). Tactical Capacity Management under Capacity
Flexibility in Make-to-Stock Systems. Working Paper.
Bett F. and Borin K. (2015) ―The effect of place on performance of shopping malls in
Kenya‖. International Journal of Business & Law Research, 2(4):73-87.
Bitner T., Lovelock R. & Zeithaml W., (2003). Services Marketing: Integrated customer
focus across the firm. London: McGraw Hill.
Buxey T., Wan Q., Schell and Bula P., (2010). Labor Turnover in the Sugar Industry in
Kenya. European Journal of Business and Management. 4(9)
Chase D., Cagliano F. & Aquilano (1992). Production and operations management: A
life cycle
Approach. Illinois: Irwin.
Corstjens, Doyle M., Eshiteti N., Okaka Y., Maragia, Odera M. & Akerele (2013).
Effects of Succession Planning Programs on Staff Retention. Mediterranean
Journal of Sciences, 4 (6).
Gants W. & Jiang, Z. (2009). A review on strategic capacity planning for the
semiconductor manufacturing industry. International Journal of Production
Research, 47(13), 3639-3655.
Guion T. and Goldratt, (1980). Recruiting, selection, and job placement. In M.D. Dunette
(Ed.), Handbook of industrial and organizational psychology. Chicago: Rand
McNally.
Huffman P.,K. and Kawila M., (2010). Service breakthroughs. Boston,Massachussetts:
Simon and Schuster.
Johnston D. and Kotler P., (2012). The determinants of service quality: satisfiers and
dissatisfiers, International Journal of Service Industry Management, Vol. 6 (5), 53
– 71.

57
Kolev A. and Paiva F., (2008). Demand and capacity management decisions in services.
How they impact on one another, International Journal of operations and
production management, .22 (5), 527-548.
KnightFrank Y., (2016) The Shop Africa 2016 report, ―assessing Sub-Saharan Africa‘s
retail markets"
Mohammadian & Ronaghi D., (2010), ―Services Marketing‖, Prentice Hall Inc
Mutali M. and Cacioppo S., (2013). Impact on Employee Retention in State Financial
Corporations in Kenya. International Journal of Business and Public Management,
2(2) 30-38.
Wirimu N., and Mokaya P., (2014). Factors that Influence Labour Turnover of Aircraft
Maintenance
Mwangi J., and Basu M., (2009). Factors affecting talent management at nation media
group
Nairobi City County Licensing Department (2015).
Ong‘ondo and Oliver (2013). Effect of Capacity Management Strategies on Service
Quality in Safaricom Limited Retail Outlets, Unpublished MBA Project:
University of Nairobi
Payton M., and Ployhart, (2006), Staffing in the 21st Century: Challenges and Strategic
Opportunities. Journal of Management, 32:868.
Ray K.,and Schmenner N., (2009). The flexibility of manufacturing systems.
International Journal of Operations & Production Management, 7(4), 35-45.
Rynes, Brown and Colbert (2002). Seven Misconceptions about Human Resource
Practices: Research Findings versus Practitioner Beliefs. Academy of Management
Executive 16: 92 – 103
Reginald and Oxford Business Group (2016). An analysis of an employee value
proposition. (Masters Dissertation). Retrieved from Networked Digital Library of
Theses and Dissertations. http://hdl.handle.net/10394/1839.
Savage and Sasser, (2006). Match supply and demand in service industries. Harvard
Business Review, 54(6), 133-140.

58
APPENDICES
Appendix I: Introduction Letter

59
Appendix II: Customer Satisfaction Questionnaire
(i) This questionnaire is administered on shopping mall tenants as the target
customers of the research on Capacity Management Practices and Customer
Satisfaction.
(ii) The information to be given in this questionnaire will be confidential and purely
for academic purposes.
(iii)The Questionnaire aims to establish the level of customer satisfaction for services
rendered by the shopping mall, as a factor of capacity management practices.
SECTION A: RESPONDENTS DEMOGRAPHICS
(Fill in the blank spaces and tick once in the below given choices of all questions)
1. Name (optional):
2. Please indicate your age bracket?
20-29 years [ ]
30-39 years [ ]
40-49 years [ ]
Above 50 years [ ]
3. Please indicate your gender: Male [ ] , Female [ ]
4. Please indicate your education level
Masters [ ] Certificate [ ]
Bachelor‘s degree [ ] others (specify)………………………..
Diploma [ ]
5. For how long have you worked for the business?............................................................
6. What is your current position in the business? ..........................................................
7. For how long have you been holding the same position? ................................................
8. For how long has your business been operating at this shopping mall? .........................

60
SECTION B: CUSTOMER SATISFACTION
(In this section please state (YES or NO) the most appropriate response for each of the
questions in the table below.
To what extent do you agree with the following aspect regarding capacity management
practices and customer satisfaction.
THANK YOU SO MUCH FOR YOUR TIME
CUSTOMER SATISFACTION INDICATOR Yes No
The Shopping Mall is easily and conveniently accessible
The Shopping Mall is strategically located
The Shopping Mall has a good floor plan
The Shopping Mall has adequate security
The Shopping Mall has ample parking space for tenants and customers
The Shopping Mall has sufficient and clean washrooms
The Shopping Mall has spacious and clearly marked walk ways
The Shopping Mall has sufficient, easy to use and working lifts
The Shopping Mall has easily identifiable and clearly marked fire exits
The Shopping Mall caters for all persons (Disabled, Children, Old)
The Shopping Mall has good ambience and aesthetics
The shopping mall has appropriate ventilation
The Shopping Mall has satisfactory opening and closing hours
The Shopping Mall attracts high caliber and quality tenants for the target market
The Shopping Mall provides fair value for rental costs
The shopping Mall has a good quality and wide product and service variety
The Shopping Mall provides easily accessible, friendly customer care services
The Shopping Mall management handles customer complains swiftly and
satisfactorily
The Shopping Mall provides satisfactory service
I would recommend the shopping Mall to other prospective tenants

61
Appendix III: Interview Guide
(i) This Interview Guide is administered on shopping mall management for the
research on Capacity Management Practices and Customer Satisfaction
(ii) The information to be given in this interview will be confidential and purely for
academic purposes.
(iii)The interview guide will seek to establish: - The capacity management practices
commonly used by Shopping Malls in Nairobi, Kenya.
SECTION A: Demographic Data
1. Name (Optional):
2. For how long have you worked at the Shopping Mall? ................................................
3. What is your current position in the Shopping Mall? ................................................
4. For how long have you been holding the same position? ...............................................
5. For how long has the Shopping Mall been operating?. .................................................
6. Approximately how many employees work in the Shopping Mall?. .............................
SECTION B: Capacity Management Practices
7. Has your Shopping Mall been employing different approaches to manage its space
and in the process influence customer level of satisfaction?
Yes ( ) No ( )
8. Which of the following capacity management practices are being implemented in the
Shopping Mall?
CAPACITY MANAGEMENT PRACTICES Yes No
Shifting Capacity
Offloading Capacity
Sub-Contracting Capacity
Any other capacity management practice that the shopping Mall employs in the
Mall…………………………………………………………………………………………

62
9. The following are some of the shifting capacity strategies that can be employed by the
shopping Mall. Which of the following are being adopted in the shopping Mall.
Statement Yes No
The shopping mall alters the number of service providers during peak
times to meet the customer demands
The shopping mall employs part time staff on part time basis during
periods of increased demands
The shopping malls shares facilities that are idle with the other sections
of the mall that are in need of the spare capacity.
The shopping mall adopts ―do it yourself procedure‖ to customers and
this releases various resources to be utilized at different levels
During periods of high demand for services by the customers- both
internal and external customers, the shopping mall offers overtime
facilities to its staff to cope with the increased demand
The shopping mall continuously trains and develops its employee to
improve their capacity to handle more than one task at a time
What other shifting capacity does the shopping mall employ in effectively managing
its shifting capacity? Please expound…………………………………………………..
10. The following are some of the off-loading capacity management strategies that can be
employed by the shopping mall. Please indicate the strategies being adopted by your
business unit.
Statement Yes No
The Shopping Mall management charges different price for space that is
strategically located in the same floor
The shopping mall requires customers to wait for the service in a queue
and this improves the quality of services offering
The staff in the shopping mall are always rescheduled to increase the
service levels at any given time in the mall and can be moved from one
point to a point where there is a deficit
The shopping mall strives to understand what suffers the customer to
establish whether the front line staff have a role to play
The mall aims at improving the size of the service delivery point to its
customers by pursuing acquisition of spaces facility in the nearby
buildings and floors to meet the customers demand
The shopping mall offers limited number of services and encourages
self- service by the customers

63
What other offloading capacity strategy does the shopping mall employ in effectively
managing its capacity? Please expound………………………………………………..
11. The following are some of the sub-contracting capacity management strategies that
can be employed by the shopping mall. Please indicate the strategies being adopted
by your shopping mall.
Statement Yes No
The Mall engages different contractors in service provision to the
establishment and its customers
Sub-contracting of services by the mall has led to the loss of control over
the service process
The use of experts in areas such as taxation, treasury and operational
decisions enables the mall to deliver quality services to its clients and
therefore increase its competitiveness
The mall shares some of its equipment such as servers with other firms to
reduce its operational cost.
What other sub-contracting strategy does the shopping mall employ in effectively
managing its capacity? Please expound
……………………………………………………………………..
THANK YOU SO MUCH FOR YOUR TIME
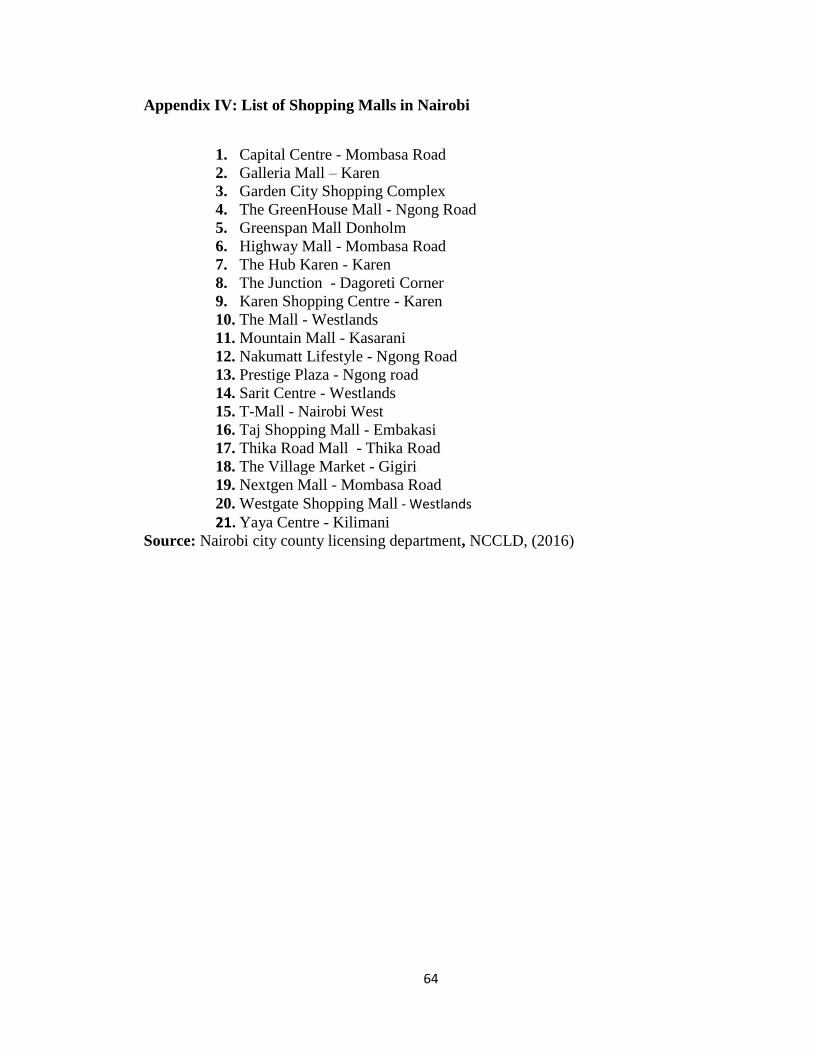
64
Appendix IV: List of Shopping Malls in Nairobi
1. Capital Centre - Mombasa Road
2. Galleria Mall – Karen
3. Garden City Shopping Complex
4. The GreenHouse Mall - Ngong Road
5. Greenspan Mall Donholm
6. Highway Mall - Mombasa Road
7. The Hub Karen - Karen
8. The Junction - Dagoreti Corner
9. Karen Shopping Centre - Karen
10. The Mall - Westlands
11. Mountain Mall - Kasarani
12. Nakumatt Lifestyle - Ngong Road
13. Prestige Plaza - Ngong road
14. Sarit Centre - Westlands
15. T-Mall - Nairobi West
16. Taj Shopping Mall - Embakasi
17. Thika Road Mall - Thika Road
18. The Village Market - Gigiri
19. Nextgen Mall - Mombasa Road
20. Westgate Shopping Mall - Westlands
21. Yaya Centre - Kilimani
Source: Nairobi city county licensing department, NCCLD, (2016)