olympic britain - uk parliament · olympic britain social and economic ... all you need is love...
TRANSCRIPT

Olympic Britain Social and economic change since the
1908 and 1948 London Games


Gavin Thompson, Oliver Hawkins, Aliyah Dar, Mark TaylorNick Battley
Adam Mellows-Facer, Chris Rhodes, Daniel Harari, Dominic Webb, Feargal McGuinness, Gavin Berman, Grahame Allen, Lorna Booth, Lucinda Maer, Matthew Keep, Nida Broughton, Paul Bolton, Rachael Harker, Richard Cracknell, Roderick McInnes, Tom Rutherford
Olympic Britain Social and economic change since the 1908 and 1948 London Games

Foreword
Olympics Racing towards our limits Men’s Olympic record progression on the trackGrade Britain The performance of the British teamIt’s the taking part that counts Competitors and events in the gamesWorld class Africa at the Olympics
PopulationSurvival of the littlest Infant mortalityHave kids, settle down Marital and maternal age since 1938Grey Britain The ageing of the UK populationA necessary end Changes in the causes of deathThe start of a new way to end CremationNatural flourish The causes of population change
Housing & home lifeBuild it up, sell it off The rise and fall of social housingAll you need is love (and a marriage certificate) Marriage since 1900Split pairs Divorces since 1900Kid and kin Children outside marriage
Incomes & povertyShow me the money Inequality in incomes and wealthWorkhouse to welfare Child poverty and help for the poorCheaper in those days? Prices and earningsThe benefits of Britain Social securityBread and board Views on life’s essentials
Leisure & lifestylesMass conception Public opinion since 1938Liquor up Alcohol consumptionChilly holiday How holidays have changed for the British and visitors to the UKA balmy celebration? Can we expect a sunny Olympics
LondonAll change The London UndergroundDo you know the way to Haringey? The changing population of London’s boroughsHome of the world Diversity and London’s foreign-born populationSize matters London’s place in the world
Contents

EducationMob school Pupil-teacher ratios and school participationPreachers and teachers Church, charity and the provision of educationYou’re hired Apprenticeships since the 1950sHigher intelligence University participation
EmploymentWorking miracles Employment by age and genderJobs for the boys Gender balance in employment and the changing nature of workPicket up Strikes and trade union membership
Food & agricultureMore chicken, less egg Changes in food consumption patternsWet fish and damp squids The UK fishing industryThe rural revolution How technology has changed farming
The economyOlympic growth and imperial decline The UK economyFrom Empire to EU UK tradeSmall change Britain and the gold standardWhere the money goes Public spendingSome total The national debt
MonarchySovereign says... The King’s and Queen’s speeches since 1908Hatches, matches and dispatches The succession to the CrownMonarch airways Royal visits since 1951
Technology & communicationPower up Energy useVideo killed the cinema’s star Cinema attendanceThe other Diamond Jubilee The UK singles chart and music salesLetters of thanks, letters from banks The postal service
TransportAre we nearly there yet? Journey times by car and railPlight train The rail network and passenger journeysLookout in the blackout Road traffic accidentsFour wheels good, two legs bad Transport and travel in the UKGridlock in Great Britain Roads and car ownership
Parliament & electionsInfluence and indifference Electoral participation and the right to votePartied out Political party membershipRed story, yellow story Elections and votingRepresentatives of society Background and characteristics of MPsAncestral make–up Composition of the House of Lords
Crime & defenceReforming prisons, reforming prisoners The prison populationCrimes of the century Recorded crimeThe Fallen Military strength and deaths in combat

Foreword Menzies Campbell
If nothIng else, Olympic Britain proves that I am a medal prospect for the London Games – unfortunately not this one! The 21.3 seconds I ran over 200m in the 1964 Olympics in Tokyo would have claimed gold by a clear second in the fourth modern Olympics, held in London in 1908. Sadly, in 2012, anything over 20 seconds is unlikely to claim a medal.
Olympic Britain is not just about the enormous leap in human physical achievement over the past century. It tells the story of the profound economic and social change this country has witnessed since those first Games in London in 1908. It does so through the medium of statistics which, among other things, tell us that of the 1.1 million people born in that year, around 550, or one in every 2000, remain alive today. They have lived to a surreal old age that has encompassed both the development of controlled flight and the advent of space tourism; the discovery of antibiotics and the invention of an artificial human heart. The demise of the Ottoman Empire (not to mention the British), two World Wars and the
Great Depression are all within their living memory.
But despite their longevity, our ‘children of 1908’ were born into a country where, by today’s standards, mortality was cruelly high. One in 40 died within their first week of life and one in eight within their first year. Growing up in a world without antibiotics and most forms of vaccination, they were vulnerable to TB, polio and diphtheria.
It was also a country of vast inequality. Those born into the top 1% of households would belong to a group that held 70% of the country’s wealth; those in the bottom 2% would have been classed as paupers, eligible for help under the Poor Laws, which could mean anything from welfare to the workhouse, depending on where they lived.
Around three-quarters would have left school at 14, in 1922, having been educated in schools where the average pupil-teacher ratio was 33 to 1, and only a quarter of teachers were trained. Among women, who typically worked until

marriage and not after, the most common jobs were in the domestic services and textiles sectors; among men, it was metal manufacturing, transport and agriculture. Fewer than 10,000 – less than 1% of our 1908 cohort – would have gone to one of the country’s 20 universities, of whom just 3,000 would have been women.
Fast forward to 1948, and the second London ‘Austerity’ Games. They took place against the backdrop of food rationing, the recent loss of India, the ‘ jewel in the crown’ of Britain’s empire, a debt burden three times higher than it is today, and a housing shortage so severe that 63% of people identified it as the country’s most pressing problem (today, the economy is cited as such by just 38%). Looking back to 1908, and the days of Empire, the country must have seemed irreparably dented, physically and psycho-logically, to our children of 1908.
But the prospects for their children were vastly improved. Infant mortality had halved by the 1930s, and many would have benefited from the creation of the grammar school system in 1944. Our 1908 children, meanwhile, could look forward to growing old supported by a ‘cradle to grave’ welfare state. They lived in a country where, in contrast to their youth, everyone now had the vote; where people could expect to live 15 years longer; and where there were, on average, 30 cinema trips per year for every man woman and child. Growing disposable income was giving rise to richer
conceptions of what constituted a decent standard of living: by 1951, Seebohm Rowntree had updated his 1901 poverty line to include trade union membership, apples and a radio as basic needs.
Today, despite the UK’s obesity epidemic and the economic crisis, we are much healthier and wealthier still than in 1948 (the statistics on wisdom are regrettably unreliable!). We take more foreign holidays than those in 1948 took domestic breaks. Within Britain, we travel more in one year than those in 1948 did in four years, thanks largely to the growth in car ownership. Divorces and births outside marriage have gone from being a rare stigma to coming very close to being the norm. Meanwhile, the ageing population and rising debt burden mean the role and responsibili-ties of the state are again up for debate, while the drawdown of troops from Iraq and Afghanistan opens a new chapter on Britain’s role in the world.
As well as the trends I have described, Olympic Britain tells the story of when cremation became the ‘way to go’; explains the curious rise in chicken consumption, matched by the demise of the egg; and reveals whether we are more superstitious now than in 1948. It is a record of our past for a year that may come to be seen as another turning point in our history when the Olympics next come to London.

Olym
pics

5 Olympic Britain
Racing towards our limitsMen’s Olympic record progression on the track
If today’s athletes had competed in the 1908 London Games, they would have appeared superhuman.
the wInner of the men’s 5,000m in Beijing 2008 ran at a pace that would have won the 1,500m in 1908, while the winner of the women’s marathon would have won the 1908 men’s race by half an hour.
What explains this enormous leap in human physical achievement? In short, the development and availability of training facilities, technological and medical advances, and the application of sport science have enabled an increasingly professionalised body of athletes to reach their potential. Meanwhile, the growth in participation among Asian and African countries, and the development of similar organisations, competition calendars and regulations among nations, has increased competitiveness.
Political factors have had an effect on record development over the years. Few men’s records were set at the Olympics immediately following the World Wars (1920 and 1948), as casualties limited the number of available male contenders and training regimes were disrupted. Famous boycotts by the US and USSR in 1980
and 1984 respectively hindered record progression at these Games.
Location has played a role too. In the 1968 Olympics at Mexico City, the high altitude produced a slew of new short-distance records and a long-jump of 8.90m that remains the longest-standing Olympic record, but inhibited performance over longer distances. Before World War II, 80% of world records were set by athletes running in their native country; now that world travel is less arduous, athletes can compete at their best wherever they are in the world: today, fewer than a quarter of records are set ‘at home’.
‘Nothing is impossible’, runs the cliché. But there are clearly limits on human capabilities, and a host of academic studies insist that performance gains have stagnated since 1988. Nonetheless, with four world and six Olympic records broken on the track alone at Beijing in 2008, expectations will remain high that human speed and endurance can be pushed to still dizzier heights at London 2012.

Ever fasterThe chart shows the average speed run, in mph, to achieve Olympic men’s records at each distance since 1908. Kinks in the line indicate new records at that Olympics. The records themselves in 1908 and as they stand currently are also shown.
23
21
19
17
15
13
9
7
11
190819121916192019241928193219361940194
419481952195619601965196819721976198019841988199219962000200420082012
100m 10.8s
19.3s (200m)
200m 22.6s
9.69s (100m)
400m 50.0s
43.8s
800m 1m 53s
1m 44s
1,500m 4m 3s
3m 32s
5,000m 14m 36s*
12m 57s
10,000m 31m 20s*
27m 4s
Marathon 2hr 55m
2hr 7m
Olympic records in 1908
current olympic records
mph
1960 Running barefoot, Ethiopia’s Abebe Bikila beats the Olympic marathon record by almost10 minutesand sets a new world record
2008 Usain Bolt’s times in the 100m and 200m were world records in Beijing, but he has since run quicker in both. At 23.3mph, his 100m record is now the faster in terms of average speed.
1936 Jesse Owens sets new records in the 100m and 200m that will stand until the 1960s
«O
lympics
PopulationH
ousing &
home life
Incomes &
poverty
Leisure &
lifestyles
London
Education
Em
ployment
Food &
agricultureTh
e econom
yM
onarchyTechnology &
comm
sTransport
Parliament
& elections
Crim
e &
defence
7 Olympic Britain
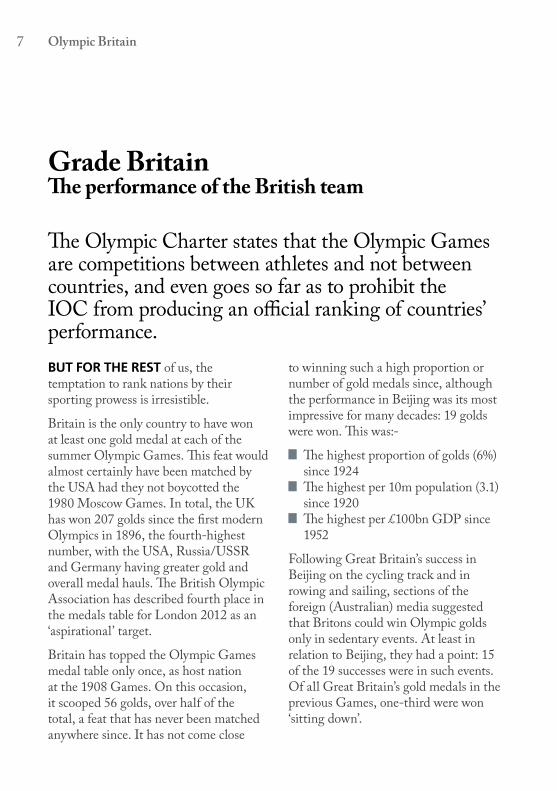
Grade BritainThe performance of the British team
The Olympic Charter states that the Olympic Games are competitions between athletes and not between countries, and even goes so far as to prohibit the IOC from producing an official ranking of countries’ performance.But for the rest of us, the temptation to rank nations by their sporting prowess is irresistible.
Britain is the only country to have won at least one gold medal at each of the summer Olympic Games. This feat would almost certainly have been matched by the USA had they not boycotted the 1980 Moscow Games. In total, the UK has won 207 golds since the first modern Olympics in 1896, the fourth-highest number, with the USA, Russia/USSR and Germany having greater gold and overall medal hauls. The British Olympic Association has described fourth place in the medals table for London 2012 as an ‘aspirational’ target.
Britain has topped the Olympic Games medal table only once, as host nation at the 1908 Games. On this occasion, it scooped 56 golds, over half of the total, a feat that has never been matched anywhere since. It has not come close
to winning such a high proportion or number of gold medals since, although the performance in Beijing was its most impressive for many decades: 19 golds were won. This was:-
The highest proportion of golds (6%) since 1924
The highest per 10m population (3.1) since 1920
The highest per £100bn GDP since 1952
Following Great Britain’s success in Beijing on the cycling track and in rowing and sailing, sections of the foreign (Australian) media suggested that Britons could win Olympic golds only in sedentary events. At least in relation to Beijing, they had a point: 15 of the 19 successes were in such events. Of all Great Britain’s gold medals in the previous Games, one-third were won ‘sitting down’.

Gold diggersThe chart shows gold medals won by the UK per 10m population at each summer Olympics since 1900
«
Beijing 2008
Athens 2004
Sydney 2000
Atlanta 1996
Barcelona 1992
Seoul 1988
Los Angeles 1984
Moscow 1980
Montreal 1976
Munich 1972
Mexico City 1968
Tokyo 1964
Rome 1960
Melbourne 1956
Helsinki 1952
London 1948
Berlin 1936
Los Angeles 1932
Amsterdam 1928
Paris 1924
Antwerp 1920
Stockholm 1912
London 1908
St. Louis 1904
Paris 1900
0 2 4 6 8 10 12 14
Olym
picsPopulation
Housing &
hom
e lifeIncom
es &
povertyL
eisure &
lifestylesL
ondonE
ducationE
mploym
entFood &
agriculture
The
economy
Monarchy
Technology &
comm
sTransport
Parliament
& elections
Crim
e &
defence
9 Olympic Britain
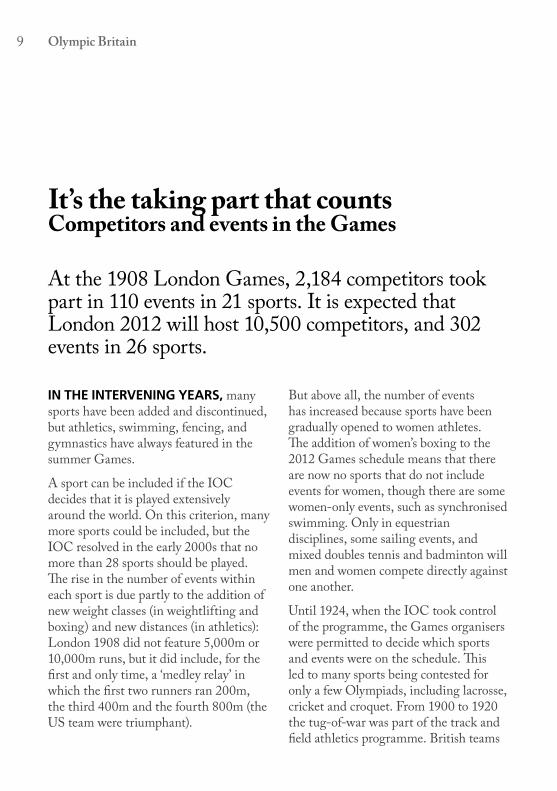
It’s the taking part that countsCompetitors and events in the Games
At the 1908 London Games, 2,184 competitors took part in 110 events in 21 sports. It is expected that London 2012 will host 10,500 competitors, and 302 events in 26 sports.
In the IntervenIng years, many sports have been added and discontinued, but athletics, swimming, fencing, and gymnastics have always featured in the summer Games.
A sport can be included if the IOC decides that it is played extensively around the world. On this criterion, many more sports could be included, but the IOC resolved in the early 2000s that no more than 28 sports should be played. The rise in the number of events within each sport is due partly to the addition of new weight classes (in weightlifting and boxing) and new distances (in athletics): London 1908 did not feature 5,000m or 10,000m runs, but it did include, for the first and only time, a ‘medley relay’ in which the first two runners ran 200m, the third 400m and the fourth 800m (the US team were triumphant).
But above all, the number of events has increased because sports have been gradually opened to women athletes. The addition of women’s boxing to the 2012 Games schedule means that there are now no sports that do not include events for women, though there are some women-only events, such as synchronised swimming. Only in equestrian disciplines, some sailing events, and mixed doubles tennis and badminton will men and women compete directly against one another.
Until 1924, when the IOC took control of the programme, the Games organisers were permitted to decide which sports and events were on the schedule. This led to many sports being contested for only a few Olympiads, including lacrosse, cricket and croquet. From 1900 to 1920 the tug-of-war was part of the track and field athletics programme. British teams
0
1,500
3,000
4,500
6,000
7,500
9,000
10,500
12,000

were successful in this sport, and in 1908 Britain took all 3 places on the podium, with the City of London police team taking the gold.
The British had less success as hosts and players of rugby union in 1908. After Scotland and Ireland refused the invitation to participate, and the French
withdrew, only two teams were left: Britain, represented not by a national team but by Cornwall, and Australasia. The Olympic report was stoical about the result of a game played in a thick London fog at a deserted White City Stadium: “as was natural, the Cornishmen were defeated... by 32 points to 3”.
Olympic growthThe chart shows the total number of athletes and events at each Olympic Games. Women athletes are represented in grey.
«O
lympics
PopulationH
ousing &
home life
Incomes &
poverty
Leisure &
lifestyles
London
Education
Em
ployment
Food &
agricultureTh
e econom
yM
onarchyTechnology &
comm
sTransport
Parliament
& elections
Crim
e &
defence
0 0
1,500 40
3,000 80
4,500 120
6,000 160
7,500 200
9,000 240
10,500 280
12,000 320
number of athletes number of events
1908
1912
1920
1924
1928
1932
1936
1948
1952
1956
1960
1964
1968
1972
1976
1980
1984
1988
1992
1996
2000
2004
2008
Los Angeles 1932: held in the aftermath of the Great Depression, many countries and competitors could not afford the transatlantic trip.
Montreal 1976: boycott by 22 African nations in protest at New Zealand’s rugby tour of South Africa (which was banned from the Games between 1964 and 1992 over apartheid).
Moscow 1980: United States boycott over Soviet invasion of Afghanistan.
Los Angeles 1984: Soviet Union and fourteen allies
boycott in response.
Melbourne1956: boycotts by Egypt, Iraq and Lebanon over
Suez Crisis; by Netherlands, Spain and Switzerland over the Soviet Union’s invasion of Hungary; and by China
over Taiwan’s independent participation.
London 1948: Germany and Japan not invited.

11 Olympic Britain
World classAfrica at the Olympics
The popular perception that the Olympic symbol of five interlocking rings represents the five inhabited continents is a modern reinterpretation of its designer’s intentions.
Baron PIerre de CouBertIn’s true vision was rather less cosmopolitan:
“The six colours (including the flag’s white background) thus combined reproduce the colours of all the nations, with no exception. The blue and yellow
of Sweden, the blue and white of Greece, the tricolours of France, England and America, Germany, Belgium, Italy, Hungary, the yellow and red of Spain next to the novelties of Brazil or Australia, with old Japan and new China. Here is truly an international symbol.”
1908 1948
2008

De Coubertin’s narrow conception of the term ‘international’ was in part a reflection of the state of the world when he first presented the designs to the International Olympic Committee’s 20th anniversary congress in 1914. Europe controlled almost all of Africa, and much of South Asia and Indochina. Though colonies were permitted separate national representation, in practice there was reluctance to allow participation, or to cultivate organised sport, for fear that victory by colonial subjects and assertions of national identity would undermine European status.
The first two indigenous Africans to compete at the Olympics came to the St. Louis Games in 1904 as curiosities to feature in the Boer War Show and ‘athletic events for savages’. They managed to enter the marathon at the Olympic Games proper, finishing ninth and twelfth out of thirty-six, despite one of them being chased off course by a dog along a deserted country road. At that time, no organised marathon had ever been staged in South Africa, and it is unlikely they had much inkling of the distance ahead when they started the race. South Africa continued to send athletes to subsequent Games,
but it was not until 1952 that any other Sub-Saharan African country (Ghana) participated.
From 1961, aid and technical assistance from the IOC was deployed to ‘incorporate’ newly-independent states into the Olympic movement. Some saw this as imperialism in another guise: this is partly what led to the staging by Indonesia of the Games of the Newly Emerging Forces (GANEFO) in 1962. Supported by Soviet aid and attended by 51 countries, including all the major communist and socialist states, the Games were intended as a rival to the Olympics, and the link between politics and sport was made explicit in their constitution.
By the late 1960s, the GANEFO organisation had collapsed, and new countries were joining the IOC at a rapid rate, although even today, Africa continues to be under-represented at the Olympics relative to its population. In the 2008 Olympics, countries like Kenya, Ethiopia and Zimbabwe far outperformed Western countries in terms of medals per athlete sent, and today it is hard to imagine a ‘world’ track event worthy of the name that does not involve African athletes.
Greater Britain World maps with countries sized according to number of athletes participating in the Olympics
Olym
picsPopulation
Housing &
hom
e lifeIncom
es &
povertyL
eisure &
lifestylesL
ondonE
ducationE
mploym
entFood &
agriculture
The
economy
Monarchy
Technology &
comm
sTransport
Parliament
& elections
Crim
e &
defence
«

13 Olympic Britain
SourcesRacing towards our limitsLondon 1908 Olympic Report, available from www.la84foundation.orgLondon 1948 Olympic Report, available from www.la84foundation.orgOfficial website of the Olympic movement, www.olympic.org
Grade BritainIOC data supplied by BBC
It’s the taking part that countsD. Wallechinsky & J. Loucky, The Complete Book of the Olympics, 2012www.olympic.org.uk, Olympic Games, 2012
World classFloris van der Merwe, Africa’s first encounter with the Olympic Games in… 1904, Journal of Olympic History, Sep 1999Karl Lennartz, The story of the rings, Journal of Olympic History, Jan 2002Ewa Pauker, GANEFO I: sports and politics in Djarkarta, Asian Survey, Apr 1965London 1908 Olympic Report, available from www.la84foundation.orgLondon 1948 Olympic Report, available from www.la84foundation.orgBeijing 2008 Olympic Report, available from www.la84foundation.orgMaps produced using Mapresso applet

Population

15 Olympic Britain
Survival of the littlestInfant mortality
“The better protection of infant life is one of the most intricate and difficult of modern problems.”
SO BEGAN DR HUGH JONES, Lecturer in Bacteriology at the Royal Southern Hospital in Liverpool, in his 1893 essay to the Royal Statistical Society on ‘The Perils and Protection of Infant Life’.
In his essay, Dr Jones records an infant mortality rate in England for the period 1881-90 of 142 deaths per thousand births among children under the age of one.
In 2010, the infant mortality rate in England and Wales was four deaths per thousand births in this age group.
The decline in infant mortality since Dr Jones published his essay has therefore been considerable, but the exact reasons for the decline, and their relative importance, are still debated.
1908 1918 1928 1948 1958 1968 1978 1988 1998 2008
0
20
40
60
100
140
120
80
Less than one week
One week to one month
One month to one year
deaths per thousand live births
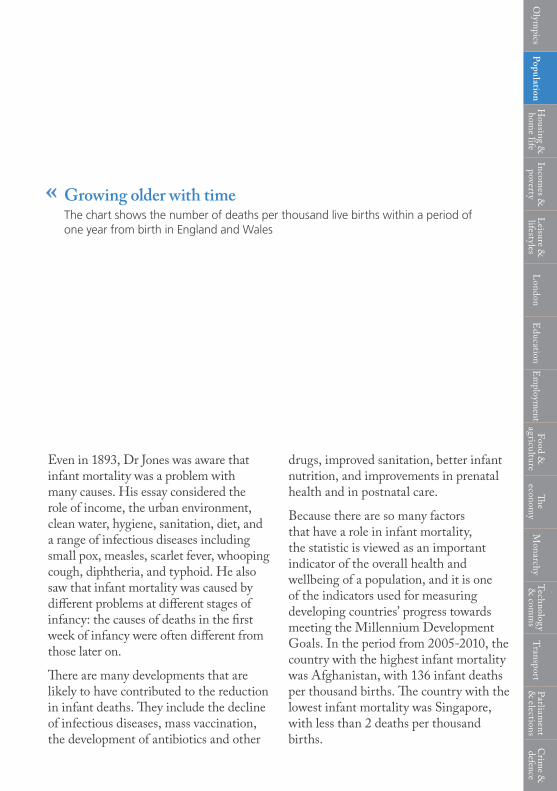
Growing older with timeThe chart shows the number of deaths per thousand live births within a period of one year from birth in England and Wales
«
Even in 1893, Dr Jones was aware that infant mortality was a problem with many causes. His essay considered the role of income, the urban environment, clean water, hygiene, sanitation, diet, and a range of infectious diseases including small pox, measles, scarlet fever, whooping cough, diphtheria, and typhoid. He also saw that infant mortality was caused by different problems at different stages of infancy: the causes of deaths in the first week of infancy were often different from those later on.
There are many developments that are likely to have contributed to the reduction in infant deaths. They include the decline of infectious diseases, mass vaccination, the development of antibiotics and other
drugs, improved sanitation, better infant nutrition, and improvements in prenatal health and in postnatal care.
Because there are so many factors that have a role in infant mortality, the statistic is viewed as an important indicator of the overall health and wellbeing of a population, and it is one of the indicators used for measuring developing countries’ progress towards meeting the Millennium Development Goals. In the period from 2005-2010, the country with the highest infant mortality was Afghanistan, with 136 infant deaths per thousand births. The country with the lowest infant mortality was Singapore, with less than 2 deaths per thousand births.
Olym
picsPopulation
Housing &
hom
e lifeIncom
es &
povertyL
eisure &
lifestylesL
ondonE
ducationE
mploym
entFood &
agriculture
The
economy
Monarchy
Technology &
comm
sTransport
Parliament
& elections
Crim
e &
defence

17 Olympic Britain
Have kids, settle downMarital and maternal age since 1938
The average age at which women have children has been increasing since the middle of the 1970s.
There is a Tendency to think of this as a modern phenomenon associated with the rise of family planning, greater economic independence for women and the development of medical techniques that can increase fertility in older people. But the average age of women at first birth today (29.6) is not very different to what it was in 1938 (29.0), and fertility among women in their forties was higher at the start of WWII and during the 1940s than it was in 2010.
The average age of women at first birth was lower at the end of the 1960s than at any other point since 1938. Before the 1960s, the average age of women both at their first birth and across all births had been higher, despite this being a period of higher fertility, lower life expectancy and less economic equality between the sexes.
Fertility among women aged 40-44 peaked in 1947 at 19 births per thousand women in England and Wales. In 2010 the number was 13. In between, fertility among older women declined, reaching a low of four births per thousand women aged 40-44 in 1977. These trends can partly be explained by the fact that families were larger than they are today and women spent a greater part of their lives bearing children. In the 1940s around 75% of births to women over 40 were to mothers who already had at least two children. In 2010, by contrast, 61% of births to women in their forties were first or second children.
As the age structure of women’s fertility has changed, so has the age at which women get married. From the 1940s to the 1970s there was a strong relationship between the average age of women at first
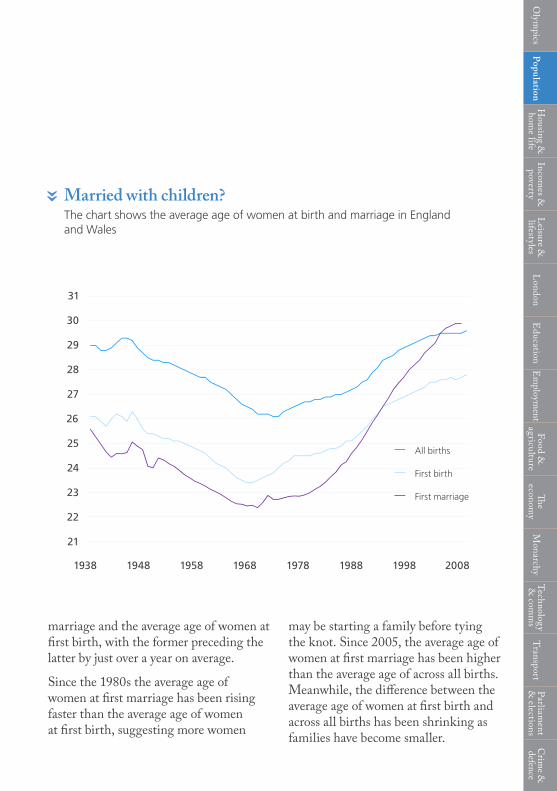
Married with children?The chart shows the average age of women at birth and marriage in England and Wales
«
marriage and the average age of women at first birth, with the former preceding the latter by just over a year on average.
Since the 1980s the average age of women at first marriage has been rising faster than the average age of women at first birth, suggesting more women
may be starting a family before tying the knot. Since 2005, the average age of women at first marriage has been higher than the average age of across all births. Meanwhile, the difference between the average age of women at first birth and across all births has been shrinking as families have become smaller.
All births
First birth
First marriage
1938 1948 1958 1968 1978 1988 1998 2008
21
22
24
23
25
26
28
30
31
29
27
All births
First birth
First marriage
Olym
picsPopulation
Housing &
hom
e lifeIncom
es &
povertyL
eisure &
lifestylesL
ondonE
ducationE
mploym
entFood &
agriculture
The
economy
Monarchy
Technology &
comm
sTransport
Parliament
& elections
Crim
e &
defence

19 Olympic Britain
Grey BritainThe ageing of the UK population
The UK’s population is both larger and older than it was a hundred years ago, and most of the difference in size is due to an increase in the older population.
Between 1901 and 2010, the population under 40 increased only modestly, from 28.5m to 31.5m. But over the same period, the number of people aged 40 and older has more than trebled, from 9.7m to 30.8m.
Among the over 65s, the increase has been still more dramatic. Around 5% of the population was aged 65 and older in 1901, compared with 17% in 2010. The proportion of the population in this age group is projected to rise to 23% by 2035. There is considerable regional variation in the distribution of the older population. In West Somerset, around 30% of the population is aged 65 and older. In Tower Hamlets it’s just 6%.
The increasing number and proportion of older people in the population reflects increasing life expectancy. This has been
rising since 1800, although the largest gains were made during the 20th century. In 1901 life expectancy at birth was around 45 for men and 49 for women. By 1951 it had increased to 66 for men and 70 for women, implying an extra year of life expectancy, on average, for every 30 months that went by.
In the first half of the 20th century, the increase in life expectancy at birth was mainly driven by improvements in infant and child mortality.
The rate at which life expectancy increased slowed down in the second half of the 20th century, when the medical improvements driving the increase shifted from improvements in infant health to improvements in adult health. By 2010 life expectancy at birth was 78 for men and 82 for women.
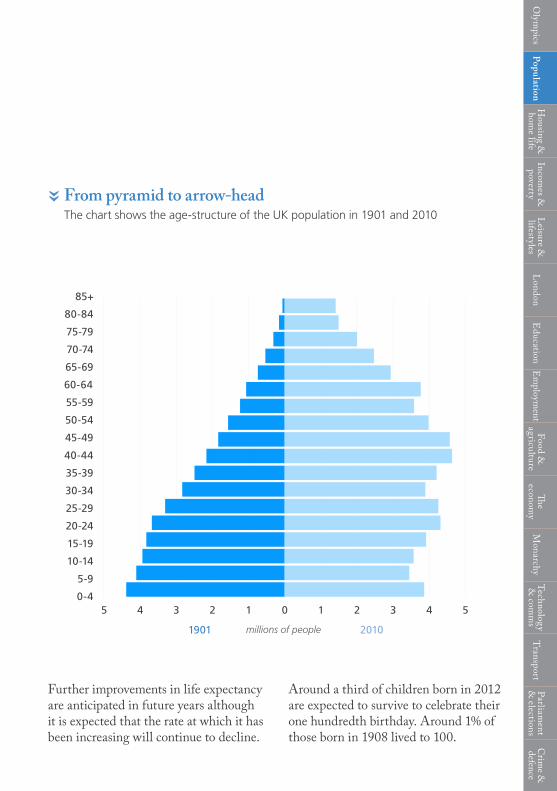
From pyramid to arrow-headThe chart shows the age-structure of the UK population in 1901 and 2010
«
Further improvements in life expectancy are anticipated in future years although it is expected that the rate at which it has been increasing will continue to decline.
Around a third of children born in 2012 are expected to survive to celebrate their one hundredth birthday. Around 1% of those born in 1908 lived to 100.
Olym
picsPopulation
Housing &
hom
e lifeIncom
es &
povertyL
eisure &
lifestylesL
ondonE
ducationE
mploym
entFood &
agriculture
The
economy
Monarchy
Technology &
comm
sTransport
Parliament
& elections
Crim
e &
defence
40-44
45-49
50-54
55-59
60-64
65-69
70-74
75-79
80-84
85+
0-4
5-9
10-14
15-19
20-24
25-29
30-34
35-39
millions of people 20101901
35-39
30-34
25-29
20-24
15-19
10-14
5-9
0-4
40-44
50-54
45-49
55-59
60-64
70-74
80-84
85+
75-79
65-69
5 4 3 2 31 40 51 2
21 Olympic Britain
A necessary endChanges in causes of death
The 20th century saw significant reforms aimed at improving living conditions for society in general and the poor in particular.
there were also ConsIderaBle improvements in living standards and significant advances in medicine and our understanding of public health and diseases. These factors led to large increases in life expectancy and are also linked to changes in the most common causes of death.
In the 1900s classifications of death were poorly organised, resulting in over half of all deaths being assigned to ‘other causes’. However, for certain conditions recording practices are sufficiently similar to make valid comparisons, and these are shown in the chart.
In the century leading up to 1908, public health had been transformed. Smallpox and cholera were on the wane thanks to vaccination and better sanitation, and the 1875 Public Health Act had provided Britain with the most extensive public health system in the world. But rapid
urbanisation meant sanitary conditions in inner cities often remained dire; most vaccines had not yet been developed; and penicillin, the first antibiotic, would not become widely available until after WWII.
As a result, the majority of deaths occurring in 1908 would today be characterised as preventable. In particular, infectious and parasitic diseases accounted for nearly a fifth of all deaths. With no acquired immunity, the young were particularly vulnerable to these, and a third of all deaths occurred in the under-fives; today, that figure is less than 1%. Measles killed 50,000 children that year, tuberculosis and whooping cough 40,000 each, and diphtheria 17,000. Diarrhoea and dysentery claimed the lives of a further 100,000 children. Today, it is unusual for these to kill anyone except those with serious underlying conditions.
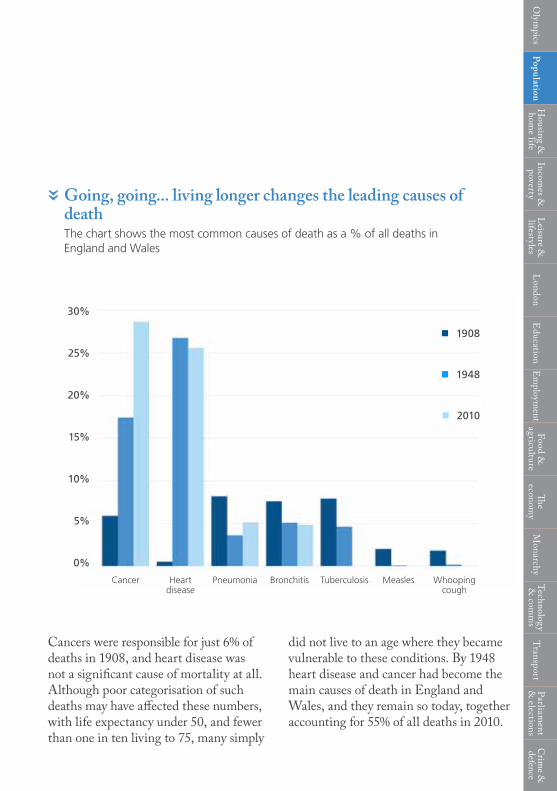
Going, going... living longer changes the leading causes of deathThe chart shows the most common causes of death as a % of all deaths in England and Wales
«
Cancers were responsible for just 6% of deaths in 1908, and heart disease was not a significant cause of mortality at all. Although poor categorisation of such deaths may have affected these numbers, with life expectancy under 50, and fewer than one in ten living to 75, many simply
did not live to an age where they became vulnerable to these conditions. By 1948 heart disease and cancer had become the main causes of death in England and Wales, and they remain so today, together accounting for 55% of all deaths in 2010.
0%
5%
10%
15%
25%
30%
20%
Cancer Heart disease
1908
1948
2010
Pneumonia Bronchitis Tuberculosis Measles Whooping cough
Olym
picsPopulation
Housing &
hom
e lifeIncom
es &
povertyL
eisure &
lifestylesL
ondonE
ducationE
mploym
entFood &
agriculture
The
economy
Monarchy
Technology &
comm
sTransport
Parliament
& elections
Crim
e &
defence
23 Olympic Britain
The start of a new way to endCremation
Cremation is now the most widely practised funeral ceremony in the UK, but it didn’t become socially acceptable until the 20th century. Before 1884, it wasn’t even considered legal.
although CrematIon has Been practised for centuries in other parts of the world, the Christian belief in physical resurrection made cremation a taboo in many European societies.
The first prominent advocate of cremation in Britain was Sir Henry Thompson, Surgeon to Queen Victoria. He had seen a model cremation apparatus at the Vienna Exposition of 1873 and believed it offered a way to help reduce “the propagation of disease among a population daily growing larger in relation to the area it occupied”. In 1874 he founded the Cremation Society of England, which argued for cremation to be formally accepted in law. The Society also built Britain’s first crematorium in Woking in Surrey in 1878.
The crematorium was first used in 1879 to burn the body of a horse, but the incident so upset the local community they appealed to the Home Secretary to intervene. Concerned that cremation might be used to destroy evidence of violence or poisoning following a murder, the then Home Secretary, Sir Richard Cross, refused to allow the practice until it was explicitly recognised by Parliament.
The turning point for cremation came in 1884 when 83-year-old Welshman William Price was arrested for attempting to cremate the body of his infant son Iesu Grist (Jesus Christ in English). Price was a physician, a nudist, a vegetarian, and an Archdruid. He disapproved of burial and attempted to cremate the body of his son on a hillside
near the village of Llantrisant in South Wales. The villagers intervened and he was put on trial at the South Glamorgan Assizes in Cardiff. Price argued that although cremation wasn’t permitted in law, it wasn’t prohibited either. The judge, Mr Justice Stephen, agreed.
Following the judgment, the first official cremation took place at Woking
Crematorium on the 26th of March 1885. Mrs Jeannette Pickersgill was the first of three cremations that year.
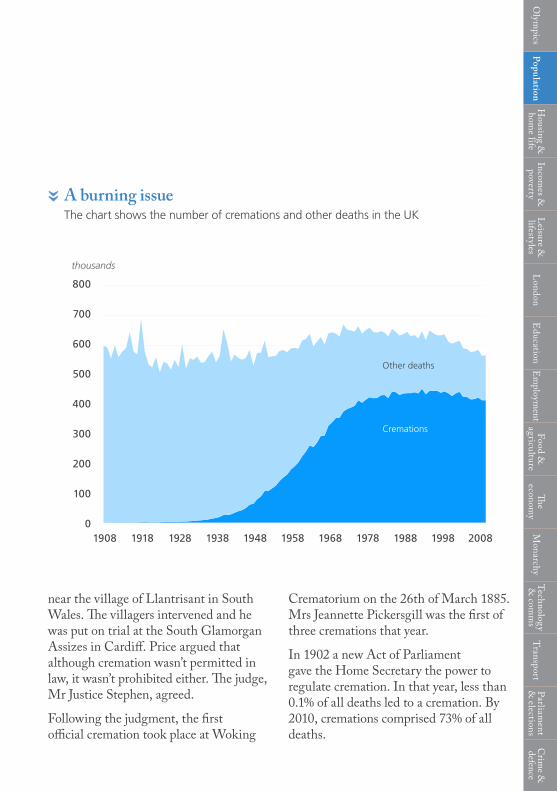
In 1902 a new Act of Parliament gave the Home Secretary the power to regulate cremation. In that year, less than 0.1% of all deaths led to a cremation. By 2010, cremations comprised 73% of all deaths.
A burning issueThe chart shows the number of cremations and other deaths in the UK
«
1908 1918 1928 1938 1948 1958 1968 1978 1988 1998 20080
100
200
300
400
500
800
700
600
Other deaths
Cremations
thousands
Olym
picsPopulation
Housing &
hom
e lifeIncom
es &
povertyL
eisure &
lifestylesL
ondonE
ducationE
mploym
entFood &
agriculture
The
economy
Monarchy
Technology &
comm
sTransport
Parliament
& elections
Crim
e &
defence

25 Olympic Britain
Natural flourishThe causes of population change
Population change is driven by four factors: births, deaths, immigration and emigration.
the fIrst two determIne the natural population change each year, namely the number of births minus the number of deaths. The second two determine net migration, which is the number of people moving into a population minus the number moving out to live elsewhere. The overall change in the size of a population is then the natural change plus net migration.
The chart shows population change in the UK in each year from 1922 to 2010. Natural change and net migration in each year are represented by lines, while the resulting overall population change is represented by bars. During this period, the UK population grew from 44m to 62m, with annual average growth of around 200,000 a year.
For much of the 20th century, population growth was driven largely by natural change. Where net migration had an effect it was often to reduce the growth caused by natural change through net emigration.
There were two periods when growth caused by natural change fell considerably: the first during the 1930s and the second during the 1970s. In the 1930s, this fall was offset to some extent by a period of net immigration. In the 1970s net migration remained negative, so population growth slowed to a halt and even briefly reversed.
Since the middle of the 1990s net migration has shown a consistent upward trend, and net immigration reached record levels in 2010. Natural change has
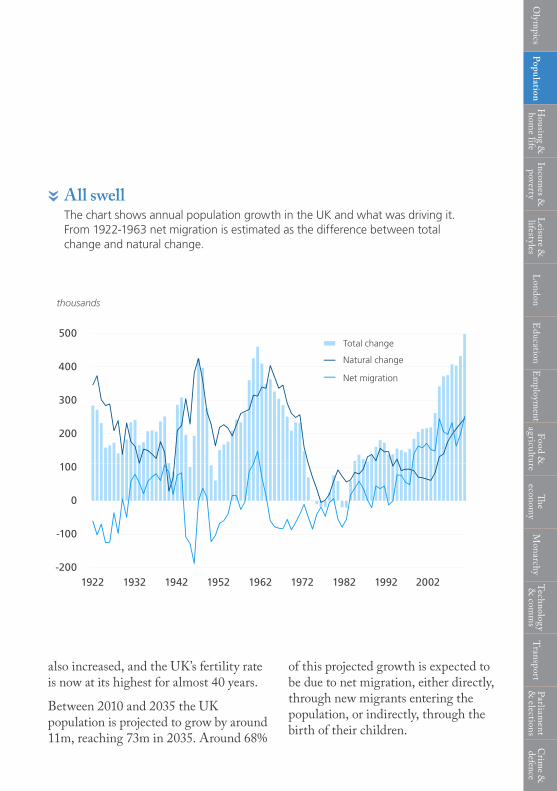
All swellThe chart shows annual population growth in the UK and what was driving it. From 1922-1963 net migration is estimated as the difference between total change and natural change.
«
also increased, and the UK’s fertility rate is now at its highest for almost 40 years.
Between 2010 and 2035 the UK population is projected to grow by around 11m, reaching 73m in 2035. Around 68%
of this projected growth is expected to be due to net migration, either directly, through new migrants entering the population, or indirectly, through the birth of their children.
Total change
Natural change
Net migration
1922 1932 1942 1952 1962 1972 1982 1992 2002-200
-100
0
100
300
500
400
200
thousands
Total change
Natural change
Net migration
Olym
picsPopulation
Housing &
hom
e lifeIncom
es &
povertyL
eisure &
lifestylesL
ondonE
ducationE
mploym
entFood &
agriculture
The
economy
Monarchy
Technology &
comm
sTransport
Parliament
& elections
Crim
e &
defence

27 Olympic Britain
SourcesSurvival of the littlestONS, Child mortality statistics: Childhood, infant and perinatal, 2010H.R. Jones, The Perils and Protection of Infant Life, Journal of the Royal Statistical Society, Vol. 57 No. 1, 1894
Have kids, settle downONS, Characteristics of mother 1, England and Wales, 2010ONS, Marriages in England and Wales: Age at marriage and previous marital status, 2010ONS, Focus on People and Migration: Fertility and Mortality, 2005
Grey BritainONS, Annual Abstract of Statistics, 1954ONS, Population by quinary age group, 1971-2010
A necessary endONS, Annual Abstract of Statistics, 1948ONS, Deaths registered in England and Wales in 2010, by causeI. Gregory, BMJ, 2009; 339:b3454
The start of a new way to endThe Cremation Society of Great Britain, Progress of Cremation in the United Kingdom, 1885-2010The Cremation Society of Great Britain, History of Modern Cremation in Great Britain from 1874
Natural flourishB.R. Mitchell, British Historical Statistics, 1988ONS, Annual Abstract of Statistics, 1938-89ONS, Population Estimates for UK, England and Wales, Scotland and Northern Ireland, 1971 to 2010ONS, Vital Statistics: Population and Health Reference Tables, Spring 2012 updateONS, National Population Projections, 2010-based Statistical Bulletin

Housing &
home life

29 Olympic Britain
Build it up, sell it offThe rise and fall of social housing
Provision of social housing started in the late 19th century when the 1890 Housing of the Working Classes Act allowed London’s local councils to build houses as well as clear away slums.
In 1896 London County Council developed the first council housing in Bethnal Green.
The 1900 Housing of the Working Classes Act extended the 1890 Act to places outside London and by the outbreak of WWI about 24,000 units had been built. All local authorities have been required by law to provide council housing since the 1919 Housing Act.
The proportion of social housing stock increased from around 1% of housing in 1911 to 10% by 1938. Then, following WWII, around a million homes were built under the post-war Labour Government, over 85% of which were social housing. Much of this house building was to replace homes bombed during the war.
The house building boom continued when the Conservatives returned to power in 1951, but the emphasis shifted at the end of the decade towards slum clearance, as millions of people were moved from rundown inner-city terraces and re-housed in purpose-built new towns or high rise flats, being introduced to the joys of indoor toilets, front and rear gardens, and landscaped estates.
Throughout the 1970s social housing accounted for around 30% of the dwelling stock in England. Since the introduction of ‘right-to-buy’ schemes in 1981, which entitled council tenants to purchase their homes at a discount price, social housing stock has diminished. The scheme, which proved a cost-effective way of renovating dilapidated estates, was partly responsible

for the increase in owner-occupiership from 55% in 1981 to 67% a decade later. But together with limitations on local council house building, it also caused a dramatic reduction in local authority housing stock, from 5m in 1981 to 1.7m
today, a level last observed in 1961. Most new houses after 1981 were built by housing associations, and today there are more of these (2.3m) than traditional local authority council houses.
Crash pad: 5m council houses were built between 1946 and 1981, but only 250,000 have been built sinceThe chart shows the number of houses built in each year since 1946, by sector
«O
lympics
PopulationH
ousing &
home life
Incomes &
poverty
Leisure &
lifestyles
London
Education
Em
ployment
Food &
agricultureTh
e econom
yM
onarchyTechnology &
comm
sTransport
Parliament
& elections
Crim
e &
defence
Local Authority
Housing Association
Private Sector
1946 1956 1966 1976 1986 1996 20060
50
100
150
200
250
300
350
400
450
thousands
31 Olympic Britain
All you need is love (and a marriage certificate)Marriage since 1900
Almost 90% of men born in 1908 were married by the age of 40. The same was true of men born in 1948.
sInCe then, however, the proportion of people marrying has been decreasing across all ages. Among men born in 1960, 78% were married by 40; for those born in 1970, the figure is 63%. A similar pattern is evident for women.
This trend has been matched by a fall in the number of marriages, from 415,000 in 1970 to 241,000 in 2010. One reason for this is that men and women have been delaying the age at which they first get married. The average age at first marriage is now 31, compared with a 20th century low of 23 in 1970. But the trend towards delaying marriage does not fully account for the observed changes. Based on current trends, evident from the chart,
marriage will never be as prevalent (at any age) among those born in 1970 and 1980 as in previous generations.
Cohabitation offers an explanation for both the rise in the age of people at their first marriage, and the fall in the number of marriages. As recently as 1980, only a third of people had ever cohabited before their first marriage; today, the figure is 80%. This in itself is linked to broader changes in attitudes towards living arrangements and family life: in effect, the role of marriage as a necessary prerequisite to sex and having children has diminished greatly, leading couples to delay the decision to marry, or forsake it altogether.

Commitment issuesThe chart shows rates of marriage for men by age and birth cohort in England and Wales
«
Since April 2005 same-sex couples have been able to form civil partnerships, giving them the same rights and respon-sibilities as those under civil marriage. In 2010, there were 6,385 new civil partnerships in the UK, compared with 277,740 marriages. The limited evidence
to date suggests that civil partnerships have been more stable than marriages. Of the 16,800 entered into in 2005 and 2006, 1.6% had been dissolved; this compares with a divorce rate of 2.9% for marriages taking place during those same years.
Olym
picsPopulation
Housing &
hom
e lifeIncom
es &
povertyL
eisure &
lifestylesL
ondonE
ducationE
mploym
entFood &
agriculture
The
economy
Monarchy
Technology &
comm
sTransport
Parliament
& elections
Crim
e &
defence
Born in 1940
Born in 1920
Born in 1900 Born in 1960
Born in 1970
Born in 1980
age
rate per thousand
17 21 25 29 33 37 41 45 490
200
100
400
300
500
600
700
800
900
1000

33 Olympic Britain
Split pairsDivorces since 1900
“We are not here, Mr. Adam, to secure your happiness, but to preserve the institution of marriage and the purity of the home. And therefore one of you must commit adultery ... someone has to behave impurely in order to uphold the Christian idea of purity.”A.P. Herbert MP Holy Deadlock (1934)
Before 1914 dIvorCe was rare; it was considered a scandal, confined by expense to the rich, and by legal restrictions requiring proof of adultery or violence to the truly desperate. In the first decade of the 20th century, there was just one divorce for every 450 marriages.
As it did in other areas of social policy, WWI led to reforms of divorce law that put men and women on a more equal footing. The Matrimonial Causes Act 1923, introduced as a Private Member’s Bill, enabled either partner to petition for divorce on the basis of their spouse’s adultery (previously, only the man had been able to do this). A further Act in 1937 offered additional grounds for divorce: cruelty, desertion and incurable insanity. Though it was becoming more widespread, divorce remained uncommon enough to be a potential
source of shame throughout the first half of the 20th century. As late as 1955, the Tory cabinet minister Lord Salisbury threatened to resign if a bill were passed to allow Princess Margaret to marry Peter Townshend, the innocent party in a divorce case.
Both World Wars caused a spike in divorces, but it was not until the Divorce Reform Act 1969 that they reached the level we are familiar with today. This legislation marked an important shift not merely because it added further grounds for divorce, on the basis of two years’ separation with the other party’s consent, or five years’ without, but because it removed the concept of ‘matrimonial offences’ and hence the idea of divorce as a remedy for the innocent against the guilty.

Tying and untying the knotThe chart shows the number of divorces and marriages
«
These liberalisations of divorce law, combined with changing attitudes and expectations of marriage, and the greater economic independence of women, all contributed to a rise in the number of divorces from 50,000 per year in 1971 to 150,000 a decade later. More recently the
number of divorces has fallen steadily, although this may be more to do with the fact that fewer people are getting married in the first place, rather than a trend toward matrimonial bliss. Today, there are just two marriages for every divorce each year.
Olym
picsPopulation
Housing &
hom
e lifeIncom
es &
povertyL
eisure &
lifestylesL
ondonE
ducationE
mploym
entFood &
agriculture
The
economy
Monarchy
Technology &
comm
sTransport
Parliament
& elections
Crim
e &
defence
1900 1910 1920 1930 1940 1950 1960 1970 1980 1990 2000 20100
50
100
200
150
250
300
350
400
450
500
thousands
WWI 1914–1918
WWII 1939–1945
Marriages
Divorces
Matrimonial Causes Act 1937
Divorce Reform Act 1969
35 Olympic Britain
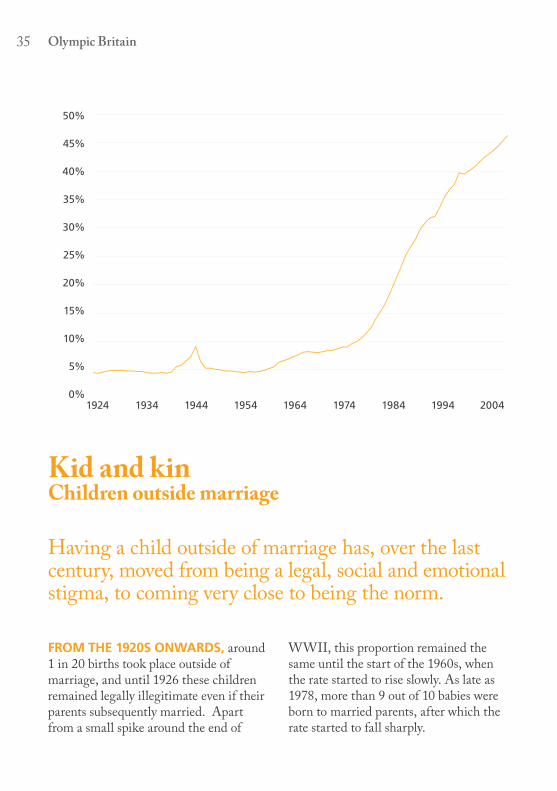
Kid and kinChildren outside marriage
Having a child outside of marriage has, over the last century, moved from being a legal, social and emotional stigma, to coming very close to being the norm.
from the 1920s onwards, around 1 in 20 births took place outside of marriage, and until 1926 these children remained legally illegitimate even if their parents subsequently married. Apart from a small spike around the end of
WWII, this proportion remained the same until the start of the 1960s, when the rate started to rise slowly. As late as 1978, more than 9 out of 10 babies were born to married parents, after which the rate started to fall sharply.
1924 1934 1944 1954 1964 1974 1984 1994 20040%
5%
10%
15%
20%
25%
30%
35%
45%
40%
50%

Going non-nuclearThe chart shows the percentage of births taking place outside marriage
«
Today, the latest available data show that 46.3% of children were born outside marriage, more than ten times the rate seen in the early parts of the 20th century. However, just because a birth takes place outside marriage doesn’t necessarily mean the child won’t grow up living with two parents. The increase in births outside marriage has been accompanied by a rise in cohabitation since 1976, so not all children born outside of marriage are born to single parents.
Today, the risk to children of growing up with one parent arises as much from
their parents divorcing as their not being married in the first place. Since 1957, when such data began to be published, the number of children whose parents have gone through a divorce each year rose from 30,000 to a peak of almost 250,000 in the mid-1990s, before declining along with the number of divorces overall. Since 1957, just over 9m children have gone through a parental divorce (although this total will include an element of double counting, as some children will have seen parents divorce more than once), while 7m have been born outside of marriage.
Olym
picsPopulation
Housing &
hom
e lifeIncom
es &
povertyL
eisure &
lifestylesL
ondonE
ducationE
mploym
entFood &
agriculture
The
economy
Monarchy
Technology &
comm
sTransport
Parliament
& elections
Crim
e &
defence
37 Olympic Britain
SourcesBuild it up, sell it offDCLG, Housing Live Table 244
All you need is love (and a marriage certificate)ONS Vital Statistics: Population and Health Reference Tables May 2012 updateONS Statistical Bulletin, Marriage in England and Wales 2010
Split pairsONS Vital Statistics: Population and Health Reference Tables, May 2012 updateONS Statistical Bulletin, Divorces in England and Wales 2010 OPCS Marriage and Divorce Statistics: Historical Series 1837 to 1983Cambridge Family Law Practice, A brief history of divorce, 2012
Kid and kinONS, Annual Abstract of Statistics, various years
Incomes &
poverty

39 Olympic Britain
Show me the moneyInequality in incomes and wealth
The top 1% received about 19% of all taxable income in 1918. By 1948 this had dropped to 11%, and the proportion kept falling until the mid-1970s, when the top 1% had about 6% of all income.
the ProPortIon of InCome going to the top 1% then increased through the 1980s and 1990s, reaching 15% in 2007.
Wealth is, in part, built up out of income, and those with higher incomes will have more income to spare to invest in creating more wealth. All other things being equal, trends in wealth inequality will therefore tend to follow similar trends to income inequality, but will become more pronounced over time.
Wealth inequality as measured by the share of wealth held by the top 1% was very large by the start of the 20th century, having increased as Britain became more industrialised. Around 1912, estimates based on tax records suggest that the top 1% wealthiest had about two-thirds of all non-pension wealth. Through much of the middle of the 20th
century, their proportion of total wealth declined. Falling income inequality, and the increasing ownership of housing by people outside the top 1%, is likely to have contributed to this. A more redis-tributive tax system may also have had an effect.
More recently, the proportion of wealth held by the top 1% has started to rise again. The growing role of financial assets in wealth generation (such as shares, which are disproportionately held by the rich), has played a role in this.
Today there are twice as many men as women among the very wealthiest group. About half of the very wealthiest are aged between 45 and 64, reflecting the way that people tend to build their wealth over their working life, and then spend it after they retire.

Wealth of everyone outside the wealthiest
1%
Wealth of the top 1%
1908 1918 1928 1938 1948 1958 1968 1978 1988 1998 2008
Olym
picsPopulation
Housing &
hom
e lifeIncom
es &
povertyL
eisure &
lifestylesL
ondonE
ducationE
mploym
entFood &
agriculture
The
economy
Monarchy
Technology &
comm
sTransport
Parliament
& elections
Crim
e &
defence
41 Olympic Britain
Workhouse to welfareChild poverty and help for the poor
Just before the first London Olympics, in 1906, 2% of people in England and Wales were receiving help via the Poor Laws – 2% of children, 1% of adults aged 16-60, and 15% of older people.
thIs helP Could take various forms, for example an allowance, medical help, or basic food and accommodation provided in an institution such as a workhouse. People receiving poor relief were called paupers.
The assistance provided under the Poor Laws varied from area to area. As the 1909 Royal Commission on the Poor Laws reported:
“In one part of the country a widow with one child would get no relief whatever unless she came into the workhouse; in another part of the country she would, indeed, get out-relief, but nothing for herself and only 6d and two loaves per week for her child; in a third district she would get as much as 5s for herself and 4s for her child; and in a fourth district, she would get relief only if she consented to part with her child and send it to a Poor Law school.”
Local economic conditions made a difference to the number of people needing help. Some areas that have high levels of relative poverty today – such as London – also had higher proportions of children being helped under the Poor Laws in 1906. Other areas have seen economic changes. Relative poverty is high today in certain parts of the north of England that were prosperous in the early part of the 20th century, due to industries such as textiles or ship building being hit hard by the depression of the 1920s and 1930s. Other areas which had high levels of pauperism in 1906 have less relative poverty now, for example, Dorset.
Today the welfare state helps people in many ways. Surveys suggest that three out of every five families in the UK receive some kind of benefit or tax credit. The rules for these are generally consistent from area to area. The most common benefits received are child benefit and the state retirement pension.

Distribution of children who were paupers in England and Wales in 1906
Distribution of children who were in poverty in the UK in 2009
Olym
picsPopulation
Housing &
hom
e lifeIncom
es &
povertyL
eisure &
lifestylesL
ondonE
ducationE
mploym
entFood &
agriculture
The
economy
Monarchy
Technology &
comm
sTransport
Parliament
& elections
Crim
e &
defence

43 Olympic Britain
Cheaper in those days? Prices and earnings
Life in 1908, it would appear, was cheap to live: you could enjoy a pint of bitter in the pub for a penny, travel from Birmingham to London for 20p, and see the opening day of the 1908 Games from as little as 12p.
If you were among the 50,000 or so individuals who owned a car (around £400), petrol would cost just 4.7p per litre.
Of course, while simple comparisons with today’s prices might appeal to our sense of nostalgia, they are not very meaningful. Whether something is expensive or cheap depends not on the price tag in isolation, but on prices and incomes generally. Account for the fact that average annual earnings in 1908 were £70, and the capacity for the common man to drink, drive, or buy-out a box in the White City athletics stadium becomes severely diminished.
In truth, the dramatic increase in incomes in the UK since 1908 makes almost every good for which comparisons are possible look much cheaper today. Prices may have risen eighty-fold, but over
the same period average earnings have increased 350-fold, with the real take-off in our purchasing power occurring in the post-war period. The notable exception to this rule is housing: in 1930, the average house cost three times the average wage; today, the figure is ten. Houses have not merely risen in price; they have become fundamentally less affordable.
Even though we can afford more of them than we could in 1948 or 1908, other items have become relatively more expensive, that is, their price has increased faster than the cost of things generally. Labour-intensive services, from healthcare to hairdressing, have become more costly because the price of these tends to keep pace with earnings. Rising duties on cigarettes and alcohol have made these relatively dearer, too.

The fruits of our toil: average earnings have risen faster than prices, particularly since WWII, reducing the time it takes to ‘earn’ most consumer goodsThe chart shows how many minutes someone on the average wage would need to work in order to earn the money to buy certain goods
«
On the other hand, trade, outsourcing and improved production techniques have brought down the cost of food, clothing and electronic gadgets in recent years.
In the run-up to 2012, the UK saw the first serious dip in price-adjusted incomes
since the 1970s. The economic and psychological effects of this have certainly been dramatic; but though it might not always feel that way, we can buy far more petrol, more beer, more food and more Games tickets in 2012 than we could in 1948 or 1908.
Beer in pub (pint)
Petrol (litre)
Milk (pint)
1908 1918 1928 1948 1958 1968 1978 1988 1998 2008
0
10
20
30
40
50Beer in pub (pint)
Petrol (litre)
Milk (pint)
Taxation during the first world war pushed petrol prices up while at the same time earnings declined. The Suez crisis in the 1950s and supply shocks during the 1970s have also affected the affordability of petrol.
Improved productivity and distribution has brought down the cost of agricultural goods, like milk. It takes just over 2 minutes to ‘earn’ a pint of milk today.
Rising rates of alcohol duty since the 1970s have meant the time taken to ‘earn’ a pint of beer has crept up in recent decades. But in 1948 it took far longer to earn a pint.
Olym
picsPopulation
Housing &
hom
e lifeIncom
es &
povertyL
eisure &
lifestylesL
ondonE
ducationE
mploym
entFood &
agriculture
The
economy
Monarchy
Technology &
comm
sTransport
Parliament
& elections
Crim
e &
defence
minutes
45 Olympic Britain
The benefits of BritainSocial security
The 1908 and 1948 Olympic years were landmarks in the development of Britain’s social security system.
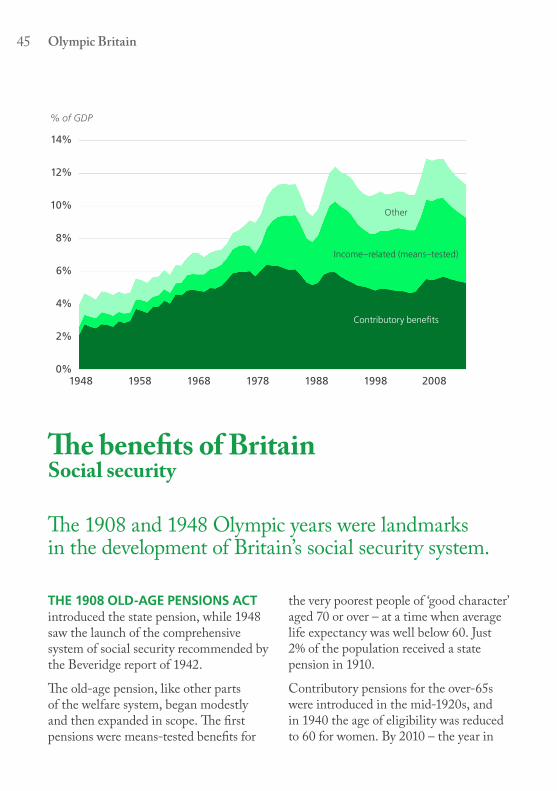
THE 1908 OLD-AGE PENSIONS ACT introduced the state pension, while 1948 saw the launch of the comprehensive system of social security recommended by the Beveridge report of 1942.
The old-age pension, like other parts of the welfare system, began modestly and then expanded in scope. The first pensions were means-tested benefits for
the very poorest people of ‘good character’ aged 70 or over – at a time when average life expectancy was well below 60. Just 2% of the population received a state pension in 1910.
Contributory pensions for the over-65s were introduced in the mid-1920s, and in 1940 the age of eligibility was reduced to 60 for women. By 2010 – the year in
1948 1958 1968 1978 1988 1998 2008
Other
Income–related (means–tested)
Contributory benefits
0%
2%
4%
6%
8%
10%
12%
14%
% of GDP
From cradle to graveThe chart shows benefit and tax credit expenditure by category as a percentage of national output in each fiscal year
Note: Figures from the 2012 fiscal year onwards are projections
«
which the female state pension age began increasing in order to be re-equalised with the male age – 20% of the population was receiving a state pension.
The contributory principle, defined by Beveridge as “benefit in return for contributions, rather than free allowances from the state,” formed the core of the post-WWII model, delivered through the expanded and centrally administered National Insurance system. Alongside this, the 1948 National Assistance Act abolished the vestiges of the centuries-old Poor Law system and established a new non-contributory means-tested financial safety net, the precursor of Income Support. Universal child benefits (then known as Family Allowance) were also introduced in this period.
The relative importance of means-tested support has grown substantially since 1948, thereby eroding the contributory principle. Originially providing a minimum subsistence income for the workless, means-tested support has expanded to boost the incomes of working families, currently through tax credits. In light of this, the Institute for Fiscal Studies has called the contributory principle today a ‘pretence’, and argued for national insurance contributions to be merged with income tax.
The latest London Games almost coincide with the advent of the next major reform of welfare provision, Universal Credit, which will replace the existing array of means-tested support, including tax credits.
Olym
picsPopulation
Housing &
hom
e lifeIncom
es &
povertyL
eisure &
lifestylesL
ondonE
ducationE
mploym
entFood &
agriculture
The
economy
Monarchy
Technology &
comm
sTransport
Parliament
& elections
Crim
e &
defence

47 Olympic Britain
Bread and boardViews on life’s essentials
In 1901, Seebohm Rowntree estimated that a family of a man, a women and two children needed earnings of 18 shillings and 10 pence a week to live on at a bare minimum, equivalent to roughly £100 in 2011 prices.
thIs Covered only the very basics for mere “physical efficiency”: the minimum necessary for the maintenance of physical health when working at a moderate level of activity. He estimated that about 10% of the population of York had earnings less than this level in 1899.
By the 1950s, Rowntree had updated his poverty line to include more basic human needs, such as the costs of travel to work or a daily newspaper. The weekly amount of money needed to meet all these needs for the family with two children was estimated at 110 shillings and one pence in 1953, equivalent to about £126 in 2011. 4% of the population of the UK lived on less than this amount.
Today the Joseph Rowntree Foundation develops a minimum income standard based on what members of the public think people need to achieve a socially acceptable standard of living, including opinions on the opportunities and choices necessary to participate in society. A couple with two children at primary school would need £514 per week after tax to achieve this minimum level. Even based on a poverty line that is generally much lower than this, 17% of people in the UK were estimated as being in poverty in 2009.
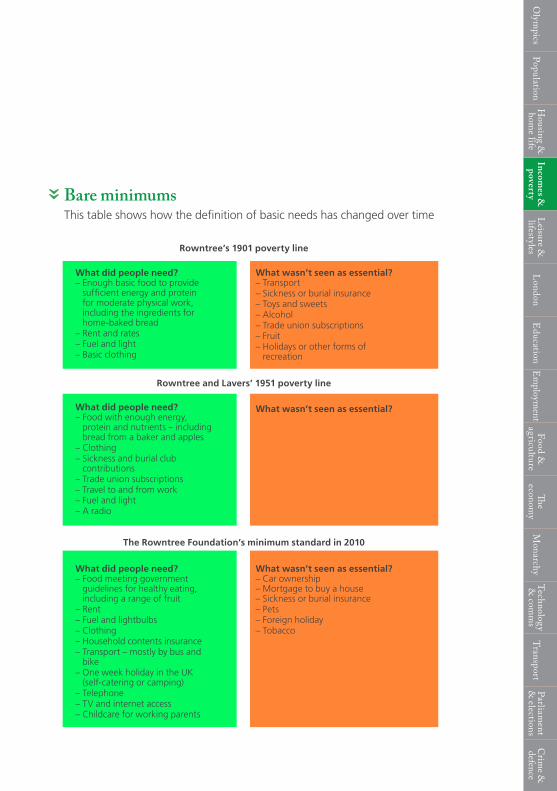
Bare minimumsThis table shows how the definition of basic needs has changed over time
what did people need? – Enough basic food to provide
sufficient energy and protein for moderate physical work, including the ingredients for home-baked bread
– Rent and rates– Fuel and light– Basic clothing
what did people need? – Food with enough energy,
protein and nutrients – including bread from a baker and apples
– Clothing– Sickness and burial club
contributions– Trade union subscriptions– Travel to and from work– Fuel and light– A radio
what did people need? – Food meeting government
guidelines for healthy eating, including a range of fruit
– Rent– Fuel and lightbulbs– Clothing– Household contents insurance– Transport – mostly by bus and
bike– One week holiday in the UK
(self-catering or camping)– Telephone– TV and internet access– Childcare for working parents
what wasn’t seen as essential? – Transport– Sickness or burial insurance– Toys and sweets– Alcohol– Trade union subscriptions– Fruit– Holidays or other forms of
recreation
what wasn’t seen as essential?
rowntree’s 1901 poverty line
rowntree and lavers’ 1951 poverty line
the rowntree foundation’s minimum standard in 2010
what wasn’t seen as essential? – Car ownership – Mortgage to buy a house – Sickness or burial insurance– Pets – Foreign holiday– Tobacco
Olym
picsPopulation
Housing &
hom
e lifeIncom
es &
povertyL
eisure &
lifestylesL
ondonE
ducationE
mploym
entFood &
agriculture
The
economy
Monarchy
Technology &
comm
sTransport
Parliament
& elections
Crim
e &
defence
«

49 Olympic Britain
SourcesShow me the moneyA.B. Atkinson, UK series in World Top Incomes database, 2012G.W. Daniels, H. Campion, The distribution of national capital, 1936 in AB Atkinson and AJ Harris, Distribution of Personal Wealth, 1978A.B. Atkinson, J.P.F. Gordon and A.J. Harrison, Trends in the Shares of Top Wealthholders in Britain: 1923-1981, 1989HMRC, Distribution of Personal Wealth statistics, 2010 & 2011J.B. Davies and A.F. Shorrocks, The Distribution of Wealth, 2000 in AB Atkinson and F Bourguignon, Handbook of Income Distribution, 2000
Workhouse to welfareReport of the Royal Commission on the Poor Laws and Relief of Distress, 1909HMRC, Child Poverty Statistics 2009, 2011D. Smith, North and South (2nd edition), 1994
Cheaper in those days?British Beer and Pub Association, Statistical Handbook 2011ONS, Detailed CPI and RPI reference tables, Jun 2011DCLG live tables on housing and house prices, Table 502Historical earnings data from www.measuringworth.comLondon 1948 Olympic Report, available from www.la84foundation.org
The benefits of BritainDWP, Benefit Expenditure Tables, May 2012 editionONS, Annual Abstract of Statistics, various yearsBoT, Statistical Abstract for the United Kingdom, 1922-1940
Bread and boardB. Seebohm Rowntree, Poverty: a Study of Town Life, 1901B. Seebohm Rowntree & G.R. Lavers, Poverty and the Welfare State, 1951B. Able-Smith & P. Townsend, The Poor and the Poorest: A new analysis of the Ministry of Labour’s Family Expenditure Surveys of 1953-54 and 1960, 1965Joseph Rowntree Foundation, Minimum Income Standard for the United Kingdom (various publications), 2008-2011ONS, Long term indicator of prices of consumer goods and services (CPI release), 2012DWP, Family Resources Survey 2009/10, 2011

Leisure & lifestyle
51 Olympic Britain
Mass conceptionPublic opinion since 1938
“Motorists are fined or imprisoned for dangerous driving. Should walkers also be punished if found guilty of careless walking, endangering the safety of others?”
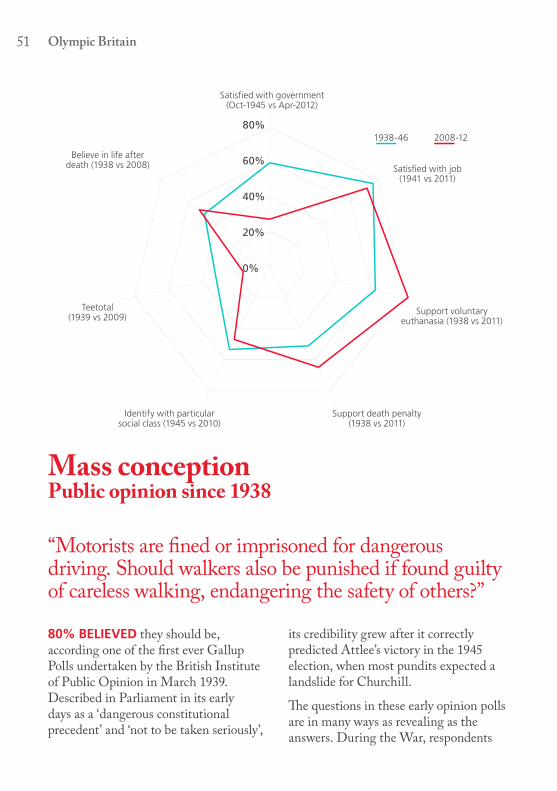
80% BelIeved they should be, according one of the first ever Gallup Polls undertaken by the British Institute of Public Opinion in March 1939. Described in Parliament in its early days as a ‘dangerous constitutional precedent’ and ‘not to be taken seriously’,
its credibility grew after it correctly predicted Attlee’s victory in the 1945 election, when most pundits expected a landslide for Churchill.
The questions in these early opinion polls are in many ways as revealing as the answers. During the War, respondents
1938-46 2008-12
80%
60%
40%
20%
0%
1938-46 2008-12
Satisfied with government (Oct-1945 vs Apr-2012)
Satisfied with job (1941 vs 2011)
Support voluntary euthanasia (1938 vs 2011)
Support death penalty (1938 vs 2011)
Identify with particular social class (1945 vs 2010)
Teetotal (1939 vs 2009)
Believe in life after death (1938 vs 2008)

were asked whether rationing was interfering with their tea-drinking, whether they carried a tin hat, and what they most looked forward to doing on the day the war ended: 19% cited celebrating in the streets, 9% tearing down blackout curtains, and 5% getting drunk. The mundane, ‘did you send washing to the laundry in the last four weeks?’ sits unpre-tentiously alongside the critical, ‘will the [newly-formed] United Nations be able to prevent war during the next 25 years?’
The destruction of housing during the War and the growth of slums was clearly a cause for national concern: the fact that 63% of people identified it as the single greatest problem facing the country in 1946 shows the strength of feeling. Today, the economy is our greatest concern, but only 38% identify it as such. Pet ownership has changed remarkably little: 31% of households had a dog and 27% a cat in 1938; today, those figures are almost exactly the same. We are more
superstitious than we were, particularly when it comes to touching wood: 41% did it for luck in 1947, compared with 71% today.
The chart shows some more comparisons of how our views have changed over the past 70 years. More people support the reintroduction of the death penalty today than supported its continuation in 1938. Satisfaction with the newly elected Labour Government in October 1945 was at levels that have only since been seen during the immediate aftermath of another Labour victory, in 1997.
Views on life after death and class, meanwhile, are not so different from today.
So was the 1940s ‘man on the street’ happier and more liberal than today? Opinion surveys today may be infinitely more respected than they were, but any attempt to answer such questions from the polling data alone really shouldn’t be taken very seriously.
Liberal and happier? Comparing public opinion in 1938-46 with today shows some unexpected change and continuityThe chart shows the proportion of people answering ‘yes’ to questions on the subjects given
«
Olym
picsPopulation
Housing &
hom
e lifeIncom
es &
povertyL
eisure &
lifestylesL
ondonE
ducationE
mploym
entFood &
agriculture
The
economy
Monarchy
Technology &
comm
sTransport
Parliament
& elections
Crim
e &
defence
53 Olympic Britain
Liquor upAlcohol consumption
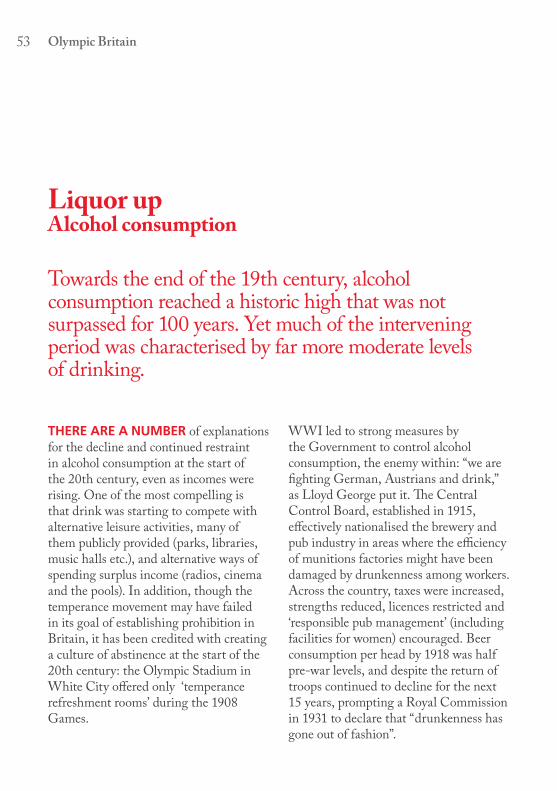
Towards the end of the 19th century, alcohol consumption reached a historic high that was not surpassed for 100 years. Yet much of the intervening period was characterised by far more moderate levels of drinking.
THERE ARE A NUMBER of explanations for the decline and continued restraint in alcohol consumption at the start of the 20th century, even as incomes were rising. One of the most compelling is that drink was starting to compete with alternative leisure activities, many of them publicly provided (parks, libraries, music halls etc.), and alternative ways of spending surplus income (radios, cinema and the pools). In addition, though the temperance movement may have failed in its goal of establishing prohibition in Britain, it has been credited with creating a culture of abstinence at the start of the 20th century: the Olympic Stadium in White City offered only ‘temperance refreshment rooms’ during the 1908 Games.
WWI led to strong measures by the Government to control alcohol consumption, the enemy within: “we are fighting German, Austrians and drink,” as Lloyd George put it. The Central Control Board, established in 1915, effectively nationalised the brewery and pub industry in areas where the efficiency of munitions factories might have been damaged by drunkenness among workers. Across the country, taxes were increased, strengths reduced, licences restricted and ‘responsible pub management’ (including facilities for women) encouraged. Beer consumption per head by 1918 was half pre-war levels, and despite the return of troops continued to decline for the next 15 years, prompting a Royal Commission in 1931 to declare that “drunkenness has gone out of fashion”.

«
With 10m adults regularly drinking more than recommended limits today, drunkenness, it would seem, is firmly back in fashion. Affluence, more liberal licensing, and larger and stronger drinks have certainly played a role; but is there, as is often suggested, an innately ‘British’ attitude to drinking that we
are powerless to transform? The trends since 1908 suggest otherwise: policy can make a difference, and culture and tastes do change. In any case, the increase in alcohol consumption since 1970 has been driven mostly by wine. Binge Britain is looking more ‘Continental’ than ever before.
Binge BordeauxThe chart shows estimated annual alcohol consumption in the UK by type of drink, measured in litres of pure alcohol per person
0
1
2
3
4
5
6
7
8
9
10
1905 1915 1925 1935 1945 1955 1965 1975 1985 1995 2005
1940: beer consumption spiked during WWII. In contrast with WWI the Government encouraged convivial beer-drinking: ‘it is the business of the Government not only to maintain life but also to maintain the morale of the people of the country’, as Lord Woolton put it.
2005: consumption reached a peak and has since declined. Some attribute recent moderation to the 2008 financial crisis.
litres per person
Cider
Wine
Spirits
Beer
Olym
picsPopulation
Housing &
hom
e lifeIncom
es &
povertyL
eisure &
lifestylesL
ondonE
ducationE
mploym
entFood &
agriculture
The
economy
Monarchy
Technology &
comm
sTransport
Parliament
& elections
Crim
e &
defence
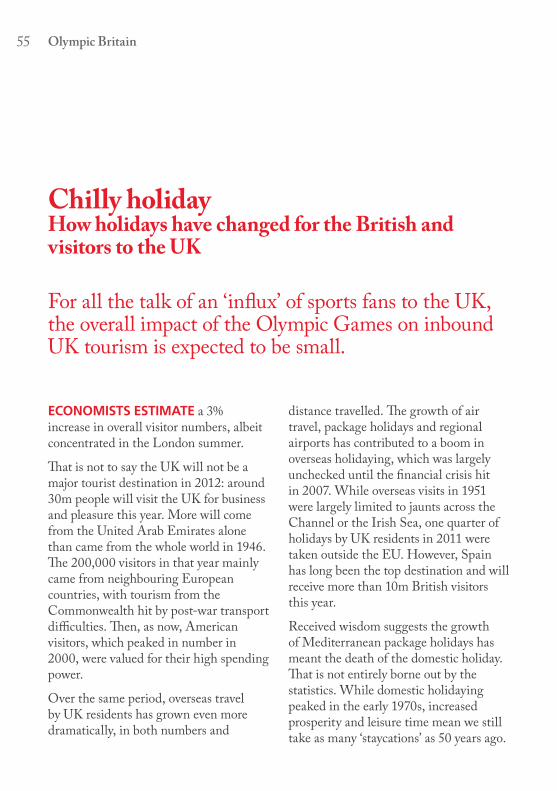
55 Olympic Britain
Chilly holidayHow holidays have changed for the British and visitors to the UK
For all the talk of an ‘influx’ of sports fans to the UK, the overall impact of the Olympic Games on inbound UK tourism is expected to be small.
ECONOMISTS ESTIMATE a 3% increase in overall visitor numbers, albeit concentrated in the London summer.
That is not to say the UK will not be a major tourist destination in 2012: around 30m people will visit the UK for business and pleasure this year. More will come from the United Arab Emirates alone than came from the whole world in 1946. The 200,000 visitors in that year mainly came from neighbouring European countries, with tourism from the Commonwealth hit by post-war transport difficulties. Then, as now, American visitors, which peaked in number in 2000, were valued for their high spending power.
Over the same period, overseas travel by UK residents has grown even more dramatically, in both numbers and
distance travelled. The growth of air travel, package holidays and regional airports has contributed to a boom in overseas holidaying, which was largely unchecked until the financial crisis hit in 2007. While overseas visits in 1951 were largely limited to jaunts across the Channel or the Irish Sea, one quarter of holidays by UK residents in 2011 were taken outside the EU. However, Spain has long been the top destination and will receive more than 10m British visitors this year.
Received wisdom suggests the growth of Mediterranean package holidays has meant the death of the domestic holiday. That is not entirely borne out by the statistics. While domestic holidaying peaked in the early 1970s, increased prosperity and leisure time mean we still take as many ‘staycations’ as 50 years ago.

Coming and goingThe top chart shows the numbers and origin of visitors to the UK; the bottom chart shows the destinations of British holidaymakers
«
0
0
5
5
10
15
10
15
20
20
30
25
25
40
35
35
50
30
45
million visitors
million holidays
1946
1951
1956
1961
1966
1971
1976
1981
1986
1991
1996
2001
2006
Increase in inbound tourism largely driven by Europe, not the USA
Number of “staycations” similar to 50 years ago
Visitors by origin, 1946
Empire countries
Scandinavia
Belgium/ Lux
Overseas visits by
destination, 1951
Overseas visits by
destination, 2011
Visitors by origin, 2011
World (excl. ROI)
USA
International
Domestic
Others
Others
Others
Others
Olym
picsPopulation
Housing &
hom
e lifeIncom
es &
povertyL
eisure &
lifestylesL
ondonE
ducationE
mploym
entFood &
agriculture
The
economy
Monarchy
Technology &
comm
sTransport
Parliament
& elections
Crim
e &
defence

57 Olympic Britain
A balmy celebrationCan we expect a sunny Olympics?
The British obsession with the weather is no doubt due to its unpredictability.
as the date of the opening ceremony for the 2012 London Olympics approaches, the host nation will begin to worry about what the weather holds for that day, July 27th, and the following weeks.
English weather statistics offer some of the longest consistent time series in the world. Daily mean temperatures for central England are available back to 1772 and daily maximums and minimums from 1878. Since 1772 the
warmest July 27th was in the Olympic year of 1948 when the mean temperature across the region was 21.9oC, while the two coldest both happened in the 19th century: mean temperatures of 10.6oC and 11.0oC were recorded in 1867 and 1823 respectively.
Since 1931, July 27th has been rain free in the south-east of England on 38 occasions out of 70, and the average daily rainfall has been 1.4mm. On average, it has been the 48th driest day of the year.
1910 1920 1930 1940 1950 1960 1970 1980 1990 2000 2010
min/max temperatures oC rainfall mm
0.0 0
7.5 100
15.0 200
22.5 300
30.0 4001912 - Maximum average rainfall: 365mm 1976 - Maximum average
temperature: 23.6o
1995 - Minimum average rainfall: 57mm
1922 - Minimum average temperature: 9.3o

The weather for the 1908 and 1948 opening ceremonies was characteristi-cally inconsistent. The 1948 ceremony was, “a perfect day with a blazing sun to welcome the teams and the spectators”, and the central England series records a maximum temperature of 31.6oC, which at the time was the highest since such records began in 1878. In 1908, by contrast, ‘there was not much sunshine, but the rain of the morning held off during most of the afternoon’.
On the whole, the weather during the two previous Games does not augur well for this one. Many of the events during the first week of the 1908 Games were held in atrocious conditions. The official report describes the clay pigeon shoot thus:-
“The specially constructed trench at Uxendon had, by careful planning, been placed so that the July sunlight should not shine in the eyes of the shooters. A more necessary precaution, in the dark weather experienced, was to insure that the birds should be clearly visible. For this purpose the ‘targets’… were marked with whitewash, so as to present a black and white ‘magpie’ appearance.”
While the 1948 Games opened with exceptionally hot weather, the second week was plagued by rainstorms. The official report pities the cameramen in the dugouts at Wembley Stadium ‘working up to their knees in water and drenched from head to foot’, while pictures show a waterlogged track and a sea of umbrellas in the spectator stands.
So-called summerThe chart shows the average daily maximum and minimum temperatures and rainfall recorded across Southern England during each summer since 1910
«
Olym
picsPopulation
Housing &
hom
e lifeIncom
es &
povertyL
eisure &
lifestylesL
ondonE
ducationE
mploym
entFood &
agriculture
The
economy
Monarchy
Technology &
comm
sTransport
Parliament
& elections
Crim
e &
defence

59 Olympic Britain
SourcesMass conceptionBritish Institute of Public Opinion (Gallup) Polls, 1938-1946, via Economic and Social Data ServiceIpsos Mori, selected polling dataBritish Social Attitudes Survey, selected dataProf. R. Wiseman, UK Superstition Survey, University of Hertforshire
Liquor upBritish Beer and Pub Association, Statistical Handbook 2011ONS, Mid-year population estimates, 1971-2011ONS, Annual Abstract of Statistics, various yearsWritten evidence to Health Committee inquiry, Alcohol, HC151-II
Chilly holidayL. Lickorish, British Tourist and Holidays Board, The Value of the Tourist Industry, 1947The British Travel Association, Patterns in British Holidaymaking 1951-1968, 1969British Tourist Authority, Digest of Tourist Statistics, variousVisitBritain et al, The UK Tourist, variousONS, Travel Trends, variousONS, Overseas Travel and Tourism - Quarterly Release - Q4 2011
A balmy celebration?Met Office, Hadley Centre observations datasets, HadCETMet Office, Hadley Centre observations datasets, HadUKPMet Office, UK climate and weather statistics

London
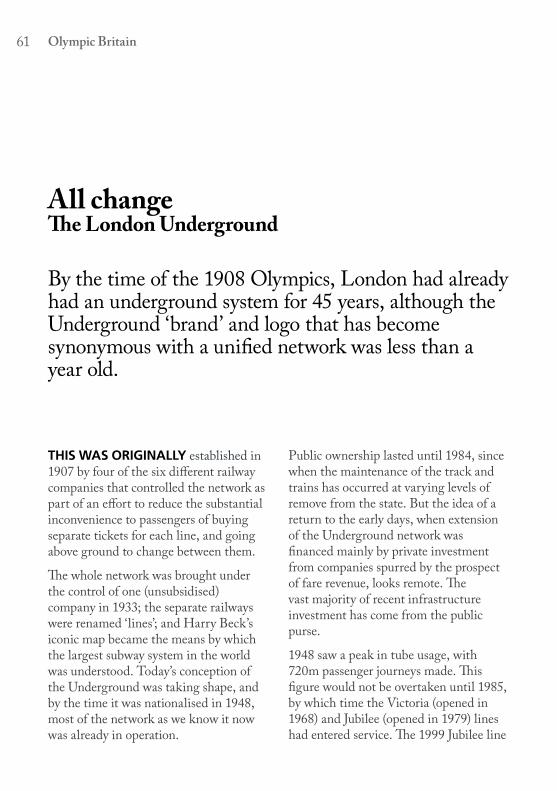
61 Olympic Britain
All changeThe London Underground
By the time of the 1908 Olympics, London had already had an underground system for 45 years, although the Underground ‘brand’ and logo that has become synonymous with a unified network was less than a year old.
thIs was orIgInally established in 1907 by four of the six different railway companies that controlled the network as part of an effort to reduce the substantial inconvenience to passengers of buying separate tickets for each line, and going above ground to change between them.
The whole network was brought under the control of one (unsubsidised) company in 1933; the separate railways were renamed ‘lines’; and Harry Beck’s iconic map became the means by which the largest subway system in the world was understood. Today’s conception of the Underground was taking shape, and by the time it was nationalised in 1948, most of the network as we know it now was already in operation.
Public ownership lasted until 1984, since when the maintenance of the track and trains has occurred at varying levels of remove from the state. But the idea of a return to the early days, when extension of the Underground network was financed mainly by private investment from companies spurred by the prospect of fare revenue, looks remote. The vast majority of recent infrastructure investment has come from the public purse.
1948 saw a peak in tube usage, with 720m passenger journeys made. This figure would not be overtaken until 1985, by which time the Victoria (opened in 1968) and Jubilee (opened in 1979) lines had entered service. The 1999 Jubilee line

Increased car ownership resulted in a decline in bus and tube usage in the 30 years after WWII. The trend has since been reversedThe chart shows estimated usage of the London Underground and bus services, measured in billions of kilometres travelled by all passengers
«
extension, boasting the most spacious stations on the network, further boosted passenger numbers, which by 2010 had reached 1.1bn: 3 journeys per week for every Londoner, collectively travelling over 8bn kilometres.
If the original flat fare of the ‘two-penny tube’ of 1900 had increased only in line with inflation, the cost would today be 79p. The current fare for Zone 1 London Underground stations is £2.00.
bus
underground
19480
2
4
6
10
8
12
1958 1968 1978 1988 1998 2008
billion km
underground
bus and tram
distance to the sun and back ten times
Olym
picsPopulation
Housing &
hom
e lifeIncom
es &
povertyL
eisure &
lifestylesL
ondonE
ducationE
mploym
entFood &
agriculture
The
economy
Monarchy
Technology &
comm
sTransport
Parliament
& elections
Crim
e &
defence

63 Olympic Britain
Do you know the way to Haringey?The changing population of London’s boroughs
In the century prior to 1911 London experienced a five-fold increase in its population, from 1.2m to 7.2m.
whIle at faCe value the century after 1911 was not nearly as spectacular – an increase of 600,000 inhabitants to 7.8m – this masks dramatic changes to where people lived in the city.
In 1911, over two-thirds of Londoners resided in Inner London. Many of these five million people lived in very densely populated communities and often did so in extreme poverty, particularly in the East End. The most crowded borough, Islington, contained 72,000 people per square mile, four times as many as Hong Kong today.
But even before WWI, London was already seeing its population shift outwards. The rise of suburbia was under way, made possible by the expansion of public transport. This allowed those who had the means to move from the crowded inner city to the leafy and less densely populated environs of Outer London, and commute to work.
This trend continued for much of the 20th century, with the proportion of
Londoners living in Outer London doubling from 30% in 1911 to 60% in 2010. One of the consequences of this was a more even distribution of people living in the city’s 32 boroughs. In 1911, for instance, 10 boroughs had population densities of less than 5,000 people per square mile. One hundred years on, not a single borough was that sparsely populated.
Today, the association between crowdedness and poverty in London no longer holds true. The most densely-pop-ulated borough in London in 2010, and indeed the most crowded local authority in the country, was the famously well-heeled Kensington and Chelsea: the rich, it seems, are sticking together like never before. Yet even here, the number of people per square mile is lower than it was in the Inner London boroughs of 1911, and half of what it was in Islington; something worth bearing in mind the next time you hear a contemporary Londoner complain about how crowded it is.

Pop. per sq. mile
0-5,0005,000-15,000
15,000-30,00030,000-45,00045,000-72,000
Pop. per sq. mile
0-5,0005,000-15,000
15,000-30,00030,000-45,00045,000-72,000
Population density, 1911
Population density, 2010
Pop. per sq. mile
0–5,0005,000–15,000
15,000–30,00030,000–45,00045,000–72,000
Olym
picsPopulation
Housing &
hom
e lifeIncom
es &
povertyL
eisure &
lifestylesL
ondonE
ducationE
mploym
entFood &
agriculture
The
economy
Monarchy
Technology &
comm
sTransport
Parliament
& elections
Crim
e &
defence
Pop. per sq. mile
0-5,0005,000-15,000
15,000-30,00030,000-45,00045,000-72,000
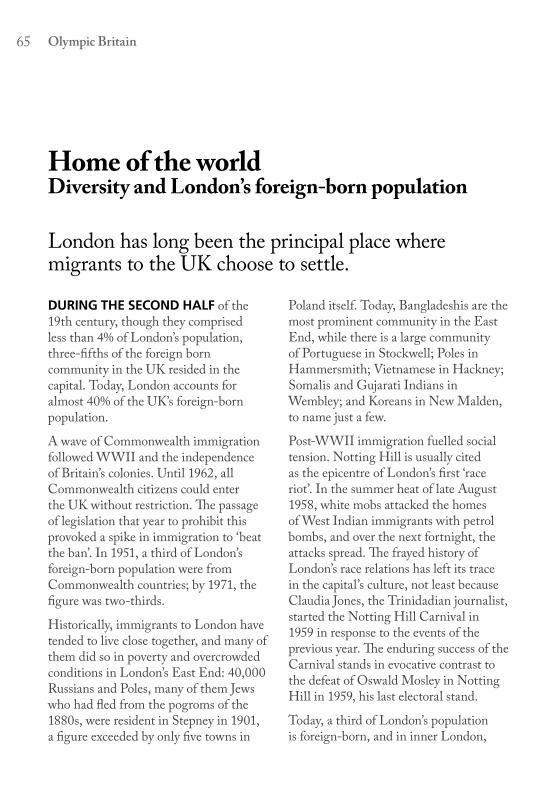
65 Olympic Britain
Home of the worldDiversity and London’s foreign-born population
London has long been the principal place where migrants to the UK choose to settle.
durIng the seCond half of the 19th century, though they comprised less than 4% of London’s population, three-fifths of the foreign born community in the UK resided in the capital. Today, London accounts for almost 40% of the UK’s foreign-born population.
A wave of Commonwealth immigration followed WWII and the independence of Britain’s colonies. Until 1962, all Commonwealth citizens could enter the UK without restriction. The passage of legislation that year to prohibit this provoked a spike in immigration to ‘beat the ban’. In 1951, a third of London’s foreign-born population were from Commonwealth countries; by 1971, the figure was two-thirds.
Historically, immigrants to London have tended to live close together, and many of them did so in poverty and overcrowded conditions in London’s East End: 40,000 Russians and Poles, many of them Jews who had fled from the pogroms of the 1880s, were resident in Stepney in 1901, a figure exceeded by only five towns in
Poland itself. Today, Bangladeshis are the most prominent community in the East End, while there is a large community of Portuguese in Stockwell; Poles in Hammersmith; Vietnamese in Hackney; Somalis and Gujarati Indians in Wembley; and Koreans in New Malden, to name just a few.
Post-WWII immigration fuelled social tension. Notting Hill is usually cited as the epicentre of London’s first ‘race riot’. In the summer heat of late August 1958, white mobs attacked the homes of West Indian immigrants with petrol bombs, and over the next fortnight, the attacks spread. The frayed history of London’s race relations has left its trace in the capital’s culture, not least because Claudia Jones, the Trinidadian journalist, started the Notting Hill Carnival in 1959 in response to the events of the previous year. The enduring success of the Carnival stands in evocative contrast to the defeat of Oswald Mosley in Notting Hill in 1959, his last electoral stand.
Today, a third of London’s population is foreign-born, and in inner London,

Olym
picsPopulation
Housing &
hom
e lifeIncom
es &
povertyL
eisure &
lifestylesL
ondonE
ducationE
mploym
entFood &
agriculture
The
economy
Monarchy
Technology &
comm
sTransport
Parliament
& elections
Crim
e &
defence
Human capitalThe chart shows the percentage of Inner London residents born overseas
Note: People born overseas does not include residents of the Republic of Ireland
«
the proportion is close to 40%. It can plausibly claim to be one of the most ethnically diverse cities on earth. Over 300 languages are spoken by its schoolchildren, many of them by the grandchildren and great-grandchildren of the post-WWII Commonwealth migrants. It boasts the largest Hindu temple in Europe and the largest mosque in Western Europe.
The accession of eastern European countries to the EU has precipitated a new wave of immigration to London and the rest of the UK. Like the migrants on the Empire Windrush from the Caribbean in 1948, many of these intend to return home after a few years. But today, the ease and cheapness of transport may mean a greater proportion fulfil that ambition.
19010%
5%
10%
15%
30%
25%
20%
40%
35%
1911 1931 1951 1971 1981 1991 2001 2011
Commonwealth Rest of world Total (no breakdown available)

67 Olympic Britain
Size mattersLondon’s place in the world
At the time of the 1908 Olympics, London was the largest city in the world, sitting at the heart of the largest empire in history; an empire on which the sun literally never set.
Its PoPulatIon had InCreased sixfold over the previous century, from 1m to 6m. The mood of general confidence as to its future was summed up by the geographer Halford Mackinder, who concluded that “we can hardly foresee any causes, apart from the decay of Britain itself, which shall lead to a failure... of London”.
The importance of the British Empire to London’s status was written into the very street names of its expanding suburbs: Rhodesia Road in Lambeth; Abyssinia Close in Wandsworth; Ceylon Road in Kensington. It had more shipyards than anywhere else in the world and half a million worked at the docks or in other import-related occupations. As in 2012, the conspicuous consumption of a wealthy elite generated a cottage economy and still more demand for labour: Harrods Knightsbridge, The Ritz and Selfridges opened in 1905, 1906 and 1907 respectively.
The late 1940s and early 1950s have been described by Roy Porter as “old London’s Indian summer, when the docks still thrived and the trams sailed majestically through pea-soupers”. But at the time of the 1948 Games, London’s pride had been physically and psycho-logically dented, by extensive damage to its housing stock during the Blitz, and by the rapid demise of Empire. The first meeting of the UN General Assembly, in February 1946, took place in Westminster Central Hall, but the meeting itself resolved to locate the UN’s headquarters in New York.
Though London has remained among the most prosperous places in the country, its status as the ‘clearing-house of the world’, as Joseph Chamberlain put it, survives only in its financial services industry. Its port infrastructure has been literally displaced by towering bank headquarters in the regenerated docklands of the south east. As in the rest of the UK, many of its

traditional manufacturing firms, reliant on imperial trade preferences, went into decline after WWII. Demand for labour is no longer insatiable, and for quality of life, London faces competition from commuter towns. As its population has stagnated, other cities, especially in the developing world, have seen the same rate of growth as London did in the 19th century. Between 1950 and 1965, London was the third-largest city in the world;
today it is the thirtieth, overtaken not just by Delhi and Mexico City, but by Lagos, Shenzen and Lima.
Yet it is hard to imagine an Olympics being held in Chongqing (China), though it has 10m people to London’s 8m. Size, it seems, is not everything, and London’s successful bid for the Games is a reminder that its history, architecture, culture and diversity still count for something.
From being the largest city in the world in 1908, London is now the thirtieth-biggest The chart shows the population of the world’s three largest metropolitan areas currently, compared with London, since 1900
«
millions
Tokyo
Delhi
Sao Paulo
London
1900
0
5
10
15
20
25
35
30
40
1910 1920 1930 1940 1950 1960 19901970 20001980 2010
Olym
picsPopulation
Housing &
hom
e lifeIncom
es &
povertyL
eisure &
lifestylesL
ondonE
ducationE
mploym
entFood &
agriculture
The
economy
Monarchy
Technology &
comm
sTransport
Parliament
& elections
Crim
e &
defence

69 Olympic Britain
SourcesAll changeGreater London Council, Transport facts and figures, 1973Transport for London, Travel in London Reports 3 and 4, 2010-11C. Wolmar, The subterranean railway: how the London Underground was built and how it changed the city forever, 2004
Do you know the way to Haringey?1911 Census, General Report, accessed via www.visionofbritain.org.ukONS, Population Estimates for UK, England and Wales, Scotland and Northern Ireland, Mid-2010
Home of the world1911 Census, General Report, accessed via www.visionofbritain.org.uk1951 Census, General Report and County Report: London1971 Census, Country of birth tables and County Report: London1981-2001 Census data accessed via www.nomisweb.co.ukONS, Population by nationality and country of birth Oct 2010-Sep 2011R. Porter, A social history of London, Chapters 12 and 14, 1994
Size mattersR. Porter, A social history of London, 1994United Nations, World urbanization prospects 2011, Table 11aI. Morris, Social development, 2010
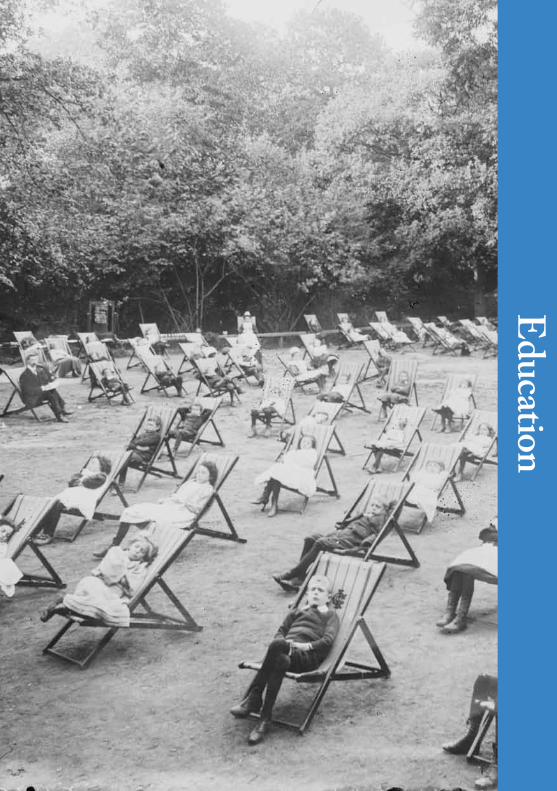
Education
71 Olympic Britain
Mob schoolPupil-teacher ratios and school participation
At the start of the 20th century, most children received their education in elementary school.
seCondary eduCatIon usually came at a charge, with demand for a limited number of free places far outstripping supply. The standard of staffing was variable: only half of the 164,000 teachers in England in 1908 were certificated, and of these only about half were trained.
Charges for secondary schools were abolished by the Education Acts of 1944-47, which introduced a common distinction between primary and secondary level at age 11. The school leaving age was raised to 15, having previously been set at 12 in 1899 and at 14 in 1918. In the early 1970s it would be raised again to 16.
Consequently, by 1950, just under a third of children in England and Wales aged 14 to 18 were in grant-aided schools,
compared with 2% in 1901. About a third of secondary level pupils were in selective grammars. Most of the other two-thirds attended secondary modern schools, which came to be perceived as inferior, since they arguably denied pupils access to public examinations and the university system. A response to this dissatisfaction eventually came in the late 1960s with the expansion of comprehensive education. By 1980 just under 90% of secondary pupils in England and Wales were being educated in comprehensive schools, compared with 9% in 1965.
The population growth of the post-war years and the fact that children were staying in school for longer required a massive expansion in the teaching workforce. The education of the ‘baby boomers’ meant the number of pupils per

teacher in primary schools across the UK briefly increased in the early 1950s. But despite a twofold increase in the number of secondary school pupils between 1950 and 1980, the pupil-teacher ratio fell from 21 to 16.
As of 2010, there are 20.7 pupils per teacher in UK primary schools, the lowest the ratio has ever been, and 15.3 pupils per teacher in secondary schools.
More personal tuitionThis chart shows the ratio of pupils to teachers in UK schools
«
1900 1910 1920 1930 1940 1950 1960 1970 1980 1990 2000 2010
0
5
10
15
25
40
45
30
35
20
Elementary/primary schools
State-funded ‘secondary’ schools
1920 - Revised definition of secondary school in Scotland
The 1944-47 Education Acts introduced a common distinction between primary and secondary schools
Olym
picsPopulation
Housing &
hom
e lifeIncom
es &
povertyL
eisure &
lifestylesL
ondonE
ducationE
mploym
entFood &
agriculture
The
economy
Monarchy
Technology &
comm
sTransport
Parliament
& elections
Crim
e &
defence
73 Olympic Britain
Preachers and teachersChurch, charity and the provision of education
Currently one in three state-funded schools in England has a religious character, catering for one quarter of pupils, but for most of the 19th century, churches and charitable groups were the principal providers of education to the masses.
even after a state system of elementary schools was established in 1870, most children continued to be educated in these voluntary schools.
In 1908, 60% of public elementary schools in England and Wales were voluntary schools, accounting for 45% of pupils. Six years earlier, their financial difficulties meant responsibil-ity for running costs had passed to local education authorities (LEAs). By 1938, voluntary schools still outnumbered council schools, but now accounted for only 30% of pupils.
Lack of funds meant that many voluntary schools were in a state of disrepair. The Board of Education reported in 1943
that nearly 92% of voluntary schools were in buildings dating from 1902 or earlier. The Education Secretary, Rab Butler, summed up the problem with a ministerial turn of phrase: “God, of His abundant grace, hath sent copious plenty of children, but not plenty of money to maintain them.” His 1944 Education Act established that half of voluntary schools’ maintenance funding would be provided by LEAs (a proportion that has since risen to 90%). The 1944 Act also allowed schools to choose whether to become ‘voluntary controlled’, so that full responsibility passed to the LEA, or voluntary aided, in which case they would receive less funding but retain more independence.

School can be voluntaryThis chart shows the percentage of schools and pupils in England in the voluntary sector
Note: Public elementary schools only prior to 1948
«
The number of voluntary schools decreased in the decade following the 1944 settlement, but since then the proportion of schools that are voluntary, and the proportion of pupils educated in them, has remained surprisingly stable. As they were a hundred years ago,
nearly all faith schools are Christian in character, although in 1908 there were twelve Jewish elementary schools catering for about 10,000 children. The first Muslim state school was established in 1997, the first Sikh school in 1998, and the first Hindu school in 2008.
1908 1918 1928 1938 1948 1958 1968 1978 1988 1998 20080%
10%
20%
30%
50%
60%
70%
40%
Schools
Pupils
Olym
picsPopulation
Housing &
hom
e lifeIncom
es &
povertyL
eisure &
lifestylesL
ondonE
ducationE
mploym
entFood &
agriculture
The
economy
Monarchy
Technology &
comm
sTransport
Parliament
& elections
Crim
e &
defence

75 Olympic Britain
You’re hiredApprenticeships since the 1950s
In the 1950s, apprenticeships were the main route into a job in most manufacturing industries, engineering and many construction occupations.
government InterventIon In this sort of training was minimal. Young people (apprentices were only very rarely over the age of 20) would work for a firm for about three years before automatically becoming a full employee.
The fall in apprenticeships during the 1970s and 1980s is partly explained by the decline in the UK’s manufacturing industries. But just as important was the declining relevance of the apprenticeship model in the face of a labour market that
1950 1960 1970 1980 1990 2000 2010
0
50
100
200
350
400
450
250
300
150
Launch of modern apprenticeships
Apprenticeships made available to people of all ages
non-manufacturing
manufacturing
thousands
From metalwork to marketing: apprenticeships have been adapted to reflect changing labour market conditions The chart shows the number of apprenticeships undertaken in each year since 1950
«
increasingly demanded a willingness, especially among young people, to change jobs in the course of their careers. Many important occupations in the post-indus-trial economy, including jobs in retail and administration, were not served by the old style of apprenticeships. Furthermore, this form of training, which awarded no formal or transferable qualifications, came to be seen as less valuable than other forms of recognised education.
All this changed in the mid-1990s when Modern Apprenticeships were launched. These are paid jobs that involve both on and off-the-job training. The government pays for a proportion of the training and the apprentice’s employer normally covers the remaining costs.
Apprenticeships now lead to nationally recognised qualifications and are available for almost every occupation. The occupations that are filled through apprenticeships today are very different to those in the past. In 2011, only 11% of apprenticeships were undertaken in manufacturing occupations, compared with 60% in 1950.
People of any age can now undertake apprenticeships. In 2011, 40% of appren-ticeships were undertaken by people aged 25 or over. These reforms have changed the role of apprenticeships, from an introduction to a first job to a means of training or re-training for a new career.
Olym
picsPopulation
Housing &
hom
e lifeIncom
es &
povertyL
eisure &
lifestylesL
ondonE
ducationE
mploym
entFood &
agriculture
The
economy
Monarchy
Technology &
comm
sTransport
Parliament
& elections
Crim
e &
defence

77 Olympic Britain
Higher intelligenceUniversity participation
In the early part of the 20th century higher education was very much a minority pursuit.
fewer than 10,000 first degrees were awarded each year in the 1920s. In 1940, less than 2% of young people went to university. Today, the Open University alone awards more than 10,000 degrees every year, and nearly half of 18 to 30 year-olds have participated in higher education.
In the 20th century, there have been four waves of expansion in higher education occurring just after WWII, in the 1960s and 1970s, the mid-1990s, and during the first decade of this century. The intense scrutiny and reform of the sector in the 1960s laid the foundations for a system of mass participation, with the Government accepting the guiding principle of the Robbins report (1963) that “courses of higher education should be available for all those who are qualified by ability and
attainment to pursue them and who wish to do so.” By 1990, 20% of young people were going to university, as many as got three or more O-levels in 1962.
Changes in the early 1990s that granted university status to over 30 ‘polytechnics’, brought about a single unified system of higher education and still greater participation, especially among women: since 1994 (the year polytechnics were included), they have received the majority of undergraduate degrees awarded.
There was a decline in undergraduate enrolment between 2009 and 2010. This, along with the increase in the cap on tuition fees to £9,000 in England, has the potential to result in the first sustained fall in first degrees awarded since the mid 1980s.

Minority interest to mass participationThe chart shows the number of first degrees and higher degrees (Masters, doctorates etc.) awarded each year from 1919
«
By contrast, enrolments from abroad continue to rise, and the international dimension of UK higher education is seen as one of its key successes. In academic year 2010/11 there were almost 430,000 overseas students. 69 different countries
– from Australia to Zimbabwe – each sent more than a thousand students to UK universities. The UK had twelve universities ranked in the top 100 in the latest world rankings and four of these were in London.
0
50
100
200
350
250
300
150
thousands of degrees awarded
1919 1929 1939 1949 1959 1969 1979 1989 1999 2009
Sector reformed and now includes former polytechnics
1960s expansion following the Robbins report
Post-war numbers boosted by schemes to get veterans to university
First degrees
Higher degrees
Olym
picsPopulation
Housing &
hom
e lifeIncom
es &
povertyL
eisure &
lifestylesL
ondonE
ducationE
mploym
entFood &
agriculture
The
economy
Monarchy
Technology &
comm
sTransport
Parliament
& elections
Crim
e &
defence
79 Olympic Britain
SourcesMob schoolHouse of Commons Library, SN/SG/4252, Education: Historical StatisticsB.R. Mitchell, British Historical Statistics, 1988ONS, Annual Abstract of Statistics, 1981-2011K. Jones, Education in Britain: 1944 to the present, 2002MoE, Education 1900-1950, 1951BoE, Statistics of Public Education in England and Wales, 1907-08DfE, Schools, pupils and their characteristics, January 2011
Preachers and teachersHouse of Commons Library, SN/SG/4405, Faith schools: admissions and performanceK. Jones, Education in Britain: 1944 to the present, 2002Ministry of Education, Education 1900-1950, 1951BoE, Educational Reconstruction, 1943B. Gates, Faith schools and colleges of education since 1800, in R Gardner, J Cairns and D Lawton (eds), Faith schools: consensus or conflict?, 2005BoE, annual reports and Statistics of Public Education in England and Wales, 1908 to 1938MoE, annual reports 1948 and 1958DfES, Statistics of Education, 1968 to 1988DfEE, Statistics of Education: Schools in England, 1998DfCSF, Pupil Characteristics and Class Sizes in Maintained Schools in England, January 2008HC Deb 19 Jan 1944 cc224-225
You’re hiredONS, Labour Market Gazette, Young persons entering employmentONS, Labour Market Gazette, First employment of young peopleBIS Data Service, Supplementary tables on apprenticeships
Higher intelligenceBoT, Statistical Abstract for the United Kingdom, 1935ONS, Annual Abstract of Statistics, various yearsHESA, Students in higher education institutions, various yearsTimes Higher Education, World University Rankings, 2011-12

Employm
ent
81 Olympic Britain
Working miraclesEmployment by age and gender
The story of rising rates of paid employment among women during the 20th century is a well-known one.
hIstorICally, marrIage was the critical factor in determining whether a woman worked or not. In 1911 the employment rate for single and widowed women aged 25-44 was 70%, not very different from the rate among women of that age today. But among married women in the same age group, it was just 10%.
There was little trend towards married women entering paid employment until WWII, when conscription resulted by mid-1943 in 80% of them being employed in work related to the war effort. Although many were dismissed after the war’s end, the subsequent decades were characterised by unusually high demand for labour and worker shortages, meaning employment among married women again began to grow. A 1965 government survey noted that “it has been apparent for some years that the only major source of potential recruits to the labour force... consists of married women”. By 1971, the rate of employment among married
women was close to 40%, up from less than 10% in 1931.
As the rate of women’s employment has risen, the rate for men, though it still remains higher, has gone into decline. In 1921, 90% of all men were in paid employment; today, the figure is just 69%. Partly, this is because of the declining labour market participation of young people, who spend longer in education, and older people, who spend longer in retirement (such trends are also in evidence for women). But even among men aged 25-44, employment rates fell from over 97% until 1981, to 91% by 2001.
The trend in participation among older men is particularly striking. In the early 20th century, if a man was lucky enough to live to today’s retirement age, he could expect to still be in work (participation among men over 65 was 62% in 1901). Indeed, he may well have been glad of the fact. Withdrawal from the labour force at this time was rarely a matter of

«O
lympics
PopulationH
ousing &
home life
Incomes &
poverty
Leisure &
lifestyles
London
Education
Em
ployment
Food &
agricultureTh
e econom
yM
onarchyTechnology &
comm
sTransport
Parliament
& elections
Crim
e &
defence
choice, even among the elderly, because most households did not have the savings required to sustain a protracted retirement.
The difficulty older people faced in keeping their jobs led reformers, Charles Booth and Joseph Chamberlain among them, to campaign for publicly provided old-age pensions. But the rate at which
these were introduced in 1908 – just 5 shillings per week for the over 70s, well below the poverty lines of the time – hardly made retirement an attractive prospect, and as late as 1921, employment among older men remained close to 60%. With the state pension age set to increase, and long life expectancies raising the cost of retirement, the trend away from old-age working looks set to be reversed.
Under 20s Over 65s All agesUnder 20s Over 65s All ages
Job for lifeThe chart shows employment rates among men and women of all ages (yellow line), and among younger and older sub-groups (pink lines) at ten-year intervals since 1921 (excluding 1941)
Under 20s Over 65s All ages
0%0%21 2131 3151 5161 6171 7181 8191 9101 0111 11
10%10%
20%20%
30%30%
40%40%
50%50%
60%60%
70%70%
80%80%
90%90%
100%100%
men women
83 Olympic Britain
Jobs for the boysGender balance in employment and the changing nature of work
The changes in the nature of work since 1908 are reflected even in the different names and categories used to classify jobs in surveys.
thIs makes It dIffICult to track changes in numbers of people doing different types of jobs. However, it is possible to look at the proportions of men and women working in different sectors, as captured in the 1911 and 1951 censuses, and the 2011 Labour Force Survey. From this, we can answer the question: has the distinction between ‘ jobs for women’ and ‘ jobs for men’ become more blurred over time as more women have entered the workforce?
In the 1911 Census, the largest categories of employment were domestic and personal services, metal manufacturing, transport and communications, textiles and agriculture, horticulture and forestry. Of these, only textiles employed anything close to a balanced number of men and
women. Domestic and personal services were dominated by women, while over 95% of workers in agriculture, and transport and communications were men.
Today, none of the major sectors of employment, with the exception of construction, are so overwhelmingly dominated by men or women, and there are few jobs that are perceived to be entirely closed off to one gender. But the divide is still very much in evidence: men are more prevalent in manufacturing (76%), and women in health and social work (78%). If the rate of progress over the last century is anything to go to, a country where male nurses and female metalworkers are entirely unremarkable looks some way off yet.

Olym
picsPopulation
Housing &
hom
e lifeIncom
es &
povertyLeisure &
lifestyles
London
Education
Employm
entFood &
agriculture
The
economy
Monarchy
Technology &
comm
sTransport
Parliament
& elections
Crim
e &
defence
A level playing field?The chart shows the proportions of men and women working in the five sectors with the largest number of employees
«20
1119
1119
51
1. Wholesale & retail trade
3. Education
2. Health & social work
4. Textiles
2. Metal manufacturing & products
5. Transport & communications
3. Commercial, finance and insurance
1. Metal manufacturing & engineering
4. Manufacturing
5. Agriculture, horticulture & forestry
3. Transport & communications
1. Domestic & personal services
4. Personal services
2. Clerks and typists
5. Construction
0% 25% 50% 75% 100%
Men Women

85 Olympic Britain
Picket upStrikes and trade union membership
During the 20th century, employees banded together in unions to work to improve their pay and conditions.
today, trade unIon memBershIP is gradually falling and, in comparison with earlier periods, strikes are rare. In 2011, despite major protests over public sector pensions, there were fewer working days lost to strikes and other labour disputes than in 1948. There were eight times as many days lost in 1908, when there were disputes in the engineering and shipbuilding industries in the North East, and strikes in the cotton industry over proposals to reduce wages.
Figures for these Olympic years are small compared with the numbers of days lost in certain other years in the early part of the century. 1926 saw 162m working days lost to industrial disputes, largely due to long stoppages in coal mining and an associated general strike.
While the number of days lost to strike peaked in the 1920s, the number of people who were trade union members
was at its highest in 1979, when you could, for example, be a member of the Scottish Union of Power Loom Overlookers, the National Union of Scalemakers, or the Screw, Nut, Bolt and Rivet Trade Union.
Since 1979 trade union membership has been gradually declining, although most people still believe that trade unions are essential to protect workers’ interests. Views of trade union power have changed, however: in 1979, 80% of people thought that trade unions had too much power in Britain; by 2011, this had fallen to 35%.
Today trade unionists are more likely to be female than male, and are more likely to work in the public than the private sector. This is in contrast to the situation in 1908, when less than a tenth of trade union members were women and the sector with the largest number of trade unionists was mining and quarrying.

Olym
picsPopulation
Housing &
hom
e lifeIncom
es &
povertyLeisure &
lifestyles
London
Education
Employm
entFood &
agriculture
The
economy
Monarchy
Technology &
comm
sTransport
Parliament
& elections
Crim
e &
defence
More working days were lost in 1926 than in the 37 years since 1974 combinedThe chart shows trade union membership and the numbers of working days lost to strikes since 1900
«
1900
0
20
40
60
80
140
100
160
120
180
millions
1910 1920 1930 1940 1950 1960 19901970 20001980 2010
1926includes nine-day general strike over wage reductions and increased working hours for coal miners and various other miners’ strikes
1921coal miners protest
about wages
1912coal miners
campaign for local minimum
wage rates
1979engineers campaign for increased wages
1984coal miners protest against pit closures
Working days lost to labour disputes
Trade union membership
87 Olympic Britain
SourcesWorking miraclesDoEP, British labour statistics: historical abstract 1886-19681971 Census, Economic activity tablesCensus data, 1981-2001, accessed via www.nomisweb.co.ukAnnual Population Survey data, 2011, accessed via www.nomisweb.co.ukONS Labour Market Statistics, June 2012D. Baines and P. Johnson The labour force participation and economic well-being of older men in London, 1929-31, 1997M. Walsh and C. Wrigley, Womanpower: the transformation of the labour force in the UK and the USA since 1945, 2001
Jobs for the boysDoEP, British labour statistics: historical abstract 1886-1968ONS, Labour Market Statistics, June 2012
Picket upBoT/MoL Gazette, 1910, 1927, 1949, 1950Ipsos-Mori , Attitudes to Trade Unions 1975-2011, 2012ONS, Labour Dispute Statistics, 2012BIS, Trade Union Membership Statistics 2011A. Marsh, V. Ryan & J.B. Smethurst, Historical Directory of Trade Unions vol 4, 1994 J.B. Smethurst & P. Carter, Historical Directory of Trade Unions vol 6, 2009

Food & agriculture
89 Olympic Britain
More chicken, less eggChanges in food consumption patterns
The first attempts by the Government to comprehensively measure our food consumption were driven by a need to determine the adequacy of the food supply and the effects of rationing during WWII.
at that tIme, it was seen as more important to increase the fat and energy content of the average diet.
Almost 60 years after the end of rationing, food has once again become a national obsession, although for rather different reasons. From a situation where choice was severely limited by availability in 1948, we are now faced in the supermarket with a dizzying array of food. For nearly a decade after the War, the Government permitted the production of just one type of cheese; today, Tesco stocks over 30 kinds of cheddar and 12 types of brie alone. This availability of comparatively cheap, tasty and easily-prepared food, together with a general decline in physical activity,
has contributed to the UK’s ‘obesity epidemic’, even as the average daily number of calories we consume has fallen from 2,400 to 2,300 since 1948. Public policy is once again being directed towards limiting consumption of certain types of food.
A number of forces have driven changes in our food consumption habits since 1948. Most obviously, the breakdown of traditional meal patterns and the increase in female labour force participation, combined with generally elevated expectations of convenience, mean that many of us now would prefer to have our food prepared for us, rather than spend time cooking it ourselves. The fall in egg consumption since the 1970s can at

least partly be explained by the demise of home baking and the cooked breakfast.
Developments in production techniques have also affected consumption patterns, driving the cost of some foods down, relative to others. In the 1950s, J Sainsbury grocers played a critical role
in encouraging intensive rearing, factory farming and processing of chickens. This, more than anything, drove the fall in the relative cost of chicken, resulting in an increase in consumption from 1m birds in 1948 to 125m today, turning it from a once-a-year Christmas treat into the country’s most popular meat.
Bakers vs broilersThe left-hand axis shows grams of chicken bought per person per week from 1948 to 2010. The right-hand axis shows the numbers of eggs bought per person per week during the same period.
1948 1958 1968 1978 1988 1998 2008
0 0
50 1
100 2
150 3
200 4
250 5
300 6
grams of chicken number of eggs
1953 egg rationing ends
1955-65 chicken prices fall by 35%, while prices of pork, lamb and beef rise by 20-40%
1990 the salmonella scare accelerates the decline in egg consumption
1970s on the demise of the cooked breakfast and home baking is seen as contributing to the long-term fall in egg consumption
«O
lympics
PopulationH
ousing &
home life
Incomes &
poverty
Leisure &
lifestyles
London
Education
Em
ployment
Food &
agricultureTh
e econom
yM
onarchyTechnology &
comm
sTransport
Parliament
& elections
Crim
e &
defence

91 Olympic Britain
Wet fish and damp squidsThe UK fishing industry
Commercial fishing has a long tradition around Britain’s coasts, providing livelihoods to sea-faring communities from Looe to Lerwick for centuries.
BrItaIn was Ideally PlaCed for the development of a large-scale industry, with seas of moderate depth, readily fished for herring, haddock, cod and pilchard by a large fleet of small vessels.
On 3 October 1908, the Times reported that the drifter Holly established a record for the season by landing 250,000 herrings from a single night’s fishing, valued then at about £240. By 1914, fishing was a large scale, capital intensive industry, supplying a large domestic market and exporting overseas.
The Second World War interrupted routine commercial fishing in Britain and arguably marks the point at which the British fishing industry began its long term decline. When fishing resumed after the war, herring was no longer the dominant species among the catch, and white fish became the mainstay; in 1948, herring comprised 25% of wet fish landed, compared with almost
50% 20 years before. By this point, the majority of herring was being caught by Scottish vessels, better placed to make the treacherous journey towards the Arctic Circle, where stocks remained plentiful. In one night’s fishing, it was reported that Peterhead boats had landed 4m herrings. The drifter Daisy had the top catch, its crew of 10 getting about £400 for a night’s work.
Where herring went, other fish followed, and stocks of North Sea cod and haddock fell rapidly after the War, with technological advances on boats concealing the true extent of the decline. Today, the challenge is to balance the needs of fishermen with the demands of conservation so depleted stocks do not wipe out the industry entirely. Since 1983, fishermen have been bound by controversial quotas imposed by the EU’s Common Fisheries Policy, in an effort to protect declining stocks.
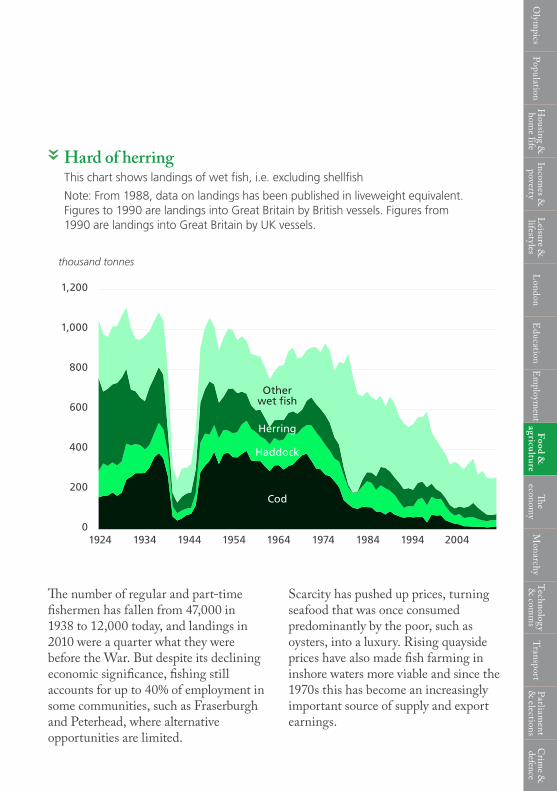
19240
200
400
600
800
1,000
1,200
thousand tonnes
1934 1944 1954 1964 1974 1984 1994 2004
Cod
Haddock
Herring
Other wet fish
The number of regular and part-time fishermen has fallen from 47,000 in 1938 to 12,000 today, and landings in 2010 were a quarter what they were before the War. But despite its declining economic significance, fishing still accounts for up to 40% of employment in some communities, such as Fraserburgh and Peterhead, where alternative opportunities are limited.
Scarcity has pushed up prices, turning seafood that was once consumed predominantly by the poor, such as oysters, into a luxury. Rising quayside prices have also made fish farming in inshore waters more viable and since the 1970s this has become an increasingly important source of supply and export earnings.
Hard of herringThis chart shows landings of wet fish, i.e. excluding shellfish
Note: From 1988, data on landings has been published in liveweight equivalent. Figures to 1990 are landings into Great Britain by British vessels. Figures from 1990 are landings into Great Britain by UK vessels.
«O
lympics
PopulationH
ousing &
home life
Incomes &
poverty
Leisure &
lifestyles
London
Education
Em
ployment
Food &
agricultureTh
e econom
yM
onarchyTechnology &
comm
sTransport
Parliament
& elections
Crim
e &
defence

93 Olympic Britain
The rural revolutionHow technology has changed farming
There has been a striking increase in agricultural productivity during the 20th century.
In 1900 one agrICultural worker fed around 25 people in Great Britain. By 2010, one agricultural worker fed 200 people. This increase in productivity is largely due to advances in three broad areas of agricultural technology.
Firstly, tractors, combine harvesters and mechanical threshers were all introduced into mainstream agriculture during the 20th century. These inventions enable a smaller workforce to collect more produce from a larger area of land.
Secondly, large capacity silos and other storage facilities with the technology needed to maintain constant temperature and humidity have allowed for the storage of far greater quantities of agricultural
produce. The ability to control the pace of ripening once harvested, using chemicals as well as temperature, means a far greater quantity of produce can be harvested in one go, without the risk of it spoiling.
Finally, fertilisers, herbicides and pesticides have helped to increase crop yields and speed up the growth of crops and to control diseases and pests. Spraying machinery has enabled huge areas to be treated in a short period of time and by a small workforce. Jobs that would have taken large teams of workers several weeks, like removing weeds from a field, can now be completed in hours by a handful of people.

Growing more with lessThe chart shows the area of land cultivated for staple crops (barley, wheat and oats) and the number of agricultural workers in Great Britain
1908 1918 1928 1938 1948 1958 1968 1978 1988 1998 20080.0 0.0
0.5 0.2
1.0 0.4
1.5 0.6
2.0 0.8
2.5 1.0
3.0 1.2
3.5 1.4
4.0 1.6
million hectares of cultivated land million agricultural workers
«O
lympics
PopulationH
ousing &
home life
Incomes &
poverty
Leisure &
lifestyles
London
Education
Em
ployment
Food &
agricultureTh
e econom
yM
onarchyTechnology &
comm
sTransport
Parliament
& elections
Crim
e &
defence

95 Olympic Britain
SourcesRacing towards our limitsMore chicken, less eggDEFRA and predecessor departments, National Food Survey and Family Food 2010A. Godley and B. Williams, The chicken, the factory farm and the supermarket: the emergence of the modern poultry industry in Britain, 2007
Wet fish and damp squidsThe Oxford Companion to British History, 2009B.R. Mitchell, British Historical Statistics, 1988ONS, Annual Abstract of Statistics, various yearsMarine and Fisheries Agency, Sea Fisheries Statistical Tables, various years
The rural revolutionDEFRA, Survey of Agricultural DataG. Routh, Occupations of the people of Great Britain 1801-1981, 1987Census of Population, 1991 & 2001ONS, Labour market statistics, employment by industry
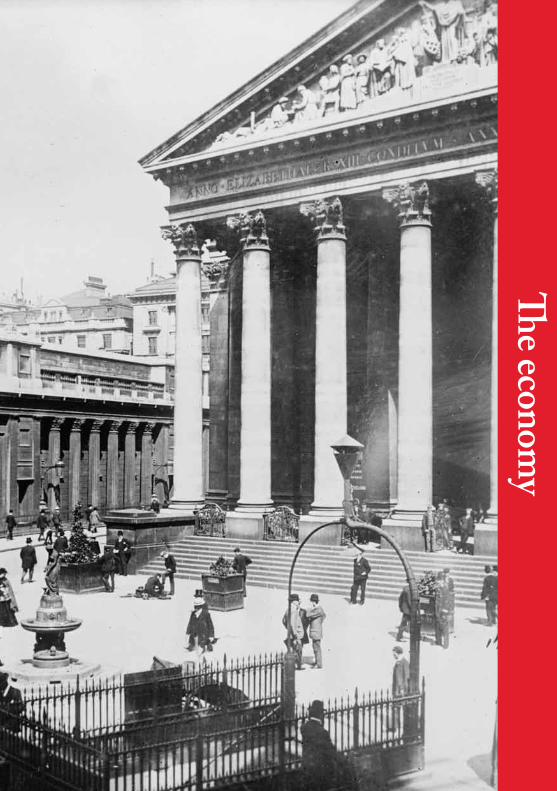
The econom
y
97 Olympic Britain
Olympic growth and imperial declineThe UK economy
At the time of the 1908 Olympics, the UK, at the heart of the largest empire in the world, was only just beginning its decline from being the world’s economic superpower.
there was InCreasIng competition, chiefly from the US, France and Germany, for the title of most industri-alised and powerful country. However, the UK was still booming, and including the output of its colonies, it remained (just) the largest economy in the world. Though the benefits were far from evenly distributed, industrialisation over the previous century had led to increasing affluence for some households. This in turn strengthened the demand for British manufactured goods at home, while the preferential trade arrangements with the rest of the Empire kept exports high and imports cheap.
By 1948, two world wars later, the UK was no longer the economic or political superpower it had once been. The economy was emerging from a severe
recession, contracting in each of the four years prior to the Games. At home, rationing meant that even when money was available, spending was subdued. Overseas, the UK could no longer rely on demand for its products from the Empire to shore-up the home economy. It had lost the ‘ jewel in the crown’ of its Empire, India, the year before, and the Atlantic Charter (1941) had promised its colonies the rights to self determination.
Even if the political will to hold on to Empire had existed, it would not have been possible as the UK no longer had the resources to enforce it. As Keynes put it to government ministers shortly after the war, Britain’s world role was a burden which ‘there is no reasonable expectation of our being able to carry.’

Games theory: 1948 was a turning-point for the UK economy, but it is unlikely 2012 will prove to be the sameThe chart shows the year-on-year change in UK economic output (gross domestic product) in the periods before and after the London Olympics
Note: Figures for 2012 and 2013 are forecasts
-4
-5
-6
-2
-3
-1
0
1
2
3
4
5
«
1948 was a turning point for the UK economy: grants from the United States worth $2.7bn under the Marshall Plan may not have saved face, but are estimated to have saved 1.2m jobs and raised national income by 10%. It seems unlikely that 2012 will prove to be the
same. Following the global economic downturn of 2008-09, when the economy contracted by 7.3%, the UK entered the 2012 Olympic year by returning to technical recession, and output remains 4% below its pre-recession peak.
Olym
picsPopulation
Housing &
hom
e lifeIncom
es &
povertyL
eisure &
lifestylesL
ondonE
ducationE
mploym
entFood &
agriculture
The
economy
Monarchy
Technology &
comm
sTransport
Parliament
& elections
Crim
e &
defence
1905 1945 20091906 1946 20101907 1947 20111908 1948 20121909 1949 2013
% change on previous year
99 Olympic Britain
From Empire to EUUK trade
At the beginning of the 20th century, Britain, including southern Ireland, was one of the world’s principal trading nations.
the maIn markets for British goods were those with which it had preferential trade arrangements: the Empire and former colonies. In 1908, exports of goods to the Commonwealth countries of Australia, Canada, India, New Zealand and South Africa accounted for around a quarter of the total, and British India was the UK’s largest single market. The US accounted for almost a tenth of all exports; while estimates of exports to the current EU countries suggest they accounted for a further four tenths, not dissimilar from the figure today (UK exports to the EU were 53% of the total in 2011).
In 1948, despite the demise of the Empire, the Commonwealth had become a still more important market for UK goods, accounting for almost a third of all exports. An independent Ireland now accounted for a twentieth share and South Africa was the single largest export market. The devastation in Europe meant demand for UK goods dwindled: exports to EU countries represented just a quarter of all exports in 1948.
By the end of the 20th century, the UK’s preferential trade arrangements with its former colonies had been replaced by those with the EU, and the US was now the UK’s largest market for goods and services. Exports to the selected Commonwealth countries accounted for less than those to Ireland alone – as, more surprisingly, did exports to the developing BRIC countries of Brazil, Russia, India and China combined.
The UK’s lack of export competitive-ness and widening trade deficit is a cause for concern today, but it is far from historically unusual. Imports exceeded exports (by value) for 32 consecutive years between 1924 and 1955 and the UK has run a deficit for 78 of the 111 years since 1908. During WWII, the collapse in demand for exports, together with the rebalancing of production towards the War effort, resulted in the UK importing £2-worth of goods for every £1 it exported. By 1940, the UK Balance of Trade had increased to an eighth of UK GDP; the figure in 2011 was just under 2%.

The UK has long imported more than it exportsThe chart shows the UK’s balance of trade (exports minus imports) as a percentage of national output, for selected years since 1900
«
1908
1948
2011
Selected Commonwealth US Estimated EU Other
Olym
picsPopulation
Housing &
hom
e lifeIncom
es &
povertyL
eisure &
lifestylesL
ondonE
ducationE
mploym
entFood &
agriculture
The
economy
Monarchy
Technology &
comm
sTransport
Parliament
& elections
Crim
e &
defence
1900
1940
2002
1901
1941
2003
1902
1942
2004
1903
1943
2005
1904
194
4
2006
1905
1945
2007
1906
1946
2008
1907
1947
2009
1908
1948
2010
1909
1949
2011
-13%
-11%
-9%
-7%
-5%
-3%
-1%
1%
% of GDP
And the importance of the Commonwealth as an export market has declinedThe chart shows UK exports by destination in 1908, 1948 and 2011
«
1908
1948
2011
Selected Commonwealth US Estimated EU Other
1908
1948
2011
Selected Commonwealth US EU (estimated) Other
101 Olympic Britain
Small changeBritain and the gold standard
At the time of London’s first Olympics in 1908, the amount of money in circulation in the UK was tied to the amount of gold in the economy.
the gold standard had prevailed for most of the previous two centuries and was to continue until WWI began in 1914.
The UK was not the only country whose monetary system was based on gold. From 1880-1914, almost all of the world’s leading economies had followed suit.
So how did it work? Each country fixed the price of gold in their local currency. In the UK, the price of one troy ounce of gold was £4.25. In the US it was fixed at $20.67. This implied a fixed exchange rate between pound sterling and the dollar ($4.87 per £1), and all the other countries on the gold standard. To enhance the credibility of the arrangements, authorities guaranteed that paper money was fully convertible into gold. Anyone could request to convert their pounds into the equivalent value of gold.
Because it limited the ability of governments to print money, the gold standard stopped countries from
deliberately devaluing their own currency in order to improve the competitiveness of their exports or pay off their debts. As a result, membership of the gold standard was seen as a commitment to sound government finance. By constraining the growth in money supply, the gold standard was also believed to contribute to stable prices. Over long periods this was generally the case: price levels in the UK were much the same in 1914 as they were in 1880.
However, the gold standard’s inflexibility had major disadvantages. Changes in the world’s money supply were dependent not on economic conditions, but on the amount on new gold that was mined. This meant that on the one hand, monetary policy could not be used to respond to recessions and booms; but on the other, significant rises in gold production would lead to faster money supply growth and ultimately inflation, regardless of a country’s underlying economic conditions.
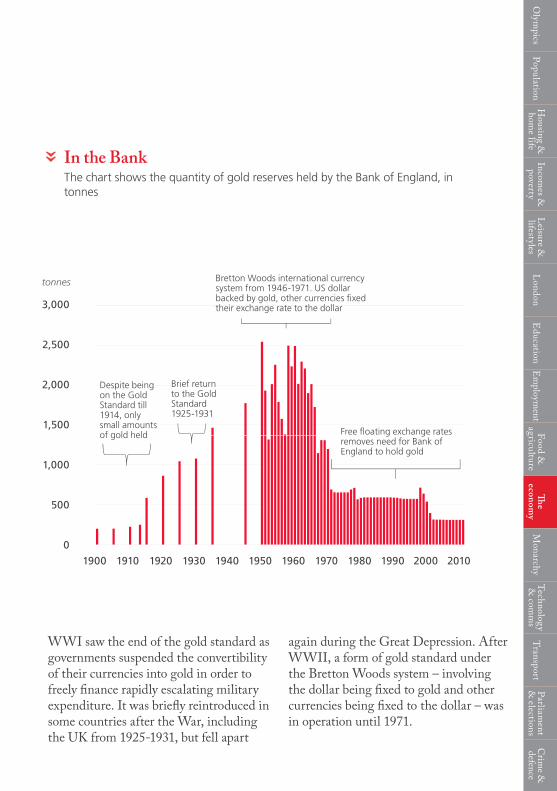
WWI saw the end of the gold standard as governments suspended the convertibility of their currencies into gold in order to freely finance rapidly escalating military expenditure. It was briefly reintroduced in some countries after the War, including the UK from 1925-1931, but fell apart
again during the Great Depression. After WWII, a form of gold standard under the Bretton Woods system – involving the dollar being fixed to gold and other currencies being fixed to the dollar – was in operation until 1971.
In the BankThe chart shows the quantity of gold reserves held by the Bank of England, in tonnes
«O
lympics
PopulationH
ousing &
home life
Incomes &
poverty
Leisure &
lifestyles
London
Education
Em
ployment
Food &
agricultureTh
e econom
yM
onarchyTechnology &
comm
sTransport
Parliament
& elections
Crim
e &
defence
1900 1910 1920 20001930 1940 1950 1960 1970 1980 1990 2010
500
0
1,000
1,500
2,000
2,500
3,000
Bretton Woods international currency system from 1946-1971. US dollar backed by gold, other currencies fixed their exchange rate to the dollar
Despite being on the Gold Standard till 1914, only small amounts of gold held
Brief return to the Gold Standard 1925-1931
Free floating exchange rates removes need for Bank of England to hold gold
tonnes

103 Olympic Britain
Where the money goesPublic spending
In 1908, Government spending was equivalent to just one seventh of economic output (GDP), with more spent on defence than on health, welfare and education combined.
today, PuBlIC sPendIng equates to half of GDP, with eight times more spent on health, old-age pensions and welfare than on defence.
The two World Wars had an enormous effect on public spending, which increased dramatically not only during wartime, but remained permanently higher thereafter. This was partly due to high debt interest payments on wartime borrowing, but in the long term may also have been because the experience led to increased acceptance of higher levels of public spending and associated levels of taxation.
Besides the increase in the scale of public spending over the century, its composition has altered. Even in the early 1950s, defence spending accounted for 9% of GDP and over a fifth of all public spending. This was more than social
security and health spending combined. Defence spending fell rapidly in the post-war period, even before the end of the Cold War: by the late 1980s, it accounted for around 4% of GDP and is now less than 3%.
As the government’s financial commitment to military protection waned, so its role as a provider of social protection expanded. The process arguably began with the Old Age Pensions Act 1908 (providing a means-tested pension of £20 per week in today’s money to those over 70) and culminated with the implementation of the 1942 Beveridge Report, which famously recommended that the state accept responsibility for the social security of its citizens from ‘cradle to grave’.
Since the early 1950s, this responsibility has been reflected in growing education,

health and social security budgets: together, these have increased from 11% of GDP to nearly 30%.
Adjusting for inflation, health spending is now 17 times higher than in 1948, and welfare and pensions spending 12 times greater. In the future, an ageing population, together with medical
advances and richer conceptions of what constitutes an adequate standard of living, will put ever-greater pressure on health, pension and social care budgets. Economically, the generosity of social protection may be reaching its sustainable limits. But expectations, once raised, may prove politically difficult to disappoint.
Government has become more active in redistributing resources over the past centuryThe chart shows public spending as a share of economic output
«O
lympics
PopulationH
ousing &
home life
Incomes &
poverty
Leisure &
lifestyles
London
Education
Em
ployment
Food &
agricultureTh
e econom
yM
onarchyTechnology &
comm
sTransport
Parliament
& elections
Crim
e &
defence
1908 1918 1928 1938 1948 1958 1968 1978 1988 1998 20080%
10%
20%
30%
50%
60%
70%
40%
% of GDP
Public spending increased rapidly during both World Wars ...
... and in both cases remained above its pre-War level after the end of the War
Health, welfare and pensions
Other spending
Defence
Education

105 Olympic Britain
Some totalThe national debt
The national debt recently exceeded £1 trillion for the first time and is currently equivalent to around two-thirds of annual economic output (GDP).
But the uk government has a long history of indebtedness, and for most of the 20th century, its debt was much higher, as a share of GDP, than it is now. The power to tax, raise revenue and print money has made the government a safe bet for creditors over the years: there are still £167m in perpetual debts, known as
Consols, left over from the Napoleonic Wars that the government has been paying 2.5% interest on since 1902.
War drove the trajectory of debt during the first half of the 20th century, too. In each year between 1918 and 1963, the stock of national debt was larger
1900 1910 1920 1930 1940 1950 1960 1970 1980 1990 2000 2010
50
200
250
300
100
150
0
% of GDP
National debt grew rapidly during both World Wars
... before increasing again after the financial crisis
Debt fell sharply after WWII ...

Olym
picsPopulation
Housing &
hom
e lifeIncom
es &
povertyL
eisure &
lifestylesL
ondonE
ducationE
mploym
entFood &
agriculture
The
economy
Monarchy
Technology &
comm
sTransport
Parliament
& elections
Crim
e &
defence
than annual GDP, due largely to rapidly escalating military expenditure during the two World Wars. Debt reached a peak of 252% of GDP in 1946, the same year as the National Health Service and National Insurance Acts. It is hard to imagine the Government embarking on the creation of the welfare state with debts worth more than twice annual output, but there are important differences between then and now. Firstly, capital and foreign exchange controls meant British lenders could not freely buy bonds issued by governments abroad, meaning there were fewer alternatives to UK Government debt for investors. Secondly, around a third of the Government’s debt was in the form of post-war loans provided by the US Government on concessional terms.
Between the end of WWII and the mid-1970s, the ratio of debt to GDP fell sharply thanks to sustained growth from 1947 to 1974. This trend has been
reversed in recent years: debt nearly doubled from 36% of GDP in 2006 to 66% in 2011. This reflects both large budget deficits and the fall in GDP which have occurred in the wake of the 2008 financial crisis, together with rapidly rising health and pensions expenditure in the years preceding it. Debt is forecast to continue rising to over 76% of GDP in 2014/15, before falling slightly.
Government debt must be financed. Thanks to interest rates that are lower now than at any time since 1897, the cost of servicing this debt is smaller, as a share of GDP, than during much of the 1980s, although the trend is sharply upwards. These low rates are partly attributable to perception of the credit-worthiness of the Government, but also reflect pessimism over the British economic outlook, with attendant low inflation, together with risk aversion, and the shortage of safe assets in the wake of the financial crisis.
Seeing redThis chart shows the UK’s national debt measured as a percentage of GDP
Note: National debt data from 1900 to 1973; public sector net debt from 1974
«
107 Olympic Britain
SourcesOlympic growth and imperial declineBank of England, The UK recession in context, data annex, 2010ONS, GDP chained volume (series ABMI)OBR, Economic and Fiscal Outlook, June 2012
From Empire to EUB.R. Mitchell, British Historical Statistics, 1988ONS, UK Balance of Payments 2011 (The Pink Book)ONS, UK Economic Accounts 2011, Quarter 3 and Quarter 4
Small changeWorld Gold Council, World Official Gold Reserves since 1845World Gold Council, World Official Gold Reserves since 2000
Where the money goesB.R. Mitchell, British Historical Statistics, 1988ONS, Economic Trends, October 1987The Institute for Fiscal Studies, Fiscal Facts
Some totalHMT, Public finances databank (archived version)ONS, Public sector finances, March 2012
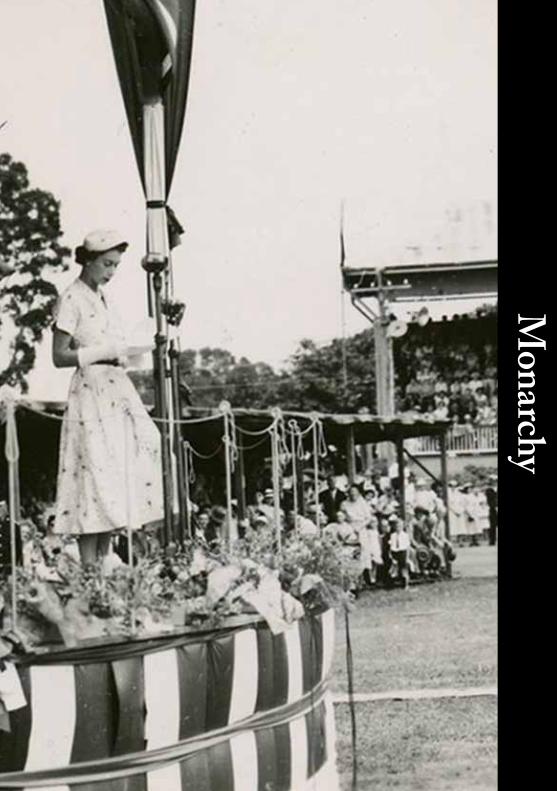
Monarchy
109 Olympic Britain
Sovereign says... The Kings’ and Queen’s speeches since 1908
The speeches made by sovereigns at the State Opening of Parliament offer a (usually) annual insight into the priorities of the Government of the day.
the kIng’s sPeeChes made in 1908 and October 1948 (a very brief speech in September 1948 opened Parliament’s shortest modern session) show striking differences with the 2012 Queen’s speech. Both the 1908 and 1948 addresses are dominated by foreign policy, while the latest Queen’s speech is largely domestic in focus. The 1908 speech, which opened by affirming the “friendly relations” between Britain and Germany, included archaic-sounding references to “Macedonian vilayets”, “Sultans” and “complications in Persia”. The 1948 speech was unsurprisingly concerned with repairing the “ravages of war” and addressing “a difficult situation” arising in Berlin. The 1908 and 1948 addresses sought to regulate hours of underground labour and nationalise the steel industry respectively, in contrast with the recent Queen’s speech, which promised to “reduce burdens on business”.
However, the addresses share several similarities. There were of similar length: 845 words in 1908, 1,003 in 1948 and 805 in 2012. Each expresses faith in international bodies: the International Peace Conference in 1908, the United Nations in 1948 and the G8 in 2012. Both the 1908 and 1948 speeches included policies for what is now known as ‘affordable housing’. Both the 1908 and 2012 programmes contained measures to protect children, while the 1948 objective of progressing “further towards paying our way abroad and restoring the prosperity of our country and the world” is similarly relevant today. The 2012 speech also pledges legislation to reform the House of Lords, the very issue which led to there being two State Openings in 1948.
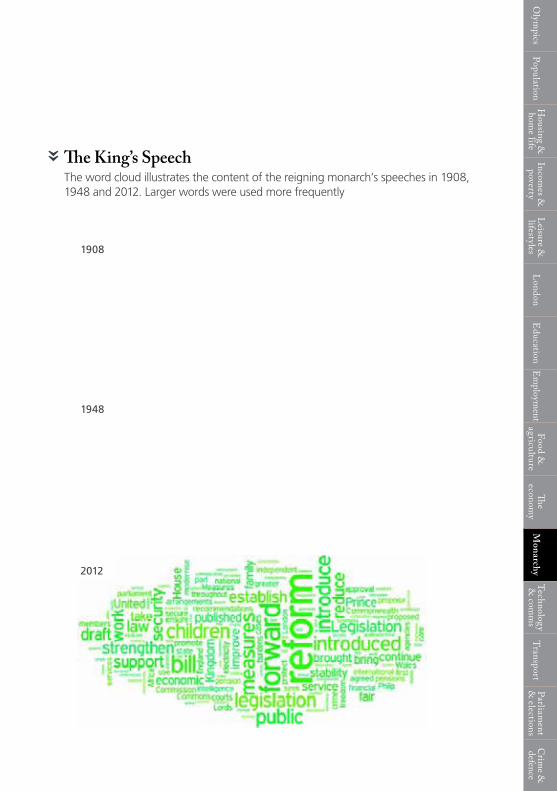
The King’s SpeechThe word cloud illustrates the content of the reigning monarch’s speeches in 1908, 1948 and 2012. Larger words were used more frequently
«O
lympics
PopulationH
ousing &
home life
Incomes &
poverty
Leisure &
lifestyles
London
Education
Em
ployment
Food &
agricultureTh
e econom
yM
onarchyTechnology &
comm
sTransport
Parliament
& elections
Crim
e &
defence
1908
1948
2012

111 Olympic Britain
Hatches, matches and dispatchesThe succession to the Crown
The marriage in April 2011 between the Duke and Duchess of Cambridge was watched by more than 24m people on the BBC and ITV.
the weddIng was followed by a power surge amounting to the equivalent of 1m kettles being boiled. However, public interest in Royal relationships goes further than fascination with the Duchess’s wedding dress and the Royal kiss. What for many are the most private of moments – births, deaths and marriages – are for the Royal family of great public interest, and in some cases matters of public policy.
For an heir to succeed to the Crown at all, the incumbent must either abdicate or die. The Queen succeeded to the throne following the death of her father, George VI. The King was much loved, and the queue to file past his coffin in Westminster Hall reached up to four miles, with over 300,000 people recorded as having filed past. George VI succeeded the throne on the abdication of his
brother, Edward VIII, whose marriage to a divorcee had been seen as unacceptable at the time.
There are also legal constraints on the succession to the Crown and on royal marriages. The monarch can neither be, nor be married to, a Roman Catholic. Under a 1772 Act of Parliament, all descendants of George II under the age of 25 can marry only with the consent of the Queen, unless they are children of princesses marrying into ‘foreign families’. And currently males take precedence over female siblings in the line of succession. Thus under the existing rules, where William and Kate’s first-born child fits in the line of succession would depend not only on its sex, but that of any sibling that follows. As it stands, a single female baby would become, on birth, third in line for the throne, behind

3.0
72
0%
5.3
52
21%
1.0
1.2
26
22Length of reign(years)
Number of marriages
Number of children
Age at death (years)
% dying of non-natural causes
«O
lympics
PopulationH
ousing &
home life
Incomes &
poverty
Leisure &
lifestyles
London
Education
Em
ployment
Food &
agricultureTh
e econom
yM
onarchyTechnology &
comm
sTransport
Parliament
& elections
Crim
e &
defence
Princes Charles and William. If she was followed by a younger brother, she would be bumped down to fourth in line.
These rules however may change. The Commonwealth Heads of Government have agreed to alter the rules to favour
gender equality, end the prohibition on an heir marrying a Catholic, and limit the scope of the 1772 Act. Legislation will be needed, guaranteeing that public interest in and debate on the monarchy will continue well after the Diamond Jubilee.
Stately statisticsThe charts compare English and British monarchs over the period 1066-1910 (black lines) with those since 1910 (blue lines)
All figures are averages

113 Olympic Britain
Monarch AirwaysRoyal visits since 1951
The Queen is the most well-travelled monarch in history. Since her accession to the throne in 1952, she has undertaken 263 official foreign visits.
OF THESE, 96 WERE COUNTED as state visits, which are visits to countries where the Queen is not recognised as the Head of State; the remaining 167 were visits to those Commonwealth countries where she is.
By contrast, her father, King George VI, made only three state visits: to France in 1938, and to Canada and the United States in 1939, before the outbreak of WWII. With the outbreak of war an imminent prospect, these visits were
7 to 25 (3)4 to 6 (13)2 or 3 (34)1 (62)not visited (141)

intended to shore up important strategic alliances, and foreign policy considera-tions remain a major factor in choosing locations for state visits. The UK’s ‘special relationship’ with the United States is evidenced by the Queen having visited the country five times, more than any other; at her most recent visit, in 2010, she laid a wreath at Ground Zero. The state visit to the Republic of Ireland in 2011, the first by a British monarch since the country’s separation from the UK in 1922, marked a symbolic normalisation of relations, following the signing of the Good Friday agreement in 1998.
The Queen has made 167 visits to the Commonwealth countries during her reign, travelling to 52 out of its 54 member states. She was in Kenya on 6 February 1952 when she learnt of her
accession to the throne. Canada, where she remains head of state, has seen the most of the Queen: she has visited various parts of the country on 25 occasions (including overnight stops).
The only occasion on which any outward visit has been interrupted was in 1974. On 7 February that year the Prime Minister Edward Heath sent a telegram to the Queen, who was in New Zealand for the Commonwealth Games, seeking her permission to dissolve Parliament so that a General Election could be held. The Queen returned to Britain from Australia on 28 February 1974, the day of the election, so that she could invite a party leader to form a Government. The Duke of Edinburgh completed the tour on her behalf.
Official air milesThe map shows the countries visited by the Queen and the number of times she has been to each
«
Olym
picsPopulation
Housing &
hom
e lifeIncom
es &
povertyL
eisure &
lifestylesL
ondonE
ducationE
mploym
entFood &
agriculture
The
economy
Monarchy
Technology &
comm
sTransport
Parliament
& elections
Crim
e &
defence

115 Olympic Britain
SourcesSovereign says...F.W.S. Craig ed., The Most Gracious Speeches to Parliament 1900-1974, 1975HL Deb 26 Oct 1948 cc1-5HL Deb 9 May 2012 cc1-3
Hatches, matches and dispatchesBBC News, Royal Wedding: In numbers, 2012
Monarch airwaysthediamondjubilee.org, Outward State Visits Since 1952, 2012thediamondjubilee.org, Commonwealth visits during The Queen’s reign, 2012www.royal.gov.uk, George VI, 2012

Technology & com
munications
117 Olympic Britain
Power upEnergy use
During the first decades of the 20th century, energy in Britain meant coal: in the home, industry, generation and on the rails.
In 1937 george orwell wrote:
“Practically everything we do, from eating an ice to crossing the Atlantic, and from baking a loaf to writing a novel, involves the use of coal, directly or indirectly. For all the arts of peace coal is needed; if war breaks out it is needed all the more.”
During the first half of the century total energy use increased in wartime and fell during strikes and the Depression, but it did not consistently change outside these times.
In 1948, 22m tonnes of coal was consumed in London, mainly burned for power or to heat homes. Annual consumption per head in the capital was around half a tonne for domestic use alone. London had 27 power stations at the time. This volume of coal burning and a prolonged period of cold, still weather led to the ‘Great Smog’ of December 1952, an accumulation of air pollutants
so dense that visibility was reduced to a few yards, and buses and ambulances were taken off the roads. It is thought to have caused around 12,000 premature deaths in the capital. This and other less severe smogs eventually led to the Clean Air Act 1956 and the removal of power stations from the capital, together with restrictions on what could be burned in the home.
Post-war economic expansion, coupled with the transport-driven demand for oil, saw total UK energy use increase by half in the two decades to 1967. By this point, coal use was in long-term decline, and oil was soon to supplant it as the country’s most important fuel. But oil’s predominance lasted only until the 1990s, by which point the replacement of coal-fired power capacity with new, more efficient gas stations resulted in natural gas becoming the most important source of energy.

Energy use increased more slowly from the 1970s, with dips in consumption during the oil shocks of the 1970s, recessions and the Miners’ Strike. Since 2005, the UK has seen its first sustained cut in energy consumption.
Though today the energy policy debate is focused on nuclear and renewables, fossil fuels (coal, oil and gas) continue to provide 90% of the UK’s energy, a figure largely unchanged from the late 1980s. 3-4% of the UK’s energy was met by renewables in 2010, and 6% by nuclear.
Boundless energy? Fossil fuels continue to supply 90% of the UK’s energy needs, though the relative importance of each has changed over the yearsThe chart shows UK inland fuel consumption in million tonnes of oil equivalent
«O
lympics
PopulationH
ousing &
home life
Incomes &
poverty
Leisure &
lifestyles
London
Education
Em
ployment
Food &
agricultureTh
e econom
yM
onarchyTechnology
& com
ms
TransportParliam
ent &
electionsC
rime &
defence
19080
50
100
150
200
250
mtoe
Coal dominates energy use. Dips in strikes and during the Depression. Increases in wartime.
Boom in gas and oil use fuels growth in total consumption
‘Dash for gas’ results in it taking over as the number one fuel
Total
Gas
Oil
Coal
1918 1928 1938 1948 1958 1968 1978 19981988 2008

119 Olympic Britain
Video killed the cinema’s starCinema attendance
No TV, no internet, no games console. What would you do for entertainment? In the 1940s, the answer was to go to the cinema.
already PoPular In the 1930s, cinema-going became a national obsession during the Second World War, with attendances rising by 50% between 1939 and 1942. There are two reasons normally given for this increase: people flocked to see the latest news from the War and, paradoxically, to seek escapism from it. High levels of employment and rising incomes also played a role.
Audiences peaked in 1946, with total cinema admissions reaching 1.6 billion, equivalent to every man, woman and child in the UK going to the pictures 33 times that year.
While remaining high by today’s standards, cinema attendances began to fall in the late 1940s and early 1950s. The decline was accelerated as television
ownership became widespread. In 1955, a third of households had a television; by 1970, over nine in ten owned one. The cinema could not compete, and admissions fell by 85% over the same period.
This trend continued into the early 1980s as another source of competition was introduced in the form of the VCR. Despite the release of such cinematic classics as Ghostbusters and Beverly Hills Cop, attendances reached their lowest point in 1984, when only 54 million tickets were bought: less than one trip per person over the whole year. Since then, audiences have recovered, helped by the introduction and expansion of multiplex cinemas. Total admissions in 2011 were 172m.
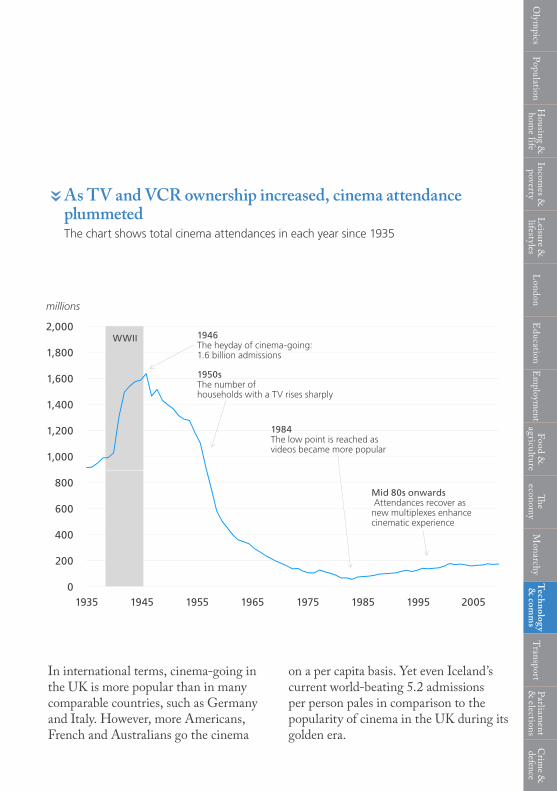
As TV and VCR ownership increased, cinema attendance plummetedThe chart shows total cinema attendances in each year since 1935
«
In international terms, cinema-going in the UK is more popular than in many comparable countries, such as Germany and Italy. However, more Americans, French and Australians go the cinema
on a per capita basis. Yet even Iceland’s current world-beating 5.2 admissions per person pales in comparison to the popularity of cinema in the UK during its golden era.
Olym
picsPopulation
Housing &
hom
e lifeIncom
es &
povertyL
eisure &
lifestylesL
ondonE
ducationE
mploym
entFood &
agriculture
The
economy
Monarchy
Technology &
comm
sTransport
Parliament
& elections
Crim
e &
defence
19350
200
400
600
800
1,000
1,200
1,400
1,600
1,800
2,000WWII 1946
The heyday of cinema-going: 1.6 billion admissions
1950sThe number of households with a TV rises sharply
1984 The low point is reached as videos became more popular
Mid 80s onwards Attendances recover as new multiplexes enhance cinematic experience
millions
1945 1955 1965 1975 1985 1995 2005

121 Olympic Britain
The other Diamond JubileeThe UK singles chart and music sales
Music charts in the UK began 60 years ago, when the New Musical Express magazine gathered a pool of 52 stores willing to report sales figures.
the results were aggregated into a Top 12, with Al Martino’s Here in My Heart awarded the first number one spot. The chart was expanded into a Top 20 on 1 October 1954, and rival publications began compiling their own charts in 1955.
In 1969 Record Retailer and the BBC commissioned the British Market Research Bureau (BMRB) to compile an official UK chart based on sales taken up to the close of trade on Saturday in a sample of record shops. The sales diaries were translated into computer readable punch cards and a computer compiled the chart on Monday, ready for BBC broadcast on Tuesday.
Over the next 30 years the contract for compiling the official UK chart was awarded to various companies and is currently compiled by The Official Charts Company on behalf of the British record industry. To qualify for inclusion, a track
must be available in an eligible format. This has grown over time to include cassettes, CDs, DVDs, and MiniDiscs as well as traditional vinyl records. From 2007, downloaded music became eligible to chart, effectively turning the singles chart into a ‘songs’ chart. Once downloads were included in the charts, Snow Patrol’s Chasing Cars reached 108 weeks on the UK chart, a record bettered by only one single in chart history, My Way, by Frank Sinatra, with 124 weeks.
Although illegal sharing of music online has certainly had an impact on music sales, the collapse in the sale of singles largely predates this: between 1997 and 2003, annual trade deliveries of singles fell by 57%, from 87m to 36m. Indeed, the internet has reinvigorated the market, and retail sales have since risen from 31m in 2003 to 178m in 2011. As late as 2004, CDs accounted for three-quarters of singles sales, but downloaded music has since come to dominate, and today
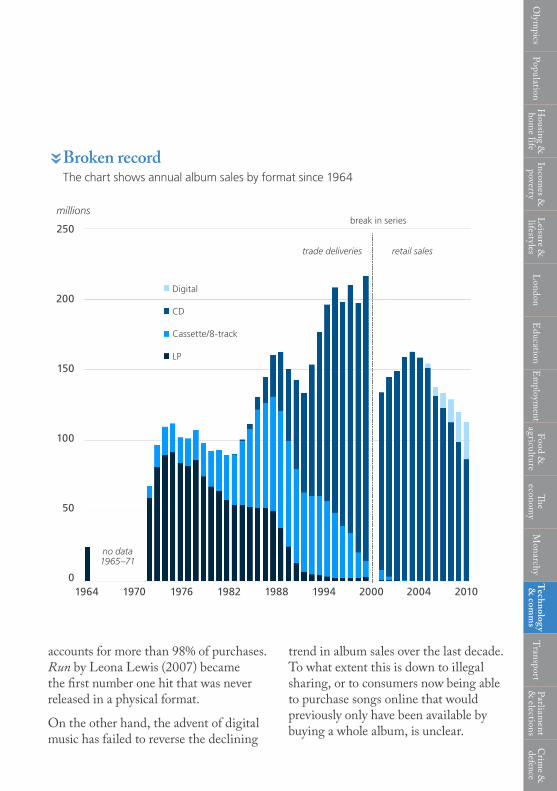
«
accounts for more than 98% of purchases. Run by Leona Lewis (2007) became the first number one hit that was never released in a physical format.
On the other hand, the advent of digital music has failed to reverse the declining
trend in album sales over the last decade. To what extent this is down to illegal sharing, or to consumers now being able to purchase songs online that would previously only have been available by buying a whole album, is unclear.
Olym
picsPopulation
Housing &
hom
e lifeIncom
es &
povertyL
eisure &
lifestylesL
ondonE
ducationE
mploym
entFood &
agriculture
The
economy
Monarchy
Technology &
comm
sTransport
Parliament
& elections
Crim
e &
defence
Broken recordThe chart shows annual album sales by format since 1964
19640
50
100
150
200
250
millions
Digital
break in series
trade deliveries retail sales
no data 1965–71
CD
Cassette/8-track
LP
1970 1976 1982 1988 1994 2000 2004 2010

123 Olympic Britain
Letters of thanks, letters from banksThe postal service
Royal Mail delivers post to every resident of the UK, processing and delivering items to 29m addresses, six days a week.
Its hIstory as a postal service for the public dates from 1635, when Charles I opened up a service previously reserved for the monarch only, hence its name.
In 1908, posting a letter was about as cheap as it ever had been: just one old
penny (around 33p in today’s prices) for national delivery of any letter up to 4oz. Major towns received six or more posts, meaning correspondents could exchange multiple letters in the same day. In the first ever instance of the government
19200
5
10
15
20
25
billions
1930 1940 1950 1960 1970 1980 1990 2000

The National PostbagThis chart shows the number of items sent through the Royal Mail in each fiscal year, excluding parcels
«
nationalising a commercial industry, the telegraph system had been brought under the control of the Post Office in 1870, and it claimed a monopoly on other com-munications technology as they became available. By 1914, the Post Office employed over 250,000 people. With revenues of £32m, it was Britain’s biggest enterprise and the world’s largest single employer. In 1920, 5.6bn items were sent through the Royal Mail, excluding parcels.
In 1969, the Post Office was nationalised, and its status changed from that of a government department, represented in Government by a Cabinet Minister, to a statutory corporation. The Postal Services Act 2000 turned the Post Office into a wholly owned public limited company, which became formally independent of Royal Mail in April 2012. In 2006, the
UK postal service market was opened up to other operators, ending a state monopoly that was almost four centuries old.
As the postal service has been restructured and exposed to competition, the tension between its role as a provider of a public service, and as a profitable business, has been thrown into high relief. The costs of sustaining a universal service have meant it continues to rely on government support. Its challenges are compounded by increasing rivalry from digital communications. By 2005 the number of letters sent peaked at 20.2bn, and has since declined steadily to 16.6bn in 2010. Meanwhile, despite government subsidy to maintain the rural network, the number of Post Offices has fallen from 18,000 in 2000 to 12,000 a decade later, the lowest number since the 1860s.
Olym
picsPopulation
Housing &
hom
e lifeIncom
es &
povertyL
eisure &
lifestylesL
ondonE
ducationE
mploym
entFood &
agriculture
The
economy
Monarchy
Technology &
comm
sTransport
Parliament
& elections
Crim
e &
defence
125 Olympic Britain
SourcesPower upMoT, Digest of energy statistics, various yearsDECC/DTI/DoE, Digest of UK Energy Statistics, various yearsMoP, statistical digest, various yearsMoFP, statistical digest, various yearsCSO, Annual abstract of statistics, 1953DECC, Historical Coal Data: Coal Availability and Consumption, 1853 to 2010G. Orwell, Down the Mine, The Road to Wigan Pier (part 1, ch. 2), 1937
Video killed the cinema’s star BFI, Statistical Yearbook 2011BFI, UK box office 2011
The other Diamond JubileeBritish Phonographic Industry, Yearbook and Statistical Handbook, various years
Letters of thanks, letters from banksD. Campbell-Smith, Masters of the Post, 2011The British Postal Museum and Archive

Transport

127 Olympic Britain
Are we nearly there yet?Journey times by car and rail
If it is completed, the new high-speed rail service, HS2, will be the fastest rail service in the UK, promising to reduce the journey time between London and Birmingham to less than one hour.
LONDON CAN CURRENTLY BE reached in 1 hour 12 minutes from Birmingham New Street, a journey that would have taken around an hour longer in both 1908 and 1948. Despite the development of steam locomotion capable of speeds approaching those of modern trains (the LNER Mallard reached 125mph in 1938), the railway infrastruc-ture was unable to support safe operation at such velocity and, until the mid-1970s, the British railway speed limit remained at 100mph.
Nonetheless, the train remained the only sensible means of travelling at speed from Birmingham to the 1908 Games. If the most well-heeled residents of Birmingham had decided to drive to White City, it would have taken them more than five hours in a car, assuming
they stuck to the speed limit of 20mph. By the time of the 1948 Games, the car was in more direct competition with the train. The Ford Anglia, though it cost almost as much as annual average earnings, was capable of 60mph: journey times to the Games from Birmingham were around three and a half hours.
Since then, developments in manufacturing and engineering have continued to increase the speed and reduce the cost of cars. The Ford Focus now costs roughly 60% of average annual earnings and its top speed is almost twice that of the 1948 Anglia. Meanwhile, until HS2 is completed (provisionally, this will be in 2026), journey times on the train to Birmingham will remain similar to what they were in 1976.

Train fleetThe chart shows the fastest journey time between London and Birmingham in each year
«O
lympics
PopulationH
ousing &
home life
Incomes &
poverty
Leisure &
lifestyles
London
Education
Em
ployment
Food &
agricultureTh
e econom
yM
onarchyTechnology &
comm
sTransport
Parliament
& elections
Crim
e &
defence
But whether the car has now become a sensible way to travel to the Games remains open to question, especially given the location of the Olympic park in the south east of the city. The average speed
for cars at peak time through central London is just 13mph, a figure that is likely to be considerably slower with the Olympic lanes in place.
1910 19701920 19801930 19901940 20001950 20101960 202000:00
00:20
00:40
01:00
02:00
01:20
02:20
01:40
02:40
journey time (hours and minutes)

129 Olympic Britain
Plight trainThe rail network and passenger journeys
Passenger transport by rail has its origins in 1820s Northern England, spurred by the work of industrial engineers like George Stephenson, who developed the first locomotive capable of travelling faster than galloping horses.
the ImPortanCe of the railways as a public good, or perhaps as a means to facilitate the movement of labour to growing industrial centres, was recognised early on. An 1844 Act of Parliament required every route to run a basic (i.e. third-class), affordable service.
Between 1848 and 1899 the length of the railway in Great Britain tripled, from less than 5,000 miles to over 18,000 miles. The growth in infrastructure was accompanied by rising numbers of passengers. The 28m journeys taken in 1844 had increased to 288m by 1870, and 1.4bn by 1908.
Though the growth infrastructure had slowed by the start of the 20th century, the rail network in 1908 and 1948 would have reached from London to Perth (Western Australia) and back, stretched out. But by 2012, the intrepid passenger
would have been stranded on the coast of Western Australia. The major catalyst for this paring back of the network was the publication in 1963 of the Beeching Report, which concluded that:
“… after the post-war growth of competition from road transport, it is no longer socially necessary for the railways to cover such a preponderant part of the total variety of internal transport services as they did in the past.”
The report accelerated route closures, and within seven years, the network was a third shorter than it had been in 1963, and 50% of stations were put out of service, including Chorlton-cum-Hardy, Trouble House Halt and Windmill End.
The 20th century ended, unexpectedly, with a boom in rail travel that has continued into the 21st. More journeys

Track and travelThe chart shows the total length of the rail route and the number of passenger journeys in Great Britain
«O
lympics
PopulationH
ousing &
home life
Incomes &
poverty
Leisure &
lifestyles
London
Education
Em
ployment
Food &
agricultureTh
e econom
yM
onarchyTechnology &
comm
sTransport
Parliament
& elections
Crim
e &
defence
are now being taken than at any time since 1927, and the priority afforded to the motor car in transport policy has receded. The high-speed line from London to Birmingham, if it goes ahead, will represent the largest investment in overland rail since the Victorian era, and a
small number of the branch routes closed under Beeching have been reopened. The shadow of Beeching’s axe may no longer be cast so ominously over the UK’s branch lines, but a return of the slow train from Oswestry to Buttington still looks like a distant prospect.
1900 1920 1940 1960 1980 2000
0 0
5 500
10 1,000
15 1,500
20 2,000
25 2,500
rail route length (thousand miles) passenger journeys (millions)
1948Railways nationalised
1963Beeching Report published
1994Railways privatised
131 Olympic Britain
Look out in the blackoutRoad traffic accidents
The first car crash is reputed to have occurred in a steam-powered vehicle in 1771; but data on the number of accidents and fatalities on British roads is available only for the period since 1926.
ALTHOUGH THE NUMBER of vehicles registered for use on the roads has increased 23-fold since then, the number of accidents, and people killed, has more than halved.
The wartime blackout, when regulations required streetlights to be turned off and traffic signals and headlights to be dimmed, led to a dramatic increase in road casualties. The King’s surgeon, writing in the British Medical Journal in 1939, complained that by “frightening the nation into blackout regulations, the Luftwaffe was able to kill 600 British citizens a month without ever taking to the air”. The number of deaths peaked in 1940 at 9,169. One person died that year for every 200 vehicles on the road; today the figure is one for every 20,000.
Government policy on road safety in the early years of the car was erratic. A state of parochial caution existed until
1896, requiring cars to be preceded by a pedestrian with a flag and to travel at no more than 2mph in built-up areas. But by 1930, the Government was legislating for anarchy. Arguing in rather circular fashion that year for an abolition of speed limits for cars (which did indeed occur), the Transport Minister Herbert Morrison pointed out that:
“… there was not one of their Lordships who observed the speed limit [and] it is probably true to say that there is not one Member of the House of Commons who observes the speed limit. I venture to say that as legislators we are not entitled to enforce and to continue speed limits.”
The outright abolition of speed limits lasted only four years, but it was not until 1965 that a general upper limit of 70mph was applied to all roads. This, together with the introduction of drink-driving limits (1967), coincides with the

Olym
picsPopulation
Housing &
hom
e lifeIncom
es &
povertyL
eisure &
lifestylesL
ondonE
ducationE
mploym
entFood &
agriculture
The
economy
Monarchy
Technology &
comm
sTransport
Parliament
& elections
Crim
e &
defence
The rate of fatalities and injuries from motor cars has declined steadily since the end of WWIIThe chart shows the number of accidents causing injury per 100 registered vehicles and the number of fatalities per 1,000 vehicles
«
peacetime peak in road fatalities, of 7,985 in 1966. These regulations, together with compulsory seatbelt wearing (introduced in 1983 for front-seat and 1991 for rear-seat passengers), improvements in highways engineering and junction design, clearer hazard marking and
developments in car safety technology have all contributed in varying degrees to the steady decline in road casualties over the past four decades. For the first time since records began, fewer than 2,000 people were killed on the roads in 2010.
6
8
10
Accidents per 100 registered vehicles
Fatalities per 1,000 registered vehicles
0
2
4
1926 1936 1946 1956 1966 1976 1986 1996 20061926
0
2
4
6
8
10
19861936 19961946 20061956 1966 1976
Personal injury accidents per 100 registered vehicles
Fatalities per 1,000 registered vehicles

133 Olympic Britain
Four wheels good, two legs badTransport and travel in the UK
Since 1949 the total distance travelled by passengers on all modes of transport within Great Britain has increased by over 275%.
where 60 years ago the average person would journey 4,600km around Britain in a year (the equivalent to Istanbul and back), today the figure is close to 13,000km (a round trip to Karachi).
It is the rise of the motor car that plays the central role in this story. During the 20th century, it went from being a seldom-seen toy of the rich to a necessity of everyday life. The 8,000 or so private cars licensed in the early years of the century multiplied to 2 million in 1949, 10 million in 1970, and 27m by 2012. Today, we travel four times as far as we did 60 years ago within the UK alone, thanks largely to the car.
As the popularity of the car has risen, so usage of other forms of transport has
declined or stagnated. In particular bus and coach use has nearly halved since 1949, with privatisation in the 1980s doing little to address the downward trend. Another casualty over the last 60 years has been the bicycle. In the early 1950s, over 20bn passenger kilometres were travelled on bicycle: 476km per person per year. Today, the figure is closer to 5 billion, or 87km per person.
Like car transport, domestic air travel has become more affordable, though it still accounts for just 1% of passenger kilometres travelled in Britain.
Whether it’s the price of fuel or exasperation with traffic (we spend 10 days a year in our cars, on average, our love affair with the car seems to be coming to an end. From 1990, the rate of

Olym
picsPopulation
Housing &
hom
e lifeIncom
es &
povertyL
eisure &
lifestylesL
ondonE
ducationE
mploym
entFood &
agriculture
The
economy
Monarchy
Technology &
comm
sTransport
Parliament
& elections
Crim
e &
defence
Pedal to the metalThis chart shows the total distance travelled by people living in Britain in 1949 and 2010, broken down by mode of transport
«
increase in car travel slowed down as the number of cars on the road approached one per household; and for the first time ever kilometres travelled by car fell
between 2007 and 2008. Meanwhile, passenger kilometres travelled by rail have increased by over 60% since 1990.
0
1949 2010
100
200
300
600
400
700
500
800
900
Buses & coachesBuses & coaches
Cars, vans & taxis Cars, vans & taxis
Other road
Other road
Rail
Rail
Air
Air
billion passenger kilometres
135 Olympic Britain
Gridlock in Great BritainRoads and car ownership
The mass production of the Model-T Ford from 1908 is often viewed as the dawn of the motorised society.
however, the BegInnIng of mass motoring in Britain was perhaps best signalled by the opening of the M1, the first full-length motorway, 50 years later.
The road network in 1914 was only 28% shorter than it is today, but no official attention was paid to the state of roads in Britain until after WWI. The first dedicated Roads Department of the Ministry of Transport was created in 1919, and over the next decade, roads were systematically surveyed and a ‘Road Fund’ established to provide finance for the repair of particularly bad stretches.
Private car ownership grew slowly until after WWII, but accelerated following the end of petrol rationing. By the late 1950s car travel had become the preferred mode of transportation. Congestion was a recognised issue by the early 1960s, but the widely accepted solution was to build more roads.
This changed in 1963 with the publication of the Buchanan Report, Traffic in Towns. For the first time, the fact of unrestrained growth in car ownership was factored into town planning and urban design. The radial design of roads around towns, without heavily restricting access to town centres, has been the norm since then and is perhaps best symbolised by the M25, completed in 1986.
Various subtle modifications have been made to the model of congestion control in Britain since Buchanan, including the introduction of parking charges in cities in the early 1970s and the pedestrianisa-tion of some town centres. Congestion charging was introduced in London in the 2003, but this has not been widely adopted.

Olym
picsPopulation
Housing &
hom
e lifeIncom
es &
povertyL
eisure &
lifestylesL
ondonE
ducationE
mploym
entFood &
agriculture
The
economy
Monarchy
Technology &
comm
sTransport
Parliament
& elections
Crim
e &
defence
The open road: in 1923, there were five cars for every kilometre of major road; today, the figure is 500, though the quality of the road network is vastly improvedThe chart shows the number of licensed private cars and the length of major roads (motorways plus A and B-roads) in Great Britain
Note: A minor revision was made to the length of major roads from 1992 onwards
«
1908 1918 1928 1938 1948 19681958 19881978 1998 2008
0 0
10 10
20 20
30 30
40 40
50 50
60 60
thousand kms
Maj
or r
oads
and
mot
orw
ays
Priv
ate
cars
lice
nsed
millions
1923First government sponsored road repair project
1958First strech of M1 opened
1986M25 completed
Major roads
Motorways
137 Olympic Britain
SourcesAre we nearly there yet?ESDS SN 6384, The speed of trains in Britain, 1910-2008D. Culshaw and P. Horrobin, The Complete Catalogue of British Cars 1895-1975, 1997Collins Gem, Classic Cars, 1996W. Plowden, The Motor Car and Politics. 1896-1970, 1971www.thetrainline.com, 2012
Plight trainDfT, RAI0101 Rail: Length of national rail route at year end and passenger travel by national railway and London Underground, 15 December 2011D.L. Munby, Inland Transport Statistics Great Britain, 1900-1970, 1978B.R. Mitchell, British Historical Statistics, 1988P. Bagwell and P. Lyth, Transport in Britain: From Canal Local to Gridlock 1750-2000, 2002
Lookout in the blackoutDfT, Reported Road Accidents, 1950-2010DfT, Annual Abstract of Statistics, 1926-1950
Four wheels good, two legs badDfT, TSGB0101 Passenger transport by mode, 15 December 2011DfT, TRA0201 Road traffic by vehicle type in Great Britain, annual from 1949, 9 February 2012DfT, RAI0101 Rail: Length of national rail route at year end and passenger travel by national railway and London Underground, 15 December 2011British Road Federation, British Road Statistics, 1959
Gridlock in Great BritainDfT statistics, Licensed vehicles by tax classDfT statistics, Road lengths by road type
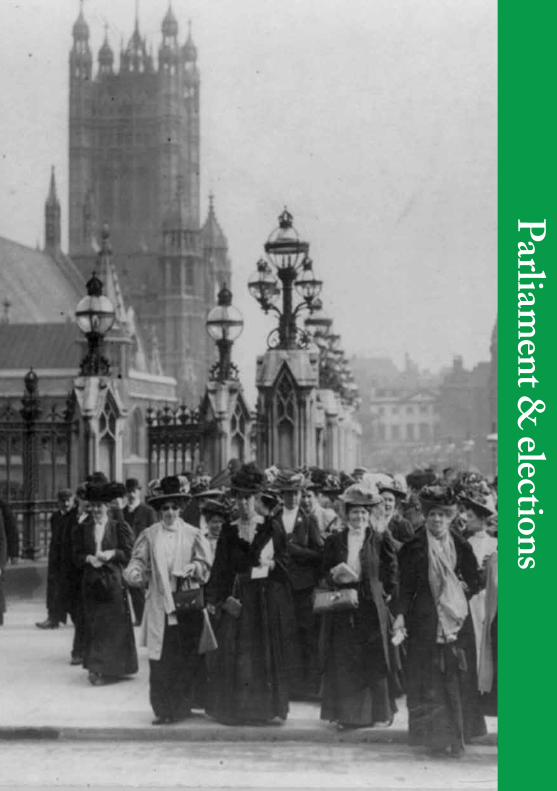
Parliament &
elections

139 Olympic Britain
Influence and indifferenceElectoral participation and the right to vote
“We are here, not because we are law-breakers; we are here in our efforts to become law-makers.”Emmeline Pankhurst, 1908
wIth turnout at the three general elections in the 21st century reaching post-war lows, disengagement with politics has become a cause for concern. But at the start of the 20th century, the right to vote was itself a matter of fierce debate. In 1908, the franchise was limited to men over 21 who ‘paid rates’ or owned property: about 60% of the adult male population.
The Representation of the People Act 1918 extended the franchise so there was no longer a property qualification for men. More famously, perhaps, it extended the vote to women at parliamentary elections, though this was limited to those over 30, and the property qualification still applied to them. Full electoral equality was not achieved until 1928, and the franchise as we know it today did not emerge until 1969, when the voting age was reduced from 21 to 18. In the meantime, additional votes granted to certain business owners, who could vote twice if their premises was in
a different constituency, and university graduates, who could vote for a second MP in one of 12 ‘university constituen-cies’, were abolished in 1948.
Today, as hard-fought battles for universal suffrage drift from living memory, concern has turned to who does and doesn’t vote, and why. Analysis suggests that Britain is divided into ‘voters’, who tend to be older, from rural areas and relatively wealthy, and ‘non-voters’, who tend to be younger, urban and relatively worse off. This economic divide gives the lie to the notion that people fail to vote out of contentment with the status quo; but beyond this, the question of why people are less inclined to vote is hard to answer. The decline in turnout mirrors a broader decline in civic participation, falling trust in politicians, and a convergence of the main parties to the political centre. Turnouts are low when the margin of victory is high, suggesting people are more inclined to vote if the result is uncertain.

Despite our preoccupation with voter turnout, questions about who should qualify to vote have not disappeared entirely. The 2012 Queen’s speech included a Bill to move from household to individual voter registration. Will this erect another barrier to electoral participation among those already marginalised? What will be the outcome
of recent debate on prisoner voting? Should the franchise be extended to 16 and 17 year-olds when fewer than half of those aged 18-24 currently vote in general elections? Though they are unlikely to bring modern-day suffragists to the streets, questions about the limits of the franchise remain fundamental to any democracy.
Mass participation?The chart shows the electorate (% of the population eligible to vote) and turnout (% of eligible population choosing to vote) at UK General Elections since 1900
«O
lympics
PopulationH
ousing &
home life
Incomes &
poverty
Leisure &
lifestyles
London
Education
Em
ployment
Food &
agricultureTh
e econom
yM
onarchyTechnology &
comm
sTransport
Parliament
& elections
Crim
e &
defence
2010
2005
2001
1997
1992
1987
1983
1979
1974
1974
1970
1966
1964
1959
1955
1951
1950
1945
1935
1931
1929
1924
1923
1922
1918
1910
1910
1906
1900
0%
10%
20%Electorate
Turnout
30%
40%
50%
60%
70%
80%
90%
100%
The 1918 Act added 13.7m women and 5.3m men to the electorate. Had women been given the vote on equal terms with men, as they eventually were in 1928, they would have been in the majority, due to loss of men during the war.
100 MPs stood unopposed in the 1918 General Election, resulting in an exceptionally low turnout.
In 2001, turnout fell below 70% for the first time since 1918. It has not risen above that level since.
Extending the vote to 16-17 year-olds would add around 1.3m to the electorate. 72%
of the population would then be able to vote, as opposed to
70% presently.
141 Olympic Britain
Partied outPolitical party membership
Mass political party membership became a phenomenon in Britain only after 1945.
the laBour Party first formed in 1900, but only started collating its membership figures from 1928. The Conservative Party is a less centralised affiliation of local associations and estimates of total membership are available only sporadically. There are no firm figures for membership of the Conservative Party prior to 1945, but it was probably 1m to 1.5m during the inter-war years.
Membership of political parties has been declining from its peak in the early 1950s. At that time, there were around 2.8m Conservative Party and 1m Labour Party members. Members of trade unions affiliated to the Labour Party and of the Socialist and Cooperative parties boosted
the total Labour Party movement by 5m to 6m in the years after 1945 until the early 1990s, since when they started to decline to around 3.5m today.
Changes in political party membership are just one indicator of civic participation. Another, which has also been in decline, is church attendance. In the early 1960s, typically around 2m people attended weekly Catholic Mass in England and Wales; and there were a similar number taking communion at Church of England Easter Sunday services. The latest data show both these figures have fallen below 1m.
By contrast, some membership organisations, particularly those associated with the environment, have
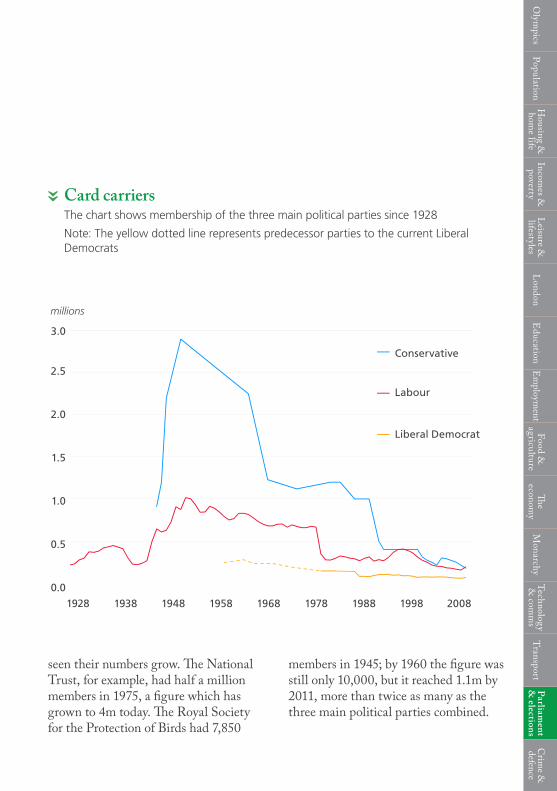
Card carriersThe chart shows membership of the three main political parties since 1928
Note: The yellow dotted line represents predecessor parties to the current Liberal Democrats
«O
lympics
PopulationH
ousing &
home life
Incomes &
poverty
Leisure &
lifestyles
London
Education
Em
ployment
Food &
agricultureTh
e econom
yM
onarchyTechnology &
comm
sTransport
Parliament
& elections
Crim
e &
defence
Conservative
Labour
Liberal Democrat
1928
0.0
0.5
1.0
1.5
2.0
2.5
3.0
millions
1938 1948 1958 1968 1978 1988 1998 2008
Labour
Conservative
Liberal Democrat
seen their numbers grow. The National Trust, for example, had half a million members in 1975, a figure which has grown to 4m today. The Royal Society for the Protection of Birds had 7,850
members in 1945; by 1960 the figure was still only 10,000, but it reached 1.1m by 2011, more than twice as many as the three main political parties combined.
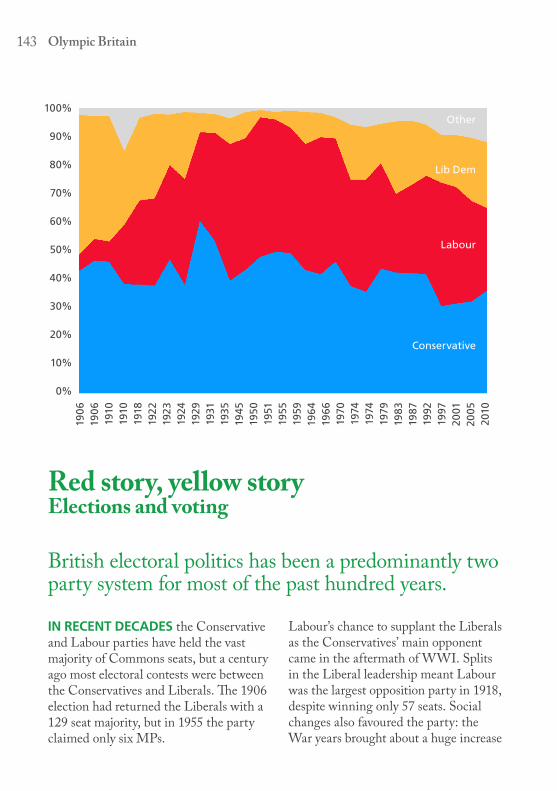
143 Olympic Britain
Red story, yellow storyElections and voting
British electoral politics has been a predominantly two party system for most of the past hundred years.
IN RECENT DECADES the Conservative and Labour parties have held the vast majority of Commons seats, but a century ago most electoral contests were between the Conservatives and Liberals. The 1906 election had returned the Liberals with a 129 seat majority, but in 1955 the party claimed only six MPs.
Labour’s chance to supplant the Liberals as the Conservatives’ main opponent came in the aftermath of WWI. Splits in the Liberal leadership meant Labour was the largest opposition party in 1918, despite winning only 57 seats. Social changes also favoured the party: the War years brought about a huge increase
Conservative
Labour
Lib Dem
Other
0%
10%
20%
30%
40%
50%
60%
70%
80%
90%
100%
2010
2005
2001
1997
1992
1987
1983
1979
1974
1974
1970
1966
1964
1959
1955
1951
1950
1945
1935
1931
1929
1924
1923
1922
1918
1910
1910
1906
1906
Olym
picsPopulation
Housing &
hom
e lifeIncom
es &
povertyL
eisure &
lifestylesL
ondonE
ducationE
mploym
entFood &
agriculture
The
economy
Monarchy
Technology &
comm
sTransport
Parliament
& elections
Crim
e &
defence
in trade union membership, while the extension of the franchise in 1918 meant many new working class voters joined the electorate. Labour formed minority governments in 1924 and 1929 and achieved its first parliamentary majority in 1945 in a landslide election victory.
The Conservatives remained the primary political force throughout the inter-war years and the largest party in the Commons, with the exception of the 1929-31 Parliament. Labour’s rise corresponded to the supplanting of religion by class as the main social factor in determining party support, though significant numbers of working class voters evidently still backed the Conservatives. During the 1950s almost half of votes cast went to the Conservatives, from a largely working class electorate.
Together the Conservatives and Labour received around 90% of the vote in general elections between 1945 and 1970. In 2010, just 65% of the vote went to these two parties. Since 1974 the Liberals have polled around 20% of the vote, but with little reward in terms of seats.
Conservative success in the 1979 election was the first of four consecutive general election victories. The party’s vote share in these years was some six or seven percentage points lower than in the 1950s, and yet in 1983 and 1987 delivered larger majorities. Likewise Labour’s landslide win in 1997 was achieved on a 43% share, similar to what it received when it lost the 1970 election, and well below vote shares secured in the immediate post-war years. This disparity between vote share and the share of rep-resentation in the Commons is due partly to the rise of other parties, which together take lots of votes but very few seats.
Best of shareThe chart shows the share of the vote received by parties at UK General Elections
«

145 Olympic Britain
Representatives of societyBackground and characteristics of MPs
The social make-up of those elected to the House of Commons has changed over the last 100 years.
In terms of gender, ethnicity and occupation, MPs have become more diverse. But they have become less varied in terms of their educational background, and possibly the extent to which they represent the changing world outside Westminster.
The first female was elected in 1918. However, women were less than 10% of all MPs until 1997, when the election of 120 women brought the proportion in the Commons to 18%, double the 9% pre-election tally. After a slight dip in 2001, the number of women MPs has continued to grow; 143 women MPs were elected in the 2010 General Election, 22% of the total.
Ethnically, the House of Commons has become more diverse. Until 25 years ago, MPs had largely been white, although a small number of MPs who would probably now be classed as black and minority ethnic were elected before
1900. The first contemporary black and minority ethnic MPs were elected in 1987 and the number has grown since then. Following the 2010 General Election there were 27 minority ethnic MPs, 11 Conservative and 16 Labour.
Over 75% of current MPs are graduates; in the period 1918 to 1945, around 40% were. There have been increases across all parties, but particularly for Labour MPs. Before 1945, less than 20% of Labour MPs were graduates. This rose to 32% in 1945, and steadily after that to stand at 72% by 2010.
To an extent, the occupational composition of the House of Commons changes with the electoral fortunes of the parties. Former teachers and manual workers have been more likely to be Labour MPs than those with a business or legal background, who are more likely to be Conservative.

Olym
picsPopulation
Housing &
hom
e lifeIncom
es &
povertyL
eisure &
lifestylesL
ondonE
ducationE
mploym
entFood &
agriculture
The
economy
Monarchy
Technology &
comm
sTransport
Parliament
& elections
Crim
e &
defence
Careers, politiciansMPs by selected occupations and party 1951 to 2010
«
The number of manual workers among MPs is lower now than in the immediate post-war years when, typically, one-third of Labour MPs were in this group; today, it is less than one in 10. In 1945 there were 45 Labour MP ex-miners, in 2010 there were six. Fewer MPs now have a legal background compared with 50 and 100 years ago.
As the numbers of MPs with manual and legal backgrounds has fallen, so the number with a political background has increased. In 2010, 14% of MPs from the three main parties had previously been politicians or political organisers, compared to around 3% up to 1979.
Liberal Democrat
Labour
Conservative
051 8364 9774 10 51 8364 9774 10 51 8364 9774 10 51 8364 9774 10
20
40
60
80
100
140
120
Barristers & solicitors
Teachers & lecturers
Manual workers
Politician/political organiser
Labour
Conservative
Liberal Democrat
147 Olympic Britain
Ancestral make-upComposition of the House of Lords
The House of Lords has been affected by changes to both its powers and membership over the last 100 years.
and the reform agenda is still alive today with proposals to introduce directly elected members to the Lords.
Historically, membership of the House of Lords was hereditary, with the exception of a relatively small number of Bishops and Law Lords. Following the Life Peerages Act 1958 an increasing number of peers were non-hereditary and it became possible for the first time for women to be members in the Lords. The House of Lords Act 1999 ended the voting rights of all but 92 hereditary peers, reducing the potential membership from over 1,200 to less than 700.
The political composition of the second Chamber has changed, although any interpretation of relative party strength should take account of the fact that peers’ attendance can vary. At the start of the 20th century 85% of the potential members of the Lords were
Conservative or Liberal Unionists affiliated to the Conservatives. In 1945 just over half the Lords’ membership was Conservative. By 2012 the parties are more evenly represented; Labour is the largest single party with just under 30% of the membership. 27% of peers are Conservative, and non-party Crossbenchers (23%) and Liberals (12%) comprise most of the rest.
Until 1958 there were no women peers. Their number rose slowly, and by 1980 they comprised 5% of peers. The proportion jumped from 9% to 16% in 1999 when most hereditary peers (largely men) were removed and has continued to increase since, to reach 22% in 2012, similar to that in the House of Commons. There is no official data, but around 5% of Peers are estimated to be minority ethnic.
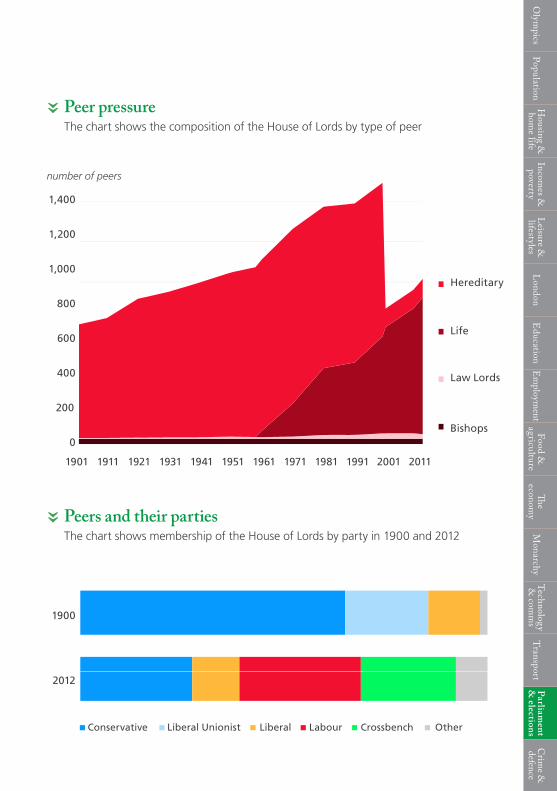
Peer pressureThe chart shows the composition of the House of Lords by type of peer
Peers and their partiesThe chart shows membership of the House of Lords by party in 1900 and 2012
««
Olym
picsPopulation
Housing &
hom
e lifeIncom
es &
povertyL
eisure &
lifestylesL
ondonE
ducationE
mploym
entFood &
agriculture
The
economy
Monarchy
Technology &
comm
sTransport
Parliament
& elections
Crim
e &
defence
Hereditary
Life
Law Lords
Bishops
1901 1911 1921 1931 1941 1951 1961 1971 1981 1991 2001
0
200
400
600
800
1,000
1,200
1,400
number of peers
2011
Hereditary
Life
Law Lords
Bishops
Conservative Liberal Unionist Liberal Labour Crossbench Other
1900
2012
Conservative Liberal Unionist Liberal Labour Crossbench OtherConservative Liberal Unionist Liberal Labour Crossbench Other

149 Olympic Britain
SourcesInfluence and indifference C. Rallings and M. Thrasher, British Electoral Facts 1832-2006, 2007House of Commons Library, RP10/36, General Election 2010
Partied outHouse of Commons Library, SN/SG/5125, Membership of UK political partiesChurch of England Research and Statistics, Provisional Attendance and Affiliation 2010Church of England, Church Statistics 2009/10R. Currie et al, Churches and Churchgoers: Patterns of Church Growth, 1700-1970, table 6.3,British Religion in Numbers
Red story, yellow storyC. Rallings and M. Thrasher, British Electoral Facts 1832-2006, 2007D. Butler and D. Stokes, Political Change in Britain, 1974House of Commons Library, RP10/36, General Election 2010
Representatives of societyHouse of Commons Library, Election Statistics: UK 1918-2011 (forthcoming)D. Butler et al, The British General Election of ... (1951 to 2010)M. Stenton & S. Lees, Who’s Who of British Members of ParliamentJ.F.S. Ross, Elections and Electors, 1955
Ancestral make-upD. Butler & G. Butler, British Political Facts, 2011www.parliament.uk, Lords by party and type of peerage, at 11 June 2012 House of Lords Library, LLN 2012/005, Women in the House of LordsHouse of Commons Library, SN/SG/1156, Ethnic Minorities in Politics and Government
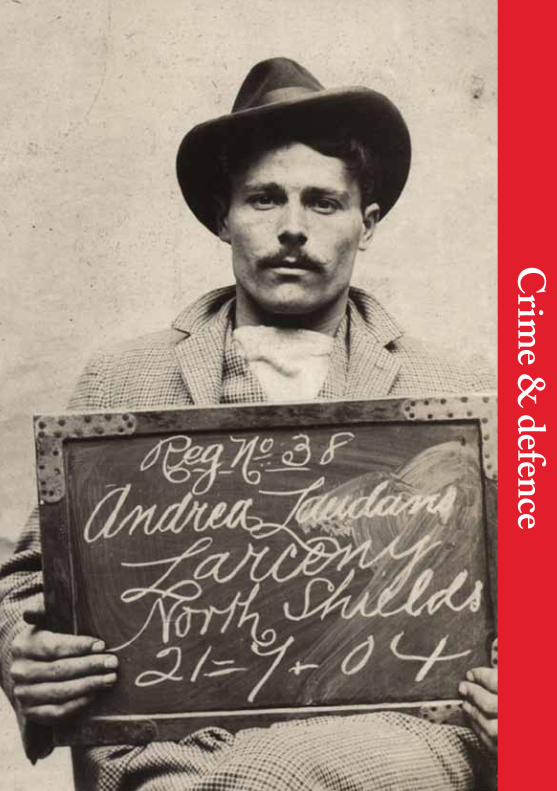
Crim
e & defence
151 Olympic Britain
Reforming prisons, reforming prisonersThe prison population
The end of the 19th century marked the transition towards a modern penal policy as the Victorian prison system was reformed.
PrIsons were to Be viewed not just as establishments for punishment but were to consider prisoners’ needs and the benefits of rehabilitation.
The recognition that young offenders should be treated separately from adults led to one such reform. The Prevention of Crime Act 1908 introduced separate establishments for offenders aged under 21, which became known as borstals. After WWII further reform was delivered through the Criminal Justice Act 1948 which abolished penal servitude, hard labour and flogging.
The reform of prisons has coincided with a growth in their use, at least since WWII. The prison population in 1908 was over 22,000, a record level that would not be exceeded until 1952. After that, the number of inmates rose steadily to 49,000 by 1988. Following a marginal reduction in the early 1990s, the number
of prisoners has almost doubled since 1993, and now stands at nearly 90,000. The current prisoner rate, of 155 prisoners for every 100,000 people, is seven times higher than it was in 1940.
The dramatic rise in prisoner numbers from the early 1990s has occurred despite there being no significant increase in the numbers being convicted in court. Changes in 1993 to allow courts to take into account previous convictions when sentencing offenders; automatic life sentences for some sexual and violent offences; and an increasing use of short custodial sentencing for ‘anti-social’ crimes, all help to explain this trend. Politically, it has proved difficult for governments to take action to reduce the number of inmates, even at times of severe pressure on prison capacity, as the controversy over End of Custody Licences (an early release scheme that ran from 2007-10) showed.

Tougher on crimeThe chart shows the proportion of women in prison and the total prison population since 1900
«
In 1908 around 13% of prisoners were women mainly serving sentences either linked to prostitution or the suffragette movement. Many of the female prisoners were housed in Holloway prison which had become a female only prison in 1903. The proportion of the prison population
that are women rose steadily from the low of 2.5% in the late 1960s to a peak of 6.1% in 2002, the highest proportion since the late 1940s. In each year since 2002 the proportion of the prison population that are women has fallen, and it currently stands at 5%.
Olym
picsPopulation
Housing &
hom
e lifeIncom
es &
povertyL
eisure &
lifestylesL
ondonE
ducationE
mploym
entFood &
agriculture
The
economy
Monarchy
Technology &
comm
sTransport
Parliament
& elections
Crim
e &
defence
1900 1910 1920 1930 1940 1950 1960 19901970 20001980 2010
female prisoners (% of all prisoners) number of prisoners (thousands)
0% 0
2% 10
4% 20
6% 30
8% 40
10% 50
16% 80
18% 90
12% 60
14% 70
20% 100
153 Olympic Britain
Crimes of the centuryRecorded crime
During the first two decades of the 20th century the police in England and Wales recorded an average of 90,000 indictable offences each year, a figure which increased to over 500,000 during the 1950s.
the CrIme rate consequently quadrupled from 250 crimes per 100,000 people in 1901 to 1,000 by 1950.
But the history of crime in the 20th century is dominated by the even sharper rise in offences recorded by the police since the late 1950s. During the 1960s there was acceleration in recorded crime: it was the only decade in the century where crime doubled. Crime continued to rise according to this measure for much of the remainder of the 20th century, with an average of over one million crimes recorded each year in the 1960s, increasing to two million during the 1970s, and 3.5m in the 1980s.
There is no simple answer as to why crime rates increased so markedly in the second half of the century. Over the period, there were significant changes to the types of offences recorded as crime, and how they are counted, making it difficult to accurately assess underlying trends in
‘real’ crime. Recorded crime levels have also been affected by the behaviour of the public in reporting crimes to the police. An increase in the number of burglaries reported, for example, may partly be due to the relatively recent need to inform the police in order to make an insurance claim, rather than an indication of any real increase in the level of burglary.
New inventions, creating new opportunities for misdemeanour, a growth in the value of ordinary people’s personal property, and the criminalisation of drug use have had real effects on crime levels during the 20th century. The most obvious example of an invention that has spurred crime is the motorcar: by 1991, a car was being reported stolen on average once every minute across England and Wales. Aeroplanes made international transport and smuggling easier, while the growing use of computers has created new kinds of offences.

Getting offensiveThe chart shows recorded offences per 100,000 people in England and Wales during the 20th century
«O
lympics
PopulationH
ousing &
home life
Incomes &
poverty
Leisure &
lifestyles
London
Education
Em
ployment
Food &
agricultureTh
e econom
yM
onarchyTechnology &
comm
sTransport
Parliament
& elections
Crim
e &
defence
The puzzle for today’s criminologists is to explain falling crime. Recorded offences reached 6m in 2003, and a steady decline has since been seen in most kinds of recorded crime, with particularly steep falls in some offences such as burglary. Some argue that improvements in
security, particularly modern systems to prevent vehicle intrusion, have significantly reduced the opportunities for committing crime. Others contend that imprisonment, policing or demographic factors play the most important role.
1901 1911 1921 1931 1941 1951 1961 19911971 19810
2,000
6,000
10,000
4,000
8,000
12,000

155 Olympic Britain
The FallenMilitary strength and deaths in combat
The military casualties incurred by the UK during the World Wars dwarf anything that has occurred since.
three tImes as many British forces died on the first day of the Battle of the Somme (19,240) than have been killed in every combat operation since the end of WWII. Had the Prime Minister read out their names in the House of Commons, as has been done since 2003, it would have taken at least 11 hours. Over the course of the war, 880,000 British forces died, 6% of the adult male population and 12.5% of those serving. The toll on the adult male population meant that the 1921 Census recorded 109 women for every hundred men.
In WWII there were 384,000 soldiers killed in combat, but a higher civilian death toll (70,000, as opposed to 2,000 in WWI), largely due to German bombing raids during the Blitz: 40,000 civilians died in the seven-month period between September 1940 and May 1941, almost half of them in London.
The strength of the British military during the World Wars was boosted
greatly by the conscription of civilians. The army reached a peak of 4m soldiers in 1918 and 2.9m in 1945. A more limited form of conscription, known as National Service, lasted until 1963, with the last use of conscripts in combat operations occurring at Suez in 1956. The decline of Empire, technological change, and a transformation of Britain’s role in the world have been reflected in a decline in personnel numbers: the army and naval service is smaller than at any point since the mid to late 19th century, while air force personnel are at a post-WWII low. The 2010 Strategic Defence and Security Review envisages further reductions to 2015. But the UK continues to spend well above the average for rich countries on its military.
Drawn-out counter-insurgency operations in Northern Ireland and Iraq have come to an end within the last decade, and the withdrawal of troops from Afghanistan at the end of 2014 will close a chapter in British military history. The sensitivity

of public opinion to military casualties incurred in wars perceived to have no clear purpose or definition of victory, together with constraints on public spending, mean the threshold for future
interventions will be high. But the crises in Libya and Syria indicate that the question of when and where to risk the lives of UK forces will remain a pressing one.
Emergencies and counter-insurgenciesThe chart shows deaths of UK armed forces personnel in each medal-earning combat theatre since the end of WWII
«O
lympics
PopulationH
ousing &
home life
Incomes &
poverty
Leisure &
lifestyles
London
Education
Em
ployment
Food &
agricultureTh
e econom
yM
onarchyTechnology &
comm
sTransport
Parliament
& elections
Crim
e &
defence
Malaya
Korea
800
1,000
1,200
1,400
1,600
Palestine
Yangtze
Suez canal zone
Kenya
Cyprus
Suez
Arabian peninsula
BorneoSouth Arabia
Malay peninsula
Northern Ireland
Dhofar
Falklands
Gulf
Afghanistan
Balkans
Iraq
0
200
400
600
800
1945 1955 1965 1975
Malaya
Korea
PalestineNorthern Ireland
Suez canal zoneCyprus
Afghanistan
Iraq
Balkans
Gulf
Falklands
SuezArabian peninsula
Yangtze
KenyaSouth ArabiaBorneoMalay peninsula
Dhofar
1985 1995 2005
0
800
200
1,000
400
1,200
600
1,400
1,600

157 Olympic Britain
SourcesReforming prisons, reforming prisonersMoJ, Offender Management Caseload Statistics 2011, Annual tables
Crimes of the centuryHO, Historical recorded crime series
The FallenCommonwealth War Graves Commission, Annual Report 2010/11, p.45G. Sheffield, The Somme, 2003MoD Defence Analytical Services Agency, correspondence to Library showing UK armed forces deaths by medal-earning theatre 1945-Nov 2011Guardian datablog, British dead and wounded in Afghanistan by monthDoEP, British labour statistics: historical abstract 1886-1968House of Commons Library, SN/SG/02183, Defence Personnel Statistics

Photo credits
Cover: shoe-shiner and customer with policeman outside Parliament (c.1905), from Parliamentary Archives FAR/7Olympics: from Official Report of the 1908 Olympic Games (digitised by LA84 Foundation)Population: crowd on Whitehall, near Downing St (1914), from Bain News Service collection, courtesy of US Library of CongressHousing and home life: children of an eastern suburb of London after bombing raid (September 1940), United States National ArchivesLeisure and lifestyles: audience at a 3D ‘stereoscopic’ film shown during the Festival of Britain (May 1951), courtesy of the National ArchivesIncomes and poverty: ‘colliery lasses’ during British Coal strike (c.1910-15), from Bain News Service collection, courtesy of US Library of CongressLondon: Leicester Square underground station (1935), courtesy of Stockholm Transport MuseumEducation: London County Open-air School (c.1910), from Bain News Service collection, courtesy of US Library of CongressEmployment: shoe-shiner and customer with policeman outside Parliament (c.1905), from Parliamentary Archives FAR/7Food and agriculture: Henry Wharton at the Hoppings Fair in Newcastle (1940s), courtesy of Tyne and Wear Archives and MuseumsThe economy: Royal Exchange, London (c. 1910-15), from Bain News Service collection, courtesy of US Library of CongressMonarchy: Queen Elizabeth addressing audience in Mackay, Queensland (March 1954), courtesy of the State Library of QueenslandTechnology and communication: entrance to the Exhibition of Science at the Festival of Britain (1951), courtesy of the National ArchivesTransport: buses outside Victoria station (1927), courtesy of Stockholm Transport MuseumParliament and elections: group of suffragettes standing outside Parliament (c.1910), from Bain News Service collection, courtesy of US Library of CongressCrime and defence: Andrea Laudano, arrested for larceny in North Shields (July 1904), from collection Criminal faces of North Shields 1902-16, courtesy of Tyne and Wear Archives and Museums
“Maps in Workhouse to welfare and Do you know the way to Haringey? and Monarch Airways are © Crown copyright. All rights reserved. Created under licence by the House of Commons Library Ordnance Survey 100040654 (2012) and Ordnance Survey Northern Ireland 2085 (2012). No reproduction, in any format, without permission.”