oltp, olap, bi and big data
TRANSCRIPT

OLTP, OLAP, BI and BIG Data
ITPro Camp Keiser University
July 13, 2013
Frank Quintana, PhD www.businessintelligencematters.us
1 Frank Quintana

We Need Data to Control Processes
2 Frank Quintana

3
Optimized for DML
Optimized for DQL
Normalized Database (3rd NF and Up)
Multidimensional Database (Start Schema, Cubes,
Measures and Dimensions etc.)
OLTP OLAP
The Mystery Source
Frank Quintana

Bill Inmom DW Model
4 Frank Quintana

5
The Kimball’s Model
Frank Quintana
7 Frank Quintana

Date Event
1996-07-01 Microsoft opens new team to build an OLAP product, codenamed Plato (permutation of letters from OLAP)
1996-07-15 Panorama Software delegation meets with Microsoft
1996-10-27 Microsoft announces acquisition of Panorama Software development team
1998-11 OLAP Services 7.0 (codename Sphinx) ships
2000-08 Analysis Services 2000 (codename Shiloh) ships
2001-11 XML for Analysis Software Development Kit 1.0 ships
2003-04 ADOMD.NET and XML for Analysis SDK 1.1 ship
2005-10-28 Analysis Services 2005 (codename Yukon) ships
2008-08-06 Analysis Services 2008 (codename Katmai) ships
Microsoft Analysis Services Events
8 Frank Quintana

The Business Intelligence Data Life Cycle (BIDLC )
• Raw DataInformationKnowledge Decisions (Wisdom)
• CollectIntegrate Analyze View
SSIS SSAS SSRS
• SSIS utilizes: XML, T-SQL, .NET (VB or C#), Expression Language.
• SSAS utilizes: XML, T-SQL, MDX, DMX, DAX, and Expression Language.
• SSRS: T-SQL, .NET, RDL (XML)
9 Frank Quintana

BIDS Solutions for OLAP
10
Control Flow
Data Flow
ETL
SSIS Packages
DW ODS
Data Mart
Reports RDL
Report Server
Report Server, Web service
or Report Viewer
Control
Integration Server
File System
SSIS INTEGRATE
SSRS View
Data Source
SSIS Analyze
Data Source
Data
Sou
rce
Analysis server
Frank Quintana

OLAP Architecture
11
Relational Storage
ROLAP MOLAP HOLAP
Multidimensional Storage
Multidimendional Storage
Multidimendional Storage
Relational DW
Cube Structures
Preprocessed Aggregates
Detail-Level Values
Multidimendional Storage
Multidimendional Storage
Multidimendional Storage
Relational DW
Frank Quintana

The Need for MDX
12 Frank Quintana

13
MDX
Frank Quintana

14 Frank Quintana

15 Frank Quintana

Key developments in early years of data warehousing were: • 1960s — General Mills and Dartmouth College, in a joint research project, develop the terms
dimensions and facts.[4] • 1970s — ACNielsen and IRI provide dimensional data marts for retail sales.[4] • 1970s — Bill Inmon begins to define and discuss the term: Data Warehouse • 1975 — Sperry Univac Introduce MAPPER (MAintain, Prepare, and Produce Executive Reports) is a
database management and reporting system that includes the world's first 4GL. It was the first platform specifically designed for building Information Centers (a forerunner of contemporary Enterprise Data Warehousing platforms)
• 1983 — Teradata introduces a database management system specifically designed for decision support.
• 1983 — Sperry Corporation Martyn Richard Jones defines the Sperry Information Center approach, which while not being a true DW in the Inmon sense, did contain many of the characteristics of DW structures and process as defined previously by Inmon, and later by Devlin. First used at the TSB England & Wales
• 1984 — Metaphor Computer Systems, founded by David Liddle and Don Massaro, releases Data Interpretation System (DIS). DIS was a hardware/software package and GUI for business users to create a database management and analytic system.
• 1988 — Barry Devlin and Paul Murphy publish the article An architecture for a business and information system in IBM Systems Journal where they introduce the term "business data warehouse".
• 1990 — Red Brick Systems, founded by Ralph Kimball, introduces Red Brick Warehouse, a database management system specifically for data warehousing.
• 1991 — Prism Solutions, founded by Bill Inmon, introduces Prism Warehouse Manager, software for developing a data warehouse.
• 1992 — Bill Inmon publishes the book Building the Data Warehouse.[5] • 1995 — The Data Warehousing Institute, a for-profit organization that promotes data warehousing,
is founded. • 1996 — Ralph Kimball publishes the book The Data Warehouse Toolkit.[6] • 2000 — Daniel Linstedt releases the Data Vault, enabling real time auditable Data Warehouses
warehouse. 17 Frank Quintana

18 Frank Quintana

Vendors included in the 2013-Magic Quadrant for BI and Analytics
1 Actuate Vendors Added
2 arcplan 25 1010data9
3 Alteryx 26 Advizor Solutions
4 Birst 27 Altosoft
5 Bitam 28 Dimensional Insight
6 Board International 29 eQ Technologic
7 GoodData 30 InetSoft
8 IBM (Cognos) 31 JackBe
9 Information Builders 32 Jedox
10 Jaspersoft 33 myDials/Adaptive Planning
11 LogiXML 34 Phocas
12 Microsoft (SSIS, SSRS, SSAS) 35 SpagoBI
13 MicroStrategy 36 Strategy Companion
14 Oracle (OBIEE) 37 Yellowfin
15 Panorama Software
16 Pentaho
17 Prognoz
18 QlikTech (In Memory DS)
19 Salient Management Company
20 SAP (BusinessObjects)
21 SAS
22 Tableau Software
23 Targit
24 Tibco Spotfire 19 Frank Quintana

“One-Size-Fits-All” Database No Longer Makes Sense
1. There is more data than ever. Gigabytes turn into terabytes, which then turn into petabytes. This information is being generated in support of transactional applications as well as business intelligence and analytics usage.
2. There are more types of data. Along with traditional relational records, enterprises now gather diverse categories such as images, video, text, and so on. This information is frequently produced by Web, mobile, sensors, and so on, along with machine-to-machine streaming communication.
3. There are more uses for all this data. Users are clamoring for real-time applications that provide seamless, immediate integration with analytics, yet are massively scalable and deliver mission-critical OLTP performance.
22 Frank Quintana

23 Frank Quintana

ALL
SOME
24 Frank Quintana

25 Frank Quintana

26 Frank Quintana

27 Frank Quintana

3 Trends Disrupting BI
Cloud computing
Big Data
Mobile
29 Frank Quintana

Big data • Big data involves using scale-out parallel data processing
and distributed file frameworks to transform and analyze large volumes of structured or unstructured data.
• Big data is where cloud computing was five years ago – still immature and largely all hype.
• Although still immature, big data is arguably a BI game changer.
• For the past several decades, IT organizations have effectively used data warehousing technologies to create and analyze enterprise views of data, but the time and cost to integrate and manage data has forced organizations to be selective.
• Consequently, the average data warehouse manages only a fraction of the data required and typically lags business needs.
• Organizations see big data technologies as a solution to store, transform and analyze data that otherwise would be cost prohibitive to manage in a data warehouse.
30 Frank Quintana

BI vs BA Business Intelligence Business Analytics
Answers the questions:
What happened?
When?
Who?
How many?
Why did it happen?
Will it happen again?
What will happen if we
change x?
What else does the data tell
us that never thought to ask?
Includes:
Reporting (KPIs, metrics)
Automated
Monitoring/Alerting
(thresholds)
Dashboards
Scorecards
OLAP (Cubes, Slice &
Dice, Drilling)
Ad hoc query
Statistical/Quantitative
Analysis
Data Mining
Predictive Modeling
Multivariate Testing
http://searchbusinessanalytics.techtarget.com/definition/business-analytics-BA
33
I hate to oppose apples to apples . BI and Analytics are two sides of the same coin Frank Quintana

Optimized for DML
Optimized for DQL
Normalized Database (3rd NF and Up)
Multidimensional Database (Start Schema, Cubes,
Measures and Dimensions etc.)
34
OLTP OLAP
Big Data
Frank Quintana

Milestones in Data Architecture and Modeling
35
60’s CODASYL Network and Hierarchichal
DB
70’s Codd RDBMS
80’s Object Oriented DB
90’s OLAP, Data Warehouse
Multidimensional
21 Century NoSQL,
Big Data, Unstructured
Data
Frank Quintana

!
36 Frank Quintana

37 Frank Quintana

NoSQL leaders in specific categories
• For document-oriented databases the clear leader is mongodb.
• Big table-style databases, both Cassandra and Hadoop.
• Graph databases. Neo4J remains the undisputed king.
• Riak has emerged as the most widely deployed and richest implementation of the Amazon Dynamo-style of key-value store.
38 Frank Quintana

39 Frank Quintana

40 Frank Quintana

41 Frank Quintana

42 Frank Quintana

!
44 Frank Quintana

45 Frank Quintana

If you want to start interacting with the Hadoop eco sytem you need Pig. Pig is an abstraction layer on top of Map Reduce to simplify some of that process HiveQL-another abstraction layer on top of Hadoop that allows you to interact on hadoop using the table metaphor Hbase- for a column oriented variation of the data Map Reduce- If you want to implement Map Reduce you need Java
46 Frank Quintana

Big data shop have already a complex mining environment To find a data scientist proficient in all these components is almost impossible
47 Frank Quintana
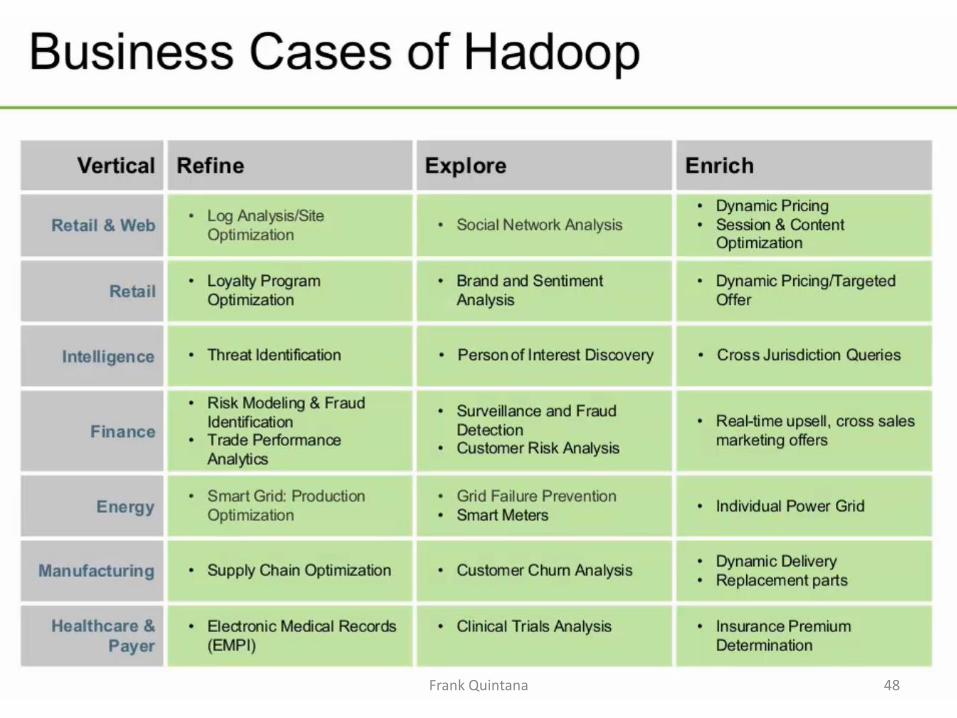
48 Frank Quintana

49 Frank Quintana
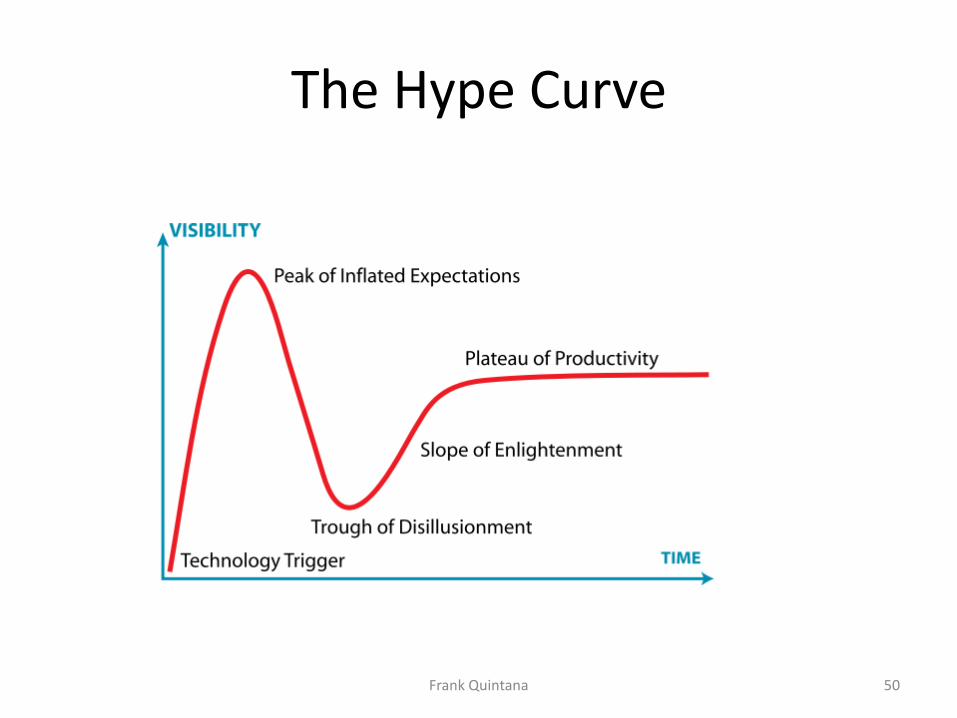
The Hype Curve
Frank Quintana 50

3rd Party Tools for Google BigQuery
51 Frank Quintana

RDBMS platforms have been the most popular choice for managing enterprise information for
the past 30 years
• The value and meaning of all this data is based on its relations, such as among customers, orders, inventory, and so on.
• Transactional integrity (ACID compliance) offered by RDBMS is crucial.
• There’s an enormous installed base of applications and RDBMS developer expertise.
52 Frank Quintana

Three different examples of what can result when data is wisely blended:
• Analyzing advertising performance. Tying these two silos together helps produce better awareness of advertising campaign effectiveness.
• Improving the e-commerce experience. Linking these systems results in a better customer experience and higher revenue.
• Ensuring regulatory compliance.
Unifying these systems results in enhanced compliance and reduced risk.
• Daily sales figures are stored in a relational database.
• Click trails through a website are maintained in a key/value store.
• Inventory and stock levels are held in a relational database
• Product images, instructional videos, and other documentation are maintained in file/object store.
• Financial transactions are maintained in relational database
• Customer and employee interactions and relationships are tracked in a graph database.
53 Frank Quintana
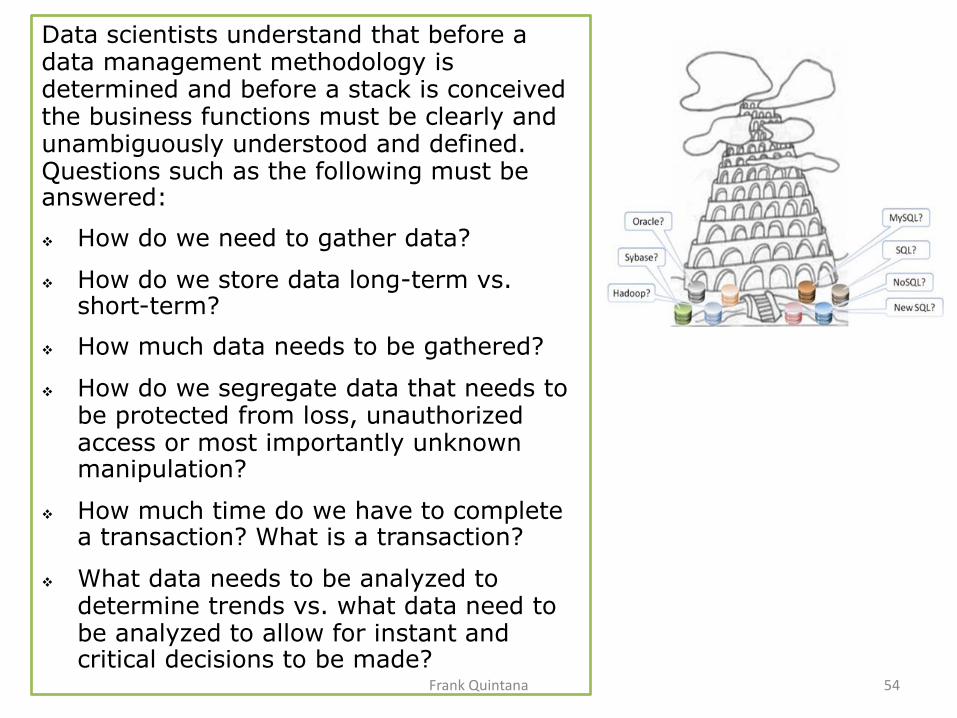
Data scientists understand that before a data management methodology is determined and before a stack is conceived the business functions must be clearly and unambiguously understood and defined. Questions such as the following must be answered:
How do we need to gather data?
How do we store data long-term vs. short-term?
How much data needs to be gathered?
How do we segregate data that needs to be protected from loss, unauthorized access or most importantly unknown manipulation?
How much time do we have to complete a transaction? What is a transaction?
What data needs to be analyzed to determine trends vs. what data need to be analyzed to allow for instant and critical decisions to be made?
54 Frank Quintana
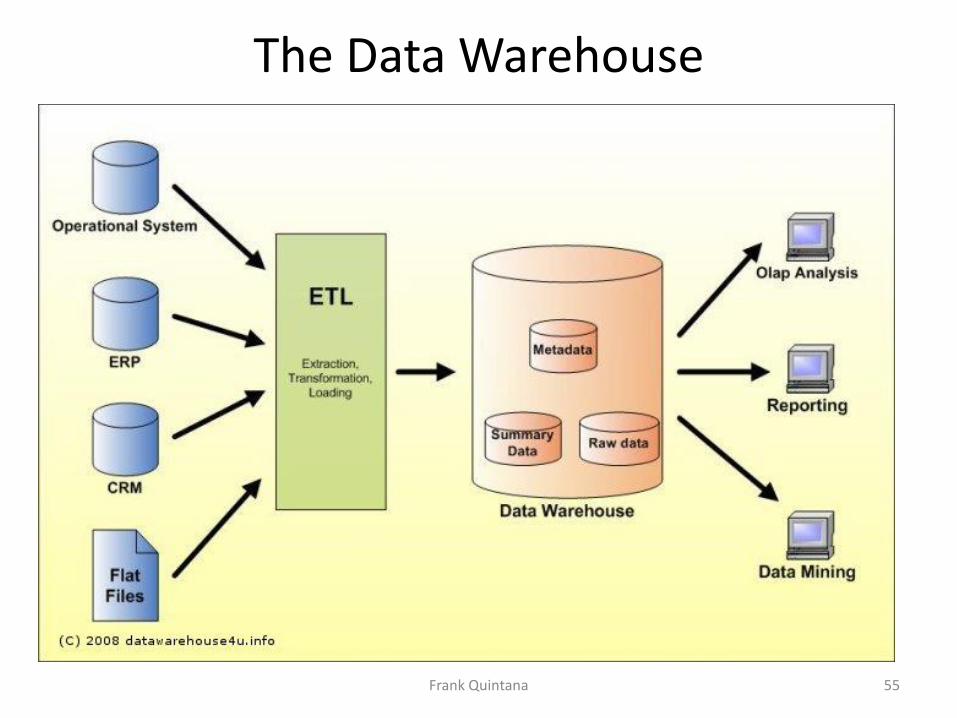
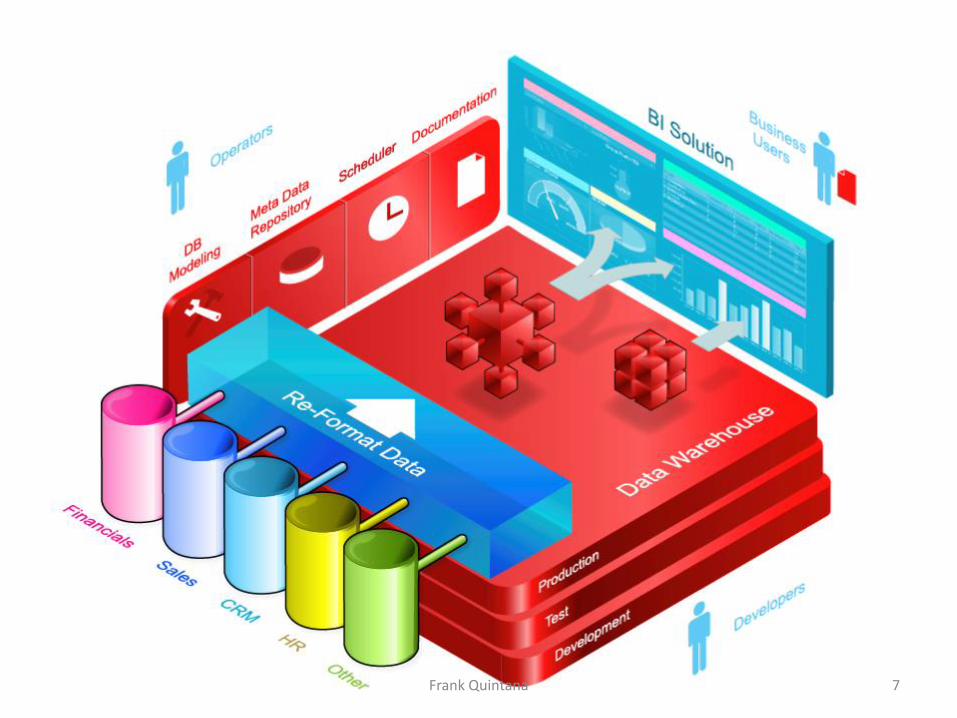
The Data Warehouse
55 Frank Quintana

The Near Future for BI • The three fastest-growing vendors in the industry are
Tableau Software, QlikTech, and Tibco Spotfire, with reported growth rates of 94%, 43%, and 23% in 2011, respectively. All three blend data visualization, analytics, and high-scale in-memory analysis capabilities.
• IDC forecasts that advanced analytics (the uber category for predictive modeling and machine learning) will grow 10.1% per year through 2016 and content analytics (the parent of natural language processing) will grow 14.5% per year through 2016.
• Traditional BI query, reporting, and analysis tools, meanwhile, will see still-impressive 9.5% annual growth, according to IDC
• Most of the cost of big data platforms is in hardware and services, not software, says Raden. 56 Frank Quintana

Conclusion • Cloud computing provides the capacity for on-demand
compute and storage resources to enable big data, together delivering an unprecedented capability to transform and analyze large volumes of structured and unstructured data.
• NoSQL provides a platform for real-time access so that Web apps and other applications can use resulting analytic models to enhance customer experience and user productivity.
• Mobility drives interaction to new scales, reinforcing the demand for real-time business intelligence. Enterprise BI user adoption surveys that fail to take the changing face of BI into account may understate adoption.
• For enterprise architects, the changing face of BI through cloud, big data, NoSQL and mobility innovation may arguably create new coordination challenges. New technologies tend to confuse old boundaries.
58 Frank Quintana

Conclusion
• Nevertheless, these developments present opportunities for BI and information management architects to reimagine BI strategy and increase the visibility and value of BI in the enterprise.
• While BI continues to be top of mind in executive surveys – and therefore is one of the top areas for IT investments – these revitalizing trends virtually guarantee even greater BI engagement in years to come.
• A lot of hype out there on NoSQL databases, but not enough technological maturity to be used in an industrial scale into the enterprise.
59 Frank Quintana

Today’s BI Will Not Be Tomorrow’s BI • It is an open question whether BI has been, in the long run,
successful or not. The take-up of BI in large organizations has stalled at 10 to 20 percent.
• Will BI survive? Yes, but we may not recognize it. What we call analytics is part of this transformation. BI will be wrapped in new technologies that provide a more complete set of tools.
• BI will be part of a “decision management” continuum -- the amalgam of predictive modeling, machine learning, natural language processing, business rules, traditional BI and visualization and collaboration capabilities.
• Modeling are going to be very important because the need for abstraction from data sources. This allows models to be made and shared in language and terms unconnected to the physical characteristics of data.
Frank Quintana 60

61 Frank Quintana