oltp i/o profile study with microsoft sql 2012 using...
TRANSCRIPT

OLTP I/O Profile Study with Microsoft SQL 2012 Using EqualLogic PS Series Storage A Dell EqualLogic Best Practices Technical White Paper
Dell Storage Engineering February 2013

2 BP1046 | OLTP I/O Profile Study with Microsoft SQL 2012 using EqualLogic PS Series Storage
© 2013 Dell Inc. All rights reserved. Reproduction of this material in any manner whatsoever without the express
written permission of Dell Inc. is strictly forbidden. For more information, contact Dell.
Dell, the Dell logo, and the Dell badge, PowerConnect™, EqualLogic™, PowerEdge™ and PowerVault™ are
trademarks of Dell Inc. Broadcom® is a registered trademark of Broadcom Corporation. Intel® is a registered
trademark of Intel Corporation in the U.S. and other countries. Microsoft®, Windows®, Windows Server®, and Active
Directory® are either trademarks or registered trademarks of Microsoft Corporation in the United States and/or other
countries.

3 BP1046 | OLTP I/O Profile Study with Microsoft SQL 2012 using EqualLogic PS Series Storage
Table of contents Acknowledgements ............................................................................................................................................................................. 4
Feedback ................................................................................................................................................................................................ 4
Executive summary .............................................................................................................................................................................. 4
1 Introduction ..................................................................................................................................................................................... 5
1.1 Objective ............................................................................................................................................................................... 5
1.2 Audience ................................................................................................................................................................................ 5
1.3 Terminology ......................................................................................................................................................................... 5
2 Product overview .......................................................................................................................................................................... 8
2.1 EqualLogic PS Arrays ......................................................................................................................................................... 8
2.2 Microsoft SQL Server 2012 ............................................................................................................................................... 8
3 Types of application workloads ................................................................................................................................................. 9
3.1 OLTP workload ................................................................................................................................................................... 9
3.2 DSS workload ...................................................................................................................................................................... 9
4 Buffer management in SQL Server .......................................................................................................................................... 10
4.1.1 Reading pages .................................................................................................................................................................... 11
4.1.2 Writing data pages ............................................................................................................................................................. 11
5 SQL Server I/O pattern study ..................................................................................................................................................... 13
5.1 TPC-C type workload ....................................................................................................................................................... 13
5.1.1 SQL Server buffer cache and the effect on I/O ..........................................................................................................14
5.1.2 Different database sizes vs. buffer cache .....................................................................................................................19
5.1.3 Checkpoints ....................................................................................................................................................................... 22
5.2 TPC-E type workload ...................................................................................................................................................... 26
5.2.1 SQL Server buffer cache and the effect on I/O ......................................................................................................... 27
5.2.2 Different database sizes vs. buffer cache .................................................................................................................... 32
6 Collecting and examining data for SQL Server ..................................................................................................................... 35
7 Conclusion .................................................................................................................................................................................... 38
8 Test configuration ....................................................................................................................................................................... 39
A Configuration details ...................................................................................................................................................................41
Additional resources .......................................................................................................................................................................... 43

4 BP1046 | OLTP I/O Profile Study with Microsoft SQL 2012 using EqualLogic PS Series Storage
Acknowledgements
This best practice white paper was produced by the following members of the Dell Storage team:
Engineering: Lakshmi Devi Subramanian
Technical Marketing: Magi Kapoor
Editing: Camille Daily
Additional contributors: Ananda Sankaran, Darren Miller, Chuck Farah and Rob Young
Feedback
We encourage readers of this publication to provide feedback on the quality and usefulness of this
information by sending an email to [email protected].
Executive summary
Microsoft® SQL Server® OLTP database environments constantly store, retrieve, and update data from and
to the storage subsystem. It is essential to configure a balanced end-to-end system to enable consistent
user transactions without any delay or bottlenecks during the peak loads. The performance bottlenecks
can only be prevented by properly sizing the storage for performance and capacity. This can be done by
gathering the storage requirements and regularly monitoring the resource utilization.
This paper covers the storage factors that need to be considered when gathering sizing requirements. Also
included is a description of the SQL Server buffer management, its effect on the I/O pattern going to the
storage, and the data for SQL Server performance bottlenecks that was monitored. It must be noted that
the environment and requirements are different for every customer and Microsoft’s SQL Server 2012, with
its improved memory management, SQL Server’s memory and storage would need to be sized
appropriately based on a company’s specific database requirements.

5 BP1046 | OLTP I/O Profile Study with Microsoft SQL 2012 using EqualLogic PS Series Storage
1 Introduction The first step in determining the requirements for a storage system is to understand the I/O pattern
generated by the application. The read/write I/O block sizes and their ratios directed by the application
can impact storage IOPS, throughput and latency. Therefore, it is essential to understand their behavior
and frequency in order to properly identify the I/O requirements for that system and to further develop
any future sizing guidelines with respect to performance or capacity.
The focus of this paper is on SQL Server 2012 database software, its I/O pattern characteristics, and the
usefulness of their relationship to a physical storage configuration in determining deployment
requirements for OLTP type workloads.
1.1 Objective This paper provides an initial look at the tools and methodology for characterizing existing workloads and
then mapping them into physical storage requirements and is not meant to serve as prescriptive sizing
guidance for SQL Server.
Test results from Dell™ EqualLogic™ PS Series arrays are used to provide concrete examples and illustrate
the application behavior. It is taken into consideration that each customer case is a unique scenario and
needs a customized analysis. However, as a general approach, the following related topics are addressed.
Types of application workload
SQL Server I/O access pattern studies
Collecting and Examining the Data for the Application
1.2 Audience This white paper is primarily targeted to database administrators, storage administrators, VMware® ESXi
administrators, and database managers who are interested in using EqualLogic storage to design, properly
size, and deploy Microsoft SQL Server 2012 running on the VMware vSphere virtualization platform. It is
assumed that the reader has an operational knowledge of Microsoft SQL Server configuration and
management of EqualLogic SANs and iSCSI SAN network design, as well as familiarity with VMware ESXi
Server environments.
1.3 Terminology The following terms will be used throughout this document.
Group: Consists of one or more EqualLogic PS Series arrays connected to an IP network that work
together to provide SAN resources to host servers.
Member: Identifies a single physical EqualLogic array.
Pool: A logical collection that each member (array) is assigned and contributes to after being added to a
group.

6 BP1046 | OLTP I/O Profile Study with Microsoft SQL 2012 using EqualLogic PS Series Storage
Hypervisor: The software layer in charge of managing access to the hardware resources, sitting above the
hardware, and in between the operating systems running as guests.
Virtual machine: An operating system implemented on a software representation of hardware resources
(processor, memory, storage, network, etc.). Virtual machines are usually identified as guests in relation
with the host operating system that executes the processes and allows them to run directly on the
hardware.
Buffer cache: Buffer cache minimizes physical disk I/O by holding (buffering) copies of requested data
blocks in memory. Data pages that are buffered in the cache can be served at memory access speed,
much faster than going to disk for it. By default, SQL Server dynamically grows and shrinks the size of its
buffer pool (cache), depending on the physical memory load that the operating system reports. However,
the buffer cache size can be adjusted using the max server memory setting in SQL Server management
studio.
Buffer cache hit ratio: The percentage of pages found in the buffer cache without having to read from a
disk. The ratio is the total number of cache hits divided by the total number of cache lookups over the last
few thousand page accesses. After a long period of time, the ratio moves very little. Because reading from
the cache is much less expensive than reading from a disk, you want this ratio to be high. Generally, you
can increase the buffer cache hit ratio by increasing the amount of memory available to the SQL Server.
Virtual address space: The set of virtual memory addresses that a process can use. The address space for
each process is private and cannot be accessed by other processes unless it is shared. A virtual address
does not represent the actual physical location of an object in memory; instead, the system maintains a
page table for each process, which is an internal data structure used to translate virtual addresses into their
corresponding physical addresses. Each time a thread references an address, the system translates the
virtual address to a physical address.
Asynchronous I/O: When a process submits a request for a read or write operation, the operating system
immediately returns control back to the application while it performs the I/O. The application is free to
perform additional work and check back periodically to see if the operation is completed.
Synchronous I/O: When a process submits a request for read or write operation, the operating system
doesn’t return control to the application until the read or write completes.
Recovery Interval: This option specifies an upper limit on the time for performing recovery operations
and controls the frequency of checkpoints issued in each database. The default recovery-interval value is
0, which allows the SQL Server Database Engine to automatically configure the recovery interval.
Perfmon: perfmon.exe is a process associated with the Microsoft Windows® operating system.
Performance Monitor, or Perfmon, measures performance statistics on a regular interval, and saves those
stats in a file. The database administrator picks the time interval, file format, and counter statistics that are
to be monitored. After gathering statistics over a period of time (hours or days), Excel can be used to
analyze the data with some basic formulas.

7 BP1046 | OLTP I/O Profile Study with Microsoft SQL 2012 using EqualLogic PS Series Storage
SAN Headquarters (SAN HQ): Monitors one or more PS Series groups. The tool is a client/server
application that runs on a Microsoft Windows server and uses simple network management protocol
(SNMP) to query the groups. Much like a flight data recorder on an aircraft, SAN HQ collects data over time
and stores it on the server for later retrieval and analysis. Client systems connect to the server to format
and display the data in the SAN HQ GUI.

8 BP1046 | OLTP I/O Profile Study with Microsoft SQL 2012 using EqualLogic PS Series Storage
2 Product overview
2.1 EqualLogic PS Arrays The Dell EqualLogic PS Series arrays are designed to meet the performance and availability needs of
application and virtualization environments in medium to large enterprises. These virtualized iSCSI storage
area networks (SANs) combine intelligence and automation with fault resiliency to provide simplified
administration, rapid deployment, enterprise performance and reliability, and seamless scalability using
innovative Dell™ Fluid Data™ architecture.
With the same innovative virtualized scale-out architecture in previous product generations, the
EqualLogic PS6100 and PS6110 Series arrays increase raw capacity, add density, and boost IOPS
performance. The PS6100 Series arrays serve as the storage foundation for the virtualized datacenter and
support critical applications such as databases, email, and virtual server workloads. Options with a single
EqualLogic PS6100 array are: all solid state drives (SSDs)(PS6100S), a mix of SSDs and 10K serial attached
SCSI (SAS) drives (PS6100XS), all 10K SAS, or all 15K SAS drives (PS6100X,PS6100XV). The PS6100X provides
a balance of cost, performance, and capacity. The PS 6100XS, with its automated SSD tiering, would be
great for mission-critical high I/O database applications, high virtualization performance, and heavy
Microsoft® Exchange Server deployments. PS6100S arrays are good for high performance and latency-
sensitive applications.
The PS6110 Series arrays have the capacity, density, scalability and performance of the PS6100 Series
arrays with the additional throughput of 10 GbE and the flexibility to use SFP+ or 10GBASE-T (copper).
These are best suited when heavy network throughput is required for frequent backups and data copies.
2.2 Microsoft SQL Server 2012 Microsoft SQL Server 2012 is a relational database management system that allows easy access to data
when it is needed. The three main features promoted by Microsoft in this new version are
Mission critical confidence -Enable mission critical performance and availability at low TCO.
Breakthrough insight -Unlock new insights with rapid data exploration and visualization across the
organization.
Cloud on your terms-Create and scale business solutions fast, on your terms from server to private
or public cloud.
All of these features are described in Microsoft’s Learning Center under “What's New in SQL Server 2012 whitepaper” at http://www.microsoft.com/sqlserver/en/us/learning-center/resources.aspx.

9 BP1046 | OLTP I/O Profile Study with Microsoft SQL 2012 using EqualLogic PS Series Storage
3 Types of application workloads In order to determine the storage requirements, as a part of studying the I/O patterns of the database
application, it is important to understand the models of the most common database workloads. Two most
common database workload types are OLTP and DSS, each of them explained in detail below.
3.1 OLTP workload Online transaction processing (OLTP) database applications are optimal for managing data that changes.
These applications typically have many users performing transactions that change real-time data at the
same time. Although individual requests by users for data usually reference few records, multiple requests
are made at the same time. Examples of different types of OLTP systems include airline ticketing systems,
banking transaction systems, and web order systems.
Optimizing an OLTP database system running on a SQL Server maximizes the number of transactions
through the system in the least amount of time. For OLTP transactions to take place, SQL Server relies on
an efficient I/O subsystem. According to “SQL Server Best Practices Article”
(http://technet.microsoft.com/en-us/library/cc966412.aspx), an OLTP transaction profile contains the
following pattern:
OLTP processing is generally random in nature for both reads and writes issued against data files and
the key metric in measuring performance of OLTP workloads is the number of I/Os per second
(IOPS) that can be achieved while maintaining a healthy response time.
Read activity (in most cases) for transaction processing is consistent and performs point queries; it
does not consist of large time-consuming queries and write activity to the data files occurs during
checkpoint operations (frequency is determined by recovery interval settings). These fairly small
(typically between 8 K and 64 K) transfers are dispersed over the data. This causes the I/O pattern to
be random in nature.
Log writes are sequential with a varying size, which is dependent on the nature of the workload
Log reads are sequential in nature too.
Tempdb is a system database used by SQL Server as a temporary workspace. Access patterns for
tempdb may vary but are generally more like OLTP data patterns.
3.2 DSS workload Decision support system (DSS) applications are typically designed to support complex analytical query
activities using very large data sets. The queries executed on a DSS database typically take a long time to
complete and usually require processing large amounts of data. A DSS query may fetch millions of records
from the database for processing. To support these queries the server reads table data from the storage
devices. A DSS profile contains the following pattern:
Reads and writes tend to be sequential in nature and are generally the result of table or index scans
and bulk insert operations.
I/O size varies but is generally larger than 8KB. Read-ahead is any multiple of 8 KB up to 256 KB
(1024 KB for Enterprise edition). Bulk load operations are multiples in a range of 8 KB up to 128 KB.

10 BP1046 | OLTP I/O Profile Study with Microsoft SQL 2012 using EqualLogic PS Series Storage
4 Buffer management in SQL Server Irrespective of the SQL Database workload types (OLTP or DSS); the buffer management functionality
remains the same for both. This section details the working of the SQL Server buffer management which is
the core component involved in the I/O pattern changes.
An essential attribute of a database engine is that it performs many disk reads and writes. The SQL
database engine is designed to make the pattern of I/O usage highly efficient. Buffer management is a key
component in achieving this efficiency. The buffer management component consists of two things:
Buffer manager - Accesses and updates database pages, and
Buffer cache (also called the buffer pool)-Caches pages to reduce database file I/O to the disk.
SQL Server uses a buffer cache to highly optimize disk access. The buffer cache is managed dynamically (it
is also possible to configure a fixed buffer cache size). That is, the size is adjusted according to available
physical memory, other applications running on the server including other SQL Server instances, and a
general transaction load. Buffer cache size is one of the major factors contributing to the change in the
SQL Server I/O patterns. The change in buffer cache sizes changes the logical I/O access pattern and in
turn changes the physical I/O access pattern to disk and the resulting storage device utilization level.
There were various changes to the memory manager component in SQL Server 2012 as part of the
redesign. This redesign made it possible to more accurately size and govern all SQL Server memory
consumption, for more efficient page allocations, and better I/O handling. The changes in the memory
components from SQL Server 2008 to SQL Server 2012 can be found in the MSDN blog post at,
http://blogs.msdn.com/b/sqlosteam/archive/2012/07/11/memory-manager-surface-area-changes-in-
sql-server-2012.aspx. A detailed explanation of SQL Server Operating System (SQLOS) memory manager
and various related components can be found in the MSDN blog post at,
http://blogs.msdn.com/b/slavao/archive/2005/02/11/371063.aspx.
This section gives a brief overview of how SQL Server buffer management works in addition to some
detailed examples from the tests conducted on different buffer pool sizes and how it changes the I/O
pattern.
A complete description of buffer management can be found on the Microsoft web site at
http://msdn.microsoft.com/en-us/library/aa337525%28v=sql.105%29.aspx
Reading or writing data to a page in the buffer cache is handled by the buffer manager. SQL Server
reserves and acquires a memory target (virtual address space) when the SQL Server starts. The size of
virtual address space required for the buffer cache is calculated by the amount of physical memory on the
system and the configured number of maximum server threads, in addition to several other parameters.
SQL Server reserves this calculated amount of virtual address space for the buffer cache. However, it
acquires only the amount of physical memory required for the current load. Any 8 KB page can be
buffered in memory which requires the buffer cache to be divided into 8 KB pages. The number of pages
11 BP1046 | OLTP I/O Profile Study with Microsoft SQL 2012 using EqualLogic PS Series Storage
getting cached in the memory depends on the amount of memory available to the SQL Server. The buffer
manager:
Manages the functions for reading data (or index pages) from the database disk files into the buffer
cache, and then writing modified pages back to disk. A page remains in the buffer cache until the
buffer manager needs the buffer area for more data.
Cooperates with the memory manager to other OS and user components to use its buffers.
Interacts primarily with a resource manager to control overall memory usage, Database Manager
and the SQLOS for low-level file I/O operations, and a log manager for write-ahead logging.
4.1.1 Reading pages There are two types of I/O reads from an instance of the SQL Server Database Engine.
Logical reads: Occur when the Database Engine requests a page from the buffer cache.
Physical reads: Occur when the page is not currently in the buffer cache. These first copies are taken from
the disk into the cache.
SQL Server uses sophisticated algorithms to retrieve data pages that would be used in the immediate
future and read-ahead is one such algorithm that the Database Engine supports. The read-ahead
performance optimization mechanism anticipates the data and index pages needed to fulfill a query and
brings the pages into the buffer cache before they are actually used by the query. This allows calculation
and I/O to overlap, taking full advantage of both the CPU and the disk.
4.1.2 Writing data pages There are two types of I/O writes from an instance of the SQL Server Database Engine.
Logical writes: Occur when data is modified in a page of the buffer cache.
Physical writes: Occur when the page is written to the disk from the buffer cache.
As mentioned before, either reading from or writing to a page happens at the buffer cache. Each time a
page is modified in the buffer cache, it is marked as dirty and is not immediately written back to the disk.
This means that a page can have more than one logical write made before it is physically written to a disk.
A record of the changes is made in the log cache for every logical write. To avoid any loss of data, SQL
Server first writes the log records to a disk. The associated dirty page is removed from the buffer cache
and then written to a disk later. SQL Server uses a technique known as write-ahead logging that prevents
writing a dirty page before the associated log record is written to a disk. This is vital for the correct working
of the recovery manager (refer to Figure 1).

12 BP1046 | OLTP I/O Profile Study with Microsoft SQL 2012 using EqualLogic PS Series Storage
Figure 1 Write operation in SQL Server
When the buffer manager writes a page, it performs an operation called scatter-gather. It searches for
adjacent dirty pages that can be included in a single gather-write operation. The selected dirty pages have
consecutive page IDs and are from the same file, however, the pages need not be contiguous in memory.
A dirty page is written to a disk in one of three ways.
Lazy writing: A system process that keeps free buffers available by removing infrequently used pages from
the buffer cache and writing them to a disk.
Eager writing: Writes dirty data pages associated with unlogged operations, such as bulk insert and select
into. This process allows creating and writing new pages to take place in parallel. That is, the calling
operation does not have to wait until the entire operation finishes before writing the pages to a disk.
Checkpoint: This process periodically sweeps the buffer cache for buffers with pages from a specified
database and writes all dirty pages to a disk. Checkpoints save time during a later recovery by creating a
point at which all dirty pages are guaranteed to have been written to a disk. The user may request a
checkpoint operation by using the CHECKPOINT command. The Database Engine may also be used to
generate automatic checkpoints. The Database Engine calculates automatic checkpoint timing based on
the amount of log space used and by the number of modifications made after the last checkpoint reaches
a limit estimated by the SQL Server (based on the ability of SQL Server to perform recovery operations
within the specified recovery interval). All databases, except for tempdb, have a checkpoint process. The
tempdb file does not require recovery (it is recreated every time the SQL Server starts). SQL Server
automatically omits flushing data pages to a disk for tempdb because it is not optimal. Checkpoint
protects the system from I/O flooding by serializing checkpoint processes that are limited to one
checkpoint at a time to completion. The lazy writing, eager writing, and checkpoint processes do not wait
for the I/O operation to complete. These processes use asynchronous (or overlapped) I/O and continue
with other work, checking for I/O success later. This allows SQL Server to maximize both CPU and I/O
resources for the appropriate tasks. However, transaction log file writes are synchronous as SQL Server
needs to flush all log records that are associated with a committed transaction before the application can
start the next transaction.

13 BP1046 | OLTP I/O Profile Study with Microsoft SQL 2012 using EqualLogic PS Series Storage
5 SQL Server I/O pattern study As explained in the previous sections, the SQL Server buffer cache highly optimizes the disk access. The
more database pages found in the buffer cache, the more efficient SQL Server is when responding to the
queries; this also improves application response times. The change in buffer cache sizes changes the
logical I/O access pattern, which changes the physical I/O access pattern and the storage device
utilization level. To illustrate the effects of buffer cache sizes that can influence application response times
and disk I/O patterns, OLTP tests were performed with two types of workloads, TPC-C and TPC-E like.
Each workload is explained in the following sections. The test criteria used for the study were:
Database data latencies (read / write) remain below 20 ms per volume
Database log latency remain below five ms
SQL server CPU utilization remain below an 80% average
TCP retransmits on the storage network remain below 0.5%
Application response times remain below two seconds
5.1 TPC-C type workload The TPC-C type workload used here models an online order processing application. The transactions in
this workload have large latency values to simulate real-world users. Therefore the transaction rate will be
very low (about 0.04 TPS per virtual user). The transactions operate against a database of nine tables.
Table 1 shows the TPC-C transactions that were executed during testing and their distribution.
Table 1 TPC-C transactions
TPC-C Transaction and distribution
Transaction Distribution of transaction
Access Description
New Order Transaction 45% Read/Write Enter a new order from a customer
Payment 43% Read/Write Update customer balance to reflect payment
Delivery 4% Read/Write Deliver orders (done as a batch transaction)
Stock-Level 4% Read only Monitor warehouse inventory
Order-Status 4% Read only Retrieve status of customer’s most recent order
For the OLTP tests with a TPC-C type workload, the impact of change in the buffer cache size at the SQL
Server was measured using the following parameters.
Application transaction response time

14 BP1046 | OLTP I/O Profile Study with Microsoft SQL 2012 using EqualLogic PS Series Storage
I/O Read/Write ratio at the storage
I/O Read/Write latency
IOPS
I/O block size
Transactions per second
Having a better understanding of the above parameters helps determine the size of storage needed for
performance and capacity.
5.1.1 SQL Server buffer cache and the effect on I/O For this test, the configuration parameters were set as shown in Table 2. The only change in the tests was
the buffer cache size.
Table 2 Test parameters: Effects of buffer cache
Configuration Parameters
EqualLogic SAN RAID Policy RAID 10
EqualLogic SAN capacity with RAID 10 1.4TB
OLTP Workload Parameters
User Transactions TPC-C like workload from Benchmark Factory® for databases
Number of users 600
Test Duration 2.5 Hours
Perfmon Sampling Interval(seconds) 30
SQL Server VM Parameters
SQL Server VM Memory(GB) 10,18,26,34
SQL Server Max memory setting (GB) (Buffer cache size)
8,16,24,32
vCPUs 2
Database Size ~370 GB (including tables, indexes)
5.1.1.1 Application transaction response times Figure 2 below shows the impact of varying SQL buffer cache sizes on application response times. The
response times were measured using the transaction response times from the Benchmark Factory
application. As the buffer cache size increased, the logical reads that hit the buffer pool increased because

15 BP1046 | OLTP I/O Profile Study with Microsoft SQL 2012 using EqualLogic PS Series Storage
more database pages were cached. This reduced the number of physical reads from the storage and
thereby improved the application response times. Shorter application response times greatly benefit OLTP
systems that are highly user interactive and require short response times in order for users to remain
productive.
Figure 2 Effect of buffer cache size on application response times
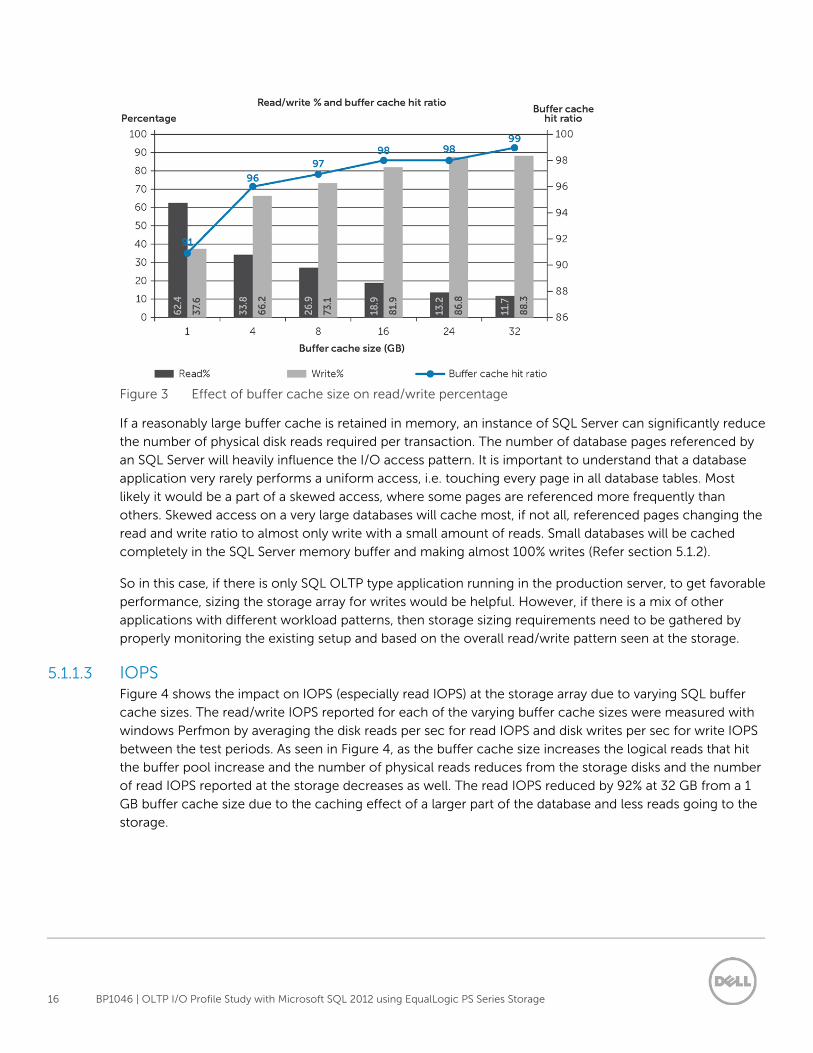
5.1.1.2 I/O Read/Write ratio Figure 3 shows the change in the I/O pattern due to varying SQL buffer cache sizes. The main reason for
the higher application response times (refer to Figure 2) at 8 GB buffer cache compared to 32 GB is due to
the changed cache hit ratio (rate of logical I/O), access pattern, and an increase of physical reads directed
to the storage subsystem with the small buffer cache at SQL Server. In fact, the changed buffer cache
sizes completely changed the physical I/O pattern from being about 26% read and 74% write, to being 12%
read and 88% write. This increased the write percentage as shown in Figure 3.
16 BP1046 | OLTP I/O Profile Study with Microsoft SQL 2012 using EqualLogic PS Series Storage
Figure 3 Effect of buffer cache size on read/write percentage
If a reasonably large buffer cache is retained in memory, an instance of SQL Server can significantly reduce
the number of physical disk reads required per transaction. The number of database pages referenced by
an SQL Server will heavily influence the I/O access pattern. It is important to understand that a database
application very rarely performs a uniform access, i.e. touching every page in all database tables. Most
likely it would be a part of a skewed access, where some pages are referenced more frequently than
others. Skewed access on a very large databases will cache most, if not all, referenced pages changing the
read and write ratio to almost only write with a small amount of reads. Small databases will be cached
completely in the SQL Server memory buffer and making almost 100% writes (Refer section 5.1.2).
So in this case, if there is only SQL OLTP type application running in the production server, to get favorable
performance, sizing the storage array for writes would be helpful. However, if there is a mix of other
applications with different workload patterns, then storage sizing requirements need to be gathered by
properly monitoring the existing setup and based on the overall read/write pattern seen at the storage.
5.1.1.3 IOPS Figure 4 shows the impact on IOPS (especially read IOPS) at the storage array due to varying SQL buffer
cache sizes. The read/write IOPS reported for each of the varying buffer cache sizes were measured with
windows Perfmon by averaging the disk reads per sec for read IOPS and disk writes per sec for write IOPS
between the test periods. As seen in Figure 4, as the buffer cache size increases the logical reads that hit
the buffer pool increase and the number of physical reads reduces from the storage disks and the number
of read IOPS reported at the storage decreases as well. The read IOPS reduced by 92% at 32 GB from a 1
GB buffer cache size due to the caching effect of a larger part of the database and less reads going to the
storage.

17 BP1046 | OLTP I/O Profile Study with Microsoft SQL 2012 using EqualLogic PS Series Storage
Figure 4 Effect of buffer cache size on IOPS

18 BP1046 | OLTP I/O Profile Study with Microsoft SQL 2012 using EqualLogic PS Series Storage
5.1.1.4 I/O latency Figure 5, shows how the database data and log volume latencies hosted at the storage are impacted by
varying buffer cache sizes. These latencies were measured using Perfmon for the volumes appearing as
drive letters at the SQL Server. As explained in the previous sections, an increase in the buffer cache size
increases the write percentage, and therefore, in write latency. Read latency will show an increase with
even a small percentage of reads since writes have a higher priority than reads (refer to Figure 5).
Figure 5 Buffer cache size impact on storage latency
The graph shows that the database write latency is higher than the read latency and hence it would be
beneficial to size the storage system to accommodate this write profile. Choosing the appropriate RAID
policy for storage based on the workload patterns and storage tiering are performance improving
examples of EqualLogic storage tuning.
5.1.1.5 I/O Block sizes In the TPC-C type workload, when the buffer cache size increased, the read I/O block size also increased
and the write I/O block size remained almost constant (~8 K). Figure 6 shows the impact of buffer cache
size on the I/O block sizes.

19 BP1046 | OLTP I/O Profile Study with Microsoft SQL 2012 using EqualLogic PS Series Storage
Figure 6 Effect of buffer cache size on I/O block size
With a larger buffer cache size, the database engine was able to efficiently pre-fetch more database pages
according to their location in database files. For example, with a table that has an average row length of
1000 bytes, up to eight rows can be accommodated in an 8 K byte page. Every time a row is read into the
buffer cache on behalf of an application, up to seven other rows accompany it.
This is reflected in the read I/O block size change illustrated in the Figure 6. If the application requires the
other seven rows at the same time, the buffer space is being used effectively and future I/Os will be saved,
thus minimizing the physical reads. These variables are dependent on the access locality. Sizing buffer
caches is a challenging exercise and the I/O block size is one of the important parameters to consider.
5.1.1.6 Transactions per second The transactions per second were recorded at the Benchmark Factory application during testing. For a
constant user load submitted at the Benchmark Factory application, the TPC-C type workload used did
not show any improvement in the number of transactions per second as the buffer cache size increased at
the SQL Server. This is because of the nature of the TPC-C type workload, where the transaction rate is set
static (on the order of 0.04 TPS per virtual user) and also due to the default fixed latencies (Think time,
Keying time).
5.1.2 Different database sizes vs. buffer cache The goal for this test was to compare the effect of buffer cache on a smaller database size (~11 GB) and a
larger database (~370 GB).This test was run to understand the behavior of an entire database cached in the
buffer pool (simulating a smaller database versus a small portion of a very large database getting cached in
the buffer pool). The comparison for these tests was done based on two parameters (I/O read/write ratios
and application response times). The focus was to compare the behavior of buffer cache sizes on different
database sizes; therefore, only two parameters for comparison were needed. For this test, the
configuration parameters were set as shown in Table 3. The only change in the tests was the database
sizes.

20 BP1046 | OLTP I/O Profile Study with Microsoft SQL 2012 using EqualLogic PS Series Storage
Table 3 Test parameters: Database sizes vs. buffer cache
Configuration Parameters
EqualLogic SAN RAID Policy RAID 10
EqualLogic SAN capacity with RAID 10 1.4TB
OLTP Workload Parameters
User Transactions TPC-C type workload from Benchmark Factory for databases
Number of users 600
Test Duration 2.5 Hours
Perfmon Sampling Interval (seconds) 30
SQL Server VM Parameters
SQL Server VM Memory(GB) 3,6,18
SQL Server Max memory setting (GB) (Buffer cache size)
1,4,16
vCPUs 2
Database Sizes used (including tables, indexes)
~11 GB | ~370 GB
5.1.2.1 I/O Read/Write ratio When a database is smaller than the buffer cache size, the entire database gets cached and mostly the
writes are sent to the storage. In order to illustrate that, Figure 7 shows the read/write percentage
comparison for two databases of different sizes for the same buffer cache sizes. When a 1 GB buffer cache
size was used, for the 11 GB smaller database, the read/write was about 36/64%, for the 370 GB bigger
database it was about 62/38%. Since 11 GB is greater than the buffer cache size of 1 GB, only part of the
data was placed in the buffer cache and the remaining 36% reads were sent to the physical disks at the
storage. However, at 16 GB, where the 11 GB database would fit in the buffer cache, the reads were about
3% and the writes were about 97%. So the read/write pattern completely changed to mostly writes. At 16
GB buffer cache, even for the bigger 370 GB database, the portion of the database cached increased and
this is seen from the read/write change from 63/37% at 1 GB to about 19/81% at 16 GB.

21 BP1046 | OLTP I/O Profile Study with Microsoft SQL 2012 using EqualLogic PS Series Storage
Figure 7 Read/Write % comparison for two different Database sizes
The above tests prove that the database size along with the buffer cache size greatly impact the read/write
pattern. In fact, in Figure 7 at 1 GB, the read/write ratios of 11 GB and 370 GB databases were completely
different because the amount cached compared to the database size. As the buffer cache size increases, it
improves the read performance, however storage needs to be sized and tuned to improve write
performance.
5.1.2.2 Application transaction response times Figure 8, shows the application response time improvement in both the database sizes as the buffer cache
size is increased from 1 GB to 16 GB. At 16 GB, where the smaller 11 GB database is completely cached,
the application response time reduced by 55% from 1 GB to 16 GB buffer cache. Similarly, for the larger
database, the application response time reduced by 63% from 1 GB buffer cache to 16 GB buffer cache.

22 BP1046 | OLTP I/O Profile Study with Microsoft SQL 2012 using EqualLogic PS Series Storage
Figure 8 Application response time comparison of two database sizes
5.1.3 Checkpoints In order to understand the checkpoint behavior in an OLTP database application workload, data was
gathered at the application side using Perfmon, and also from the storage side using SANHQ (live view
feature) to see the impact of checkpoints. In these tests, there were separate log and data volumes; the
buffer cache size was set to 16 GB at the SQL Server, and 200 users were run form Benchmark Factory.
Also, the recovery-interval was set to the default value of 0, which allows the Database Engine to
automatically configure the recovery interval. In Figure 9, when the checkpoint operation happened, the
data and log write latencies increased because of a large number of write requests queued at the storage.
It is normal for data write latency to increase during a checkpoint operation. From the tests, the data
latency spikes were 30 to 35 ms during checkpoints and the checkpoints on an average occurred every
four to five minutes.

23 BP1046 | OLTP I/O Profile Study with Microsoft SQL 2012 using EqualLogic PS Series Storage
Figure 9 Impact of checkpoint operation on log write latencies
These checkpoints would occur more frequently when the number of users is increased for the same tests
or when a smaller buffer cache size is used. Pages need to be flushed to give room for the new read/write
operations on the pages. To see this behavior, the same test was run with the number of users increased
from 200 to 600, see Figure 10. As the number of users increased, more pages became dirty and the
pages needing a checkpoint increased. This resulted in a checkpoint frequency of approximately every
one to two minutes as opposed to 4 to 5 minutes.

24 BP1046 | OLTP I/O Profile Study with Microsoft SQL 2012 using EqualLogic PS Series Storage
Figure 10 Frequency of checkpoint operation for 600 users
To see the checkpoint behavior on the server side and how is trickles down to storage, the sampling
interval in Perfmon (at the application level) was set to three seconds to match the SAN HQ (at the storage
level) live view sample interval.
Figure 11 Impact of checkpoint seen at the application side (Perfmon)

25 BP1046 | OLTP I/O Profile Study with Microsoft SQL 2012 using EqualLogic PS Series Storage
As seen in figures 9, 10, and 11, not only the data write latency increased during checkpoints, but also the
read latencies increased. This is because writes have a higher priority than the reads and reads get queued
up during checkpoints. This can be seen from the red spike areas (read) closer to the blue spikes (write) in
Figure 11. Similar behavior was seen at the storage side as well. Figure 12 shows the increased read latency
areas close to the checkpoint operations in SAN HQ.
Figure 12 Impact of checkpoint seen at the storage side (SAN HQ)
SQL Server generates automatic checkpoints at intervals dependent on the number of modifications. The
time between checkpoints is longer when there are fewer modifications, and shorter if many
modifications have been made to the data.
Sometimes, the recovery interval may be so short that the database is continually in checkpoint mode,
which is not efficient. It must be noted that a short recovery interval creates frequent checkpoints with
short peak write loads, and high values create longer write peak loads during checkpoints. The duration of
the write peaks during checkpoints greatly depends on the buffer cache size. For example, if a larger
buffer cache is used and the checkpoint occurs whenever most of the cache contains updated database
pages, then the database engine has to write lots of data as quickly as possible. This might create a
response time issue for the database user. The frequency and duration of checkpoints (depending on the
recovery interval value) has to be evaluated in relationship with the I/O load generated by user transaction
activities and the method the storage device uses to handle the I/O load.
The TPC-C like transactions generate read/write ratios of ~70:30 on the client side. However, based on
the buffer cache size used at the SQL Server and the locality of the database data reference, the read/write

26 BP1046 | OLTP I/O Profile Study with Microsoft SQL 2012 using EqualLogic PS Series Storage
ratios that go to storage would vary and not always generate 70/30 read/write ratios for similar OLTP
applications. This is evident from the test results previously shown.
Note: It must be noted that, averaging the IOPs in case of OLTP type workloads can be greatly skewed
due to the checkpoint behavior. For instance there may be 3000 write IOPS pushed to the storage only
during the checkpoints but nearly 0 IOPS between the checkpoints and hence averaging the write IOPs
might be low in the order of 200-300 IOPS. So to understand the true storage performance, monitoring
during the checkpoints would be beneficial, especially for OLTP type workloads.
5.2 TPC-E type workload Compared to TPC-C, TPC-E is relatively new and simulates the OLTP workload of a brokerage firm. The
focus of the workload is the central database that executes transactions related to customer accounts.
Transactions operate against a database of 33 tables and Table 4 shows the TPC-E transactions that get
executed and their distribution during the test.
Table 4 TPC-E transactions
TPC-E Transaction and distribution
Transaction Distribution of transaction
Access Description
Trade order 10% Read/Write Buy or sell a security
Trade Result 10% Read/Write Complete the execution of a buy or sell order
Trade Status 19% Read only Get the status of an order
Trade Update 2% Read/Write Make corrections to a set of traders
Customer Position 13% Read only Get the value of a customer’s assets
Market Feed 1% Read/Write Process an update of current market activity
Market Watch 18% Read only Track market trends(e.g., for a customer’s “watch list”)
Security Detail 14% Read only Get a detailed data about security
Trade Lookup 8% Read only Get information about a set of trades
Broker Volume 5% Read only Get a summary of the volume and value of pending orders of a set of brokers

27 BP1046 | OLTP I/O Profile Study with Microsoft SQL 2012 using EqualLogic PS Series Storage
For the OLTP tests with TPC-E type workloads, the impact of change in buffer cache size at the SQL
Server was measured using the following parameters.
Application transaction response times
I/O Read/Write ratio at the storage
I/O Read/Write latency
I/OPS
I/O Block sizes
Transactions per second
5.2.1 SQL Server buffer cache and the effect on I/O For this test, the configuration parameters were set as shown in Table 5. The only change in the tests was
the buffer cache size.
Note: TPC-E is a very different and more memory and CPU intensive workload compared to TPC-C. The
number of users needed to run TPC-E transactions in Benchmark Factory would be different from the
number of users needed to run transactions in TPC-C. Therefore, it is not advisable to compare the TPC-
E performance numbers against any TPC-C workload.
Table 5 Test parameters: Effects of Buffer Cache
Configuration Parameters
EqualLogic SAN RAID Policy RAID 10
EqualLogic SAN capacity with RAID 10 1.4TB
OLTP Workload Parameters
User Transactions TPC-E type workload from Benchmark Factory for databases
Number of users 12
Test Duration 2.5 Hours
SQL Server VM Parameters
SQL Server VM Memory(GB) 66,68,69
SQL Server Max memory setting (GB) (Buffer cache size)
64,66,67
vCPUs 4
Database Size ~394 GB (including tables, indexes)

28 BP1046 | OLTP I/O Profile Study with Microsoft SQL 2012 using EqualLogic PS Series Storage
5.2.1.1 Application transaction response times Figure 13 shows the impact on application response times due to varying SQL buffer cache sizes. The
response times were measured using the query response times from Benchmark Factory. The slightly
higher application response times at 64 GB buffer cache compared to 67 GB is because there are more
physical reads directed to the storage subsystem with the small buffer cache at the SQL Server. As the
buffer cache size increases, the logical reads that hit the buffer pool increase since more database pages
were cached. This reduces the number of physical reads from the storage and thereby improves the
application response times. Similar behavior was seen in the TPC-C type workload.
Figure 13 Effect of buffer cache size on application response times
5.2.1.2 I/O read/write ratio Figure 14, below shows the change in the I/O pattern due to varying SQL buffer cache sizes. Changed
buffer cache sizes, altered the physical I/O pattern from about 95/5% read/write, to about 90/10%
read/write. Even though TPC-E like transactions produce read/write ratios of ~90:10, the size of the buffer
cache has a major impact on the percentage that hits the storage.

29 BP1046 | OLTP I/O Profile Study with Microsoft SQL 2012 using EqualLogic PS Series Storage
Figure 14 Effect of buffer cache size on read/write percentage
5.2.1.3 IOPS Figure 15 shows the impact on IOPS (especially read IOPS) at the storage array due to varying SQL buffer
cache sizes. The read/write IOPS reported for each of the varying buffer cache sizes were measured with
Perfmon by averaging the disk reads per sec for read IOPS and disk writes per sec for write IOPS between
the test periods. As seen in Figure 15, as the buffer cache size increases, the logical reads that hit the buffer
pool increase and reduce the number of physical reads from the storage disks consequently decreasing
the number of read IOPS reported at the storage. This can be seen from the percentage decrease in read
IOPS of 11% from 64 GB to 66 GB and of 19% from 64 GB to 67 GB. The SQL database engine is working
more efficiently by making use of, and reading pages from, the large buffer cache. This is evident from the
application response times reported in Figure 13.
Figure 15 Effect of buffer cache size on IOPS

30 BP1046 | OLTP I/O Profile Study with Microsoft SQL 2012 using EqualLogic PS Series Storage
5.2.1.4 I/O latency Figure 16 shows the impact on database data and log volume latencies hosted at the storage due to
varying buffer cache sizes. These latencies were measured using Perfmon for the volumes appearing as
drive letters at the SQL Server. In the TPC-E type workload, there was a slight increase in write latency and
a decrease in the read latency because of the change in read/write percentages as the buffer pool size
increased. However, in both TPC-C and TPC-E type workloads, the changed buffer cache size impacted
the write latency. This is illustrated in the slight increase in data write latency from figures 5 and 16.
Figure 16 Buffer Cache size impact on storage latency
5.2.1.5 Transactions per second Transactions per second were recorded by Benchmark Factory during the test. For the TPC-E type
workload, as the buffer cache size increased, the number of transactions per second also increased (refer
Figure 17). The TPC-E type workload showed improvement in TPS for varying buffer cache sizes with the
same user load count. This behavior is due to the nature of TPC-E workload where there are no default
latency settings unlike the TPC-C workload and also because with a bigger buffer cache size, more data
pages could be processed and therefore more transactions.

31 BP1046 | OLTP I/O Profile Study with Microsoft SQL 2012 using EqualLogic PS Series Storage
Figure 17 Buffer cache size impact on SQL transactions
5.2.1.6 Block sizes In the TPC-E type workload where the buffer cache sizes were in close range (64 GB, 66 GB, and 67 GB),
the impact on the I/O block sizes were minimal. The read I/O block size slightly increased with the bigger
buffer cache sizes and the write I/O size was almost the same (refer Figure 18). Similar behavior was
observed with the TPC-C type workload.
Figure 18 Effect of buffer cache size on I/O block size

32 BP1046 | OLTP I/O Profile Study with Microsoft SQL 2012 using EqualLogic PS Series Storage
These results are due to a bigger buffer cache size that allowed the database engine to efficiently pre-
fetch more database pages according to their location in database files. The physical reads were
minimized by keeping previously read database pages in the buffer cache as long as possible.
5.2.2 Different database sizes vs. buffer cache The configuration parameters in this test were set as shown in Table 6. The only change in the tests was
the database sizes. This test compared the effect of buffer cache between a smaller database (~140 GB)
and a larger database (~394 GB). All the test parameters were kept the same except the database sizes.
Table 6 Test parameters: Database sizes vs. buffer cache
Configuration Parameters
EqualLogic SAN 1xPS6100XV (2.5", 24 15K SAS drives,146 GB)
RAID Policy RAID 10
SQL DB Data 4x150GB volume
SQL DB Log 1x120GB volume
SQL TempDB TempData-1x60GB volume | TempLog-1x50GB volume
OLTP Workload Parameters
User Transactions TPC-E type workload from Benchmark Factory® for databases
Number of users 12
Test Duration 2.5 Hours
SQL Server VM Parameters
SQL Server VM Memory(GB) 66
SQL Server Max memory setting (GB) (Buffer cache size)
64
vCPUs 4
Database Sizes used (including tables, indexes)
~140 GB | ~394 GB
5.2.2.1 Read/Write ratio Figure 19 shows the read/write percentage comparison for two databases of different sizes for the same
buffer cache sizes. When a 64 GB buffer cache size was used, for the 140 GB (smaller) database, the
read/write was about 12/88%; while for the 394 GB (bigger) database, it was about 95/5%. In the test with
the 140 GB database, a smaller read percentage went to the storage because most of the database was in

33 BP1046 | OLTP I/O Profile Study with Microsoft SQL 2012 using EqualLogic PS Series Storage
the buffer cache. In the larger (394 GB) database, most of the database reads happen from the storage
because of the smaller (64 GB) buffer cache size.
Figure 19 Read/write percentage comparison for two different Database sizes
This shows that the portion of the database accessed, and the access pattern is different for different
databases sizes and different buffer cache sizes. To properly size the storage, the proportion of the
database size to the buffer cache sizes also needs to be considered.
5.2.2.2 Application response times Figure 20 shows the application response times of the different database sizes for the same buffer cache
size of 64 GB. The application response time was around nine milliseconds for the smaller (140 GB) and 82
ms for the larger (394 GB) database. However, both response times were well below the acceptable
response time limit of two seconds. The reason is that because most of the smaller database is cached,
which is favorable for the reads. Only a small portion is cached for the larger (394 GB) database.

34 BP1046 | OLTP I/O Profile Study with Microsoft SQL 2012 using EqualLogic PS Series Storage
Figure 20 Application response times comparison for two different database sizes
From the above tests, it is clear that smaller databases benefit more quickly than larger databases when a
small buffer cache is increased in size. This is because a high proportion of a small database can be
cached quickly, whereas the same memory increase caches a small proportion of a large database. From
the results of the different database sizes tests, bigger databases would benefit from using larger buffer
cache sizes (buffer cache sizes greater than 67 GB were not tested), thus reducing the physical read IOPS
and application response times. All of the above mentioned parameters help in sizing the buffer cache in
proportion of the size of the database.

35 BP1046 | OLTP I/O Profile Study with Microsoft SQL 2012 using EqualLogic PS Series Storage
6 Collecting and examining data for SQL Server The best way to understand the access patterns for SQL Server application is through monitoring.
Monitoring helps with capacity planning and also verifying that the system can handle peak application
loads without problems. This can be done using Perfmon and SAN HQ for EqualLogic storage. It would be
useful to collect baseline data before the applications are deployed and then to periodically monitor them
after they are deployed. This method will allow any potential problems related to performance to be
spotted so that proactive measures can be taken to fix them.
This section explains the basic set of counters to collect in Perfmon when running a SQL Server database
application. In addition, the Microsoft recommended thresholds are listed to assist in identifying potential
performance bottlenecks.
Table 7 Perfmon counters for SQL Server
Perfmon Counter
Threshold Description Reference
Processor
(_Total)% Processor Time
<80% % Processor Time is the percentage of elapsed time that the processor takes to execute a non-Idle thread. A server might go to >80% at times, but if it averages between 80-90% for a sustained period of time, it indicates CPU contention. If a virtualized environment exists, it is important to look at this counter in the guest VM as well as the host. (Ex: In ESXi, VMware vCenter™ - Server Performance gives that statistic).
http://msdn.microsoft.com/en-us/library/ms178072.aspx
Memory
Available Bytes >80 MB Indicates how many bytes of memory are currently available for use by processes.
http://msdn.microsoft.com/en-us/library/ms176018.aspx
Pages Input/sec <10 Reads from hard disk per second to resolve hard pages.
http://support.microsoft.com/kb/889654
Pages/sec Reference description
Indicates the number of pages that either were retrieved from disk due to hard page faults, or written to disk to free space in the working set due to page faults. Useful only in combination with Pages Input/Sec, %Usage, %Usage Peak.
http://support.microsoft.com/kb/889654

36 BP1046 | OLTP I/O Profile Study with Microsoft SQL 2012 using EqualLogic PS Series Storage
Perfmon Counter
Threshold Description Reference
No more than 70 percent
Paging File\\% Usage
<70% Percentage of Page File in use, which indicates the server, is substituting disk space for memory.
http://support.microsoft.com/kb/889654
Paging File\\%Usage Peak
<70% Highest %Usage metric since the last time the server was restarted.
http://support.microsoft.com/kb/889654
Logical Disk/physical Disk
Average Disk sec/ Read & Average Disk sec/ Write
4-20ms for DB Data (OLTP) & <30ms for DSS 1-5ms for Log writes
A key measure of disk latency representing the average time, in milliseconds of each read/write to disk.
http://msdn.microsoft.com/en-us/library/cc966412.aspx
Disk Reads/sec & Disk Writes/sec
Reference description
An important metric to measure if there is a random workload. The number of IOPS being issued against a particular disk or volume. This number varies based on the size of I/Os issued which varies based on the hardware.
http://msdn.microsoft.com/en-us/library/cc966412.aspx
Average Disk Bytes/Read & Average Disk Bytes/Write
Reference description
Measures the size of I/Os being issued. Larger I/Os tend to have higher latency (for example, BACKUP/RESTORE operations issue 1 MB transfers by default). When used to monitor SQL Server, it gives the average size of the I/Os SQL Server is issuing.
http://msdn.microsoft.com/en-us/library/cc966412.aspx
Disk Read Bytes/sec Disk Write Bytes/sec
Reference description
The important unit of measurement for sequential I/O is throughput (MB/s). It measures total disk throughput. Ideally larger block scans should be able to heavily utilize connection bandwidth.
http://msdn.microsoft.com/en-us/library/cc966412.aspx
SQL Server: Buffer Manager

37 BP1046 | OLTP I/O Profile Study with Microsoft SQL 2012 using EqualLogic PS Series Storage
Perfmon Counter
Threshold Description Reference
Buffer cache hit ratio
>90% Indicates the percentage of pages found in the buffer cache without having to read from disk. The ratio is the total number of cache hits divided by the total number of cache lookups over the last few thousand page accesses.
http://msdn.microsoft.com/en-us/library/ms176018%28v=sql.90%29.aspx
Checkpoint pages/sec
Reference description
Indicates the number of pages flushed to disk per second by a checkpoint or other operation that requires all dirty pages to be flushed.
http://technet.microsoft.com/en-us/library/ms189628.aspx
Lazy writes/sec <20 Monitors the number of times per second that the Lazy Writer process moves dirty pages from the buffer to disk as it frees up buffer space. Lower is better with zero being ideal. When greater than 20, this counter indicates a need for more memory.
http://www.quest.com/backstage/images/promotions/SQLServer-Perfmonance-Poster.pdf
Page life expectancy
>300 Tells, on average, how many seconds SQL Server expects a data page to stay in cache. The target on an OLTP system should be at least 300 (5 min). When under 300, this may indicate poor index design (leading to increased disk I/O and less effective use of memory) or, simply, a potential shortage of memory.
http://technet.microsoft.com/en-us/library/cc966401.aspx
SQL Server: Memory Manager
Total Server Memory (KB)
Reference description
Specifies the amount of memory the server has committed using the memory manager. If this counter is consistently high compared to the amount of physical memory in the computer, it may indicate that more memory is required.
http://technet.microsoft.com/en-us/library/ms190924.aspx
Target Server Memory(KB)
Reference description
Indicates the ideal amount of memory the server can consume based on the configured max server memory.
http://technet.microsoft.com/en-us/library/ms190924.aspx

38 BP1046 | OLTP I/O Profile Study with Microsoft SQL 2012 using EqualLogic PS Series Storage
7 Conclusion To summarize the tests conducted in section 5, when the buffer cache size was increased:
There was an impact on IOPS; especially read IOPS at the storage array because of the increase in
logical reads that hit the buffer pool reducing the number of physical reads from the storage disks.
Changed the read/write percentage to mostly writes.
The application response times improve because of the improved buffer cache hit ratio and reduced
physical reads that go to the storage.
The discussions in this paper are an overview of SQL Server buffer management and how it changes the
I/O pattern going to the storage. It must be noted that every customer environment and requirements are
different. The impact of buffer cache size on the read/write percentage, application response times, IOPS,
I/O latency and TPS need to considered in when planning for SQL Server storage sizing. The appropriate
amount of memory to be used for a specific database size can only be determined from experience with
an existing monitored setup.
If the application being setup is completely new, then running some initial baseline tests (like those shown
in section 5) on smaller test deployments would aid in understanding the workload behavior and I/O
patterns with varying SQL Server memory configurations. This baseline would give the necessary
information to set up the actual production deployments. Having a better understanding of buffer cache
size, database size, and the database access patterns would help size the storage for performance and
capacity. For example, even though most of the database access is skewed, if the percentage of frequently
accessed portions of the database is known for a given buffer cache size, then the percentage of
frequently accessed database portions can be extrapolated for different buffer pool sizes.
Note: The percentage of data accessed at the storage can be gathered from SAN HQ if EqualLogic
storage arrays are being used. The group/pool I/O load space distribution in SAN HQ can be helpful in
determining if the I/O activity observed is attributable to a relatively small amount of the total dataset, or
if it is a generally uniform distribution across the entire dataset. Knowledge of the distribution of activity
can be useful in making decisions about whether or not tiering data for performance will be effective. If
data activity is concentrated in a relatively small portion of the capacity, providing higher performing
media for that capacity may prove effective in increasing the performance of an application. For example,
many databases have a core portion of the data that is frequently accessed such as indexes and
reference data accessed by all users. This portion of the data, if accelerated, will often improve the overall
performance of the database. The group I/O load space distribution graph shows the amount of data that
falls into one of three categories: high I/O, medium I/O, and low I/O.
39 BP1046 | OLTP I/O Profile Study with Microsoft SQL 2012 using EqualLogic PS Series Storage
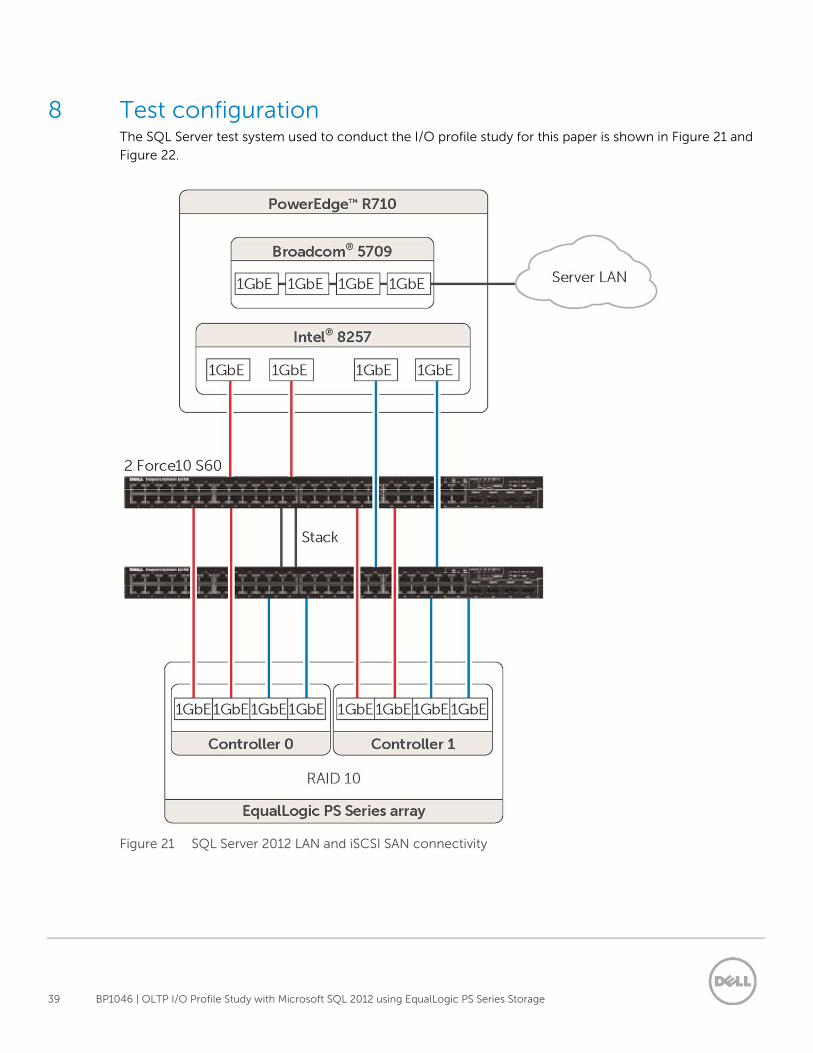
8 Test configuration The SQL Server test system used to conduct the I/O profile study for this paper is shown in Figure 21 and
Figure 22.
Figure 21 SQL Server 2012 LAN and iSCSI SAN connectivity

40 BP1046 | OLTP I/O Profile Study with Microsoft SQL 2012 using EqualLogic PS Series Storage
Figure 22 High level view of test system components
Some of the key design details of the test system configuration include (refer to Figure 22):
Installed and configured SQL Server 2012 Enterprise Edition in a Windows Server 2008 R2 SP1
Enterprise Edition virtual machine (SQL DB VM) hosted on a VMware vSphere ESXi 5 server with a
Dell PowerEdge™ R710 server.
The four local disks installed in the R710 server were configured as a RAID 5 set. ESXi 5 was installed
on these disks, and the guest virtual machine OS disk partitions were also hosted within the virtual
machine file system on these disks.
A second VMware ESXi 5 server (INFRA) was used to host virtual machines for vCenter and Active
Directory.
A third VMware ESXi 5 server (LOAD GEN) was used to host a Windows 2008 R2 workload simulation
virtual machine, running an instance of Benchmark Factory.
The MONITOR server was a PowerEdge R710 server running Windows 2008 R2 natively. It was used
to host SAN HQ, and Perfmon.
The SAN switches consisted of two Dell Force10™ S60 switches, configured as a single stack.
Redundant connection paths from each array controller to each switch in the stack were created.
One EqualLogic PS series array in a RAID 10 configuration was used to host SQL Server database
volumes.

41 BP1046 | OLTP I/O Profile Study with Microsoft SQL 2012 using EqualLogic PS Series Storage
A Configuration details
This section contains an overview of both the hardware and software configurations used throughout the
testing described in this document.
Table 8 Test configuration hardware components
Test Configuration Hardware Components
SQL Server® (ESXi01)
One PowerEdge R710 server running VMware ESXi v5, hosting a single SQL Server database virtual machine: BIOS Version: 6.1.0 2 x Quad Core Intel® Xeon® E5520 Processors 2.26 GHz 48 GB RAM, 4 x 146 GB 15K SAS internal disk drives Broadcom 5709c 1GbE quad-port NIC (LAN on motherboard), firmware version 6.4.5 Two Intel Quad Port VT network adapters (Intel 8257 1Gb) Firmware level 1.5-1
INFRA SERVER One (1) Dell PowerEdge R710 Server running VMware ESXi v4.1, hosting a two (2) Windows Server 2008 R2 virtual machines for Active Directory and vCenter: BIOS Version: 6.1.0 Quad Core Intel® Xeon® X5570 Processor 2.26 GHz 48 GB RAM,2 x 146 GB 15K SAS internal disk drives Broadcom 5709c 1GbE quad-port NIC (LAN on motherboard) – firmware version 6.4.5
LOAD GEN SERVER One (1) Dell PowerEdge R710 Server running VMware ESXi v4.1, hosting 1 Windows Server 2008 R2 virtual machine for Quest Bench Mark Factory: BIOS Version: 6.1.0 Quad Core Intel® Xeon® X5650 Processor 2.26 GHz 48 GB RAM, 2 x 146 GB 15K SAS internal disk drives Broadcom 5709c 1GbE quad-port NIC (LAN on motherboard) – firmware version 6.4.5
MONITOR SERVER One (1) Dell PowerEdge R710 Server with Windows Server 2008 R2 for SANHQ: BIOS Version: 6.1.0 Intel Xeon X5650 Processor 2.26 GHz 48 GB RAM,2 x 146 GB 15K SAS internal disk drives Broadcom 5709c 1GbE quad-port NIC (LAN on motherboard) – firmware version 6.4.5
Network 2 x Force10 S60 1Gb Ethernet Switch ,Firmware: 8.3.3.7
Storage 1 x EqualLogic PS Series array Dual quad-port 1GbE controllers running firmware version 5.2.4
42 BP1046 | OLTP I/O Profile Study with Microsoft SQL 2012 using EqualLogic PS Series Storage
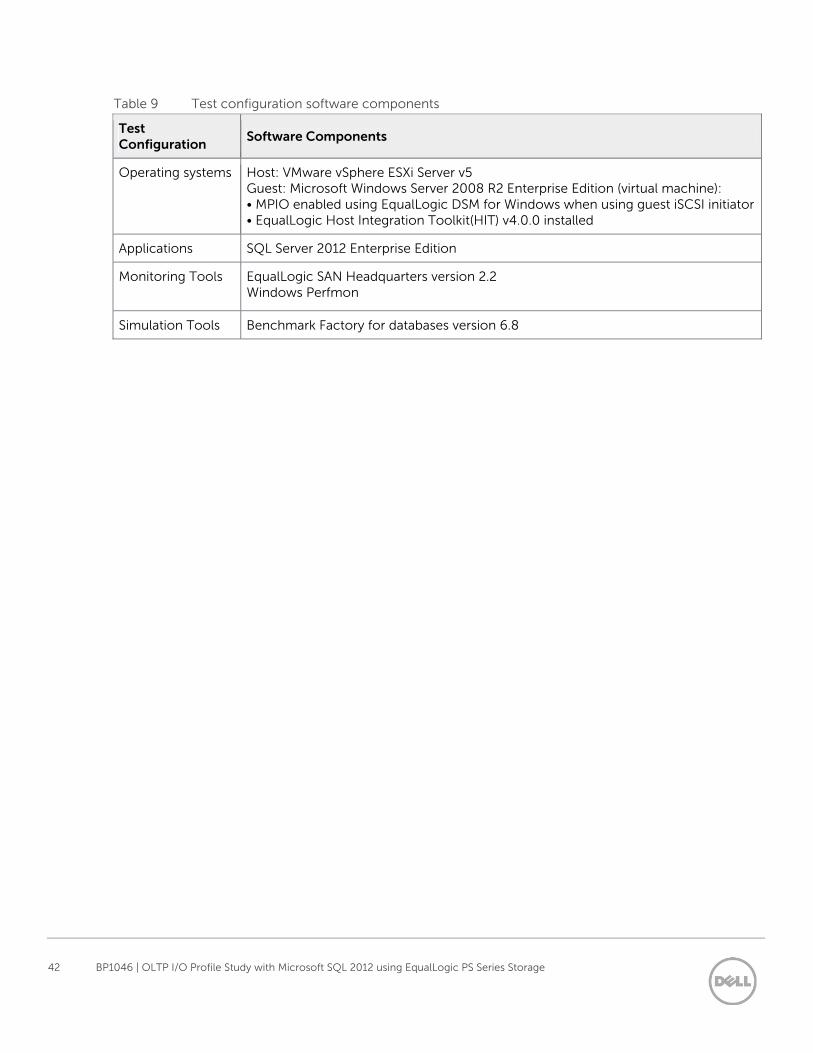
Table 9 Test configuration software components
Test Configuration
Software Components
Operating systems Host: VMware vSphere ESXi Server v5 Guest: Microsoft Windows Server 2008 R2 Enterprise Edition (virtual machine): • MPIO enabled using EqualLogic DSM for Windows when using guest iSCSI initiator • EqualLogic Host Integration Toolkit(HIT) v4.0.0 installed
Applications SQL Server 2012 Enterprise Edition
Monitoring Tools EqualLogic SAN Headquarters version 2.2 Windows Perfmon
Simulation Tools Benchmark Factory for databases version 6.8

43 BP1046 | OLTP I/O Profile Study with Microsoft SQL 2012 using EqualLogic PS Series Storage
Additional resources
Support.dell.com is focused on meeting your needs with proven services and support.
DellTechCenter.com is an IT Community where you can connect with Dell Customers and Dell employees
for the purpose of sharing knowledge, best practices, and information about Dell products and your
installations.
Referenced or recommended Dell publications:
Dell EqualLogic PS Series Network Performance Guidelines:
http://www.equallogic.com/resourcecenter/assetview.aspx?id=5229
PS Series Groups Deploying Microsoft® SQL Server in an ISCSI SAN
http://www.equallogic.com/uploadedfiles/Resources/Tech_Reports/tr1013-sql-server.pdf
Referenced or recommended Microsoft publications:
SQL Server 2012 What’s New, July 2011
http://www.microsoft.com/sqlserver/en/us/learning-center/resources.aspx
Analyzing I/O Characteristics and Sizing Storage Systems for SQL Server database applications, April
2010
http://msdn.microsoft.com/en-us/library/ee410782(v=sql.100).aspx
SQL Server 2000 I/O Basics, January 2005
http://technet.microsoft.com/library/Cc966500
For EqualLogic best practices white papers, reference architectures, and sizing guidelines for enterprise
applications and SANs, refer to Storage Infrastructure and Solutions Team Publications at:
http://dell.to/sM4hJT
44 BP1046 | OLTP I/O Profile Study with Microsoft SQL 2012 using EqualLogic PS Series Storage
This white paper is for informational purposes only. The content is provided as is, without express or
implied warranties of any kind.