oligomers of g proteins identified in live cho cells … · 2015-11-29 · oligomers of g proteins...
TRANSCRIPT

OLIGOMERS OF G PROTEINS IDENTIFIED IN LIVE CHO
CELLS AND EXTRACTS OF Sf9 CELLS
by
Huiqiao Ji
A thesis submitted in conformity with the requirements
for the degree of Master of Science
Graduate Department of Pharmaceutical Sciences
University of Toronto
© Copyright by Huiqiao Ji, 2015

ii
Oligomers of G Proteins Identified in Live CHO Cells and Extracts of Sf9 Cells
Huiqiao Ji
Master of Science
Department of Pharmaceutical Sciences, University of Toronto
2015
ABSTRACT
The oligomeric status of G proteins, unlike that of G protein coupled receptors, remains
unexplored. Dual-colour fluorescence correlation spectroscopy (dcFCS), Förster resonance energy
transfer (FRET) and step-wise photobleaching therefore were used to probe for oligomers of
fluorescently labelled G proteins (Gi112) in live CHO cells and purified extracts of Sf9 cells.
When G proteins bearing either eGFP or mCherry were co-expressed in CHO cells, the presence
of a complex was indicated by a high degree of cross-correlation in dcFCS. Model-based analyses
of apparent FRET efficiencies indicated that the complex contained at least four units.
Photobleaching of single particles of eGFP-tagged G protein purified from Sf9 cells revealed 4–6
units; this number was essentially unchanged by guanyl nucleotides or agonist-activated M2
receptor, but it was decreased by the combination of both. These results suggest that G proteins
form tetramers or larger oligomers that dissociate upon activation.

iii
ACKNOWLEDGMENTS
I would like to first thank my supervisor Dr. James W. Wells, for giving me the opportunity
to study in his laboratory. I truly benefit from his guidance and am grateful for his patience with
me. I am also thankful to my committee advisors Dr. Robert Macgregor and Dr. Ali Salahpour, for
their helpful suggestions and friendly encouragements.
I want to thank my former and present labmates, Alexey Strokach, Dr. Dar’ya Redka, Dr.
Fei Huang, John Dong, and Dr. Rabindra Shivnaraine, for the laughter we shared and the
encouragements you offered when things were difficult. My special thanks go to Dr. Rabindra
Shivnaraine, for the lessons he taught me both in life and in the lab.
I am grateful for the collaboration with Yuchong Li and Dennis Fernandes from Dr.
Claudiu Gradinaru’s laboratory on their expertise in dcFCS and single molecule tracking.
Most of all, I want to thank my family members for their unconditional love and support.
Especially, I would like to thank my father, Ping, for his encouraging words and pats on the
shoulder when I am down; my mother, Shanshan, for being my lighthouse and always guiding me
back to solid ground when I am lost; and my late grandmother, Sha, for giving me warmth on the
coldest days and always remaining close to my heart.
iv
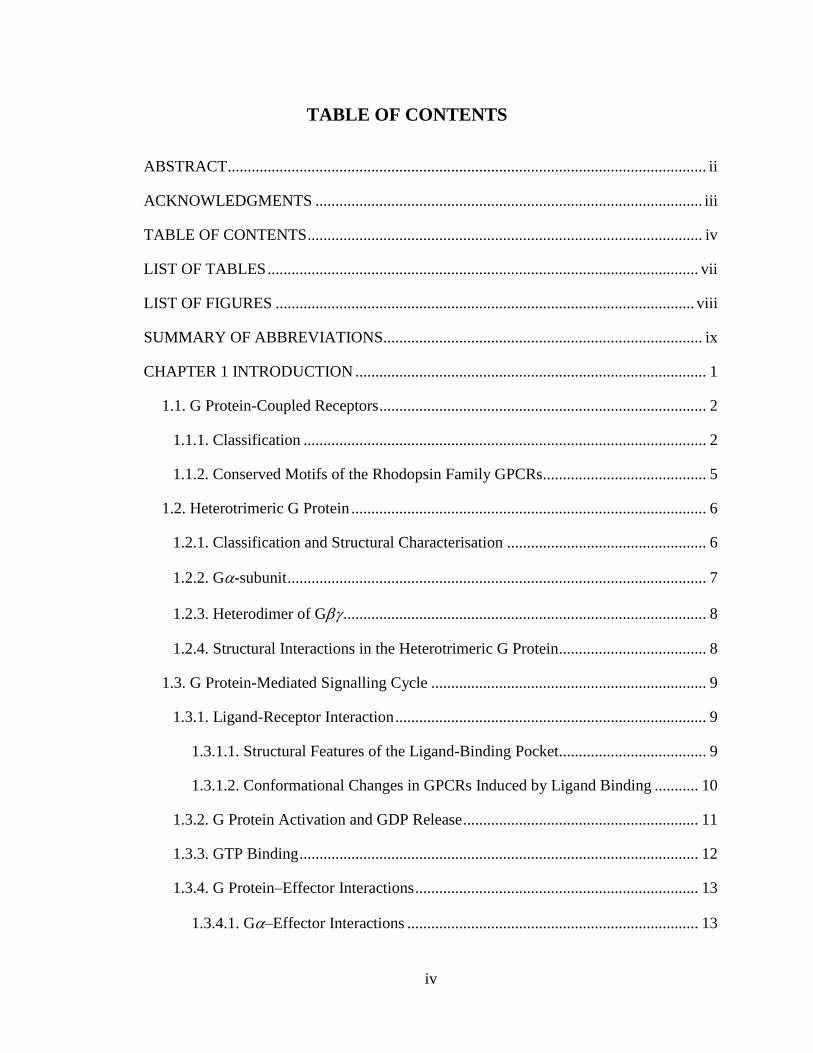
TABLE OF CONTENTS
ABSTRACT ........................................................................................................................ ii
ACKNOWLEDGMENTS ................................................................................................. iii
TABLE OF CONTENTS ................................................................................................... iv
LIST OF TABLES ............................................................................................................ vii
LIST OF FIGURES ......................................................................................................... viii
SUMMARY OF ABBREVIATIONS................................................................................ ix
CHAPTER 1 INTRODUCTION ........................................................................................ 1
1.1. G Protein-Coupled Receptors .................................................................................. 2
1.1.1. Classification ..................................................................................................... 2
1.1.2. Conserved Motifs of the Rhodopsin Family GPCRs ......................................... 5
1.2. Heterotrimeric G Protein ......................................................................................... 6
1.2.1. Classification and Structural Characterisation .................................................. 6
1.2.2. G-subunit ......................................................................................................... 7
1.2.3. Heterodimer of G ........................................................................................... 8
1.2.4. Structural Interactions in the Heterotrimeric G Protein..................................... 8
1.3. G Protein-Mediated Signalling Cycle ..................................................................... 9
1.3.1. Ligand-Receptor Interaction .............................................................................. 9
1.3.1.1. Structural Features of the Ligand-Binding Pocket..................................... 9
1.3.1.2. Conformational Changes in GPCRs Induced by Ligand Binding ........... 10
1.3.2. G Protein Activation and GDP Release ........................................................... 11
1.3.3. GTP Binding .................................................................................................... 12
1.3.4. G Protein–Effector Interactions ....................................................................... 13
1.3.4.1. G–Effector Interactions ......................................................................... 13
v
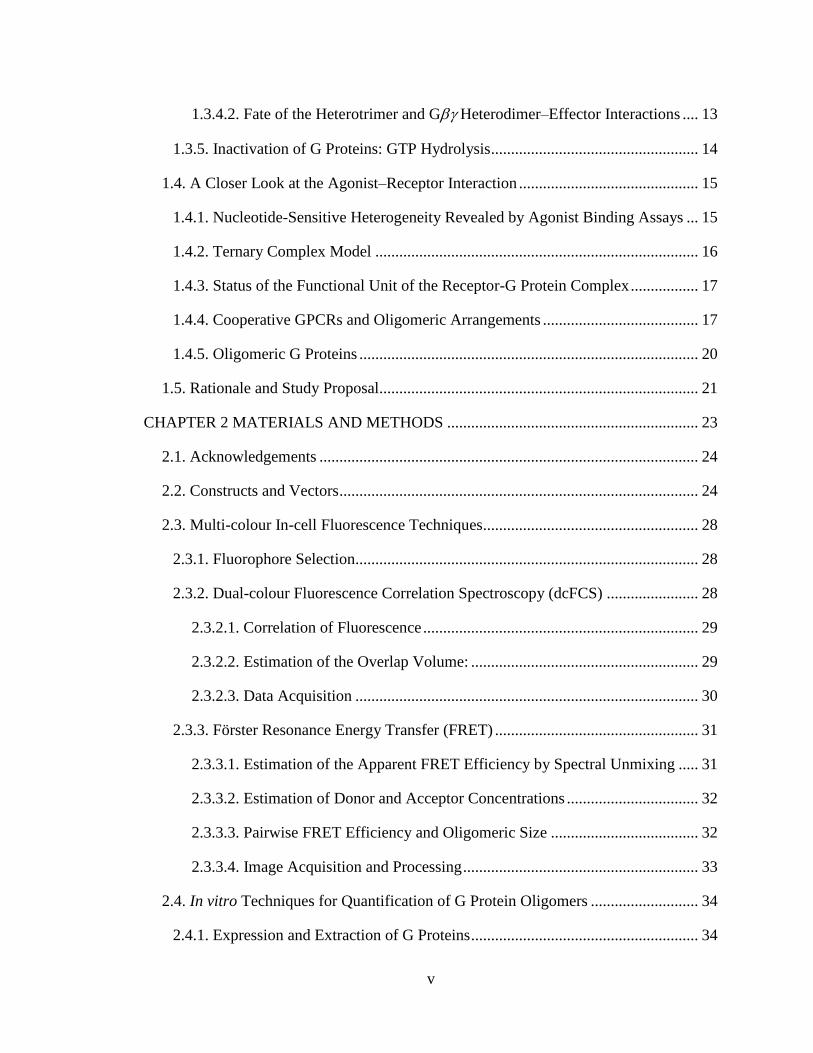
1.3.4.2. Fate of the Heterotrimer and G Heterodimer–Effector Interactions .... 13
1.3.5. Inactivation of G Proteins: GTP Hydrolysis.................................................... 14
1.4. A Closer Look at the Agonist–Receptor Interaction ............................................. 15
1.4.1. Nucleotide-Sensitive Heterogeneity Revealed by Agonist Binding Assays ... 15
1.4.2. Ternary Complex Model ................................................................................. 16
1.4.3. Status of the Functional Unit of the Receptor-G Protein Complex ................. 17
1.4.4. Cooperative GPCRs and Oligomeric Arrangements ....................................... 17
1.4.5. Oligomeric G Proteins ..................................................................................... 20
1.5. Rationale and Study Proposal................................................................................ 21
CHAPTER 2 MATERIALS AND METHODS ............................................................... 23
2.1. Acknowledgements ............................................................................................... 24
2.2. Constructs and Vectors .......................................................................................... 24
2.3. Multi-colour In-cell Fluorescence Techniques...................................................... 28
2.3.1. Fluorophore Selection...................................................................................... 28
2.3.2. Dual-colour Fluorescence Correlation Spectroscopy (dcFCS) ....................... 28
2.3.2.1. Correlation of Fluorescence ..................................................................... 29
2.3.2.2. Estimation of the Overlap Volume: ......................................................... 29
2.3.2.3. Data Acquisition ...................................................................................... 30
2.3.3. Förster Resonance Energy Transfer (FRET) ................................................... 31
2.3.3.1. Estimation of the Apparent FRET Efficiency by Spectral Unmixing ..... 31
2.3.3.2. Estimation of Donor and Acceptor Concentrations ................................. 32
2.3.3.3. Pairwise FRET Efficiency and Oligomeric Size ..................................... 32
2.3.3.4. Image Acquisition and Processing ........................................................... 33
2.4. In vitro Techniques for Quantification of G Protein Oligomers ........................... 34
2.4.1. Expression and Extraction of G Proteins ......................................................... 34
vi
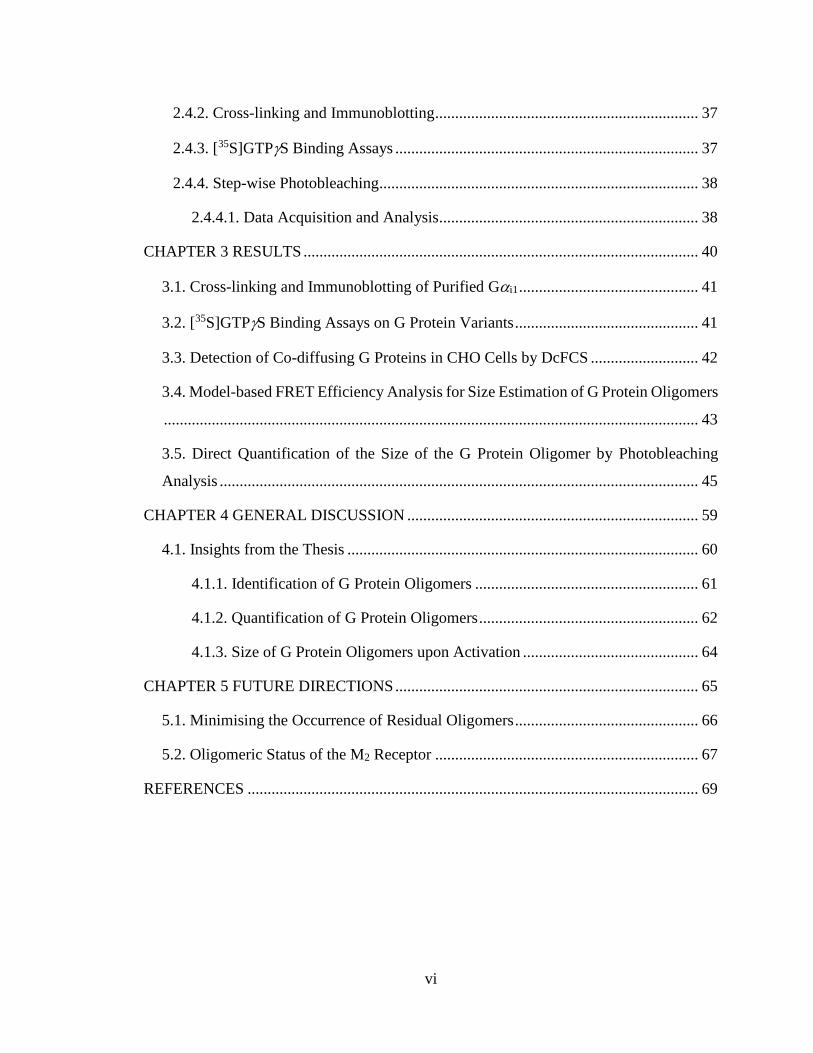
2.4.2. Cross-linking and Immunoblotting .................................................................. 37
2.4.3. [35S]GTPS Binding Assays ............................................................................ 37
2.4.4. Step-wise Photobleaching................................................................................ 38
2.4.4.1. Data Acquisition and Analysis ................................................................. 38
CHAPTER 3 RESULTS ................................................................................................... 40
3.1. Cross-linking and Immunoblotting of Purified Gi1 ............................................. 41
3.2. [35S]GTPS Binding Assays on G Protein Variants .............................................. 41
3.3. Detection of Co-diffusing G Proteins in CHO Cells by DcFCS ........................... 42
3.4. Model-based FRET Efficiency Analysis for Size Estimation of G Protein Oligomers
...................................................................................................................................... 43
3.5. Direct Quantification of the Size of the G Protein Oligomer by Photobleaching
Analysis ........................................................................................................................ 45
CHAPTER 4 GENERAL DISCUSSION ......................................................................... 59
4.1. Insights from the Thesis ........................................................................................ 60
4.1.1. Identification of G Protein Oligomers ........................................................ 61
4.1.2. Quantification of G Protein Oligomers ....................................................... 62
4.1.3. Size of G Protein Oligomers upon Activation ............................................ 64
CHAPTER 5 FUTURE DIRECTIONS ............................................................................ 65
5.1. Minimising the Occurrence of Residual Oligomers .............................................. 66
5.2. Oligomeric Status of the M2 Receptor .................................................................. 67
REFERENCES ................................................................................................................. 69
vii
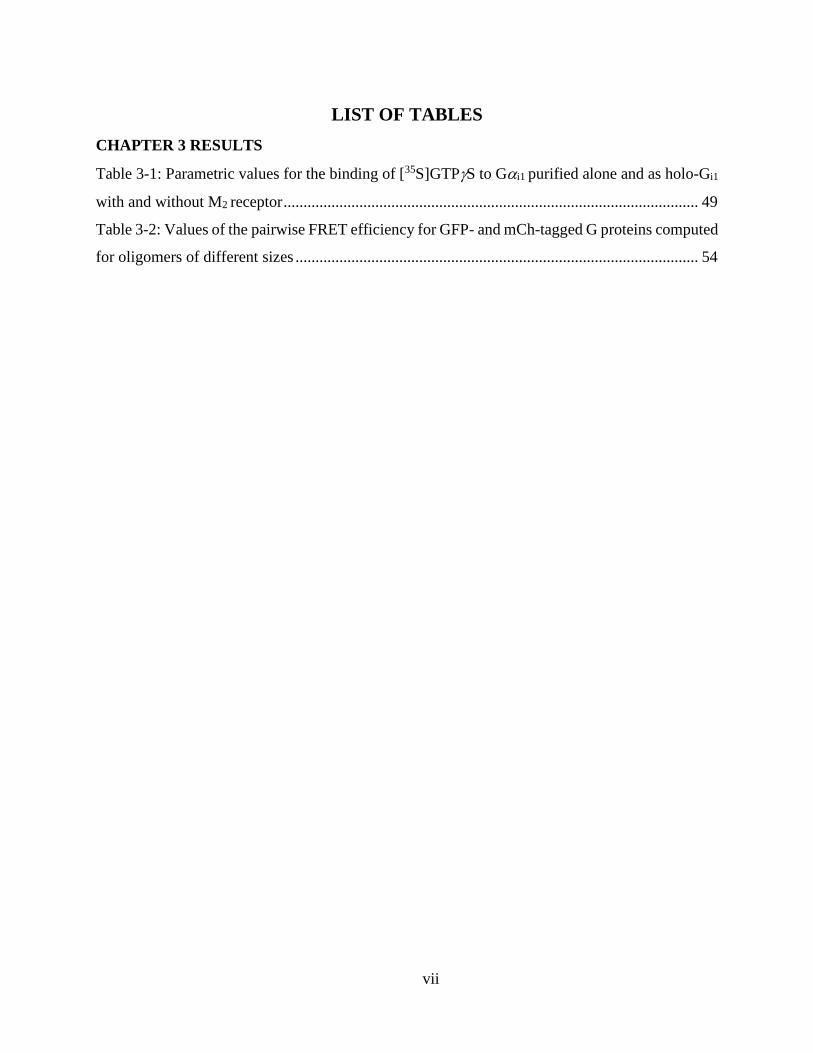
LIST OF TABLES
CHAPTER 3 RESULTS
Table 3-1: Parametric values for the binding of [35S]GTPS to Gi1 purified alone and as holo-Gi1
with and without M2 receptor ........................................................................................................ 49
Table 3-2: Values of the pairwise FRET efficiency for GFP- and mCh-tagged G proteins computed
for oligomers of different sizes ..................................................................................................... 54

viii
LIST OF FIGURES
CHAPTER 2 METHODS AND MATERIALS
Figure 2-1: Cartoon depiction of the various constructs used in this project. .............................. 27
Figure 2-2: Excitation and emission spectra of eGFP and mCherry. ........................................... 28
Figure 2-3: Extraction of eGFP-tagged G proteins from Sf9 cells ................................................ 36
CHAPTER 3 RESULTS
Figure 3-1: Effects of cross-linking on purified His6-Gi1. .......................................................... 47
Figure 3-2: Binding of [35S]GTPS to Gi1 and holo-G proteins purified with and without M2
receptor. ........................................................................................................................................ 48
Figure 3-3: Identification of G protein oligomers by dcFCS. ....................................................... 50
Figure 3-4: Identification of G protein oligomers by FRET. ........................................................ 51
Figure 3-5: Absence of stochastic FRET. ..................................................................................... 52
Figure 3-6: Model-base estimation of oligomeric size. ................................................................ 53
Figure 3-7: Rejection of dimeric G proteins. ................................................................................ 55
Figure 3-8: Distribution of photobleaching steps and its sensitivity to laser power in multimeric
eGFP. ............................................................................................................................................ 56
Figure 3-9: Effects of the M2 receptor and DTT on the photobleaching pattern of heterotrimeric
Gi1. ................................................................................................................................................. 57
Figure 3-10: Effects of ligands on the photobleaching pattern of heterotrimeric Gi1. .................. 58
ix
SUMMARY OF ABBREVIATIONS
A2AAR A2A adenosine receptor
ARK -adrenergic receptor kinase
2-AR 2-adrenergic receptor
2-AR*-Gs a complex of the activated 2 adrenergic receptor and Gs
BiFC bimolecular fluorescence complementation
BRET bioluminescence resonance energy transfer
BS3 bis(sulfosuccinimidyl)suberate
cAMP cyclic adenosine monophosphate
cGMP cyclic guanosine monophosphate
CHO Chinese hamster ovary
DAG diacyl glycerol
dcFCS dual-colour fluorescence correlation spectroscopy
DTT dithiothreitol
EC, ECL, and ICL extracellular, extracellular loop, and intracellular loop
EDTA ethylenediaminetetraacetic acid
eGFP enhanced green fluorescent protein
EMCCD electron multiplying charged coupled device
ER estrogen receptor
FCS fluorescence correlation spectroscopy
FRAP fluorescence recovery after photobleaching
FRET Förster resonance energy transfer
GABA -aminobutyric acid
GAP GTPase activating protein
GDP guanosine diphosphate
GIRK G protein-regulated inwardly rectifying K+-channel
GMP-PNP guanylyl imidodiphosphate
GPCR G protein-coupled receptor
GTP guanosine triphosphate
GTPS guanosine 5’-O-[3-(-thio)triphosphate]
x
H8 8th -helix of a GPCR
HEK human embryonic kidney
HEPES sodium N-(2-hydroxyethyl)piperazine-N’-2-ethanesulfonate
HRP horseradish peroxidase
IB immunoblot
IMAC immobilized metal ion affinity chromatography
IP immunoprecipitation
mCh mCherry, a monomeric red fluorescent protein
M2G a purified complex of M2 receptor and heterotrimeric G
protein
Ni2+-NTA nickel-nitrilotriacetic acid
PAGE polyacrylamide gel electrophoresis
PDE phosphodiesterase
PIP2 phosphatidylinositol 4,5-bisphosphate
PLC phospholipase C
RG receptor-G protein complex
RGS regulator of G protein signalling
SDS sodium dodecyl sulfate
Sf9 Spodoptera frugiperda
TIRFM total internal reflection fluorescence microscopy
TM transmembrane domain/region
Tris Tris(hydroxymethyl)aminomethine

1
CHAPTER 1 INTRODUCTION
2
1.1. G Protein-Coupled Receptors
1.1.1. Classification
G protein-coupled receptors (GPCRs) constitute the largest family of transmembrane
signalling molecules in the human genome96. Although of wide structural diversity, all GPCRs
possess a common structure of seven transmembrane helices (7TM) with an extracellular amino-
terminus and an intracellular carboxyl-terminus. As the helices traverse the membrane seven times,
three extracellular and three intracelluar loops (ECLs and ICLs) are formed. The first and third
ECLs are short and well conserved among different receptors. The more diverse ECL2 has been
shown to play crucial roles in binding of ligands32. The ICLs interact with intracellular proteins
such as G protein and arrestin. The ICL regions are more conserved compared to the ECLs and
display significant changes in conformation upon receptor activation87.
The conserved features of GPCRs were initially identified based on the results of
hydropathic analyses and mutation studies on various cloned receptors (e.g., reference 2). More
recently, following the emergence of the first high-resolution crystal structure of inactive
monomeric rhodopsin131, more than twenty GPCRs in both inactive and active states were resolved
in the last decade87. Resolution of those structures allows researchers to develop a thorough
understanding of the structures and functions of the receptor. A recent milestone structural
achievement of the resolution of the complex of the activated 2-AR and the heterotrimeric Gs
allows for a better view of the receptor-G protein interaction. The structure confirmed some
interactions that were previously deduced from structural and functional studies (e.g., references
31,42,64,123) and discovered some novel structural alterations of the receptor and the G protein146
whose functional significance has been investigated in further studies (e.g., references 3,65).
The superfamily of GPCRs, which has more than 800 members in humans, can be
classified into 5 main families based on phylogenetic analysis. They are the families of rhodopsin
(or Class A), secretin and adhesion (or Class B), glutamate (or Class C), and frizzled/taste2
receptors49. Except for the rhodopsin family, GPCRs in all the other families have long amino-
termini. Moreover, many of them are rich in cysteine residues, a feature that plays key roles in
ligand recognition and binding49.
Receptors in the secretin family have amino-termini that are approximately 60–80 amino
acids in length. The N-termini often contain key cysteine residues that are important in binding of
large peptide ligands. Besides the secretin receptors, members of this family also include the
3
corticotropin-releasing hormone receptors, the glucagon receptors, and the growth hormone-
releasing hormone receptors49. Crystal structure of two receptors in this family of GPCRs are
available: the glucagon receptor (GCGR)155 and the corticotropin-releasing factor 1 receptor
(CRHR1)75. Receptors in the adhesion family have large amino-termini that consist of up to 2800
amino acids. These long peptide sequences often are rich in proline residues and glycosylation
sites for the formation of adhesion-like motifs such as EGF (e.g., references 67,68). GPCRs in this
family participate in cell adhesion and many of them are orphan receptors115,161. To date, no solved
crystal structure is available for this family49.
The glutamate family contains the metabotropic glutamate receptors and the GABA
receptors which are abundant particularly in the nervous system. Ligands for these receptors are
derivatives or mimics of the excitatory neurotransmitter glutamate, such as -amino butyric acid
(GABA) and N-methyl-D-aspartic acid (NMDA) and they generally bind to the amino-terminus
of the respective receptors. The N-terminus of the metabotropic glutamate receptor forms a "Venus
fly trap" to capture and to retain ligands in an extracellular cavity52. The N-termini of the GABA
receptors are large but lack the cysteine-rich sequences found in other members of the family49.
The glutamate family also includes 5 taste receptors (TAS1)49. Only the crystal structure of
metabotropic glutamate receptor 1 (mGluR1)191 is currently available for this family.
The frizzled/taste2 receptor family contains two major groups, namely, the frizzled and
taste (TAS2) groups. In some reports, binding of Wnt (a glycoprotein substrate) at the long N-
termini (~200 amino acids long) of the frizzled receptors has been suggested to induce G protein
coupling, placing them into the GPCR superfamily157. Ten frizzled receptors together with
smoothened (SMOH), a human frizzled receptor, make up the frizzled group. They are involved
in cell proliferation, polarity, and death49. The crystal structure of smoothened was recently
solved179. Members of the taste2/TAS2 group have short amino-termini, and ligand binding
therefore is likely to occur elsewhere for this group of receptors. Very little is known for this group
of GPCRs except that they are found in tongue and palate epithelium and serve as bitter taste
receptors49.
With more than 700 members, the rhodopsin family is the largest among the five families49.
The ligand-binding site of this family is usually buried in the core of the 7TM bundle7, with the
exception of the glycoprotein-binding receptors, whose ligand-binding sites are at their amino-
termini49. Homology of the peptide sequences indicates that receptors of the rhodopsin family are

4
divided into 4 groups: -, -, -, and -groups. Receptors in some groups can be further categorised
into clusters.
Receptors in the -group are sub-divided into five major clusters: amine receptors,
adenosine receptors, melatonin receptors, opsin receptors, and prostaglandin receptors49. Of the
five, the amine receptors are among the most commonly studied targets in pharmacological
investigations. Members of this cluster include serotonin receptors, dopamine receptors,
muscarinic receptors, histamine receptors, adrenergic receptors, and trace amine receptors. They
bind small amines that have a single aromatic ring. In the current study, the M2 muscarinic receptor,
which belongs to the amine cluster of the -group in the rhodopsin family, was studied. More than
half of the crystallised GPCRs are members of the -group: rhodopsin (e.g., references 131,134),
and the 2-adrenergic receptor (e.g., references 145,146) in various states, M2 and M3 muscarinic
receptors62,92, 1 adrenergic receptor (e.g., references 76,119), D3 dopamine receptor26, A2A
adenosine receptor (e.g., references 97,192), histamine H1 receptor153, and sphingosine-1-
phosphate receptor66. It is noteworthy that only the structures of rhodopsin were determined from
material purified from native membranes.
Receptors in the -group bind peptides at regions formed by the amino-terminus, ECLs,
and extracellular (EC) regions of TM helices49. Some examples of this group include the gastrin-
releasing peptide receptor, the neurotension receptors, the growth hormone secretagogue receptor,
and the thyrotropin releasing hormone receptor. A structural representation of the -group is
provided by the crystal of the neurotensin receptor 1183. -Group receptors can be sub-divided into
clusters of the somatostatin/opioid/galanin (SOG) receptors, the melanin-concentrating hormone
(MCH) receptors, and the chemokine receptors. Ligands of the -group receptors also are peptides
which bind at the EC region of the TM helices49. Resolved -group receptor crystal structures
include -, -, and -opioid receptors58,109,190, two chemokine receptors (CXCR4 and CCR5)168,189,
and the nociception/orphanin FQ peptide receptor (NOP)174. -Group GPCRs include many
olfactory receptors and various types of receptors that bind glycoproteins, such as LH, TSH, and
FSH49. Two members of this group have been crystallised, namely, the protease-activated receptor
1 (PDB code 3VW7) and the purinergic P2Y12 receptor195.
5
1.1.2. Conserved Motifs of the Rhodopsin Family GPCRs
Alignment of the peptide sequences among receptors in the rhodopsin family reveals 20–
30 regions of conserved amino acid residues within the 7TM bundle4. Two common structural
regions identified are the E/DRY motif at the border between TM3 and ICL2 and the NPXXY
sequence at the cytosolic end of the TM7. In the discussion of this section, the residues are
numbered according to the Ballesteros-Weinstein numbering system8 to demonstrate the degree of
conservation.
The E/DRY motif has a key arginine residue (Arg3.50) that is conserved in 96% of the
rhodopsin family GPCRs87. It is connected to an acidic residue (either Asp3.49 or Glu3.49) via a salt
bridge177. This connection has been observed in all inactive and even some active crystal structures
(e.g., references 97,145,192). It remains intact in most receptor structures except in the structures
of the active form of rhodopsin* and the complex form of 2-AR*-Gs. In those two active structures,
the salt bridges are broken and the guanidinium group of Arg3.50 changes position to interact with
the C-terminus of the G subunit instead146,162. In rhodopsin, the side chain of Arg3.50 also interacts
with Asp6.30 and forms an "ionic lock" with residues of TM6177. Another important residue in the
E/DRY motif, Asp3.49 or Glu3.49, also is involved in the interaction with ligands, as suggested by
early mutagenesis results (e.g., reference 166). For instance, the carboxyl group of Asp3.49 interacts
with the protonated amine group of typical agonists for the -adrenergic receptors145.
The NPXXY motif serves as a major micro-switch for activation and has a key tyrosine
residue (Tyr7.53) that is conserved in 92% of all rhodopsin family GPCRs87. In the inactive state,
the side chain of Tyr7.53 points towards TM1, TM2, and helix 8 (H8). In the active conformation,
the side chain of Tyr7.53 points towards the core of the 7TM bundle and interacts with TM6 and
TM3 residues. In the active state, the structures of rhodopsin* and 2-AR* reveal a hydrogen bond
between Tyr7.53and Tyr5.58, another micro-switch which is conserved in 89% of GPCRs. On the
other hand, the behaviour of the Tyr5.58 side chain varies among activated structures of
receptors97,145,162,192.
6
1.2. Heterotrimeric G Protein
1.2.1. Classification and Structural Characterisation
A G protein is a heterotrimeric protein comprising -, -, and -subunits. Unlike the highly
diverse family of GPCRs, the family of G proteins has fewer members. In the human genome, 16,
5, and 12 genes code for 21 G, 6 G, and 16 G subunits, respectively41. G proteins are
categorised into four classes based on the similarity of the primary structure of G, namely, i/o,
s, q/11, and 12/13154. Nine family members of Gi/o are involved in inhibitory pathways and
interact with GPCRs such as the M2 and M4 muscarinic receptors, 2A-C adrenergic receptors, D2-
4 dopamine receptors, H3 and H4 histamine receptors, melatonin receptors, and 5-HT1A/B/D/E/F
serotonin receptors. Gi/o interacts with adenylyl cyclase to inhibit the production of second
messenger cAMP and blocks action of various cAMP-dependent pathways127. A special member
of this group, transducin (Gt), is uniquely involved in relaying the signal from photo-activated
rhodopsin. Gt interacts with phosphodiesterase (PDE) which breaks down the second messenger
cGMP and eventually leads to hyperpolarisation of the membrane potential133. Gs (3 members)
activates adenylyl cyclase and promotes the production of cAMP, in contrast to Gi/o. It interacts
with GPCRs such as 1-3 adrenergic receptors, D1 and D5 dopamine receptors, H2 histamine
receptor, and 5-HT4,6,7 serotonin receptors.
Gq/11 (4 members) interacts with the M1, 3, 5 muscarinic receptors, H1 histamine receptor,
and 5-HT2A/B/C serotonin receptors. It activates phospholipase C (PLC) which in turn hydrolyses
phosphatidylinositol 4,5-bisphosphate (PIP2) to diacyl glycerol (DAG) and inositol trisphosphate
(IP3)163. These products are involved in various pathways. For instance, DAG can interact with
Ca2+ channels and lead to an increased Ca2+ current into the cell1. G12/13 (2 members) interacts with
GPCRs such as the sphingosine-1-phosphate receptor 1 (S1P1) and the protease-activated receptor
1 (PAR1). They induce the functionality of a wide range of effectors such as Rho-specific guanine
nucleotide exchange factors (RhoGEFs)127 that exchange GDP for GTP on the G.
Similar to GPCRs, various mutation studies, molecular dynamic modeling, and high
resolution crystal structures in various conformations have allowed for a structural characterisation
of the G proteins. Some important details are discussed below along the description of the
structural features of the G protein subunits.
7
1.2.2. G-subunit
The -subunit of the G protein contains two domains: a Ras-like domain (G-Ras) and an
-helical domain (G-AH). G-Ras is a GTPase that hydrolyses bound GTP to GDP upon
activation; G-AH forms a lid over the guanyl nucleotide binding pocket and buries the bound
nucleotide in the core of the protein160. In the G-Ras domain, five loops formed by alternating -
helices and -sheet strands construct the guanyl nucleotide binding pocket: the loops between 1-
1 (G1 or p-loop), 1-2 (G2), 3-2 (G3 or SWII), 5-4 (G4), and 6-5 (G5). Residues at G1
bind to the - and -phosphates of the guanyl nucleotide. A threonine residue in G2 coordinates
the binding of Mg2+ ions. The G3 region is involved in binding of the -phosphate of GTP and
Mg2+. Residues in the G4 and G5 regions recognise the guanine ring and the guanine base of the
nuceotide160.
A structural comparison of the GDP- and GTP-bound G proteins reveals conformational
differences in three major regions. They are at or near the nucleotide binding pocket and are termed
the switch regions (SWI–III)129. These regions are located at linker 2 (between F, an -helix in
the G-AH region and 2, SWI), the G3 loop (SWII), and the loop between 4 and 3 (SWIII)160.
Changes in conformation implicate those switches in accommodating binding and releasing of the
guanyl nucleotide. The switches also have been postulated to support water molecules required for
GTP hydrolysis, to properly orientate Mg2+ ions, and to facilitate the exit of free phosphate160.
Moreover, the switch regions are crucial in arranging protein-protein interactions between G and
its partners such as G, effectors, and regulators of G protein signalling (RGS)17. The G-AH
domain, which comprises a bundle of 6 -helices, is joined to the G-Ras domain via 2 linkers
(L1 and L2)160. Due to its diverse makeup, G-AH has been shown to increase the affinity of
guanyl nucleotides to the G protein, to increase the rate of GTP hydrolysis, and to play an important
role in determining the interaction between the G protein and its specific effectors129.
Myristoylation (Gi only) and/or palmitoylation (all except for Gt) that occurs at the N-
terminal helix (N) of the G contributes to its membrane localisation129. In Gi, the singly
myristolated G was retained in the cytosol37,187. Moreover, a myristoylation-preventing mutation
at the N-terminus of G where the glycine at position 2 is replaced by an alanine also inhibits
palmitoylation50. The lack of lipid modifications eventually leads to accumulation of the G in the

8
cytoplasm50,120. Other classes of G protein that are only palmitoylated or possess mutations that
prevent palmitoylation are similarly retained in the cytoplasm37,186.
Currently, crystal structures of the Ghave been obtained for the inactive GDP-bound state:
Gt(GDP)94, Gi1(GDP)30,117, and G12/13(GDP)91; for the active GTP-bound state:
Gt(GTPS)126, Gi1(GTPS/GppNHp)28,29, Gs(GTPS)167; and for the state favoured by GDP-
AlF4-: Gt(GDP-AlF4
-)159, Gi1(GDP-AlF4-)28, and G12/13(GDP-AlF4
-)91. The crystal structures
of -subunits have also been solved with effectors, such as Gt/i(GDP-AlF4-)-RGS9-PDE156,
Gs(GTPS) in combination with the catalytic domains of adenylyl cyclase V and II171,
Gi/q(GDP-AlF4-)-GRK2 in combination with the heterodimer of 172, and G13 (GDP-AlF4
-)-
p115RhoGEF24.
1.2.3. Heterodimer of G
- and -subunits of the G protein are tightly coupled and dissociate from each other only
under denaturing conditions63. G is a seven-bladed -propeller in which each 40-amino acid blade
or WD sequence is made of four anti-parallel strands. G is composed of two -helices joined by
a loop. The amino-terminus of G is also an -helix which forms a coiled-coil structure with the
N-terminal -helix of G. This coiled-coil structure is important for the proper folding of G129.
The carboxyl-terminus of G binds to blades 5 and 6 of G158. Lipid modifications on G facilitate
membrane association of the G protein. The attachment of an isoprenyl group at the C-terminus of
G leads to membrane association and acts as a signal for further modification of Gsuch as
palmitylation129. Mutations of Gs and Gq that block palmitoylation prevent their association
with G and result in cytosolic accumulation45. Crystal structures of the G heterodimer also
have been resolved, such as that of G11158. The heterodimer has also been solved with effectors
and regulators, such as G11-phosducin54,55,104 and G12-GRK2103.
1.2.4. Structural Interactions in the Heterotrimeric G Protein
Crystal structures of two heterotrimeric G proteins (Gt/i11 and Gi112) display the
interacting sites between G and G subunits95,178. Two sites of interaction have been revealed
between G and G. One interface is composed of hydrophobic residues and exists between SWI
and II of the G and blades 5 and 7 of the G. This interface buries ~1800 Å2 of surface area and

9
plays a crucial role in locking GDP in the binding pocket of G. The other interface is located
between the N-terminus of G and blade 1 of G and buries ~900 Å2 of surface area95,178. There
is no evidence for any direct interaction between G and G95,178, although the N- and C-termini
of the two subunits are in close proximity to each other14,152.
1.3. G Protein-Mediated Signalling Cycle
G protein-mediated signalling is initiated when the externally stimulated receptor relays
the signal to its attendant G protein; the activated G protein incorporates GTP at the nucleotide-
binding pocket in the place of GDP. In this system, the G proteins bridge the receptors that
discriminate among a wide range of external stimuli and the effectors which initiate downstream
pathways inside the cell. Components of the G protein-mediated signalling cycle include the
receptor, G protein, and effector, classification and structural features of which are discussed
briefly above. Moreover, studies of various mutants and dynamic modeling, as well as structural
comparisons among solved structures of the signalling components, have shined some light on our
understanding of the interactions in the G protein-mediated signalling cycle. In the following
section, some structural features of the key interactions and associations are discussed.
1.3.1. Ligand-Receptor Interaction
1.3.1.1. Structural Features of the Ligand-Binding Pocket
Two types of ligand-binding pocket, namely, those with an open or restricted entrance, are
revealed in the ligand-bound crystal structures of GPCRs. Most members of the rhodopsin family
have an extracellular entrance for ligands at ECL2. The diverse makeup of the secondary structures
formed by the ECL2 is proposed to be the first step for recognising specific ligands87. ECL2 also
forms a disulfide bridge with a key cysteine residue (Cys3.25) in TM3, which is an important
structure for receptor stability, possibly by limiting the degree of receptor conformational change
upon activation176. The second type of binding pocket, observed in the structures of rhodopsin (e.g.,
reference 162) and the S1P1 sphingosine receptor66, is either partially or fully blocked at the
extracellular regions of the receptor. In the S1P1 receptor, the crystal structure reveals a "side"
opening between TM1 and TM7 for hydrophobic ligands to directly enter the pocket from the lipid
bilayer66.

10
As illustrated by various crystal structures, binding pockets containing residues from TM3,
TM6, and TM7 make direct contact with ligands. TM1 has not been observed structurally to
contact with the ligand but also is able to affect ligand binding, as shown in mutagenesis studies176.
Those transmembrane helices form a consensus scaffold for ligand binding, and the variability in
the makeup of the scaffold contributes to ligand specificity in different receptors. Some of these
residues also form inter-domain structures to ensure the proper orientation of a specific ligand in
the pocket and a precise conformation of the pocket176. One example is the network of inter-helical
interactions that has been modeled for the structure of inactive 1-AR176.
1.3.1.2. Conformational Changes in GPCRs Induced by Ligand Binding
Binding of a ligand induces microscopic changes in the binding pocket conformation that
lead to large-scale rearrangements of the transmembrane helices. These rearrangements act to
facilitate association of the receptor with other proteins, such as with hetreotrimeric G proteins and
arrestin146. A structural comparison of GPCRs in the inactive and active states revealed an outward
swing of TM6 as one of the most significant changes in conformation. In the structure of the
adenosine A2A receptor, the side chain of Trp6.48 interacts with the ligand, stabilises the shift of the
residue, and leads to a corresponding displacement of TM697,192.
In the 2-adrenergic receptor, the displacement of TM6 is largely dependent on the polar
interaction between the agonist and serine residues (Ser203 and Ser207) in TM5. The interaction
between TM5 and the ligand causes a subsequent inward shift of the EC tip of TM5. That shift
leads to a conformational change in a TM3 residue (Ile121), which in turn is coupled to a side-
chain movement of a residue (Phe282) in TM6165. This eventually leads to the outward swing of
TM6 (14 Å) observed in the crystal structure of 2-AR*-Gs. The displacement of TM6 allows
insertion of the 5-helix (C-terminus) of the G subunit into the cavity between TM5 and TM6146.
In addition to the conserved regions within TM5 and TM6, the structure of 2-AR*-Gs also
reveals conserved motifs in ICL2 of the receptor at the receptor-G protein interface. A conserved
phenylalanine residue (Phe139) of ICL2 is posited to be in contact with a hydrophobic surface of
G, a structure that is crucial for RG coupling146. Mutation of the phenylalanine residue resulted
in impaired coupling118. The ICL2 region is stabilised by an interaction between ICL2 and the
aspartic acid residue in the conserved DRY motif of TM3. The G protein also makes contact with
the receptor at the arginine residue of DRY, which packs against the tyrosine residue in the

11
conserved NPXXY motif in TM7146. It therefore appears that the ICL2 region links the G protein
to the conserved regions of the receptor.
Another dynamic region within the orthosteric binding pocket of the receptor involves
TM3 and TM7, and the specific conformational changes vary for different receptors. For rhodopsin,
disruption of a salt bridge formed between residues in TM3 and TM7 results in an increase of 2–
3Å in the distance between the helices87,162. In contrast, in A2AAR, the ribose rings of the agonist
form a strong network of hydrogen bonds with residues in TM3 and TM7, leading to decrease of
~2Å in the distance between the helices81,87. In 2-AR, residues of TM3 and TM7 are bridged by
the hydroxyl and amino groups of agonists, but the absolute distance between the helices does not
change extensively87,145,146.
1.3.2. G Protein Activation and GDP Release
Activated GPCRs catalyse the exchange of GDP for GTP on G, which in turn activates
the G proteins. The rate-limiting step of G protein activation is the release of GDP due to its slow
dissociation rate in the absence of a guanyl nucleotide exchange factor such as an activated GPCR
(R*)74. Release of GDP is allosterically induced by R*, as the binding sites of the active receptor
on G (N- and C-termini, as well as the loops between 4-6 and 3-5) are some 30 Å away from
the proposed nucleotide-binding pocket (G1 through G5 regions)63. Those contact sites between
the receptor and G have been revealed by mutagenesis (e.g., references 38,61,141), peptide
mapping (e.g., references 64,112) and chemical cross-linking (e.g., references 21,80). Most of the
postulated interactions were confirmed by the crystal structure of 2-AR*-Gs.
Mutations in the 5-helix and 6-5 loop of G can increase the spontaneous release of
GDP78,173 and decrease receptor-catalysed nucleotide exchange110,111. Results from site-directed
spin labeling indicate that, in the presence of an activated receptor, GDP is released upon a rigid-
body rotation of the 5-helix towards the 6-strand130. Those results suggest that the GDP release
is coordinated between the 5-helix and other parts of the G protein. Not surprisingly, when the
crystal structure of 2-AR*-Gs is compared to the inactive form of the Ras-like domain of Gs, the
5-helix of Gs in the complex is seen to translate and rotate towards the receptor. The major
displacement of the 5-helix is also associated with changes at the 6-5 and 1-1 loops146. In the
Gs-Ras structure, those loops interact with the guanosine ring and -phosphate of the nucleotide,
12
respectively. In addition, the 6-5 loop is displaced away from the nucleotide binding pocket,
potentially facilitating the exit of GDP167.
Deuterium exchange measurements showed an increased level of exchange in the 1 strand
and the N-terminus of the 5-helix upon formation of the RG complex27. On the basis of double
electron-electron resonance (DEER) distance measurements and the 2-AR*-Gs crystal structure,
a hybrid model was constructed of the complex between the active form of rhodopsin and Gi. By
tracking energy changes, the model showed a disruption of links between the 5-helix and the 6-
5 loop, the 1-helix, G which is a helical structure located between the Ras-like and the helical
domains of the -subunit, and the GDP binding site. Furthermore, the loss of contact between the
domains is one of the most drastic changes in the crystal structure of 2-AR*-Gs, where a 127ο
displacement of the -helical domain relative to the Ras-like domain was observed146. Moreover,
the observations of increased deuterium exchange at the interface between the two domains and a
large change identified by DEER spectroscopy in the distance between nitroxide probes on the two
domains confirmed the inter-domain separation27.
1.3.3. GTP Binding
After the release of GDP, the nucleotide-free G protein heterotrimer and the activated
receptor remain bound with high affinity (e.g., references 18,44). We and others (e.g., reference
146) took advantage of this phenomenon to isolate stable complexes of RG in a procedure of co-
purification (Chapter 2). The tightly-bound RG complex is thought to be only a transiently
occurring entity, however, owing to the rapid binding of GTP which is highly abundant in the
cytosol (i.e., ~µM).
A comparison of the crystal structures of the GDP-, GDP-AlF4- and GTPS-bound G
proteins reveals a similar structural arrangement in most regions of the G protein with exception
of the three switches regions that undergo significant rearrangements when GTP replaces GDP128.
While the - and -phosphates of the GTP molecule bind to the -subunit of the G protein in
region of the p-loop, the -phosphate binds at the regions of the loops of 1-2 and 3-2 that
overlap with switches 1 and 2. The phosphate hydrogen atom binds to the amide oxygen atom of
the conserved glycine residue in switch 2, and to the hydroxyl group and amide of the
serine/threonine residue of the p-loop160. The coordinate of the nucleotide, Mg2+, binds to other
residues, such as threonine in G2, and incorporates water molecules in the complex160.

13
1.3.4. G Protein–Effector Interactions
G protein activation is marked by the release of GDP and the binding of GTP. Subunits of
the G protein subsequently interact with specific effectors depending upon the signalling cascade
that they are involved in. While some G protein subunits are capable of interacting with a wide
variety of effectors, others are more specific and couple only to certain effectors (e.g., Gt and
cGMP phosphodiesterase (PDE))129.
1.3.4.1. G–Effector Interactions
Different types of G lead to varying signalling outcomes even via the same effector. For
example, interaction with Gs leads to activation of adenylyl cyclase, but interaction with Gi
results in inhibition of the effector. Gq interacts with phospholipase C (PLC) and hydrolyses
phosphatidylinositol 4,5 bisphosphate (PIP2) to second messengers, and Gt couples to PDE and
catalyses the breakdown of cGMP129. Crystal structures of G coupled to effectors have identified
interfaces between the two proteins. In general, hydrophobic side chains of the effectors insert into
the cavity formed by the N-termini of the 2- and 3-helices of G. Additional contacts at the C-
termini of the helices of 2 and 3 as well as the loops of 2-4 and 3-5 are thought to be involved
in determining the binding specificity of effectors129. Furthermore, studies other than
crystallography also suggest the involvement of the loop of 4-6 in the binding of Gt to
PDE102,144 as well as that of Gs to adenylyl cyclase10.
1.3.4.2. Fate of the Heterotrimer and G Heterodimer–Effector Interactions
The crystal structure of G-GTP reveals a spectrum of structural rearrangements at the
switch regions. In particular, rearrangement at the region where binding of the -phosphate occurs
disrupts the binding site for G. Therefore, it has been proposed that binding of GTP diminishes
the binding surface for G and leads to dissociation of the G protein heterotrimer17,56.
Subsequently, the two entities of the G protein interact with their respective effectors. However,
FRET/BRET studies that monitored the resonance energy transfer efficiencies between G and
G upon activation in live cells yielded differing results. Whereas some studies support the
dissociation hypothesis with observations of either a decrease or complete loss of resonance energy
transfer between G protein subunits (e.g., references 6,84,194), others suggest an alternative

14
possibility of subunit rearrangement with observations of increased energy transfer (e.g.,
references 19,70,93). Therefore, the status of the heterotrimeric G protein subunits after activation
remains to be elucidated.
Since the discovery of the first effector that interacts with G (i.e., the K+ ion channel in
cardiac membranes)105, other such effectors have been identified such as adenylyl cyclase169, -
adrenergic receptor kinase (ARK)139, and calcium and potassium channels (e.g., references
71,148). Mutation studies show that the interacting effectors share overlapping binding sites on
G (e.g., references 47,99,132). The overall conformation of the crystal structure of the
heterotrimer is generally preserved when the protein interacts with various effectors, although
some loops in G displace and form the binding site for the effector proteins. Moreover, the
interacting surface is also the binding site for the SWII region of G. Thus it has been argued that
binding of G inhibits binding of effectors on G, and this view is supportive of the dissociation
model of the G protein heterotrimer129.
1.3.5. Inactivation of G Proteins: GTP Hydrolysis
Termination of the signalling cycle is marked by hydrolysis of GTP to GDP and reassembly
of the heterotrimeric G protein. Key residues and regions for GTP hydrolysis on G are identified
by comparison of the crystal structures of G-GDP and G-(GDP +AlF4-). In the latter structure,
AlF4- forms a tetragonal bipyramid structure with oxygen from the -phosphate group of GDP and
a water molecule28,159,160. Comparisons of the structures of G uncovered crucial residues for
GTPase activity. Particularly, a glutamine residue appropriately places the water molecule in the
bipyramid structure, and a conserved arginine residue stabilises the negative charge on the leaving
phosphate group28,126. Moreover, the intrinsic GTPase activity of G is relatively slow as the
turnover rate of G-catalysed GTP hydrolysis is in the range of 2–5 min-1 (reference 56). Typically,
a class of proteins termed the GTPase-activating proteins or GAPs also are present to accelerate
GTP hydrolysis and to aid in the termination of the signalling cascade. These proteins were initially
found to be involved in enhancing the activity of Ras proteins in the catalytic reaction of GTP
hydrolysis160. Certain effectors also have been shown to function as GAPs160. For instance,
phospholipase 1 has been found to accelerate the GTPase activity of Gq/1113.

15
A major family of GAPs named regulators of G protein signalling, or RGS, has been
discovered. Members of the RGS family share a common domain that is segmented by linkers of
various sizes36,39. RGS proteins are proposed to stabilise the transition state of the reaction of GTP
hydrolysis based on two types of observations. One, RGS proteins have been shown to display
higher affinity for Go/i(GDP-AlF4-) than for Go/i(GTPS) or Go/i(GDP)11. Two, high-resolution
crystal structures of the G-RGS complex, such as that of Gi1(GDP-AlF4-)-RGS4170 and
Gt(GDP-AlF4-)-RGS9156, illustrate the interactions between the RGS protein core and the switch
regions of G. As previously discussed, the switches are sensitive regions for binding and
hydrolysis of the guanyl nucleotide. In addition, a comparison between the crystal structures of
G12(GDP + AlF4-) and G13(GDP) reveals that a glutamic acid residue in the loop between the
helices of D and E in the helical domain acts as a spring to separate the Ras-like and helical
domains of the -subunit. The open space between the separated domains may be involved in the
dissociation of G from the bound effector; therefore, the heterotrimer of G protein can be
subsequently reassembled91,129.
1.4. A Closer Look at the Agonist–Receptor Interaction
1.4.1. Nucleotide-Sensitive Heterogeneity Revealed by Agonist Binding Assays
Radiolabelled ligands permit direct observation of the ligand-receptor interaction. Other
than observing the direct binding behaviour of a radioligand to the receptor, a widely used method
permits studying the binding of a wide range of unlabelled agonists by observing their inhibition
pattern on the binding of a radiolabelled ligand. For example, graded concentrations of an
unlabelled agonist can be used to inhibit the labelling of receptors by a fixed concentration of
radiolabelled antagonist. For various types of GPCRs, such assays commonly give rise to an
inhibition pattern that has a shallower slope and a Hill coefficient less than 1. The shape of the
curve deviates from a rectangular hyperbola that is predictive of an interaction according to the
law of mass action. Such patterns have been demonstrated in the binding of many GPCRs, such as
the adrenergic receptor (e.g., references 60,88), the muscarinic receptor (e.g., references 15,16),
the opiate receptor77, the dopamine receptor20, and the serotonin receptor9. Addition of guanyl
nucleotides (e.g., GTP) induces a rightward shift (GTP-shift) in the inhibition curve of an agonist
and results in a curve whose Hill coefficient is near 1. Antagonist binding results in curves with
Hill coefficients near 1 and are insensitive to guanyl nucleotides (e.g., references 12,43). Partial
16
agonists produce GTP-shifts with less deviation from 1 compared to those induced by full agonists.
It has been shown that the magnitude of the GTP-shift corresponds to the efficacy of the agonist43,88.
Empirically the binding curves with Hill coefficients less than 1 can be fitted in terms of
multiple binding sites (i.e., a sum of more than one rectangular hyperbola) (e.g., references 88,113).
According to the multi-site model, the heterogeneity observed in the binding pattern is viewed as
a result of a mixture of sites of high and low affinities for the agonist; addition of GTP converts
the sites of high affinity to sites of low affinity. However, if only one gene product is present, and
if the states of the receptor do not interconvert, the multi-site model is merely a way to smooth the
data points by means of curves.
1.4.2. Ternary Complex Model
Due to the inadequate explanation of the binding behaviour provided by the multi-site
model, other mechanistic models have been proposed to describe the phenomenon of nucleotide-
sensitive heterogeneity in agonist binding. One popular model is the ternary complex model, which
regards the receptor and G protein as being monomeric entities that transiently interact during G
protein-mediated signalling. The model rationalises the observed heterogeneity as a result of
different affinities for a G protein-free receptor, which has a low affinity for the agonist, and for a
G protein-coupled receptor, which has a high affinity for the agonist. GTP, which has a higher
affinity for the uncoupled G protein, binds to the receptor-coupled G protein and promotes
disassociation of the RG complex. Dissociation of the complex by GTP eventually leads to the
GTP-shift as the uncoupled receptor has a lower affinity for agonist35.
Although the ternary complex model explained many observations qualitatively, data
simulated by mathematical models based on it were not in agreement with the experimentally
obtained binding data (e.g., references 59,98,124). To make the simulated data agree with the
observations, compromises such as changes in total G protein number were required35,116.
Furthermore, this model also has several assumptions that have been under debate. One, the
receptors are mutually independent; therefore, the heterogeneity revealed in agonist binding is
induced in the receptor by the G protein. Two, the G proteins are also assumed to be mutually
independent of each other, and this aspect has been largely overlooked in the literature. Three, the
receptor-G protein complex is assumed to be a transient entity formed by random collision of its
components.
17
1.4.3. Status of the Functional Unit of the Receptor-G Protein Complex
Upon binding of an agonist, the activated receptor relays its signal to the associated G
protein. The complex of receptor and G protein (RG) is considered as the functional unit in the
signalling cycle and its oligomeric integrity as a whole as well as that of its components has been
the subject of numerous investigations. The ternary complex model assumes a transient unit of RG,
formed by random collision, whose dissociation is regulated by guanyl nucleotides. On one hand,
guanyl nucleotides have been shown to cause dissociation of the RG complex in solubilised
preparations (e.g., references 18,56). On the other hand, the existence of a stable complex in
solubilised and even purified samples also has been reported (e.g., references 85,107). In recent
years, fluorescent techniques such as resonance energy transfer (RET) and fluorescence recovery
after photobleaching (FRAP) have been used to probe the dynamics of the RG complex (e.g.,
references 51,70,125,142). For instance, under resting conditions, specific interactions were
observed between 2A adrenergic or M4 muscarinic receptors and their cognate G protein
subunits125. A FRAP study demonstrated a receptor-dependent decrease in the mobility of a
fluorescent G protein in the complex of the M3 muscarinic receptor and Gq142. These observations
pointed to "pre-coupling" of GPCR and G protein.
Moreover, in the same FRAP study, the addition of neither agonist nor inverse agonist
changed the mobility of Gq. Furthermore, fluctuations in resonance energy transfer per se rather
than a complete loss of BRET was reported in the complex of 2A-AR and Gi112 after activation
of the receptor51. These observations suggest a stable RG complex whose components only
rearrange rather than dissociate upon activation. Meanwhile, others reported activation of receptor
to lead to dissociation of the RG complex and the heterotrimeric G protein using similar techniques
(e.g., references 69,70).
1.4.4. Cooperative GPCRs and Oligomeric Arrangements
The ternary complex model also assumes mutually independent receptors and implies that
the observed heterogeneity in the binding pattern is a result of G protein regulation. A biphasic
pattern was observed for inhibition of the labeled antagonist [3H]AF-DX 384 by the unlabelled
agonist oxotremorine-M at purified M2 receptors devoid of G protein. This observation implies
that the heterogeneity is intrinsic to the receptor and is possibly a result of different affinities of
the agonist for different protomers within a cooperative oligomer of receptors188. A similar
18
observation has also been reported for purified receptors reconstituted in phospholipid vesicles147.
In our laboratory, quantitative analyses in terms of cooperativity suggested four or more binding
sites for the agonist in a tetramer or larger oligomer of receptors. The same conclusion has been
drawn from the binding patterns of M2 receptors in native membranes135 and purified
preparations188. When M2 receptors were co-purified with G proteins, the binding profile obtained
with a labelled antagonist and graded concentrations of an unlabelled agonist became bell-shaped
in the presence of GMP-PNP, a non-hydrolysable GTP analog. Bell-shaped patterns are
inconsistent with non-interacting sites and can be accounted for by cooperativity188.
Cooperativity implies oligomers. Although it has been shown that some GPCRs from the
rhodopsin family (e.g., 2-AR) can signal as monomers185, several lines of contradicting evidence
suggestive of an oligomeric arrangement also have emerged. Early studies involving
hydrodynamic assays and target size analysis by radiation inactivation suggested the existence of
dimers or larger oligomers (e.g., references 33,140). Later, purified receptors from native tissues
were shown to migrate as dimers and trimers during electrophoresis (e.g., reference 188).
Moreover, co-immunoprecipitation (Co-IP) of differently tagged receptor purified from Sf9 cells
and increased receptor size upon chemical cross-linking have also been observed (e.g., references
34,136,137).
The GABAB receptor has been shown to form heterodimers of GABAB1 and GABAB2. As
GABAB1 only binds agonist but does not couple to G protein and GABAB2 only couples to the G
protein but does not bind agonist, a unit of both is required to transmit a signal184. Another striking
piece of evidence that directly revealed oligomers of a GPCR was the identification by atomic
force microscopy of arrays of rhodopsin dimers arranged in a pseudocrystalline lattice in the disks
of rod outer segments48.
More recently, fluorescence-based techniques such as FRAP (e.g., reference 40), RET-
based techniques, bimolecular fluorescence complementation (BiFC) (e.g., reference 53), and
single-molecule tracking have been used to detect oligomers of GPCRs in live cells. A large body
of evidence for oligomeric GPCRs comes from RET-based (FRET and BRET) studies. Briefly, in
FRET-based studies, an external excitation source irradiates the donor fluorophore, and the
efficiency of non-radiative energy transfer is monitored between two closely positioned
fluorescent molecules (a pair of compatible donor and acceptor). BRET follows the same principle,
with the replacement of the fluorescent donor by a biluminescent donor106. Since an early
19
observation of homo-oligomers of 2-adrenergic receptor in HEK-293 cells5, similar results
suggesting oligomers of a wide variety of GPCRs have been reported. Details of the results of
those studies have been systematically reviewed (e.g., reference 106). Whereas most studies of
this nature confirmed the existence of GPCR oligomers but placed only a lower limit on their size
(i.e., dimeric), a study which employed quantitative model-fitting of the FRET efficiency between
GFP2- and YFP-tagged M2 muscarinic receptors suggested tetrameric receptors in CHO cells138.
Other fluorescence techniques, such as fluorescence correlation spectroscopy (FCS), also
have been used to determine the size of oligomeric receptors. FCS estimates the size of
fluorophore-tagged receptors based on the emitted intensity as they diffuse through a small
detection volume defined by the wavelength of the laser180. Dimers have been suggested for the
serotonin 5-HT2C and the -opioid receptor in HEK-293 cells57,73. In addition to single-colour FCS,
dual-colour FCS (dcFCS) is made possible by the addition of another compatible fluorophore and
corresponding laser180. DcFCS revealed a substantial level of heterodimers between estrogen
receptors ER and ER. A combination of FRET and dcFCS led to the conclusion that the EGF
and ErbB receptors pre-form homo- and heterodimers prior to activation101. From the level of
cross-correlation between fluorescent IL-4 and the co-receptor, Weidemann et al. distinguished
two types of IL-4-induced IL-4 receptor formation: one formed a complex with its co-receptor,
while the other did not181.
The above fluorescence-based techniques acquire data either from a whole cell or over a
period of time from a small portion of the cell membrane. More recently, studies using total internal
reflection fluorescence microscopy (TIRFM) have allowed investigators to track molecules on a
single-molecule level and to count the number of fluorophore-labelled molecules that are present
in an oligomeric array. Briefly, TIRFM allows for total internal reflection using a high numerical
aperture (NA) objective. The reflected light subsequently generates a narrow evanescent field
immediately adjacent to the interface between the coverslip and the sample medium. Compared to
wide-field fluorescence, TIRFM produces clearer images with a high signal-to-noise ratio and thus
allows for the observation of single molecules. Using TIRFM, M1 muscarinic and N-formyl
peptide receptors were observed to be either stably monomeric or transiently dimeric in CHO
cells72,86; 1- and 2-adrenergic receptors were reported to vary from monomers to tetramers22.
On a structural basis, diffraction-quality crystals of oligomeric GPCRs with multiple
interacting interfaces have been resolved for different receptors, including rhodopsin151, - and -
20
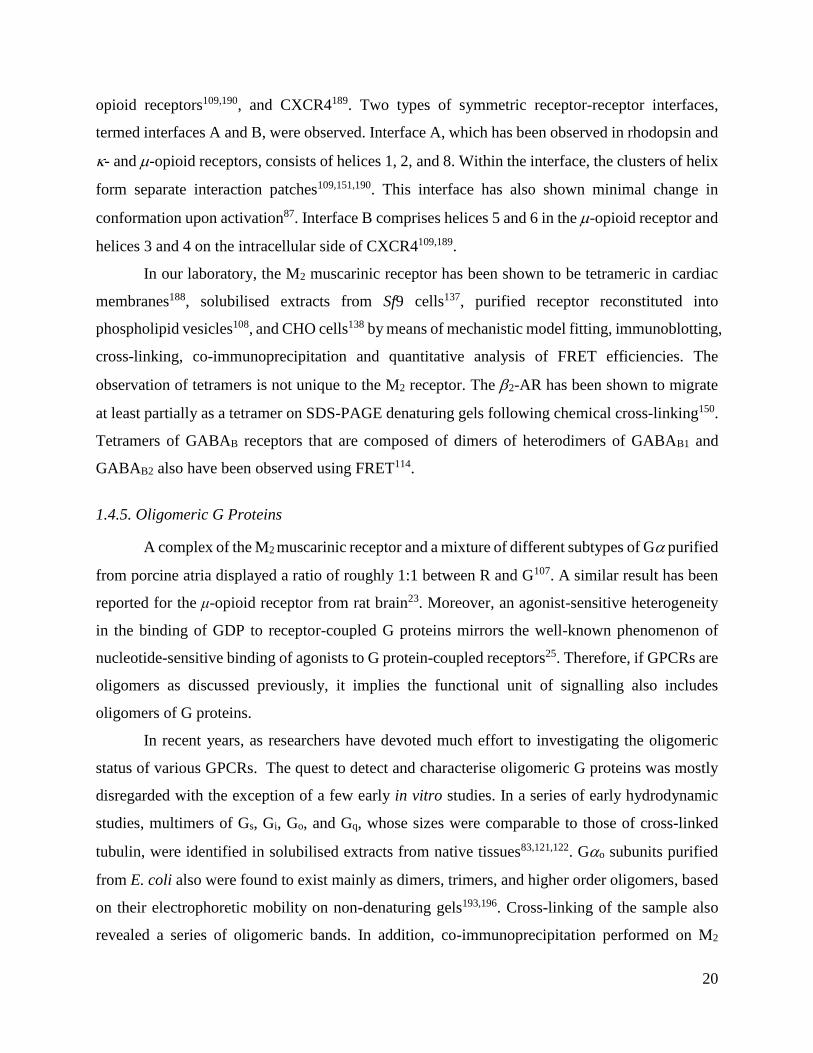
opioid receptors109,190, and CXCR4189. Two types of symmetric receptor-receptor interfaces,
termed interfaces A and B, were observed. Interface A, which has been observed in rhodopsin and
- and -opioid receptors, consists of helices 1, 2, and 8. Within the interface, the clusters of helix
form separate interaction patches109,151,190. This interface has also shown minimal change in
conformation upon activation87. Interface B comprises helices 5 and 6 in the -opioid receptor and
helices 3 and 4 on the intracellular side of CXCR4109,189.
In our laboratory, the M2 muscarinic receptor has been shown to be tetrameric in cardiac
membranes188, solubilised extracts from Sf9 cells137, purified receptor reconstituted into
phospholipid vesicles108, and CHO cells138 by means of mechanistic model fitting, immunoblotting,
cross-linking, co-immunoprecipitation and quantitative analysis of FRET efficiencies. The
observation of tetramers is not unique to the M2 receptor. The 2-AR has been shown to migrate
at least partially as a tetramer on SDS-PAGE denaturing gels following chemical cross-linking150.
Tetramers of GABAB receptors that are composed of dimers of heterodimers of GABAB1 and
GABAB2 also have been observed using FRET114.
1.4.5. Oligomeric G Proteins
A complex of the M2 muscarinic receptor and a mixture of different subtypes of G purified
from porcine atria displayed a ratio of roughly 1:1 between R and G107. A similar result has been
reported for the μ-opioid receptor from rat brain23. Moreover, an agonist-sensitive heterogeneity
in the binding of GDP to receptor-coupled G proteins mirrors the well-known phenomenon of
nucleotide-sensitive binding of agonists to G protein-coupled receptors25. Therefore, if GPCRs are
oligomers as discussed previously, it implies the functional unit of signalling also includes
oligomers of G proteins.
In recent years, as researchers have devoted much effort to investigating the oligomeric
status of various GPCRs. The quest to detect and characterise oligomeric G proteins was mostly
disregarded with the exception of a few early in vitro studies. In a series of early hydrodynamic
studies, multimers of Gs, Gi, Go, and Gq, whose sizes were comparable to those of cross-linked
tubulin, were identified in solubilised extracts from native tissues83,121,122. Go subunits purified
from E. coli also were found to exist mainly as dimers, trimers, and higher order oligomers, based
on their electrophoretic mobility on non-denaturing gels193,196. Cross-linking of the sample also
revealed a series of oligomeric bands. In addition, co-immunoprecipitation performed on M2
21
muscarinic receptor co-purified with Go, Gi1-3, and caveolins from porcine atria has revealed a
mixture of various combinations of homo- and hetero-oligomers of G subunits107. Furthermore,
guanyl nucleotides have been found to induce disaggregation of G protein oligomers. For instance,
it has been shown on polyacrylamide gels that cross-linked Go exists as oligomers; such
oligomers dissociate upon GTPS activation. In addition, no apparent cross-linking has been
observed in Go samples that were pre-incubated with the nucleotide, also indicating the possible
dissociation of the G protein oligomers upon activation by a guanyl nucleotide196.
The current project revisits the concept of a G protein oligomer, and it is the first attempt
to directly identify such oligomers in live cells. Also of interest has been the oligomeric status of
the G protein upon its activation.
1.5. Rationale and Study Proposal
The superfamily of G protein-coupled receptors is composed of a diverse collection of
transmembrane molecules that are responsive to a wide range of stimuli. The G proteins bridge the
externally activated receptors and the respective downstream effectors which subsequently lead to
intracellular signalling events. Biochemical studies as well as the recently solved high-resolution
crystal structures of various types of receptors, G proteins, and effectors have aided in the structural
visualisation of the components of this G protein-mediated signalling cycle. Moreover, many of
the crystal structures, as well as dynamic modeling and mutagenesis studies based on the solved
structures have advanced our understanding of the interactive dynamics among those components.
Of those structures, the structure of the complex between the 2-adreneric receptor and the
stimulatory heterotrimeric G protein in particular has provided a direct demonstration of the
interaction between an active receptor and its attendant G protein146.
Despite the structural discoveries, a common mechanistic description of the G protein-
mediated signalling cycle is still lacking. Early reports of radioligand binding assays described a
guanyl nucleotide-sensitive heterogeneity in binding of agonists. Various models have been used
to account for the phenomenon. The popular ternary complex model assumes a monomeric
receptor and transient receptor-G protein complex and regards the heterogeneity as a result of G
protein intervention. However, the model provides only a qualitative description of the binding
pattern, and it is inconsistent with several lines of observations regarding the size of the receptor
and the stability of the signalling complex. In our laboratory, the binding curve of a purified M2
22
receptor reconstituted as a tetramer devoid of G protein also revealed to be heterogeneous188. This
indicates that the heterogeneity is intrinsic to the receptor and perhaps arises from cooperative
interactions among receptors in an oligomeric setting. Various other types of GPCRs also have
been shown to form oligomers in live cells by fluorescence-based techniques such as FRET, BRET
and FRAP. In addition, the notion of a transient signalling complex has been debated due to reports
of contradicting results (e.g., references 51,70,125,142). Although much effort has been invested
in understanding the above two issues, comparably little attention has been paid to the oligomeric
status of the G proteins.
An agonist-sensitive heterogeneity revealed in binding of guanyl nucleotides mirrors the
more commonly known nucleotide-sensitive heterogeneity in the binding of agonist25. Moreover,
a stochiometry of 1:1 has been reported for the interaction between receptor and G protein (e.g.,
references 23,107). Therefore, if receptors exist in a cooperative oligomer, it implies the existence
of an oligomer of G proteins arranged in a similar fashion. In early hydrodynamic and chemical
cross-linking studies, oligomers of G proteins have been isolated and detected83,121,122,193,196. In the
current project, we have used fluorescence-based techniques to identify G protein oligomers in
live CHO cells and purified extracts of Sf9 cells. Furthermore, the size of the oligomer purified
from Sf9 extracts was monitored upon activation by guanyl nucleotide and by an activated M2
muscarinic receptor to reveal a ligand-dependent dissociation into smaller entities of G protein.

23
CHAPTER 2 MATERIALS AND METHODS
24
2.1. Acknowledgements
Fluorescence-based experiments were completed in collaboration with Rabindra
Shivanaraine and Nellie Han in our laboratory, as well as with Yuchong Li and Dennis Fernandes
in Dr. Claudiu Gradinaru's laboratory in the Department of Chemical and Physical Sciences,
University of Toronto (Mississauga). Models regarding the interpretation and analysis of FRET
were developed by Dr. Valerică Raicu based on the binomial expansion and Förster theory143.
MATLAB programs used for the image processing and data analysis were written locally as follows:
FRET calculation, Nellie Han and Rabindra Shivnaraine; correlation function fitting, Yuchong Li
and Rabindra Shivnaraine; and step determination of the intensity-time trajectory, Rabindra
Shivnaraine. The single molecule photobleaching experiments were conducted in collaboration
with Dennis Fernandes.
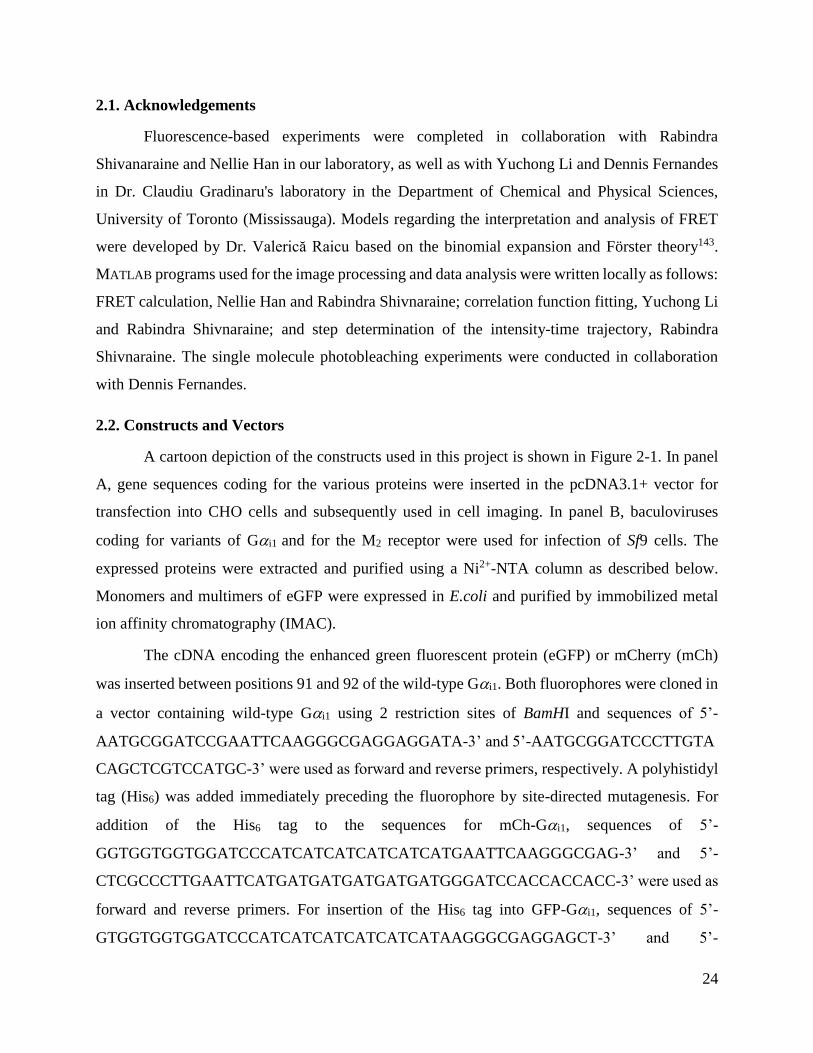
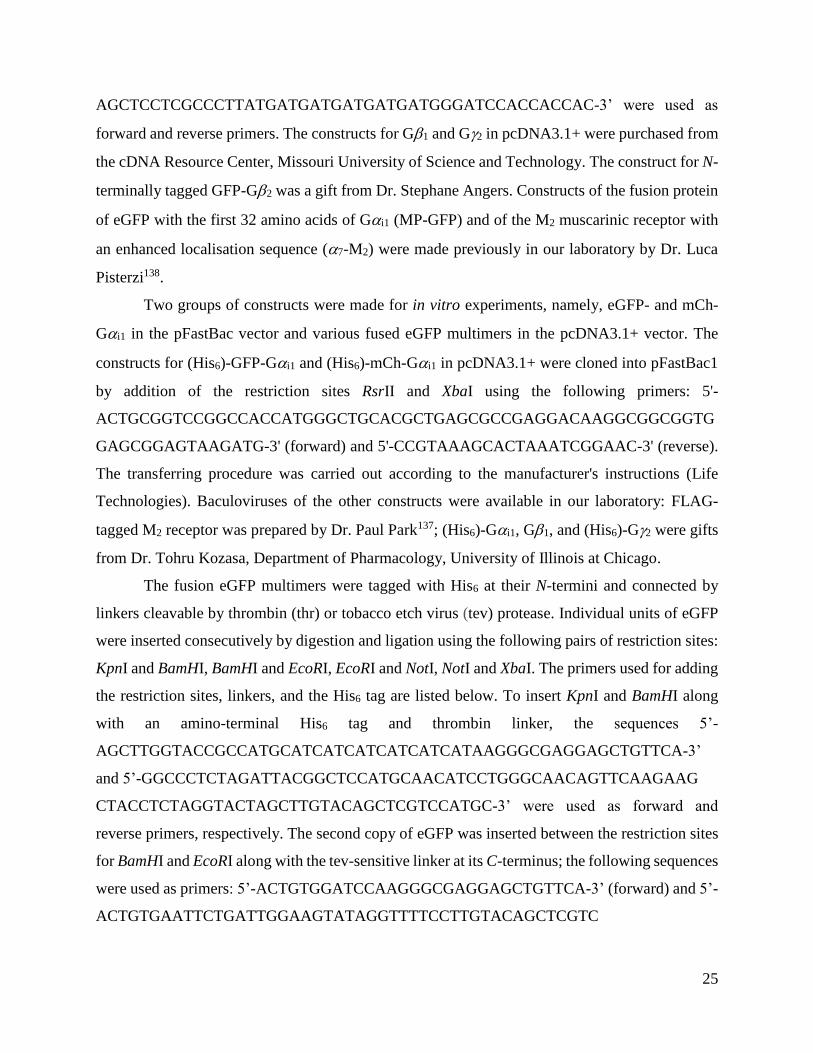
2.2. Constructs and Vectors
A cartoon depiction of the constructs used in this project is shown in Figure 2-1. In panel
A, gene sequences coding for the various proteins were inserted in the pcDNA3.1+ vector for
transfection into CHO cells and subsequently used in cell imaging. In panel B, baculoviruses
coding for variants of Gi1 and for the M2 receptor were used for infection of Sf9 cells. The
expressed proteins were extracted and purified using a Ni2+-NTA column as described below.
Monomers and multimers of eGFP were expressed in E.coli and purified by immobilized metal
ion affinity chromatography (IMAC).
The cDNA encoding the enhanced green fluorescent protein (eGFP) or mCherry (mCh)
was inserted between positions 91 and 92 of the wild-type Gi1. Both fluorophores were cloned in
a vector containing wild-type Gi1 using 2 restriction sites of BamHI and sequences of 5’-
AATGCGGATCCGAATTCAAGGGCGAGGAGGATA-3’ and 5’-AATGCGGATCCCTTGTA
CAGCTCGTCCATGC-3’ were used as forward and reverse primers, respectively. A polyhistidyl
tag (His6) was added immediately preceding the fluorophore by site-directed mutagenesis. For
addition of the His6 tag to the sequences for mCh-Gi1, sequences of 5’-
GGTGGTGGTGGATCCCATCATCATCATCATCATGAATTCAAGGGCGAG-3’ and 5’-
CTCGCCCTTGAATTCATGATGATGATGATGATGGGATCCACCACCACC-3’ were used as
forward and reverse primers. For insertion of the His6 tag into GFP-Gi1, sequences of 5’-
GTGGTGGTGGATCCCATCATCATCATCATCATAAGGGCGAGGAGCT-3’ and 5’-
25
AGCTCCTCGCCCTTATGATGATGATGATGATGGGATCCACCACCAC-3’ were used as
forward and reverse primers. The constructs for G1 and G2 in pcDNA3.1+ were purchased from
the cDNA Resource Center, Missouri University of Science and Technology. The construct for N-
terminally tagged GFP-G2 was a gift from Dr. Stephane Angers. Constructs of the fusion protein
of eGFP with the first 32 amino acids of Gi1 (MP-GFP) and of the M2 muscarinic receptor with
an enhanced localisation sequence (7-M2) were made previously in our laboratory by Dr. Luca
Pisterzi138.
Two groups of constructs were made for in vitro experiments, namely, eGFP- and mCh-
Gi1 in the pFastBac vector and various fused eGFP multimers in the pcDNA3.1+ vector. The
constructs for (His6)-GFP-Gi1 and (His6)-mCh-Gi1 in pcDNA3.1+ were cloned into pFastBac1
by addition of the restriction sites RsrII and XbaI using the following primers: 5'-
ACTGCGGTCCGGCCACCATGGGCTGCACGCTGAGCGCCGAGGACAAGGCGGCGGTG
GAGCGGAGTAAGATG-3' (forward) and 5'-CCGTAAAGCACTAAATCGGAAC-3' (reverse).
The transferring procedure was carried out according to the manufacturer's instructions (Life
Technologies). Baculoviruses of the other constructs were available in our laboratory: FLAG-
tagged M2 receptor was prepared by Dr. Paul Park137; (His6)-Gi1, G1, and (His6)-G2 were gifts
from Dr. Tohru Kozasa, Department of Pharmacology, University of Illinois at Chicago.
The fusion eGFP multimers were tagged with His6 at their N-termini and connected by
linkers cleavable by thrombin (thr) or tobacco etch virus (tev) protease. Individual units of eGFP
were inserted consecutively by digestion and ligation using the following pairs of restriction sites:
KpnI and BamHI, BamHI and EcoRI, EcoRI and NotI, NotI and XbaI. The primers used for adding
the restriction sites, linkers, and the His6 tag are listed below. To insert KpnI and BamHI along
with an amino-terminal His6 tag and thrombin linker, the sequences 5’-
AGCTTGGTACCGCCATGCATCATCATCATCATCATAAGGGCGAGGAGCTGTTCA-3’
and 5’-GGCCCTCTAGATTACGGCTCCATGCAACATCCTGGGCAACAGTTCAAGAAG
CTACCTCTAGGTACTAGCTTGTACAGCTCGTCCATGC-3’ were used as forward and
reverse primers, respectively. The second copy of eGFP was inserted between the restriction sites
for BamHI and EcoRI along with the tev-sensitive linker at its C-terminus; the following sequences
were used as primers: 5’-ACTGTGGATCCAAGGGCGAGGAGCTGTTCA-3’ (forward) and 5’-
ACTGTGAATTCTGATTGGAAGTATAGGTTTTCCTTGTACAGCTCGTC
26
CATGC-3’ (reverse). The third copy of eGFP was inserted between the restriction sites for EcoRI
and NotI along with the thrombin-sensitive linker at the 3’-end;the following sequences were used
as forward and reverse primers: 5’-ACTGTGAATTCAAGGGCGAGGAGCTGTTC
A-3’and 5’-TCGATGCGGCCGCGCTACCTCTAGGTACTAGCTTGTACAGCTCGTCCATG
C-3’. The fourth eGFP was inserted between the sites for NotI and XbaI using the following
primers: 5’-ACTGTGCGGCCGCAAGGGCGAGGAGCTGTTCA-3’ (forward) and 5’-
GGCCCTCTAGATTACTTGTACAGCTCGTCCATGC-3’ (reverse).
27
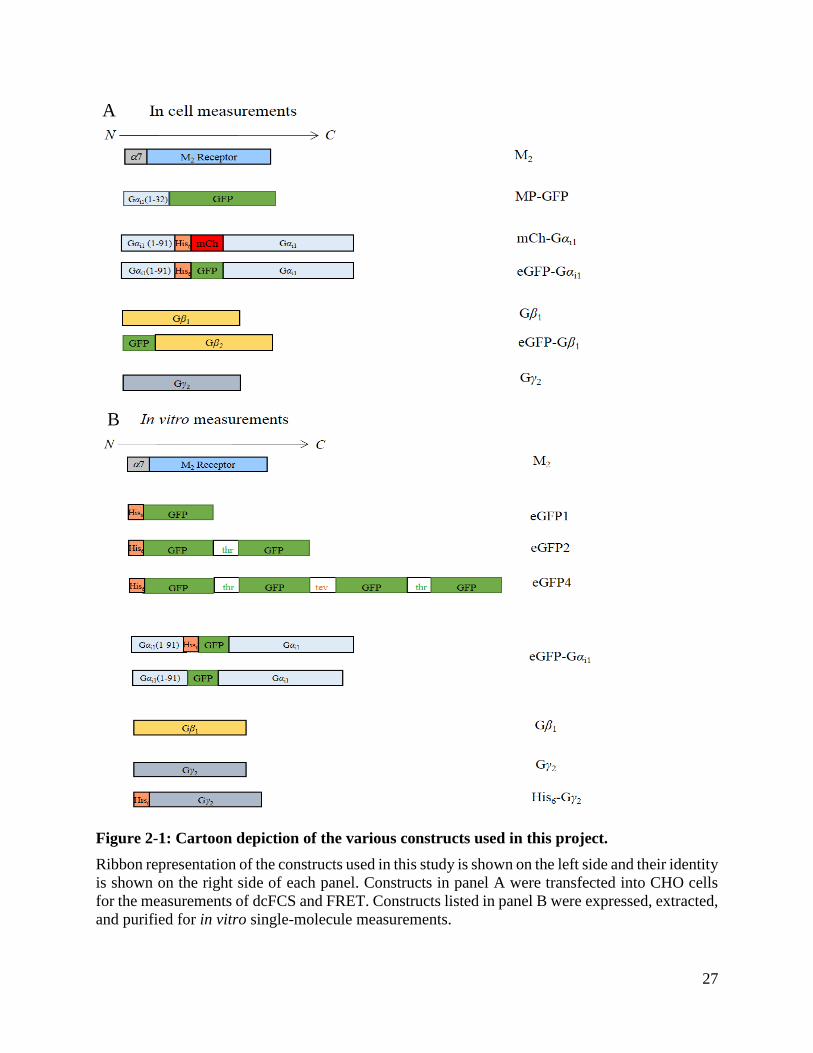
Figure 2-1: Cartoon depiction of the various constructs used in this project.
Ribbon representation of the constructs used in this study is shown on the left side and their identity
is shown on the right side of each panel. Constructs in panel A were transfected into CHO cells
for the measurements of dcFCS and FRET. Constructs listed in panel B were expressed, extracted,
and purified for in vitro single-molecule measurements.
A
B
28
2.3. Multi-colour In-cell Fluorescence Techniques
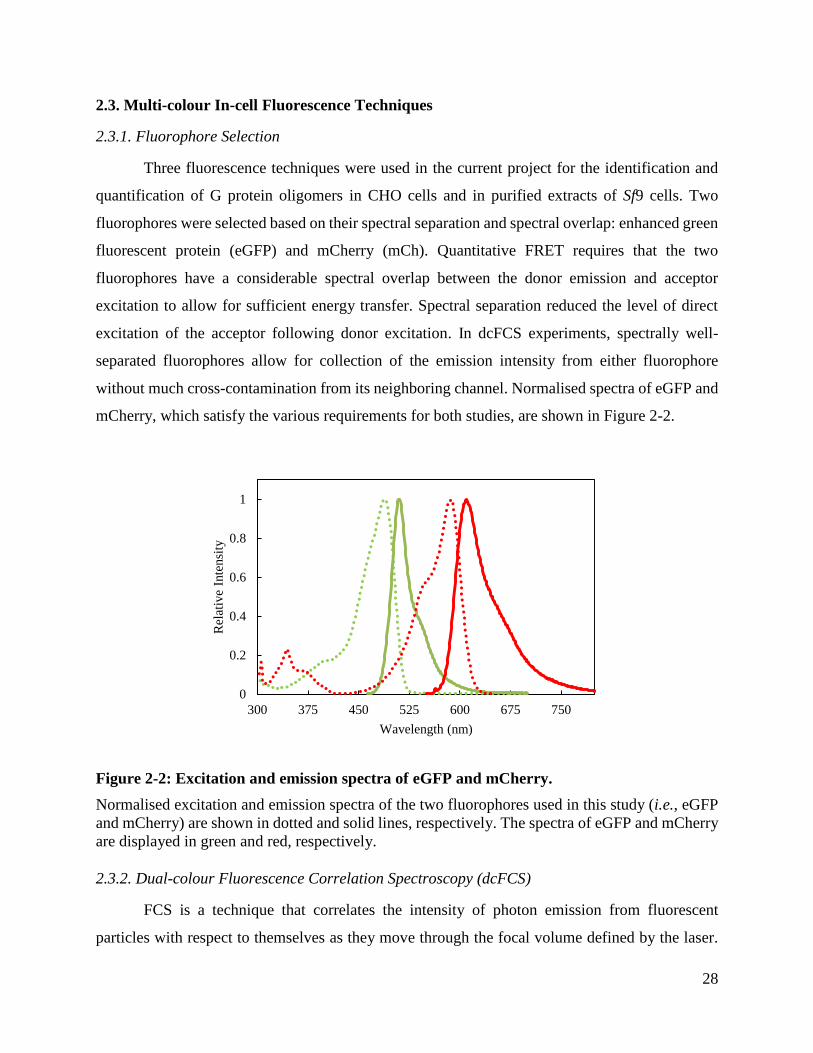
2.3.1. Fluorophore Selection
Three fluorescence techniques were used in the current project for the identification and
quantification of G protein oligomers in CHO cells and in purified extracts of Sf9 cells. Two
fluorophores were selected based on their spectral separation and spectral overlap: enhanced green
fluorescent protein (eGFP) and mCherry (mCh). Quantitative FRET requires that the two
fluorophores have a considerable spectral overlap between the donor emission and acceptor
excitation to allow for sufficient energy transfer. Spectral separation reduced the level of direct
excitation of the acceptor following donor excitation. In dcFCS experiments, spectrally well-
separated fluorophores allow for collection of the emission intensity from either fluorophore
without much cross-contamination from its neighboring channel. Normalised spectra of eGFP and
mCherry, which satisfy the various requirements for both studies, are shown in Figure 2-2.
Figure 2-2: Excitation and emission spectra of eGFP and mCherry.
Normalised excitation and emission spectra of the two fluorophores used in this study (i.e., eGFP
and mCherry) are shown in dotted and solid lines, respectively. The spectra of eGFP and mCherry
are displayed in green and red, respectively.
2.3.2. Dual-colour Fluorescence Correlation Spectroscopy (dcFCS)
FCS is a technique that correlates the intensity of photon emission from fluorescent
particles with respect to themselves as they move through the focal volume defined by the laser.
0
0.2
0.4
0.6
0.8
1
300 375 450 525 600 675 750
Rel
ativ
e In
tensi
ty
Wavelength (nm)

29
The focal volume is dependent upon the focusing of the laser beam, where the ratio (s) of height
to width reflects this focus. Values of s in this study were measured to be between 4 and 6.
2.3.2.1. Correlation of Fluorescence
The fluorescence fluctuation at any time point (𝛿𝐹𝑖(𝑡)) is compared with that of the same
fluorophore at some lag time τ later, ( 𝛿𝐹𝑖(𝑡 + 𝜏) ). This is normalised over the averaged
fluorescence signal (Equation 2-1) and the resulting normalised quantity is termed auto-correlation,
or 𝐺𝑖(𝜏), for the monitored fluorophore. Correlation of the intensities of two spectrally separated
signals (colours) is a special implementation of FCS known as dual-colour FCS (dcFCS). The two-
colour correlation is known as cross-correlation (𝐺𝑥(𝜏)) and is calculated according to Equation
2-2. In the equation, the subscripts g and r respectively refer to the emission intensities from eGFP
and mCherry. To identify the diffusive properties of the auto- and cross-correlating components,
various models need to be fitted to the data. Receptor and G protein at the membrane can diffuse
in only two dimensions (x and y); therefore the data were fit with a two-dimensional model that
accounts for crowding (i.e., the anomalous model)46,82 (Equation 2-3). The parameters of the model
are as follows: 𝐺(0) corresponds to the amplitude of the correlation curve and 𝜏𝐷 is the diffusion
time of the molecules through the focal volume. The anomalous factor is described by . Values
of less than 1 would indicate the diffusion of crowded molecules. In the case of auto-correlation,
the average number of molecules within the confocal volume is inversely proportional to the
amplitude of the fitted diffusion curve (𝐺(0)). The extent of co-diffusion of eGFP and mCherry is
measured by the amplitude of the cross-correlation curves. The existence of cross-correlation
would imply that the fluorophore-tagged molecules diffuse as oligomers.
𝐺𝑖(𝜏) =⟨𝛿𝐹𝑖(𝑡)∙𝛿𝐹𝑖(𝑡+𝜏)⟩
⟨𝐹𝑖(𝑡)⟩2
𝐺𝑥(𝜏) =⟨𝛿𝐹𝑔(𝑡)∙𝛿𝐹𝑟(𝑡+𝜏)⟩
⟨𝐹𝑔(𝑡)⟩∙⟨𝐹𝑟(𝑡)⟩
𝐺(𝜏) = 𝐺(0)(1 + (𝑡
𝜏𝐷)
𝛼)−1
2.3.2.2. Estimation of the Overlap Volume:
Co-diffusing molecules are captured only within the volume illuminated by both lasers.
That volume is called the overlap volume and it is less than either of the individual focal volumes.
To accurately account for the number of co-diffusing flurorophores, a correction factor for the
Equation 2-2
Equation 2-1
Equation 2-3
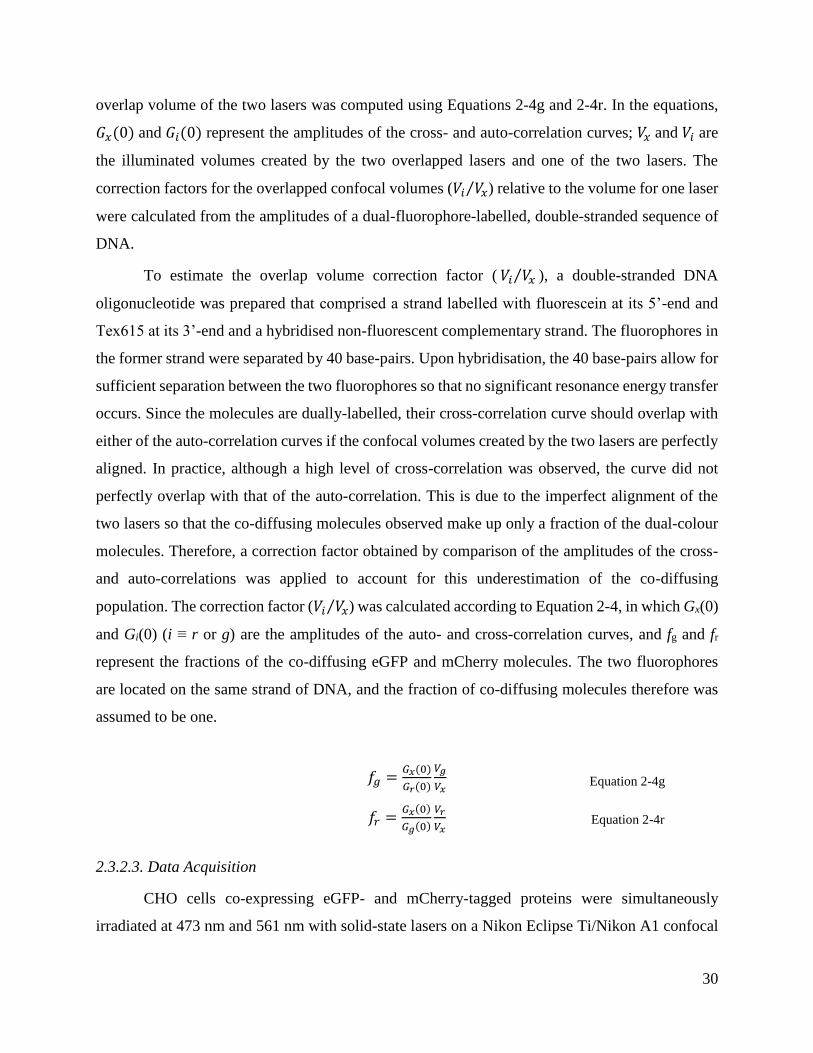
30
overlap volume of the two lasers was computed using Equations 2-4g and 2-4r. In the equations,
𝐺𝑥(0) and 𝐺𝑖(0) represent the amplitudes of the cross- and auto-correlation curves; 𝑉𝑥 and 𝑉𝑖 are
the illuminated volumes created by the two overlapped lasers and one of the two lasers. The
correction factors for the overlapped confocal volumes (𝑉𝑖 𝑉𝑥⁄ ) relative to the volume for one laser
were calculated from the amplitudes of a dual-fluorophore-labelled, double-stranded sequence of
DNA.
To estimate the overlap volume correction factor ( 𝑉𝑖 𝑉𝑥⁄ ), a double-stranded DNA
oligonucleotide was prepared that comprised a strand labelled with fluorescein at its 5’-end and
Tex615 at its 3’-end and a hybridised non-fluorescent complementary strand. The fluorophores in
the former strand were separated by 40 base-pairs. Upon hybridisation, the 40 base-pairs allow for
sufficient separation between the two fluorophores so that no significant resonance energy transfer
occurs. Since the molecules are dually-labelled, their cross-correlation curve should overlap with
either of the auto-correlation curves if the confocal volumes created by the two lasers are perfectly
aligned. In practice, although a high level of cross-correlation was observed, the curve did not
perfectly overlap with that of the auto-correlation. This is due to the imperfect alignment of the
two lasers so that the co-diffusing molecules observed make up only a fraction of the dual-colour
molecules. Therefore, a correction factor obtained by comparison of the amplitudes of the cross-
and auto-correlations was applied to account for this underestimation of the co-diffusing
population. The correction factor (𝑉𝑖 𝑉𝑥⁄ ) was calculated according to Equation 2-4, in which Gx(0)
and Gi(0) (i ≡ r or g) are the amplitudes of the auto- and cross-correlation curves, and fg and fr
represent the fractions of the co-diffusing eGFP and mCherry molecules. The two fluorophores
are located on the same strand of DNA, and the fraction of co-diffusing molecules therefore was
assumed to be one.
𝑓𝑔 =𝐺𝑥(0)
𝐺𝑟(0)
𝑉𝑔
𝑉𝑥
𝑓𝑟 =𝐺𝑥(0)
𝐺𝑔(0)
𝑉𝑟
𝑉𝑥
2.3.2.3. Data Acquisition
CHO cells co-expressing eGFP- and mCherry-tagged proteins were simultaneously
irradiated at 473 nm and 561 nm with solid-state lasers on a Nikon Eclipse Ti/Nikon A1 confocal
Equation 2-4g
Equation 2-4r
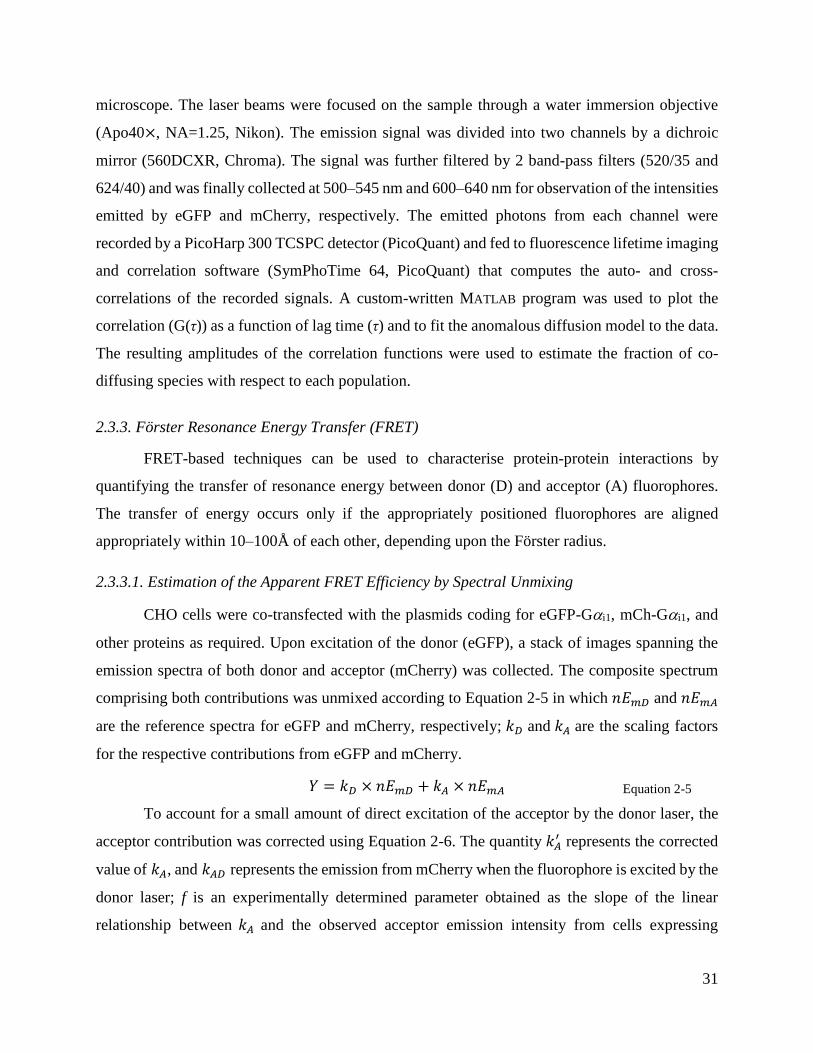
31
microscope. The laser beams were focused on the sample through a water immersion objective
(Apo40×, NA=1.25, Nikon). The emission signal was divided into two channels by a dichroic
mirror (560DCXR, Chroma). The signal was further filtered by 2 band-pass filters (520/35 and
624/40) and was finally collected at 500–545 nm and 600–640 nm for observation of the intensities
emitted by eGFP and mCherry, respectively. The emitted photons from each channel were
recorded by a PicoHarp 300 TCSPC detector (PicoQuant) and fed to fluorescence lifetime imaging
and correlation software (SymPhoTime 64, PicoQuant) that computes the auto- and cross-
correlations of the recorded signals. A custom-written MATLAB program was used to plot the
correlation (G(τ)) as a function of lag time (τ) and to fit the anomalous diffusion model to the data.
The resulting amplitudes of the correlation functions were used to estimate the fraction of co-
diffusing species with respect to each population.
2.3.3. Förster Resonance Energy Transfer (FRET)
FRET-based techniques can be used to characterise protein-protein interactions by
quantifying the transfer of resonance energy between donor (D) and acceptor (A) fluorophores.
The transfer of energy occurs only if the appropriately positioned fluorophores are aligned
appropriately within 10–100Å of each other, depending upon the Förster radius.
2.3.3.1. Estimation of the Apparent FRET Efficiency by Spectral Unmixing
CHO cells were co-transfected with the plasmids coding for eGFP-Gi1, mCh-Gi1, and
other proteins as required. Upon excitation of the donor (eGFP), a stack of images spanning the
emission spectra of both donor and acceptor (mCherry) was collected. The composite spectrum
comprising both contributions was unmixed according to Equation 2-5 in which 𝑛𝐸𝑚𝐷 and 𝑛𝐸𝑚𝐴
are the reference spectra for eGFP and mCherry, respectively; 𝑘𝐷 and 𝑘𝐴 are the scaling factors
for the respective contributions from eGFP and mCherry.
𝑌 = 𝑘𝐷 × 𝑛𝐸𝑚𝐷 + 𝑘𝐴 × 𝑛𝐸𝑚𝐴
To account for a small amount of direct excitation of the acceptor by the donor laser, the
acceptor contribution was corrected using Equation 2-6. The quantity 𝑘𝐴′ represents the corrected
value of 𝑘𝐴, and 𝑘𝐴𝐷 represents the emission from mCherry when the fluorophore is excited by the
donor laser; f is an experimentally determined parameter obtained as the slope of the linear
relationship between 𝑘𝐴 and the observed acceptor emission intensity from cells expressing
Equation 2-5
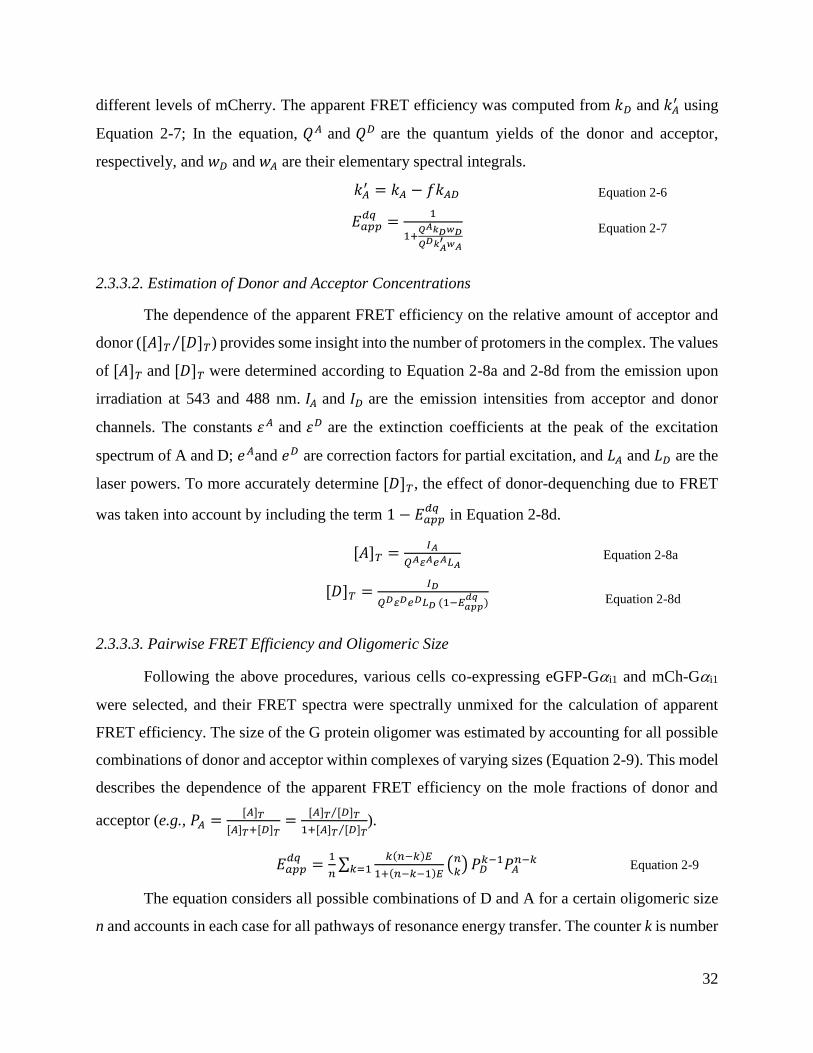
32
different levels of mCherry. The apparent FRET efficiency was computed from 𝑘𝐷 and 𝑘𝐴′ using
Equation 2-7; In the equation, 𝑄𝐴 and 𝑄𝐷 are the quantum yields of the donor and acceptor,
respectively, and 𝑤𝐷 and 𝑤𝐴 are their elementary spectral integrals.
𝑘𝐴′ = 𝑘𝐴 − 𝑓𝑘𝐴𝐷
𝐸𝑎𝑝𝑝𝑑𝑞 =
1
1+𝑄𝐴𝑘𝐷𝑤𝐷
𝑄𝐷𝑘𝐴′ 𝑤𝐴
2.3.3.2. Estimation of Donor and Acceptor Concentrations
The dependence of the apparent FRET efficiency on the relative amount of acceptor and
donor ([𝐴]𝑇 [𝐷]𝑇⁄ ) provides some insight into the number of protomers in the complex. The values
of [𝐴]𝑇 and [𝐷]𝑇 were determined according to Equation 2-8a and 2-8d from the emission upon
irradiation at 543 and 488 nm. 𝐼𝐴 and 𝐼𝐷 are the emission intensities from acceptor and donor
channels. The constants 휀𝐴 and 휀𝐷 are the extinction coefficients at the peak of the excitation
spectrum of A and D; 𝑒𝐴and 𝑒𝐷 are correction factors for partial excitation, and 𝐿𝐴 and 𝐿𝐷 are the
laser powers. To more accurately determine [𝐷]𝑇, the effect of donor-dequenching due to FRET
was taken into account by including the term 1 − 𝐸𝑎𝑝𝑝𝑑𝑞
in Equation 2-8d.
[𝐴]𝑇 =𝐼𝐴
𝑄𝐴 𝐴𝑒𝐴𝐿𝐴
[𝐷]𝑇 =𝐼𝐷
𝑄𝐷 𝐷𝑒𝐷𝐿𝐷 (1−𝐸𝑎𝑝𝑝𝑑𝑞
)
2.3.3.3. Pairwise FRET Efficiency and Oligomeric Size
Following the above procedures, various cells co-expressing eGFP-Gi1 and mCh-Gi1
were selected, and their FRET spectra were spectrally unmixed for the calculation of apparent
FRET efficiency. The size of the G protein oligomer was estimated by accounting for all possible
combinations of donor and acceptor within complexes of varying sizes (Equation 2-9). This model
describes the dependence of the apparent FRET efficiency on the mole fractions of donor and
acceptor (e.g., 𝑃𝐴 =[𝐴]𝑇
[𝐴]𝑇+[𝐷]𝑇=
[𝐴]𝑇 [𝐷]𝑇⁄
1+[𝐴]𝑇 [𝐷]𝑇⁄).
𝐸𝑎𝑝𝑝𝑑𝑞 =
1
𝑛∑
𝑘(𝑛−𝑘)𝐸
1+(𝑛−𝑘−1)𝐸(𝑛
𝑘)𝑘=1 𝑃𝐷
𝑘−1𝑃𝐴𝑛−𝑘
The equation considers all possible combinations of D and A for a certain oligomeric size
n and accounts in each case for all pathways of resonance energy transfer. The counter k is number
Equation 2-7
Equation 2-9
Equation 2-6
Equation 2-8a
Equation 2-8d
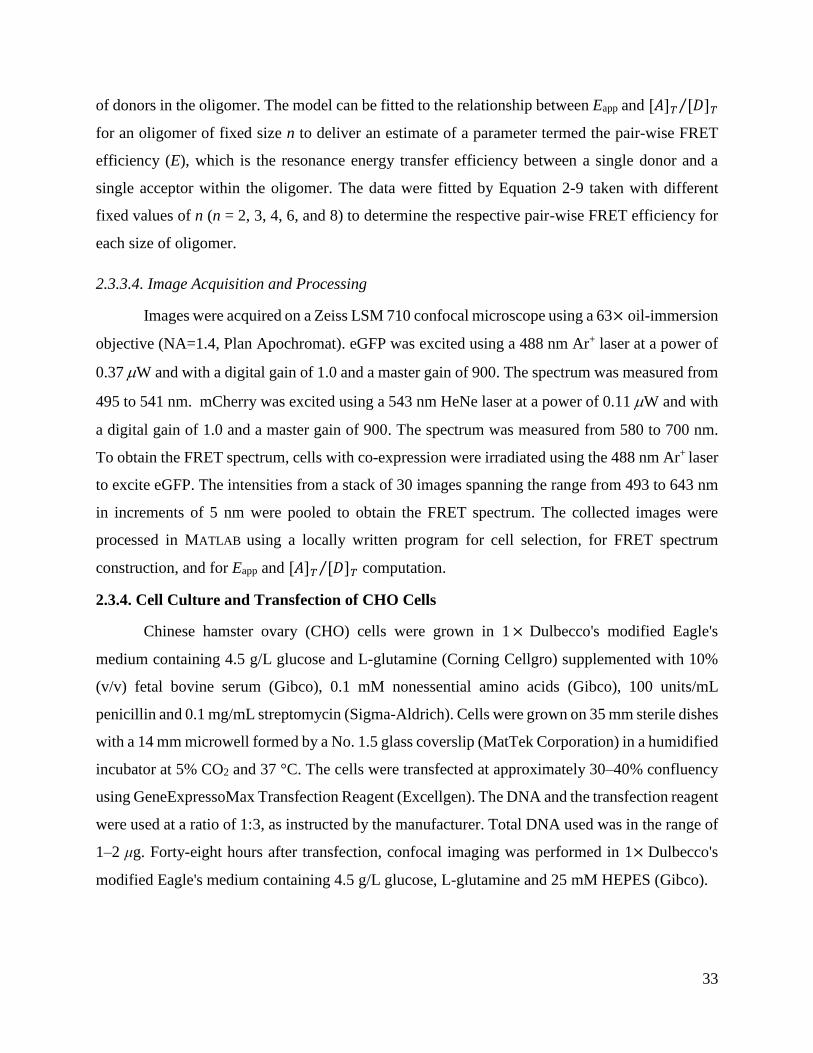
33
of donors in the oligomer. The model can be fitted to the relationship between Eapp and [𝐴]𝑇 [𝐷]𝑇⁄
for an oligomer of fixed size n to deliver an estimate of a parameter termed the pair-wise FRET
efficiency (E), which is the resonance energy transfer efficiency between a single donor and a
single acceptor within the oligomer. The data were fitted by Equation 2-9 taken with different
fixed values of n (n = 2, 3, 4, 6, and 8) to determine the respective pair-wise FRET efficiency for
each size of oligomer.
2.3.3.4. Image Acquisition and Processing
Images were acquired on a Zeiss LSM 710 confocal microscope using a 63× oil-immersion
objective (NA=1.4, Plan Apochromat). eGFP was excited using a 488 nm Ar+ laser at a power of
0.37 W and with a digital gain of 1.0 and a master gain of 900. The spectrum was measured from
495 to 541 nm. mCherry was excited using a 543 nm HeNe laser at a power of 0.11 W and with
a digital gain of 1.0 and a master gain of 900. The spectrum was measured from 580 to 700 nm.
To obtain the FRET spectrum, cells with co-expression were irradiated using the 488 nm Ar+ laser
to excite eGFP. The intensities from a stack of 30 images spanning the range from 493 to 643 nm
in increments of 5 nm were pooled to obtain the FRET spectrum. The collected images were
processed in MATLAB using a locally written program for cell selection, for FRET spectrum
construction, and for Eapp and [𝐴]𝑇 [𝐷]𝑇⁄ computation.
2.3.4. Cell Culture and Transfection of CHO Cells
Chinese hamster ovary (CHO) cells were grown in 1 × Dulbecco's modified Eagle's
medium containing 4.5 g/L glucose and L-glutamine (Corning Cellgro) supplemented with 10%
(v/v) fetal bovine serum (Gibco), 0.1 mM nonessential amino acids (Gibco), 100 units/mL
penicillin and 0.1 mg/mL streptomycin (Sigma-Aldrich). Cells were grown on 35 mm sterile dishes
with a 14 mm microwell formed by a No. 1.5 glass coverslip (MatTek Corporation) in a humidified
incubator at 5% CO2 and 37 °C. The cells were transfected at approximately 30–40% confluency
using GeneExpressoMax Transfection Reagent (Excellgen). The DNA and the transfection reagent
were used at a ratio of 1:3, as instructed by the manufacturer. Total DNA used was in the range of
1–2 μg. Forty-eight hours after transfection, confocal imaging was performed in 1× Dulbecco's
modified Eagle's medium containing 4.5 g/L glucose, L-glutamine and 25 mM HEPES (Gibco).
34
2.4. In vitro Techniques for Quantification of G Protein Oligomers
2.4.1. Expression and Extraction of G Proteins
Baculoviruses coding for eGFP-inserted i1, wild-type 2, and wild-type or His6-1 subunits
of the G protein and for FLAG epitope-bearing human M2 muscarinic receptor were expressed in
Sf9 cells. The cells were cultured at 27.5 °C in Ex-Cell 400 insect medium (JRH Biosciences)
containing 2% fetal bovine serum, 1% Fungizone, and 0.1% gentamycin (all from GibcoBRL).
Cells growing at a density of 2 × 10⁶ cells/mL were infected with one or more baculoviruses at a
total multiplicity of infection of 7.5.
The G protein purification procedure used in this project was adapted from reference 90.
The harvested membranes were lysed with buffer AG (20 mM KH2PO4 (Sigma-Aldrich), 20 mM
NaCl (Bioshop), 20 mM HEPES (Bioshop), 0.1 mM EDTA (Sigma-Aldrich), 10 mM -
mercaptoethanol (Sigma-Aldrich), and Complete Protease Inhibitor tablets (Roche), adjusted to
pH 7.4 with NaOH). The lysed membranes were first washed with buffer AG, and subsequently
with buffer AG in the absence of EDTA (buffer BG). The washes with buffer BG prepared the
sample for subsequent purification on the nickel-nitrilotriacetic acid (Ni2+-NTA) agarose (Qiagen).
Between each wash, the membrane pellets were resuspended in the appropriate buffer and
homogenised by Polytron (setting 5, 10 seconds per burst for three bursts). The homogenate was
centrifuged for 30 min at 100,000 g and 4 °C. The washed membranes were resuspended to
approximately 3 mg/mL protein and were incubated with 1% (w/v) sodium cholate (Sigma-Aldrich)
at 4 °C overnight. The solubilised supernatant was collected by centrifugation and loaded on the
Ni2+-NTA column for purification.
Prior to loading the sample, the column was equilibrated with buffer EG1, which contains
20 mM HEPES, 20 mM NaCl, 1 mM MgCl2 (Sigma-Aldrich), 10 mM -mercaptoethanol, and 0.2%
(w/v) sodium cholate, adjusted to pH 7.4 with NaOH. After loading the sample, the column was
washed twice in succession with buffers WG1 and WG2. The two wash buffers only differed in the
concentration of NaCl, which was added to remove non-specifically associated materials from the
column. They both contain 20 mM HEPES, 3 mM MgCl2, 10 mM -mercaptoethanol, 60 mM
imidazole (Sigma-Aldrich), 0.2% (w/v) sodium cholate; and 100 mM NaCl (WG1) or 20 mM NaCl
(WG2). After the removal of non-specifically bound materials by stringent washing, the His6-tagged
G proteins were eluted with buffer EG2 (20 mM HEPES, 20 mM NaCl, 3 mM MgCl2, 10 mM -

35
mercaptoethanol, 150 mM imidazole, and 1% (w/v) sodium cholate, adjusted to pH 7.4 with
NaOH). A schematic description of the procedure is presented in Figure 2-3A.
Extraction of receptor and G protein followed steps similar to those described above. The
key additions to the co-purification procedure included the incorporation of the agonist carbachol
and the steps to remove bound GDP for the isolation of the complex. A depiction of the
solubilisation and purification procedures is shown in Figure 2-3B. The co-infected Sf9 cell pellets
were lysed with buffer ARG (10 mM carbachol, 20 mM KH2PO4, 20 mM NaCl, 20 mM HEPES,
0.1 mM EDTA, 10 mM -mercaptoethanol, protease inhibitor tablets, and 200 μg/mL bacitracin
(Sigma-Aldrich), adjusted to pH 7.4 with NaOH). After centrifugation, the pellets were washed
three times with buffer ARG supplemented with 1 mM EDTA to remove GDP (BRG). The
membrane was subsequently washed with buffer ARG without EDTA (CRG) for subsequent
purification on the Ni2+-NTA chelating column. The washed membrane was then resuspended in
buffer CRG, and 25 mU/mL apyrase (New England Biolabs) was added to the homogenate. The
mixture was inverted gently at 4 °C for 60 min so any bound GDP could be hydrolysed by the
purine pyrophosphatase apyrase. Steps for GDP removal are crucial to the isolation of a coupled
RG complex as the GDP-bound G protein disrupts the stability of the receptor-G protein complex.
Finally, the membrane was resuspended to approximately 5.5 mg/mL protein and solubilised in
digitonin–cholate (0.86% digitonin, 0.17% cholate) in the presence of 10 mM carbachol before
purification on the Ni2+-NTA column (Figure 2-3B). The digitonin was purchased from Wako at
purity near 100%.
Purification of the RG complex was similar to that of the G protein, with some minor
alternations to the buffers. The equilibration buffer ERG1 contained 20 mM HEPES, 20 mM
KH2PO4, 20 mM NaCl, 10 mM -mercaptoethanol, 10 mM carbachol, and 0.22%-0.04%
digitonin–cholate. The wash buffers WRG1 and WRG2 both contained the following common
constituents: 20 mM HEPES, 20 mM KH2PO4, 10 mM -mercaptoethanol, 10 mM carbachol, 60
mM imidazole, 0.22%-0.04% digitonin–cholate, and 100 mM NaCl (WRG1) or 20 mM NaCl
(WRG2). The elution buffer ERG2 contained 20 mM HEPES, 20 mM KH2PO4, 20 mM NaCl, 10 mM
-mercaptoethanol, 10 mM carbachol, 150 mM imidazole, and 0.86%-0.17% digitonin–cholate,
adjusted to pH 7.4 with NaOH. After purification, samples were concentrated with their respective
fresh elution buffers (EG2 or ERG2) without imidazole to facilitate subsequent immobilisation for
photobleaching analysis.
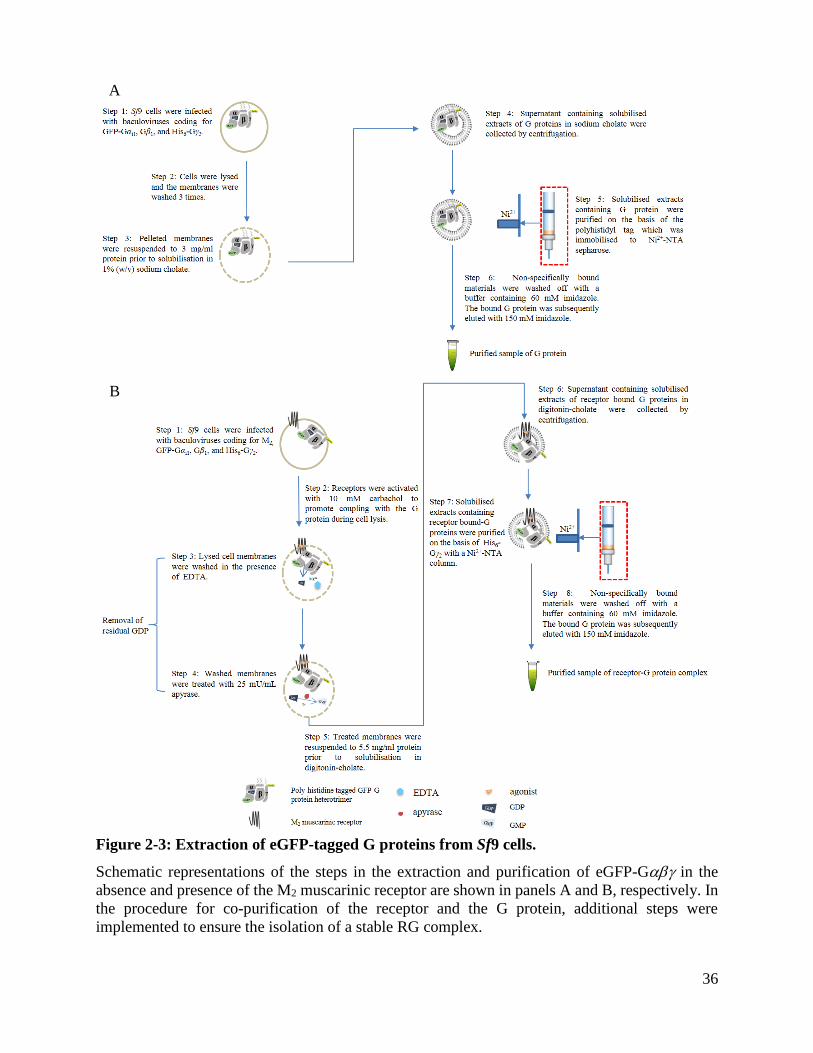
36
Figure 2-3: Extraction of eGFP-tagged G proteins from Sf9 cells.
Schematic representations of the steps in the extraction and purification of eGFP-G in the
absence and presence of the M2 muscarinic receptor are shown in panels A and B, respectively. In
the procedure for co-purification of the receptor and the G protein, additional steps were
implemented to ensure the isolation of a stable RG complex.
A
B
37
2.4.2. Cross-linking and Immunoblotting
Aliquots of purified G protein sample were mixed with different concentrations of
bis(sulfosuccinimidyl) suberate (BS3) (Thermo Scientific) and incubated for 30 min at room
temperature. The cross-linking reaction was terminated by the addition of Tris-HCl to a final
concentration of 20 mM. The samples were heated subsequently at 65 ℃ for 5 min before being
applied to a 10% polyacrylamide gel (Bio-Rad). Electrophoresis was performed as described in
reference 107. The transferred proteins on a nitrocellulose membrane were incubated with anti-
Gi (Chemicon) and Horseradish Peroxidase (HRP)-conjugated anti-mouse IgG from sheep (GE
Healthcare) as primary and secondary antibodies at dilutions of 1:1000 and 1:3000, respectively.
A control consisting of the non-cross-linked sample and a molecular weight ladder (Frogbio) were
run in parallel. Cholate-solubilised Sf9 membrane from uninfected cells was included as a negative
control.
2.4.3. [35S]GTPS Binding Assays
Various G protein-containing samples were mixed with graded concentrations of
[35S]GTPS (PerkinElmer). To achieve the desired concentratons of the nucleotide, the specfic
activity of radiolabelled GTPS was reduced to approximately 20 mCi/mmol by addition of
unlabelled GTPS (Sigma-Aldrich). Non-specific binding was taken as total binding in the
presence of 0.1 mM unlabeled GTPS (Sigma-Aldrich). The reaction mixture was incubated at
30 °C for 2.5 h. Free and bound radioligand were separated by chromatography on Sephadex G-
50. All measurements were made in triplicate, and the values were averaged to obtain the means
used in subsequent analyses. Further details regarding the assays have been described elsewhere
(e.g., references 25,108).
The data were analysed according to Equation 2-10, in which Bmax is the total amount of G
protein in m classes of sites, Bsp is the specific binding of radiolabelled GTPS at the total
concentration [P]t, and Fj, Kj, and nH(j) represent the fraction of sites of type j, the affinity of
[35S]GTPS for the sites of type j, and the corresponding Hill coefficient, respectively.
𝐵𝑜𝑏𝑠𝑑 = 𝐵𝑚𝑎𝑥 ∑𝐹𝑗([𝑃]𝑡−𝐵𝑠𝑝)
𝑛𝐻(𝑗)
𝐾𝑗
𝑛𝐻(𝑗)+([𝑃]𝑡−𝐵𝑠𝑝)
𝑛𝐻(𝑗)
𝑚𝑗=1 + 𝑁𝑆([𝑃]𝑡 − 𝐵𝑠𝑝)
Equation 2-10

38
2.4.4. Step-wise Photobleaching
The cycle of fluorescence excitation and emission is finite. When a fluorophore stops
absorbing and emitting fluorescence, it is said to have been photobleached. In a molecule
containing multiple fluorophores, the intensity of emission is proportional to the number of
fluorophores present, and the decrease in intensity through photobleaching can be measured. Using
a sensitive detector, the number of step-wise drops in the emitted intensity can serve as a measure
of oligomeric size. Therefore, the size of a fluorescent multimer can be inferred from an analysis
of the intensity-time trajectory obtained for a single molecule. In this project, step-wise
photobleaching analysis has been used to quantify eGFP-labelled G protein oligomers.
2.4.4.1. Data Acquisition and Analysis
Purified eGFP-tagged G proteins (His6-GFP-Gi1, GFP-Gi11-His62, and the co-purified
complex of GFP-Gi11-His62 and M2 muscarinic receptor) and multimers of eGFP fused end to
end were immobilised on coverslips. The surface of the coverslip was coated with a mixture of
purchased 95% polyethylene glycol (PEG) and 5% PEG-biotin. The coated surface subsequently
was treated with streptavidin and a biotinylated antibody that specifically binds to hexahistidyl
sequence and thus anchors the His6-tagged G protein samples for measurement. In some cases, G
protein samples were incubated with various compounds including GDP and AlF4-, GTPS, DTT,
and mastoparan for 20 min prior to immobilisation. The immobilised sample was excited at 473
nm using a diode-pumped solid state laser (Cobolt Blue, MarketTech). During the course of the
experiments, various levels of laser power were employed to irradiate the fusion proteins of eGFP:
60 W/cm2, 180 W/cm2, and 260 W/cm2; eGFP-labelled G proteins were irradiated at a power of
200 W/cm2. In all cases, the laser beam was focused on an observation area of 3600 μm2 and an
oil-immersion objective (60×, NA = 1.45, Olympus) was employed. Movies of the selected region
on the coverslip were recorded for 15 to 45 s by an electron-multiplying charged-coupled device
(EMCCD) camera (DU-897BV, Andor), which yields 500 images at an exposure time of 30 ms
per image.
Time trajectories of the fluorescence intensities of single molecules or particles were
extracted from the movies and analysed using a custom-built program in MATLAB. An intensity-
time trajectory of a set of flatterned images was filtered using a modified version of the Chung-
Kennedy filtration algorithm. The program determines the occurrence of a photobleaching step

39
based on a comparison of the intensity drop with the running average. For each molecule, the
maximum number of photobleaching steps was recorded and the results from a large number of
molecules (400–3000) were summarised in a histogram.

40
CHAPTER 3 RESULTS
41
3.1. Cross-linking and Immunoblotting of Purified Gi1
His6-tagged Gi1 was expressed in Sf9 cells and purified as described in Chapter 2.
Aliquots of the purified material were applied to the polyacrylamide gel and subjected to
electrophoresis. The contents of the gel then were transferred to a nitrocellulose membrane and
blotted with a Gi-specific antibody (Figure 3-1). A single band corresponding to monomeric Gi
migrated with a molecular mass of roughly 45 kDa (lane 2). Samples cross-linked with
bis(sulfosuccinimidyl) suberate (BS3) (lanes 3 and 4) showed the appearance of an additional band
with a molecular mass greater than 245 kDa and a concomitant reduction in the density of the
monomeric band. In lanes 3 to 4, as the applied concentration of the cross-linker was increased
from 2 mM to 4 mM, the intensity of the oligomeric band increased and the monomeric band
disappeared (lane 4). The samples were assayed in parallel with the solubilised extract from non-
infected Sf9 membranes for detection of non-specific interactions with the antibody. None was
observed on the blot (lane 1).
3.2. [35S]GTPS Binding Assays on G Protein Variants
The functionality of the purified G proteins was evaluated in [35S]GTPS binding assays
in the absence and presence of activated M2 receptors. The binding curves obtained for His6-tagged
wild-type Gi1 (His6-G) and for the fluorophore-tagged analogue (i.e., His6-XFP-G, where XFP
represents eGFP or mCherry) are compared in Figure 3-2A. The estimated binding affinities for
His6-G and His6-XFP-G are 2.19 μM and 0.50 μM, respectively. It therefore appears that the
insertion of a fluorophore at position 91 of Gi1 did not compromise its ability to bind nucleotide;
rather, the affinity was increased about fourfold. However, the presence of G had little if any
effect on the affinity of the nucleotide for XFP-G (Figure 3-2B) as the fitted values are 0.50 μM
and 0.98 μM for His6-XFP-G and XFP-G-His6-, respectively. In the case of holo-G proteins,
the hexahistidyl tag was placed on the -subunit to ensure that all -subunits in the purified
preparation were associated with a -heterodimer.
On the other hand, profiles for the binding of [35S]GTPS to the stable complex of
fluorophore-labelled G protein and activated M2 muscarinic receptor (M2G) displayed a leftward
shift of approximately two orders of magnitude compared to that of XFP-G-His6- (Figure 3-
2C). As a result, M2G samples no longer exhibit the comparatively low, micro-molar affinity for
42
the nucleotide. The appearance of high–affinity binding and the concomitant loss of low–affinity
binding indicate that all of the G proteins are associated with receptors. This observation also
suggests that the insertion of a fluorophore at position 91 does not perturb the normal functioning
of the G protein (i.e., coupling to an activated receptor). Therefore, data acquired from
fluorophore-tagged G proteins are reflective of interactions involving G proteins in native
preparations.
Hill coefficients for the binding of [35S]GTPS to the M2G complex were markedly lower
than 1 (nH1 = 0.66 ± 0.03, N = 5) (Equation 2-10, m = 1). Whereas one component is sufficient to
describe binding to His6-Gi1 and His6-XFP-Gi1 in terms of Equation 2-10 (nH(j) = 1 for all j) (p
≥ 0.03), two components are required for M2G (p ˂ 0.0005). For both the G protein alone and the
M2G complex, the fitted values of Kj showed little variability among different experiments (Table
3-1). In the case of M2G, however, the value of Fj varied from 0.2 to 0.95. The pooled results from
M2G therefore were analysed with single values of K1 and K2 as the constrains on Kj were without
appreciable effect on the sum of squares (p = 0.62), but separate values of F2 for the data from
different experiments. The fitted parametric values are listed in Table 3-1.
In conclusion, the binding profiles obtained with [35S]GTPS indicate that the insertion of
the fluorophore in Gi1 did not impair the ability of the G protein to bind guanyl nucleotide or to
couple to the activated M2 receptor. Moreover, the heterogeneity observed in the binding curves
of M2G demonstrates that the nucleotide binds to receptor-coupled G proteins with different
affinities, possibly indicating the existence of oligomers. To further investigate this issue, the
fluorophore-tagged G proteins were used as markers to monitor their oligomeric status in
fluorescence-based experiments. Live CHO cells were transfected with the plasmids for eGFP-
and mCherry-tagged G proteins along with other necessary constructs. Individual cells co-
expressing both fluorophore-tagged proteins were selected for further analysis.
3.3. Detection of Co-diffusing G Proteins in CHO Cells by DcFCS
Fluorescence correlation spectroscopy (FCS) monitors the diffusion of fluorescent
molecules through a focal volume defined by the excitation laser. The simultaneous measurement
of two fluorophores allows one to monitor the co-diffusion of two spectrally compatible
fluorescent molecules through the focal volume. The fraction of molecules that co-diffuse is
estimated from the amplitude of the cross-correlation curve relative to that of each individual auto-
43
correlation curve. A large fraction implies the existence of oligomers that are at least dimeric in
size.
Measurements of the co-expressed eGFP- and mCherry-tagged G proteins revealed that
approximately 41% of the entire population of eGFP-Gi1 and 39% of the entire population of mCh-
Gi1 co-diffused with the other colour (Figure 3-3A). Co-expression of a membrane-localised form
of eGFP (MP-GFP) and mCh-Gi1 resulted in little or no cross-correlation (Figure 3-3C) and the
pair served as a negative control. When mCh-Gi1 was co-expressed with eGFP-tagged G (GFP-
G), virtually all of the mCh-Gi1 co-diffused with GFP-G (Figure 3-3B), indicating that the
heterotrimeric G protein is stable at rest. The pair was used as a positive control.
3.4. Model-based FRET Efficiency Analysis for Size Estimation of G Protein Oligomers
Spectral unmixing of the observed emission spectrum yields the emission components of
the donor (𝑘𝐷) and the acceptor (𝑘𝐴′ ) (e.g., Figure 3-4A). Those values are used to calculate the
overall apparent FRET efficiency (Eapp) for a selected cell. Apparent FRET efficiencies obtained
in this way are plotted against the ratios of acceptor to donor ([𝐴]𝑇 [𝐷]𝑇⁄ ) in Figure 3-4B–D. FRET
between eGFP-Gi1 and mCh-Gi1 in the presence of G12 was monitored in the absence (GG)
and in the presence of M2 receptors (RGG). The latter sample (i.e., RGG) also was monitored after
the addition of a muscarinic agonist carbachol (RGGag). In all three cases, values of Eapp up to
about 60% were observed between the eGFP- and mCherry-tagged G proteins and appeared to
reach to a plateau when the value of [𝐴]𝑇 [𝐷]𝑇⁄ exceeded 1.
To examine whether the observed FRET arose in a stochastic manner, Eapp was measured
in cells co-expressing mCh-Gi1 and a membrane-localised donor (MP-GFP). As the fused
sequence added to eGFP includes the myristoylation and palmitoylation sites of Gi1, MP-GFP
ought to localise at the membrane. There was little or no FRET between MP-GFP and mCh-Gi1,
as indicated by FRET efficiencies near or indistinguishable from zero (Figure 3-5, black empty
squares), indicating an absence of stochastic interactions. Furthermore, to test the effect of the
level of expression on the distribution of apparent FRET efficiencies over the range of [𝐴]𝑇 [𝐷]𝑇⁄ ,
the data for GG, RGG, and RGGag were equally divided into four groups based on the total
expression levels of donor and acceptor. Cells with varying expression levels were distributed
throughout the measured ranges of [𝐴]𝑇 [𝐷]𝑇⁄ and Eapp. To sum up, the low non-specific FRET
between the non-interacting pair of MP-GFP and mCh-Gi1 and the independence of Eapp on the
44
expression level indicate that the observed FRET between fluorophore-tagged G proteins was not
a result of stochastic interactions between over-expressed donors and acceptors.
In Figure 3-6, the plots of apparent FRET efficiency versus [𝐴]𝑇 [𝐷]𝑇⁄ were fitted to
Equation 2-9 to extract values of the pair-wise efficiency (E) for oligomers of various sizes. As
summarized in Table 3-2, expressed as percentage, the estimated values of E for GFP-Gi1 and
mCh-Gi1 alone (GG) are 151 ± 2 (n = 2, dimer), 90.8 ± 1.0 (n = 3, trimer), 67.0 ± 0.8 (n = 4,
tetramer), 44.9 ± 0.6 (n = 6, hexamer), and 34.1 ± 0.5 (n = 8, octamer). The values of E for GFP-
Gi1 and mCh-Gi1 in the presence of receptor (RGG) are 133 ± 2 (dimer), 78.0 ± 1.2 (trimer),
56.7 ± 0.9 (tetramer), 37.3 ± 0.7 (hexamer), and 28.0 ± 0.6 (octamer). Upon the addition of
carbachol (RGGag), the values are 133 ± 1 (dimer), 76.8 ± 0.9 (trimer), 55.3 ± 0.7 (tetramer), 36.0
± 0.5 (hexamer), and 26.8 ± 0.4 (octamer).
Dimeric fits to all three sets of data resulted in values of E above 100%. The result suggests
that a dimer of G proteins is unlikely. We also determined the range of E within which the fit of a
dimeric model did not significantly differ from the best-fit curve. For each of the three conditions
(i.e., GG, RGG and RGGag), a fixed value of E was varied in increments of 1% as illustrated in
Figure 3-7, and the sum of squares from each fit was compared with that of the best fit using an F-
test. In this way, the lowest value of E that was not significantly different from the best fit was
determined. In each case, even the lowest possible value E is above 100% and a dimer therefore
can be rejected definitely. The relationship between p and E is illustrated in Figure 3-7, where the
dashed horizontal line corresponds to p = 5 × 10⁻⁴. Fits with E above the line are not significantly
different from the best fit (i.e., p > 5 × 10⁻⁴); fits with E below the line (i.e., p ˂ 5 × 10⁻⁴) deviate
significantly from the best fit. The lowest values of the determined E that do not compromise the
goodness of the fit are as follows: 146%, GG; 127%, RGG; and 129%, RGGag. These results
suggest that an oligomer of G proteins is at least tetrameric.
In conclusion, FRET observed between eGFP- and mCherry-tagged G proteins implies the
existence of G protein oligomers. Moreover, the dependence of Eapp on the ratio of total acceptors
to total donors ([𝐴]𝑇 [𝐷]𝑇⁄ ) points to a tetramer or larger oligomer, based on pair-wise FRET
efficiencies estimated in terms of a model for FRET between neighbouring fluorophores. Neither
the addition of M2 receptor nor its activation by the muscarinic agonist carbachol had a substantial
effect on the pair-wise FRET efficiency. The latter observation may be due to the nature of the
measurement, in that each cell yields a single averaged value of Eapp. To determine the exact size
45
of the G protein oligomers and to monitor their status upon stimulation, photobleaching analysis
and total internal reflection fluorescence microscope (TIRFM) were used to directly count the
number of fluorescent protomers in single molecules of eGFP-tagged G protein.
3.5. Direct Quantification of the Size of the G Protein Oligomer by Photobleaching Analysis
eGFP-Gi1, G1, and His6-G2 were expressed in Sf9 cells in the absence and presence of
the M2 muscarinic receptor. The co-expressed samples were subsequently extracted and purified
on Ni2+-NTA columns as described in Chapter 2. The purified eGFP-labelled G proteins were
immobilised on a polyethylene glycol (PEG)-coated surface using an anti-histidine antibody. The
immobilised eGFP-containing samples were excited and subsequently photobleached at 473 nm.
The custom-built TIRF microscopy used in this study ensures sub-millisecond detection and
therefore was sufficiently rapid to capture variations in intensity. A sample intensity-time
trajectory is shown in Figure 3-8A, where each permanent decrease in intensity as a result of
photobleaching is regarded as one step. The size of a fluorescent complex can be inferred from the
maximum number of observed photobleaching steps.
The photobleaching patterns of concatenated eGFP molecules comprising one, two, and
four units of the fluorophore were monitored under conditions similar to those used for purified G
proteins. Each fusion protein gave rise to distributions of photobleaching steps such that the largest
number of steps did not exceed the number of fluorophores (Figure 3-8B–D). For instance,
irradiation of tetrameric eGFP resulted 1–4 steps, but the number of steps never exceeded 4 (Figure
3-8D). Moreover, the distribution of steps was observed to vary with the laser power (Figure 3-
8D). The relative number of molecules that displayed four photobleaching steps increased as the
laser power increased and decreased as the laser power decreased. In Figure 3-8D, a comparison
of the distributions obtained at a medium power of 180 W/cm2 (grey bars) and a higher power of
260 W/cm2 (white bars) shows a rightward shift in the distribution with an increase in the power,
and hence a higher occurrence of four steps. A comparison of the distributions obtained at a
medium power of 180 W/cm2 and a lower power at 60 W/cm2 (black bars) shows a leftward shift
in the distribution with a decrease in the power, and hence a lower occurrence of four steps.
In the measurements of eGFP-tagged G proteins, a laser power of 200 W/cm2 was
employed. The reason for choosing such a medium level of power is two-fold: one, high laser
powers are associated with rapid photobleaching thus a smaller sampling pool; two, low laser
46
powers are not capable of exciting all fluorophores in a molecule, thus there would be an
underestimation of the oligomeric size. Therefore, experiments of this nature involve a trade-off
between more molecules to survey and a more accurate estimate of the number of photobleaching
steps.
In Figure 3-9A, distributions of 1 through 6 steps were observed when eGFP-labelled
Gi1-His6- (grey bars) and the heterotrimer co-purified with the M2 receptor (black bars) were
photobleached. In the presence of M2 receptor, the occurrence of the molecules that displayed five
and six steps was markedly reduced. Similarly, addition of the reducing agent dithiothreitol (DTT)
also reduced somewhat the occurrence of the fifth and sixth steps (white bars) (Figure 3-9B).
The effects of ligands on the G protein oligomeric status are shown in Figure 3-10. In the
absence of the M2 receptor, photobleaching of the G protein heterotrimer resulted in a step
distribution that was essentially unchanged upon the addition of GDP plus AlF4- (Figure 3-10A,
white bars). In contrast, the addition of an activated GPCR analog, mastoparan, markedly reduced
the prevalence of particles with a higher number of steps (4–6) and led to a distribution that was
populated predominantly by particles with 1 and 2 steps (black bars). With the co-purified complex
of M2 receptor and eGFP-tagged G protein heterotrimer (Figure 3-10B), the addition of GTPS
(black bar) or GDP plus AlF4- (white bars) reduced substantially the number of particles exhibiting
a higher number of photobleaching steps (4–6) while increasing the frequency of those with fewer
steps (1–3). The above observations suggest that the G protein oligomers are largely unaffected by
either the agonist-liganded M2 receptor or guanyl nucleotides when added separately but dissociate
into dimers or monomers when an agonist, the receptor and the nucleotide are added together.

47
Figure 3-1: Effects of cross-linking on purified His6-Gi1.
Sf9 cells expressing His6-Gi1 were extracted in sodium cholate and purified on a Ni2+-NTA
column as described in ‘Materials and Methods’. Aliquots of approximately 10 nM purified His6-
Gi1 were loaded in lanes 2–4 of the polyacrylamide gel. Samples in lanes 3 and 4 were pre-
incubated with the cross-linker BS3 at concentrations of 2 mM and 4 mM, respectively. Solubilised
membrane from uninfected Sf9 cells was loaded in lane 1 as a negative control. After
electrophoresis, the samples were transferred to a nitrocellulose membrane and blotted with anti-
Gi antibody. The concentration of G proteins was estimated from the binding of [35S]GTPS.
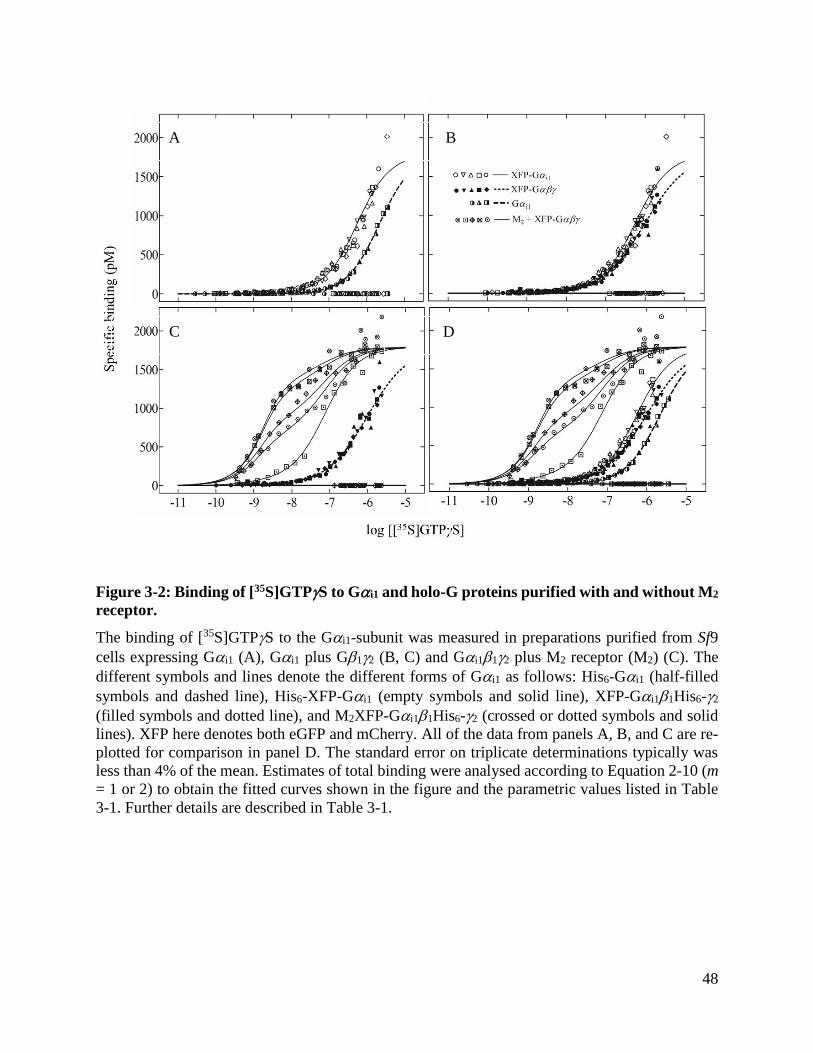
48
Figure 3-2: Binding of [35S]GTPS to Gi1 and holo-G proteins purified with and without M2
receptor.
The binding of [35S]GTPS to the Gi1-subunit was measured in preparations purified from Sf9
cells expressing Gi1 (A), Gi1 plus G12 (B, C) and Gi112 plus M2 receptor (M2) (C). The
different symbols and lines denote the different forms of Gi1 as follows: His6-Gi1 (half-filled
symbols and dashed line), His6-XFP-Gi1 (empty symbols and solid line), XFP-Gi11His6-2
(filled symbols and dotted line), and M2XFP-Gi11His6-2 (crossed or dotted symbols and solid
lines). XFP here denotes both eGFP and mCherry. All of the data from panels A, B, and C are re-
plotted for comparison in panel D. The standard error on triplicate determinations typically was
less than 4% of the mean. Estimates of total binding were analysed according to Equation 2-10 (m
= 1 or 2) to obtain the fitted curves shown in the figure and the parametric values listed in Table
3-1. Further details are described in Table 3-1.
A B
C D
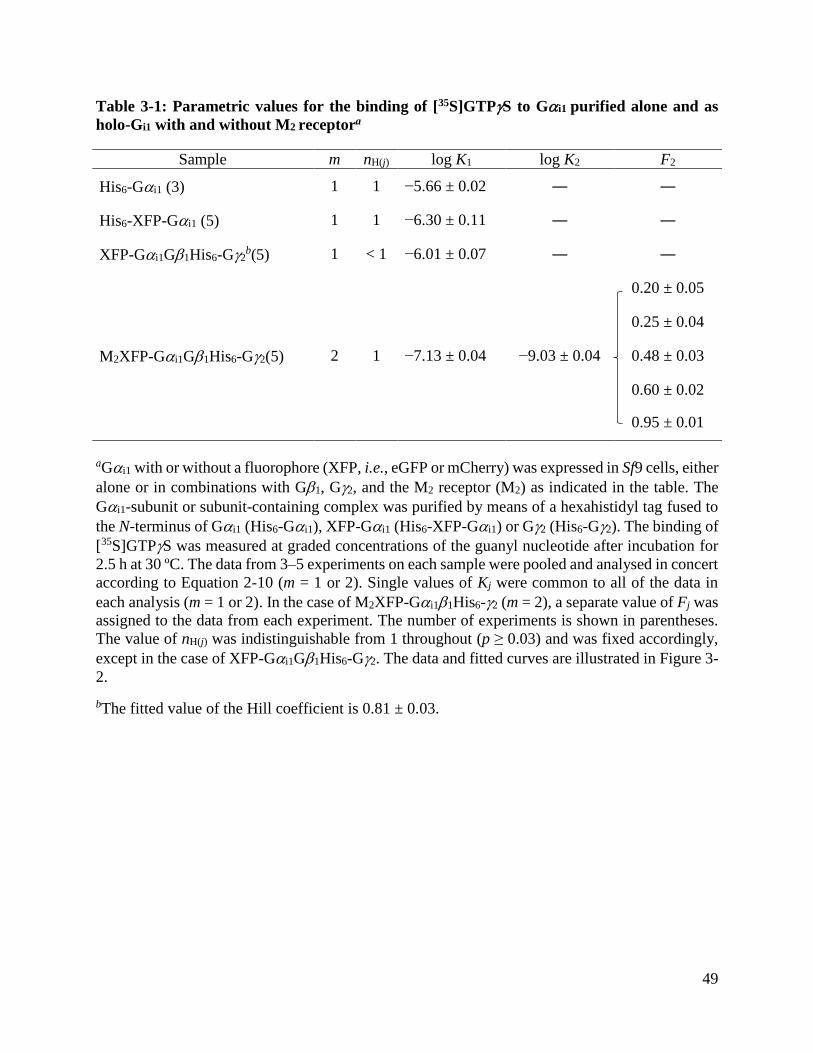
49
Table 3-1: Parametric values for the binding of [35S]GTPS to Gi1 purified alone and as
holo-Gi1 with and without M2 receptora
Sample m nH(j) log K1 log K2 F2
His6-Gi1 (3) 1 1 −5.66 ± 0.02 ― ―
His6-XFP-Gi1 (5) 1 1 −6.30 ± 0.11 ― ―
XFP-Gi1G1His6-G2b(5) 1 < 1 −6.01 ± 0.07 ― ―
M2XFP-Gi1G1His6-G2(5)
0.20 ± 0.05
0.25 ± 0.04
2 1 −7.13 ± 0.04 −9.03 ± 0.04 0.48 ± 0.03
0.60 ± 0.02
0.95 ± 0.01
aGi1 with or without a fluorophore (XFP, i.e., eGFP or mCherry) was expressed in Sf9 cells, either
alone or in combinations with G1, G2, and the M2 receptor (M2) as indicated in the table. The
Gi1-subunit or subunit-containing complex was purified by means of a hexahistidyl tag fused to
the N-terminus of Gi1 (His6-Gi1), XFP-Gi1 (His6-XFP-Gi1) or G2 (His6-G2). The binding of
[35S]GTPS was measured at graded concentrations of the guanyl nucleotide after incubation for
2.5 h at 30 ºC. The data from 3–5 experiments on each sample were pooled and analysed in concert
according to Equation 2-10 (m = 1 or 2). Single values of Kj were common to all of the data in
each analysis (m = 1 or 2). In the case of M2XFP-Gi11His6-2 (m = 2), a separate value of Fj was
assigned to the data from each experiment. The number of experiments is shown in parentheses.
The value of nH(j) was indistinguishable from 1 throughout (p ≥ 0.03) and was fixed accordingly,
except in the case of XFP-Gi1G1His6-G2. The data and fitted curves are illustrated in Figure 3-
2.
bThe fitted value of the Hill coefficient is 0.81 ± 0.03.
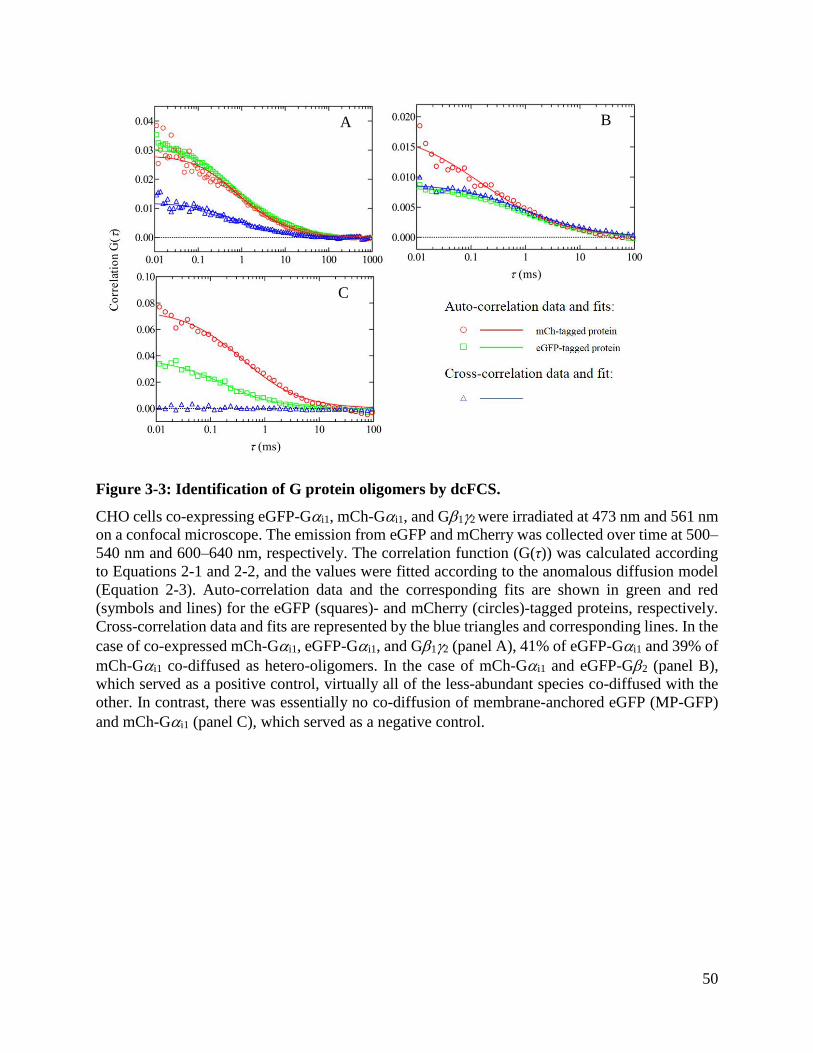
50
Figure 3-3: Identification of G protein oligomers by dcFCS.
CHO cells co-expressing eGFP-Gi1, mCh-Gi1, and G12 were irradiated at 473 nm and 561 nm
on a confocal microscope. The emission from eGFP and mCherry was collected over time at 500–
540 nm and 600–640 nm, respectively. The correlation function (G(τ)) was calculated according
to Equations 2-1 and 2-2, and the values were fitted according to the anomalous diffusion model
(Equation 2-3). Auto-correlation data and the corresponding fits are shown in green and red
(symbols and lines) for the eGFP (squares)- and mCherry (circles)-tagged proteins, respectively.
Cross-correlation data and fits are represented by the blue triangles and corresponding lines. In the
case of co-expressed mCh-Gi1, eGFP-Gi1, and G12 (panel A), 41% of eGFP-Gi1 and 39% of
mCh-Gi1 co-diffused as hetero-oligomers. In the case of mCh-Gi1 and eGFP-G2 (panel B),
which served as a positive control, virtually all of the less-abundant species co-diffused with the
other. In contrast, there was essentially no co-diffusion of membrane-anchored eGFP (MP-GFP)
and mCh-Gi1 (panel C), which served as a negative control.
A B
C
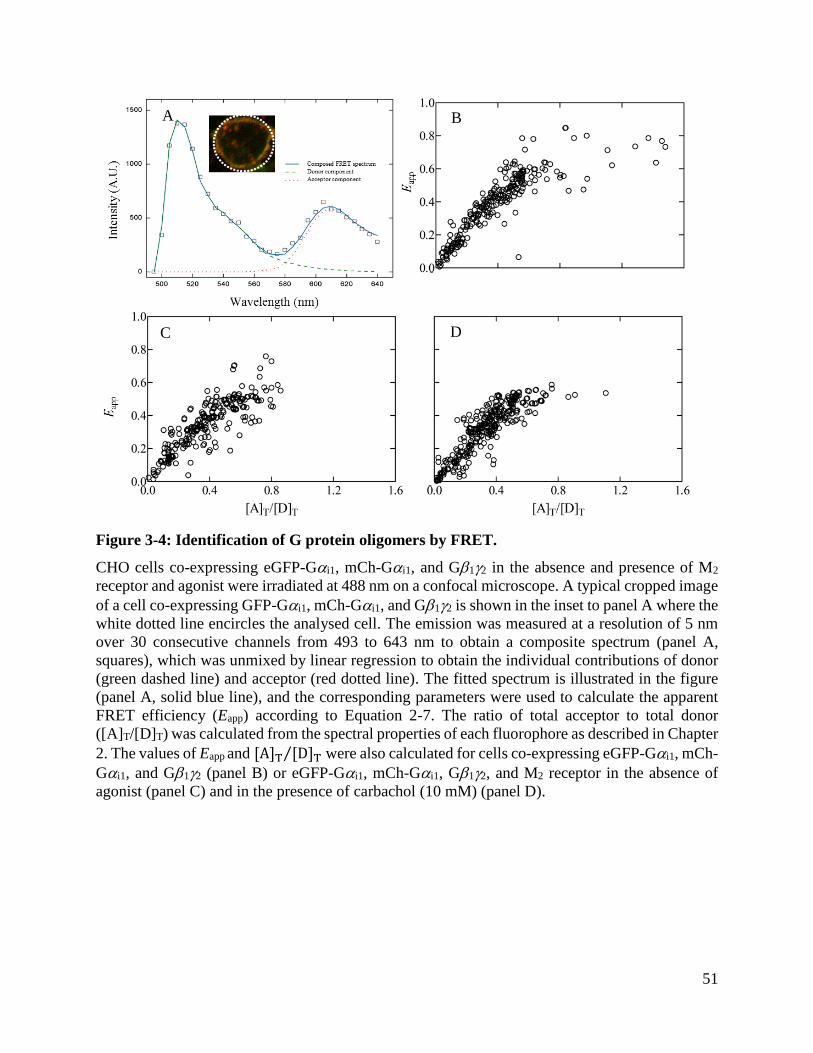
51
Figure 3-4: Identification of G protein oligomers by FRET.
CHO cells co-expressing eGFP-Gi1, mCh-Gi1, and G12 in the absence and presence of M2
receptor and agonist were irradiated at 488 nm on a confocal microscope. A typical cropped image
of a cell co-expressing GFP-Gi1, mCh-Gi1, and G12 is shown in the inset to panel A where the
white dotted line encircles the analysed cell. The emission was measured at a resolution of 5 nm
over 30 consecutive channels from 493 to 643 nm to obtain a composite spectrum (panel A,
squares), which was unmixed by linear regression to obtain the individual contributions of donor
(green dashed line) and acceptor (red dotted line). The fitted spectrum is illustrated in the figure
(panel A, solid blue line), and the corresponding parameters were used to calculate the apparent
FRET efficiency (Eapp) according to Equation 2-7. The ratio of total acceptor to total donor
([A]T/[D]T) was calculated from the spectral properties of each fluorophore as described in Chapter
2. The values of Eapp and [A]T [D]T⁄ were also calculated for cells co-expressing eGFP-Gi1, mCh-
Gi1, and G12 (panel B) or eGFP-Gi1, mCh-Gi1, G12, and M2 receptor in the absence of
agonist (panel C) and in the presence of carbachol (10 mM) (panel D).
A B
C D
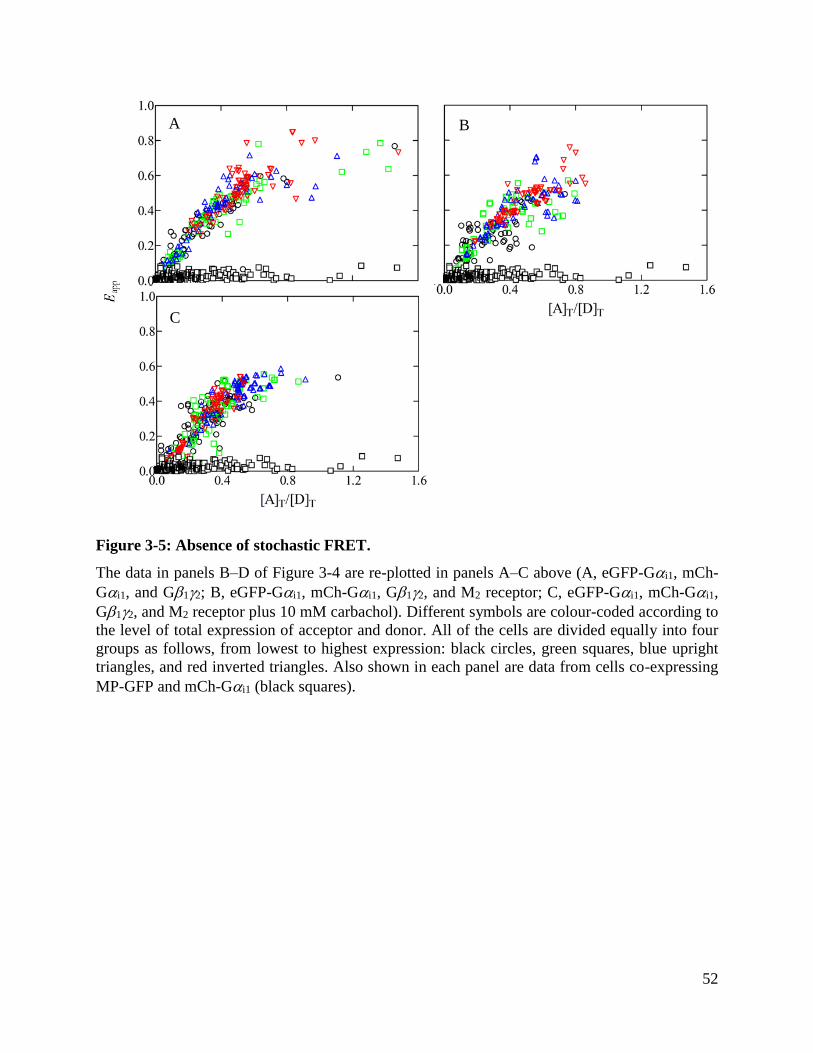
52
Figure 3-5: Absence of stochastic FRET.
The data in panels B–D of Figure 3-4 are re-plotted in panels A–C above (A, eGFP-Gi1, mCh-
Gi1, and G12; B, eGFP-Gi1, mCh-Gi1, G12, and M2 receptor; C, eGFP-Gi1, mCh-Gi1,
G12, and M2 receptor plus 10 mM carbachol). Different symbols are colour-coded according to
the level of total expression of acceptor and donor. All of the cells are divided equally into four
groups as follows, from lowest to highest expression: black circles, green squares, blue upright
triangles, and red inverted triangles. Also shown in each panel are data from cells co-expressing
MP-GFP and mCh-Gi1 (black squares).
A B
C
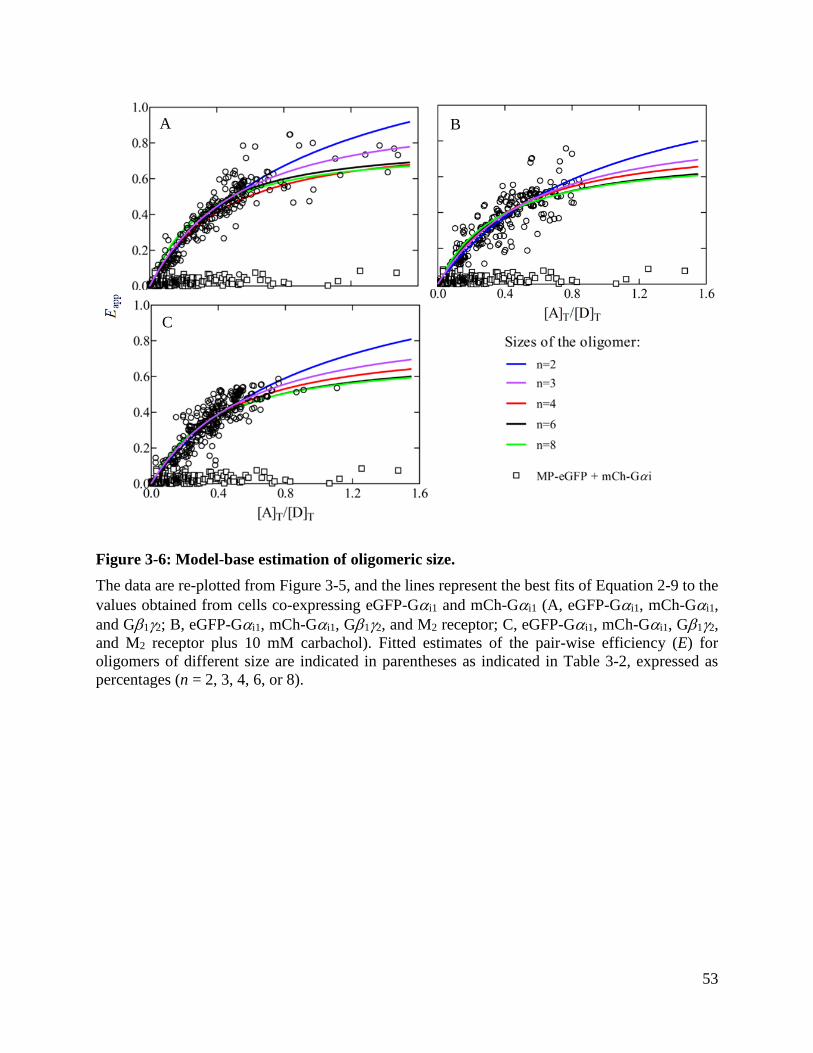
53
Figure 3-6: Model-base estimation of oligomeric size.
The data are re-plotted from Figure 3-5, and the lines represent the best fits of Equation 2-9 to the
values obtained from cells co-expressing eGFP-Gi1 and mCh-Gi1 (A, eGFP-Gi1, mCh-Gi1,
and G12; B, eGFP-Gi1, mCh-Gi1, G12, and M2 receptor; C, eGFP-Gi1, mCh-Gi1, G12,
and M2 receptor plus 10 mM carbachol). Fitted estimates of the pair-wise efficiency (E) for
oligomers of different size are indicated in parentheses as indicated in Table 3-2, expressed as
percentages (n = 2, 3, 4, 6, or 8).
C
B A
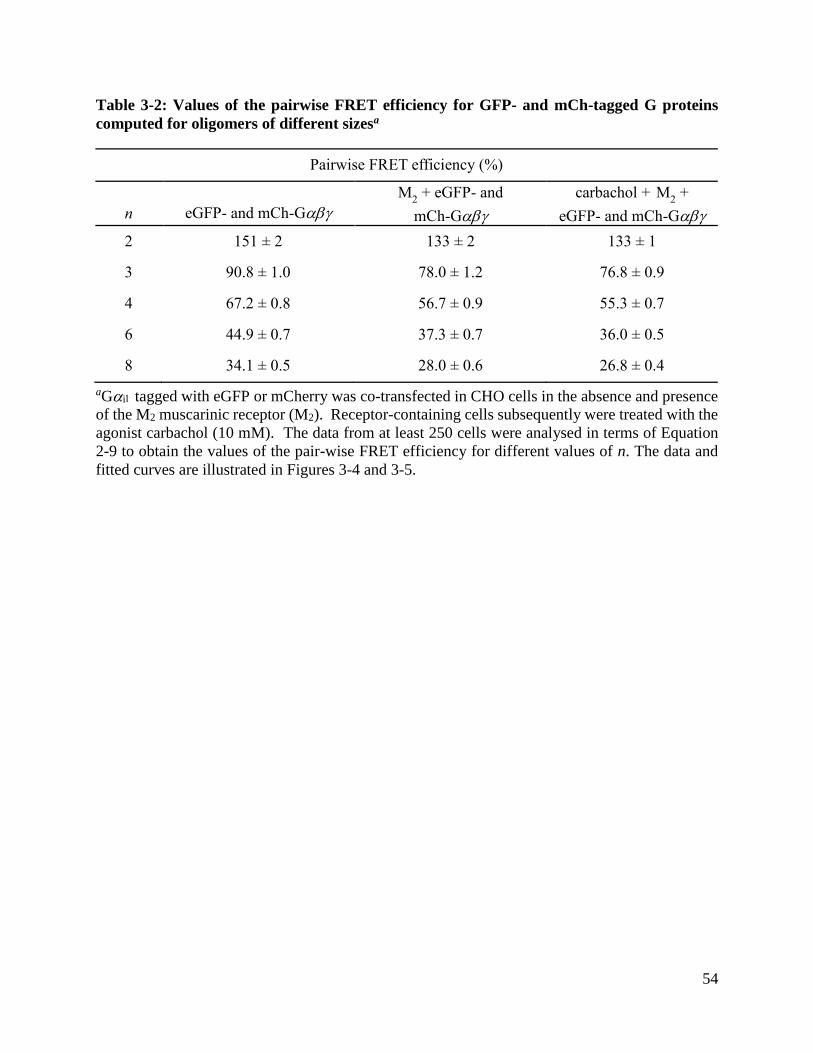
54
Table 3-2: Values of the pairwise FRET efficiency for GFP- and mCh-tagged G proteins
computed for oligomers of different sizesa
aGi tagged with eGFP or mCherry was co-transfected in CHO cells in the absence and presence
of the M2 muscarinic receptor (M2). Receptor-containing cells subsequently were treated with the
agonist carbachol (10 mM). The data from at least 250 cells were analysed in terms of Equation
2-9 to obtain the values of the pair-wise FRET efficiency for different values of n. The data and
fitted curves are illustrated in Figures 3-4 and 3-5.
Pairwise FRET efficiency (%)
n eGFP- and mCh-G
M2 + eGFP- and
mCh-G
carbachol + M2 +
eGFP- and mCh-G
2 151 ± 2 133 ± 2 133 ± 1
3 90.8 ± 1.0 78.0 ± 1.2 76.8 ± 0.9
4 67.2 ± 0.8 56.7 ± 0.9 55.3 ± 0.7
6 44.9 ± 0.7 37.3 ± 0.7 36.0 ± 0.5
8 34.1 ± 0.5 28.0 ± 0.6 26.8 ± 0.4
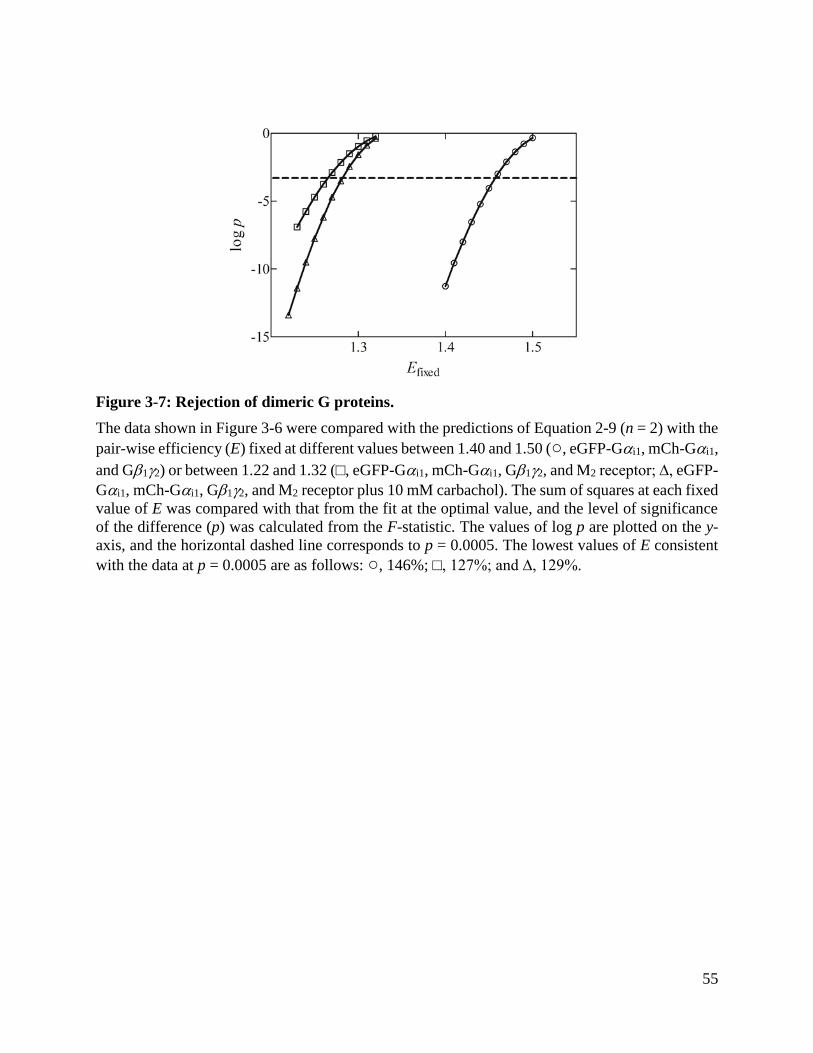
55
Figure 3-7: Rejection of dimeric G proteins.
The data shown in Figure 3-6 were compared with the predictions of Equation 2-9 (n = 2) with the
pair-wise efficiency (E) fixed at different values between 1.40 and 1.50 (○, eGFP-Gi1, mCh-Gi1,
and G12) or between 1.22 and 1.32 (□, eGFP-Gi1, mCh-Gi1, G12, and M2 receptor; ∆, eGFP-
Gi1, mCh-Gi1, G12, and M2 receptor plus 10 mM carbachol). The sum of squares at each fixed
value of E was compared with that from the fit at the optimal value, and the level of significance
of the difference (p) was calculated from the F-statistic. The values of log p are plotted on the y-
axis, and the horizontal dashed line corresponds to p = 0.0005. The lowest values of E consistent
with the data at p = 0.0005 are as follows: ○, 146%; □, 127%; and ∆, 129%.
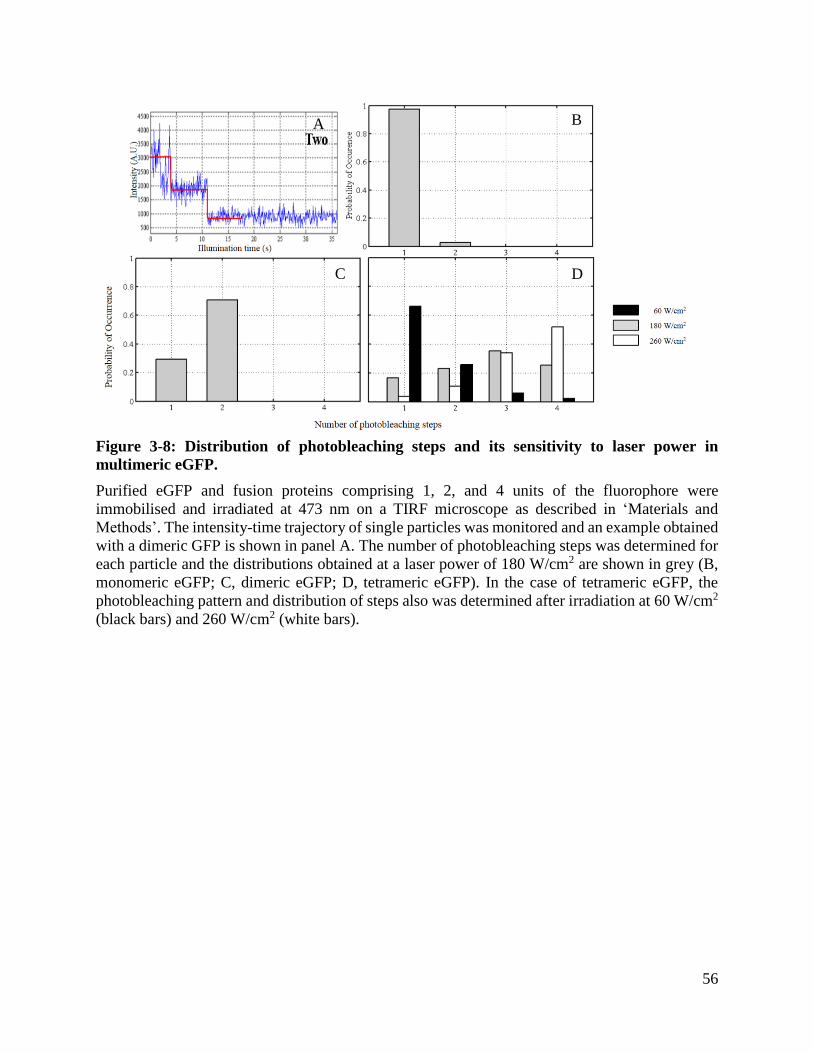
56
Figure 3-8: Distribution of photobleaching steps and its sensitivity to laser power in
multimeric eGFP.
Purified eGFP and fusion proteins comprising 1, 2, and 4 units of the fluorophore were
immobilised and irradiated at 473 nm on a TIRF microscope as described in ‘Materials and
Methods’. The intensity-time trajectory of single particles was monitored and an example obtained
with a dimeric GFP is shown in panel A. The number of photobleaching steps was determined for
each particle and the distributions obtained at a laser power of 180 W/cm2 are shown in grey (B,
monomeric eGFP; C, dimeric eGFP; D, tetrameric eGFP). In the case of tetrameric eGFP, the
photobleaching pattern and distribution of steps also was determined after irradiation at 60 W/cm2
(black bars) and 260 W/cm2 (white bars).
A B
C D

57
Figure 3-9: Effects of the M2 receptor and DTT on the photobleaching pattern of
heterotrimeric Gi1.
eGFP-labelled Gi121 was expressed in Sf9 cells either alone (grey bars) or together with M2
receptor (black bars). The heterotrimeric G protein or receptor-G protein complex was purified by
means of a hexahistidyl tag fused at the N-terminus of the -subunit. The purified materials were
immobilised and the photobleaching patterns of single particles were recorded to obtain the data
plotted in panel A. The photobleaching pattern of purified eGFP-Gi121 also was recorded in the
presence of 10 mM DTT to obtain the data (white bars) plotted together with the samples without
DTT (grey bars) in panel B.
A
B
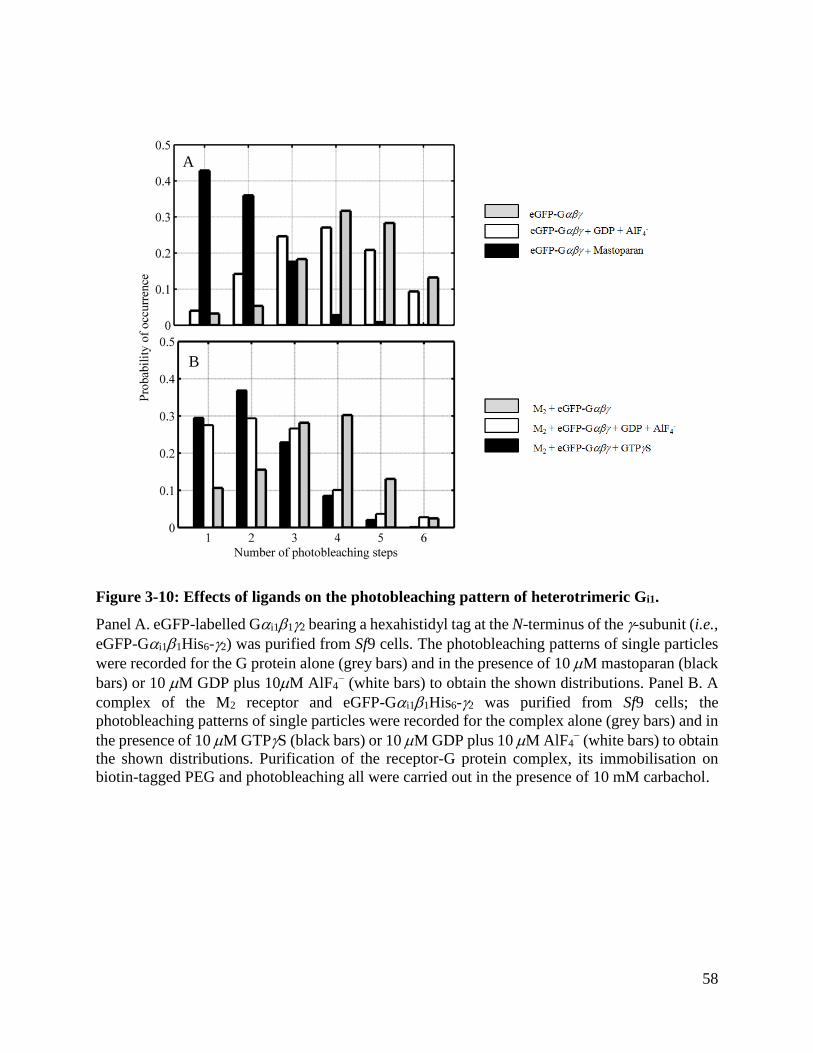
58
Figure 3-10: Effects of ligands on the photobleaching pattern of heterotrimeric Gi1.
Panel A. eGFP-labelled Gi112 bearing a hexahistidyl tag at the N-terminus of the -subunit (i.e.,
eGFP-Gi11His6-2) was purified from Sf9 cells. The photobleaching patterns of single particles
were recorded for the G protein alone (grey bars) and in the presence of 10 M mastoparan (black
bars) or 10 M GDP plus 10M AlF4− (white bars) to obtain the shown distributions. Panel B. A
complex of the M2 receptor and eGFP-Gi11His6-2 was purified from Sf9 cells; the
photobleaching patterns of single particles were recorded for the complex alone (grey bars) and in
the presence of 10 M GTPS (black bars) or 10 M GDP plus 10 M AlF4− (white bars) to obtain
the shown distributions. Purification of the receptor-G protein complex, its immobilisation on
biotin-tagged PEG and photobleaching all were carried out in the presence of 10 mM carbachol.
A
B

59
CHAPTER 4 GENERAL DISCUSSION
60
4.1. Insights from the Thesis
A dispersion of affinities is observed in the binding of agonists to GPCRs and the breadth
of that dispersion is reduced upon the addition of guanyl nucleotides. Different models have been
used to account for this phenomenon, one of which attributes the implied heterogeneity to
cooperative interactions between neighboring sites in an oligomeric array of GPCRs. When
applied quantitatively, the cooperativity model has been shown to provide a good description of
the binding properties of the M2 receptor in various preparations if there are at least four interacting
sites, presumably within a tetramer108,135,188. In agreement with the model-based predictions of
binding assays, oligomers of various GPCRs have been detected in recent studies involving
biophysical techniques (Chapter 1).
Whereas the guanyl nucleotide-sensitive heterogeneity seen in the binding of agonists to
GPCRs is a well-known phenomenon, it is mirrored by a less-known, agonist-sensitive
heterogeneity in the binding of GDP to receptor-coupled G proteins25,79,175. For example, the
binding of guanyl nucleotides to sites labelled by [35S]GTPS in myocardial membranes has
revealed a heterogeneity indicative of multiple classes of sites; in the case of GDP, the addition of
a muscarinic agonist induced a rightward shift in the binding curve that appeared as an
interconversion of G proteins from a state of high affinity to a state of low affinity. The reciprocal
nature of these effects suggests that essentially the same mechanism underlies the effect of guanyl
nucleotides on agonists and that of agonists on GDP. Furthermore, some GPCRs have been co-
purified with equimolar quantities of their attendant G subunits (e.g., the M2 receptor purified
from porcine atria23,107 and the -opioid receptor from rat brain23,107). Such observations suggest
that the functional unit of GPCR-mediated signalling is an oligomer comprising multiple copies
of receptor and G protein at an overall ratio of 1. Ratios of receptors to G protein of 2:1 and 4:1
also have been reported in the case of rhodopsin when reconstituted into phospholipid
vesicles100,182. A tetrameric M2 receptor therefore may be associated with a monomeric, dimeric,
or tetrameric G protein.
In contrast to the much-studied oligomeric GPCRs, the oligomeric status of G proteins has
been largely ignored with the exception of a few early biochemical studies. Hydrodynamic studies
performed more than two decades ago identified multimers of various types of G protein in isolated
native tissues83,121,122. Such observations led to the proposal of the ‘Disaggregation Theory of
Hormone Action’149, which offered an alternative to more commonly acknowledged schemes

61
based on the ternary complex model56. The disaggregation theory hypothesises the existence of
two populations of G protein during the signalling cycle. Upon the binding of hormones to GPCRs,
multimeric G proteins disaggregate into GTP-bound monomers that subsequently induce the
activities of downstream effectors.
Oligomeric Go has been detected on western blots of non-denaturing polyacrylamide gels
loaded with purified G protein subjected previously to cross-linking193,196. In contrast, no cross-
linked band was observed in a sample that was pre-incubated with GTPS193. In agreement with
those results, which are consistent with the disaggregation theory, the current study found that
affinity-purified Gi1 appeared as oligomers when resolved on polyacrylamide gels after cross-
linking with BS3 (Figure 3-1). In the current project, we also have examined fluorescent G proteins
for their oligomeric status in live CHO cells and at the level of single molecules after solubilisation
and purification from Sf9 cells. Oligomers were detected under the above conditions, and their
disaggregation dynamics were tracked upon the addition of M2 muscarinic receptor, an additional
reducing agent, and various ligands.
4.1.1. Identification of G Protein Oligomers
A comparison of the binding curves obtained with Gi1 purified alone, with G, and with
G plus M2 receptor (M2G) showed that receptor-coupled G proteins are of higher affinity for
[35S]GTPS (Figure 3-2). Moreover, the lower affinities associated with receptor-free G proteins
were not observed in samples of M2G; therefore, all of the G protein in those samples was coupled
to receptor.
In addition, heterogeneity was observed in [35S]GTPS binding assays on M2G. The
difference between the estimated affinities is about 80-fold (K1/K2). Because the Sf9 cells were
infected with baculovirus coding for only one type of G protein, and because no endogenous G
protein was detected on western blots of material from uninfected cells (Figure 3-1, lane 1), it
appears that the heterogeneity observed in binding profiles was induced in an otherwise
homogeneous population of G proteins. That could arise from oligomers of G proteins with their
constituent protomers interacting in a cooperative fashion. Such an arrangement would be similar
to that described for oligomers of the M2 muscarinic receptor (e.g., references 108,135,188).
Heterogeneity revealed in the binding of GTPS has been reported previously when the M2
muscarinic receptor was co-purified with various subtypes of G from porcine atria107.

62
In two fluorescence based approaches that monitored the eGFP- and mCherry-bearing G
proteins in CHO cells, large fractions of both labelled G proteins were found to co-diffuse in
measurements of dcFCS, as determined from the amplitudes of the auto- and cross-correlation
functions (Figure 3-3A); also, significant levels of FRET were observed between the two
fluorophores (Figure 3-4). eGFP- and mCherry-tagged G proteins therefore appear to exist as
dimers or larger oligomers. Several lines of evidence argue that the association is specific. There
was no cross-correlation or FRET between MP-GFP and mCh-Gi1 (Figures 3-3C and 3-4); in
contrast, nearly all of mCh-Gi1 co-diffused with eGFP-G (Figure 3-3B), indicating the existence
of a stable G protein heterotrimer in a system at rest. Furthermore, there was no relationship
between the apparent FRET efficiency (Eapp) and the expression levels of acceptor and donor
(Figure 3-5). The interactions detected by dcFCS and FRET therefore do not appear to arise in a
stochastic manner, suggesting that G proteins exist wholly or in part as oligomers in live CHO
cells.
4.1.2. Quantification of G Protein Oligomers
FRET is not only an indication of close distance between donor- and acceptor-tagged G
proteins, it also can be used quantitatively to estimate the size of an oligomer. In the current study,
the dependence of Eapp on [𝐴]𝑇 [𝐷]𝑇⁄ was analysed in terms of a model based on a stable oligomer
to estimate the size of oligomers formed by eGFP- and mCherry-tagged G proteins (Equation 2-
9). The same model has been used previously to estimate the size of oligomers formed by M2
muscarinic receptors in CHO cells138. The model yields fitted estimates of the pair-wise FRET
efficiency (E) for a given oligomeric size (n). The E value obtained for a dimer of eGFP- and
mCherry-tagged G proteins in a large number of cells exceeded 100% under all three conditions
and even the lowest fixed values of E that did not significantly compromise the goodness of fit
were well above 100% (Figure 3-7). The values obtained for a trimer were physically possible (i.e.,
< 100%) but high nonetheless (E = 77–91%). Realistic values of E were obtained only for a
tetramer or larger oligomer (i.e., E ≤ ~60%)
The model employed in this study accounts for all combinations of donor and acceptor and
includes all pathways for resonance energy transfer in an oligomer of defined size. It assumes that
there is no net change in oligomeric size, at least under the conditions of the measurement, and it
therefore is unsuitable for dynamic systems in which the G proteins interconvert between
63
monomers and oligomers or between oligomers of different size. The model also assumes that the
distance between fluorophores and therefore the pair-wise FRET efficiency is identical for all pairs
of donor and acceptor within the oligomer. The latter assumption makes the estimated value E less
accurate when the fixed size of the oligomer exceeds a dimer. The rejection of a dimer and very
likely a trimer on the basis of anomalously large pair-wise FRET efficiencies places a lower limit
of four on the size of the oligomer in CHO cells. There was little or no effect on the value of E
upon the inclusion of M2 receptor, either with or without agonist.
To avoid the limitations associated with efficiencies averaged over an entire cell and over
the time of the measurement, step-wise photobleaching analysis was employed to track individual
fluorophore-labelled G proteins at the level of single oligomers. Upon irradiation at 473 nm,
purified eGFP-tagged G proteins gave intensity-time trajectories with successive photobleaching
steps, the maximum step of a large amount of sampled molecules formed a distribution. A series
of multimeric eGFP fusion proteins of different sizes also gave distributions of photobleaching
steps, but the number of steps never exceeded the number of fluorophores in the fusion protein
(Figure 3-8). Laser power also plays a role in shaping the step distribution (Figure 3-8D).
Employment of a high laser power, which can potentially excite and photobleach all fluorophores
in a complex, has been shown to increase the occurrence of traces with a higher number of steps.
Higher power therefore provides a more accurate indication of the true size of the photobleached
protein. It also leads to rapid photobleaching, however, and thus to fewer molecules that can be
surveyed. The choice of laser power therefore is a trade-off between obtaining more accurate
results with a higher power and observing more molecules before they are photobleached with a
lower power. A medium level of power therefore was used to examine the size of G protein
oligomers in the present study.
Photobleaching of eGFP-tagged G proteins revealed distributions spanning 1 through 6
steps, with a predominance of 4 steps (Figure 3-9). The presence of the M2 muscarinic receptor
and the addition of DTT both reduced the occurrence of traces with 5 or 6 steps (Figure 3-9). These
observations imply the existence of mostly tetrameric G proteins. Monomers and dimers cannot
be ruled out, however, and particles that displayed 5 or 6 steps may be a result of non-specific
association between tetramers and the smaller complexes. If so, those aggregates appear to be
broken apart or otherwise disfavoured by reducing agents or the M2 receptor. We therefore
conclude that G proteins at rest exist as oligomers that likely comprise four heterotrimeric units,

64
both in the absence and in the presence of M2 receptor. Taken together with previous results from
our laboratory, which demonstrated the existence of a tetrameric M2 muscarinic receptor in various
preparations, it appears that the functional unit of M2 receptor and Gi112 comprises four copies
of each.
4.1.3. Size of G Protein Oligomers upon Activation
In the absence of the M2 muscarinic receptor, the addition of guanyl nucleotides induced
little or no change in the distribution of photobleaching steps of the G protein (Figure 3-10A). It
follows that the oligomeric status of a tetrameric G protein is insensitive to stimulation solely by
a guanyl nucleotide. In contrast, in the presence of an agonist-activated M2 muscarinic receptor,
the addition of a guanyl nucleotide led to a leftward shift in the photobleaching step distribution
(Figure 3-10B). The addition of an active GPCR mimic, mastoparan, resulted in a similar re-
distribution (Figure 3-10A). It therefore appears that the dissociation of G protein oligomers
requires stimulation from both an activated GPCR and a guanyl nucleotide.
Results of early biochemical studies and the data collected in the current project argue for
a stable oligomeric G protein under resting conditions. The oligomeric size also seems unaffected
by guanyl nucleotide alone. However, the combination of activated M2 receptor and guanyl
nucleotide appears to cause dissociation of the oligomer as indicated by the lower number of steps
observed. It therefore appears that a constitutive oligomer of G proteins undergoes dissociation
upon the activation of a coupled receptor by an agonist and of the G protein by a guanyl nucleotide.
Such an arrangement is consistent with the disaggregation theory proposed initially by Rodbell149.

65
CHAPTER 5 FUTURE DIRECTIONS

66
5.1. Minimising the Occurrence of Residual Oligomers
Observations from the current study suggest the existence of two types of G protein
oligomer: a stable oligomer that is insensitive to stimulation by guanyl nucleotides and a transient
GPCR-coupled oligomer that dissociates into smaller entities upon the addition of guanyl
nucleotides. The presence of both types of oligomer was inferred from the results of
photobleaching studies on immobilised G protein samples. This single-molecule technique takes
advantage of the proportional relationship between the intensity of fluorescent emission and the
number of fluorophores present in a multimeric molecule. A step-wise decrease in intensity that
follows photobleaching is used as a means to determine the size of the fluorescent oligomer.
With oligomers of Gi1 in the absence of the receptor, the addition of guanyl nucleotides did
not affect the distribution of the number of photobleaching steps, thus indicating a stable oligomer.
With oligomers of Gi1 coupled to agonist-activated M2 receptors, the addition of guanyl
nucleotides led to a shift in the distribution from one centred on four steps to one that was
composed predominately of one and two steps. This shift implies a dissociation of tetrameric or
larger G proteins to monomers or dimers, but the same distribution also contained an appreciable
number of particles with three photobleaching steps. The retention of such larger particles in the
presence of guanyl nucleotides may be a result of the incomplete dissociation of the original
oligomer or the non-specific formation of smaller units of the G protein.
To examine this further, various parameters of the measuring system will be optimised to
yield a more definitive result, particularly the elimination of particles showing three or more
photobleaching steps after addition of guanyl nucleotide. First, the current time of 20 min for
incubation of the purified proteins with various ligands may not be sufficient for all of the sampled
particles to be affected. Therefore, by increasing the incubation time prior to photobleaching, one
would expect to observe a lower retention of the larger species. Second, a more robust activation
may be achievable with a constitutively active mutant of Gi1 in which GTP hydrolysis is blocked
by the point mutation Q204L89. The mutant itself may show fewer particles with three or more
photobleaching steps, and the addition of a guanyl nucleotide may lead to fewer still.
Combinations of the mutant, mastoparan and guanyl nucleotides (e.g., GTPS or GDP plus AlF4−)
also may reduce the number of steps. Third, larger residual oligomers may arise from non-specific
interactions between smaller units such as monomers and dimers, even in the presence of -
mercaptoethanol. The reducing agent DDT has been shown to reduce the occurrence of G protein
67
oligomers that displayed 5 and 6 photobleaching steps (Figure 3-9B), but DTT itself may have
undergone oxidation under the conditions of the assays164. This will be tested by replenishing the
sample with additional DTT over the course of the measurements described above.
5.2. Oligomeric Status of the M2 Receptor
As discussed previously, the oligomeric status of functional GPCRs and the composition
of the signalling complex formed by GPCRs and G proteins have been topics of great interest and
much debate. Single-particle photobleaching therefore will be used to investigate the oligomeric
status of the M2 muscarinic receptor, both alone and in a complex with Gi1.
To estimate the size of the receptor alone, M2 receptor bearing a His6 tag and eGFP at its
amino terminus will be expressed in Sf9 cells and purified in digitonin and sodium cholate as
previously described (e.g., reference 136). The baculovirus encoding the construct is currently
available in our laboratory. The extracted and purified receptor will be immobilised on biotin-
containing PEG, and the photobleaching step patterns will be recorded by means of TIRF
microscopy. The reducing agent DTT will be included throughout the purification and subsequent
measurements to minimise non-specific aggregation of the receptor. At least four photobleaching
steps are expected on the basis of evidence that the M2 receptor is a tetramer. To examine the effect
of agonists on the oligomeric status of the receptor, a saturating concentration of the muscarinic
agonist carbachol will be added to the receptor prior to immobilisation. If the distribution of
photobleaching steps remains largely unchanged, it would suggest that the receptor exists as a
stable oligomer; alternatively, a shift to fewer steps would argue in favour of a transient oligomer
that dissociates upon activation.
To monitor the oligomeric status of the receptor in a complex with the G protein, the eGFP-
bearing M2 receptor will be co-purified with heterotrimeric Gi1 bearing a hexahistidyl tag at the N-
terminus of the -subunit. The purification will be carried out as described in Chapter 2, with the
same steps taken to ensure the association of the receptor and the G protein (Figure 2-3B). The
immobilised complex will be subsequently examined by single-particle photobleaching.
Placement of the fluorophore at the N-terminus of the M2 receptor and His6 on the -subunit of the
G protein will ensure that all measurements will be of receptors coupled to heterotrimeric G
proteins. Measurements in the absence and presence of guanyl nucleotides will provide
information on the olgomeric status of the receptor within the complex before and after activation

68
of the G protein. A nucleotide-dependent decrease in the number of immobilised fluorescent
particles would suggest that activation causes dissociation of the receptor from the G protein.

69
REFERENCES
1. Aires V, Hichami A, Boulay G, Khan NA. Activation of TRPC6 calcium channels by
diacylglycerol (DAG)-containing arachidonic acid: a comparative study with DAG-containing
docosahexaenoic acid. Biochimie. 2007;89(8):926-937.
2. Albert AD, Yeagle PL. Structural studies on rhodopsin. Biochim Biophys Acta.
2002;1565(2):183-195.
3. Alexander NS, Preininger AM, Kaya AI, Stein RA, Hamm HE, Meiler J. Energetic analysis of
the R*-G complex links the 5 helix to GDP release and domain opening. Nat Struct Mol Biol.
2013;21(1):56-63.
4. Angel TE, Chance MR, Palczewski K. Conserved waters mediate structural and functional
activation of family A (rhodopsin-like) G protein-coupled receptors. Proc Natl Acad Sci U S A.
2009;106(21):8555-8560.
5. Angers S, Salahpour A, Joly E, et al. Detection of β2-adrenergic receptor dimerization in living
cells using bioluminescence resonance energy transfer (BRET). Proc Natl Acad Sci U S A.
2000;97(7):3684-3689.
6. Azpiazu I, Gautam N. A fluorescence resonance energy transfer-based sensor indicates that
receptor access to a G protein is unrestricted in a living mammalian cell. J Biol Chem.
2004;279(26):27709-27718.
7. Baldwin JM. Structure and function of receptors coupled to G proteins. Curr Opin Cell Biol.
1994;6(2):180-190.
8. Ballesteros J.A, Weinstein H. Integrated methods for the construction of three dimensional
models and computational probing of structure-function relations in G-protein coupled receptors.
J Neurosci Methods. 1995;25:366-428.
9. Bennett JP, Snyder SH. Serotonin and lysergic acid diethylamide binding in rat brain
membranes: relationship to postsynaptic serotonin receptors. Mol Pharmacol. 1976;12(3):373-
389.
10. Berlot CH, Bourne HR. Identification of effector-activating residues of Gs. Cell.
1992;68(5):911-922.
11. Berman DM, Kozasa T, Gilman AG. The GTPase-activating protein RGS4 stabilizes the
transition state for nucleotide hydrolysis. J Biol Chem. 1996;271(44):27209-27212.
12. Berrie CP, Birdsall NJM, Burgen ASV, Hulme EC. Guanine nucleotides modulate muscarinic
receptor binding in the heart. Biochem Biophys Res Commun. 1979;87(4):1000-1005.
70
13. Berstein G, Blank JL, Jhon D, Exton JH, Rhee SG, Ross EM. Phospholipase Cβ1 is a GTPase-
activating protein for Gq/11, its physiologic regulator. Cell. 1992;70(3):411-418.
14. Bigay J, Faurobert E, Franco M, Chabre M. Roles of lipid modifications of transducin subunits
in their GDP-dependent association and membrane binding. Biochemistry. 1994;33(47):14081-
14090.
15. Birdsall NJ, Burgen AS, Hiley CR, Hulme EC. Binding of agonists and antagonists to
muscarinic receptors. J Supramol Struct. 1976;4:367-371.
16. Birdsall NJM, Burgen ASV, Hulme EC. The binding of agonists to brain muscarinic receptors.
Mol Pharmacol. 1978;14(5):723-736.
17. Bohm A, Gaudet R, Sigler PB. Structural aspects of heterotrimeric G-protein signaling. Curr
Opin Biotechnol. 1997;8(4):480-487.
18. Bornancin F, Pfister C, Chabre M. The transitory complex between photoexcited rhodopsin
and transducin. Eur J Biochem. 1989;184(3):687-698.
19. Bünemann M, Frank M, Lohse MJ. Gi protein activation in intact cells involves subunit
rearrangement rather than dissociation. Proc Natl Acad Sci U S A. 2003;100(26):16077-16082.
20. Burt DR, Creese I, Snyder SH. Properties of [3H]haloperidol and [3H]dopamine binding
associated with dopamine receptors in calf brain membranes. Mol Pharmacol. 1976;12(5):800-
812.
21. Cai K, Itoh Y, Khorana HG. Mapping of contact sites in complex formation between transducin
and light-activated rhodopsin by covalent crosslinking: Use of a photoactivatable reagent. Proc
Natl Acad Sci U S A. 2000;98(9):4877-4882.
22. Calebiro D, Rieken F, Wagner J, et al. Single-molecule analysis of fluorescently labeled G-
protein-coupled receptors reveals complexes with distinct dynamics and organization.
Proceedings of the National Academy of Sciences. 2013;110(2):743-748.
23. Chalecka-Franaszek E, Weems HB, Crowder AT, Cox BM, Côté TE. Immunoprecipitation of
high-affinity, guanine nucleotide-sensitive, solubilized -opioid receptors from rat brain. J
Neurochem. 2000;74(3):1068-1078.
24. Chen Z, Singer WD, Sternweis PC, Sprang SR. Structure of the p115RhoGEF rgRGS domain–
Gα13/i1 chimera complex suggests convergent evolution of a GTPase activator. Nat Struct Mol Biol.
2005;12(2):191-197.
25. Chidiac P, Wells JW. Effects of adenyl nucleotides and carbachol on cooperative interactions
among G proteins. Biochemistry (N Y ). 1992;31(44):10908-10921.
71
26. Chien EYT, Liu W, Zhao Q, et al. Structure of the human dopamine D3 receptor in complex
with a D2/D3 selective antagonist. Science. 2010;330(6007):1091-1095.
27. Chung KY, Rasmussen SGF¸, Liu T, et al. 2 adrenergic receptor-induced conformational
changes in the heterotrimeric G protein Gs. Nature. 2011;477(7366):611-615.
28. Coleman DE, Berghuis AM, Lee E, Linder ME, Gilman AG, Sprang SR. Structures of active
conformations of Gi1 and the mechanism of GTP hydrolysis. Science. 1994;265(5177):1405-
1412.
29. Coleman DE, Sprang SR. Structure of Gi1.GppNHp, autoinhibition in a G protein-substrate
complex. J Biol Chem. 1999;274(24):16669-16672.
30. Coleman DE, Sprang SR. Crystal structures of the G protein Gi1 complexed with GDP and
Mg2+: a crystallographic titration experiment. Biochemistry (N Y ). 1998;37(41):14376-14385.
31. Conklin BR, Farfel Z, Lustig KD, Julius D, Bourne HR. Substitution of three amino acids
switches receptor specificity of Gqto that of Gi. Nature. 1993;363(6426):274-276.
32. Conn JP, Christopoulos A, Lindsley CW. Allosteric modulators of GPCRs: a novel approach
for the treatment of CNS disorders. Nat Rev Drug Discov. 2009;8(1):41-54.
33. Conn PM, Venter JC. Radiation inactivation (target size analysis) of the gonadotropin-
releasing hormone receptor: evidence for a high molecular weight complex. Endocrinology.
1985;116(4):1324-1326.
34. Cvejic S, Devi LA. Dimerization of the -opioid receptor: implication for a role in receptor
internalization. J Biol Chem. 1997;272(43):26959-26964.
35. De Lean A, Stadel JM, Lefkowitz RJ. A ternary complex model explains the agonist-specific
binding properties of the adenylate cyclase-coupled -adrenergic receptor. J Biol Chem.
1980;255(15):7108-7117.
36. De Vries L, Mousli M, Wurmser A, Farquhar MG. GAIP, a protein that specifically interacts
with the trimeric G protein Gi3, is a member of a protein family with a highly conserved core
domain. Proc Natl Acad Sci U S A. 1995;92(25):11916-11920.
37. Degtyarev MY, Spiegel AM, Jones TL. Palmitoylation of a G protein i subunit requires
membrane localization not myristoylation. J Biol Chem. 1994;269(49):30898-30903.
38. Denker BM, Boutin PM, Neer EJ. Interactions between the amino- and carboxyl-terminal
regions of G subunits: analysis of mutated Go/i2 chimeras. Biochemistry (N Y ).
1995;34(16):5544-5553.
39. Dohlman HG, Thorner J. RGS proteins and signaling by heterotrimeric G proteins. J Biol
Chem. 1997;272(7):3871-3874.

72
40. Dorsch S, Klotz K, Engelhardt S, Lohse MJ, Bunemann M. Analysis of receptor
oligomerization by FRAP microscopy. Nat Meth. 2009;6(3):225-230.
41. Downes GB, Gautam N. The G protein subunit gene families. Genomics. 1999;62(3):544-552.
42. Dratz EA, Furstenau JE, Lambert CG, et al. NMR structure of a receptor-bound G-protein
peptide. Nature. 1993;363(6426):276-281.
43. Ehlert FJ. The relationship between muscarinic receptor occupancy and adenylate cyclase
inhibition in the rabbit myocardium. Mol Pharmacol. 1985;28(5):410-421.
44. Emeis D, Kühn H, Reichert J, Hofmann KP. Complex formation between metarhodopsin II
and GTP-binding protein in bovine photoreceptor membranes leads to a shift of the photoproduct
equilibrium. FEBS letters. 1982;143(1):29-34.
45. Evanko DS, Thiyagarajan MM, Wedegaertner PB. Interaction with G is required for
membrane targeting and palmitoylation of Gi and Gq. J Biol Chem. 2000;275(2):1327-1336.
46. Feder TJ, Brust-Mascher I, Slattery JP, Baird B, Webb WW. Constrained diffusion or
immobile fraction on cell surfaces: a new interpretation. Biophys J. 1996;70(6):2767-2773.
47. Ford CE, Skiba NP, Bae H, et al. Molecular basis for interactions of G protein subunits with
effectors. Science. 1998;280(5367):1271-1274. Science. 1998;280(5367):1271-1274.
48. Fotiadis D, Liang Y, Filipek S, Saperstein DA, Engel A, Palczewski K. Atomic-force
microscopy: rhodopsin dimers in native disc membranes. Nature. 2003;421(6919):127-128.
49. Fredriksson R, Lagerstrom MC, Lundin L, Schioth HB. The G protein-coupled receptors in
the human genome form five main families. Phylogenetic analysis, paralogon groups, and
fingerprints. Mol Pharmacol. 2003;63(6):1256-1272.
50. Galbiati F, Guzzi F, Magee AI, Milligan G, Parenti M. N-terminal fatty acylation of the alpha-
subunit of the G-protein Gi1: only the myristoylated protein is a substrate for palmitoylation.
Biochem J. 1994;303:697-700.
51. Gales C, Van Durm J,J.J., Schaak S, et al. Probing the activation-promoted structural
rearrangements in preassembled receptor-G protein complexes. Nat Struct Mol Biol.
2006;13(9):778-786.
52. Galvez T, Parmentier M, Joly C, et al. Mutagenesis and modeling of the GABAB receptor
extracellular domain support a venus flytrap mechanism for ligand binding. J Biol Chem.
1999;274(19):13362-13369.
53. Gandia J, Galino J, Amaral OB, et al. Detection of higher-order G protein-coupled receptor
oligomers by a combined BRET-BiFC technique. FEBS Lett. 2008;582(20):2979-2984.
73
54. Gaudet R, Bohm A, Sigler PB. Crystal structure at 2.4 Å resolution of the complex of
transducin and its regulator, phosducin. Cell. 1996;87(3):577-588.
55. Gaudet R, Savage JR, McLaughlin JN, Willardson BM, Sigler PB. A molecular mechanism
for the phosphorylation-dependent regulation of heterotrimeric G proteins by phosducin. Mol Cell.
1999;3(5):649-660.
56. Gilman AG. G proteins: transducers of receptor-generated signals. Annu Rev Biochem.
1987;56:615-649.
57. Golebiewska U, Johnston JM, Devi L, Filizola M, Scarlata S. Differential response to morphine
of the oligomeric state of -opioid in the presence of -opioid receptors. Biochemistry (N Y ).
2011;50(14):2829-2837.
58. Granier S, Manglik A, Kruse AC, et al. Structure of the -opioid receptor bound to naltrindole.
Nature. 2012;485(7398):400-404.
59. Green MA, Chidiac P, Wells JW. Cardiac muscarinic receptors. relationship between the G
protein and multiple states of affinity. Biochemistry (N Y ). 1997;36(24):7380-7394.
60. Greenberg DA, Snyder SH. Pharmacological properties of [3H]dihydroergokryptine binding
sites associated with -noradrenergic receptors in rat brain membranes. Mol Pharmacol.
1978;14(1):38-49.
61. Grishina G, Berlot CH. A surface-exposed region of Gs in which substitutions decrease
receptor-mediated activation and increase receptor affinity. Mol Pharmacol. 2000;57(6):1081-
1092.
62. Haga K, Kruse AC, Asada H, et al. Structure of the human M2 muscarinic acetylcholine
receptor bound to an antagonist. Nature. 2012;482(7386):547-551.
63. Hamm HE. The many faces of G protein signaling. J Biol Chem. 1998;273(2):669-672.
64. Hamm HE, Deretic D, Arendt A, Hargrave PA, Koenig B, Hofmann KP. Site of G protein
binding to rhodopsin mapped with synthetic peptides from the x subunit. Science.
1988;241(4867):832.
65. Hamm HE, Kaya AI, Gilbert JA, Preininger AM. Linking receptor activation to changes in SW
I and II of G proteins. J Struct Biol. 2013;184(1):63-74.
66. Hanson MA, Roth CB, Jo E, et al. Crystal structure of a lipid G protein-coupled receptor.
Science. 2012;335(6070):851-855.
67. Harmar A. Family-B G-protein-coupled receptors. Genome Biol. 2001;2(12): reviews3013.1-
reviews3013.10.

74
68. Hayflick JS. A family of heptahelical receptors with adhesion-like domains: a marriage
between two super families. J Recept Signal Transduct. Res 2000;20(2-3):119-131.
69. Hein P, Frank M, Hoffmann C, Lohse MJ, Bünemann M. Dynamics of receptor/G protein
coupling in living cells. EMBO J. 2005;24(23):4106-4114.
70. Hein P, Rochais F, Hoffmann C, et al. Gs activation is time-limiting in initiating receptor-
mediated signaling. J Biol Chem. 2006;281(44):33345-33351.
71. Herlitze S, Garcia DE, Mackie K, Hille B, Scheuer T, Catterall WA. Modulation of Ca2+
channels by G protein subunits. Nature. 1996;380(6571):258-262.
72. Hern JA, Baig AH, Mashanov GI, et al. Formation and dissociation of M1 muscarinic receptor
dimers seen by total internal reflection fluorescence imaging of single molecules. Proc Natl Acad
Sci U S A. 2010;107(6):2693-2698.
73. Herrick-Davis K, Grinde E, Lindsley T, Cowan A, Mazurkiewicz JE. Oligomer size of the
serotonin 5-hydroxytryptamine 2C (5-HT2C) receptor revealed by fluorescence correlation
spectroscopy with photon counting histogram analysis: Evidence for homodimers without
monomers or tetramers. J Biol Chem. 2012;287(28):23604-23614.
74. Higashijima T, Ferguson KM, Smigel MD, Gilman AG. The effect of GTP and Mg2+ on the
GTPase activity and the fluorescent properties of Go. J Biol Chem. 1987;262(2):757-761.
75. Hollenstein K, Kean J, Bortolato A, et al. Structure of class B GPCR corticotropin-releasing
factor receptor 1. Nature. 2013;499(7459):438-443.
76. Huang J, Chen S, Zhang JJ, Huang X. Crystal structure of oligomeric 1-adrenergic G protein-
coupled receptors in ligand-free basal state. Nat Struct Mol Biol. 2013;20(4):419-425.
77. Hulme EC. Interactions of alkaloids and peptides with opiate receptors. Biochem Soc Trans.
1977;5(1):65-69.
78. Iiri T, Herzmark P, Nakamoto JM, van Dop C, Bourne HR. Rapid GDP release from Gs in
patients with gain and loss of endocrine function. Nature. 1994;371(6493):164-8.
79. Ikegaya T, Nishiyama T, Haga K, et al. Interaction of atrial muscarinic receptors with three
kinds of GTP-binding proteins. J Mol Cell Cardiol. 1990;22(3):343-351.
80. Itoh Y, Cai K, Khorana HG. Mapping of contact sites in complex formation between light-
activated rhodopsin and transducin by covalent crosslinking: use of a chemically preactivated
reagent. Proc Natl Acad Sci U S A. 2000;98(9):4883-4887.
81. Jaakola V, Griffith MT, Hanson MA, et al. The 2.6 Å crystal structure of a human A2A
adenosine receptor bound to an antagonist. Science. 2008;322(5905):1211-1217.
75
82. Jacobson K, Ishihara A, Inman R. Lateral diffusion of proteins in membranes. Annu Rev
Physiol. 1987;49(1):163-175.
83. Jahangeer S, Rodbell M. The disaggregation theory of signal transduction revisited: further
evidence that G proteins are multimeric and disaggregate to monomers when activated. Proc Natl
Acad Sci U S A. 1993;90(19):8782-8786.
84. Janetopoulos C, Jin T, Devreotes P. Receptor-mediated activation of heterotrimeric G-proteins
in living cells. Science. 2001;291(5512):2408-2411.
85. Jastrzebska B, Ringler P, Lodowski DT, et al. Rhodopsin-transducin heteropentamer: three-
dimensional structure and biochemical characterization. J Struct Biol. 2011;176(3):387-394.
86. Kasai RS, Suzuki KGN, Prossnitz ER, et al. Full characterization of GPCR monomer-dimer
dynamic equilibrium by single molecule imaging. J Cell Biol. 2011;192(3):463-480.
87. Katritch V, Cherezov V, Stevens RC. Structure-function of the G protein–coupled receptor
superfamily. Annu Rev Pharmacol Toxicol. 2013;53:531-556.
88. Kent RS, De Lean A, Lefkowitz RJ. A quantitative analysis of -adrenergic receptor
interactions: resolution of high and low affinity states of the receptor by computer modeling of
ligand binding data. Mol Pharmacol. 1980;17(1):14-23.
89. Kleuss C, Raw AS, Lee E, Sprang SR, Gilman AG. Mechanism of GTP hydrolysis by G-
protein subunits. Proc Natl Acad Sci U S A. 1994;91(21):9828-9831.
90. Kozasa T, Gilman AG. Purification of recombinant G proteins from Sf9 cells by hexahistidine
tagging of associated subunits: characterization of 12 and inhibition of adenylyl cyclase by z. J
Biol Chem. 1995;270(4):1734-1741.
91. Kreutz B, Yau DM, Nance M, Tanabe S, Tesmer JJG, Kozasa T. A new approach to producing
functional G subunits yields the activated and deactivated structures of G12/13 proteins.
Biochemistry (N Y ). 2006;45(1):167-174.
92. Kruse AC, Hu J, Pan AC, et al. Structure and dynamics of the M3 muscarinic acetylcholine
receptor. Nature. 2012;482(7386):552-556.
93. Lambert NA. Dissociation of heterotrimeric G proteins in cells. Sci Signal. 2008;1(25):re5.
94. Lambright DG, Noel JP, Hamm HE, Sigler PB. Structural determinants for activation of the
-subunit of a heterotrimeric G protein. Nature. 1994;369(6482):621-628.
95. Lambright DG, Sondek J, Bohm A, Skiba NP, Hamm HE, Sigler PB. The 2.0 Å crystal
structure of a heterotrimeric G protein. Nature. 1996;379(6563):311-319.
76
96. Lander ES et al. Initial sequencing and analysis of the human genome. Nature.
2001;409(6822):860-921.
97. Lebon G, Warne T, Edwards PC, et al. Agonist-bound adenosine A2A receptor structures reveal
common features of GPCR activation. Nature. 2011;474(7352):521-525.
98. Lee TWT, Sole MJ, Wells JW. Assessment of ternary model for the binding of agonists to
neurohumoral receptors. Biochemistry (N Y ). 1986;25(22):7009-7020.
99. Li Y, Sternweis PM, Charnecki S, et al. Sites for G binding on the G protein subunit overlap
with sites for regulation of phospholipase C and adenylyl cyclase. J Biol Chem.
1998;273(26):16265-16272.
100. Liebman PA, Sitaramayya A. Role of G-protein-receptor interaction in amplified
phosphodiesterase activation of retinal rods. Adv Cyclic Nucleotide Protein Phosphorylation Res.
1984;17:215-225.
101. Liu P, Sudhaharan T, Koh RML, et al. Investigation of the dimerization of proteins from the
epidermal growth factor receptor family by single wavelength fluorescence cross-correlation
spectroscopy. Biophys J. 2007;93(2):684-698.
102. Liu Y, Arshavsky VY, Ruoho AE. Interaction sites of the C-terminal region of the cGMP
phosphodiesterase inhibitory subunit with the GDP-bound transducin alpha-subunit. Biochem J.
1999;337:281-288.
103. Lodowski DT, Pitcher JA, Capel WD, Lefkowitz RJ, Tesmer JJG. Keeping G proteins at bay:
a complex between G protein-coupled receptor kinase 2 and G. Science. 2003;300(5623):1256-
1262.
104. Loew A, Ho Y, Blundell T, Bax B. Phosducin induces a structural change in transducin . Structure. 1998;6(8):1007-1019.
105. Logothetis DE, Kurachi Y, Galper J, Neer EJ, Clapham DE. The subunits of GTP-binding
proteins activate the muscarinic K+ channel in heart. Nature. 1987;325(6102):321-326.
106. Lohse MJ, Nuber S, Hoffmann C. Fluorescence/bioluminescence resonance energy transfer
techniques to study G-protein-coupled receptor activation and signaling. Pharmacol Rev.
2012;64(2):299-336.
107. Ma AW-, Pawagi AB, Wells JW. Heterooligomers of the muscarinic receptor and G proteins
purified from porcine atria. Biochem Biophys Res Commun. 2008;374(1):128-133.
108. Ma AW-, Redka DS, Pisterzi LF, Angers S, Wells JW. Recovery of oligomers and
cooperativity when monomers of the M2 muscarinic cholinergic receptor are reconstituted into
phospholipid vesicles. Biochemistry (N Y ). 2007;46(26):7907-7927.

77
109. Manglik A, Kruse AC, Kobilka TS, et al. Crystal structure of the -opioid receptor bound to
a morphinan antagonist. Nature. 2012;485(7398):321-326.
110. Marin EP, Krishna AG, Sakmar TP. Disruption of the 5 helix of transducin impairs
rhodopsin-catalyzed nucleotide exchange. Biochemistry (N Y ). 2002;41(22):6988-6994.
111. Marin EP, Krishna AG, Sakmar TP. Rapid activation of transducin by mutations distant from
the nucleotide-binding site: evidence for a mechanistic model of receptor-catalyzed nucleotide
exchange by G proteins. J Biol Chem. 2001;276(29):27400-27405.
112. Martin EL, Rens-Domiano S, Schatz PJ, Hamm HE. Potent peptide analogues of a G protein
receptor-binding region obtained with a combinatorial library. J Biol Chem. 1996;271(1):361-366.
113. Mattera R, Pitts BJ, Entman ML, Birnbaumer L. Guanine nucleotide regulation of a
mammalian myocardial muscarinic receptor system. evidence for homo- and heterotropic
cooperativity in ligand binding analyzed by computer-assisted curve fitting. J Biol Chem.
1985;260(12):7410-7421.
114. Maurel D, Comps-Agrar L, Brock C, et al. Cell-surface protein-protein interaction analysis
with time-resolved FRET and snap-tag technologies: application to GPCR oligomerization. Nature
Methods. 2008;5(6):561-567.
115. McKnight AJ, Gordon S. The EGF-TM7 family: unusual structures at the leukocyte surface.
J Leukoc Biol. 1998;63(3):271-280.
116. Minton AP, Sokolovsky M. A model for the interaction of muscarinic receptors, agonists, and
two distinct effector substances. Biochemistry (N Y ). 1990;29(6):1586-1593.
117. Mixon MB, Lee E, Coleman DE, Berghuis AM, Gilman AG, Sprang SR. Tertiary and
quaternary structural changes in Gi1 induced by GTP hydrolysis. Science (N.Y.).
1995;270(5238):954-960.
118. Moro O, Lameh J, Högger P, Sadée W. Hydrophobic amino acid in the i2 loop plays a key
role in receptor-G protein coupling. J Biol Chem. 1993;268(30):22273-22276.
119. Moukhametzianov R, Warne T, Edwards PC, et al. Two distinct conformations of helix 6
observed in antagonist-bound structures of a 1-adrenergic receptor. Proc Natl Acad Sci U S A.
2011;108(20):8228-8232.
120. Mumby SM, Kleuss C, Gilman AG. Receptor regulation of G-protein palmitoylation. Proc
Natl Acad Sci U S A. 1994;91(7):2800-2804.
121. Nakamura S, Rodbell M. Glucagon induces disaggregation of polymer-like structures of the
alpha subunit of the stimulatory G protein in liver membranes. Proc Natl Acad Sci U S A.
1991;88(16):7150-7154.
78
122. Nakamura S, Rodbell M. Octyl glucoside extracts GTP-binding regulatory proteins from rat
brain "synaptoneurosomes" as large, polydisperse structures devoid of complexes and sensitive
to disaggregation by guanine nucleotides. Proc Natl Acad Sci U S A. 1990;87(16):6413-6417.
123. Natochin M, Muradov KG, McEntaffer RL, Artemyev NO. Rhodopsin recognition by mutant
Gs containing C-terminal residues of transducin. J Biol Chem. 2000;275(4):2669-2675.
124. Neubig RR. Membrane organization in G-protein mechanisms. FASEB. 1994;8(12):939-946.
125. Nobles M, Benians A, Tinker A. Heterotrimeric G proteins precouple with G protein-coupled
receptors in living cells. Proc Natl Acad Sci USA. 2005;102:18706-18711.
126. Noel JP, Hamm HE, Sigler PB. The 2.2 Å crystal structure of transducin- complexed with
GTP S. Nature. 1993;366(6456):654-663.
127. Offermanns S. G-proteins as transducers in transmembrane signalling. Prog Biophys Mol
Biol. 2003;83(2):101-130.
128. Oldham WM, Hamm HE. Heterotrimeric G protein activation by G-protein-coupled
receptors. Nat Rev Mol Cell Biol. 2008;9(1):60-71.
129. Oldham WM, Hamm H,E. Structural basis of function in heterotrimeric G proteins. Q Rev
Biophys. 2006;39(02):117-166.
130. Oldham WM, Van Eps N, Preininger AM, Hubbell WL, Hamm HE. Mechanism of the
receptor-catalyzed activation of heterotrimeric G proteins. Nat Struct Mol Biol. 2006;13(9):772-
777.
131. Palczewski K, Kumasaka T, Hori T, et al. Crystal structure of rhodopsin: a G protein-coupled
receptor. Science. 2000;289(5480):739-745.
132. Panchenko MP, Saxena K, Li Y, et al. Sites important for PLC2 activation by the G protein
subunit map to the sides of the propeller structure. J Biol Chem. 1998;273(43):28298-28304.
133. Pannbacker RG, Fleischman DE, Reed DW. Cyclic nucleotide phosphodiesterase: high
activity in a mammalian photoreceptor. Science. 1972;175(4023):757-758.
134. Park JH, Scheerer P, Hofmann KP, Choe H, Ernst OP. Crystal structure of the ligand-free G-
protein-coupled receptor opsin. Nature. 2008;454(7201):183-187.
135. Park PS-, Sum CS, Pawagi AB, Wells JW. Cooperativity and oligomeric status of cardiac
muscarinic cholinergic receptors. Biochemistry (N Y ). 2002;41(17):5588-5604.
136. Park PS, Wells JW. Monomers and oligomers of the M2 muscarinic cholinergic receptor
purified from Sf9 cells. Biochemistry (N Y ). 2003;42(44):12960-12971.
79
137. Park PS, Sum CS, Hampson DR, van Tol HHM, Wells JW. Nature of the oligomers formed
by muscarinic M2 acetylcholine receptors in Sf9 cells. Eur J Pharmacol. 2001;421(1):11-22.
138. Pisterzi LF, Jansma DB, Georgiou J, et al. Oligomeric size of the M2 muscarinic receptor in
live cells as determined by quantitative fluorescence resonance energy transfer. J Biol Chem.
2010;285(22):16723-16738.
139. Pitcher JA, Inglese J, Higgins JB, et al. Role of subunits of G proteins in targeting the
beta-adrenergic receptor kinase to membrane-bound receptors. Science (N.Y.).
1992;257(5074):1264-1267.
140. Poyner DR, Birdsall NJ, Curtis C, et al. Binding and hydrodynamic properties of muscarinic
receptor subtypes solubilized in 3-(3-cholamidopropyl)dimethylammonio-2-hydroxy-1-
propanesulfonate. Mol Pharmacol. 1989;36(3):420-429.
141. Preininger AM, Parello J, Meier SM, Liao G, Hamm HE. Receptor-mediated changes at the
myristoylated amino terminus of Gil proteins. Biochemistry (N Y ). 2008;47(39):10281-10293.
142. Qin K, Dong C, Wu G, Lambert NA. Inactive-state preassembly of Gq-coupled receptors and
Gq heterotrimers. Nat Chem Biol. 2011;7(10):740-747.
143. Raicu V. Efficiency of resonance energy transfer in homo-oligomeric complexes of proteins.
J Biol Phys. 2007;33(2):109-127.
144. Rarick HM, Artemyev NO, Hamm HE. A site on rod G protein subunit that mediates
effector activation. Science (N.Y.). 1992;256(5059):1031-1033.
145. Rasmussen SGF, Choi H, Fung JJ, et al. Structure of a nanobody-stabilized active state of the
2 adrenoceptor. Nature. 2011;469(7329):175-180.
146. Rasmussen SGF, DeVree BT, Zou Y, et al. Crystal structure of the 2 adrenergic receptor-Gs
protein complex. Nature. 2011;477(7366):549-555.
147. Redka DS, Heerklotz H, Wells JW. Efficacy as an intrinsic property of the M2 muscarinic
receptor in its tetrameric state. Biochemistry (N Y ). 2013;52(42):7405-7427.
148. Reuveny E, Slesinger PA, Inglese J, et al. Activation of the cloned muscarinic potassium
channel by G protein subunits. Nature. 1994;370(6485):143-146.
149. Rodbell M. Signal transduction: evolution of an idea. Bioscience Reports. 1995;15(3):117-
133.
150. Salahpour A, Bonin H, Bhalla S, Petäjä-Repo U, Bouvier M. Biochemical characterization of
β2-adrenergic receptor dimers and oligomers. Biological Chemistry. 2003;384:117-123.

80
151. Salom D, Lodowski DT, Stenkamp RE, et al. Crystal structure of a photoactivated
deprotonated intermediate of rhodopsin. Proc Natl Acad Sci U S A. 2006;103(44):16123-16128.
152. Seitz HR, Heck M, Hofmann KP, Alt T, Pellaud J, Seelig A. Molecular determinants of the
reversible membrane anchorage of the G-protein transducin. Biochemistry (N Y ).
1999;38(25):7950-7960.
153. Shimamura T, Shiroishi M, Weyand S, et al. Structure of the human histamine H1 receptor
complex with doxepin. Nature. 2011;475(7354):65-70.
154. Simon MI, Strathmann MP, Gautam N. Diversity of G proteins in signal transduction.
Science. 1991;252(5007):802.
155. Siu FY, He M, de Graaf C, et al. Structure of the human glucagon class B G-protein-coupled
receptor. Nature. 2013;499(7459):444-449.
156. Slep KC, Kercher MA, He W, Cowan CW, Wensel TG, Sigler PB. Structural determinants
for regulation of phosphodiesterase by a G protein at 2.0 Å. Nature. 2001;409(6823):1071-1077.
157. Slusarski DC, Corces VG, Moon RT. Interaction of wnt and a frizzled homologue triggers G-
protein-linked phosphatidylinositol signalling. Nature. 1997;390:410-413.
158. Sondek J, Bohm A, Lambright DG, Hamm HE, Sigler PB. Crystal structure of a G-protein dimer at 2.1 Å resolution. Nature. 1996;379(6563):369-374.
159. Sondek J, Lambright DG, Noel JP, Hamm HE, Sigler PB. GTPase mechanism of G proteins
from the 1.7 Å crystal structure of transducin -GDP AIF4-. Nature. 1994;372(6503):276-279.
160. Sprang SR. G protein mechanisms:Insights from structural analysis. Annu Rev Biochem.
1997;66(1):639-678.
161. Stacey M, Lin H, Gordon S, McKnight AJ. LNB-TM7, a group of seven-transmembrane
proteins related to family-B G-protein-coupled receptors. Trends Biochem Sci. 2000;25(6):284-
289.
162. Standfuss J, Edwards PC, D'Antona A, et al. The structural basis of agonist-induced activation
in constitutively active rhodopsin. Nature. 2011;471(7340):656-660.
163. Sternweis PC, Smrcka AV. Regulation of phospholipase C by G proteins. Trends Biochem
Sci. 1992;17(12):502-506.
164. Stevens R, Stevens L, Price NC. The stabilities of various thiol compounds used in protein
purifications. Biochem Educ. 1983;11(2):70.
81
165. Strader CD, Candelore MR, Hill WS, Sigal IS, Dixon RA. Identification of two serine
residues involved in agonist activation of the -adrenergic receptor. J Biol Chem.
1989;264(23):13572-13578.
166. Strader CD, Sigal IS, Candelore MR, Rands E, Hill WS, Dixon RA. Conserved aspartic acid
residues 79 and 113 of the -adrenergic receptor have different roles in receptor function. J Biol
Chem. 1988;263(21):10267-10271.
167. Sunahara RK, Tesmer JJG, Gilman AG, Sprang SR. Crystal structure of the adenylyl cyclase
activator Gs. Science. 1997;278(5345):1943-1947.
168. Tan Q, Zhu Y, Li J, et al. Structure of the CCR5 chemokine receptor-HIV entry inhibitor
maraviroc complex. Science. 2013;341(6152):1387-1390.
169. Tang WJ, Gilman AG. Type-specific regulation of adenylyl cyclase by G protein subunits.
Science. 1991;254(5037):1500-1503.
170. Tesmer JJG, Berman DM, Gilman AG, Sprang SR. Structure of RGS4 bound to AlF4--
activated Gi1: stabilization of the transition state for GTP hydrolysis. Cell. 1997;89(2):251-261.
171. Tesmer JJG, Sunahara RK, Gilman AG, Sprang SR. Crystal structure of the catalytic domains
of adenylyl cyclase in a complex with Gs·GTPS. Science. 1997;278(5345):1907-1916.
172. Tesmer VM, Kawano T, Shankaranarayanan A, Kozasa T, Tesmer JJG. Snapshot of activated
G proteins at the membrane: the Gq-GRK2-G complex. Science. 2005;310(5754):1686-1690.
173. Thomas TC, Schmidt CJ, Neer EJ. G-protein o subunit: mutation of conserved cysteines
identifies a subunit contact surface and alters GDP affinity. Proc Natl Acad Sci U S A.
1993;90(21):10295-10299.
174. Thompson AA, Liu W, Chun E, et al. Structure of the nociceptin/orphanin FQ receptor in
complex with a peptide mimetic. Nature. 2012;485(7398):395-399.
175. Tota MR, Kahler KR, Schimerlik MI. Reconstitution of the purified porcine atrial muscarinic
acetylcholine receptor with purified porcine atrial inhibitory guanine nucleotide binding protein.
Biochemistry (N Y ). 1987;26(25):8175-8182.
176. Venkatakrishnan AJ, Deupi X, Lebon G, Tate CG, Schertler GF, Babu MM. Molecular
signatures of G-protein-coupled receptors. Nature. 2013;494(7436):185-194.
177. Vogel R, Mahalingam M, Lüdeke S, Huber T, Siebert F, Sakmar TP. Functional role of the
"ionic lock”—an interhelical hydrogen-bond network in family A heptahelical receptors. J Mol
Biol. 2008;380(4):648-655.
178. Wall MA, Coleman DE, Lee E, et al. The structure of the G protein heterotrimer Gi. Cell. 1995;83(6):1047-1058.

82
179. Wang C, Wu H, Katritch V, et al. Structure of the human smoothened receptor bound to an
antitumour agent. Nature. 2013;497(7449):338-343.
180. Weidemann T, Schwille P. Dual-color fluorescence cross-correlation spectroscopy with
continuous laser excitation in a confocal setup. Methods Enzymol. 2013; 518:43–70.
181. Weidemann T, Worch R, Kurgonaite K, Hintersteiner M, Bokel C, Schwille P. Single cell
analysis of ligand binding and complex formation of interleukin-4 receptor subunits. Biophys J.
2011;101(10):2360-2369.
182. Wessling-Resnick M, Johnson GL. Transducin interactions with rhodopsin. Evidence for
positive cooperative behavior. J Biol Chem. 1987;262(26):12444-12447.
183. White JF, Noinaj N, Shibata Y, et al. Structure of the agonist-bound neurotensin receptor.
Nature. 2012;490(7421):508-513.
184. White JH, Wise A, Main MJ, et al. Heterodimerization is required for the formation of a
functional GABAB receptor. Nature. 1998;396(6712):679-682.
185. Whorton MR, Bokoch MP, Rasmussen S, et al. A monomeric G protein-coupled receptor
isolated in a high-density lipoprotein particle efficiently activates its G protein. Proc Natl Acad
Sci U S A. 2007;104(18):7682-7687.
186. Wise A, Grassie MA, Parenti M, Lee M, Rees S, Milligan G. A cysteine-3 to serine mutation
of the G-protein Gi1 abrogates functional activation by the 2A-adrenoceptor but not interactions
with the complex. Biochemistry (N Y ). 1997;36(35):10620-10629.
187. Wise A, Parenti M, Milligan G. Interaction of the G-protein G11 with receptors and
phosphoinositidase C: the contribution of G-protein palmitoylation and membrane association.
FEBS Lett. 1997;407(3):257-260.
188. Wreggett KA, Wells JW. Cooperativity manifest in the binding properties of purified cardiac
muscarinic receptors. J Biol Chem. 1995;270(38):22488-22499.
189. Wu B, Chien EYT, Mol CD, et al. Structures of the CXCR4 chemokine GPCR with small-
molecule and cyclic peptide antagonists. Science. 2010;330(6007):1066-1071.
190. Wu H, Wacker D, Mileni M, et al. Structure of the human -opioid receptor in complex with
JDTic. Nature. 2012;485(7398):327-332.
191. Wu H, Wang C, Gregory KJ, et al. Structure of a class C GPCR metabotropic glutamate
receptor 1 bound to an allosteric modulator. Science. 2014;344(6179):58-64.
192. Xu F, Wu H, Katritch V, et al. Structure of an agonist-bound human A2A adenosine receptor.
Science. 2011;332(6027):322-327.

83
193. Yang H, Qu L, Ni J, Wang M, Huang Y. Palmitoylation participates in G protein coupled
signal transduction by affecting its oligomerization. Mol Membr Biol. 2008;25(1):58-71.
194. Yi T, Kitano H, Simon MI. A quantitative characterization of the yeast heterotrimeric G
protein cycle. Proc Natl Acad Sci U S A. 2003;100(19):10764-10769.
195. Zhang J, Zhang K, Gao Z, et al. Agonist-bound structure of the human P2Y12 receptor.
Nature. 2014;509(7498):119-122.
196. Zhang L, Yang S, Huang Y. Evidence for disaggregation of oligomeric Go induced by
guanosine-5"-3-O-(thio)triphosphate activation. Biochemistry (Moscow). 2005;68(1):121-128.