old mutual savings and investment report · old mutual savings and investment report do great...
TRANSCRIPT

1
OLD MUTUAL SAVINGS AND INVESTMENT REPORT
DO GREAT THINGS EVERY DAY
2
TABLE OF CONTENTS1. Recap of Findings (from Measure 13 July 2018) 1
2. Main Findings from this Measure 14 2
3. Sampling and Methodology 4
4. Household Composition, Dependents, Single Motherhood, and Questions of Co-Dependency 95. Sandwich generation and Expectations of Supporting Family 15
5.1 Sandwich generation 15
5.2 Expectations of supporting family 166. Perceptions of Current Financial Position 17
6.1 Satisfaction with Financial Position 17
6.2 Ability to “Get By” 19
6.3 Level of Financial Stress 20
6.4 Perceptions of Current Debt Level and Appetite for Further Debt 22
6.5 Having to Forgo Pleasure Spending 23
6.6 Making to to month end 25
6.7 Borrowing or Falling behind on Bills and Repayments 26
6.8 Changes in Household Spending Patterns and Making Ends Meet 27
6.9 Financial ‘Robustness’ and Ability to Cope With a Financial Emergency 35
7. Retrospective Views and Future Expectations 41
8. Savings Levels and Putting Money Aside 43
8.1 Savings as a % of Household Income 43
8.2 Consumer Perceptions as to Whether Saving More /Less/The Same 45
8.3 Saving for Emergencies: Where and How? 47
8.4 Savings Stocks in the Face of Retrenchment 49
9. Savings Purpose 50
9.1 Savings Objectives – What are South Africans Saving For? 50
9.2 Savings Goals & Priorities 53
10. Savings and Investment Vehicles 54
10.1. ClassificationofSavingsVehiclesUsed 54
10.2. Banked Cash Savings 54
10.3. Formal Savings Products 55
10.4. Informal Savings 60
10.5. Precautionary Savings 67
10.6. Equity Based Investments 68
10.7. Cryptocurrencies 69
11. Credit and Debt: The Other Side of the Savings Coin 71
11.1. Property Ownership and Homeloan Repayment Patterns 71
11.2. Primary Residence as a Source of Retirement Funding 74
11.3. Credit Cards and Store Cards 74
11.4. Personal Loans and other Short to Medium Term Debt 82
12. Attitudinal Dynamics 85
13. ConfidenceinFinancialDecisionMaking 90

1
1. RECAP OF MAIN FINDINGS FROM MEASURE 13 (JULY 2018)
Areminderthatthe2018fieldworktookplacesome2monthsaftertheresignationofJacobZumaaspresidentandtheappointment of President Cyril Ramaphosa. The mood and outlook of the working consumer would no doubt have been affected by this “Ramaphoria”.
Theimprovingtrendsonclaimedlevelsoffinancialstress,havingtoforgopleasurespendingandabilitytogetbycontinuedin2018,butforthosethatfeltveryfinanciallystressedthelinktodebtservicingwasevenstronger.Thatsaid,the2018resultsindicated that households were getting a better handle on their debt and had managed to pay down to more manageable levels.
Otherencouragingresults includedasignificant improvement inthepercentageofhouseholdswhoweremanagingtomake it through to month end without having to borrow from friends or dip into savings (this no doubt due to better planning as 2018 saw an increase in budgetmaking). That said, 41% of households (and 73%of <R6000households)still were still running out of funds before month end at least once in the year. 2018 saw a decrease in the percentage of households that simply skipped payments or paid bills late as a coping mechanism. This greater focus on the importance of debt management was encouraging.
Belttighteningwaseverywhereandwhilsttheresultsindicatedreduced‘cuttingout’insomecategories,wesuggestedthatthiswasbecausepeoplehadalreadycutbackasmuchastheycould,ratherthanbeinganindicationofthingseasingup.In 2019 we have tweaked how we ask these questions in order to get a read on the extent to which households have in fact alreadycutdownasmuchastheycaninspecificcategories.
2018 also saw the trend of trading down to cheaper brands strengthening further.
Attitudinally, consumerswere increasinglycautiouswith theirfinancesand thiswas reflected in their choiceof savingsvehicles,oftenoptingforbankaccountsratherthanriskierequitybasedoptions.(Thatsaid,themixedreceptiontothelikesof Bitcoin showed that many are tempted by what looks like an easy and quick option).
Whilstconsumersweresavinglessandfinancialsatisfactionlevelswerelower,theimprovedconfidenceintheSouthAfricaneconomy was encouraging.
2
2. MAIN FINDINGS FROM THIS MEASURE 14 (2109)
The 2019 results need to be viewed against a weakening economic backdrop.
SouthAfrica’sunemploymentrateincreasedto27.6percentinthefirstquarterof2019andnewsoflargescaleretrenchments*abound with more to come. In March 2019 Standard Bank announced dozens of branch closures affecting 1 200 jobs. GroupFivefiledforbankruptcyprotectionandannouncedfurtherretrenchments(onthebackoflosing1000jobsin2018).InMay2019TongaatHulett issuedS189lettersto5000employees.June2019sawSibanye-Stillwaterannounces3000retrenchments and Multichoice announced that it will retrench 2 000 employees at this call centres and walk in service centres.Theseare justsomeoftheexamples,andwhilstourSavings& InvestmentMonitorsamplefocussesonworkingpeoplethatdoesnotmeanthattheyarenotaffected.Onthecontrary,asbreadwinnerstheyareincreasinglylookedtobynon-workingfamilyforfinancialassistance,asisborneoutintheincreasing%supportingadultdependentswiththeknock-onincreaseofthosewhofindthemselvespartoftheSandwichGeneration–nowatthehighestlevelsincetheinceptionofthis study in 2009.(*BusinessInsiderSA,25June2019)
Onthepoliticalfront,muchoftheRamaphoriafeltinearly2018hasdieddown.WhilstPresidentRamaphosadeliveredhis inauguration speech to jubilant South African’s in May 2019 (with the cheaper ceremony being welcomed) subsequent cabinetappointmentsmadeitclearthatwhilstmanyofthoseaccusedofmaladministrationandcorruptionweredropped,internalpowerplaysmeantthatacompletelycleansweepwasnotpossible.Bethatasitmay,thebelttighteningevidentinthe cabinet restructure (including cutting down the number of ministries from 36 to 28) was appreciated.
Negativepublicsentimenttowardscorruption,maladministrationandsheerwastageofpublicfundscontinuestorunhigh.AstheZondocommissionofenquiryintostatecapture,togetherwithevidencefromthePICinquiryfeedbackeye-wateringaccountsofexcessandblatanttheft,sothenegativesentimentgrows.
Itisoflittlecomforttosaythatwearenotaloneinfacingbotheconomicandpoliticalchallenges.Lookingfurtherafieldtotheglobaleconomy,globaleconomicgrowthremainedsteadyat3.1percentin2018,asafiscallyinducedaccelerationintheUSAoffsetslowergrowthinsomeotherlargeeconomies.Economicactivityatthegloballevelissettoexpandatasolidpaceof3%,butthereareincreasingsignsthatgrowthmayhavepeaked.**.(**UNWorldEconomicSituation&prospectsReport2019)
Intheshorttermthesignificantriseintradetensions(inparticularasbetweentheTrumpadministrationandChina)donot bode well (for emerging economies in particular). Similarly the continued uncertainty around Brexit is not conducive to growth.
Theeffectsofclimatechangecontinuetobefeltathomeatabroad,howeverthebeaconoflightthatisteenageactivistGreta Thunberg and the audiences she is getting to sit up and listen is something to celebrate.
Lookingnowtothese2019results,wenotethecontinuedbelt-tighteningandtheextenttowhichsomehouseholdshavealready cut down as much as they can. Those categories that are most sticky or resilient to change are those that are practicallydifficult tochange (accommodationcosts, costofgetting towork)oremotionallydifficult tocut (education,assistancetodependents)orelsedeemedessentials(carinsurance,security,medicalaid).
Inordertocope,householdsareincreasinglylookingtoloansfromfamilyandfriendsorfinancialinstitutionstomakeendsmeet.

3
Despitethistrend(or inconjunctionwith it), thereareattemptstopaydowndebtquicker,especiallytrueofR40000+householdsinrelationtostoreaccountdebtandcreditcards.However,acloserlookatstorecarsandcreditcardusagepatterns reveals reliance on these to fund day to day purchases like groceries rather than this credit being reserved for purchaseoflargeticketitemsortofinanceemergencies.
Therehasbeenadecreaseinsavingforemergenciesi.e.toensureabuffer.Asaffordabilitybites,sobuffersavingsbecomea luxury. This leaves households very exposed with 38% of metro working households only having enough savings to last a month or less if their main source of income was lost.
Therearenosignificantshiftsinsavings&investmentvehiclesusedotherthanadropoffinstokvelpenetrationinR40000+households,butthisisjustbackdownto2017levelsandcontributionratestoallinformalsavingsvehicleshaveincreased.
Confidenceinfinancialdecisionmakinghasdeterioratedfurtherwithsignificantpocketsunsurewheretoturnforadvice.
Onapositivenote,claimedconfidenceintheSouthAfricaneconomyhasimprovedmarginally.Timewilltellifthatoptimismis to be rewarded.

4
3. SAMPLING AND METHODOLOGYThe Old Mutual Savings & Investment Monitor is an annual study having initially been conducted twice a year. The inaugural measurewastakenin2009andthisJuly2019measureisthe14thmeasuretodate.
Eachwavecomprisesof1000interviewsamongstworkingSouthAfricanslivinginmajormetropolitanareas,andexamineslevelsofsavingsandinvestmentaswellastheirattitudetofinancesingeneralandsavingsinparticular.
Originally(Measures1&2),thesamplewasquotacontrolledbylife-stageandthereafterbyhouseholdincome,raceandarea.This structure allowed for the inclusion of a small proportion of students and retired respondents. In Measure 3 (November 2010), inorder to removeadisproportionate race/ageskewtheprimaryquotawaschanged from life-stage toage,andstudents and retired respondents were excluded.
Quotasareimposedonhouseholdincometoensurethatsub-samplesizesaresufficientlyrobusttoallowforanalysisbyincome bracket.
Originally(Waves1&2)4broadhouseholdincomebandswereidentifiedandthesamplequotacontrolledaccordingly:• Less than R6 000• R6 000 – R19 999• R20 000 – R39 999• R40000+
FromNovember2010,5incomebracketswereusedtoallowforgreatergradation:• Less than R6 000• R6 000 – R13 999• R14 000 – R19 999• R20 000 – R39 999• R40000+
Historically, inordertoallowforanalysisatatotalmarketlevel,thedataisre-weightedtoreflectthehouseholdincomeprofileasperAMPSproportionsforemployedMetropolitanDwellers.InJuly2018,twoyearspostthedemiseofAMPSweextrapolated an appropriate household income weighting based on the average rate of change in AMPS household income weightings since the inceptionofSIM (i.e.over the last9years). In thismeasurewehavebeenguidedby theprofileofworkinghouseholdsinthe5provinceswesampleaspertheBureauofMarketResearchatUNISA(“BMR”).
The weights applied are set out below:
JULY 2011
NOV 2011
JULY 2012
NOV 2012
JULY 2013
JULY 2014
JULY 2015
JULY 2016
JULY 2017
JULY 2018
JULY 2019
AMPS 2010*
AMPS 2010*
AMPS 2011A
AMPS 2012RA
AMPS 2012RB
AMPS 2013B
AMPS 2014RA
AMPS 2015A
AMPS 2015A
EXTRA-POLATED
BMR
Less than R6 000 29% 26% 27% 25% 25% 23% 23% 22% 22% 18% 22%
R6 000 – R13 999 33% 33% 33% 31% 32% 31% 31% 28% 28% 27% 29%
R14 000 – R19 999 14% 14% 13% 15% 14% 13% 13% 14% 14% 14% 10%
R20 000 – R39 999 18% 20% 20% 20% 20% 21% 22% 22% 22% 25% 17%
R40000+ 6% 7% 7% 9% 9% 12% 12% 14% 14% 17% 22%
5
Questioning is done in relation to household rather than personal circumstances. This is because household income is amore appropriatemeasure inmany circumstances, primarilybecause amongst couples thefinancial and investmentdecisionsandholdingsareoftenjoint,especiallyinrelationtothebigdecisionssuchashomeloandebtandeducationandretirement provision.
Amongst singles, whilst personal and household income are one and the same thing amongst working singles livingalone,foryoungsinglesstilllivingwiththeirparentsthepositionisdifferent.Toasktheserespondentsaboutsavingsinthehouseholdcontextwouldbemisleading.Giventhesecomplexities,questioningaroundsavingswasadaptedsothatit isrelevanttotheindividualrespondent’slife-stage.Inotherwords,thelineofquestioningwasinrelationtoeitherpersonalorhouseholdposition,dependingonwhichismostrelevantforthatlife-stagesegment.
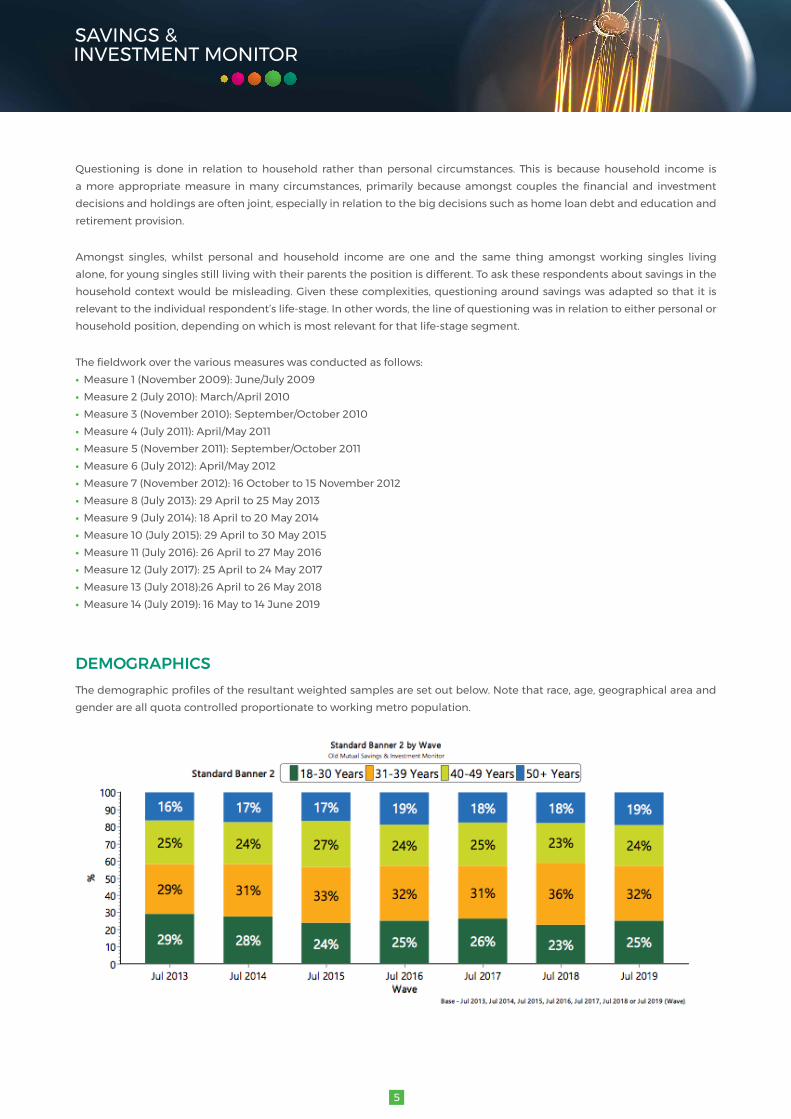
Thefieldworkoverthevariousmeasureswasconductedasfollows:• Measure1(November2009):June/July2009• Measure2(July2010):March/April2010• Measure 3 (November 2010): September/October 2010• Measure4(July2011):April/May2011• Measure 5 (November 2011): September/October 2011• Measure6(July2012):April/May2012• Measure 7 (November 2012): 16 October to 15 November 2012• Measure8(July2013):29Aprilto25May2013• Measure9(July2014):18Aprilto20May2014• Measure10(July2015):29Aprilto30May2015• Measure11(July2016):26Aprilto27May2016• Measure12(July2017):25Aprilto24May2017• Measure13(July2018):26Aprilto26May2018• Measure14(July2019):16Mayto14June2019
DEMOGRAPHICS Thedemographicprofilesoftheresultantweightedsamplesaresetoutbelow.Notethatrace,age,geographicalareaandgender are all quota controlled proportionate to working metro population.

6
The results have been analysed by the following generational groups:• GenZ(smallsample,qualitativeinterestn=13in2015and2016,n=26in2017,morerobustsamplein2018(n=52)andinthis2019measure(n=70)(theseareconsumersbornin1995andlater)
• Gen Y• Gen X• Baby Boomers

7
INCOME LEVELS
Ashasbeenthecasehistorically,thedesignoftheun-weightedsub-samplesizesdoallowforanalysisbyincomegroup:
HOUSEHOLD INCOME JUL -19 UN-WEIGHTED SAMPLE NUMBERS
JUL -19 WEIGHTED SAMPLE PROPORTIONS
Less than R6 000 207 22%
R6 000 to R13 999 205 29%
R14 000 to R19 999 195 10%
R20 000 to R39 999 201 17%
R40 000 or more 192 22%
TOTAL 1000 100%

8
Personalincomeisrecorded(butofcourseisinfluencedbythequotaonhouseholdincome)
PERSONAL INCOME JUL-13 JUL-14 JUL-15 JUL-16 JUL-17 JUL-18 JUL-19
Less than R1 000 0% 0% 0% 0% 0% 0% 0%
R1 000 to R2 999 10% 7% 6% 4% 6% 4% 4%
R3 000 to R4 999 0% 18% 21% 15% 16% 15% 15%
R5 000 to R5 999 0% 15% 14% 14% 14% 14% 17%
R6 000 to R11 999 28% 23% 25% 27% 22% 22% 21%
R12 000 to R13 999 8% 8% 8% 8% 9% 10% 8%
R14 000 to R15 999 6% 8% 6% 8% 7% 8% 9%
R16 000 to R19 999 4% 7% 6% 6% 7% 7% 6%
R20 000 to R29 999 9% 7% 10% 13% 11% 11% 10%
R30 000 to R39 999 2% 3% 3% 2% 4% 4% 4%
R40000+ 2% 4% 1% 2% 4% 6% 6%
EDUCATION LEVELMatric remains the highest education level achieved for most.
EDUCATION JUL-13 JUL-14 JUL-15 JUL-16 JUL-17 JUL-18 JUL-19
No Formal Schooling 0% 0% 0% 0% 0% 0% 0%
Some Primary School 0% 0% 0% 0% 1% 0% 0%
Finished Primary School 1% 1% 1% 1% 0% 1% 0%
Some High School 17% 17% 17% 15% 13% 16% 18%
Matric 45% 46% 45% 42% 40% 47% 42%
College 14% 12% 12% 17% 18% 15% 16%
Technical College/Technikon 13% 13% 16% 13% 17% 12% 11%
UniversityDegree 8% 7% 7% 10% 9% 8% 9%
Post Graduate Degree 1% 3% 1% 2% 2% 1% 3%

9
4. HOUSEHOLD COMPOSITION, DEPENDENTS AND QUESTIONS OF CO-DEPENDENCY
HOUSEHOLD SIZE AND COMPOSITION Ashasbeenthecaseconsistentlyoverhistoricalmeasures,averagehouseholdsizesitsatjustunder4people.
28%stillliveathomewiththeirparents,andnotunexpectedlythiscontinuestocorrelatewithbothageandincome.¬¬¬

10
Ofthosethatstill liveathome,thevastmajority(86%)havealwayslivedtherebutsome13%havemovedoutandthenmovedback,otherwiseknownasthe‘boomeranggeneration’.Atatotalsampleleveltheyonlyaccountfor4%ofworkingmetro dwellers.
EVER MOVED OUT OF PARENTS HOME
(BASE = LIVE AT HOME WITH PARENTS)
JUL-13 JUL-14 JUL-15 JUL-16 JUL-17 JUL-18 JUL-19
Always lived at home with your parents
81% 82% 82% 82% 84% 85% 86%
Movedout,butnowmovedbackinyour parents
17% 17% 16% 18% 16% 15% 13%
EVER MOVED OUT OF PARENTS HOME
(BASE = TOTAL SAMPLE)JUL-13 JUL-14 JUL-15 JUL-16 JUL-17 JUL-18 JUL-19
Always lived at home with your parents
20% 20% 21% 19% 24% 20% 24%
Movedout,butnowmovedbackinyour parents
4% 4% 4% 4% 5% 4% 4%
Lookingatthoseaged18–34years,justunderhalfstillliveathomewiththeirparents.ThispatternisfairlyconsistentacrossincomegroupsandonlystartstodropoffsignificantlyamongsthouseholdsearningR40000+.
11
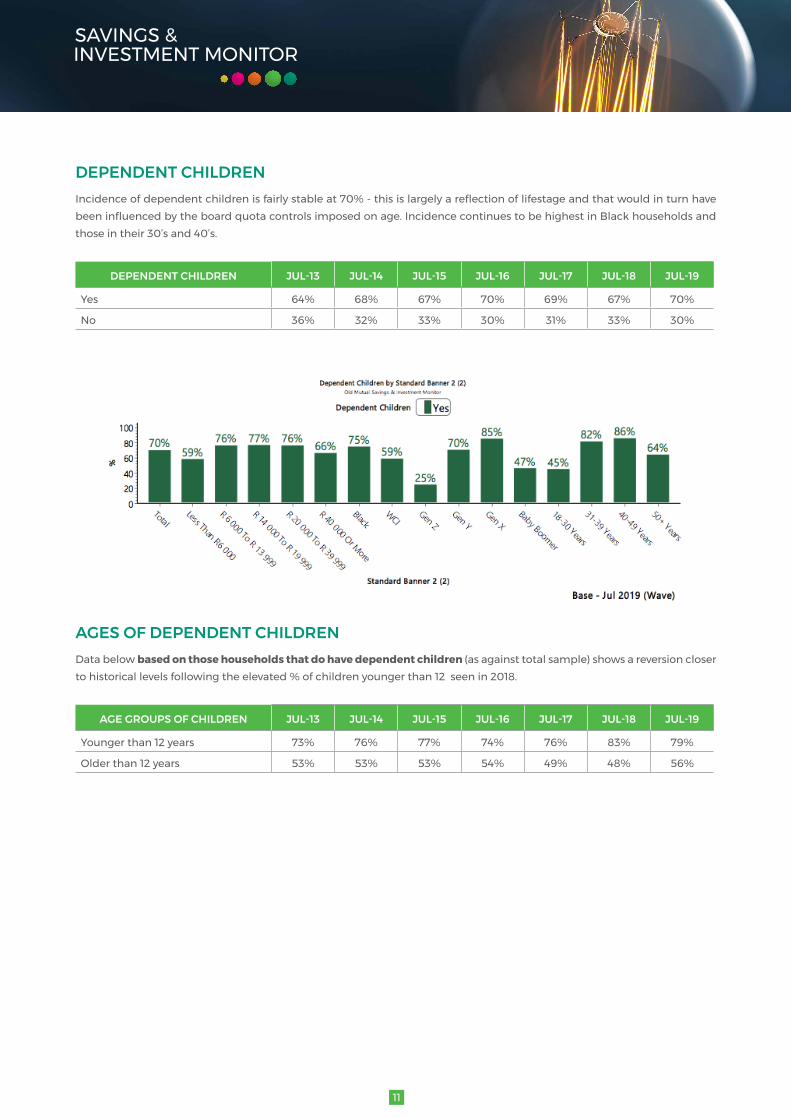
DEPENDENT CHILDRENIncidenceofdependentchildrenisfairlystableat70%-thisislargelyareflectionoflifestageandthatwouldinturnhavebeeninfluencedbytheboardquotacontrolsimposedonage.IncidencecontinuestobehighestinBlackhouseholdsandthose in their 30’s and 40’s.
DEPENDENT CHILDREN JUL-13 JUL-14 JUL-15 JUL-16 JUL-17 JUL-18 JUL-19
Yes 64% 68% 67% 70% 69% 67% 70%
No 36% 32% 33% 30% 31% 33% 30%
AGES OF DEPENDENT CHILDRENData below based on those households that do have dependent children (as against total sample) shows a reversion closer to historical levels following the elevated % of children younger than 12 seen in 2018.
AGE GROUPS OF CHILDREN JUL-13 JUL-14 JUL-15 JUL-16 JUL-17 JUL-18 JUL-19
Younger than 12 years 73% 76% 77% 74% 76% 83% 79%
Older than 12 years 53% 53% 53% 54% 49% 48% 56%

12
SINGLE MOTHERHOOD AND FINANCIAL SUPPORT BY FATHERSFollowingasmalldeclinein2018,theproportionofmotherswhoconsiderthemselvessinglemothershasrisento54%andonceagainweseethestronginversecorrelationwith incomei.e.thepoorerthehousehold,thehigherthe incidenceof‘single motherhood’.
However the increase in single motherhood is driven primarily by increases amongst higher earning and WCI households (increaseisevidentacrossallthreeracegroups:White,ColouredandIndian).Onlytimewilltellifthisisthestartofatrend.

13
Intermsofpaternalsupport,the2019resultsshowanimprovement,with20%ofthosewhoconsiderthemselvessinglemothers receiving regular support from the father of the child/children.
Lookingatthis“improvement”morecloselyweseethatitisdrivennotonlybythechangeinsinglemotherprofileseenin2019(moreWCI,higherincomehouseholds),butalsobyimprovedsupportpaymentswithinthesegroups.
OTHER DEPENDENTS (OTHER THAN CHILDREN)2019seesasignificantincreaseinadultdependents.Thisincreaseisevidentacrossincome,raceandagebutismostmarkedWCI,lessthanR6000andR20000–R39999.
OTHER DEPENDENTS JUL-13 JUL-14 JUL-15 JUL-16 JUL-17 JUL-18 JUL-19
Yes 30% 31% 33% 38% 36% 36% 44%
No 70% 69% 67% 62% 64% 64% 56%

14
The increase in adult dependents is driven by an increase in dependent parents with over 1 in 4 The next most prevalent group of dependents is siblings.
RELATIONSHIP OF ADULT DEPENDENTS TO YOU JUL-13 JUL-14 JUL-15 JUL-16 JUL-17 JUL-18 JUL-19
Mother/Father/Parents 20% 20% 23% 26% 26% 21% 27%
Brother/Sister/Sibling 5% 10% 12% 13% 11% 13% 15%
Niece/Nephew 1% 2% 2% 2% 2% 5% 4%
Grandparents 1% 2% 2% 2% 2% 2% 3%
Other Related Family 2% 1% 1% 2% 2% 2% 3%
Cousins 0% 0% 1% 1% 1% 0% 2%
Aunt/Uncle 0% 0% 1% 1% 1% 1% 1%
Other (Not Related) 1% 0% 0% 1% 0% 0% 0%

15
5. SANDWICH GENERATION AND EXPECTATIONS OF SUPPORTING FAMILY
5.1 SANDWICH GENERATIONThe term ‘Sandwich Generation’ has been coined to describe those who are supporting not only children but also parents and/orotherolderdependents.Thishasincreasedsignificantlyandhasincreasedto34%in2019.Thisisthehighest level recorded since the inception of The Old Mutual Savings & Investment Monitor and accounts for a third of the sample.
TheproportionallyhigherincidenceamongstBlackhouseholdsisagainworthnoting,asistheincreaseinWCIsandwichgeneration (up from 8% in 2018 to 17% in 2019).
16
5.2 EXPECTATIONS AS REGARDS SUPPORTING (OR BEING SUPPORTED BY) FAMILY MEMBERS
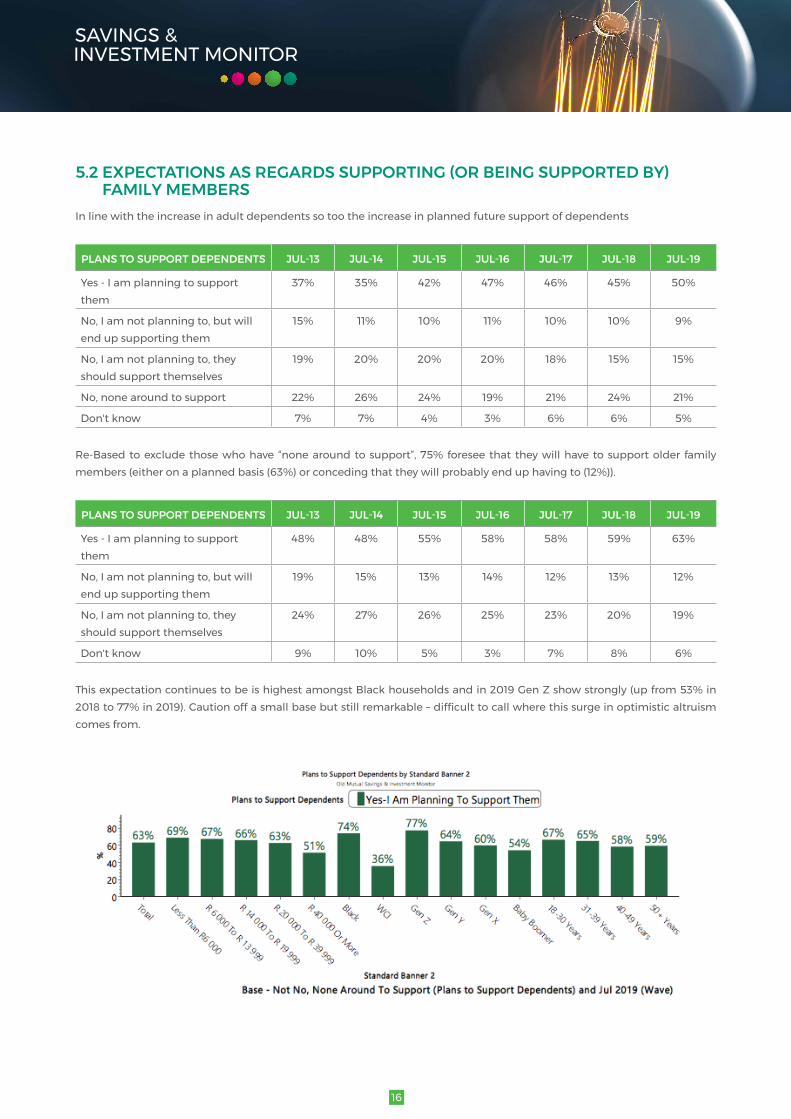
In line with the increase in adult dependents so too the increase in planned future support of dependents
PLANS TO SUPPORT DEPENDENTS JUL-13 JUL-14 JUL-15 JUL-16 JUL-17 JUL-18 JUL-19
Yes-Iamplanningtosupportthem
37% 35% 42% 47% 46% 45% 50%
No,Iamnotplanningto,butwillend up supporting them
15% 11% 10% 11% 10% 10% 9%
No,Iamnotplanningto,theyshould support themselves
19% 20% 20% 20% 18% 15% 15%
No,nonearoundtosupport 22% 26% 24% 19% 21% 24% 21%
Don't know 7% 7% 4% 3% 6% 6% 5%
Re-Basedtoexcludethosewhohave “nonearoundtosupport”,75%foreseethat theywillhave tosupportolder familymembers (either on a planned basis (63%) or conceding that they will probably end up having to (12%)).
PLANS TO SUPPORT DEPENDENTS JUL-13 JUL-14 JUL-15 JUL-16 JUL-17 JUL-18 JUL-19
Yes-Iamplanningtosupportthem
48% 48% 55% 58% 58% 59% 63%
No,Iamnotplanningto,butwillend up supporting them
19% 15% 13% 14% 12% 13% 12%
No,Iamnotplanningto,theyshould support themselves
24% 27% 26% 25% 23% 20% 19%
Don't know 9% 10% 5% 3% 7% 8% 6%
ThisexpectationcontinuestobeishighestamongstBlackhouseholdsandin2019GenZshowstrongly(upfrom53%in2018to77%in2019).Cautionoffasmallbasebutstillremarkable–difficulttocallwherethissurgeinoptimisticaltruismcomes from.

17
6. PERCEPTIONS OF CURRENT FINANCIAL POSITION
6.1 SATISFACTION WITH CURRENT FINANCIAL SITUATION Satisfactionwithcurrentfinancialsituationdownmarginallybutstillbetterthanthelowrecordedin2016.At6outof10itremains a mediocre rating.
Satisfactionlevelsremainstronglycorrelatedtoincome(thecorrelationwithageisareflectionoftheage/incomecorrelationmore than anything else)

18
Looking demographically we see that the uptick in satisfaction level seen at a total level is driven by improved sentiment in lessthanR6000householdsandGenerationZ.
SATISFACTION WITH OVERALL FINANCIAL SITUATION JUL-13 JUL-14 JUL-15 JUL-16 JUL-17 JUL-18 JUL-19
Less than R6 000 5.9 5.5 4.9 4.6 4.6 4.4 5
R6 000 to R13 999 6.4 6.3 5.8 5.3 5.8 5.6 5.9
R14 000 to R19 999 6.6 6.7 6.3 6 6.3 6 6
R20 000 to R39 999 7.2 7.1 6.7 6.3 6.7 6.4 6.5
R 40 000 or more 7.4 7.5 7.3 6.9 7.2 7.1 6.9
Black 6.7 6.5 6 5.6 5.8 5.7 6
WCI 6.2 6.5 6.1 5.8 6.5 6.1 6.1
GenZ - - 6.1 5.6 5.2 5 5.9
Gen Y 6.5 6.4 5.9 5.6 5.8 5.7 5.9
Gen X 6.6 6.5 6.1 5.8 6.4 6.1 6.1
Baby Boomer 6.6 6.6 6.3 5.8 6.3 6.5 6.6
18-30Years 6.3 6.4 5.7 5.5 5.6 5.4 5.8
31-39Years 6.5 6.5 6.1 5.6 5.9 5.8 5.9
40-49Years 6.7 6.5 6.1 5.8 6.4 6 6.1
50+Years 6.6 6.6 6.4 5.9 6.4 6.4 6.4
Lookingatgroupedscoresratherthanmeanscores(whichtendstoflattenoutthedata),thesignificantpocketsofhighlydissatisfied consumers (scoring 4 or less) becomeevident in the lower incomegroups inparticular. Albeit improved in <R6000khouseholdwhere‘’only’’39%arehighlydissatisfied,comparedto51%in2018.
19
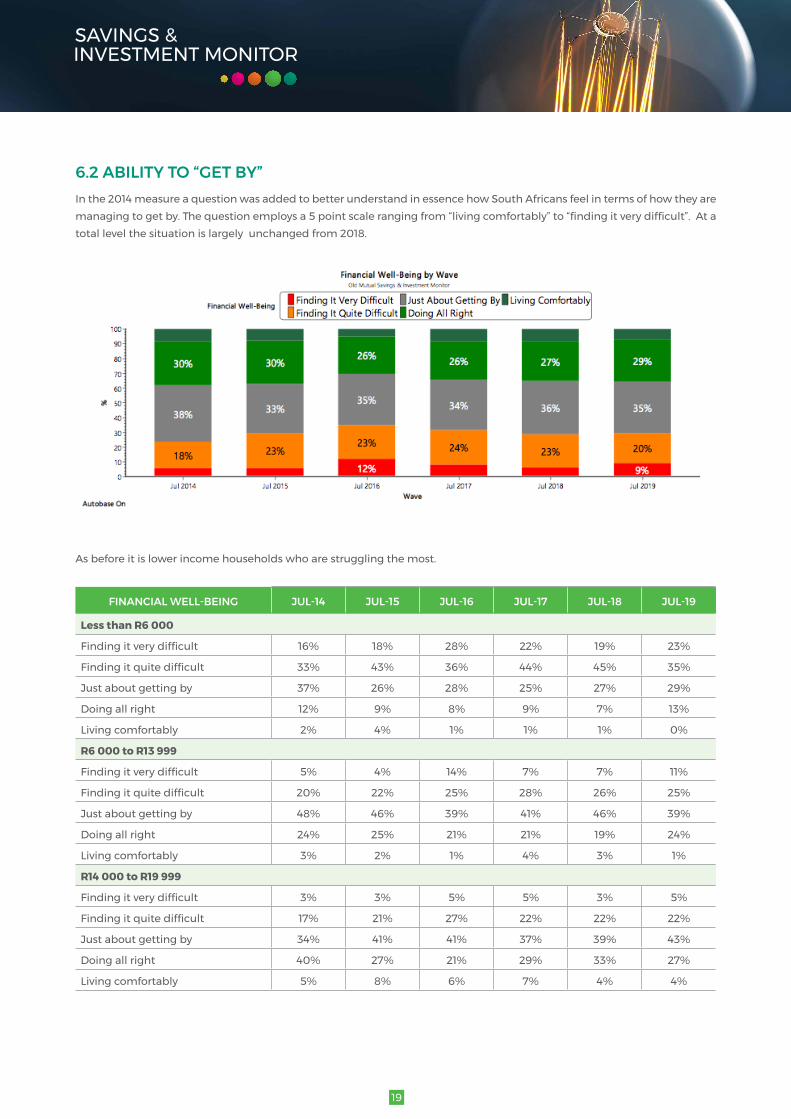
6.2 ABILITY TO “GET BY” In the 2014 measure a question was added to better understand in essence how South Africans feel in terms of how they are managingtogetby.Thequestionemploysa5pointscalerangingfrom“livingcomfortably”to“findingitverydifficult”.Atatotal level the situation is largely unchanged from 2018.
As before it is lower income households who are struggling the most.
FINANCIAL WELL-BEING JUL-14 JUL-15 JUL-16 JUL-17 JUL-18 JUL-19
Less than R6 000
Findingitverydifficult 16% 18% 28% 22% 19% 23%
Findingitquitedifficult 33% 43% 36% 44% 45% 35%
Justaboutgettingby 37% 26% 28% 25% 27% 29%
Doing all right 12% 9% 8% 9% 7% 13%
Living comfortably 2% 4% 1% 1% 1% 0%
R6 000 to R13 999
Findingitverydifficult 5% 4% 14% 7% 7% 11%
Findingitquitedifficult 20% 22% 25% 28% 26% 25%
Justaboutgettingby 48% 46% 39% 41% 46% 39%
Doing all right 24% 25% 21% 21% 19% 24%
Living comfortably 3% 2% 1% 4% 3% 1%
R14 000 to R19 999
Findingitverydifficult 3% 3% 5% 5% 3% 5%
Findingitquitedifficult 17% 21% 27% 22% 22% 22%
Justaboutgettingby 34% 41% 41% 37% 39% 43%
Doing all right 40% 27% 21% 29% 33% 27%
Living comfortably 5% 8% 6% 7% 4% 4%

20
FINANCIAL WELL-BEING JUL-14 JUL-15 JUL-16 JUL-17 JUL-18 JUL-19
R20 000 to R39 999
Findingitverydifficult 1% 1% 4% 3% 2% 4%
Findingitquitedifficult 7% 16% 16% 12% 14% 12%
Justaboutgettingby 37% 28% 36% 36% 36% 39%
Doing all right 42% 47% 38% 37% 38% 35%
Living comfortably 14% 9% 6% 12% 10% 11%
R 40 000 or more
Findingitverydifficult 2% 0% 3% 1% 0% 0%
Findingitquitedifficult 4% 4% 6% 4% 6% 5%
Justaboutgettingby 23% 15% 29% 28% 27% 28%
Doing all right 43% 52% 46% 42% 41% 47%
Living comfortably 29% 28% 16% 26% 26% 20%
6.3 LEVEL OF FINANCIAL STRESS Respondentsareaskedtodescribetheleveloffinancialstressthattheyfeeltodayona4-pointscalefrom“overwhelmingstress” to “no stress at all”. As with “ability to get by” there have been no notable changes over the year.

21
Stress levels continue to be highest in low income households.
LEVEL OF FINANCIAL STRESS JUL-16 JUL-17 JUL-18 JUL-19
Less than R6 000
I feel overwhelming stress 31% 22% 17% 18%
High stress 49% 54% 54% 45%
Low stress 20% 19% 25% 32%
No stress at all 0% 5% 4% 5%
R6 000 to R13 999
I feel overwhelming stress 18% 8% 5% 7%
High stress 47% 47% 43% 44%
Low stress 30% 37% 44% 38%
No stress at all 5% 8% 8% 11%
R14 000 to R19 999
I feel overwhelming stress 11% 5% 3% 5%
High stress 50% 37% 37% 38%
Low stress 35% 46% 47% 45%
No stress at all 4% 12% 13% 11%
R20 000 to R39 999
I feel overwhelming stress 12% 4% 3% 3%
High stress 45% 28% 28% 33%
Low stress 37% 51% 53% 54%
No stress at all 6% 18% 16% 10%
R40 000 or more
I feel overwhelming stress 5% 0% 2% 0%
High stress 33% 28% 18% 27%
Low stress 47% 45% 56% 57%
No stress at all 16% 27% 24% 16%
Debtlevelsandfinancialstresscontinuetobecloselylinkedandthelinkisevenstrongerin2019,with70%(vs.67%in2018,64% in 2017 and 52% in 2016) of those who describe their stress levels as “overwhelming” admitting to having too much debt and having trouble managing it (compared to none of those who describe their stress levels as low).
FEELINGS ABOUT DEBT LEVEL 2019 TOTAL
I FEEL OVERWHELMING
STRESSHIGH STRESS LOW STRESS NO STRESS
AT ALL
I could take on more debt and stillmanagemyfinanceswell
7% 0% 3% 8% 26%
I can manage my current debt well
74% 30% 64% 89% 74%
I have too much debt and am having trouble managing it
19% 70% 33% 3% 0%

22
6.4 PERCEPTIONS OF CURRENT DEBT LEVEL AND APPETITE FOR FURTHER DEBTConsumers’perceptionsoftheirabilitytomanagetheirdebtremainpositive,albeitwithamarginalincreaseinthosewhoadmit to having trouble managing their debt. This self assessment is somewhat at odds with other indicators in the results e.g. around the % that fall behind on payments when they struggle to make ends meet at month end. It would seem that for many juggling payments is part and parcel of good debt management.
Lowincomehouseholdsstrugglethemost,butthemarkedimprovementseenin2019hasbeenmaintainedin2019(atleastin terms of how they feel about their debt).
FEELINGS ABOUT DEBT LEVEL JUL-15 JUL-16 JUL-17 JUL-18 JUL-19
Less than R6 000
I could take on more debt and still managemyfinanceswell
1% 1% 5% 5% 0%
I can manage my current debt well 76% 67% 53% 70% 69%
I have too much debt and am having trouble managing it
23% 31% 40% 24% 31%
R6 000 to R13 999
I could take on more debt and still managemyfinanceswell
10% 5% 7% 7% 6%
I can manage my current debt well 71% 68% 72% 76% 72%
I have too much debt and am having trouble managing it
17% 27% 21% 18% 22%
R14 000 to R19 999
I could take on more debt and still managemyfinanceswell
8% 5% 12% 7% 7%
I can manage my current debt well 74% 66% 71% 78% 75%
I have too much debt and am having trouble managing it
17% 29% 17% 15% 18%
23
FEELINGS ABOUT DEBT LEVEL JUL-15 JUL-16 JUL-17 JUL-18 JUL-19
R20 000 to R39 999
I could take on more debt and still managemyfinanceswell
17% 11% 10% 10% 7%
I can manage my current debt well 68% 68% 76% 75% 78%
I have too much debt and am having trouble managing it
14% 21% 15% 15% 16%
R40 000 or more
I could take on more debt and still managemyfinanceswell
26% 13% 21% 18% 17%
I can manage my current debt well 68% 76% 72% 76% 78%
I have too much debt and am having trouble managing it
5% 11% 6% 6% 5%
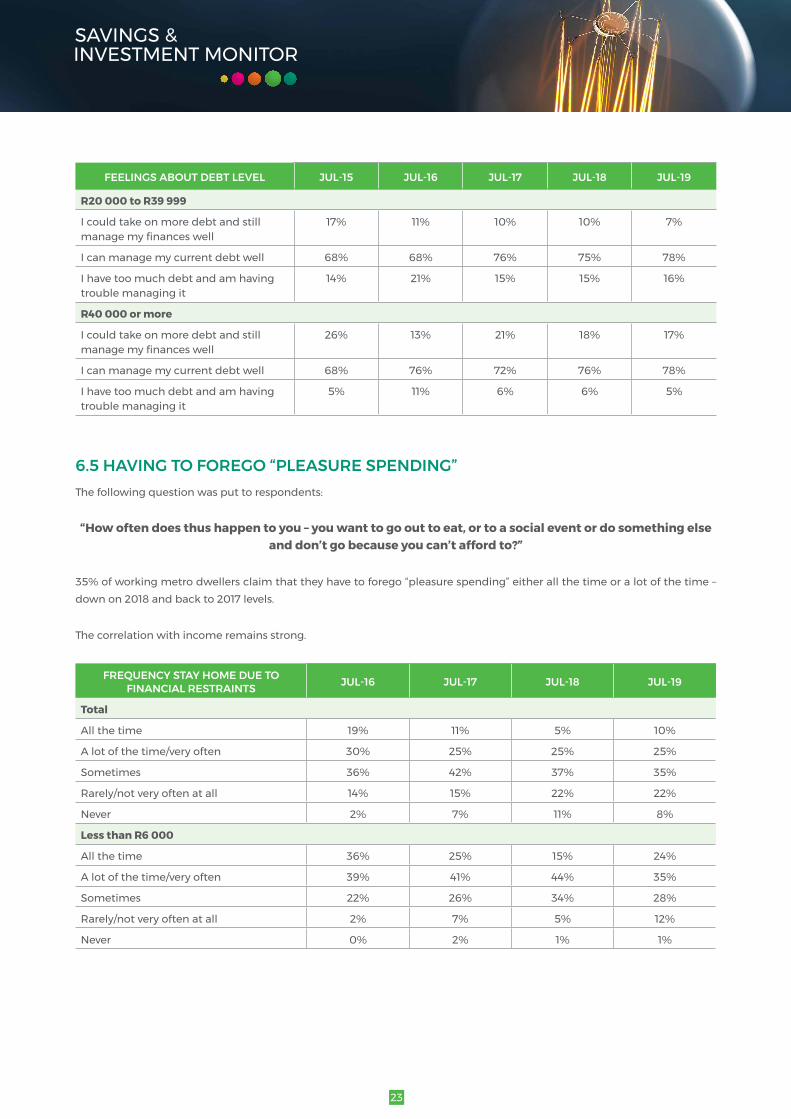
6.5 HAVING TO FOREGO “PLEASURE SPENDING” The following question was put to respondents:
“How often does thus happen to you – you want to go out to eat, or to a social event or do something else and don’t go because you can’t afford to?”
35% of working metro dwellers claim that they have to forego “pleasure spending” either all the time or a lot of the time – down on 2018 and back to 2017 levels.
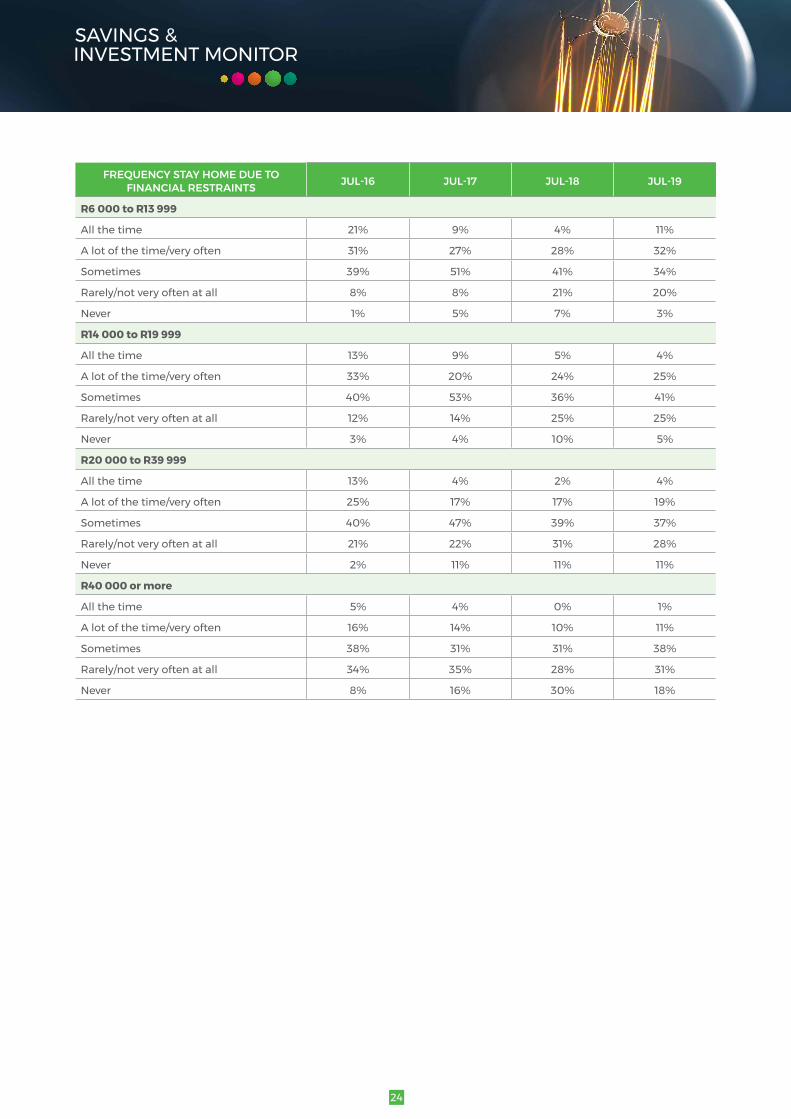
The correlation with income remains strong.
FREQUENCY STAY HOME DUE TO FINANCIAL RESTRAINTS JUL-16 JUL-17 JUL-18 JUL-19
Total
All the time 19% 11% 5% 10%
A lot of the time/very often 30% 25% 25% 25%
Sometimes 36% 42% 37% 35%
Rarely/not very often at all 14% 15% 22% 22%
Never 2% 7% 11% 8%
Less than R6 000
All the time 36% 25% 15% 24%
A lot of the time/very often 39% 41% 44% 35%
Sometimes 22% 26% 34% 28%
Rarely/not very often at all 2% 7% 5% 12%
Never 0% 2% 1% 1%
24
FREQUENCY STAY HOME DUE TO FINANCIAL RESTRAINTS JUL-16 JUL-17 JUL-18 JUL-19
R6 000 to R13 999
All the time 21% 9% 4% 11%
A lot of the time/very often 31% 27% 28% 32%
Sometimes 39% 51% 41% 34%
Rarely/not very often at all 8% 8% 21% 20%
Never 1% 5% 7% 3%
R14 000 to R19 999
All the time 13% 9% 5% 4%
A lot of the time/very often 33% 20% 24% 25%
Sometimes 40% 53% 36% 41%
Rarely/not very often at all 12% 14% 25% 25%
Never 3% 4% 10% 5%
R20 000 to R39 999
All the time 13% 4% 2% 4%
A lot of the time/very often 25% 17% 17% 19%
Sometimes 40% 47% 39% 37%
Rarely/not very often at all 21% 22% 31% 28%
Never 2% 11% 11% 11%
R40 000 or more
All the time 5% 4% 0% 1%
A lot of the time/very often 16% 14% 10% 11%
Sometimes 38% 31% 31% 38%
Rarely/not very often at all 34% 35% 28% 31%
Never 8% 16% 30% 18%
25
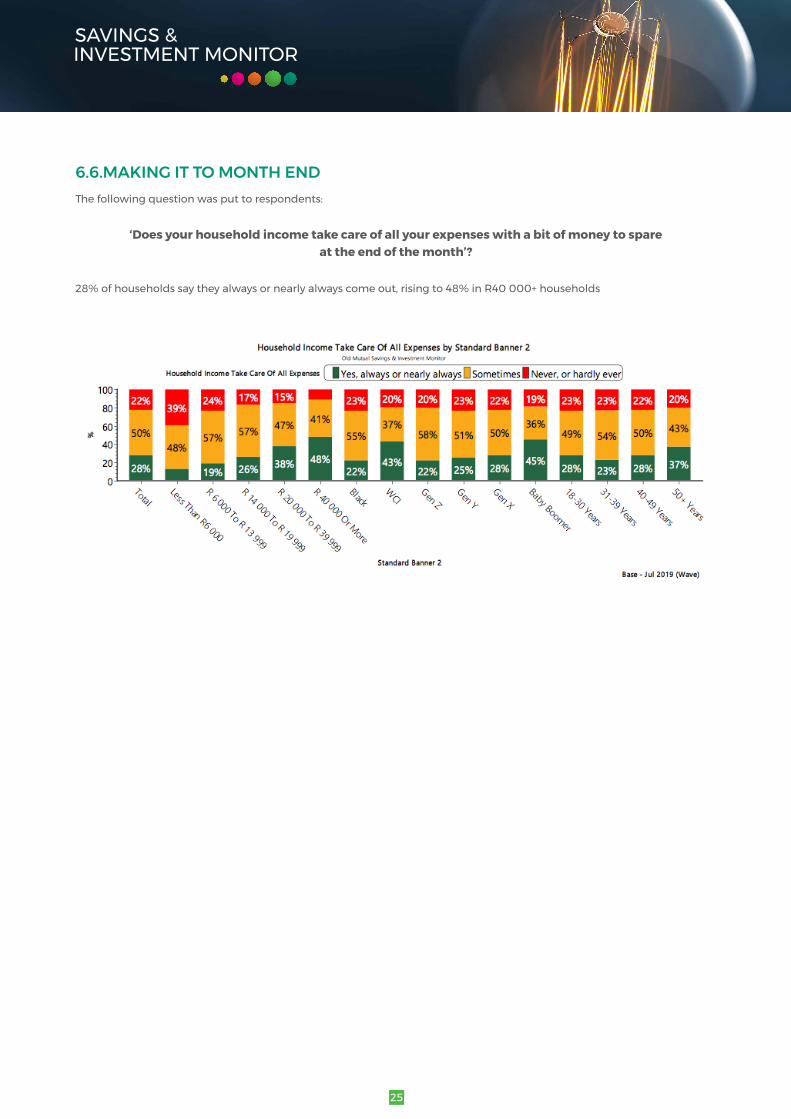
6.6.MAKING IT TO MONTH END The following question was put to respondents:
‘Doesyourhouseholdincometakecareofallyourexpenseswithabitofmoneytospare at the end of the month’?
28%ofhouseholdssaytheyalwaysornearlyalwayscomeout,risingto48%inR40000+households
26
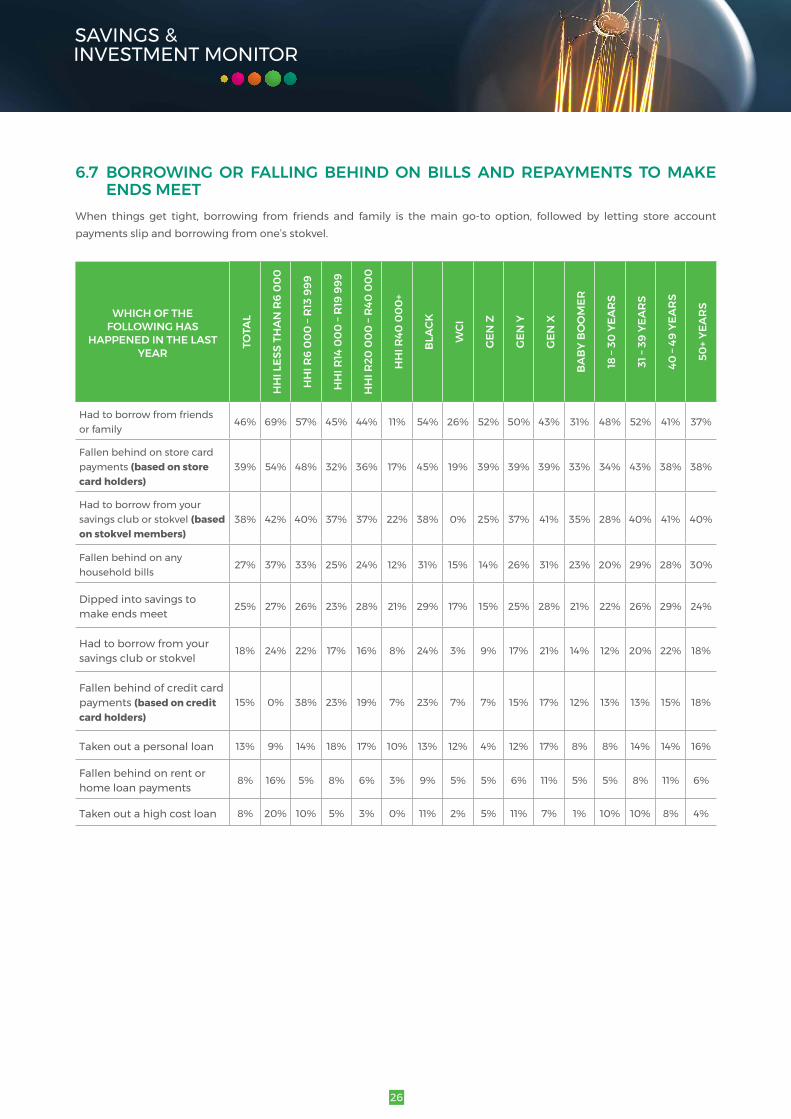
6.7 BORROWING OR FALLING BEHIND ON BILLS AND REPAYMENTS TO MAKE ENDS MEET
When things get tight, borrowing from friends and family is themain go-to option, followed by letting store accountpayments slip and borrowing from one’s stokvel.
WHICH OF THE FOLLOWING HAS
HAPPENED IN THE LAST YEAR
TOTA
L
HH
I LES
S TH
AN
R6
00
0
HH
I R6
00
0 –
R13
999
HH
I R14
00
0 –
R19
999
HH
I R20
00
0 –
R40
00
0
HH
I R40
00
0+
BLA
CK
WCI
GEN
Z
GEN
Y
GEN
X
BA
BY
BO
OM
ER
18 –
30 Y
EAR
S
31 –
39 Y
EAR
S
40 –
49 Y
EAR
S
50+
YEA
RS
Had to borrow from friends or family
46% 69% 57% 45% 44% 11% 54% 26% 52% 50% 43% 31% 48% 52% 41% 37%
Fallen behind on store card payments (based on store card holders)
39% 54% 48% 32% 36% 17% 45% 19% 39% 39% 39% 33% 34% 43% 38% 38%
Had to borrow from your savings club or stokvel (based onstokvelmembers)
38% 42% 40% 37% 37% 22% 38% 0% 25% 37% 41% 35% 28% 40% 41% 40%
Fallen behind on any household bills
27% 37% 33% 25% 24% 12% 31% 15% 14% 26% 31% 23% 20% 29% 28% 30%
Dipped into savings to make ends meet
25% 27% 26% 23% 28% 21% 29% 17% 15% 25% 28% 21% 22% 26% 29% 24%
Had to borrow from your savings club or stokvel
18% 24% 22% 17% 16% 8% 24% 3% 9% 17% 21% 14% 12% 20% 22% 18%
Fallen behind of credit card payments (based on credit card holders)
15% 0% 38% 23% 19% 7% 23% 7% 7% 15% 17% 12% 13% 13% 15% 18%
Taken out a personal loan 13% 9% 14% 18% 17% 10% 13% 12% 4% 12% 17% 8% 8% 14% 14% 16%
Fallen behind on rent or home loan payments
8% 16% 5% 8% 6% 3% 9% 5% 5% 6% 11% 5% 5% 8% 11% 6%
Taken out a high cost loan 8% 20% 10% 5% 3% 0% 11% 2% 5% 11% 7% 1% 10% 10% 8% 4%

27
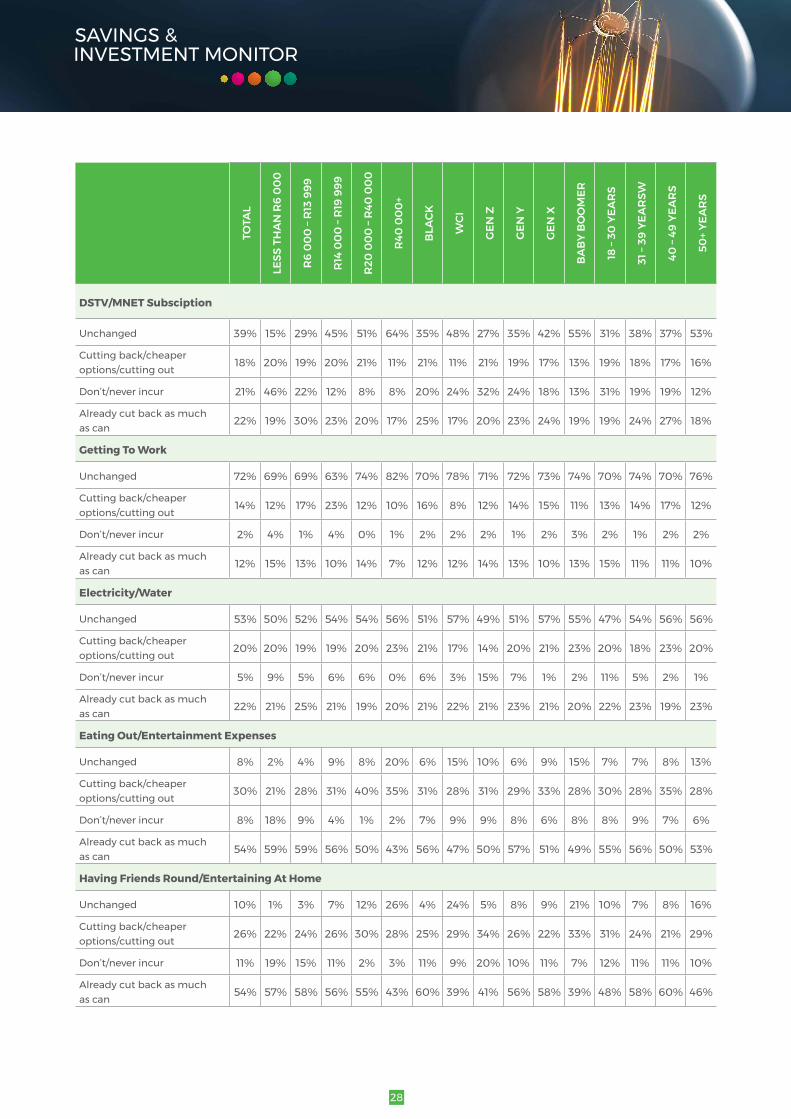
6.8 CHANGES IN HOUSEHOLD SPENDING PATTERNS AND MAKINGS ENDS MEET2018sawdecreaseintheextenttowhichpeoplearecuttingbackincertaincategories,notablyshoesandclothing,alcoholand cigarettes as well as travel and holidays. We suggested then that this may be because people have alreadycutbackasmuch as they can,ratherthanbeinganindicationofthingseasingup.
So,in2019wechangedthewaythequestionwasaskedandgavehouseholds4(asagainst3)optionstocategorisetheirspending in a particular category:
1 = Never spent on this or no longer spend on this
2=Alreadycutbackasmuchascan,sounchangedoverthelastyear
3=Activelycuttingbackorusingcheaperoptionsorcuttingbackfurther
4 = Unchanged, same as always
The detailed responses are tabulated below.
TOTA
L
LESS
TH
AN
R6
00
0
R6
00
0 –
R13
999
R14
00
0 –
R19
999
R20
00
0 –
R40
00
0
R40
00
0+
BLA
CK
WCI
GEN
Z
GEN
Y
GEN
X
BA
BY
BO
OM
ER
18 –
30 Y
EAR
S
31 –
39 Y
EAR
SW
40 –
49 Y
EAR
S
50+
YEA
RS
Food & Groceries
Unchanged 29% 18% 25% 34% 36% 39% 28% 32% 23% 27% 32% 35% 25% 27% 31% 34%
Cutting back/cheaper options/cutting out
46% 55% 45% 38% 42% 42% 47% 41% 46% 50% 41% 38% 50% 49% 42% 38%
Don’t/never incur 0% 0% 0% 2% 2% 0% 0% 1% 2% 0% 0% 1% 1% 0% 0% 1%
Already cut back as much as can
25% 27% 30% 26% 21% 19% 24% 26% 29% 23% 27% 26% 23% 23% 27% 27%
Alcoholic Beverages
Unchanged 11% 5% 7% 8% 10% 26% 7% 23% 11% 10% 10% 21% 9% 11% 11% 15%
Cutting back/cheaper options/cutting out
20% 18% 24% 19% 20% 15% 22% 15% 22% 23% 15% 21% 21% 24% 13% 19%
Don’t/never incur 35% 43% 35% 37% 30% 29% 38% 27% 33% 26% 46% 40% 23% 30% 47% 42%
Already cut back as much as can
34% 34% 34% 36% 40% 30% 34% 36% 35% 42% 29% 18% 46% 35% 29% 24%
Cigarettes
Unchanged 8% 9% 5% 8% 11% 11% 6% 14% 7% 8% 8% 12% 8% 8% 7% 11%
Cutting back/cheaper options/cutting out
9% 7% 12% 10% 10% 7% 9% 11% 5% 11% 9% 5% 9% 11% 7% 9%
Don’t/never incur 65% 66% 66% 59% 59% 69% 71% 50% 61% 63% 67% 69% 61% 63% 68% 68%
Already cut back as much as can
18% 19% 17% 22% 20% 14% 15% 25% 27% 18% 16% 14% 21% 19% 17% 12%
28
TOTA
L
LESS
TH
AN
R6
00
0
R6
00
0 –
R13
999
R14
00
0 –
R19
999
R20
00
0 –
R40
00
0
R40
00
0+
BLA
CK
WCI
GEN
Z
GEN
Y
GEN
X
BA
BY
BO
OM
ER
18 –
30 Y
EAR
S
31 –
39 Y
EAR
SW
40 –
49 Y
EAR
S
50+
YEA
RS
DSTV/MNET Subsciption
Unchanged 39% 15% 29% 45% 51% 64% 35% 48% 27% 35% 42% 55% 31% 38% 37% 53%
Cutting back/cheaper options/cutting out
18% 20% 19% 20% 21% 11% 21% 11% 21% 19% 17% 13% 19% 18% 17% 16%
Don’t/never incur 21% 46% 22% 12% 8% 8% 20% 24% 32% 24% 18% 13% 31% 19% 19% 12%
Already cut back as much as can
22% 19% 30% 23% 20% 17% 25% 17% 20% 23% 24% 19% 19% 24% 27% 18%
GettingToWork
Unchanged 72% 69% 69% 63% 74% 82% 70% 78% 71% 72% 73% 74% 70% 74% 70% 76%
Cutting back/cheaper options/cutting out
14% 12% 17% 23% 12% 10% 16% 8% 12% 14% 15% 11% 13% 14% 17% 12%
Don’t/never incur 2% 4% 1% 4% 0% 1% 2% 2% 2% 1% 2% 3% 2% 1% 2% 2%
Already cut back as much as can
12% 15% 13% 10% 14% 7% 12% 12% 14% 13% 10% 13% 15% 11% 11% 10%
Electricity/Water
Unchanged 53% 50% 52% 54% 54% 56% 51% 57% 49% 51% 57% 55% 47% 54% 56% 56%
Cutting back/cheaper options/cutting out
20% 20% 19% 19% 20% 23% 21% 17% 14% 20% 21% 23% 20% 18% 23% 20%
Don’t/never incur 5% 9% 5% 6% 6% 0% 6% 3% 15% 7% 1% 2% 11% 5% 2% 1%
Already cut back as much as can
22% 21% 25% 21% 19% 20% 21% 22% 21% 23% 21% 20% 22% 23% 19% 23%
Eating Out/Entertainment Expenses
Unchanged 8% 2% 4% 9% 8% 20% 6% 15% 10% 6% 9% 15% 7% 7% 8% 13%
Cutting back/cheaper options/cutting out
30% 21% 28% 31% 40% 35% 31% 28% 31% 29% 33% 28% 30% 28% 35% 28%
Don’t/never incur 8% 18% 9% 4% 1% 2% 7% 9% 9% 8% 6% 8% 8% 9% 7% 6%
Already cut back as much as can
54% 59% 59% 56% 50% 43% 56% 47% 50% 57% 51% 49% 55% 56% 50% 53%
Having Friends Round/Entertaining At Home
Unchanged 10% 1% 3% 7% 12% 26% 4% 24% 5% 8% 9% 21% 10% 7% 8% 16%
Cutting back/cheaper options/cutting out
26% 22% 24% 26% 30% 28% 25% 29% 34% 26% 22% 33% 31% 24% 21% 29%
Don’t/never incur 11% 19% 15% 11% 2% 3% 11% 9% 20% 10% 11% 7% 12% 11% 11% 10%
Already cut back as much as can
54% 57% 58% 56% 55% 43% 60% 39% 41% 56% 58% 39% 48% 58% 60% 46%

29
TOTA
L
LESS
TH
AN
R6
00
0
R6
00
0 –
R13
999
R14
00
0 –
R19
999
R20
00
0 –
R40
00
0
R40
00
0+
BLA
CK
WCI
GEN
Z
GEN
Y
GEN
X
BA
BY
BO
OM
ER
18 –
30 Y
EAR
S
31 –
39 Y
EAR
SW
40 –
49 Y
EAR
S
50+
YEA
RS
Children’s Schooling/Education
Unchanged 53% 42% 59% 60% 56% 52% 58% 41% 16% 54% 65% 33% 32% 66% 67% 44%
Cutting back/cheaper options/cutting out
8% 10% 8% 8% 7% 8% 9% 6% 2% 10% 9% 2% 6% 11% 10% 5%
Don’t/never incur 32% 42% 25% 26% 30% 35% 27% 46% 76% 30% 18% 60% 57% 17% 16% 44%
Already cut back as much as can
6% 6% 8% 6% 7% 5% 6% 8% 6% 6% 8% 5% 5% 7% 7% 7%
Shoes & Clothing
Unchanged 18% 12% 17% 19% 22% 24% 17% 22% 16% 18% 19% 20% 14% 20% 17% 23%
Cutting back/cheaper options/cutting out
42% 35% 40% 42% 46% 48% 43% 38% 38% 39% 45% 45% 36% 41% 49% 41%
Don’t/never incur 2% 3% 1% 3% 1% 1% 2% 1% 2% 3% 0% 1% 3% 2% 0% 1%
Already cut back as much as can
38% 50% 43% 35% 32% 27% 38% 39% 43% 41% 35% 35% 47% 37% 34% 35%
Armed Response/Alarms
Unchanged 14% 1% 4% 5% 13% 45% 6% 36% 6% 11% 15% 32% 10% 11% 16% 23%
Cutting back/cheaper options/cutting out
1% 0% 1% 3% 2% 2% 1% 3% 0% 1% 2% 0% 1% 1% 3% 1%
Don’t/never incur 81% 98% 95% 90% 80% 44% 91% 55% 93% 85% 79% 62% 87% 84% 78% 72%
Already cut back as much as can
3% 0% 0% 2% 5% 9% 2% 6% 1% 3% 3% 7% 2% 3% 4% 5%
Accommodation
Unchanged 56% 45% 53% 54% 55% 73% 52% 68% 48% 53% 62% 56% 54% 52% 63% 57%
Cutting back/cheaper options/cutting out
5% 9% 4% 10% 4% 1% 6% 2% 5% 5% 6% 2% 5% 5% 8% 3%
Don’t/never incur 29% 35% 35% 25% 30% 18% 32% 22% 36% 31% 24% 36% 31% 32% 21% 34%
Already cut back as much as can
9% 11% 8% 12% 11% 7% 10% 8% 11% 11% 8% 6% 10% 11% 9% 6%
Hair/Beauty
Unchanged 22% 12% 18% 21% 26% 36% 18% 32% 22% 19% 24% 33% 22% 18% 21% 31%
Cutting back/cheaper options/cutting out
23% 20% 20% 22% 28% 29% 23% 24% 22% 22% 25% 24% 21% 23% 27% 24%
Don’t/never incur 20% 24% 24% 24% 19% 10% 23% 14% 22% 23% 17% 19% 23% 23% 15% 18%
Already cut back as much as can
34% 45% 38% 33% 27% 24% 36% 30% 34% 36% 34% 24% 34% 36% 37% 27%

30
TOTA
L
LESS
TH
AN
R6
00
0
R6
00
0 –
R13
999
R14
00
0 –
R19
999
R20
00
0 –
R40
00
0
R40
00
0+
BLA
CK
WCI
GEN
Z
GEN
Y
GEN
X
BA
BY
BO
OM
ER
18 –
30 Y
EAR
S
31 –
39 Y
EAR
SW
40 –
49 Y
EAR
S
50+
YEA
RS
DomesticWorker/Gardener
Unchanged 10% 0% 3% 2% 9% 33% 4% 25% 4% 8% 9% 24% 9% 7% 10% 15%
Cutting back/cheaper options/cutting out
3% 0% 2% 4% 4% 7% 3% 5% 0% 2% 3% 8% 2% 2% 5% 5%
Don’t/never incur 79% 98% 93% 88% 73% 44% 89% 55% 93% 83% 79% 55% 84% 85% 76% 68%
Already cut back as much as can
8% 1% 3% 6% 14% 16% 5% 15% 3% 6% 9% 13% 6% 6% 9% 11%
Assistance/Payments To Children/Dependent
Unchanged 31% 31% 28% 33% 35% 32% 34% 23% 23% 32% 33% 25% 32% 30% 33% 30%
Cutting back/cheaper options/cutting out
9% 10% 11% 8% 9% 7% 10% 6% 8% 9% 8% 14% 7% 10% 9% 11%
Don’t/never incur 50% 49% 48% 50% 48% 56% 44% 67% 65% 49% 49% 53% 54% 50% 48% 50%
Already cut back as much as can
9% 11% 13% 9% 8% 5% 11% 4% 5% 10% 10% 7% 7% 10% 11% 9%
Medical Aid
Unchanged 34% 1% 14% 32% 58% 74% 25% 57% 11% 28% 40% 51% 24% 29% 39% 47%
Cutting back/cheaper options/cutting out
4% 0% 6% 5% 4% 6% 5% 3% 0% 3% 7% 5% 1% 3% 6% 7%
Don’t/never incur 60% 99% 78% 60% 34% 16% 69% 36% 89% 67% 51% 38% 73% 66% 52% 43%
Already cut back as much as can
2% 0% 2% 2% 3% 4% 2% 4% 0% 2% 2% 6% 2% 1% 3% 3%
Car And/Or Household Insurance
Unchanged 27% 0% 7% 19% 48% 69% 17% 52% 4% 23% 33% 47% 16% 25% 33% 40%
Cutting back/cheaper options/cutting out
4% 0% 3% 7% 8% 5% 3% 6% 1% 4% 6% 3% 1% 5% 7% 3%
Don’t/never incur 63% 98% 86% 68% 37% 15% 74% 32% 91% 69% 55% 44% 77% 65% 54% 50%
Already cut back as much as can
6% 1% 4% 6% 7% 12% 5% 9% 5% 5% 7% 6% 6% 5% 7% 7%
Holiday And Travel
Unchanged 7% 1% 2% 4% 6% 22% 3% 18% 3% 5% 6% 24% 5% 4% 7% 16%
Cutting back/cheaper options/cutting out
16% 10% 12% 11% 20% 28% 15% 20% 19% 14% 20% 14% 15% 14% 22% 16%
Don’t/never incur 41% 68% 54% 41% 26% 10% 49% 21% 59% 46% 35% 30% 45% 49% 32% 34%
Already cut back as much as can
35% 21% 31% 44% 47% 41% 33% 41% 19% 35% 38% 32% 34% 33% 39% 34%
31
TOTA
L
LESS
TH
AN
R6
00
0
R6
00
0 –
R13
999
R14
00
0 –
R19
999
R20
00
0 –
R40
00
0
R40
00
0+
BLA
CK
WCI
GEN
Z
GEN
Y
GEN
X
BA
BY
BO
OM
ER
18 –
30 Y
EAR
S
31 –
39 Y
EAR
SW
40 –
49 Y
EAR
S
50+
YEA
RS
Cellphone/Airtime/Data Costs
Unchanged 27% 15% 18% 26% 33% 47% 23% 38% 30% 25% 26% 40% 27% 24% 25% 34%
Cutting back/cheaper options/cutting out
34% 34% 41% 36% 31% 28% 38% 25% 32% 35% 36% 27% 34% 33% 39% 30%
Don’t/never incur 0% 0% 0% 1% 1% 0% 1% 0% 0% 0% 0% 1% 0% 0% 0% 1%
Already cut back as much as can
38% 50% 41% 37% 36% 25% 39% 37% 38% 40% 38% 32% 38% 42% 35% 35%
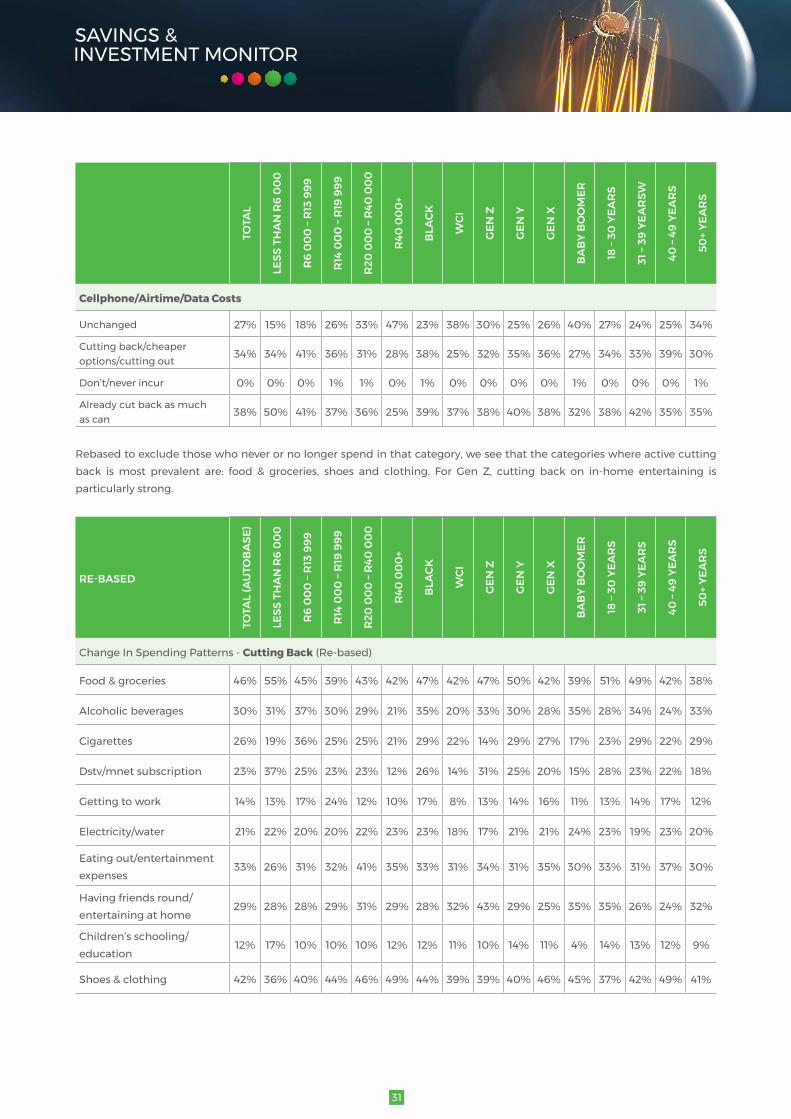
Rebasedtoexcludethosewhoneverornolongerspendinthatcategory,weseethatthecategorieswhereactivecuttingback ismost prevalent are: food & groceries, shoes and clothing. For Gen Z, cutting back on in-home entertaining isparticularly strong.
RE-BASED
TOTA
L (A
UTO
BA
SE)
LESS
TH
AN
R6
00
0
R6
00
0 –
R13
999
R14
00
0 –
R19
999
R20
00
0 –
R40
00
0
R40
00
0+
BLA
CK
WCI
GEN
Z
GEN
Y
GEN
X
BA
BY
BO
OM
ER
18 –
30 Y
EAR
S
31 –
39 Y
EAR
S
40 –
49 Y
EAR
S
50+
YEA
RS
ChangeInSpendingPatterns-CuttingBack(Re-based)
Food & groceries 46% 55% 45% 39% 43% 42% 47% 42% 47% 50% 42% 39% 51% 49% 42% 38%
Alcoholic beverages 30% 31% 37% 30% 29% 21% 35% 20% 33% 30% 28% 35% 28% 34% 24% 33%
Cigarettes 26% 19% 36% 25% 25% 21% 29% 22% 14% 29% 27% 17% 23% 29% 22% 29%
Dstv/mnet subscription 23% 37% 25% 23% 23% 12% 26% 14% 31% 25% 20% 15% 28% 23% 22% 18%
Getting to work 14% 13% 17% 24% 12% 10% 17% 8% 13% 14% 16% 11% 13% 14% 17% 12%
Electricity/water 21% 22% 20% 20% 22% 23% 23% 18% 17% 21% 21% 24% 23% 19% 23% 20%
Eating out/entertainment expenses
33% 26% 31% 32% 41% 35% 33% 31% 34% 31% 35% 30% 33% 31% 37% 30%
Having friends round/entertaining at home
29% 28% 28% 29% 31% 29% 28% 32% 43% 29% 25% 35% 35% 26% 24% 32%
Children’s schooling/education
12% 17% 10% 10% 10% 12% 12% 11% 10% 14% 11% 4% 14% 13% 12% 9%
Shoes & clothing 42% 36% 40% 44% 46% 49% 44% 39% 39% 40% 46% 45% 37% 42% 49% 41%

32
RE-BASED
TOTA
L (A
UTO
BA
SE)
LESS
TH
AN
R6
00
0
R6
00
0 –
R13
999
R14
00
0 –
R19
999
R20
00
0 –
R40
00
0
R40
00
0+
BLA
CK
WCI
GEN
Z
GEN
Y
GEN
X
BA
BY
BO
OM
ER
18 –
30 Y
EAR
S
31 –
39 Y
EAR
S
40 –
49 Y
EAR
S
50+
YEA
RS
Armed response/alarms 8% 0% 18% 26% 11% 4% 11% 6% 0% 8% 11% 0% 6% 9% 12% 2%
Accommodation 7% 14% 5% 13% 6% 1% 9% 3% 8% 7% 8% 4% 7% 7% 9% 4%
Hair/beauty 29% 26% 26% 29% 34% 33% 30% 28% 28% 29% 30% 29% 27% 29% 32% 29%
Domestic worker/gardener 15% 25% 22% 34% 14% 13% 23% 11% 0% 14% 16% 19% 11% 14% 19% 16%
Assistance/payments to children/dependents
18% 19% 21% 16% 17% 16% 18% 18% 22% 17% 16% 31% 16% 19% 17% 22%
Medical aid 11% 33% 26% 13% 6% 7% 15% 5% 0% 9% 14% 9% 5% 10% 13% 13%
Car and/or household insurance
11% 20% 22% 21% 13% 6% 13% 9% 7% 12% 13% 5% 6% 14% 14% 7%
Holiday and travel 28% 31% 27% 18% 27% 31% 30% 25% 46% 25% 31% 20% 28% 27% 33% 24%
Cellphone/airtime/data costs
34% 34% 41% 36% 31% 28% 38% 25% 32% 35% 36% 28% 34% 33% 39% 30%

33
Rebasedtoexcludethosewhoneverornolongerspendinthatcategory,thecategoriesthataremoststickyorresilienttochangearethosethatarepracticallydifficulttochange(e.g.accommodation,gettingtowork)oremotionallydifficult(assistancetofamily,children’seducation)ordeemedessentials(armedresponse/security,medicalaid,carinsurance).
RE-BASED
TOTA
L (A
UTO
BA
SE)
LESS
TH
AN
R6
00
0
R6
00
0 –
R13
999
R14
00
0 –
R19
999
R20
00
0 –
R40
00
0
R40
00
0+
BLA
CK
WCI
GEN
Z
GEN
Y
GEN
X
BA
BY
BO
OM
ER
18 –
30 Y
EAR
S
31 –
39 Y
EAR
S
40 –
49 Y
EAR
S
50+
YEA
RS
Change In Spending Patterns - Unchanged (Re-based)
Food & groceries 29% 18% 25% 34% 36% 39% 28% 32% 24% 27% 32% 35% 25% 27% 31% 35%
Alcoholic beverages 17% 9% 10% 13% 14% 36% 11% 31% 16% 13% 19% 36% 12% 16% 21% 25%
Cigarettes 24% 26% 14% 20% 26% 35% 21% 28% 19% 22% 24% 38% 22% 21% 23% 33%
Dstv/mnet subsciption 49% 28% 37% 51% 56% 70% 44% 64% 40% 46% 51% 63% 45% 47% 45% 61%
Getting to work 74% 72% 70% 66% 74% 83% 71% 80% 73% 73% 74% 76% 71% 75% 71% 78%
Electricity/water 56% 55% 54% 58% 58% 57% 55% 59% 58% 54% 58% 56% 52% 57% 57% 57%
Eating out/entertainment expenses
9% 3% 4% 9% 9% 20% 6% 17% 11% 7% 10% 16% 7% 8% 9% 14%
Having friends round/entertaining at home
11% 2% 4% 8% 12% 27% 5% 26% 6% 9% 11% 23% 11% 8% 9% 18%
Children’s schooling/education
78% 73% 79% 82% 80% 80% 79% 75% 67% 77% 80% 84% 75% 79% 79% 78%
Shoes & clothing 19% 12% 17% 20% 22% 24% 17% 22% 17% 18% 19% 20% 15% 20% 17% 23%
Armed response/alarms 75% 75% 80% 54% 63% 80% 65% 81% 79% 74% 73% 82% 80% 72% 70% 81%
Accommodation 80% 70% 82% 71% 79% 90% 76% 87% 75% 78% 81% 87% 79% 77% 79% 86%
Hair/beauty 28% 15% 24% 28% 32% 40% 24% 37% 29% 25% 28% 41% 29% 24% 25% 38%
Domestic worker/gardener 48% 25% 38% 18% 33% 59% 34% 57% 55% 49% 44% 53% 54% 48% 43% 48%
Assistance/payments to children/dependents
63% 60% 55% 66% 68% 73% 61% 70% 65% 64% 64% 54% 69% 60% 63% 60%
Medical aid 84% 67% 66% 81% 89% 88% 80% 89% 97% 85% 82% 82% 88% 86% 81% 82%
Car and/or household insurance
73% 20% 49% 60% 76% 81% 69% 78% 41% 72% 72% 84% 69% 72% 71% 80%
Holiday and travel 12% 3% 5% 7% 9% 24% 6% 23% 8% 9% 10% 34% 10% 8% 10% 24%
Cellphone/airtime/data costs
27% 15% 18% 27% 33% 47% 23% 38% 30% 25% 26% 41% 27% 24% 25% 34%
34
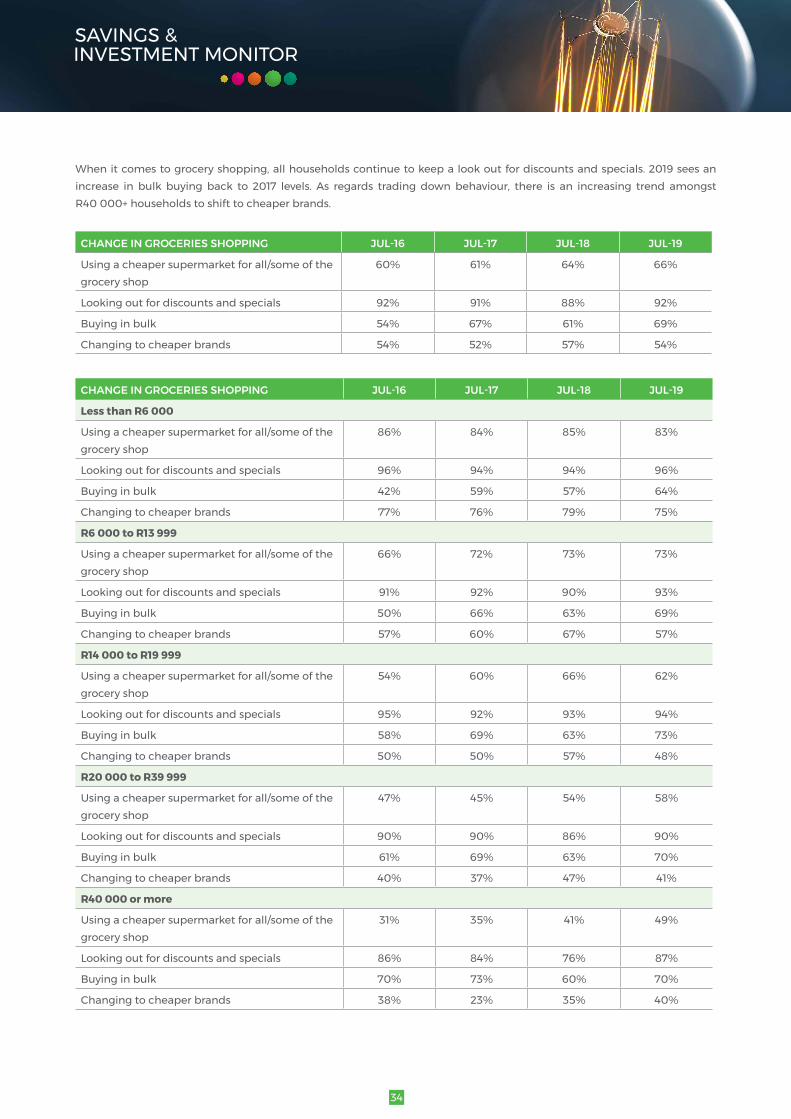
Whenitcomestogroceryshopping,allhouseholdscontinuetokeepalookoutfordiscountsandspecials.2019seesanincrease in bulk buying back to 2017 levels. As regards trading down behaviour, there is an increasing trend amongst R40000+householdstoshifttocheaperbrands.
CHANGE IN GROCERIES SHOPPING JUL-16 JUL-17 JUL-18 JUL-19
Usingacheapersupermarketforall/someofthegrocery shop
60% 61% 64% 66%
Looking out for discounts and specials 92% 91% 88% 92%
Buying in bulk 54% 67% 61% 69%
Changing to cheaper brands 54% 52% 57% 54%
CHANGE IN GROCERIES SHOPPING JUL-16 JUL-17 JUL-18 JUL-19
Less than R6 000
Usingacheapersupermarketforall/someofthegrocery shop
86% 84% 85% 83%
Looking out for discounts and specials 96% 94% 94% 96%
Buying in bulk 42% 59% 57% 64%
Changing to cheaper brands 77% 76% 79% 75%
R6 000 to R13 999
Usingacheapersupermarketforall/someofthegrocery shop
66% 72% 73% 73%
Looking out for discounts and specials 91% 92% 90% 93%
Buying in bulk 50% 66% 63% 69%
Changing to cheaper brands 57% 60% 67% 57%
R14 000 to R19 999
Usingacheapersupermarketforall/someofthegrocery shop
54% 60% 66% 62%
Looking out for discounts and specials 95% 92% 93% 94%
Buying in bulk 58% 69% 63% 73%
Changing to cheaper brands 50% 50% 57% 48%
R20 000 to R39 999
Usingacheapersupermarketforall/someofthegrocery shop
47% 45% 54% 58%
Looking out for discounts and specials 90% 90% 86% 90%
Buying in bulk 61% 69% 63% 70%
Changing to cheaper brands 40% 37% 47% 41%
R40 000 or more
Usingacheapersupermarketforall/someofthegrocery shop
31% 35% 41% 49%
Looking out for discounts and specials 86% 84% 76% 87%
Buying in bulk 70% 73% 60% 70%
Changing to cheaper brands 38% 23% 35% 40%

35
6.9 FINANCIAL “ROBUSTNESS” AND ABILITY TO COPE WITH A FINANCIAL EMERGENCY
In order to get a fix on thefinancial “robustness” of SouthAfricaworkingmetrohouseholds and tobetter understandbehaviourinthefaceofafinancialemergency,respondentswereaskedhowtheywouldhandleanunforeseenexpenseofR1000,thenR5000,risinguptoR100000.
Once again respondents were given the option to “bail” if they reached a monetary ceiling where they would be unable to eitheruseexistingsavings,sellanassetortapintoacreditlinetomeettheamount.
Asregardstrends,<R6000householdsareresortingtoloansmorereadilywhilstthoseinmidcategory(R14000–R19999)and(R20000–R39999)aremorestrained.HouseholdsinR40000+appearabitbetterequippedtocopeascomparedtolast year.
TABLE READS: • In2018,attotalmarketlevel,allbar2%workinghouseholdscanhandleanunforeseenexpenseofR1000.58%wouldaccessavailablesavings,6%woulduseacreditcardandtheremainderwouldborrowthemoney,mostlikelyfromafriend(20%) or stokvel (9%).
• At R100 000 the vast majority (85%) would not be able to handle this.
HANDLE UNFORESEEN EXPENDITURE OF
R1 000 R5 000 R10 000 R50 000 R100 000
2016
2017
2018
2019
2016
2017
2018
2019
2016
2017
2018
2019
2016
2017
2018
2019
2016
2017
2018
2019
Pay with a credit card 9% 7% 6% 9% 11% 15% 11% 13% 8% 11% 10% 10% 1% 2% 2% 2% - - - -
Useoverdraft/existing credit 1% 2% 1% 2% 3% 4% 3% 4% 3% 4% 2% 3% 1% 1% 2% 2% - - 1% 1%
Personal loan from institution 4% 4% 3% 7% 19% 19% 16% 21% 30% 26% 23% 27% 17% 19% 19% 18% 7% 10% 12% 9%
Borrow from friend/relative 25% 28% 20% 27% 13% 12% 9% 8% 4% 3% 3% 2% 1% - 1% 1% - - - -
Borrow from my stokvel 6% 7% 9% 9% 11% 10% 9% 10% 4% 4% 3% 4% - - - - - - - -
Borrow against home equity - - - - - - - - 1% 1% - 1% 3% 2% 3% 3% 4% 2% 3% 5%
Borrow from employer* - 3% 4% 4% 5% 5% 4% 6% 5% 4% 3% 3% 0% - - - - - - -
Surrender a policy* - - - - - 1% 1% - 1% 2% 2% 1% 4% 2% 2% 1% 3% - 1% -
Pay bills late 4% 5% 3% 4% 2% 2% 1% 2% 1% - - - 0% - - - - - - -
Use savings 50% 54% 58% 45% 25% 25% 31% 23% 7% 9% 12% 8% 3% 2% 2% 2% 0% 1% 1% 1%
Sell/pawn an asset 1% 1% - - 1% 1% 1% 1% 1% 1% - 1% 1% - - 1% 0% - - -
Would not be able to handle it
2% 1% 2% 2% 11% 16% 18% 17% 35% 40% 44% 41% 69% 72% 70% 71% 84% 85% 82% 85%
*addedaspre-codeoptionin2016

36
HOUSEHOLD INCOME LESS THAN R6 000• Friends,savingsandtoa lesserextentstokvelsarethego-tosources foranunexpectedexpenseofR1000 invery low
income households• AtanexpenseofR5000,thetippingpointcomeslaterin2019,with38%(asagainst48%in2018)unabletocope.Lower
income now showing greater appetite to take out a personal loan/greater reliance on loans.
HANDLE UNFORESEEN EXPENDITURE OF
R1 000 R5 000 R10 000 R50 000 R100 000
2016
2017
2018
2019
2016
2017
2018
2019
2016
2017
2018
2019
2016
2017
2018
2019
2016
2017
2018
2019
Pay with a credit card 2% - - - 1% - - - 1% - - - - - - - - - -
Useoverdraft/other existing line of credit
1% - - 1% - 1% - 1% - 1% - - - - - - - - - -
Take out personal loan from an institution or micro lender
8% 7% 7% 11% 24% 23% 21% 29% 23% 19% 15% 18% 3% 3% 1% 1% 1% 2% - -
Borrow from a friend/relative 35% 45% 41% 40% 18% 14% 10% 9% 3% 2% 1% - - - - - - - - -
Borrow from my stokvel 8% 12% 15% 20% 18% 9% 12% 10% 7% 2% 2% 1% - - - - - - - -
Borrow against home equity/use home loan
- 1% - 1% - - - 1% 1% - - 1% - - - 1% - - -
Borrow from employer* 5% 6% 10% 5% 7% 6% 7% 7% 4% 3% 2% 2% 1% - - - - - - -
Surrender a policy* - - - - 1% - - - 1% - 1% 3% - - - 2% - - -
Pay bills late/skippayments* 3% 9% 6% 6% 1% 1% - - - - - - - - - - - - - -
Use savings 36% 33% 22% 23% 3% 6% 2% 6% - 1% - - 3% - - - - - - -
Sell/pawn an asset 2% 2% 1% 1% 1% - 3% - 1% - 1% 1% - - - - - - -
Would not be able to handle it
4% 2% 7% 3% 27% 42% 48% 38% 64% 72% 81% 73% 93% 97% 99% 99% 96% 98% 100% 100%
*addedasapre-codein2016

37
HOUSEHOLD INCOME R6 000 TO R13 999• Friends & savings are the primary sources for a R1 000 unforeseen expense• FormalloansgaintractionatR5000,althoughaccess/relianceonpersonalloanscontinuestoshowadecliningtrendfor
amounts of R50 000 and over • Over half cannot cope with an unforeseen expense of R10 000• At R50 000 the vast majority of households in this bracket can’t cope
HANDLE UNFORESEEN EXPENDITURE OF
R1 000 R5 000 R10 000 R50 000 R100 000
2016
2017
2018
2019
2016
2017
2018
2019
2016
2017
2018
2019
2016
2017
2018
2019
2016
2017
2018
2019
Pay with a credit card 5% 3% 3% 4% 5% 10% 5% 4% 2% 5% 1% 1% - - 1% - - - - -
Useoverdraft/other existing line of credit
1% 1% - - 1% 2% 2% 1% - - - 1% - - 1% 1% - - 1% -
Take out a personal loan from an institution or micro lender
2% 5% 4% 9% 22% 28% 24% 30% 35% 28% 28% 33% 15% 10% 12% 11% 4% 3% 4% 2%
Borrow from a friend/relative 30% 31% 25% 35% 18% 13% 14% 8% 3% 2% 3% 1% - - 1% 1% - - - -
Borrow from my stokvel 8% 8% 10% 9% 13% 13% 9% 15% 5% 4% 2% 3% - - - - - - - -
Borrow against home equity/use home loan
- - 1% - 1% - 1% - 1% - - 1% 1% - - - - - - -
Borrow from employer* 1% 4% 6% 5% 4% 6% 7% 9% 7% 6% 5% 5% 1% - - - - - - -
Surrender a policy* - - 1% - - - 1% - 1% 3% 3% 1% 3% 1% 2% - 2% - - -
Pay bills late/skippayments* 4% 6% 5% 3% 2% 2% 1% 4% - - - - - - - - - - - -
Use savings 50% 52% 54% 41% 22% 16% 21% 13% 2% 1% 7% 2% - - - - - - - -
Sell/pawn an asset 1% 2% 1% - 2% - 2% 1% - - 1% 1% - - - 1% - - - -
Would not be able to handle it
2% 0% 0% 2% 14% 16% 20% 19% 43% 52% 55% 52% 80% 88% 85% 86% 94% 96% 96% 98%
*addedasapre-codein2016

38
HOUSEHOLD INCOME R14 000 – R19 999• SavingsaretheprimarysourceforexpensesofR1000,afterwhichborrowingstepsin.Howeverrelianceonsavingsisdownsignificantlyin2019forallexpenseamounts–evidenceofdepletedsavingspools.
• Astheamountoftheexpenseclimbs,soborrowingfromfriendsandfamilydropsoffinfavourofinstitutionalborrowing.• Generally speaking for this income bracket the tipping point comes earlier in 2019.
HANDLE UNFORESEEN EXPENDITURE OF
R1 000 R5 000 R10 000 R50 000 R100 000
2016
2017
2018
2019
2016
2017
2018
2019
2016
2017
2018
2019
2016
2017
2018
2019
2016
2017
2018
2019
Pay with a credit card 7% 5% 7% 7% 13% 16% 12% 10% 6% 10% 7% 7% - - 1% 1% - - - -
Useoverdraft/other existing line of credit
3% 3% 2% 1% 5% 3% 2% 2% 3% 5% 2% 2% 1% - 1% 2% - 1% - 1%
Take out a personal loan from an institution or micro lender
5% 5% 3% 10% 23% 21% 16% 23% 38% 32% 26% 36% 16% 24% 22% 15% 8% 13% 10% 4%
Borrow from a friend/relative 23% 28% 14% 31% 9% 16% 10% 12% 6% 5% 5% 3% 1% - 1% 1% - - - -
Borrow from my stokvel 6% 6% 12% 9% 10% 8% 14% 10% 4% 4% 5% 2% - - 1% - - - - -
Borrow against home equity/use home loan
- - 1% - 1% 1% - - - - - - 3% 2% 2% - 2% 2% - 1%
Borrow from employer* 1% 2% 2% 4% 4% 7% 3% 6% 4% 3% 3% 3% - - - - - - - -
Surrender a policy* - 1% - - - 1% 1% - 1% 3% 3% 1% 4% 1% 2% - 1% - 1% -
Pay bills late/skippayments* 8% 3% 1% 5% 3% 2% 1% 4% - - - - - - - - - - - -
Use savings 50% 60% 65% 45% 26% 25% 34% 21% 5% 9% 14% 4% - - 1% 1% - - 1% -
Sell/pawn an asset 1% 1% - - 2% - - 2% 1% - 1% 2% - 1% - 1% - - - -
Would not be able to handle it
1% 1% 1% 1% 6% 11% 13% 17% 30% 32% 38% 43% 75% 71% 71% 81% 89% 86% 89% 94%
*addedasapre-codein2016

39
HOUSEHOLD INCOME R20 000 – R39 999• Credit card continues to be used extensively up to R10 000• Formal loans popular especially for amounts in R10 000 – R50 000 range• Relianceonsavingsdownacrosstheboard-evidenceofadepletedsavingspool• Thebailpointcomesearlierforlargeramountsin2019,withnearlytwothirdsunabletohandleanexpenseofR50000
and 84% bailing at R100 000
HANDLE UNFORESEEN EXPENDITURE OF
R1 000 R5 000 R10 000 R50 000 R100 000
2016
2017
2018
2019
2016
2017
2018
2019
2016
2017
2018
2019
2016
2017
2018
2019
2016
2017
2018
2019
Pay with a credit card 15% 13% 10% 11% 20% 23% 18% 18% 15% 20% 18% 16% 2% 3% 1% 1% - 1% - -
Useoverdraft/other existing line of credit
1% 3% 1% 2% 5% 7% 3% 4% 6% 6% 3% 5% 2% 2% 2% 1% 1% - 2% -
Take out a personal loan from an institution or micro lender
3% 1% 2% 6% 15% 14% 12% 14% 30% 28% 25% 30% 24% 30% 30% 30% 10% 15% 20% 13%
Borrow from a friend/relative 21% 15% 12% 22% 9% 9% 7% 10% 4% 4% 6% 4% 1% 1% 2% 1% - 1% - -
Borrow from my stokvel 2% 5% %7 7% 5% 9% 6% 8% 4% 5% 3% 6% 1% 1% - 1% - - - -
Borrow against home equity/use home loan
- - - - 1% 1% - 1% 1% - - 2% 6% 2% 6% 2% 9% 3% 3% 4%
Borrow from employer* 2% 2% 2% 2% 7% 4% 2% 4% 6% 5% 3% 5% - - - 1% - - - -
Surrender a policy* 1% 1% - - - 1% - 1% 4% 3% 2% 1% 8% 6% 2% 1% 2% 1% 1% -
Pay bills late/skippayments* 3% 2% 1% 4% 1% 2% 1% 3% 2% 1% - - 1% - - - 4% - - -
Use savings 57% 68% 70% 55% 36% 41% 43% 34% 10% 15% 14% 10% 2% 5% 1% 2% - 1% - -
Sell/pawn an asset 2% 1% - - 1% 1% - 1% 2% 1% - 1% 2% 1% - 1% - 1% - -
Would not be able to handle it
- 1% - 1% 4% 3% 8% 7% 18% 17% 28% 24% 51% 54% 56% 62% 75% 77% 73% 84%
*addedasapre-codein2016

40
HOUSEHOLD INCOME R40 000+ • Credit card very popular for amounts up to R10 000• Lowincidenceofloansfromfamily/friends,withpreferenceforformalloansforlargeramounts.• Home loans also remain popular for amounts north of R50 000• Resilience levels have generally improved for R40 000+ households, with those unable to cope with an expense of
R50 000 dropping to 26% (down from 37% in 2018)
HANDLE UNFORESEEN EXPENDITURE OF
R1 000 R5 000 R10 000 R50 000 R100 000
2016
2017
2018
2019
2016
2017
2018
2019
2016
2017
2018
2019
2016
2017
2018
2019
2016
2017
2018
2019
Pay with a credit card 20% 17% 10% 22% 26% 33% 20% 33% 25% 29% 24% 29% 3% 7% 6% 8% - 1% - 1%
Useoverdraft/other existing line of credit
2% 4% 2% 5% 9% 12% 6% 11% 9% 12% 8% 8% 6% 6% 8% 6% 6% 2% 4% 35
Take out a personal loan from an institution or micro lender
1% 1% 1% 3% 6% 4% 7% 7% 22% 21% 17% 23% 34% 38% 29% 35% 18% 29% 28% 25%
Borrow from a friend/relative 11% 18% 8% 8% 7% 8% 4% 3% 5% 3% 1% 3% 3% 2% - 4% 1% 1% - 2%
Borrow from my stokvel 4% 3% 2% 2% 4% 7% 6% 3% 1% 2% 5% 7% 1% - - 1% - - - -
Borrow against home equity/use home loan
- 1% - - - 1% - - 1% 2% 1% 2% 8% 9% 8% 12% 11% 10% 12% 18%
Borrow from employer* - 2% 2% - 3% 2% - 2% 3% 3% 2% 1% 1% 1% - - - - - -
Surrender a policy* - - - - - - 1% 1% 1% 2% 1% - 5% 3% 2% 2% 9% 2% 1% 2%
Pay bills late/skippayments* 2% 2% - 1% 2% 1% - 1% 2% - - 2% 1% - - 1% 1% - - -
Use savings 62% 64% 78% 64% 45% 48% 58% 43% 21% 26% 28% 23% 4% 6% 10% 8% 1% 3% 4% 3%
Sell/pawn an asset 2% - - - 1% 1% - - 1% 1% - 1% 2% - - 1% 1% - - -
Would not be able to handle it
- - - - - 1% 1% 1% 8% 8% 14% 6% 34% 30% 37% 26% 57% 54% 50% 49%
*addedasapre-codein2016

41
7. RETROSPECTIVE VIEWS AND FUTURE EXPECTATIONS
Respondentsareaskedwhethertheyexpecttheirfinancialsituationtoimprove,deteriorateorstaythesameinthenextsixmonths.2019seesamarginallylessoptimisticoutlook,althoughsome40%expectanimprovement.
The decline in optimism levels is more evident in higher earning households.
OUTLOOK FOR NEXT 6 MONTHS JUL-13 JUL-14 JUL-15 JUL-16 JUL-17 JUL-18 JUL-19
Less than R6 000
Improve/get better 43% 33% 34% 26% 26% 36% 37%
Stay the same 47% 46% 57% 46% 42% 41% 38%
Get worse 10% 21% 9% 27% 32% 23% 25%
R6 000 to R13 999
Improve/get better 50% 41% 48% 31% 34% 40% 43%
Stay the same 40% 46% 46% 48% 48% 44% 41%
Get worse 9% 13% 6% 22% 18% 16% 16%
R14 000 to R19 999
Improve/get better 54% 43% 45% 41% 35% 43% 40%
Stay the same 37% 44% 47% 43% 46% 41% 49%
Get worse 10% 13% 8% 16% 18% 16% 11%
R20 000 to R39 999
Improve/get better 54% 58% 55% 42% 46% 49% 42%
Stay the same 40% 37% 38% 44% 39% 43% 48%
Get worse 6% 5% 7% 14% 15% 8% 10%
R40 000 or more
Improve/get better 54% 48% 62% 44% 45% 47% 39%
Stay the same 42% 45% 37% 44% 43% 48% 54%
Get worse 4% 6% 1% 12% 12% 6% 7%
42
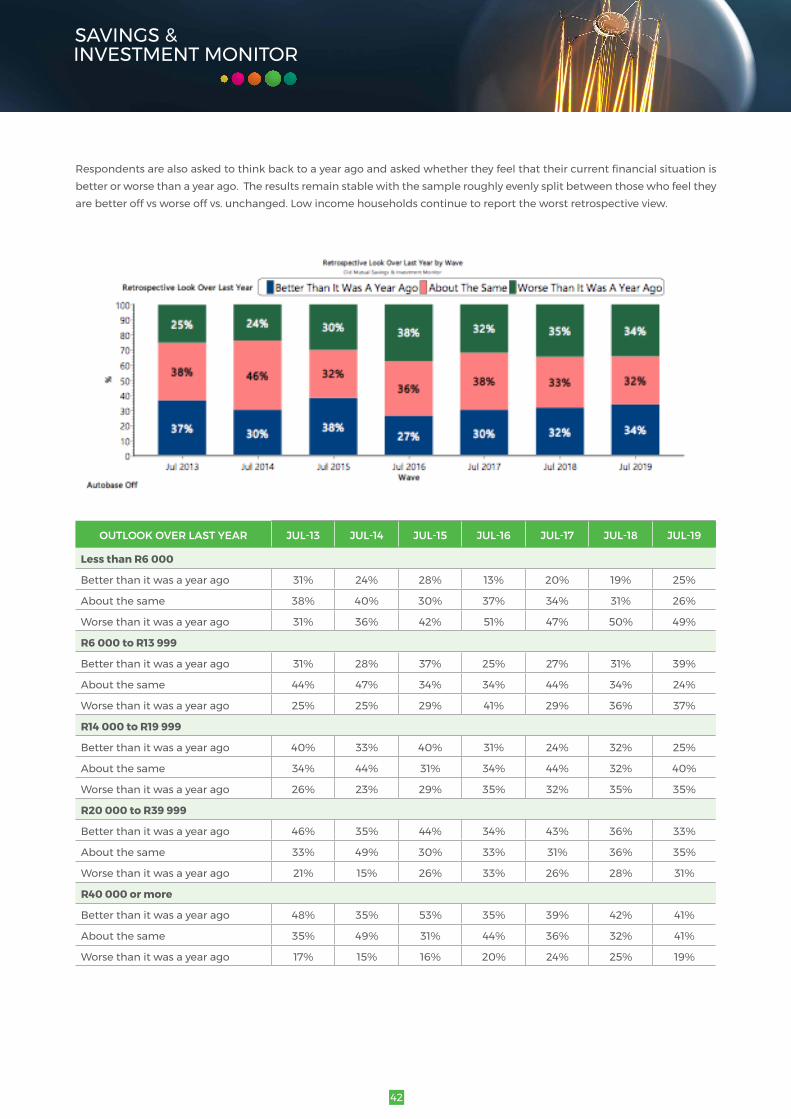
Respondentsarealsoaskedtothinkbacktoayearagoandaskedwhethertheyfeelthattheircurrentfinancialsituationisbetter or worse than a year ago. The results remain stable with the sample roughly evenly split between those who feel they are better off vs worse off vs. unchanged. Low income households continue to report the worst retrospective view.
OUTLOOK OVER LAST YEAR JUL-13 JUL-14 JUL-15 JUL-16 JUL-17 JUL-18 JUL-19
Less than R6 000
Better than it was a year ago 31% 24% 28% 13% 20% 19% 25%
About the same 38% 40% 30% 37% 34% 31% 26%
Worse than it was a year ago 31% 36% 42% 51% 47% 50% 49%
R6 000 to R13 999
Better than it was a year ago 31% 28% 37% 25% 27% 31% 39%
About the same 44% 47% 34% 34% 44% 34% 24%
Worse than it was a year ago 25% 25% 29% 41% 29% 36% 37%
R14 000 to R19 999
Better than it was a year ago 40% 33% 40% 31% 24% 32% 25%
About the same 34% 44% 31% 34% 44% 32% 40%
Worse than it was a year ago 26% 23% 29% 35% 32% 35% 35%
R20 000 to R39 999
Better than it was a year ago 46% 35% 44% 34% 43% 36% 33%
About the same 33% 49% 30% 33% 31% 36% 35%
Worse than it was a year ago 21% 15% 26% 33% 26% 28% 31%
R40 000 or more
Better than it was a year ago 48% 35% 53% 35% 39% 42% 41%
About the same 35% 49% 31% 44% 36% 32% 41%
Worse than it was a year ago 17% 15% 16% 20% 24% 25% 19%
43
8. SAVINGS LEVELS AND PUTTING MONEY ASIDE
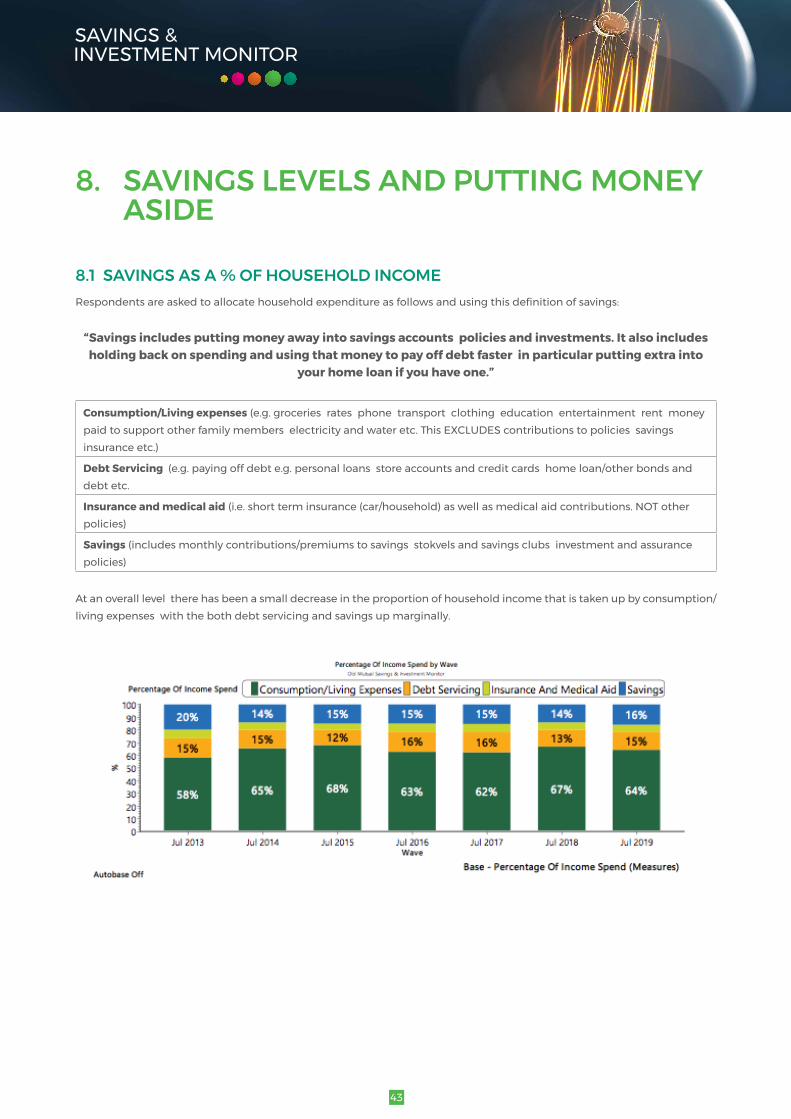
8.1 SAVINGS AS A % OF HOUSEHOLD INCOMERespondentsareaskedtoallocatehouseholdexpenditureasfollowsandusingthisdefinitionofsavings:
“Savings includes putting money away into savings accounts policies and investments. It also includes holdingbackonspendingandusingthatmoneytopayoffdebtfasterinparticularputtingextrainto
your home loan if you have one.”
Consumption/Living expenses (e.g. groceries rates phone transport clothing education entertainment rent money paidtosupportotherfamilymemberselectricityandwateretc.ThisEXCLUDEScontributionstopoliciessavingsinsurance etc.)
Debt Servicing (e.g. paying off debt e.g. personal loans store accounts and credit cards home loan/other bonds and debt etc.
Insurance and medical aid (i.e. short term insurance (car/household) as well as medical aid contributions. NOT other policies)
Savings (includes monthly contributions/premiums to savings stokvels and savings clubs investment and assurance policies)
At an overall level there has been a small decrease in the proportion of household income that is taken up by consumption/ living expenses with the both debt servicing and savings up marginally.

44
Low income households continue to spend the highest proportion on consumption/living expenses with debt servicing and precautionary savings (such as insurance and medical aid) rising with income. Savings as a % of household income are fairly steady across income levels (although Rand/absolute amounts will vary considerably).
Looking at the results within income bands and race/generation/age it is notable that the increase in the proportionate spend on debt servicing is most notable in R14 000 – R19 999 households whilst the increase in savings tends to be R40000+.
PERCENTAGE OF INCOME SPEND JUL-13 JUL-14 JUL-15 JUL-16 JUL-17 JUL-18 JUL-19
Less than R6 000
Consumption/living expenses 65% 72% 76% 71% 71% 79% 73%
Debt servicing 14% 14% 10% 13% 13% 8% 12%
Insurance and medical aid 1% 1% 0% 1% 1% 0% 0%
Savings 20% 13% 14% 15% 15% 13% 14%
R6 000 to R13 999
Consumption/living expenses 59% 68% 69% 65% 63% 70% 67%
Debt servicing 16% 14% 11% 15% 16% 12% 14%
Insurance and medical aid 6% 4% 4% 5% 4% 3% 3%
Savings 20% 14% 16% 16% 16% 15% 16%
R14 000 to R19 999
Consumption/living expenses 57% 62% 65% 59% 61% 66% 65%
Debt servicing 16% 15% 12% 18% 15% 13% 15%
Insurance and medical aid 8% 8% 7% 8% 8% 6% 5%
Savings 19% 15% 16% 15% 15% 15% 15%
R20 000 to R39 999
Consumption/living expenses 52% 60% 64% 58% 57% 60% 59%
Debt servicing 17% 16% 14% 17% 17% 16% 16%
Insurance and medical aid 11% 10% 8% 10% 11% 10% 8%
Savings 20% 14% 14% 15% 15% 13% 17%
R40 000 or more
Consumption/living expenses 49% 59% 62% 57% 57% 59% 55%
Debt servicing 16% 16% 15% 18% 17% 16% 17%
Insurance and medical aid 14% 11% 9% 10% 12% 10% 11%
Savings 21% 14% 15% 14% 14% 15% 17%
45
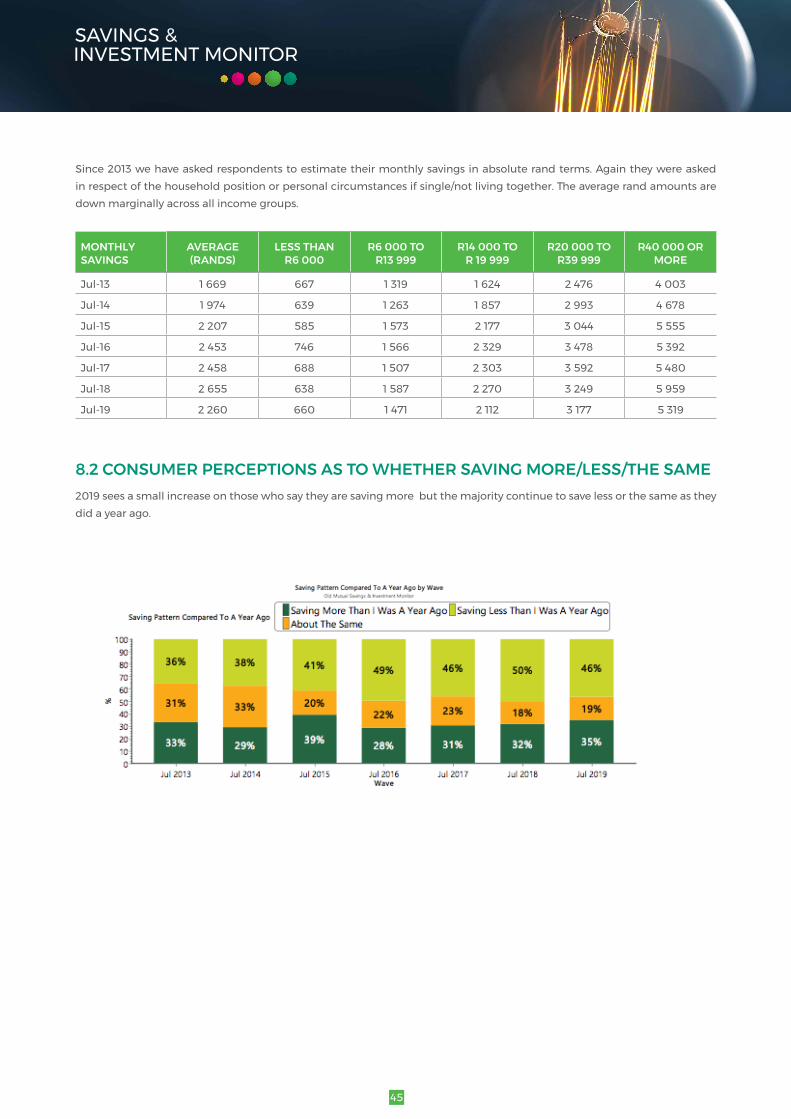
Since 2013 we have asked respondents to estimate their monthly savings in absolute rand terms. Again they were asked in respect of the household position or personal circumstances if single/not living together. The average rand amounts are down marginally across all income groups.
MONTHLY SAVINGS
AVERAGE (RANDS)
LESS THAN R6 000
R6 000 TO R13 999
R14 000 TO R 19 999
R20 000 TO R39 999
R40 000 OR MORE
Jul-13 1 669 667 1 319 1 624 2 476 4 003
Jul-14 1 974 639 1 263 1 857 2 993 4 678
Jul-15 2 207 585 1 573 2 177 3 044 5 555
Jul-16 2 453 746 1 566 2 329 3 478 5 392
Jul-17 2 458 688 1 507 2 303 3 592 5 480
Jul-18 2 655 638 1 587 2 270 3 249 5 959
Jul-19 2 260 660 1 471 2 112 3 177 5 319
8.2 CONSUMER PERCEPTIONS AS TO WHETHER SAVING MORE/LESS/THE SAME 2019 sees a small increase on those who say they are saving more but the majority continue to save less or the same as they did a year ago.

46
The demographic analysis reveals a similar pattern to that seen historically. There continues to be a positive correlation with income with a higher % of wealthier households claiming to be saving more when compared to lower income. The spike inGenZsavingmoreisalifestageissueandwhatweareseeingistheeffectsoffirst-timeemployment.ManyofGenZhaveonly recently started earning and are only now in a position to save.
Respondents are asked why they are saving more/less or the same compared to a year ago. Increased demands on income remains the most prevalent determinant of behaviour.
2019 TOTALSAVING MORE THAN I WAS A
YEAR AGO
ABOUT THE SAME
SAVING LESS THAN I WAS A
YEAR AGO
Little change in circumstances/needs 16% 1% 47% 15%
Increased demands on income 45% 0% 50% 77%
Effect of debt/debt management 18% 26% 10% 15%
Improved income 21% 54% 10% 1%
Item/causespecificsavings 5% 13% 1% 0%
Deteriorating income 13% 1% 4% 26%
Decreased demands 4% 11% 0% 0%
Shift in headspace 13% 27% 18% 1%
Other 1% 1% 1% 1%
As has been the case historically whilst improved income is still cited most often as a reason for saving more a shift in headspace (i.e. realising the importance of savings) is also a strong driver as is the effect of good debt management (i.e. paying off debt which frees up funds to be saved).
REASONS SAVING MORE JUL-13 JUL-14 JUL-15 JUL-16 JUL-17 JUL-18 JUL-19
Improved income 51% 47% 59% 51% 59% 59% 54%
Shift in headspace 18% 30% 18% 35% 39% 33% 27%
Effect of debt/debt management 24% 30% 22% 35% 22% 32% 26%
Item/causespecificsavings 9% 11% 5% 21% 11% 13% 13%
Decreased demands 18% 13% 13% 12% 2% 15% 11%
Little change in circumstances/needs 1% 0% 1% 0% 0% 0% 1%
Other 2% 0% 0% 3% 2% 2% 1%

47
As to reasons for saving less increased demands on income in the form of escalating expenses remains the primary barrier to saving. Deteriorating income (lower commissions family members losing jobs or being put on short hours) is the next mostprevalentdriverbeingcitedby1 in4ofthosewhofindthattheyaresavinglessthanayearago.Thosecitingdebtmanagement (having more debt to service) as a reason for saving less remains at 15%.
REASONS SAVING LESS JUL-13 JUL-14 JUL-15 JUL-16 JUL-17 JUL-18 JUL-19
Increased demands on income 70% 74% 74% 74% 86% 79% 77%
Deteriorating income 16% 19% 24% 25% 16% 26% 26%
Little change in circumstances/needs 11% 6% 27% 22% 27% 15% 15%
Effect of debt/debt management 14% 12% 9% 19% 10% 15% 15%
8.3 SAVING FOR FINANCIAL EMERGENCIES Since2016respondentshavebeenaskeddirectlywhethertheysaveforfinancialemergenciesandiftheydowherethesefunds are saved. At a total level claimed saving for emergencies is down sharply to 51%. Some of this may be attributable to the wording change but there are indications elsewhere in the results (for example the drop in rainy day saving as a saving objective as well as decreased ability to cope with various levels of unforeseen expense) which show that savings levels are being depleted and emergency savings are now a luxury for some.

48
Bank savings accounts continue to be the vehicle of choice for emergency savings.
METHOD OF SAVING FOR EMERGENCIES 2019 TO
TAL
LESS
TH
AN
R6
00
0
R6
00
0 –
R13
999
R14
00
0 –
R19
999
R20
00
0 –
R40
00
0
R40
00
0+
BLA
CK
WCI
GEN
Z
GEN
Y
GEN
X
BA
BY
BO
OM
ER
18 –
30 Y
EAR
S
31 –
39 Y
EAR
S
40 –
49 Y
EAR
S
50+
YEA
RS
Unweightednumbers 504 68 86 95 114 141 332 172 25 230 188 61 122 145 131 106
Bank savings account/in the bank
78% 66% 77% 82% 80% 81% 77% 80% 79% 77% 79% 79% 80% 75% 79% 78%
Incash-unbanked 15% 16% 10% 12% 16% 18% 10% 25% 12% 13% 16% 18% 12% 14% 13% 19%
Save in a stokvel/savings club 13% 29% 17% 12% 8% 6% 18% 3% 13% 15% 13% 7% 12% 17% 15% 6%
Save in a stokvel/savings club (basedonblackstokvelmembers)
28% 50% 28% 25% 19% 13% 28% 34% 31% 25% 20% 31% 31% 30% 15%
Unittrusts 4% 0% 1% 2% 7% 7% 4% 5% 0% 4% 4% 7% 4% 3% 5% 5%
In access bond facility/home loan
4% 0% 0% 0% 4% 8% 2% 7% 0% 3% 2% 10% 2% 4% 1% 7%
Invested in shares 2% 1% 0% 0% 3% 3% 2% 1% 0% 1% 1% 8% 0% 1% 1% 5%
BuildUpCreditBalanceInCredit Card
2% 0% 1% 1% 1% 3% 2% 0% 4% 1% 2% 1% 2% 1% 1% 3%

49
8.4 SAVINGS STOCKS IN THE FACE OF RETRENCHMENTIn 2019 we added a question to assess households’ ability to cope in the face of retrenchment:
“If you were retrenched or lost your job/main source of income would you have enough money saved to last you …less than a month one month 2 months etc.”
At a total sample level 38% of metro working households have enough for a month or less. As would be expected savings stocks are inversely correlated with income and rise with age.
IF RETRENCHED HOW LONG WOULD SAVINGS
LAST TOTA
L
LESS
TH
AN
R6
00
0
R6
00
0 –
R13
999
R14
00
0 –
R19
999
R20
00
0 –
R40
00
0
R40
00
0+
BLA
CK
WCI
GEN
Z
GEN
Y
GEN
X
BA
BY
BO
OM
ER
18 –
30 Y
EAR
S
31 –
39 Y
EAR
S
40 –
49 Y
EAR
S
50+
YEA
RS
Less than a month 18% 38% 22% 14% 6% 3% 19% 14% 29% 22% 13% 8% 25% 20% 16% 9%
One month 20% 26% 26% 19% 17% 7% 21% 15% 26% 21% 18% 14% 24% 20% 19% 15%
2 Months 16% 13% 17% 22% 15% 15% 15% 20% 15% 15% 18% 12% 16% 15% 20% 13%
3 Months 15% 11% 13% 15% 20% 21% 14% 19% 16% 15% 16% 16% 15% 16% 15% 16%
More than 3 months 31% 12% 21% 30% 42% 55% 30% 32% 14% 27% 34% 51% 21% 30% 31% 46%
50
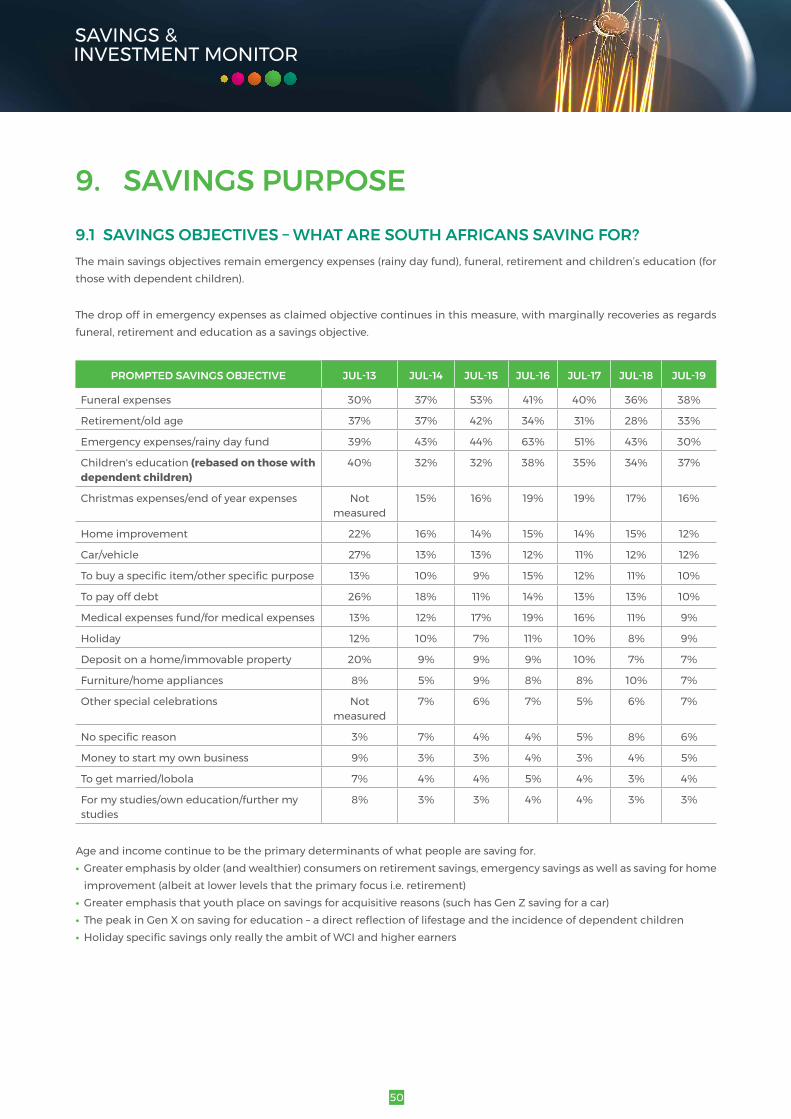
9. SAVINGS PURPOSE 9.1 SAVINGS OBJECTIVES – WHAT ARE SOUTH AFRICANS SAVING FOR?Themainsavingsobjectivesremainemergencyexpenses(rainydayfund),funeral,retirementandchildren’seducation(forthose with dependent children).
Thedropoffinemergencyexpensesasclaimedobjectivecontinuesinthismeasure,withmarginallyrecoveriesasregardsfuneral,retirementandeducationasasavingsobjective.
PROMPTED SAVINGS OBJECTIVE JUL-13 JUL-14 JUL-15 JUL-16 JUL-17 JUL-18 JUL-19
Funeral expenses 30% 37% 53% 41% 40% 36% 38%
Retirement/old age 37% 37% 42% 34% 31% 28% 33%
Emergency expenses/rainy day fund 39% 43% 44% 63% 51% 43% 30%
Children's education (rebased on those with dependent children)
40% 32% 32% 38% 35% 34% 37%
Christmas expenses/end of year expenses Not measured
15% 16% 19% 19% 17% 16%
Home improvement 22% 16% 14% 15% 14% 15% 12%
Car/vehicle 27% 13% 13% 12% 11% 12% 12%
Tobuyaspecificitem/otherspecificpurpose 13% 10% 9% 15% 12% 11% 10%
To pay off debt 26% 18% 11% 14% 13% 13% 10%
Medical expenses fund/for medical expenses 13% 12% 17% 19% 16% 11% 9%
Holiday 12% 10% 7% 11% 10% 8% 9%
Deposit on a home/immovable property 20% 9% 9% 9% 10% 7% 7%
Furniture/home appliances 8% 5% 9% 8% 8% 10% 7%
Other special celebrations Not measured
7% 6% 7% 5% 6% 7%
Nospecificreason 3% 7% 4% 4% 5% 8% 6%
Money to start my own business 9% 3% 3% 4% 3% 4% 5%
To get married/lobola 7% 4% 4% 5% 4% 3% 4%
For my studies/own education/further my studies
8% 3% 3% 4% 4% 3% 3%
Age and income continue to be the primary determinants of what people are saving for. • Greateremphasisbyolder(andwealthier)consumersonretirementsavings,emergencysavingsaswellassavingforhome
improvement (albeit at lower levels that the primary focus i.e. retirement)• Greateremphasisthatyouthplaceonsavingsforacquisitivereasons(suchhasGenZsavingforacar)• ThepeakinGenXonsavingforeducation–adirectreflectionoflifestageandtheincidenceofdependentchildren• HolidayspecificsavingsonlyreallytheambitofWCIandhigherearners

51
PROMPTED SAVINGS OBJECTIVE TO
TAL
LESS
TH
AN
R6
00
0
R6
00
0 –
R13
999
R14
00
0 –
R19
999
R20
00
0 –
R40
00
0
R40
00
0+
BLA
CK
WCI
GEN
Z
GEN
Y
GEN
X
BA
BY
BO
OM
ER
18 –
30 Y
EAR
S
31 –
39 Y
EAR
S
40 –
49 Y
EAR
S
50+
YEA
RS
Funeral expenses 38% 44% 43% 40% 40% 23% 45% 19% 15% 40% 39% 38% 27% 45% 36% 43%
Retirement/old age 33% 11% 27% 33% 40% 56% 26% 50% 8% 26% 38% 59% 19% 28% 35% 55%
Emergency expenses/rainy day fund 30% 25% 21% 29% 30% 46% 28% 35% 24% 28% 31% 38% 26% 29% 34% 33%
Children's education 27% 15% 32% 30% 27% 29% 29% 21% 10% 29% 33% 5% 16% 36% 35% 15%
Christmas expenses/ end of year expenses 16% 18% 20% 15% 18% 8% 19% 8% 8% 16% 19% 13% 16% 15% 20% 15%
Home improvement 12% 7% 9% 14% 15% 20% 13% 11% 2% 10% 19% 11% 6% 12% 15% 19%
Car/vehicle 12% 5% 13% 17% 14% 12% 12% 12% 24% 13% 8% 11% 17% 13% 7% 9%
Tobuyaspecificitem/otherspecificpurpose 10% 10% 10% 8% 10% 8% 11% 6% 15% 10% 11% 2% 12% 9% 10% 7%
To pay off debt 10% 9% 8% 7% 11% 12% 10% 9% 7% 9% 12% 7% 8% 9% 11% 12%
Medical expenses fund/ for medical expenses 9% 2% 7% 9% 12% 17% 10% 8% 2% 9% 11% 12% 6% 10% 11% 12%
Holiday 9% 1% 2% 3% 13% 24% 3% 23% 6% 7% 8% 18% 10% 5% 11% 11%
Deposit on a home/immovable property 7% 2% 7% 11% 12% 9% 7% 7% 5% 10% 5% 6% 9% 9% 5% 5%
Furniture/home appliances 7% 6% 7% 8% 5% 7% 7% 5% 3% 8% 4% 8% 9% 7% 4% 6%
Other special celebrations 7% 3% 8% 5% 5% 10% 5% 10% 7% 7% 7% 5% 5% 8% 7% 5%
Nospecificreason 6% 10% 6% 6% 5% 3% 7% 4% 12% 4% 7% 10% 7% 4% 8% 7%
Money to start my own business 5% 5% 6% 3% 7% 4% 6% 3% 9% 6% 4% 2% 7% 5% 5% 2%
To get married/lobola 4% 5% 6% 5% 3% 1% 5% 1% 3% 7% 1% 0% 6% 6% 1% 0%
For my studies/own education/further my studies
3% 4% 3% 5% 5% 1% 4% 1% 19% 4% 1% 0% 8% 3% 1% 0%

52
A CLOSER LOOK AT SAVING FOR CHILDREN’S EDUCATION
Insomeinstances,wehaverespondentswitheducationpoliciesbutwhodonotclaimeducationasasavingsobjective,even at a prompted level (although the majority do). We have questioned them further on this issue and many claim that they view their education policy premiums as an expense rather than a saving – in essence an expense in the same way that school fees are an expense. We have constructed a combined measure that includes those who claim education as a savings objectiveand/orhaveaneducationpolicy,andin201945%ofparentsaresavingforchildren’seducation(andbyimplication55% are not).
BROAD EDUCATION MEASURE (BASE = THOSE WITH DEPENDENT
CHILDREN)JUL-13 JUL-14 JUL-15 JUL-16 JUL-17 JUL-18 JUL-19
YES Objective or Policy 44% 40% 40% 46% 43% 43% 45%
Neither 56% 60% 60% 54% 57% 57% 55%
BROAD EDUCATION MEASURE (JULY 2019) (BASE=THOSEWITH
DEPENDENTCHILDREN)
TOTA
L
LESS
TH
AN
R6
00
0
R6
00
0 –
R13
999
R14
00
0 –
R19
999
R20
00
0 –
R40
00
0
R40
00
0+
BLA
CK
WCI
GEN
Y
GEN
X
BA
BY
BO
OM
ER
18 –
30 Y
EAR
S
31 –
39 Y
EAR
S
40 –
49 Y
EAR
S
50+
YEA
RS
YES Objective or Policy 45% 26% 49% 49% 46% 52% 47% 39% 48% 45% 18% 44% 51% 47% 30%
Neither 55% 74% 51% 51% 54% 48% 53% 61% 52% 55% 82% 56% 49% 53% 70%
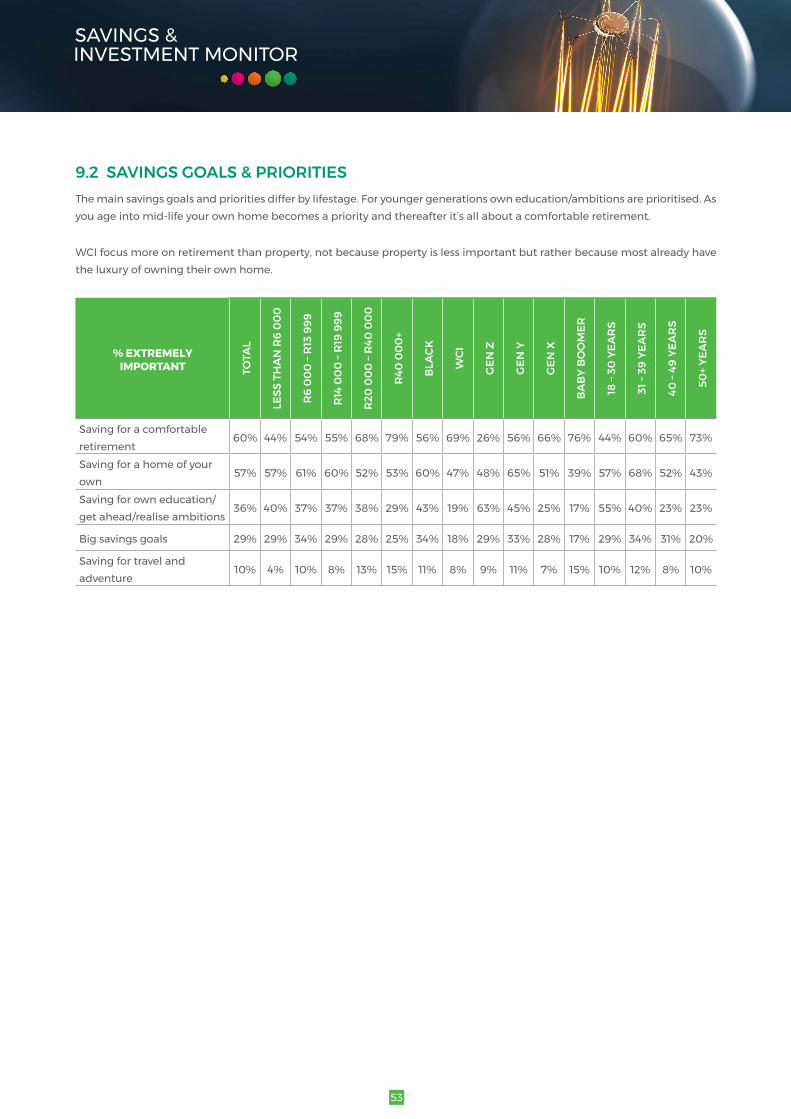
53
9.2 SAVINGS GOALS & PRIORITIESThe main savings goals and priorities differ by lifestage. For younger generations own education/ambitions are prioritised. As youageintomid-lifeyourownhomebecomesapriorityandthereafterit’sallaboutacomfortableretirement.
WCIfocusmoreonretirementthanproperty,notbecausepropertyislessimportantbutratherbecausemostalreadyhavethe luxury of owning their own home.
% EXTREMELY IMPORTANT TO
TAL
LESS
TH
AN
R6
00
0
R6
00
0 –
R13
999
R14
00
0 –
R19
999
R20
00
0 –
R40
00
0
R40
00
0+
BLA
CK
WCI
GEN
Z
GEN
Y
GEN
X
BA
BY
BO
OM
ER
18 –
30 Y
EAR
S
31 –
39 Y
EAR
S
40 –
49 Y
EAR
S
50+
YEA
RS
Saving for a comfortable retirement
60% 44% 54% 55% 68% 79% 56% 69% 26% 56% 66% 76% 44% 60% 65% 73%
Saving for a home of your own
57% 57% 61% 60% 52% 53% 60% 47% 48% 65% 51% 39% 57% 68% 52% 43%
Saving for own education/get ahead/realise ambitions
36% 40% 37% 37% 38% 29% 43% 19% 63% 45% 25% 17% 55% 40% 23% 23%
Big savings goals 29% 29% 34% 29% 28% 25% 34% 18% 29% 33% 28% 17% 29% 34% 31% 20%
Saving for travel and adventure
10% 4% 10% 8% 13% 15% 11% 8% 9% 11% 7% 15% 10% 12% 8% 10%

54
10. SAVINGS AND INVESTMENT VEHICLES10.1 CLASSIFICATION OF SAVINGS AND INVESTMENT VEHICLES USED
SAVINGS AND INVESTMENT VEHICLES JUL-13 JUL-14 JUL-15 JUL-16 JUL-17 JUL-18 JUL-19
Banked cash savings 40% 35% 44% 42% 35% 36% 35%
Informal saving 49% 49% 57% 60% 59% 59% 60%
Informal savings(base=black) 65% 63% 73% 76% 74% 76% 70%
Formal savings products & policies 83% 86% 87% 87% 88% 90% 88%
Investments 5% 8% 7% 8% 3% 6% 9%
Alternative investments 1% 1% 1% 1% 1% 1% 1%
Insurance and precautionary savings 48% 50% 48% 52% 50% 49% 47%
Bonds 1% 3% 2% 5% 2% 1% 1%
10.2 BANKED CASH SAVINGSBanked cash savings have not recovered from the slump seen in 2017.
BANKED CASH SAVINGS JUL-13 JUL-14 JUL-15 JUL-16 JUL-17 JUL-18 JUL-19
Total 40% 35% 44% 42% 35% 36% 35%
Less than R6 000 32% 21% 33% 27% 20% 21% 18%
R6 000 to R13 999 37% 29% 41% 41% 33% 31% 27%
R14 000 to R19 999 38% 36% 44% 45% 35% 37% 33%
R20 000 to R39 999 45% 44% 51% 47% 40% 38% 42%
R40 000 or more 60% 60% 61% 58% 53% 56% 60%

55
10.3 FORMAL SAVINGS PRODUCTSThe sharp increase in savings and investment policies seen in 2016 was almost certainly due to a wording change from “endowmentpolicies”to“SavingsorEndowmentpolicies(i.e.policieswhereyousaveforaspecifictermorgoal”).
In 2017 distinction was made between savings and investment policies and the following are now measured separately:• SavingsPolicy–whereyoupayregularpremiumsoverafixedperiod• Investment Policy – where you make ad hoc payments for any period
2019seesnosignificantchangesinformalpolicyholdingatatotalsamplelevelandfuneralpoliciescontinuetobethemostprevalent of the formal policies with 3 out of 4 working metro households having at least one such policy.
SAVINGS AND INVESTMENT VEHICLES JUL-13 JUL-14 JUL-15 JUL-16 JUL-17 JUL-18 JUL-19
Savings & investment policies 14% 11% 8% 20% 26% 32% 31%
Savings policy Not measured separately 19% 24% 22%
Investment policy Not measured separately 12% 11% 14%
Retirement annuities 20% 24% 23% 25% 30% 27% 26%
Pension or provident fund 56% 57% 53% 51% 53% 50% 48%
Education policies (rebased on those who have dependent children)
19% 27% 27% 26% 25% 25% 24%
Funeral policies 65% 72% 73% 73% 75% 76% 74%
Life assurance/death and disability policies 35% 37% 31% 31% 38% 36% 35%
LIFE INSURANCE
Since2018lifeinsurancehasbeenrecordedinmoredetaili.e.inseparatecomponents:Life,disability,dreaddiseaseandincomeprotection.Allformsoflongterminsurancearestronglycorrelatedwithincome,andtherehavebeennomaterialshifts in the last year.
SAVINGS AND INVESTMENT VEHICLES JUL-13 JUL-14 JUL-15 JUL-16 JUL-17 JUL-18 JUL-19
Life assurance/death and disability policies 35% 37% 31% 31% 38% 36% 35%
Life insurance policies Not measured separately 35% 31%
Disability cover Not measured separately 15% 12%
Dreaded disease/severe illness cover Not measured separately 9% 9%
Income protection policies Not measured separately 3% 4%

56
SAVINGS AND INVESTMENT VEHICLES 2019 TO
TAL
LESS
TH
AN
R6
00
0
R6
00
0 –
R13
999
R14
00
0 –
R19
999
R20
00
0 –
R40
00
0
R40
00
0+
GEN
Z
GEN
Y
GEN
X
BA
BY
BO
OM
ER
Life insurance policies 31% 5% 14% 25% 53% 67% 8% 25% 39% 48%
Disability cover 12% 0% 3% 8% 16% 36% 3% 10% 13% 28%
Dreaded disease/severe illness cover 9% 0% 3% 6% 9% 27% 0% 7% 11% 19%
Income protection policies 4% 0% 0% 1% 4% 16% 0% 2% 6% 11%
RETIREMENT PRODUCTS
When looking at the incidence of occupational retirement funds it is important to keep in mind that membership is largely afunctionofwhereoneworksandwhetherornotthisisofferedasanemployeebenefitbytheemployer.Oftenwheretheseareinplace,fundmembershipiscompulsoryforfulltimeemployeesandassuchpensionandprovidentfundsarenotreallydiscretionary in nature.
IncidenceofbothprivateRA’sandoccupationalretirementfundsisdownmarginallyon2018,with58%ofworkingmetrohouseholds have some form of formal retirement provision.
RETIREMENT PRODUCTS JUL-13 JUL-14 JUL-15 JUL-16 JUL-17 JUL-18 JUL-19
Have pension or prov fund 56% 57% 53% 51% 53% 50% 48%
Have RA 20% 24% 23% 25% 30% 27% 26%
Have fund and RA 14% 15% 13% 17% 23% 18% 16%
Have neither 38% 34% 38% 41% 40% 40% 42%
Have either fund OR RA 62% 66% 62% 59% 60% 60% 58%
The incidence of formal retirement provision climbs with both age and income (bearing in mind that age and income in themselves are positively correlated with higher income groups having an older bias).

57
RETIREMENT PRODUCTS JUL-13 JUL-14 JUL-15 JUL-16 JUL-17 JUL-18 JUL-19
Less than R6 000
Consumption/living expenses 65% 72% 76% 71% 71% 79% 73%
Debt servicing 14% 14% 10% 13% 13% 8% 12%
Insurance and medical aid 1% 1% 0% 1% 1% 0% 0%
Savings 20% 13% 14% 15% 15% 13% 14%
Less than R6 000
Have pension or prov fund 41% 39% 26% 26% 19% 14% 25%
Have RA 4% 4% 0% 2% 5% 2% 3%
Have fund and RA 3% 2% 0% 1% 2% 0% 2%
Have neither 58% 58% 73% 73% 78% 85% 73%
Have either fund OR RA 42% 42% 27% 27% 22% 15% 27%
R6 000 to R13 999
Have pension or prov fund 59% 57% 57% 47% 50% 48% 46%
Have RA 13% 13% 13% 10% 19% 13% 12%
Have fund and RA 9% 10% 8% 7% 14% 10% 9%
Have neither 37% 39% 37% 50% 46% 49% 51%
Have either fund OR RA 63% 61% 63% 50% 54% 51% 49%
R14 000 to R19 999
Have pension or prov fund 64% 70% 62% 61% 64% 57% 60%
Have RA 21% 23% 24% 28% 24% 25% 19%
Have fund and RA 16% 18% 14% 20% 21% 17% 15%
Have neither 31% 25% 29% 31% 33% 35% 35%
Have either fund OR RA 69% 75% 71% 69% 67% 65% 65%
R20 000 to R39 999
Have pension or prov fund 64% 69% 66% 66% 73% 65% 65%
Have RA 36% 42% 36% 42% 52% 44% 36%
Have fund and RA 25% 28% 22% 28% 42% 29% 25%
Have neither 25% 16% 20% 20% 17% 19% 25%
Have either fund OR RA 75% 84% 80% 80% 83% 81% 75%
R40 000 or more
Have pension or prov fund 59% 54% 59% 65% 69% 64% 57%
Have RA 54% 63% 65% 58% 59% 56% 62%
Have fund and RA 32% 29% 35% 39% 44% 32% 35%
Have neither 19% 12% 12% 16% 16% 12% 16%
Have either fund OR RA 81% 88% 88% 84% 84% 88% 84%
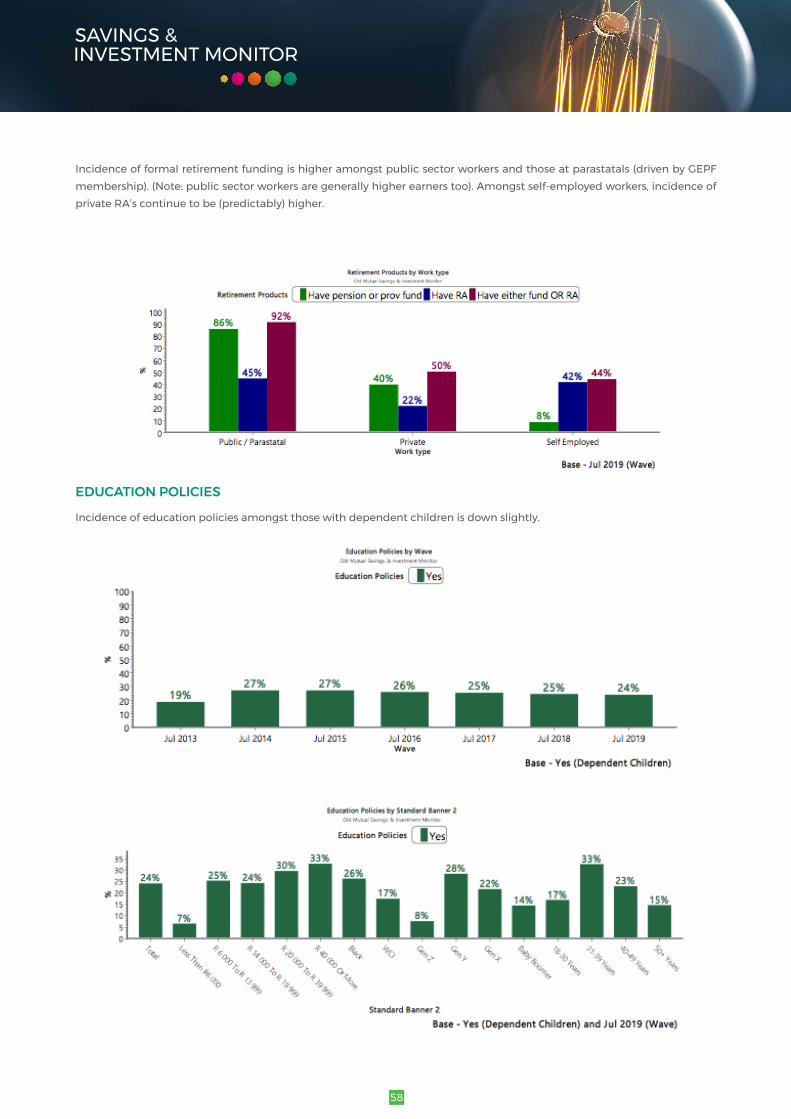
58
Incidence of formal retirement funding is higher amongst public sector workers and those at parastatals (driven by GEPF membership).(Note:publicsectorworkersaregenerallyhigherearnerstoo).Amongstself-employedworkers,incidenceofprivate RA’s continue to be (predictably) higher.
EDUCATION POLICIES
Incidence of education policies amongst those with dependent children is down slightly.
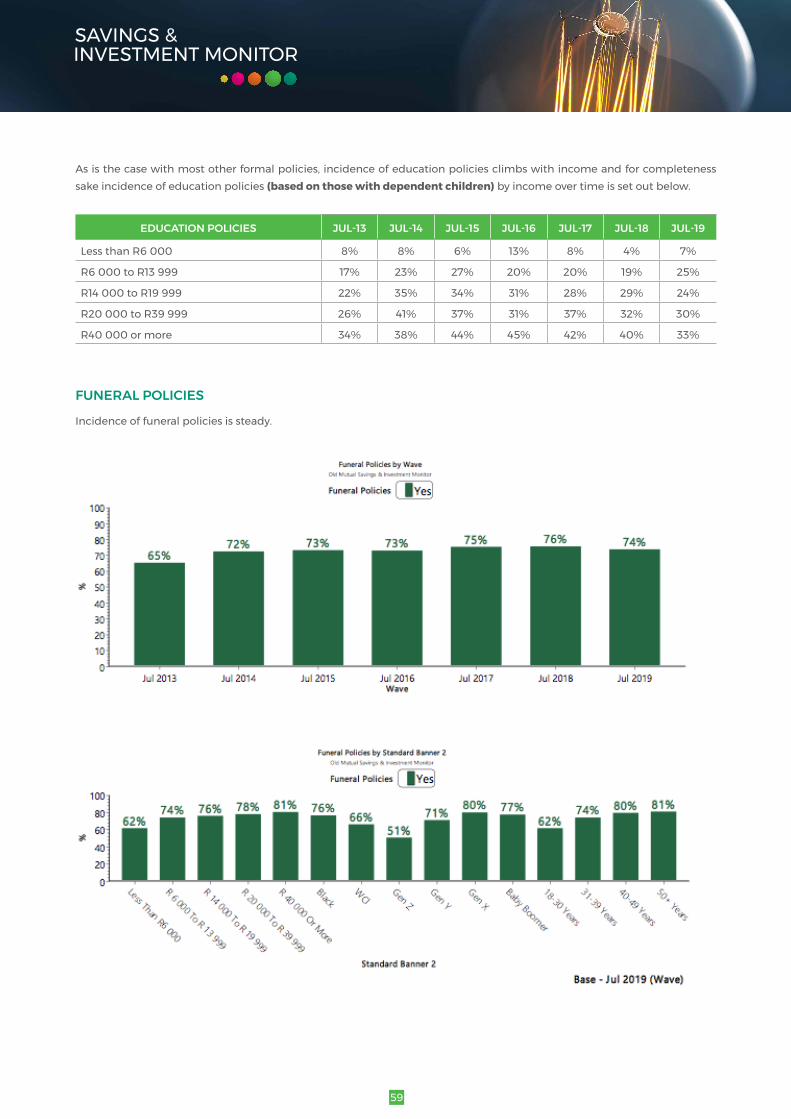
59
Asisthecasewithmostotherformalpolicies,incidenceofeducationpoliciesclimbswithincomeandforcompletenesssake incidence of education policies (based on those with dependent children) by income over time is set out below.
EDUCATION POLICIES JUL-13 JUL-14 JUL-15 JUL-16 JUL-17 JUL-18 JUL-19
Less than R6 000 8% 8% 6% 13% 8% 4% 7%
R6 000 to R13 999 17% 23% 27% 20% 20% 19% 25%
R14 000 to R19 999 22% 35% 34% 31% 28% 29% 24%
R20 000 to R39 999 26% 41% 37% 31% 37% 32% 30%
R40 000 or more 34% 38% 44% 45% 42% 40% 33%
FUNERAL POLICIES
Incidence of funeral policies is steady.

60
10.4 INFORMAL SAVINGS Unbankedcashsavingsareupmarginally.
INFORMAL SAVINGS: TOTAL SAMPLE JUL-13 JUL-14 JUL-15 JUL-16 JUL-17 JUL-18 JUL-19
Savings club or stokvel 34% 32% 43% 42% 40% 44% 45%
Burial society 24% 21% 26% 26% 25% 20% 23%
Funeral parlour cover Not measured 23% 29% 31%
Grocery scheme 8% 8% 11% 13% 11% 10% 10%
Cashsavings-notbanked 5% 9% 6% 17% 10% 13% 13%
GiventhattheseinformalsavingsvehiclesaregenerallytheambitofBlackhouseholds(althoughnotexclusivelyso),wehavefilteredtheresultssoastolookattheresultswithinBlackhouseholds.In2019,70%ofblackworkingmetrohouseholdshaveat leastonetypeof informalsavingsproducti.e.stokvel,burialsociety,groceryschemeorunbankedcash. (Funeralparlourcoverisnotincludedinthedefinitionasthishybridstraddlesformalandinformalmarkets).
Informal savings are seen across all income groups but are more prevalent with age.
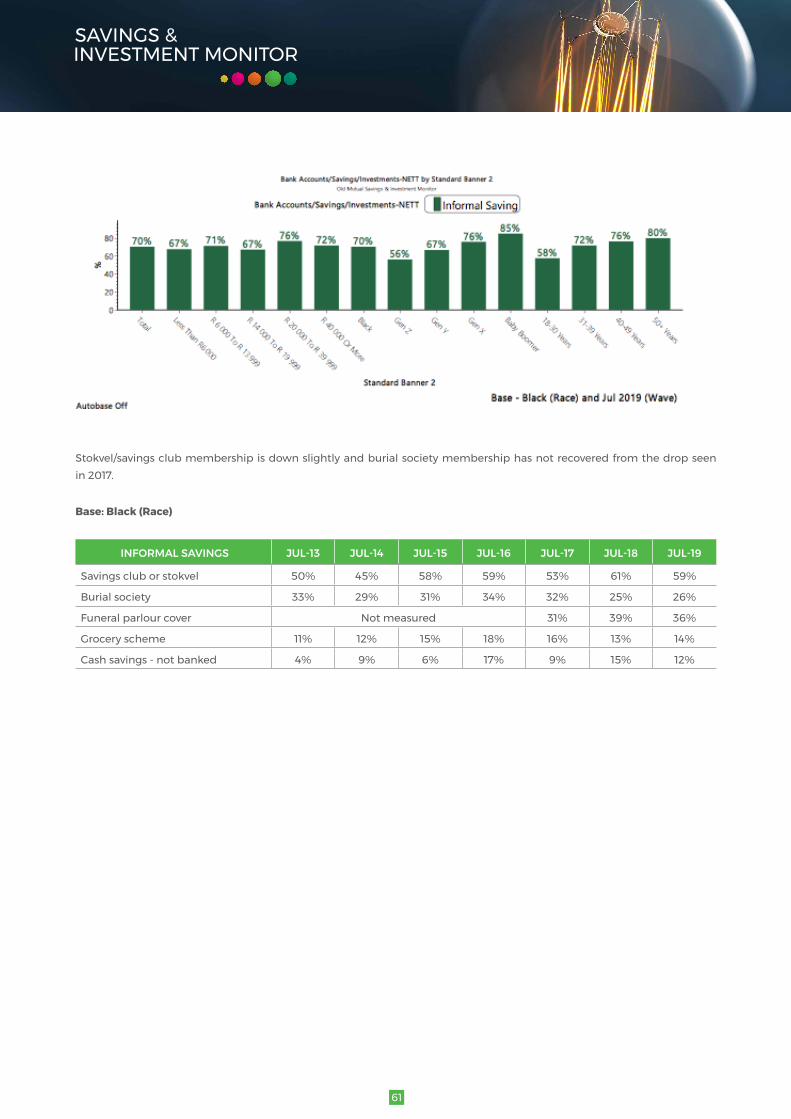
61
Stokvel/savings club membership is down slightly and burial society membership has not recovered from the drop seen in 2017.
Base:Black(Race)
INFORMAL SAVINGS JUL-13 JUL-14 JUL-15 JUL-16 JUL-17 JUL-18 JUL-19
Savings club or stokvel 50% 45% 58% 59% 53% 61% 59%
Burial society 33% 29% 31% 34% 32% 25% 26%
Funeral parlour cover Not measured 31% 39% 36%
Grocery scheme 11% 12% 15% 18% 16% 13% 14%
Cashsavings-notbanked 4% 9% 6% 17% 9% 15% 12%
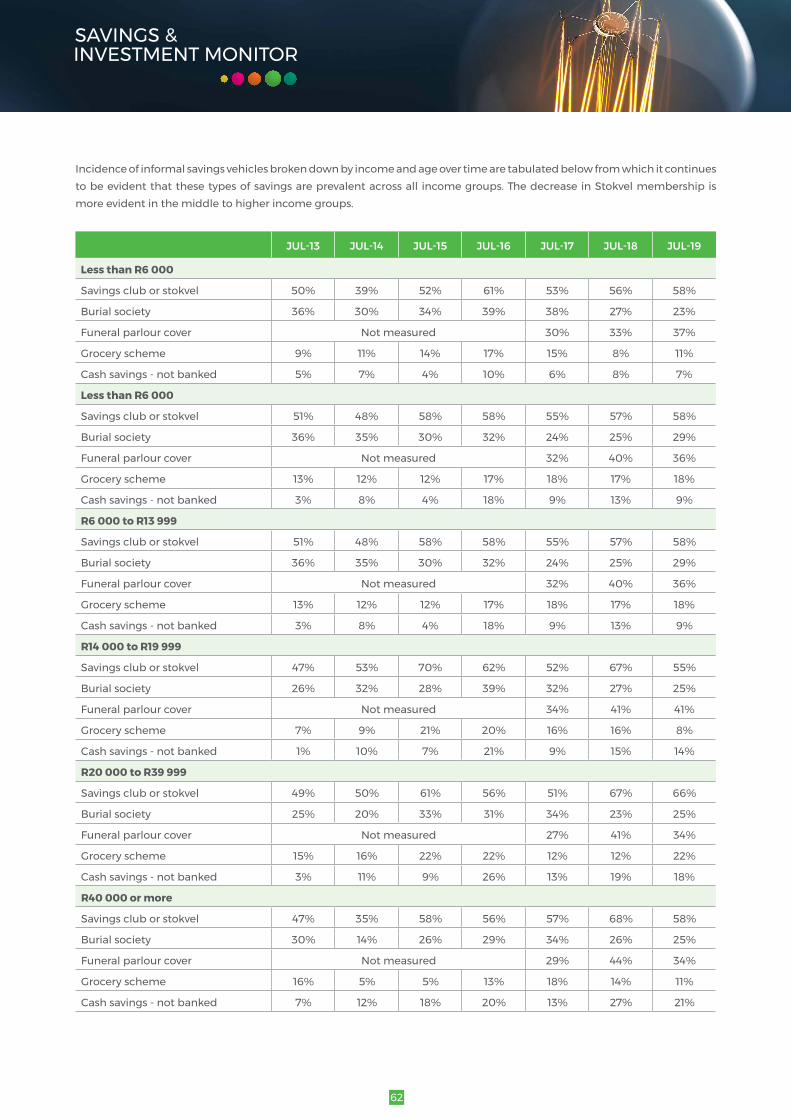
62
Incidence of informal savings vehicles broken down by income and age over time are tabulated below from which it continues to be evident that these types of savings are prevalent across all income groups. The decrease in Stokvel membership is more evident in the middle to higher income groups.
JUL-13 JUL-14 JUL-15 JUL-16 JUL-17 JUL-18 JUL-19
Less than R6 000
Savings club or stokvel 50% 39% 52% 61% 53% 56% 58%
Burial society 36% 30% 34% 39% 38% 27% 23%
Funeral parlour cover Not measured 30% 33% 37%
Grocery scheme 9% 11% 14% 17% 15% 8% 11%
Cashsavings-notbanked 5% 7% 4% 10% 6% 8% 7%
Less than R6 000
Savings club or stokvel 51% 48% 58% 58% 55% 57% 58%
Burial society 36% 35% 30% 32% 24% 25% 29%
Funeral parlour cover Not measured 32% 40% 36%
Grocery scheme 13% 12% 12% 17% 18% 17% 18%
Cashsavings-notbanked 3% 8% 4% 18% 9% 13% 9%
R6 000 to R13 999
Savings club or stokvel 51% 48% 58% 58% 55% 57% 58%
Burial society 36% 35% 30% 32% 24% 25% 29%
Funeral parlour cover Not measured 32% 40% 36%
Grocery scheme 13% 12% 12% 17% 18% 17% 18%
Cashsavings-notbanked 3% 8% 4% 18% 9% 13% 9%
R14 000 to R19 999
Savings club or stokvel 47% 53% 70% 62% 52% 67% 55%
Burial society 26% 32% 28% 39% 32% 27% 25%
Funeral parlour cover Not measured 34% 41% 41%
Grocery scheme 7% 9% 21% 20% 16% 16% 8%
Cashsavings-notbanked 1% 10% 7% 21% 9% 15% 14%
R20 000 to R39 999
Savings club or stokvel 49% 50% 61% 56% 51% 67% 66%
Burial society 25% 20% 33% 31% 34% 23% 25%
Funeral parlour cover Not measured 27% 41% 34%
Grocery scheme 15% 16% 22% 22% 12% 12% 22%
Cashsavings-notbanked 3% 11% 9% 26% 13% 19% 18%
R40 000 or more
Savings club or stokvel 47% 35% 58% 56% 57% 68% 58%
Burial society 30% 14% 26% 29% 34% 26% 25%
Funeral parlour cover Not measured 29% 44% 34%
Grocery scheme 16% 5% 5% 13% 18% 14% 11%
Cashsavings-notbanked 7% 12% 18% 20% 13% 27% 21%

63
NUMBER OF INFORMAL SCHEMES HOUSEHOLDS BELONG TO
InJuly2014measureweaddedaquestiontobetterunderstandthenumberof stokvels/informalsavingsschemesthathouseholds belong to. Most (86%) only belong to ONE scheme of a particular type.
NO. OF SCHEMES - STOKVEL/ SAVINGS CLUB (DETAIL) BASE = BLACK JUL-14 JUL-15 JUL-16 JUL-17 JUL-18 JUL-19
UnweightedNumbers 277 358 400 364 428 401
1 73% 68% 74% 73% 89% 86%
2 22% 28% 23% 24% 10% 12%
3 3% 4% 2% 3% 0% 1%
4 1% 0% 0% 1% 0% 0%
Amongstmembersofburialsocieties,2019seesasmallincreaseinmultiplemembership(althoughthevastmajorityonlybelong to one burial society).
NO. OF SCHEMES - BURIAL SOCIETY BASE = BLACK JUL-14 JUL-15 JUL-16 JUL-17 JUL-18 JUL-19
UnweightedNumbers 180 191 237 219 177 173
1 88% 84% 90% 96% 98% 83%
2 11% 13% 9% 4% 1% 17%
3 1% 3% 0% 0% 1% 0%
Amongst grocery scheme members the incidence on multiple membership remains negligible.
NO. OF SCHEMES - GROCERY SCHEME BASE = BLACK JUL-14 JUL-15 JUL-16 JUL-17 JUL-18 JUL-19
UnweightedNumbers 67 89 121 107 91 92
1 98% 99% 98% 99% 96% 95%
2 0% 1% 2% 1% 3% 4%
3 2% 0% 0% 0% 0% 2%
4 0% 0% 0% 0% 0% 0%
5 0% 0% 0% 0% 1% 0%

64
CONTRIBUTION RATES
Respondents were asked how much they contribute to the informal schemes that they belong to. The average monthly (or equivalent) amount contributed to a stokvel or savings club by black households has increased to R859 (NB this is the average – there are big variations within this).
Contribution rates climb sharply with income. Worth noting that the increase in contributions is most evident at top end (R40000+)butlookingbackfurtherthismayjustbearecovery.
TOTAL CONTRIBUTION - STOKVEL/SAVINGS CLUB (BASE BLACK) JUL-14 JUL-15 JUL-16 JUL-17 JUL-18 JUL-19
Total 683 723 765 761 711 869
Less than R6 000 405 366 425 339 372 543
R6 000 To R 13 999 663 633 609 622 630 805
R14 000 to R19 999 602 922 824 978 796 765
R20 000 to R39 999 961 967 1 106 1 085 873 992
R40 000 or more 1 315 1 631 1 914 1 636 1 128 1 734

65
Lookingatburialsocieties,theamountsinvolvedaremuchlowerbuttherehasbeenanincreaseinaveragecontributionrates (in line with the increase in multiple membership seen in 2019).
Asregardsgroceryschemes,Blackhouseholds’averagecontributiontogroceryschemescontinuestoincrease,probablyinanattempttokeepupwithfoodpriceinflation.

66
STOKVEL FORM AND STRUCTURE
In2018,StokvelmemberswereaskedtodescribetheformorstructureoftheirStokvelorclub,bychoosingwhichformbestdescribestheirStokvel(orbydescribingthestructureifneitheroftheoptionsbelowfit):• Ashorttermrotatingsavingsclub/Stokvel-eachmembergetsaturntoreceivealumpsumofthecontributionsatleastonceinthelifetimeofthestokvel.Thelifetimeistypicallysixmonthsorayear,dependingonthenumberofmembers.
• An investment club, where members contribute to the investment club on a monthly basis (usually), raising the capital to fund an investment in longer term assets
InlinewiththemassnatureoftheSIMsample,thevastmajority(91%)ofBlackStokvelmembersdescribetheirStokvelasatraditional rotating Stokvel (even more so than in 2018).
DESCRIPTION OF STOKVEL - TOTAL JUL-18 JUL-19
A short term rotating savings club/stokvel 74% 91%
An investment club 29% 11%
INVESTMENT OF STOKVEL ASSETS
In2019,inoverhalfofcases,themoneyisheldincashratherthanbanked(inlinewiththemoretraditionalprofileofstokvelsmeasured in 2019). When it is banked it is generally banked in the name of the Stokvel (47%) rather than in a member’s name (8%). Incidence of any other type of investment such as a formal policy or equities is negligible.
STOKVEL ASSETS INVESTED - TOTAL JUL-18 JUL-19
Held in cash 34% 54%
In a bank account in the name of the stokvel 52% 47%
In a bank account in a members name 17% 8%

67
Aswouldbeexpected,cashholdingsaremorecommonfortraditionalstokvelsandbankaccountsinthenameoftheclubmore prevalent for investment clubs.
STOKVEL ASSETS INVESTED (BLACK)A SHORT TERM ROTATING SAVINGS CLUB/STOKVEL AN INVESTMENT CLUB
2018 2019 2018 2019
Held in cash 41% 59% 18% 19%
In a bank account in a members name 16% 7% 21% 17%
In a bank account in the name of the stokvel 47% 44% 70% 80%
PURPOSE SPECIFIC STOKVELS
In 2019 we explored the purpose of the stokvels recorded – was there a common purpose that members were saving for and ifso,whatwasthatpurpose?Inmostcasestheseweretheusualrotatingsavingsclubswhereeachmembersavesfortheirownreasons.Themostprevalentgoalspecificstokvelsarethoseaimedatsavingforeducationrelateditemssuchasschooluniforms,stationery,booksandthelike;aswellasthosesavingforspecialoccasions(likeweddings).
Property stokvels are an emerging trend and a booster sample of property stokvel members was secured for SIM 2019. Those property stokvel results are reported on separately.
PURPOSE OF CLUB/STOKVEL - TOTAL TOTAL 2019
Notsavingforspecificpurpose,eachmemberhasownreasons 76%
School expenses 12%
For special occasions/events 10%
Funeral expenses 9%
Travel 3%
Property/building/land 3%
December and january expenses 2%
Forthefewtravelstokvelsthatemergedweexploredintendedtraveldestinations.Thesetendedtobelocal(mainlyKZN).
10.5 PRECAUTIONARY SAVINGSIncidenceofbothshortterminsuranceandmedicalaidaredownsomewhatin2019,withdeclinesevidentinallincomegroupsotherthanR40000+.
JUL-13 JUL-14 JUL-15 JUL-16 JUL-17 JUL-18 JUL-19
Short Term Insurance 30% 30% 31% 33% 38% 38% 35%
Medical Insurance/Medical Aid 42% 44% 41% 45% 42% 44% 41%

68
JUL-13 JUL-14 JUL-15 JUL-16 JUL-17 JUL-18 JUL-19
Less than R6 000
Short Term Insurance 3% 2% 1% 1% 1% 1% 1%
Medical Insurance/Medical Aid 13% 10% 2% 8% 5% 1% 2%
R6 000 to R13 999
Short Term Insurance 17% 14% 16% 14% 19% 14% 12%
Medical Insurance/Medical Aid 35% 31% 33% 29% 26% 23% 22%
R14 000 to R19 999
Short Term Insurance 34% 33% 30% 36% 43% 36% 28%
Medical Insurance/Medical Aid 51% 59% 52% 56% 44% 44% 42%
R20 000 to R39 999
Short Term Insurance 61% 52% 58% 59% 66% 64% 60%
Medical Insurance/Medical Aid 68% 73% 66% 71% 71% 70% 66%
R40 000 or more
Short Term Insurance 79% 80% 80% 76% 86% 80% 82%
Medical Insurance/Medical Aid 79% 76% 81% 84% 85% 83% 85%
10.6 EQUITY BASED INVESTMENTSEquity based investments (such as shares, unit trust and exchange traded funds) remain the ambit of higher earninghouseholds and have increased year on year.
JUL-13 JUL-14 JUL-15 JUL-16 JUL-17 JUL-18 JUL-19
UnitTrusts/MutualFunds/ETF's 2% 6% 5% 5% 3% 5% 7%
Listed Shares 3% 3% 3% 3% 1% 2% 3%
JUL-13 JUL-14 JUL-15 JUL-16 JUL-17 JUL-18 JUL-19
Less than R6 000
UnitTrusts/MutualFunds/ETF's 2% 0% 0% 0% 1% 0% 1%
Listed Shares 0% 1% 0% 0% 0% 0% 0%
R6 000 to R13 999
UnitTrusts/MutualFunds/ETF's 1% 2% 0% 2% 1% 1% 3%
Listed Shares 1% 1% 1% 0% 0% 1% 1%
R14 000 to R19 999
UnitTrusts/MutualFunds/ETF's 1% 3% 3% 5% 1% 4% 3%
Listed Shares 1% 4% 1% 2% 0% 0% 0%
R20 000 to R39 999
UnitTrusts/MutualFunds/ETF's 3% 10% 7% 9% 5% 7% 10%
Listed Shares 4% 3% 3% 5% 1% 1% 4%
R40 000 or more
UnitTrusts/MutualFunds/ETF's 9% 18% 22% 14% 5% 14% 16%
Listed Shares 14% 15% 15% 13% 5% 7% 9%
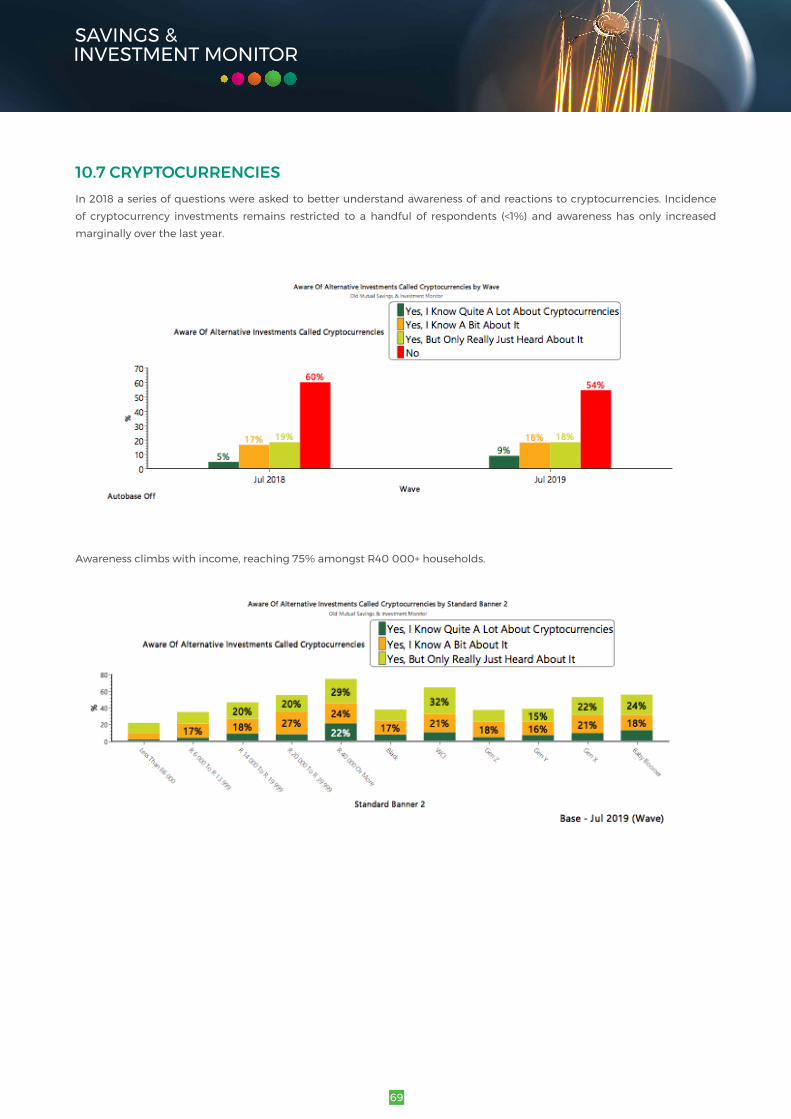
69
10.7 CRYPTOCURRENCIESIn 2018 a series of questions were asked to better understand awareness of and reactions to cryptocurrencies. Incidence of cryptocurrency investments remains restricted to a handful of respondents (<1%) and awareness has only increasedmarginally over the last year.
Awarenessclimbswithincome,reaching75%amongstR40000+households.
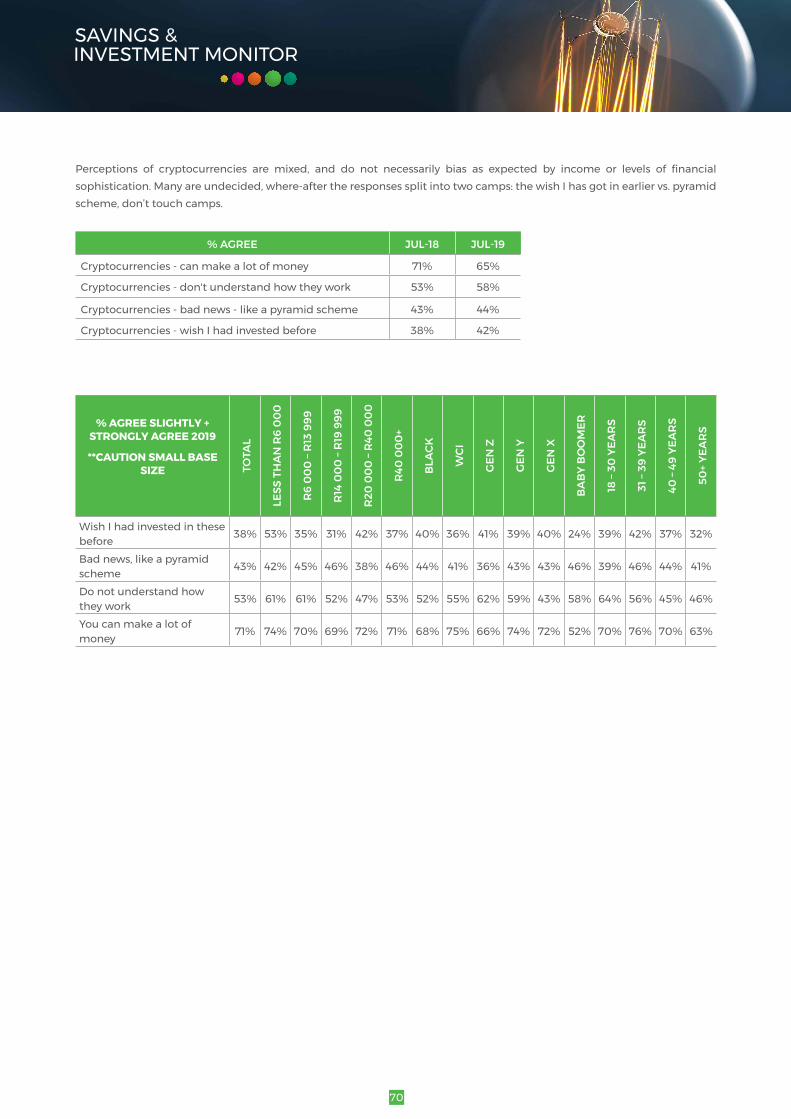
70
Perceptions of cryptocurrencies are mixed, and do not necessarily bias as expected by income or levels of financialsophistication.Manyareundecided,where-aftertheresponsessplitintotwocamps:thewishIhasgotinearliervs.pyramidscheme,don’ttouchcamps.
% AGREE JUL-18 JUL-19
Cryptocurrencies-canmakealotofmoney 71% 65%
Cryptocurrencies-don'tunderstandhowtheywork 53% 58%
Cryptocurrencies-badnews-likeapyramidscheme 43% 44%
Cryptocurrencies-wishIhadinvestedbefore 38% 42%
% AGREE SLIGHTLY + STRONGLY AGREE 2019
**CAUTION SMALL BASE SIZE TO
TAL
LESS
TH
AN
R6
00
0
R6
00
0 –
R13
999
R14
00
0 –
R19
999
R20
00
0 –
R40
00
0
R40
00
0+
BLA
CK
WCI
GEN
Z
GEN
Y
GEN
X
BA
BY
BO
OM
ER
18 –
30 Y
EAR
S
31 –
39 Y
EAR
S
40 –
49 Y
EAR
S
50+
YEA
RS
Wish I had invested in these before 38% 53% 35% 31% 42% 37% 40% 36% 41% 39% 40% 24% 39% 42% 37% 32%
Badnews,likeapyramidscheme 43% 42% 45% 46% 38% 46% 44% 41% 36% 43% 43% 46% 39% 46% 44% 41%
Do not understand how they work 53% 61% 61% 52% 47% 53% 52% 55% 62% 59% 43% 58% 64% 56% 45% 46%
You can make a lot of money 71% 74% 70% 69% 72% 71% 68% 75% 66% 74% 72% 52% 70% 76% 70% 63%
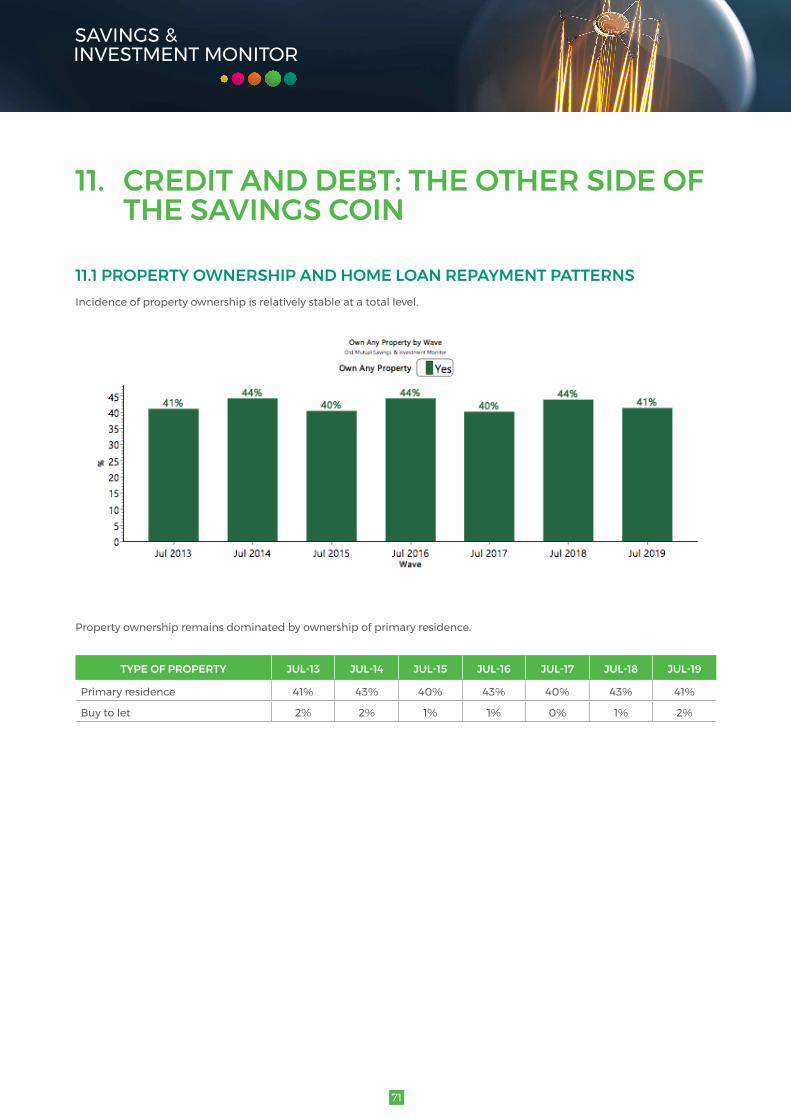
71
11. CREDIT AND DEBT: THE OTHER SIDE OF THE SAVINGS COIN
11.1 PROPERTY OWNERSHIP AND HOME LOAN REPAYMENT PATTERNSIncidence of property ownership is relatively stable at a total level.
Property ownership remains dominated by ownership of primary residence.
TYPE OF PROPERTY JUL-13 JUL-14 JUL-15 JUL-16 JUL-17 JUL-18 JUL-19
Primary residence 41% 43% 40% 43% 40% 43% 41%
Buy to let 2% 2% 1% 1% 0% 1% 2%

72
Home ownership remains strongly correlated to income level and age.
Incidence of home loans amongst those who own their primary residence has increased marginally with 44% of home owners paying a bond.

73
Themajorityofbondholderscontinuetoonlypaytheminimumbondinstalmentrequired,butmostoftheincrease(seenin 2018) in those paying in extra every month has been maintained.
PRIMARY RESIDENCE JUL-13 JUL-14 JUL-15 JUL-16 JUL-17 JUL-18 JUL-19
UnweightedNumbers 188 189 137 192 169 173 181
FINANCIAL STRESS
Struggle to meet 4% 2% 3% 5% 4% 0% 1%
Can no longer afford to pay extra 2% 2% 3% 3% 2% 1% 4%
Recent advance 0% 1% 2% 2% 1% 0% 1%
Re-negotiatedduetofinancialpressure
2% 0% 1% 2% 0% 1% 1%
MINIMUM ONLY
Pay minimum only 54% 63% 65% 67% 77% 71% 66%
TRYING TO PAY OFF FASTER
Pay extra every month 31% 28% 18% 14% 12% 23% 20%
Extra lump sums 8% 5% 9% 7% 4% 3% 5%
As has been the case historically incidence of extra repayments climbs with income (Caution small base sizes in lower income groups).
2019 TOTAL (AUTOBASE)
R6 000 – R13 999
R14 000 – R19 999
R20 000 – R40 000 R40 000+
UnweightedNumbers n=181 n=11 n=23 n=57 n=90
FINANCIAL STRESS
Struggle to meet 1% 3% 0% 1% 1%
Can no longer afford to pay extra 4% 0% 0% 3% 5%
Recent advance 1% 0% 5% 0% 1%
Re-negotiatedduetofinancialpressure
1% 0% 0% 0% 1%
MINIMUM ONLY
Pay minimum only 66% 65% 85% 75% 61%
TRYING TO PAY OFF FASTER
Pay extra every month 20% 11% 10% 15% 25%
Extra lump sums 5% 0% 0% 4% 7%

74
11.2 PRIMARY RESIDENCE AS PART OF RETIREMENT FUNDINGOnceagainWCIconsumersaresignificantlymorelikelytoviewtheirhomeassometypeofretirementnestegg.
Note than approximately 1 in 5 haven’t really thought about it.
PRIMARY RESIDENCE AS NEST EGG JUL-13 JUL-14 JUL-15 JUL-16 JUL-17 JUL-18 JUL-19
Will rely on it heavily expect it to provide the majority of my retirement funding
9% 8% 9% 12% 6% 5% 7%
Will rely on it to some extent to provide some of my retirement funding
21% 18% 26% 29% 21% 33% 23%
Won't rely on it at all (or hardly at all) 54% 53% 47% 41% 53% 44% 49%
Don'tknow-haven'treallythoughtabout it
16% 21% 16% 17% 19% 18% 19%
2019 TOTALLESS THAN
R6 000
R6 000 – R13 999
R14 000 – R19 999
R20 000 – R40 000 R40 000+ BLACK WCI
Unweightednumbers 398 49 53 54 103 139 256 142
Will rely on it heavily expect it to provide the majority of my retirement funding
7% 12% 5% 16% 8% 5% 8% 7%
Will rely on it to some extent to provide some of my retirement funding
23% 14% 16% 25% 25% 28% 16% 35%
Won't rely on it at all (or hardly at all) 49% 46% 60% 51% 45% 47% 53% 44%
Don'tknow-haven'treally thought about it 19% 27% 14% 8% 22% 19% 22% 15%
11.3 CREDIT CARDS AND STORE CARDSAt a total sample level the incidence of both credit cards and store cards is down on 2018.

75
CREDIT CARDS
Incidenceofcreditcardsremainsstronglypositivelycorrelatedwithincome,buttotheextentthatdecreasesinincidencehaveoccurred,thishasbeenR20000–R39999especially.
CREDIT CARD JUL-13 JUL-14 JUL-15 JUL-16 JUL-17 JUL-18 JUL-19
Less than R6 000 6% 6% 2% 6% 2% 1% 1%
R6 000 to R13 999 19% 19% 20% 19% 20% 11% 13%
R14 000 to R19 999 39% 39% 30% 32% 27% 28% 22%
R20 000 to R39 999 52% 57% 50% 52% 50% 53% 41%
R40 000 or more 66% 73% 69% 64% 70% 71% 66%
Lookingatrepaymentpatterns,only16%paytheircreditcardoffinfullattheendofthemonthwhichisanimprovement,however these have come from the camp that pay in extra and we still have 56% that pay the minimum only.
REPAYMENT PATTERN - CREDIT CARD JUL-13 JUL-14 JUL-15 JUL-16 JUL-17 JUL-18 JUL-19
Pay in full at the end of each month 13% 19% 12% 13% 11% 10% 16%
Pay required minimum plus extra each month
30% 30% 40% 26% 40% 36% 27%
Pay minimum instalment only 55% 50% 43% 58% 48% 54% 56%
Pay irregularly/only when I can 1% 1% 3% 3% 1% 1% 1%
REPAYMENT PATTERN - CREDIT CARD JUL-13 JUL-14 JUL-15 JUL-16 JUL-17 JUL-18 JUL-19
R14 000 to R19 999
Pay in full at the end of each month 8% 17% 8% 7% 8% 6% 12%
Pay required minimum plus extra each month 26% 27% 39% 19% 36% 30% 16%
Pay minimum instalment only 66% 52% 46% 67% 50% 65% 67%
Pay irregularly/only when I can 0% 4% 7% 8% 5% 0% 3%
R20 000 to R39 999
Pay in full at the end of each month 15% 18% 13% 10% 12% 8% 12%
Pay required minimum plus extra each month 32% 31% 41% 26% 41% 37% 25%
Pay minimum instalment only 51% 49% 43% 60% 47% 55% 62%
Pay irregularly/only when I can 0% 2% 2% 3% 0% 0% 1%
R40 000 or more
Pay in full at the end of each month 22% 26% 14% 21% 13% 12% 21%
Pay required minimum plus extra each month 41% 35% 52% 32% 50% 37% 32%
Pay minimum instalment only 36% 39% 34% 45% 37% 51% 46%
Pay irregularly/only when I can 1% 0% 0% 1% 0% 0% 1%
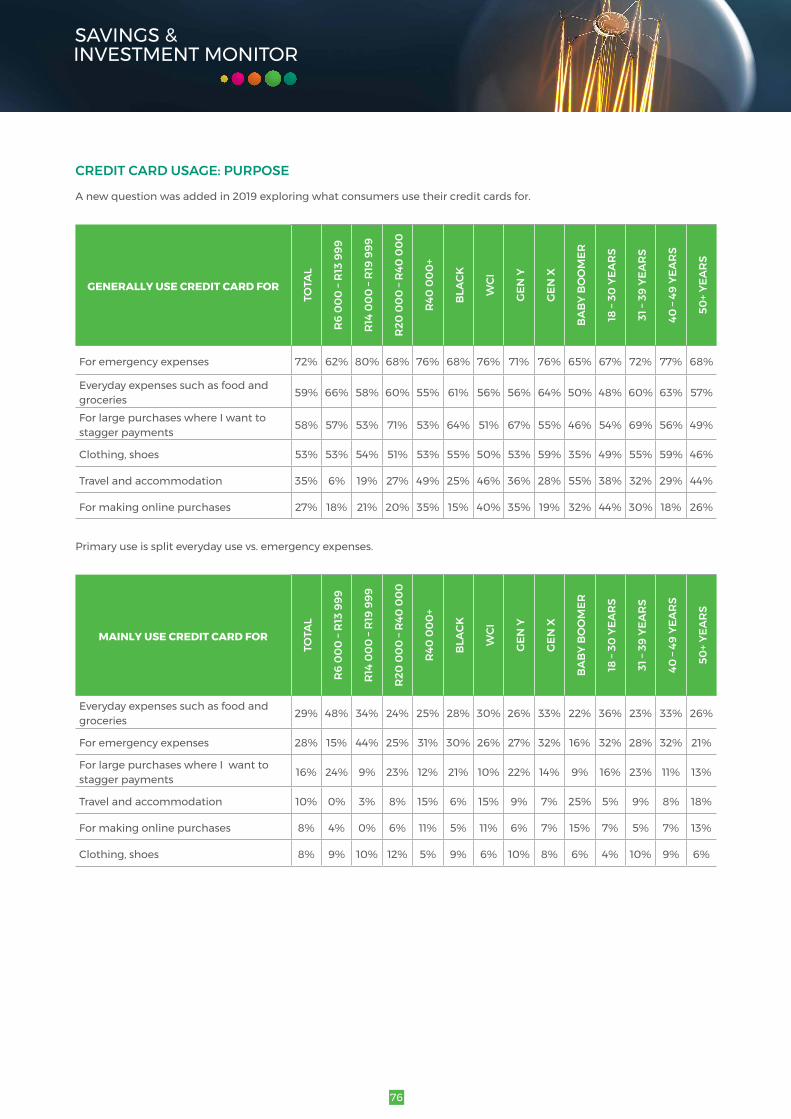
76
CREDIT CARD USAGE: PURPOSE
A new question was added in 2019 exploring what consumers use their credit cards for.
GENERALLY USE CREDIT CARD FOR
TOTA
L
R6
00
0 –
R13
999
R14
00
0 –
R19
999
R20
00
0 –
R40
00
0
R40
00
0+
BLA
CK
WCI
GEN
Y
GEN
X
BA
BY
BO
OM
ER
18 –
30 Y
EAR
S
31 –
39 Y
EAR
S
40 –
49 Y
EAR
S
50+
YEA
RS
For emergency expenses 72% 62% 80% 68% 76% 68% 76% 71% 76% 65% 67% 72% 77% 68%
Everyday expenses such as food and groceries 59% 66% 58% 60% 55% 61% 56% 56% 64% 50% 48% 60% 63% 57%
For large purchases where I want to stagger payments 58% 57% 53% 71% 53% 64% 51% 67% 55% 46% 54% 69% 56% 49%
Clothing,shoes 53% 53% 54% 51% 53% 55% 50% 53% 59% 35% 49% 55% 59% 46%
Travel and accommodation 35% 6% 19% 27% 49% 25% 46% 36% 28% 55% 38% 32% 29% 44%
For making online purchases 27% 18% 21% 20% 35% 15% 40% 35% 19% 32% 44% 30% 18% 26%
Primary use is split everyday use vs. emergency expenses.
MAINLY USE CREDIT CARD FOR
TOTA
L
R6
00
0 –
R13
999
R14
00
0 –
R19
999
R20
00
0 –
R40
00
0
R40
00
0+
BLA
CK
WCI
GEN
Y
GEN
X
BA
BY
BO
OM
ER
18 –
30 Y
EAR
S
31 –
39 Y
EAR
S
40 –
49 Y
EAR
S
50+
YEA
RS
Everyday expenses such as food and groceries 29% 48% 34% 24% 25% 28% 30% 26% 33% 22% 36% 23% 33% 26%
For emergency expenses 28% 15% 44% 25% 31% 30% 26% 27% 32% 16% 32% 28% 32% 21%
For large purchases where I want to stagger payments 16% 24% 9% 23% 12% 21% 10% 22% 14% 9% 16% 23% 11% 13%
Travel and accommodation 10% 0% 3% 8% 15% 6% 15% 9% 7% 25% 5% 9% 8% 18%
For making online purchases 8% 4% 0% 6% 11% 5% 11% 6% 7% 15% 7% 5% 7% 13%
Clothing,shoes 8% 9% 10% 12% 5% 9% 6% 10% 8% 6% 4% 10% 9% 6%

77
CREDIT CARD USAGE: PURPOSE
Lookingatcreditcardusagebyrepaymentpatternitisevidentthatcreditisbeingusedtofinanceeverydaypurchases,notjust emergencies and large ticket items. Looking at the table below we see that only 18% of those who use their credit card mainly for everyday purchases like groceries pay their card off in full at the end of the month.
REPAYMENT PATTERN-CREDIT
CARDTOTAL
EVERYDAY EXPENSES SUCH AS
FOOD AND GROCERIES
CLOTHING, SHOES
TRAVEL AND ACCOMMODATION
FOR MAKING ONLINE
PURCHASES
FOR LARGE PURCHASES
WHERE I WANT TO STAGGER
PAYMENTS
FOR EMERGENCY
EXPENSES
Pay in full at the end of each month 16% 18% 16% 17% 23% 8% 14%
Pay required minimum plus extra each month
27% 32% 6% 20% 58% 24% 21%
Pay minimum instalment only 56% 48% 78% 63% 19% 65% 63%
Pay irregularly/only when I can 1% 2% 0% 0% 0% 4% 1%
CREDIT CARD USAGE: FREQUENCY
Frequencyofusearepurposeare(obviously)inter-linked.
FREQUENCY USE CREDIT CARD TOTAL
EVERYDAY EXPENSES SUCH AS
FOOD AND GROCERIES
CLOTHING, SHOES
TRAVEL AND ACCOMMODATION
FOR MAKING ONLINE
PURCHASES
FOR LARGE PURCHASES
WHERE I WANT TO STAGGER
PAYMENTS
FOR EMERGENCY
EXPENSES
Weekly/almost weekly 24% 56% 10% 9% 28% 12% 5%
Once or twice a month 33% 37% 35% 31% 24% 33% 31%
Every 2 or 3 months 27% 7% 44% 36% 33% 37% 33%
Once or twice a year 12% 0% 11% 21% 16% 17% 18%
Less often 5% 0% 0% 3% 0% 1% 14%

78
CreditcardUsage:Balancedueoncardfrommonthtomonth
AVERAGE BALANCE DUE ON CREDIT CARD MONTH TO MONTH TOTAL R6 000 –
R13 999R14 000 – R19 999
R20 000 – R40 000 R40 000+
Less than R2 000 39% 71% 63% 39% 27%
R2000-R4999 32% 25% 25% 36% 33%
R5000-R6999 14% 4% 7% 14% 17%
R7000-R9999 9% 0% 3% 7% 13%
R10000-R14999 4% 0% 3% 1% 6%
R15000-R19999 2% 0% 0% 1% 4%
R20000-R24999 0% 0% 0% 0% 1%
R30000+ 0% 0% 0% 1% 0%
STORE CARDS
Storecardscontinuetohavebroaderappeal,butwithevidenceofcuttingbackinhigherincomehouseholds.
STORE ACCOUNT CARD JUL-13 JUL-14 JUL-15 JUL-16 JUL-17 JUL-18 JUL-19
Less than R6 000 58% 59% 51% 51% 58% 48% 50%
R6 000 To R13 999 65% 66% 66% 65% 69% 66% 64%
R14 000 To R19 999 67% 64% 75% 68% 69% 70% 66%
R20 000 To R39 999 60% 75% 63% 61% 63% 76% 65%
R40 000 or more 54% 57% 62% 75% 65% 70% 57%
Lookingatstorecardrepaymentpatterns,ashasbeenthecasehistoricallytheincidenceofclearingtheseaccountsinfullis even poorer than for credit cards.
REPAYMENT PATTERN - SHOP ACCOUNTS JUL-13 JUL-14 JUL-15 JUL-16 JUL-17 JUL-18 JUL-19
Pay in full at the end of each month 4% 6% 6% 6% 5% 3% 5%
Pay required minimum plus extra each month
20% 27% 24% 21% 26% 21% 24%
Pay minimum instalment only 72% 65% 64% 66% 65% 72% 66%
Pay irregularly/only when I can 4% 2% 6% 6% 4% 4% 5%

79
Higher earners repayment patterns remain erratic. 2019 sees renewed attempts to pay off faster.
REPAYMENT PATTERN - STORE CARDS/SHOP ACCOUNTS JUL-13 JUL-14 JUL-15 JUL-16 JUL-17 JUL-18 JUL-19
Less than R6 000
Pay in full at the end of each month 4% 4% 6% 7% 4% 4% 1%
Pay required minimum plus extra each month
16% 22% 12% 20% 10% 13% 20%
Pay minimum instalment only 72% 68% 70% 63% 75% 73% 67%
Pay irregularly/only when I can 8% 6% 12% 10% 11% 10% 11%
R6 000 to R13 999
Pay in full at the end of each month 3% 4% 6% 4% 3% 1% 8%
Pay required minimum plus extra each month
19% 26% 21% 21% 23% 14% 14%
Pay minimum instalment only 74% 69% 65% 67% 69% 80% 71%
Pay irregularly/only when I can 4% 1% 8% 8% 5% 5% 7%
R14 000 to R19 999
Pay in full at the end of each month 6% 7% 6% 7% 5% 1% 3%
Pay required minimum plus extra each month
21% 28% 21% 16% 29% 27% 21%
Pay minimum instalment only 72% 63% 66% 68% 61% 70% 73%
Pay irregularly/only when I can 2% 2% 4% 8% 4% 1% 3%
R20 000 to R39 999
Pay in full at the end of each month 3% 8% 4% 8% 7% 3% 6%
Pay required minimum plus extra each month
22% 31% 30% 19% 31% 25% 25%
Pay minimum instalment only 71% 60% 62% 69% 62% 69% 68%
Pay irregularly/only when I can 3% 1% 4% 4% 0% 3% 1%
R40 000 or more
Pay in full at the end of each month 1% 10% 5% 8% 9% 6% 5%
Pay required minimum plus extra each month
35% 29% 44% 28% 40% 26% 42%
Pay minimum instalment only 63% 61% 48% 63% 50% 66% 52%
Pay irregularly/only when I can 1% 0% 3% 0% 1% 1% 1%
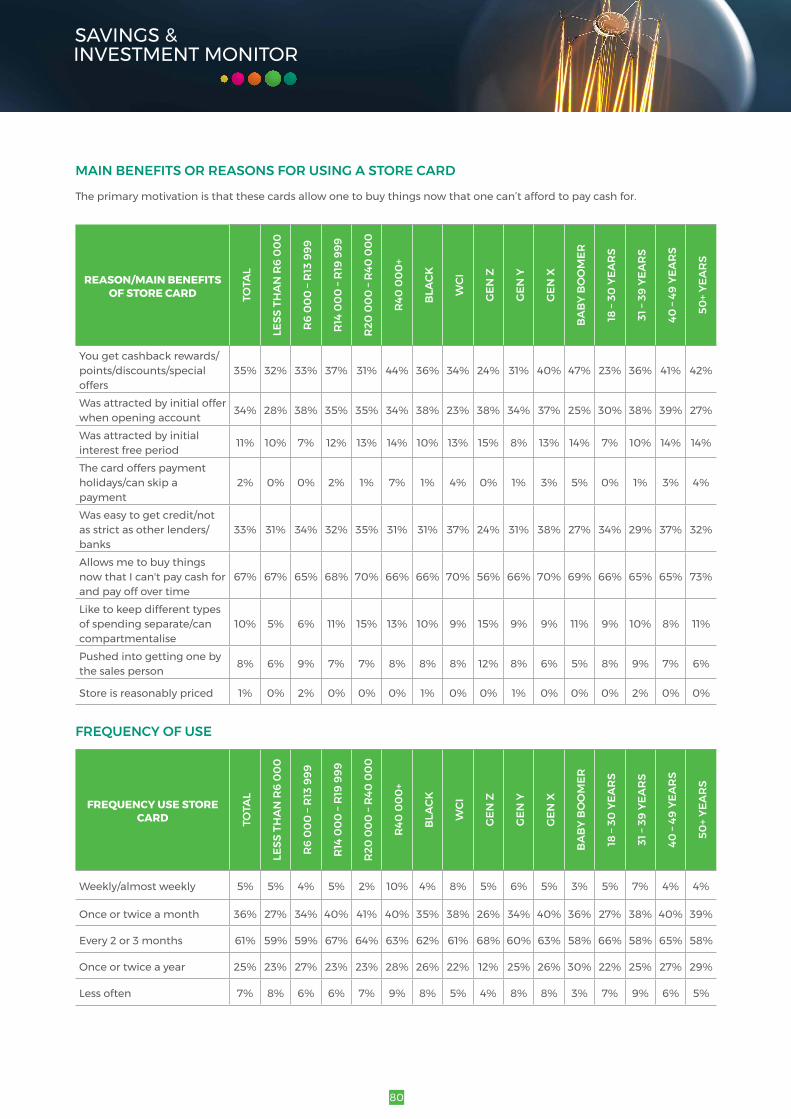
80
MAIN BENEFITS OR REASONS FOR USING A STORE CARD
The primary motivation is that these cards allow one to buy things now that one can’t afford to pay cash for.
REASON/MAINBENEFITSOF STORE CARD TO
TAL
LESS
TH
AN
R6
00
0
R6
00
0 –
R13
999
R14
00
0 –
R19
999
R20
00
0 –
R40
00
0
R40
00
0+
BLA
CK
WCI
GEN
Z
GEN
Y
GEN
X
BA
BY
BO
OM
ER
18 –
30 Y
EAR
S
31 –
39 Y
EAR
S
40 –
49 Y
EAR
S
50+
YEA
RS
You get cashback rewards/points/discounts/special offers
35% 32% 33% 37% 31% 44% 36% 34% 24% 31% 40% 47% 23% 36% 41% 42%
Was attracted by initial offer when opening account 34% 28% 38% 35% 35% 34% 38% 23% 38% 34% 37% 25% 30% 38% 39% 27%
Was attracted by initial interest free period 11% 10% 7% 12% 13% 14% 10% 13% 15% 8% 13% 14% 7% 10% 14% 14%
The card offers payment holidays/can skip a payment
2% 0% 0% 2% 1% 7% 1% 4% 0% 1% 3% 5% 0% 1% 3% 4%
Was easy to get credit/not as strict as other lenders/banks
33% 31% 34% 32% 35% 31% 31% 37% 24% 31% 38% 27% 34% 29% 37% 32%
Allows me to buy things now that I can't pay cash for and pay off over time
67% 67% 65% 68% 70% 66% 66% 70% 56% 66% 70% 69% 66% 65% 65% 73%
Like to keep different types of spending separate/can compartmentalise
10% 5% 6% 11% 15% 13% 10% 9% 15% 9% 9% 11% 9% 10% 8% 11%
Pushed into getting one by the sales person 8% 6% 9% 7% 7% 8% 8% 8% 12% 8% 6% 5% 8% 9% 7% 6%
Store is reasonably priced 1% 0% 2% 0% 0% 0% 1% 0% 0% 1% 0% 0% 0% 2% 0% 0%
FREQUENCY OF USE
FREQUENCY USE STORE CARD TO
TAL
LESS
TH
AN
R6
00
0
R6
00
0 –
R13
999
R14
00
0 –
R19
999
R20
00
0 –
R40
00
0
R40
00
0+
BLA
CK
WCI
GEN
Z
GEN
Y
GEN
X
BA
BY
BO
OM
ER
18 –
30 Y
EAR
S
31 –
39 Y
EAR
S
40 –
49 Y
EAR
S
50+
YEA
RS
Weekly/almost weekly 5% 5% 4% 5% 2% 10% 4% 8% 5% 6% 5% 3% 5% 7% 4% 4%
Once or twice a month 36% 27% 34% 40% 41% 40% 35% 38% 26% 34% 40% 36% 27% 38% 40% 39%
Every 2 or 3 months 61% 59% 59% 67% 64% 63% 62% 61% 68% 60% 63% 58% 66% 58% 65% 58%
Once or twice a year 25% 23% 27% 23% 23% 28% 26% 22% 12% 25% 26% 30% 22% 25% 27% 29%
Less often 7% 8% 6% 6% 7% 9% 8% 5% 4% 8% 8% 3% 7% 9% 6% 5%
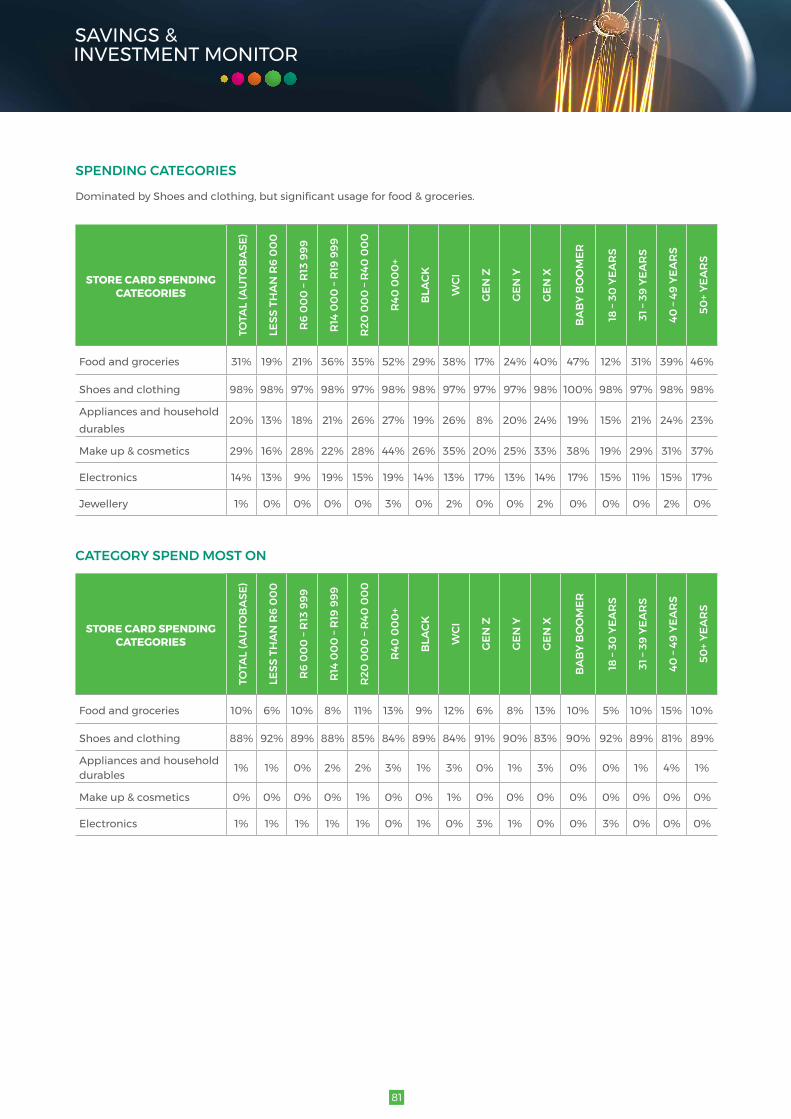
81
SPENDING CATEGORIES
DominatedbyShoesandclothing,butsignificantusageforfood&groceries.
STORE CARD SPENDING CATEGORIES
TOTA
L (A
UTO
BA
SE)
LESS
TH
AN
R6
00
0
R6
00
0 –
R13
999
R14
00
0 –
R19
999
R20
00
0 –
R40
00
0
R40
00
0+
BLA
CK
WCI
GEN
Z
GEN
Y
GEN
X
BA
BY
BO
OM
ER
18 –
30 Y
EAR
S
31 –
39 Y
EAR
S
40 –
49 Y
EAR
S
50+
YEA
RS
Food and groceries 31% 19% 21% 36% 35% 52% 29% 38% 17% 24% 40% 47% 12% 31% 39% 46%
Shoes and clothing 98% 98% 97% 98% 97% 98% 98% 97% 97% 97% 98% 100% 98% 97% 98% 98%
Appliances and household durables
20% 13% 18% 21% 26% 27% 19% 26% 8% 20% 24% 19% 15% 21% 24% 23%
Make up & cosmetics 29% 16% 28% 22% 28% 44% 26% 35% 20% 25% 33% 38% 19% 29% 31% 37%
Electronics 14% 13% 9% 19% 15% 19% 14% 13% 17% 13% 14% 17% 15% 11% 15% 17%
Jewellery 1% 0% 0% 0% 0% 3% 0% 2% 0% 0% 2% 0% 0% 0% 2% 0%
CATEGORY SPEND MOST ON
STORE CARD SPENDING CATEGORIES
TOTA
L (A
UTO
BA
SE)
LESS
TH
AN
R6
00
0
R6
00
0 –
R13
999
R14
00
0 –
R19
999
R20
00
0 –
R40
00
0
R40
00
0+
BLA
CK
WCI
GEN
Z
GEN
Y
GEN
X
BA
BY
BO
OM
ER
18 –
30 Y
EAR
S
31 –
39 Y
EAR
S
40 –
49 Y
EAR
S
50+
YEA
RS
Food and groceries 10% 6% 10% 8% 11% 13% 9% 12% 6% 8% 13% 10% 5% 10% 15% 10%
Shoes and clothing 88% 92% 89% 88% 85% 84% 89% 84% 91% 90% 83% 90% 92% 89% 81% 89%
Appliances and household durables 1% 1% 0% 2% 2% 3% 1% 3% 0% 1% 3% 0% 0% 1% 4% 1%
Make up & cosmetics 0% 0% 0% 0% 1% 0% 0% 1% 0% 0% 0% 0% 0% 0% 0% 0%
Electronics 1% 1% 1% 1% 1% 0% 1% 0% 3% 1% 0% 0% 3% 0% 0% 0%

82
11.4 OTHER SHORT-TO-MEDIUM TERM DEBT2019seesanoverallincreaseinpersonalloans–fromfinancialinstitutions(especiallyR14000–R39999households)andfamily (especially lower income)
CURRENT SHORT/MEDIUM TERM LOANS JUL-13 JUL-14 JUL-15 JUL-16 JUL-17 JUL-18 JUL-19
Any personal loan 24% 28% 27% 36% 29% 24% 35%
Personalloanfromafinancialinstitution 17% 20% 16% 21% 14% 14% 19%
Personal loan from a micro lender 3% 3% 4% 8% 6% 4% 5%
Personal loan from a friend/family member 6% 7% 10% 15% 13% 10% 17%
Carfinance 17% 13% 15% 18% 19% 21% 21%
Hire purchase/instalment sale 12% 14% 14% 13% 12% 10% 7%
Revolving credit facility 4% 4% 2% 6% 10% 5% 5%
Overdraft 6% 7% 4% 11% 9% 10% 9%
Student loan Not measured 1% 3% 2% 1% 1%
CURRENT SHORT/MEDIUM TERM LOANS JUL-13 JUL-14 JUL-15 JUL-16 JUL-17 JUL-18 JUL-19
Less than R6 000
Any personal loan 28% 28% 32% 45% 33% 25% 45%
Personalloanfromafinancialinstitution 14% 14% 10% 12% 8% 5% 12%
Personal loan from a micro lender 4% 4% 7% 14% 9% 8% 11%
Personal loan from a friend/family member 12% 13% 18% 27% 21% 17% 33%
Carfinance 3% 1% 0% 0% 0% 0% 0%
Hire purchase/instalment sale 13% 17% 11% 8% 7% 3% 5%
Revolving credit facility 1% 2% 0% 0% 1% 0% 0%
Overdraft 1% 0% 0% 0% 0% 0% 0%
Student loan 0% 1% 3% 0% 1%
R6 000 to R13 999
Any personal loan 26% 31% 32% 36% 31% 30% 38%
Personalloanfromafinancialinstitution 20% 23% 20% 19% 15% 14% 19%
Personal loan from a micro lender 3% 2% 4% 8% 8% 6% 7%
Personal loan from a friend/family member 5% 9% 12% 16% 16% 15% 18%
Carfinance 9% 4% 5% 6% 10% 8% 7%
Hire purchase/instalment sale 14% 11% 15% 13% 16% 10% 9%
Revolving credit facility 4% 2% 1% 2% 8% 1% 2%
Overdraft 2% 2% 2% 2% 5% 3% 2%
Student loan 0% 4% 3% 1% 1%

83
CURRENT SHORT/MEDIUM TERM LOANS JUL-13 JUL-14 JUL-15 JUL-16 JUL-17 JUL-18 JUL-19
R14 000 to R19 999
Any personal loan 24% 26% 23% 41% 31% 18% 34%
Personalloanfromafinancialinstitution 17% 24% 16% 30% 17% 14% 21%
Personal loan from a micro lender 2% 2% 3% 6% 5% 1% 6%
Personal loan from a friend/family member 5% 4% 8% 15% 13% 6% 17%
Carfinance 19% 11% 12% 18% 22% 23% 15%
Hire purchase/instalment sale 11% 18% 15% 15% 12% 13% 10%
Revolving credit facility 4% 2% 2% 5% 10% 2% 4%
Overdraft 8% 4% 5% 10% 11% 8% 4%
Student loan 1% 3% 1% 0% 2%
R20 000 to R39 999
Any personal loan 18% 29% 23% 30% 25% 25% 37%
Personalloanfromafinancialinstitution 15% 22% 18% 25% 16% 19% 29%
Personal loan from a micro lender 1% 3% 4% 5% 3% 3% 2%
Personal loan from a friend/family member 3% 5% 4% 9% 9% 7% 10%
Carfinance 32% 26% 33% 34% 31% 37% 35%
Hire purchase/instalment sale 11% 16% 16% 15% 11% 13% 8%
Revolving credit facility 8% 7% 2% 12% 15% 8% 8%
Overdraft 12% 13% 6% 21% 11% 15% 12%
Student loan 3% 1% 2% 1% 1%
R40 000 Or More
Any personal loan 19% 20% 19% 29% 21% 18% 20%
Personalloanfromafinancialinstitution 17% 19% 15% 24% 16% 14% 18%
Personal loan from a micro lender 1% 1% 1% 4% 3% 1% 0%
Personal loan from a friend/family member 1% 0% 4% 5% 4% 4% 4%
Carfinance 42% 40% 41% 47% 42% 41% 51%
Hire purchase/instalment sale 8% 9% 16% 14% 12% 10% 5%
Revolving credit facility 10% 14% 4% 14% 21% 14% 13%
Overdraft 15% 23% 15% 30% 24% 28% 25%
Student loan 1% 4% 2% 0% 2%

84
Therepaymentpatternsofthemostprevalentshort-to-mediumtermdebtaresetoutbelow.Thevastmajoritycontinuetopaytheminimuminstallmentonly,withtheexceptionofpersonalloansfromfamilyandfriendswhererepaymentpatternsaremorecasual,withanupturninthosewhoonlypayirregularly.
REPAYMENT PATTERN - PERSONAL LOAN FROM A FINANCIAL INSTITUTION JUL-13 JUL-14 JUL-15 JUL-16 JUL-17 JUL-18 JUL-19
Pay required minimum plus extra each month 14% 8% 12% 12% 11% 8% 11%
Pay minimum instalment only 82% 86% 78% 80% 80% 86% 84%
Pay irregularly/only when I can 4% 6% 5% 7% 8% 6% 6%
REPAYMENT PATTERN - PERSONAL LOAN FROM A FRIEND/FAMILY MEMBER JUL-13 JUL-14 JUL-15 JUL-16 JUL-17 JUL-18 JUL-19
Pay required minimum plus extra each month 13% 28% 10% 8% 15% 16% 18%
Pay minimum instalment only 39% 34% 43% 56% 57% 48% 41%
Pay irregularly/only when I can 47% 38% 43% 34% 26% 35% 41%
REPAYMENT PATTERN - CAR FINANCE JUL-13 JUL-14 JUL-15 JUL-16 JUL-17 JUL-18 JUL-19
Pay required minimum plus extra each month 15% 14% 14% 8% 15% 10% 11%
Pay minimum instalment only 82% 83% 81% 89% 80% 87% 87%
Pay irregularly/only when I can 3% 2% 2% 2% 3% 1% 1%
REPAYMENT PATTERN - HIRE PURCHASE/INSTALMENT SALE JUL-13 JUL-14 JUL-15 JUL-16 JUL-17 JUL-18 JUL-19
Pay required minimum plus extra each month 13% 10% 18% 10% 10% 13% 6%
Pay minimum instalment only 80% 87% 74% 75% 82% 78% 81%
Pay irregularly/only when I can 6% 3% 4% 15% 5% 8% 13%

85
12. ATTITUDINAL DYNAMICSRespondentsareaskedtoratetheir levelofagreementwithaseriesofstatementsabouttheirattitudetofinancesandlifegenerally.Afour-pointagreescaleisused.Foranalysispurposeswehavecombinedthetop2ratedscorestogiveusapercentageAgree=StronglyAgreeandAgreeSlightly.ThesehavebeenrankedaccordingtothehighestlevelofagreementinthisJuly2019measure.(Shadingindicatesattributenotmeasured).Intermsofcolorationgreenindicatessignificantlyhigherthan2018,redlowerandblackparity.
Atatotalsamplelevelnotetherecoveryinappetiteforknowledgeseeking,butatthesametimeatincreaseinthe%whostruggletofindsomebodywhotheycantrustforadvice.
ATTITUDE TO FINANCES AXES JUL-13 JUL-14 JUL-15 JUL-16 JUL-17 JUL-18 JUL-19
I want to learn more about how to save 80% 80% 84% 83% 84% 80% 82%
Extremelycautiouswithfinances 75% 75% 80% 75% 77% 84% 82%
Setfinancialgoals 80% 76% 78% 69% 75% 76% 78%
Always trying to become more knowledgeable aboutfinancialmatters 74% 73% 75% 76% 80% 69% 76%
Always worried about not having enough money 71% 65% 68% 77% 69% 67% 73%
I wonder if I have done enough to secure my retirement 69% 64% 73% 73% 71% 69% 71%
Planmyfinancesfivetotenyearsahead 60% 53% 62% 55% 60% 63% 64%
Seekfinancialadvicefromfamilyandfriends 55% 51% 64% 62% 58% 56% 60%
Death,funeralanddisabilitycoveraremoreimportant 44% 50% 46% 44% 53% 53% 57%
Savings for education is more important than retirement 47% 49% 52% 49% 51% 50% 55%
Iknowalotaboutfinancialproducts 48% 44% 50% 49% 46% 49% 51%
Wouldlikefinancialadvicebuthardtofindsomebody I trust 40% 37% 38% 36% 39% 31% 45%
Feelfinanciallysecure,haveenoughpayforunplanned events 40% 43% 38% 30% 40% 35% 42%
Most months I struggle to make ends meet 43% 39% 47% 54% 44% 38% 42%
Alwayslookingoutforlatestfinancialservicesproducts 40% 36% 35% 45% 47% 33% 41%
Not always sure who to turn to regarding finances 36% 34% 33% 37% 36% 35% 36%
Saving for future is not a priority right now 22% 24% 26% 27% 25% 22% 33%
SpendallthatIearn,notabletosaveanything 34% 29% 29% 33% 25% 24% 32%
Iconsidermyselfaspender,notasaver 35% 37% 29% 42% 36% 20% 27%
Worry that if my partner dies or leaves me that Iwillnotbeabletocopefinancially 27%
Happytobuyfinancialproductsoffinternet 14% 18% 15% 15% 18% 14% 19%
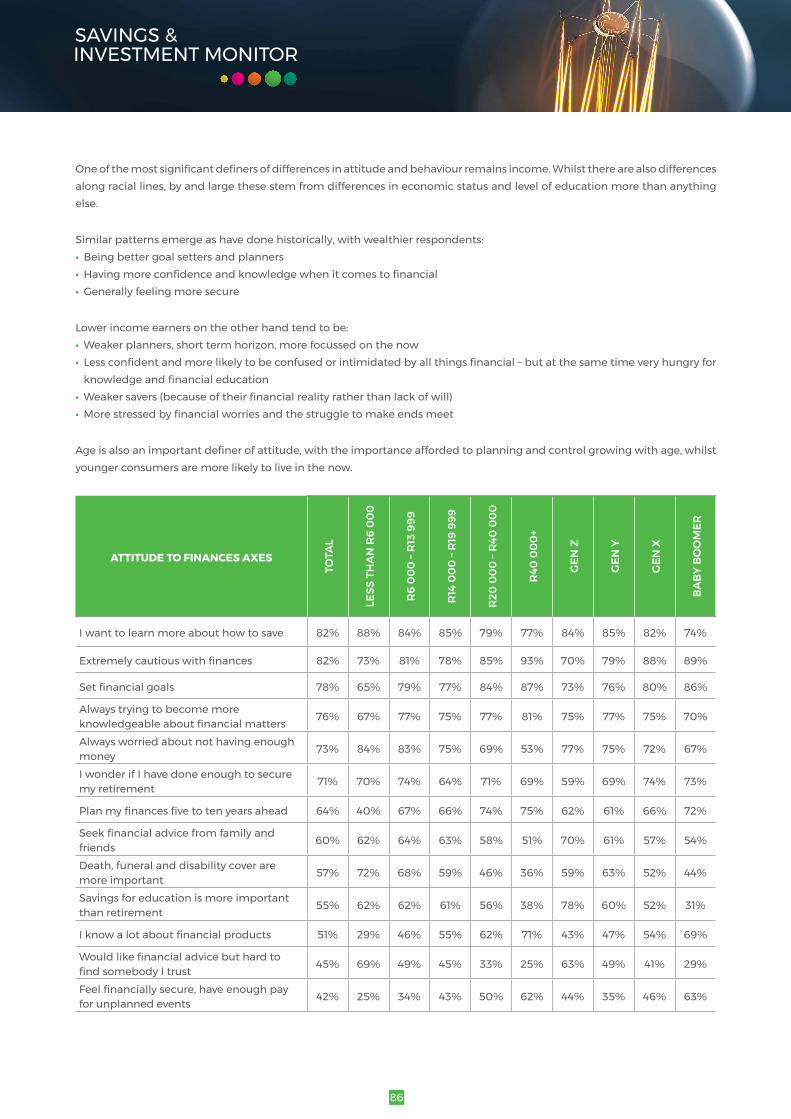
86
Oneofthemostsignificantdefinersofdifferencesinattitudeandbehaviourremainsincome.Whilsttherearealsodifferencesalongraciallines,byandlargethesestemfromdifferencesineconomicstatusandlevelofeducationmorethananythingelse.
Similarpatternsemergeashavedonehistorically,withwealthierrespondents:• Being better goal setters and planners• Havingmoreconfidenceandknowledgewhenitcomestofinancial• Generally feeling more secure
Lower income earners on the other hand tend to be:• Weakerplanners,shorttermhorizon,morefocussedonthenow• Lessconfidentandmorelikelytobeconfusedorintimidatedbyallthingsfinancial–butatthesametimeveryhungryforknowledgeandfinancialeducation
• Weakersavers(becauseoftheirfinancialrealityratherthanlackofwill)• Morestressedbyfinancialworriesandthestruggletomakeendsmeet
Ageisalsoanimportantdefinerofattitude,withtheimportanceaffordedtoplanningandcontrolgrowingwithage,whilstyounger consumers are more likely to live in the now.
ATTITUDE TO FINANCES AXES
TOTA
L
LESS
TH
AN
R6
00
0
R6
00
0 –
R13
999
R14
00
0 –
R19
999
R20
00
0 –
R40
00
0
R40
00
0+
GEN
Z
GEN
Y
GEN
X
BA
BY
BO
OM
ER
I want to learn more about how to save 82% 88% 84% 85% 79% 77% 84% 85% 82% 74%
Extremelycautiouswithfinances 82% 73% 81% 78% 85% 93% 70% 79% 88% 89%
Setfinancialgoals 78% 65% 79% 77% 84% 87% 73% 76% 80% 86%
Always trying to become more knowledgeableaboutfinancialmatters 76% 67% 77% 75% 77% 81% 75% 77% 75% 70%
Always worried about not having enough money 73% 84% 83% 75% 69% 53% 77% 75% 72% 67%
I wonder if I have done enough to secure my retirement 71% 70% 74% 64% 71% 69% 59% 69% 74% 73%
Planmyfinancesfivetotenyearsahead 64% 40% 67% 66% 74% 75% 62% 61% 66% 72%
Seekfinancialadvicefromfamilyandfriends 60% 62% 64% 63% 58% 51% 70% 61% 57% 54%
Death,funeralanddisabilitycoveraremore important 57% 72% 68% 59% 46% 36% 59% 63% 52% 44%
Savings for education is more important than retirement 55% 62% 62% 61% 56% 38% 78% 60% 52% 31%
Iknowalotaboutfinancialproducts 51% 29% 46% 55% 62% 71% 43% 47% 54% 69%
WouldlikefinancialadvicebuthardtofindsomebodyItrust 45% 69% 49% 45% 33% 25% 63% 49% 41% 29%
Feelfinanciallysecure,haveenoughpayfor unplanned events 42% 25% 34% 43% 50% 62% 44% 35% 46% 63%
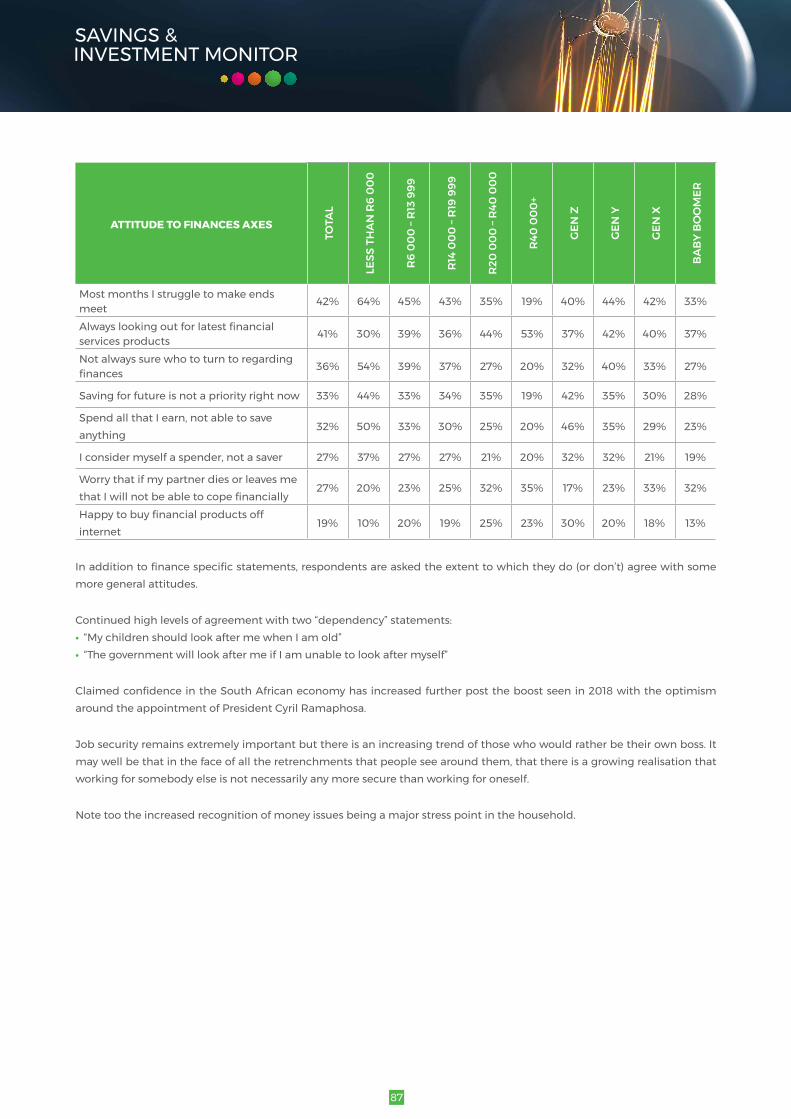
87
ATTITUDE TO FINANCES AXES
TOTA
L
LESS
TH
AN
R6
00
0
R6
00
0 –
R13
999
R14
00
0 –
R19
999
R20
00
0 –
R40
00
0
R40
00
0+
GEN
Z
GEN
Y
GEN
X
BA
BY
BO
OM
ER
Most months I struggle to make ends meet 42% 64% 45% 43% 35% 19% 40% 44% 42% 33%
Alwayslookingoutforlatestfinancialservices products 41% 30% 39% 36% 44% 53% 37% 42% 40% 37%
Not always sure who to turn to regarding finances 36% 54% 39% 37% 27% 20% 32% 40% 33% 27%
Saving for future is not a priority right now 33% 44% 33% 34% 35% 19% 42% 35% 30% 28%
SpendallthatIearn,notabletosaveanything
32% 50% 33% 30% 25% 20% 46% 35% 29% 23%
Iconsidermyselfaspender,notasaver 27% 37% 27% 27% 21% 20% 32% 32% 21% 19%
Worry that if my partner dies or leaves me thatIwillnotbeabletocopefinancially
27% 20% 23% 25% 32% 35% 17% 23% 33% 32%
Happytobuyfinancialproductsoffinternet
19% 10% 20% 19% 25% 23% 30% 20% 18% 13%
Inadditiontofinancespecificstatements,respondentsareaskedtheextenttowhichtheydo(ordon’t)agreewithsomemore general attitudes.
Continued high levels of agreement with two “dependency” statements: • “My children should look after me when I am old”• “The government will look after me if I am unable to look after myself”
ClaimedconfidenceintheSouthAfricaneconomyhasincreasedfurtherposttheboostseenin2018withtheoptimismaround the appointment of President Cyril Ramaphosa.
Jobsecurityremainsextremelyimportantbutthereisanincreasingtrendofthosewhowouldratherbetheirownboss.Itmaywellbethatinthefaceofalltheretrenchmentsthatpeopleseearoundthem,thatthereisagrowingrealisationthatworking for somebody else is not necessarily any more secure than working for oneself.
Note too the increased recognition of money issues being a major stress point in the household.

88
ATTITUDE TO FINANCES AXES JUL-13 JUL-14 JUL-15 JUL-16 JUL-17 JUL-18 JUL-19
Jobsecurityismoreimportantthanjobsatisfaction 81% 80% 81%
I am very optimistic about what the future holds for me 83% 78% 84% 69% 80% 80% 80%
I like to own products that are the most technologically advanced 65% 59% 66% 66% 69% 64% 67%
I feel I never have enough money to do the things I want 60% 58% 59% 68% 60% 60% 62%
I like to take risks in my life 47% 48% 47% 53% 53% 45% 53%
TogetaheadinlifeIamwillingtosacrificefamily & social time 49% 49% 44% 46% 51% 43% 53%
I'dratherbemyownbossandearnless,thanearn more and work for somebody else 39% 43% 53%
Money issues are a major source of stress in our household 40% 50%
IfeelconfidentabouttheSouthAfricaneconomy 55% 52% 55% 31% 34% 43% 46%
My children should look after me when I am old 38% 39% 41% 45% 37% 38% 38%
The government will look after me if I am not able to look after myself 31% 32% 36% 32% 33% 32% 36%
I am less worried about children's education now that government may provide 31% 30%
My partner & I often argue about money matters (base = partnered respondents) 33% 39%

89
ATTITUDESTOWORKANDLIFE-GROUPED AXES
2019 TOTA
L
LESS
TH
AN
R6
00
0
R6
00
0 –
R13
999
R14
00
0 –
R19
999
R20
00
0 –
R40
00
0
R40
00
0+
GEN
Z
GEN
Y
GEN
X
BA
BY
BO
OM
ER
Jobsecurityismoreimportantthanjobsatisfaction 81% 84% 84% 75% 76% 82% 84% 81% 82% 81%
I am very optimistic about what the future holds for me 80% 78% 82% 82% 80% 80% 83% 83% 78% 75%
I like to own products that are the most technologically advanced 67% 60% 66% 69% 74% 69% 75% 76% 60% 44%
I feel I never have enough money to do the things I want 62% 79% 65% 65% 62% 42% 55% 65% 65% 45%
I like to take risks in my life 53% 47% 56% 58% 57% 51% 59% 55% 53% 42%
TogetaheadinlifeIamwillingtosacrificefamily & social time 53% 61% 54% 55% 51% 45% 68% 51% 52% 55%
I'dratherbemyownbossandearnless,than earn more and work for somebody else
53% 52% 52% 53% 50% 57% 59% 52% 54% 48%
Money issues are a major source of stress in our household 50% 70% 58% 51% 42% 27% 53% 53% 50% 38%
Ifeelconfidentaboutthesouthafricaneconomy 46% 48% 49% 50% 45% 39% 49% 47% 44% 46%
My children should look after me when I am old 38% 49% 44% 39% 30% 24% 30% 37% 44% 30%
The government will look after me if I am not able to look after myself 36% 54% 41% 38% 28% 19% 29% 38% 37% 29%
I am less worried about children's education now that government may provide
30% 37% 36% 35% 28% 15% 33% 31% 28% 30%
My partner & I often argue about money matters (base = partnered respondents) 39% 49% 49% 56% 40% 22% 62% 36% 42% 35%

90
13. CONFIDENCE IN FINANCIAL DECISION MAKING
2019seessomefurtherdeclineinconsumerconfidencewhenitcomestotheirperceivedabilitytomakegoodsavingsandinvestmentdecisions.Thisdeclineisseenacrossallincomegroupsotherthan<R6000,althoughconfidencelevelscontinueto be positively correlated with income.
CONFIDENCE IN ABILITY TO MAKE GOOD SAVINGS & INVESTMENT DECISION JUL-13 JUL-14 JUL-15 JUL-16 JUL-17 JUL-18 JUL-19
Less than R6 000 6.7 6.1 5.2 5.2 5.4 5.1 5.3
R6 000 to R13 999 7.1 6.8 6.2 6 6.3 6.1 5.9
R14 000 to R19 999 7.4 7.1 6.7 6.5 6.6 6.6 6.3
R20 000 to R39 999 7.6 7.5 6.9 6.8 7.2 6.9 7
R40 000 or more 8 7.9 7.5 7.2 7.7 7.5 7.3
GenZ - - 5.5 5.7 5.6 5.8 5.9
Gen Y 7.1 6.7 6.3 6.1 6.3 6.2 6.1
Gen X 7.3 7 6.4 6.3 6.9 6.7 6.4
Baby Boomer 7.3 7 6.2 6.5 6.6 6.8 7
18-30Years 7.1 6.7 5.9 6.1 6.1 6 6.1
31-39Years 7.3 7 6.5 6.2 6.4 6.5 6.1
40-49Years 7.3 7 6.4 6.3 6.9 6.6 6.5
50+Years 7.2 7 6.3 6.5 6.8 6.8 6.7

91

Old Mutual is a Licensed Financial Services Provider
OM
BD
S 0
7.20
19 L
1367
1.13