okmap_en
DESCRIPTION
manualTRANSCRIPT
OkMap – User manual November 1, 2012
Page 1
Summary
Installation ............................................................................................................................ 12
Software installation ................................................................................................................................................. 12
When an error occurs ................................................................................................................................................ 16
Organization of the screen ............................................................................................... 17
Multi document interface .......................................................................................................................................... 17
Menu ......................................................................................................................................................................... 17
Context menu ............................................................................................................................................................ 18
Toolbar ...................................................................................................................................................................... 19
Status bar .................................................................................................................................................................. 19
File manager .............................................................................................................................................................. 20
Area map ................................................................................................................................................................... 21
Mini map ................................................................................................................................................................... 22
Lens ............................................................................................................................................................................ 24
Data tables ................................................................................................................................................................ 25
Datum ...................................................................................................................................... 27
The shape of the Earth ............................................................................................................................................... 27
Datum definition........................................................................................................................................................ 27
Coordinate systems ................................................................................................................................................... 27
List the datum ............................................................................................................................................................ 28
Add custom datum .................................................................................................................................................... 29
Default projections/datum .............................................................................................. 30
What is a projection................................................................................................................................................... 30
Classification according to spatial properties ............................................................................................................ 30
Classification according to geometric principles ....................................................................................................... 30
Most used projections ............................................................................................................................................... 31
Projections used according to the scale ..................................................................................................................... 31
Usable projections with OkMap ................................................................................................................................. 31
Projection parameters ............................................................................................................................................... 32
List the default projections/datum ............................................................................................................................ 32
Add custom projections/datum ................................................................................................................................. 33
Maps ......................................................................................................................................... 35
Types of maps ............................................................................................................................................................ 35
Calibrate a raster map ............................................................................................................................................... 35
Create a vectorial map ............................................................................................................................................... 40
Save a map in OkMap format.................................................................................................................................... 44
Save a map in World file format ................................................................................................................................ 44
Save a map in Google Earth KML/KMZ format ......................................................................................................... 45

OkMap – User manual November 1, 2012
Page 2
Save a map in OziExplorer format ........................................................................................................................... 46
Save a map in GPSTuner format............................................................................................................................... 46
Load a map in OkMap format ................................................................................................................................... 46
Load a map in ECW format ........................................................................................................................................ 46
Load a map in Geotiff format .................................................................................................................................... 48
Load a map in World file format ................................................................................................................................ 51
Load a map in OziExplorer format ............................................................................................................................. 53
Load a map in GPSTuner format ................................................................................................................................ 54
Modify scale / zoom................................................................................................................................................... 54
Move the map ............................................................................................................................................................ 54
Modify the calibration of a raster map ...................................................................................................................... 55
Modify a vectorial map .............................................................................................................................................. 55
Index the maps .......................................................................................................................................................... 56
List the available maps .............................................................................................................................................. 56
Visualize the bounds of the maps .............................................................................................................................. 58
Save the map image to file ........................................................................................................................................ 59
Print the map image .................................................................................................................................................. 59
Copy the map image to the clipboard ....................................................................................................................... 59
Grids ......................................................................................................................................... 61
What are the grids .................................................................................................................................................... 61
Grid properties ........................................................................................................................................................... 61
DEM data ................................................................................................................................ 63
What area the data DEM........................................................................................................................................... 63
Download DEM data.................................................................................................................................................. 63
Display the bounds of the DEM data ......................................................................................................................... 64
Vectorial data, themes, shapes ........................................................................................ 66
What are the vectorial data ...................................................................................................................................... 66
List the vectorial themes ............................................................................................................................................ 66
Shape type point .................................................................................................................. 69
What are point shapes .............................................................................................................................................. 69
Create a point ............................................................................................................................................................ 69
Select the points ........................................................................................................................................................ 69
Information about a point ......................................................................................................................................... 70
Modify the points ....................................................................................................................................................... 70
Move a point.............................................................................................................................................................. 72
Delete the points ........................................................................................................................................................ 72
Hide and unhide the points ........................................................................................................................................ 73
Shape type multipoint ....................................................................................................... 74
What are multipoint shapes ...................................................................................................................................... 74

OkMap – User manual November 1, 2012
Page 3
Create a multipoint .................................................................................................................................................... 74
Select the multipoints ................................................................................................................................................ 74
Information about a multipoint ................................................................................................................................. 75
Modify the multipoints .............................................................................................................................................. 76
Add a point to a multipoint ....................................................................................................................................... 77
Delete last point from a multipoint ............................................................................................................................ 77
Move a multipoint ..................................................................................................................................................... 77
Delete the multipoints ............................................................................................................................................... 78
Hide and unhide the multipoints................................................................................................................................ 78
Shape type line ..................................................................................................................... 79
What are line shapes ................................................................................................................................................. 79
Create a line ............................................................................................................................................................... 79
Select the lines ........................................................................................................................................................... 79
Information about a line ............................................................................................................................................ 80
Modify the lines ......................................................................................................................................................... 81
Add a point to a line................................................................................................................................................... 82
Delete last point from a line ....................................................................................................................................... 82
Move a line ................................................................................................................................................................ 82
Delete the lines .......................................................................................................................................................... 83
Hide and unhide the lines .......................................................................................................................................... 83
Shape type polygon ............................................................................................................. 84
What are polygon shapes .......................................................................................................................................... 84
Create a polygon ....................................................................................................................................................... 84
Select the polygons .................................................................................................................................................... 84
Information about a polygon..................................................................................................................................... 85
Modify the polygons .................................................................................................................................................. 86
Move a polygon ......................................................................................................................................................... 87
Add a point to a polygon ........................................................................................................................................... 88
Delete last point from a polygon ............................................................................................................................... 88
Delete the polygons ................................................................................................................................................... 88
Hide and unhide the polygons ................................................................................................................................... 88
Map add-ons .......................................................................................................................... 90
What are the map add-ons ....................................................................................................................................... 90
Map icon ................................................................................................................................. 91
What are the map icons ............................................................................................................................................ 91
Create a map icon ...................................................................................................................................................... 91
Select a map icon ....................................................................................................................................................... 91
Information about a map icon ................................................................................................................................... 91
Modify the map icons ................................................................................................................................................ 92

OkMap – User manual November 1, 2012
Page 4
Move a map icon ....................................................................................................................................................... 93
Delete the map icons ................................................................................................................................................. 94
Hide and unhide the map icons .................................................................................................................................. 94
Map comment ....................................................................................................................... 95
What are the map comments .................................................................................................................................... 95
Create a map comment ............................................................................................................................................. 95
Select a map comment .............................................................................................................................................. 95
Information about a map comment .......................................................................................................................... 96
Modify the map comments ....................................................................................................................................... 96
Move a map comment ............................................................................................................................................... 98
Delete the map comments ......................................................................................................................................... 98
Hide and unhide the map comments ......................................................................................................................... 98
GPX data .................................................................................................................................. 99
What are the GPX data .............................................................................................................................................. 99
Load GPX data ........................................................................................................................................................... 99
Save GPX data .......................................................................................................................................................... 101
Waypoints ........................................................................................................................... 102
What are the waypoints .......................................................................................................................................... 102
Create a waypoint ................................................................................................................................................... 102
List the waypoints .................................................................................................................................................... 102
Select the waypoints ................................................................................................................................................ 104
Information about a waypoint ................................................................................................................................ 105
Modify the waypoints .............................................................................................................................................. 106
Move a waypoint ..................................................................................................................................................... 108
Delete the waypoints ............................................................................................................................................... 109
Hide and unhide the waypoints ............................................................................................................................... 109
Set the altitude to a waypoint ................................................................................................................................. 109
Navigate toward a waypoint ................................................................................................................................... 109
Routes ................................................................................................................................... 110
What are the routes................................................................................................................................................. 110
Create a route .......................................................................................................................................................... 110
List the routes .......................................................................................................................................................... 111
Select the routes ...................................................................................................................................................... 114
Select the route waypoints ...................................................................................................................................... 114
Information about a route ....................................................................................................................................... 115
Information about a route waypoint ....................................................................................................................... 116
Modify the routes .................................................................................................................................................... 117
Add a waypoint to a route ....................................................................................................................................... 118
Delete a waypoint from a route ............................................................................................................................... 119

OkMap – User manual November 1, 2012
Page 5
Move a route ........................................................................................................................................................... 119
Delete the routes ..................................................................................................................................................... 119
Hide and unhide the routes ...................................................................................................................................... 120
Duplicate a route ..................................................................................................................................................... 120
Invert a route ........................................................................................................................................................... 120
Join the routes ......................................................................................................................................................... 120
Set the altitude to a route ........................................................................................................................................ 120
Navigate along a route ............................................................................................................................................ 121
Tracks ................................................................................................................................... 122
What are the tracks ................................................................................................................................................. 122
Create a track .......................................................................................................................................................... 122
List the tracks ........................................................................................................................................................... 122
Select the tracks ....................................................................................................................................................... 126
Select the track points ............................................................................................................................................. 126
Information about a track ....................................................................................................................................... 127
Information about a track point .............................................................................................................................. 128
Modify the tracks ..................................................................................................................................................... 129
Add a point to a track .............................................................................................................................................. 130
Modify a point of a track ......................................................................................................................................... 130
Delete a point from a track ...................................................................................................................................... 131
Move a track ............................................................................................................................................................ 132
Delete the tracks ...................................................................................................................................................... 132
Hide and unhide the tracks ...................................................................................................................................... 132
Simplify a track ........................................................................................................................................................ 133
Duplicate a track ...................................................................................................................................................... 133
Invert a track ........................................................................................................................................................... 133
Join the tracks .......................................................................................................................................................... 133
Join the segments of a track .................................................................................................................................... 134
Set the altitude to a track ........................................................................................................................................ 134
Set the travel time to a track ................................................................................................................................... 134
Navigate along a track............................................................................................................................................. 134
Track statistics ......................................................................................................................................................... 134
Track graphs ............................................................................................................................................................ 135
Import vectorial data ...................................................................................................... 137
Import OkMap vectorial data .................................................................................................................................. 137
Import SHP vectorial data ........................................................................................................................................ 137
Import DCW polygons ............................................................................................................................................. 140
Export vectorial data ....................................................................................................... 144
Export SHP vectorial data ........................................................................................................................................ 144

OkMap – User manual November 1, 2012
Page 6
GPS communications ....................................................................................................... 145
Receive data from GPS ............................................................................................................................................ 145
Send data to GPS ..................................................................................................................................................... 145
Turn off the GPS ....................................................................................................................................................... 146
Navigation ........................................................................................................................... 147
Navigation mode ..................................................................................................................................................... 147
Navigation simulator ............................................................................................................................................... 147
Navigation data ....................................................................................................................................................... 148
Navigate toward a waypoint ................................................................................................................................... 149
Navigate along a route ............................................................................................................................................ 150
Navigate along a track............................................................................................................................................. 152
Anchor alarm ........................................................................................................................................................... 153
Compass .................................................................................................................................................................. 154
Satellites map ........................................................................................................................................................... 154
Satellites in view ...................................................................................................................................................... 155
Record the GPS track log .......................................................................................................................................... 156
GPS track statistics .................................................................................................................................................. 157
GPS track graphs ..................................................................................................................................................... 157
Save the current position ......................................................................................................................................... 158
Send current position to OkMap .............................................................................................................................. 158
Send current position to GpsGate ............................................................................................................................ 159
Center the map ........................................................................................................................................................ 159
Receive remote data ........................................................................................................ 160
Receive data from remote OkMap .......................................................................................................................... 160
Receive data from GpsGate.com ............................................................................................................................. 160
Utility functions ................................................................................................................ 161
Distance calculation ................................................................................................................................................ 161
Area calculation ....................................................................................................................................................... 161
Google Earth ............................................................................................................................................................ 161
Google Maps............................................................................................................................................................ 162
Maps server ............................................................................................................................................................. 162
Geocoding ............................................................................................................................................................... 163
Routing .................................................................................................................................................................... 164
Map tiling / Garmin custom maps ........................................................................................................................... 165
Orient a map to north .............................................................................................................................................. 166
Crop a map .............................................................................................................................................................. 167
Resize a map ............................................................................................................................................................ 168
GPSBabel converter ................................................................................................................................................. 168
Xslt transformations ................................................................................................................................................ 169
Calculator ................................................................................................................................................................ 170

OkMap – User manual November 1, 2012
Page 7
Create toponyms ..................................................................................................................................................... 171
Create photo list ...................................................................................................................................................... 172
Batch conversions of coordinates ............................................................................................................................ 172
Conversions of coordinates ...................................................................................................................................... 174
Distances and azimuth calculations ......................................................................................................................... 174
Convert vectorial data to GPX .................................................................................................................................. 176
Convert GPX to vectorial data.................................................................................................................................. 176
Convert toponyms to waypoints .............................................................................................................................. 177
Convert waypoints to toponyms .............................................................................................................................. 178
Grid tracks generator ............................................................................................................................................... 178
Preferences ......................................................................................................................... 180
Preferences - General ............................................................................................................................................... 180
Preferences - View ................................................................................................................................................... 181
Preferences - Proxy .................................................................................................................................................. 181
Preferences - Maps .................................................................................................................................................. 182
Preferences - DEM ................................................................................................................................................... 183
Preferences - Waypoints .......................................................................................................................................... 184
Preferences - Routes ................................................................................................................................................ 185
Preferences - Tracks ................................................................................................................................................. 186
Preferences – Graphs ............................................................................................................................................... 187
Preferences – Toponyms .......................................................................................................................................... 188
Preferences – Photos ............................................................................................................................................... 189
Preferences - Map icons .......................................................................................................................................... 190
Preferences - Map comments .................................................................................................................................. 191
Preferences - Vectorial data ..................................................................................................................................... 191
Preferences - Distance, area .................................................................................................................................... 192
Preferences - Routing ............................................................................................................................................... 193
Preferences - Grids ................................................................................................................................................... 194
Preferences - Georeference ..................................................................................................................................... 195
Preferences - GPS ..................................................................................................................................................... 196
Preferences - NMEA ................................................................................................................................................. 197
Preferences - Navigation.......................................................................................................................................... 198
Preferences - Compass ............................................................................................................................................ 199
Preferences - Satellites ............................................................................................................................................ 200
Preferences - Send OkMap ....................................................................................................................................... 201
Preferences - Receive OkMap .................................................................................................................................. 202
Preferences - GpsGate.com ..................................................................................................................................... 203
Preferences - Sounds ................................................................................................................................................ 204
Glossary ............................................................................................................................... 206
A .............................................................................................................................................................................. 206 Accuracy .............................................................................................................................................................. 206

OkMap – User manual November 1, 2012
Page 8
Actuality .............................................................................................................................................................. 206 Address matching ................................................................................................................................................ 206 ADSL .................................................................................................................................................................... 206 Aero photogrammetric restitution ...................................................................................................................... 206 Algorithm ............................................................................................................................................................. 206 Arc ....................................................................................................................................................................... 206 Area compared .................................................................................................................................................... 206 Attribute .............................................................................................................................................................. 206
B ............................................................................................................................................................................... 206 Backup ................................................................................................................................................................. 206 Band .................................................................................................................................................................... 207 Base mapping ...................................................................................................................................................... 207 BIL (Band Interleaved by Line) ............................................................................................................................. 207 BIP (Band Interleaved by Pixel) ........................................................................................................................... 207 Bit ........................................................................................................................................................................ 207 Buffer, buffering .................................................................................................................................................. 207 Byte ..................................................................................................................................................................... 207
C ............................................................................................................................................................................... 207 CAD (Computer Aided Design) ............................................................................................................................ 207 Check point .......................................................................................................................................................... 207 Class of elements ................................................................................................................................................ 207 Classification ........................................................................................................................................................ 207 Coherence ........................................................................................................................................................... 207 Compression ........................................................................................................................................................ 208 Conformal projections ......................................................................................................................................... 208 Connection .......................................................................................................................................................... 208 Connection .......................................................................................................................................................... 208 Curves of level ..................................................................................................................................................... 208
D .............................................................................................................................................................................. 208 Data Bank ............................................................................................................................................................ 208 Database.............................................................................................................................................................. 208 DBMS (Data Base Management System) ............................................................................................................ 208 Decompression .................................................................................................................................................... 208 Default ................................................................................................................................................................. 208 DEM (Digital Elevation Model) ............................................................................................................................ 208 Derived thematic maps ....................................................................................................................................... 208 Desktop ............................................................................................................................................................... 208 DIGEST ................................................................................................................................................................. 208 Digital mapping ................................................................................................................................................... 208 Digital .................................................................................................................................................................. 209 Digitizer ............................................................................................................................................................... 209 DIME (Dual Independent Map Encoding)............................................................................................................ 209 Directory .............................................................................................................................................................. 209 DTM (Digital Terrain Model) ............................................................................................................................... 209 DXF (Drawing eXchange File format) .................................................................................................................. 209 Dynamic segmentation ....................................................................................................................................... 209
E ............................................................................................................................................................................... 209 Eliosynchronous orbit.......................................................................................................................................... 209 Entity ................................................................................................................................................................... 209 Equidistant projections ....................................................................................................................................... 209 Equivalent projections......................................................................................................................................... 209 ERDAS .................................................................................................................................................................. 209 Esaustivity............................................................................................................................................................ 210
F ............................................................................................................................................................................... 210 Field ..................................................................................................................................................................... 210
G .............................................................................................................................................................................. 210 Gauss-Boaga ........................................................................................................................................................ 210 GB (Gigabyte) ...................................................................................................................................................... 210
OkMap – User manual November 1, 2012
Page 9
Genealogy............................................................................................................................................................ 210 Generalization ..................................................................................................................................................... 210 Geographic map .................................................................................................................................................. 210 Geographic projection ......................................................................................................................................... 210 Geographical Data Base ...................................................................................................................................... 210 Geographical database ........................................................................................................................................ 210 Geomarketing ...................................................................................................................................................... 210 Geometric congruence ........................................................................................................................................ 210 Georeference ...................................................................................................................................................... 211 Geostationary satellite ........................................................................................................................................ 211 Geosynchronous satellite .................................................................................................................................... 211 GIS (Geographical Information System) .............................................................................................................. 211 Global quality ...................................................................................................................................................... 211 GPS (Global Positioning System) ......................................................................................................................... 211 Graph ................................................................................................................................................................... 211 GRASS (Geographical Resource Analysis Support System) ................................................................................. 211 GRID..................................................................................................................................................................... 211 GUI (Graphical User Interface) ............................................................................................................................ 211
I ................................................................................................................................................................................ 211 IGES (Initial Graphics Exchange Standard) .......................................................................................................... 211 Image processing ................................................................................................................................................. 211 Informatics system .............................................................................................................................................. 211 Informative system ............................................................................................................................................. 212 Interpolation ....................................................................................................................................................... 212 ISDN ..................................................................................................................................................................... 212 Isogonic ............................................................................................................................................................... 212
K ............................................................................................................................................................................... 212 KB (Kilobyte) ........................................................................................................................................................ 212
L ............................................................................................................................................................................... 212 Lambert ............................................................................................................................................................... 212 LANDSAT .............................................................................................................................................................. 212 Latitude ............................................................................................................................................................... 212 Layer, Informative layer or Geographical layer ................................................................................................... 212 Layer .................................................................................................................................................................... 212 Legend ................................................................................................................................................................. 212 Library.................................................................................................................................................................. 212 Local quality ........................................................................................................................................................ 212 Logical congruence .............................................................................................................................................. 212 Logical expression ............................................................................................................................................... 213 Logical operator .................................................................................................................................................. 213 Longitude............................................................................................................................................................. 213
M ............................................................................................................................................................................. 213 Mass memory ...................................................................................................................................................... 213 MB (Megabyte) ................................................................................................................................................... 213 Metadata ............................................................................................................................................................. 213 Metric precision .................................................................................................................................................. 213 Mosaicing ............................................................................................................................................................ 213
N .............................................................................................................................................................................. 213 Nadir .................................................................................................................................................................... 213 Native format ...................................................................................................................................................... 213 Node .................................................................................................................................................................... 213 Nominal scale ...................................................................................................................................................... 213 NTF (National Transfer Format) .......................................................................................................................... 213
O .............................................................................................................................................................................. 213 Object .................................................................................................................................................................. 213 Open source ........................................................................................................................................................ 214 Orthogonalization ............................................................................................................................................... 214 Orthophotography .............................................................................................................................................. 214

OkMap – User manual November 1, 2012
Page 10
Overlay, topological overlay ................................................................................................................................ 214
P ............................................................................................................................................................................... 214 Pan ....................................................................................................................................................................... 214 Password ............................................................................................................................................................. 214 Path ..................................................................................................................................................................... 214 Photogrammetric ................................................................................................................................................ 214 Photo interpretation ........................................................................................................................................... 214 Photo plain .......................................................................................................................................................... 214 Pixel ..................................................................................................................................................................... 214 Plotter .................................................................................................................................................................. 214 Plug-in.................................................................................................................................................................. 214 Point .................................................................................................................................................................... 214 Polygon ................................................................................................................................................................ 214 Primary key .......................................................................................................................................................... 214 Process ................................................................................................................................................................ 214 Projection systems .............................................................................................................................................. 215 Projection ............................................................................................................................................................ 215
Q .............................................................................................................................................................................. 215 Query ................................................................................................................................................................... 215
R ............................................................................................................................................................................... 215 Raster image ........................................................................................................................................................ 215 Rasterization........................................................................................................................................................ 215 Record ................................................................................................................................................................. 215 Recording ............................................................................................................................................................ 215 Reference system ................................................................................................................................................ 215 Regression ........................................................................................................................................................... 215 Relational database ............................................................................................................................................. 215 Relationship ......................................................................................................................................................... 215 Resolution ........................................................................................................................................................... 216 RLC (Run Length Coded) ...................................................................................................................................... 216 Route ................................................................................................................................................................... 216 Routine ................................................................................................................................................................ 216
S ............................................................................................................................................................................... 216 Scale .................................................................................................................................................................... 216 Scanner ................................................................................................................................................................ 216 Secondary key ..................................................................................................................................................... 216 Semantic precision .............................................................................................................................................. 216 Sensor .................................................................................................................................................................. 216 Shortest path ....................................................................................................................................................... 216 Simple thematic maps ......................................................................................................................................... 216 SIT (Territorial Informative System) .................................................................................................................... 216 Spatial data .......................................................................................................................................................... 217 Spatial relationships ............................................................................................................................................ 217 SPOT (Système Probatoire d’Observation de la Terre) ....................................................................................... 217 SQL (Structured Query Language) ....................................................................................................................... 217 Symbols ............................................................................................................................................................... 217
T ............................................................................................................................................................................... 217 Table of attributes ............................................................................................................................................... 217 Template ............................................................................................................................................................. 217 Territorial continuity ........................................................................................................................................... 217 Thematism ........................................................................................................................................................... 217 Theodolite ........................................................................................................................................................... 217 TIFF (Tag Image File Format) ............................................................................................................................... 217 TIGER (Topologically Integrated Geographic Encoding and Referencing) .......................................................... 217 TIN (Triangulated Irregular Network) .................................................................................................................. 217 Topology .............................................................................................................................................................. 218 UMTS ................................................................................................................................................................... 218
U .............................................................................................................................................................................. 218
OkMap – User manual November 1, 2012
Page 11
User-name ........................................................................................................................................................... 218 User interface ...................................................................................................................................................... 218 UTM (Universal Transverse Mercator) ................................................................................................................ 218
V............................................................................................................................................................................... 218 Vectorial .............................................................................................................................................................. 218 Vectorialization ................................................................................................................................................... 218
W ............................................................................................................................................................................. 218 Wizard ................................................................................................................................................................. 218
Z ............................................................................................................................................................................... 218 Zenith .................................................................................................................................................................. 218 Zoom ................................................................................................................................................................... 218

OkMap – User manual November 1, 2012
Page 12
Installation
Software installation
After downloaded the installation kit of OkMap, use WinZip program to unzip the file. Warning: Before installing OkMap is necessary, if not already installed, download
Microsoft Framework 3.5 SP 1 and install it on your computer.
To install OkMap open the setup_<version>.exe file; it displays the following window:
Select your language and then press the OK button.
Read the contents of the page and press the Next button.

OkMap – User manual November 1, 2012
Page 13
First you must carefully read the user agreement and express acceptance (press the I accept the agreement option).
Press the Next button.
Read carefully the page content, with particular regard to the prerequisites, and press the Next button.

OkMap – User manual November 1, 2012
Page 14
In this window you can choose the target directory where install the files.
If you haven’t special reasons leave the default suggested by the installer.
Then press the Next button.
In this window you can select additional tasks to perform:
Create a desktop icon Associate to OkMap some file extensions
Then press the Next button.

OkMap – User manual November 1, 2012
Page 15
Check settings and then press the Install button.
The program will proceed now to the installation OkMap; the process can take a few moments.
At the end the following window appears:

OkMap – User manual November 1, 2012
Page 16
The program was properly installed. You can select if lauch OkMap now.
Press the Finish button to exit. The installer will automatically create an entry in Start - All programs - OkMap.
When an error occurs When an error occurs, perform the following steps:
Make sure you have correctly installed Microsoft Framework 3.5 SP1. Uninstall any previous installations of OkMap.
Delete directories:
Windows XP:
C:\Documents and Settings\<user>\Impostazioni locali\Dati applicazioni\GianPaoloSaliola
C:\Documents and Settings\<user>\Dati applicazioni\GianPaoloSaliola
Windows 7:
C:\Users\<user>\AppData\Local\GianPaoloSaliola
C:\Users\<user>\AppData\Roaming\GianPaoloSaliola
Reinstall OkMap. If after these attempts the error persists, please contact us.

OkMap – User manual November 1, 2012
Page 17
Organization of the screen
Multi document interface
When you activate the program OkMap, it displays its main window. This window serves as
a container and host inside another window (multi document interface). OkMap allows working with multiple maps simultaneously. To open, for instance, a new window map, use the menu File – Load - Map. The windows opened inside the main windows can be “docked“. You can use the mouse to “drag & dock” windows or undock them. When you close this window, main OkMap automatically closes all windows in it and
terminates. Closure of the application may be subject to confirmation as specified in the function Preferences – General.
Menu
Menu items, generally located above the toolbar, are the usual way to activate the functions of the program.
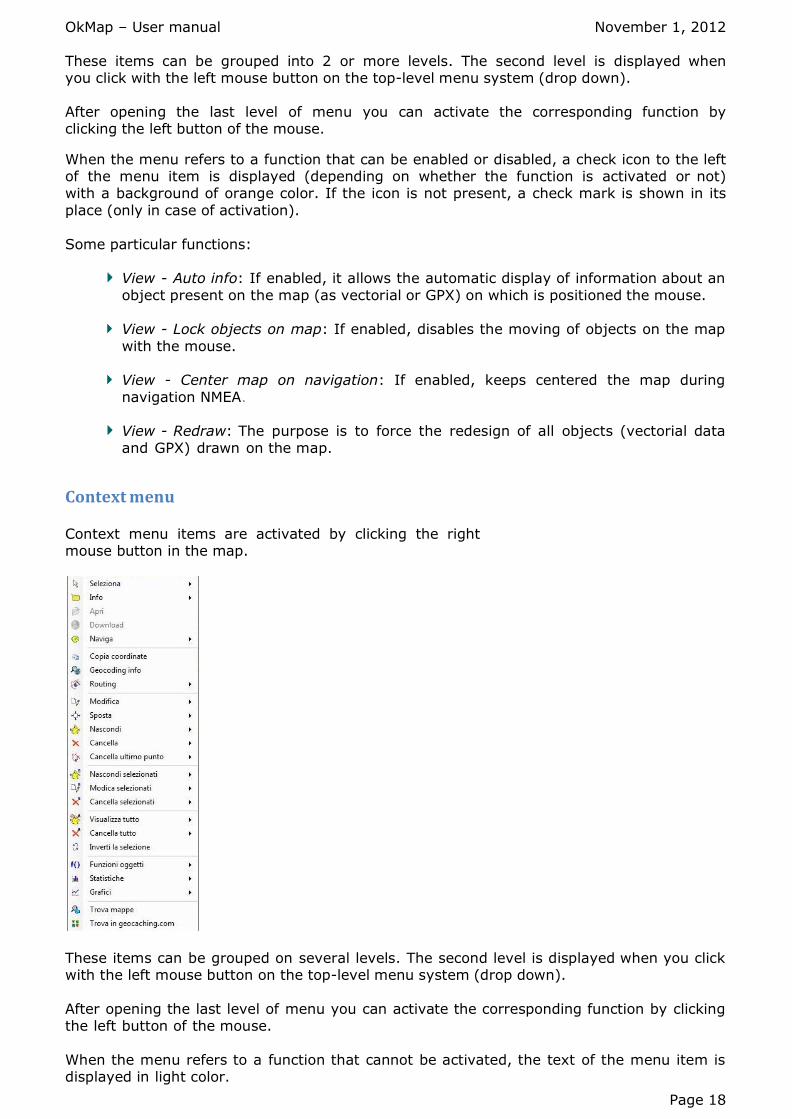
OkMap – User manual November 1, 2012
Page 18
These items can be grouped into 2 or more levels. The second level is displayed when you click with the left mouse button on the top-level menu system (drop down).
After opening the last level of menu you can activate the corresponding function by clicking the left button of the mouse. When the menu refers to a function that can be enabled or disabled, a check icon to the left of the menu item is displayed (depending on whether the function is activated or not) with a background of orange color. If the icon is not present, a check mark is shown in its
place (only in case of activation).
Some particular functions:
View - Auto info: If enabled, it allows the automatic display of information about an
object present on the map (as vectorial or GPX) on which is positioned the mouse.
View - Lock objects on map: If enabled, disables the moving of objects on the map
with the mouse. View - Center map on navigation: If enabled, keeps centered the map during
navigation NMEA.
View - Redraw: The purpose is to force the redesign of all objects (vectorial data
and GPX) drawn on the map.
Context menu Context menu items are activated by clicking the right mouse button in the map.
These items can be grouped on several levels. The second level is displayed when you click with the left mouse button on the top-level menu system (drop down).
After opening the last level of menu you can activate the corresponding function by clicking the left button of the mouse.
When the menu refers to a function that cannot be activated, the text of the menu item is displayed in light color.

OkMap – User manual November 1, 2012
Page 19
Activated functions may concern:
The single subject on which you place the mouse pointer All the selected objects of a type
All the selected objects All the objects of a type All the object
The point on the map where is located the mouse
Toolbar
The toolbar is a convenient shortcut to activate the program functions as an alternative to
the menu items. There are as many toolbars as are the main items of the menu (level 1).
The toolbars contain some images (icons) that correspond to as many menu items. Each icon represents a function that can be activated by clicking on it with the left mouse button.
Placing the mouse for at least 2 seconds on an icon, appears the description of the corresponding function (tooltip).
The toolbars can be displayed or not using the Toolbar menu item.
The toolbars can be moved by dragging with the left mouse button; when the application
ends, the position of the toolbars is saved, and proposed the next time. The menu item Toolbar - Reset replaces the toolbars in the positions saved the last time. The
menu Toolbar – Default replaces the toolbars in the original position (the ones proposed for a new installation of OkMap).
Status bar
The status bar is positioned in the underside of the main window and is used to display
some indicators.
The status bar is divided into three tabs and all the indicators inside are read-only.
Placing the mouse for at least 2 seconds on an indicator, appears the meaning description (tooltip).
The first tab contains the following indicators:
Number of loaded waypoints
Number of loaded routes Number of loaded tracks
Number of loaded toponyms Number of loaded photos The remote data receiving status by OkMap server (receiving / not receiving)
The last position sent to an OkMap remote server The remote GpsGate.com receiving status (receiving / not receiving) The remote data receiving status by GpsGate.com server

OkMap – User manual November 1, 2012
Page 20
The second tab contains the following indicators:
Size of the current map in pixels Position of the mouse pointer in pixel (X and Y) Reference Datum
UTM zone on the mouse pointer Longitude and latitude of the mouse pointer (express in the form specified in the function Preferences - General)
Alternative grid East and north coordinates of the mouse pointer Altitude of the mouse pointer (1) (the unit of measurement is expressed as specified in the function Preferences – Distance, area)
The third tab contains the following indicators:
Size of the current map in pixels
Reference Datum Projection used by map Center of longitude and latitude (express in the form specified in the function
Preferences - General) Zoom Factor (%) for raster maps or scale (meters / pixel) for vectorial maps
Calculated distance between various points with the tool Distance (the unity of measure is express according to what specified in the function Preferences – Distance. area)
Calculated area of a polygon formed by the points specified with the tool Area (the unity of measure is express according to what specified in the function Preferences Distance, area)
(1) - the altitude is shown only if in the folder ..\OkMap\data\dem has been placed the DEM (digital earth model) data files in SRTM-1 or SRTM-3 format (file with extension "hgt"). The DEM data can be automatically downloaded provided you have an internet connection
(v. Download DEM data).
File manager
It’s an utility function to manage opened files.

OkMap – User manual November 1, 2012
Page 21
The file types are:
Maps Waypoints, routes, tracks
Toponyms Photos Predefined projections (one system file)
Datum (one system files)
The item listed can be expanded or collapsed to simplify reading.
The selected files are colored in blue while the icon underline the modified files.
There is a context menu specialized for each file type and single file.
Area map
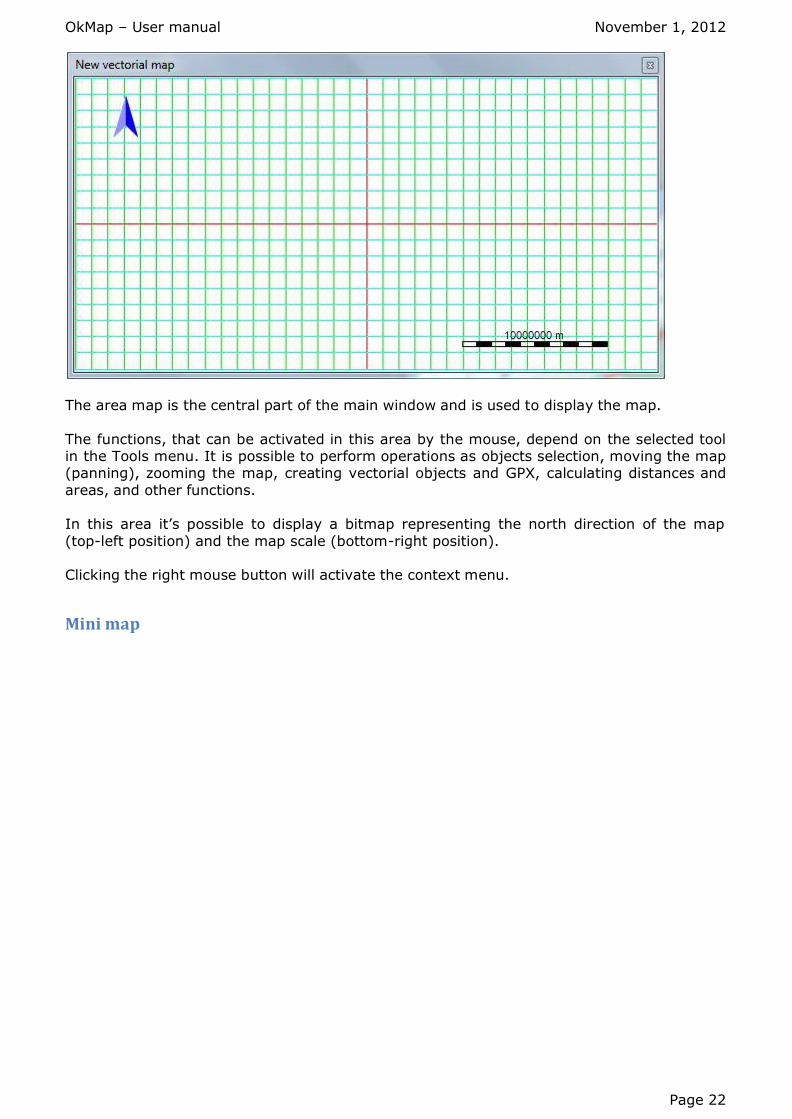
OkMap – User manual November 1, 2012
Page 22
The area map is the central part of the main window and is used to display the map.
The functions, that can be activated in this area by the mouse, depend on the selected tool in the Tools menu. It is possible to perform operations as objects selection, moving the map (panning), zooming the map, creating vectorial objects and GPX, calculating distances and
areas, and other functions. In this area it’s possible to display a bitmap representing the north direction of the map
(top-left position) and the map scale (bottom-right position). Clicking the right mouse button will activate the context menu.
Mini map

OkMap – User manual November 1, 2012
Page 23
The mini map is used to display the full image of the map in a small window (thumbnail).
It constitutes an overview and a valuable aid for panning (moving the main map).
It can be viewed only in case of raster map.
To display / hide the mini map use the menu View - Thumbnail.
By clicking the left button of the mouse, on a point on the mini map, you will get moving (panning) of the main map, in order to view this point in the middle of the screen.
A rectangle of red color, displayed within the mini map, identifies the portion of the map displayed in the main area. Obviously the size of the rectangle depends on the zoom factor selected.

OkMap – User manual November 1, 2012
Page 24
Lens
The lens is used to view an enlarged image of the map in the neighborhood of the mouse pointer.
It is an aid to precision operations such as then calibration of a raster map or the creation of a waypoint.
Can be viewed only in case of raster map.
To display / hide the mini map use the View - Lens menu.
Moving the mouse pointer in the main area of the map, the window will automatically display the mini map zoomed around that point.

OkMap – User manual November 1, 2012
Page 25
Data tables
To represent lists of structured information is often used tables or grids of data. The table would consist of the following parts:
A header consisting of several cells containing the column headings. A central body containing the cells belonging to different rows and columns of the table.
The first column contains the line numbers (not editable). A possible last line where you can insert new elements (if the insertion is a function provided in that context).
A vertical scroll bar to the right of the table and displayed only if the number of rows exceeds the visible space available.
A horizontal scroll bar at the base of the table and displayed only if the number of columns exceeds the visible space available.
Some fields are editable while non-editable fields are highlighted with a gray background.
Above the data tables often appear some fields (usually one or two) that allow you to filter the data shown in the below table rows.
To filter the data is sufficient to choose the column to filter in the combo box and type, in the adjacent field, the value to use as filter (inside value).
To scroll the table vertically using the vertical scroll bar to the right of the table itself, or use the mouse wheel.
To scroll the table horizontally and then displays the columns to the right of the table, use the horizontal scroll bar at the base of the table.
To insert new elements (if any) scroll the table vertically and go to the last blank line designed for that purpose.

OkMap – User manual November 1, 2012
Page 26
To change the display order of the rows click with the left mouse button on the head of the table at the column for which you want to get the sort of rows; a further click will change the sort order alternately from ascending to decreasing.
To change the display order of columns, click the left mouse button on the heading of the column you want to move; then drag the heading cell in the desired position and then
release the mouse button.
To select a row click the left mouse button on the column containing the line numbers in the
row to be selected; holding down the Ctrl key you can add additional rows to your selection; holding down the Shift key you can select rows between the current line and the previously selected line.
To select all rows simply click with the left mouse button on the heading of the column containing the row numbers.
Selected lines can be copied to the clipboard using the button Cntr+C. Lines copied can be pasted into an editor or a spreadsheet.
To delete the selected rows (if any) press the Canc key; the program will ask for confirmation before proceeding with deleting.
To increase or decrease the width of a column position the mouse on the heading of the table at the end of the column you want to resize; a sizing cursor will be displayed; hold the
left mouse button and drag the end of column left (enlargement) or right (narrowing); so, at the size desired, release the mouse.
To restore the size of columns in the native state press the right mouse button at the table
and choose context menu Default grid layout.
To increase or to decrease the height of a row position the mouse on the first column of the
table (line number) at the end of the line you want; a sizing cursor will be displayed; hold the left button the mouse and drag the end of the row down (enlargement) or upwards (narrowing); so, at the size desired, release the mouse.
OkMap – User manual November 1, 2012
Page 27
Datum
The shape of the Earth The shape of the Earth can be approximated, in an ever more precise, to:
A sphere. An ellipsoid or spheroid (ellipsoid of revolution): that can be mathematically defined by the semi-major axis and the flattening at the poles.
A geoid: that would coincide with the surface of the sea if he ranges widely over the
planet with the same density and temperature and in absence of disturbances due to
winds and tidal currents.
Datum definition
A datum defines a system of coordinates through:
The ellipsoid of reference (semi-major axis and flattening). The position of the ellipsoid from the center of the Earth (3 spatial coordinates: x, y, z).
Each reference ellipsoid takes a specific name (e.g.: Bessel 1841, Clarke 1866, International 1924, WGS84, etc.).
There are many datum reference because:
Historically there has never been need of an universal univocal system.
Some datum allow you to maximize the accuracy locally.
Several datum can refer to the same ellipsoid. What distinguishes these datum is the
position of the ellipsoid to the center of the Earth. These datum are used in various regions to achieve greater accuracy in the local area.
Even the datum are defined with a unique name that recalls the name of the ellipsoid and the region where they are required, such as South American 1969 (Brazil).
In recent years it has felt the need to establish an international datum (WGS84) with origin at the center of the Earth (x=y=z=0).
Coordinate systems
The spherical coordinates are measured in latitude and longitude. These angles are measured in degrees from the center of the earth to a point on the surface.
The latitude varies from the north pole (90) decreases to the Equator (0) and decreasing
further to the south pole (-90).
The longitude varies from the Greenwich meridian (0) growing towards the east to the meridian opposite (180) and decreases towards the west to the same meridian opposite (-180).
When you express the spherical coordinates is always necessary to indicate the reference datum because different datum provide different coordinates for the same point.
A direct projection transforms a spherical coordinates system in a Cartesian coordinate system, while a reverse projection makes the opposite.
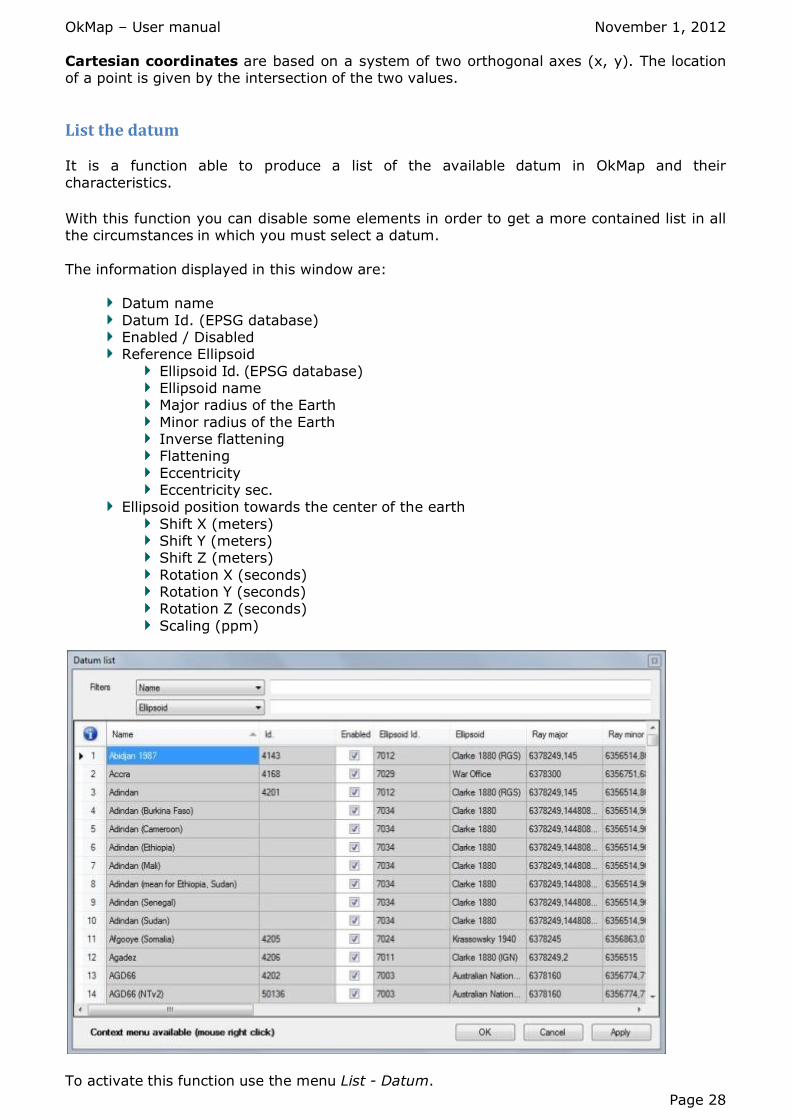
OkMap – User manual November 1, 2012
Page 28
Cartesian coordinates are based on a system of two orthogonal axes (x, y). The location of a point is given by the intersection of the two values.
List the datum
It is a function able to produce a list of the available datum in OkMap and their
characteristics.
With this function you can disable some elements in order to get a more contained list in all the circumstances in which you must select a datum.
The information displayed in this window are:
Datum name
Datum Id. (EPSG database) Enabled / Disabled Reference Ellipsoid
Ellipsoid Id. (EPSG database) Ellipsoid name Major radius of the Earth
Minor radius of the Earth Inverse flattening Flattening
Eccentricity Eccentricity sec.
Ellipsoid position towards the center of the earth
Shift X (meters) Shift Y (meters) Shift Z (meters)
Rotation X (seconds) Rotation Y (seconds) Rotation Z (seconds)
Scaling (ppm)
To activate this function use the menu List - Datum.
OkMap – User manual November 1, 2012
Page 29
To enable or disable a datum, click on the Enabled column in the row on the datum to be
modified, a checkmark will indicate if the row is active or not.
To save the modified data press the Apply button.
To save the changed data and exit function press the Ok button. To exit without saving the data, press the Cancel button. For more information about the general use of tables, see the topic Data tables.
Add custom datum
OkMap has a large number of predefined datum and normally should not be asked to define your own.
In every case, if the user wants to add datum not in the list, he may do so by changing a
definition file OkMap.
For more information on obtaining a list of datum see the topic List the datum.
CAUTION the following procedure is for the exclusive use of advanced users because it can determine the improper functioning of OkMap.
To add a new datum with an editor modify the following definition file: C:\Documents and Settings\"utente"\Dati applicazioni\GianPaoloSaliola\OkMap\"versione"\defs\Datums.xml.
CAUTION before you edit the file make a backup copy because if the changes are not
correctly made, OkMap during start-up will cause an irreversible error.
Go to the end of the file and before the closing end tag /datums, insert, copying it from a
existent datum, all the rows between the tags (including) datum and /datum. Then change the contents being careful to give a unique name for the new datum worth the incorrect operation of OkMap. CAUTION Use the decimal point in U.S. notation.
At the end of the changes save the file and relaunch OkMap. If the system does not start, restore the backup file made previously using the original name
If OkMap still does not work probably the repaired file is not correct. You can still solve the problem uninstall and reinstall OkMap.
WARNING Each time you reinstall OkMap your customizations will be lost. Store, in a folder, a file containing your custom datum so they can reenter after you reinstall a new OkMap version.

OkMap – User manual November 1, 2012
Page 30
Default projections/datum
What is a projection
A projection of a cartographic map is a mathematical formula used to convert the three- dimensional shape of the earth's surface in a two-dimensional shape as a map (direct
projection) and back (reverse projection).
Classification according to spatial properties
Since the earth's surface is curved, the process of projection distorts always one or more of the following spatial properties:
areas distances angles
There are many types of projection each of one capable of representing one or more
spatial properties but not all at once.
The projections are grouped into categories according to the spatial properties that are able to represent:
Equivalent or Equal-area: the areas of all regions are represented in the same proportion of the original surface, e.g. maintain the relationship between the
surfaces. Shapes, angles and dimensions are distorted in most areas of the map.
Equidistant: maintain a constant scale along all the great circles (the shortest distance between two points). No projection can be both equivalent and equidistant because the requirements of scale for compliance and for the equivalence are contradictory.
Conforming or isogonic or orthomorfic: preserves angles. The compass rose is the same in every point on the surface of the globe (except the poles). It is impossible that a projection is both conform and equivalent.
Classification according to geometric principles
The projections are further classified based on geometric principles on which they are
based:
Perspective: they are obtained by a plane tangent to the sphere at any point of the
same and by the variation of the observation point, are distinguished in: Centrographic: the point of observation coincides with the center of the sphere and projected on the plane of polar gnomonic map.
Stereographic: the observation point is on the surface of the sphere opposite to the projection plane.
Orthographic: infinity and is projected on the tangent plane at the opposite
pole.
Conic: are made by projecting the points of the sphere on a cone tangent to a parallel.
Cylindrical: are obtained by wrapping the globe with a cylinder tangent to the equator.
Mathematics: are used to realize small scale maps and representing the entire
surface of the Earth in the form of circles, ovals or other shapes also interrupted.

OkMap – User manual November 1, 2012
Page 31
Most used projections
Here is a list of most used map projections and their scope of use (the list is alphabetical and
not in order of importance):
Albers Equal-area Conic: Equivalent, Conic. Used for large regions that extend
from east to west. Equidistant Conic: Equidistant, Conic. Used for mid latitudes and small regions. Lambert Azimuthal Equal-area: Equivalent, azimuthal. Used for the polar regions.
Lambert Conformal Conic: Conforming, Conic. Used for large regions that extend from east to west.
Mercator: Conforming, Cylindrical. Used for the regions bordering the equator. Useful because the nautical lines are straight.
Miller: Cylindrical, not Conforming not Equivalent. For atlases and maps that require
little distortion near the polar regions. Oblique Mercator: Conforming, Cylindrical. Used for areas that extend obliquely so the equator.
Orthographic: Azimuthal, not Conforming not Equivalent. Used to produce a view of Earth seen from space.
Robinson: Pseudocylindrical, not Conforming not Equivalent. Mainly used for the
production of atlases. Sinusoidal: Pseudocylindrical, Equivalent. Used for large areas (Africa, South America) which has a north-south extension.
Stereographic: Azimuthal, Conforming. Used for the polar regions. Transverse Mercator: Cylindrical, Conforming. Used mainly in the region that extends north-south.
Projections used according to the scale
Here is a list of projections that are most appropriate for use according to the scale to be adopted:
World: Mercator, Miller and Robinson.
Hemisphere: Lambert Azimuthal Equal-area and Stereographic Continent, oceans and regions: Albers Equal-area Conic, Equidistant Conic (Simple Conic), Lambert Azimuthal Equal-area, Lambert Conformal Conic,
Stereographic, and Transverse Mercator Medium and large scale: Lambert Conformal Conic, Stereographic and Transverse Mercator
Usable projections with OkMap
OkMap currently implements the following projections:
Longitude / Latitude
Mercator Mercator 2SP Transverse Mercator
Oblique Mercator Hotine Oblique Mercator Lambert Conformal Conic
Lambert Conformal Conic 2SP Albers Conical Equal Area Orthographic
Cassini-Soldner Bonne

OkMap – User manual November 1, 2012
Page 32
Projection parameters
The mathematical models that are based on map projections are characterized by a set of
parameters that define how to transform coordinates in Cartesian coordinates.
The type and the number of the parameters depend on the projection in question. The following chart illustrates the parameters for all the projections used in OkMap.
Projection x0 y0 lam0 phi0 k0 azim bear phi1 phi2
Longitude / Latitude x x x x
Mercator x x x x x
Mercator 2SP x x x x x x
Transverse Mercator x x x x x
Oblique Mercator x x x x x x x
Lambert Conformal Conic x x x x x
Lambert Conformal Conic 2SP x x x x x x x
Orthographic x x x x
Cassini-Soldner x x x x x
Bonne x x x x
where:
Parameter Description
x0 False East / Linear value applied to the origin of the coordinate x
y0 False North / Linear value applied to the origin of the coordinate y
lam0 Central meridian - Longitude of the origin of the map (-180, 180)
phi0 Central parallel - Latitude of the origin of the map (-90, 90)
k0 Scale factor at the central meridian (0.1, 1.0)
azim Azimuth of the line that passes through the center of projection (-90, 90)
bear Direction of the center of the line (-90, 90)
phi1 First standard parallel (-90, 90)
phi2 Second standard parallel (-90, 90)
List the default projections/datum
It is a function able to produce a list of the predefined projections / datum in OkMap and their characteristics.
This list represents the set of projections / datum most commonly used in the compilation of maps and is made available to the user to make ease the task of
georeferencing of raster maps.
With this function you can disable some elements in order to get a more contained list in all the circumstances in which you must select a default projection / datum.
The information displayed in this window are:
Predefined projection / datum name Predefined projection / datum Id. (EPSG database) Enabled / Disabled
Country Projection name False east
False north Center of the longitude Center of the latitude
Scale factor x

OkMap – User manual November 1, 2012
Page 33
Scale factor y Center line azimuth Center line bearing
First standard latitude Second standard latitude
To activate this function use the menu List - Presets.
To enable or disable a predefined projection / datum, click on the Enabled column in the row on the datum to be modified, a checkmark will indicate if the row is active or not.
Some lines are not activated because the corresponding projection is not implemented in OkMap.
To save the modified data press the Apply button. To save the changed data and exit function press the Ok button. To exit without saving the data, press the Cancel button.
For more information about the general use of tables, see the topic Data tables.
Add custom projections/datum
OkMap has a large number of predefined projections / datum and normally should not be asked to define your own.
In every case, if the user wants to add projections / datum not in the list, he may do so by
changing a definition file OkMap.
For more information on obtaining a list of predefined projections / datum see the topic List
the projections / datum.

OkMap – User manual November 1, 2012
Page 34
CAUTION the following procedure is for the exclusive use of advanced users because it can determine the improper functioning of OkMap.
To add a new projection / datum with an editor modify the following definition file: C:\Documents and Settings\"user"\Dati
applicazioni\GianPaoloSaliola\OkMap\"versione"\defs\ProjectionPresets.xml.
CAUTION before you edit the file make a backup copy because if the changes are not correctly made, OkMap during start-up will cause an irreversible error.
Go to the end of the file and before the closing end tag /projectionPresets, insert, copying it from a existent projection / datum, all the rows between the tags (including)
projectionPreset and /projectionPreset. Then change the contents being careful to give a unique name for the new projection / datum worth the incorrect operation of OkMap. You must use an existing projection and an existing datum. CAUTION Use the decimal point in
U.S. notation.
At the end of the changes save the file and relaunch OkMap. If the system does not start, restore the backup file made previously using the original name
If OkMap still does not work probably the repaired file is not correct. You can still solve the
problem uninstall and reinstall OkMap.
WARNING Each time you reinstall OkMap your customizations will be lost. Store, in a
folder, a file containing your custom datum so they can reenter after you reinstall a new OkMap version.
OkMap – User manual November 1, 2012
Page 35
Maps
Types of maps
Cartographic programs can be divided into two categories: those that use georeferenced vectorial cartography, usually purchased on a CD (vectorial maps) , and those that use a
graphic file (.tif,. jpg,. bmp etc..), purchased or obtained by scanning a paper map and then properly georeferenced or calibrated (raster maps).
OkMap can use both the types of maps, even simultaneously.
Raster map includes a digital image of a map previously submitted to a process of
calibration (georeferencing). The calibration process allows you to store additional information to the image of the map so that OkMap can always learn, according to the coordinates in pixels, the real coordinates relative and vice versa.
The calibration o f a raster map can be made as long as you know:
the projection system used for drawing the map and the relative parameters (e.g.
center of the projection, etc.) the map datum the correspondences between the absolute coordinates of the map (in pixel) and the
geographical coordinates of at least 2 points (preferably 3 or more)
Raster maps can be used as background for the representation of waypoints (points of interest), routes and tracks and as background for navigation.
Vectorial maps means a rectangle of some size on which to draw a certain amount of vectorial data (points, lines, polygons) that represent a specific territory in its various forms (dividing lines, rivers, lakes, roads, etc..).
The creation of a vectorial map needs to know:
the projection system used for drawing the map and the relative parameters (e.g.
center of the projection, etc.) the map datum the scale factor (e.g. meters for pixel)
Vectorial maps can be used, like the raster maps as background for the representation of
waypoints (points of interest), routes, tracks and as background for navigation.
Calibrate a raster map The calibration of a raster map is the process of georeferencing which enables the software to know the geographical coordinates of any point (expressed in pixel coordinates)
of the image of the map and vice versa.
A video is available for this function. The method provides for the transformation of coordinates into distances from the center of the map (expressed in meters) and then solving a system of linear equations that
determine the calibration coefficients of the map.
The method of transformation of coordinates used and the number of coefficients determined, depend on the number of points suggested in the calibration of the map.
OkMap uses the following methods:
similarity - when two points of calibration are suggested. Four coefficients are

OkMap – User manual November 1, 2012
Page 36
determined to manage the scale (scaling or stretching) and the displacement (shifting)
affine - when three points of calibration are suggested. Six coefficients are
determined to manage the scale (scaling or stretching), the rotation and the distortion (rotation or skewing) and displacement (shifting) similar with average of the coefficients - when are suggested more than three
points of calibration. The similar method is used by taking three points at a time and finally made the average of the coefficients.
Currently no method is used for higher-order polynomial (non-linear) that would georeference maps deformed in a non-uniform way.
The calibration process in OkMap includes the following steps.
Opening the image file that represents the map to be calibrated using the menu File - New - Raster map. A panel, containing the information needed for calibration, is opened on the right side of the main content.
For convenience the panels Mini map and Lens are activated to facilitate the operations of
selecting reference points.
First you press the Map setup button. Do not do this means to indicate the WGS84 datum and Longitude / Latitude as projection.
A series of windows (wizard) that allow you to specify the characteristics of the map (name, description, datum, projection and its parameters) are displayed.
To switch between windows using the Next > and< Previous buttons. To close the wizard press the End button; to cancel it press the Cancel button.
The first window is used to indicate the name and description of the map (both optional).

OkMap – User manual November 1, 2012
Page 37
The next window is to indicate with a simple selection: reference datum, projection type
and relative parameters.
The data are contained in a database that covers a large number of definitions used by most nations in the layout their own maps.
The list shows only the presets of datum / projection active. To enable or disable one or
more definitions use the function List - Presets.
After making your selection, the wizard ends. If it was not possible to identify the
characteristics of the map that is georeferenced, you can proceed to a manual selection of information leaving the selection blank and press the Next > button.
In this case a window for setting the datum used by the map is displayed.

OkMap – User manual November 1, 2012
Page 38
The list shows only the active datum. To enable or disable one or more datum to use the List
- Datum function.
Going forward, a window is displayed to define the type of projection used by the map.
If the desired projection does not appear in the list and the area of the map covers a small area, you can get a good approximation by selecting the Longitude / Latitude projection.
Once selected the projection, press the Parameters button to indicate the parameters of the
projection.
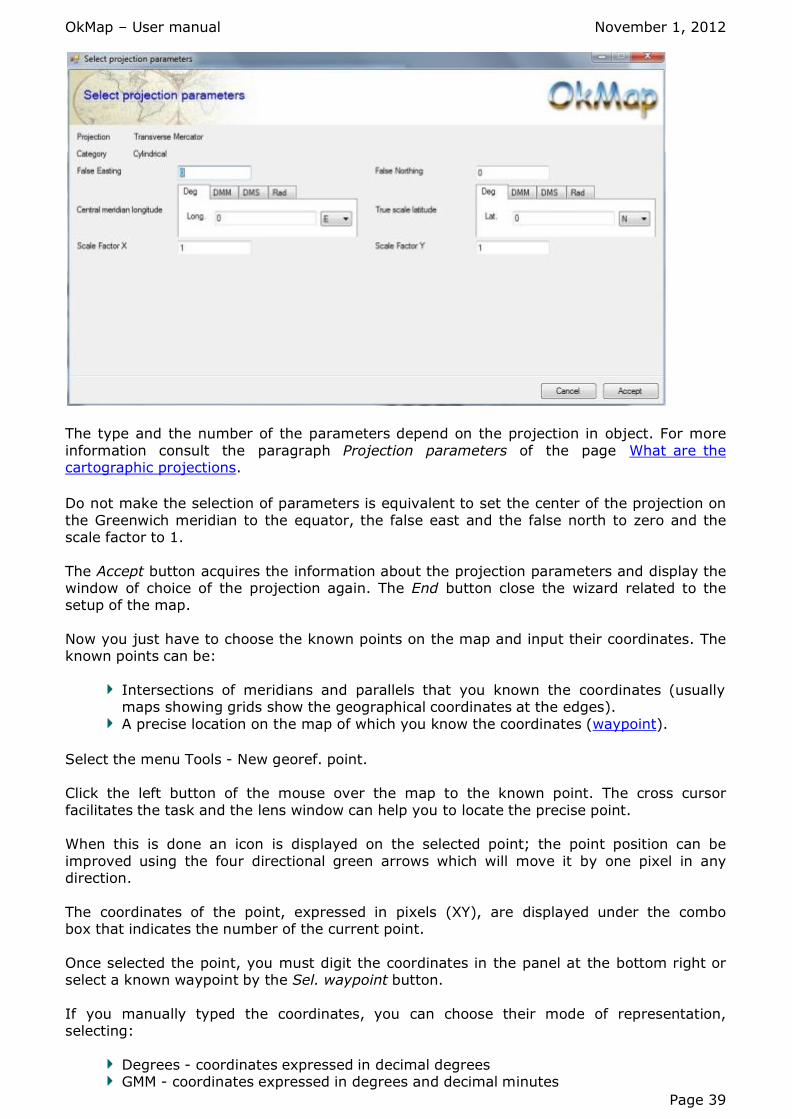
OkMap – User manual November 1, 2012
Page 39
The type and the number of the parameters depend on the projection in object. For more
information consult the paragraph Projection parameters of the page What are the cartographic projections.
Do not make the selection of parameters is equivalent to set the center of the projection on
the Greenwich meridian to the equator, the false east and the false north to zero and the scale factor to 1.
The Accept button acquires the information about the projection parameters and display the window of choice of the projection again. The End button close the wizard related to the setup of the map.
Now you just have to choose the known points on the map and input their coordinates. The known points can be:
Intersections of meridians and parallels that you known the coordinates (usually maps showing grids show the geographical coordinates at the edges).
A precise location on the map of which you know the coordinates (waypoint).
Select the menu Tools - New georef. point.
Click the left button of the mouse over the map to the known point. The cross cursor
facilitates the task and the lens window can help you to locate the precise point. When this is done an icon is displayed on the selected point; the point position can be
improved using the four directional green arrows which will move it by one pixel in any direction.
The coordinates of the point, expressed in pixels (XY), are displayed under the combo box that indicates the number of the current point.
Once selected the point, you must digit the coordinates in the panel at the bottom right or select a known waypoint by the Sel. waypoint button.
If you manually typed the coordinates, you can choose their mode of representation, selecting:
Degrees - coordinates expressed in decimal degrees GMM - coordinates expressed in degrees and decimal minutes

OkMap – User manual November 1, 2012
Page 40
GMS - coordinates expressed in degrees, minutes and decimal seconds UTM - coordinate expressed in UTM (east, north, zone and hemisphere) Rad - expressed in decimal radiant
If the Sel. waypoint button is pressed, a table containing the list of selectable waypoint is displayed.
For more information about the general use of tables, see the topic Data tables.
To select a waypoint, select a row and press the Apply button or simply double-click with the left mouse button in the row to be selected.
To facilitate the search of a waypoint, fill the Find field with the leading characters of the column on which the sort order is selected.
To add a new georeferencing point use the Add button. The current point is displayed on the map with an icon surrounded by a rectangle.
The combo box Point displays the number of the current point. The current point can be changed and its coordinates (if already typed) will be automatically displayed.
A point and its coordinates can be deleted with the Remove button. To complete the process of georeferencing you must input at least two points (preferably
three or more) and then press the Accept button. Avoid choosing positions lined up in the two aces because the georeferencing would
result few reliable or in some cases it would be impossible to resolve the system of equations on the basis of the determination of the coefficients of calibration.
Create a vectorial map
The procedure for creating a vectorial map in OkMap includes the following steps. Use the menu File - New - Vectorial map to display a series of windows (wizard) to help
identify the characteristics of the map (name, description, datum, projection and its parameters).
To switch between windows use the Next > and< Previous buttons. To close the wizard to press the End button; to cancel it press the Cancel button.
The first window is used to indicate the name and description of the map (both optional).

OkMap – User manual November 1, 2012
Page 41
The next window is used to indicate the geographical limits of the vectorial map you are creating.
The geographical bounds are expressed in terms of minimum coordinates (geographical position at the top left of your map) and maximum coordinates (geographical position at the bottom right).
Can be chosen mode of representation of the coordinates, selecting:
Degrees - coordinates expressed in decimal degrees GMM - coordinates expressed in degrees and decimal minutes GMS - coordinates expressed in degrees, minutes and decimal seconds
UTM - coordinate expressed in UTM (east, north, zone and hemisphere) Rad - expressed in decimal radiant
The next window is to indicate with a simple selection: reference datum, projection type and its parameters, using a database that contains a large number of definitions used by most nations in the layout their own maps.

OkMap – User manual November 1, 2012
Page 42
The list shows only the presets of datum / projections active. To enable or disable one or more definitions use the function List - Presets.
Once you select the wizard ends. If it was not possible to identify the characteristics of the map you are creating, you can proceed to a manual selection of information, leaving empty the selection field and pressing the Next > button.
In this case a window is displayed to define the datum used by the map.
The list shows only the presets of datum / projections active. To enable or disable one or more definitions use the function List datum.
Going forward, a window is displayed to define the type of projection used by the map.

OkMap – User manual November 1, 2012
Page 43
Once selected, press the Parameters button to indicate the projection parameters.
The type and number of parameters depend on the projection in question. For more
information refer to the projection parameters of topic Projection parameters of the page What are the cartographic projections.
Do not make the selection of parameters is equivalent to set the center of the projection on
the Greenwich meridian to the equator, the false east and north to zero and the scale factor to 1.
The Accept button acquire information about the parameters and redisplays the window of choice of the projection. The End button ends the wizard related to the creation of the map.
Once finished the procedure, you will see a blank map on which you can design your own vectorial data or import them from external files.

OkMap – User manual November 1, 2012
Page 44
It is also possible to modify the grids properties, as for raster maps, through the menu File - Modify - Grid parameters.
Save a map in OkMap format Once the calibration procedure of a raster map, the creation of a vectorial map or the
variation of the attributes of a map is finished, it is possible to save the new characteristics in a definition file with extension .okm.
To save the map use the menu File - Save – Map; then choose to save the file as OkMap in the Save as combo.
If it is a raster map, the file must reside in the same folder as the image file. Exception to this rule are the maps of image files that are stored in the folder specified in the function
Preferences - Maps, in the field Alternative image map folder; the files .okm that relate to these images can be saved in any folder.
By default, the last file .okm opened is proposed.
The above is particularly useful if the map images are stored on a DVD (you cannot store their files .okm on a DVD); in such case specify in the function Preferences - Maps, in
the field Alternative image map folder the device DVD player (example: D:\). In the file .okm will save all the characteristics of the map:
Name and description of the map Geographical bounds of the map
Image file name (only in case of map raster) Dimensions in pixel of the file image (only in case of map raster) Reference datum Used projection and its parameters
Characteristics of the grids Calibration points and their coordinates (in the case of raster map) Direct and
inverse coefficients of calibration (only in case of map raster) Vectorial data (also a map raster can contain vectorial data)
Save a map in World file format To save the map use the menu File - Save – Map; then choose to save the file as World
file in the Save as combo. The image file of the map must have the extension: .jpg, .tif, .gif, .bmp, .png.
The file extension is assigned according to the following matches:
World file File image
.gfw .gif
.jgw .jpg
.pgw .png
.tfw .tif
.bpw .bmp
A window allows to input the type of the coordinates contained in the GeoTiff file.

OkMap – User manual November 1, 2012
Page 45
In this window you must specify the unit of measurement of the coordinates.
Save a map in Google Earth KML/KMZ format To save the map use the menu File - Save – Map; then choose to save the file as Google Earth KML or KMZ in the Save as combo.
The resulting file will eventually contain the loaded GPX data.
The following window is displayed.
In this window you can specify which types of GPX data you want to include in the output
file:
Waypoints
Routes Tracks
the KML specifics:
The use of extensions kml 2.2
The KML transparency (0=Transparent, 255=Opaque) The KML draw order (0=Invisible, 1-49=Under the vectorial data, 50-100=On the top)
The End button acquires the information and process the data. The Cancel stops the process.

OkMap – User manual November 1, 2012
Page 46
Save a map in OziExplorer format
To save the map use the menu File - Save – Map; then choose to save the file as OziExplorer in the Save as combo.
The image file of the map must have the extension: .bmp, .tif, .jpg, .png, .cap, .ecw, .jp2. If OkMap is unable to determine the corresponding OziExplorer datum, a window is
displayed for manual acquisition.
Save a map in GPSTuner format To save the map use the menu File - Save – Map; then choose to save the file as
GpsTuner in the Save as combo. The image file of the map must have the extension: .jpg, .gif, .bmp, .png.
Load a map in OkMap format To load a map (raster or vectorial) use the menu File - Load - Map; then choose to load the file as OkMap in the File type combo.
If it is a raster map, OkMap open the corresponding image file declared in the map file; such file must reside in the same folder as the .okm file, or in the folder specified in the
function Preferences - Maps, in the field Alternative image map folder.
The map is displayed with a zoom / scale set so as to be entirely displayed in the window or with the zoom / scale used the last time the map was open (if this is specified in the
function Preferences - Maps, in the field Set last zoom/pan after map loading).
Load a map in ECW format To load a map use the menu File - Load - Map; then choose to load the file as ECW image in the File type combo.

OkMap – User manual November 1, 2012
Page 47
If during the examination of the ECW file OkMap is unable to determine the projection used, a window is displayed to acquire, with a simple selection: reference datum, projection type
and its parameters. The data are stored in a database that contains a big number of definitions used by
many nations in drafting their own maps.
The list shows only the datum / projections presets active. To enable or disable one or more definitions use the function List - Presets.
Similarly, if OkMap is unable to determine the datum used in the map, a window is displayed for manual acquisition.
The list shows only the active datum. To enable or disable one or more datum to use the function List - Datum.

OkMap – User manual November 1, 2012
Page 48
Load a map in Geotiff format To load a map use the menu File - Load - Map; then choose to load the file as GeoTiff in the File type combo.
After the file selection, a series of windows (wizard) is displayed to identify the characteristics of the coordinates and of the map (type of coordinates, datum, projection
and its parameters).
To switch between windows use the keys Next > and < Previous buttons. To close the
wizard press the End button. To cancel it press the Cancel button. The first window show all the tags contained in the TIF file in a readable form.
The second window allows to input the type of the coordinates contained in the GeoTiff file.
In this window you must specify the unit of measurement of the coordinates.

OkMap – User manual November 1, 2012
Page 49
The next window is to indicate with a simple selection: reference datum, projection type and parameters.
The data are stored in a database that contains a big number of definitions used by many nations in drafting their own maps.
The list shows only the datum / projections presets active. To enable or disable one or more definitions use the function List - Presets.
Once you select the wizard ends. If unable to identify the characteristics of the map is georeferenced, you can proceed to a manual selection of information, leaving empty the
selection field and pressing the Next > button. In this case a window is displayed for the definition of the datum used by the map.
The list shows only the datum active. To enable or disable one or more definitions use the
function List - Datum. Going forward, a window is displayed to define the type of projection used by the map.

OkMap – User manual November 1, 2012
Page 50
If the desired projection did not appear in the list and the surface of the map covers a small region, one can obtain a good approximation by selecting the projection Longitude / Latitude.
Once selected the projection, press the button Parameters to indicate the projection parameters.
The type and number of parameters depend on the projection in question. For more
information refer to the Projection parameters of the page What is a cartographic projection.
Do not make the selection of parameters is equivalent to set the center of the projection on the Greenwich meridian to the equator, the false east and north to zero and the scale factor to 1.
The Accept button acquire information about the parameters and redisplays the window of choice of the projection. The End button ends the setup wizard of the map.

OkMap – User manual November 1, 2012
Page 51
Load a map in World file format
To load a map use the menu File - Load - Map; then choose to load the file as World file in the File type combo.
World file and image file must have the same name but different extension, according to the following matches:
World file File image
.gfw .gif
.jgw .jpg
.pgw .png
.tfw .tif
.bpw .bmp After the file selection, a series of windows (wizard) is displayed to identify the characteristics of the coordinates and of the map (type of coordinates, datum, projection
and its parameters). To switch between windows use the keys Next > and < Previous buttons. To close the
wizard press the End button. To cancel it press the Cancel button.
The first window allows the input of the type of coordinates contained in the World file.
In this window you must specify whether the coordinates contained in World file are
geographical or metric; in which case you must also specify the unit of measurement. The next window is to indicate with a simple selection: reference datum, projection type
and parameters. The data are stored in a database that contains a big number of definitions used by
many nations in drafting their own maps. The list shows only the datum / projections presets active. To enable or disable one or
more definitions use the function List - Presets. Once you select the wizard ends. If unable to identify the characteristics of the map is
georeferenced, you can proceed to a manual selection of information, leaving empty the selection field and pressing the Next > button.
In this case a window is displayed for the definition of the datum used by the map.

OkMap – User manual November 1, 2012
Page 52
The list shows only the datum active. To enable or disable one or more definitions use the function List - Datum.
Going forward, a window is displayed to define the type of projection used by the map.
If the desired projection did not appear in the list and the surface of the map covers a small region, one can obtain a good approximation by selecting the projection Longitude / Latitude.
Once selected the projection, press the button Parameters to indicate the projection parameters.

OkMap – User manual November 1, 2012
Page 53
The type and number of parameters depend on the projection in question. For more information refer to the Projection parameters of the page What is a cartographic projection.
Do not make the selection of parameters is equivalent to set the center of the projection on the Greenwich meridian to the equator, the false east and north to zero and the scale factor
to 1. The Accept button acquire information about the parameters and redisplays the window of
choice of the projection. The End button ends the setup wizard of the map.
Load a map in OziExplorer format To load a map use the menu File - Load - Map; then choose to load the file as OziExplorer in the File type combo.
If OkMap is unable to determine the datum used in the map, a window is displayed for manual acquisition.

OkMap – User manual November 1, 2012
Page 54
The list shows only the datum active. To enable or disable one or more definitions use the function List - Datum.
Load a map in GPSTuner format To load a map use the menu File - Load - Map; then choose to load the file as GpsTuner in
the File type combo.
Modify scale / zoom
The image of a raster map can be enlarged or scaled by adjusting the zoom factor. The zoom factor of 100% indicates that the image is displayed full size. Increasing the zoom
factor, the image is enlarged, vice versa is scaled. Similarly, for a vectorial map is defined the scale that indicates how many meters are
represented in a pixel. Decreasing the number of meters represented in a pixel will result in a magnification of the image and vice versa.
To adjust the zoom level (raster map) or scale (vectorial map) you can use the mouse
wheel forward or backward. Alternatively you can use the menus Zoom - Zoom + / Zoom - for the raster maps and the
menus Scale - Scale + / Scale - for the vectorial maps; In such case you will get an increase / decrease the zoom / scale of 20%.
Using the menu Zoom / Scale - Fit on page you get a zoom level / scale such that the map will be shown entirely in space made available by the window. In the Zoom menu are also available predefined levels (e.g.: 50%, 100%, 120%, etc.).
Similarly in the menu Scale are also available predefined levels (e.g.: 100 mt / pixel, 1 km / pixel, etc.).
You can also use the left mouse button while holding down the Alt key to draw a rectangle on which zoom into the map.
Move the map

OkMap – User manual November 1, 2012
Page 55
If the zoom factor or scale was such that the displayed image is only a portion of the entire map, you can shift the image in 4 directions, using one of the following methods:
Press the left mouse button and drag. Use the 4 arrow keys. Place your mouse over the map edges or corners and press the left mouse button.
Double click the left mouse button on the map; this function moves that point to the central position of the map.
Modify the calibration of a raster map
Change the calibration of a raster map may be needed when you notice that the georeferencing procedure does not produce good results.
This usually when you realize:
It displays a grid and you see that this does not coincide with that drawn on the map.
Positioning the mouse over an intersection of the grid, the coordinates displayed in
the status bar do not match the real ones shown on the edge of the map. Positioning the mouse over a known point, the coordinates displayed in the status bar does not coincide with those known.
This procedure can also modify some features of the map as the name and the
description.
To change the calibration of a raster map (after you have loaded it) use the menu File - Modify - Map parameters.
The procedure of calibration is quite identical to that described in the page Calibrate a
raster map.
Modify a vectorial map
Modify a vectorial map can be useful for:
Change the name and / or description of the map Change the geographical bounds of the map Change the datum Change the projection and / or the its parameters
To change the characteristics of a vectorial map (after you have loaded it) use the menu File
- Modify - Map parameters.
The procedure of change is quite identical to that described in the page Create a vectorial map.
The only difference is that two buttons may be active in the window on the setting of
bounds of the map:
Copy the bounds of vectorial data (if you introduce vectorial data) Copy the bounds of the GPX data (if data GPX is loaded)
The first button automatically compiles the geographical bounds of the map using the geographical bounds of vectorial data, thus limiting or extending the area covered by the
vectorial map.
Similarly, the second button performs the same operation but using the bounds of the loaded data GPX.

OkMap – User manual November 1, 2012
Page 56
Index the maps
Index maps to OkMap means to build an internal database with a list of all maps
available on your drives, each with its own characteristics. Once built this database you can list the available maps or display the bounds of the
maps on a general map.
To build the list of available maps you make the following steps:
Using the function Preferences - Maps indicate, in the fields Map folder 1/4, the folder where your maps reside (you can specify up to four different directories).
If necessary use the ... buttons to open a dialog box to select the folder.
Possibly click the fields Include subfolder to indicate whether OkMap will find maps in the subfolders.
Confirm your changes with Ok button.
The map indexing is done automatically when editing the map folders. A window will display the files in sequence analysis.
If you wish to force re-index because you have changed the contents of folders you can use the maps menu Maps - Reindex maps.
List the available maps
List the available maps lets you see all of the maps in our possession and let you choose to open a map based on the needs of the moment.
To view a list of our maps, you must:
Have specified in the function Preferences - Maps in which folders are stored the
maps. Have made the indexing procedure.
To view the list of maps in the database use the menu Maps - List maps. A table containing the following information is displayed:
File name Map name and description Reference datum Projection used
Indicator if map is raster (or vectorial) Map size in pixel (raster) Area covered by the map Geographical bounds of the map

OkMap – User manual November 1, 2012
Page 57
Double-clicking with the left mouse button on a row you get the opening of a new map
window and loading the map indicated. For more information about the general use of tables, see the topic Data tables.
Alternatively you can use the menu Maps - List maps by position. This function before displaying the list of maps, interposes a window where you can specify a location to narrow the list of those maps that contain the geographic location indicated.
You can enter the coordinates in the box, or:
choose a location (geocoding) with the Sel. location button; choose a waypoint with the Sel. waypoint button; choose a toponym with the Sel. toponym button;
save the shown coordinates as waypoint with the Save waypoint button.

OkMap – User manual November 1, 2012
Page 58
If you manually digit coordinates you can choose their mode of representation, selecting:
Degrees - coordinates expressed in decimal degrees
GMM - coordinates expressed in degrees and decimal minutes GMS - coordinates expressed in degrees, minutes and decimal seconds UTM - coordinate expressed in UTM (east, north, zone and hemisphere)
Rad - expressed in decimal radiant If the Sel. waypoint button is pressed, it's displayed a table containing the list of selectable
waypoint. To select a waypoint, select a row and press the Accept button or simply double click the left
mouse button in the row to select. Then you can see the list of maps that contain inside the indicated coordinates.
Visualize the bounds of the maps
It allows to display on a general map (of great extension of the maps of which we want to display the bounds) some rectangles that represent the limits of your maps previously indexed.
It is possible to display some characteristics and eventually to open one of these maps based on the needs of the moment.
To display the bounds of the your maps you must:
Have specified in the function Preferences - Maps in which folders are stored the maps.
Have made the indexing procedure. Open a greater extension map that can contain maps of where you want to see the bounds.

OkMap – User manual November 1, 2012
Page 59
To display the map bounds in the database use the menu Maps - View maps bounds. You can
display / hide the names of the maps using the menu Maps - View maps labels. If the function autoinfo (menu View - Auto info) is activated, by hovering the mouse on the
edges of the maps, you can see a box containing the name, the description and the map file.
In every case, to display information on the map, you can use the right mouse button, click on the limits of a map and select the context menu Info - map. This window will close automatically by clicking on another point on the map.
To open a map use the context menu Open - map.
Save the map image to file
Create a copy of the map with all the vectorial data and GPX present.
To obtain a copy of the map image use the menu File - Save - Map image or the menu File - Save - Map screenshot.
The first saves the entire image of the map at the zoom level while the second only the
visible portion of the map. A dialog box for saving the image file is displayed.
The supported formats are: tif, jpg, png, gif, bmp, wmf, emf.
Print the map image
Need to get a print of the map image as appears on the screen with all its limitations and vectorial data and GPX present.
To print the map image use the menu File - Print. A dialog box for choosing the print options is displayed.
Copy the map image to the clipboard Need to get a copy to the clipboard of the map image as appears on the screen with all its
limitations and vectorial data and GPX present. The image can then be pasted on a document such office to create the documentation.

OkMap – User manual November 1, 2012
Page 60
To get a copy in the clipboard of the map image use the menu File - Copy to clipboard.

OkMap – User manual November 1, 2012
Page 61
Grids
What are the grids
The grids are a series of parallel lines to the meridians and the terrestrial parallels to the
same way of those drawn on the geographical maps (grid lat / lon).
You can also display a metric grid where the lines are equidistant from each other (UTM
grid). The grids can be drawn both on raster maps and on vectorial maps.
Display the grids let you to quickly verify if a map raster has correctly been calibrated, because the lines drawn by OkMap will trace with precision those drawn on the map.
Some maps show the geographical grid while the other the metric one.
To show or hide the grids use the menu View - Grid Lat/Lon or the menu View - Grid UTM.
The grids will be drawn only if you have been correctly input the properties of the grids using the menu File - Modify - Grid map parameters.
If the suitable parameters set produce a grid too dense, the design of $the grid is turned off, thus avoiding performance degradation. To reactivate the display of the grid, you must first
change its properties.
Grid properties
The properties of the grids allow you to tell to OkMap as to draw on a map the
geographical grids (Lat / Lon) and the alternative metric grids.
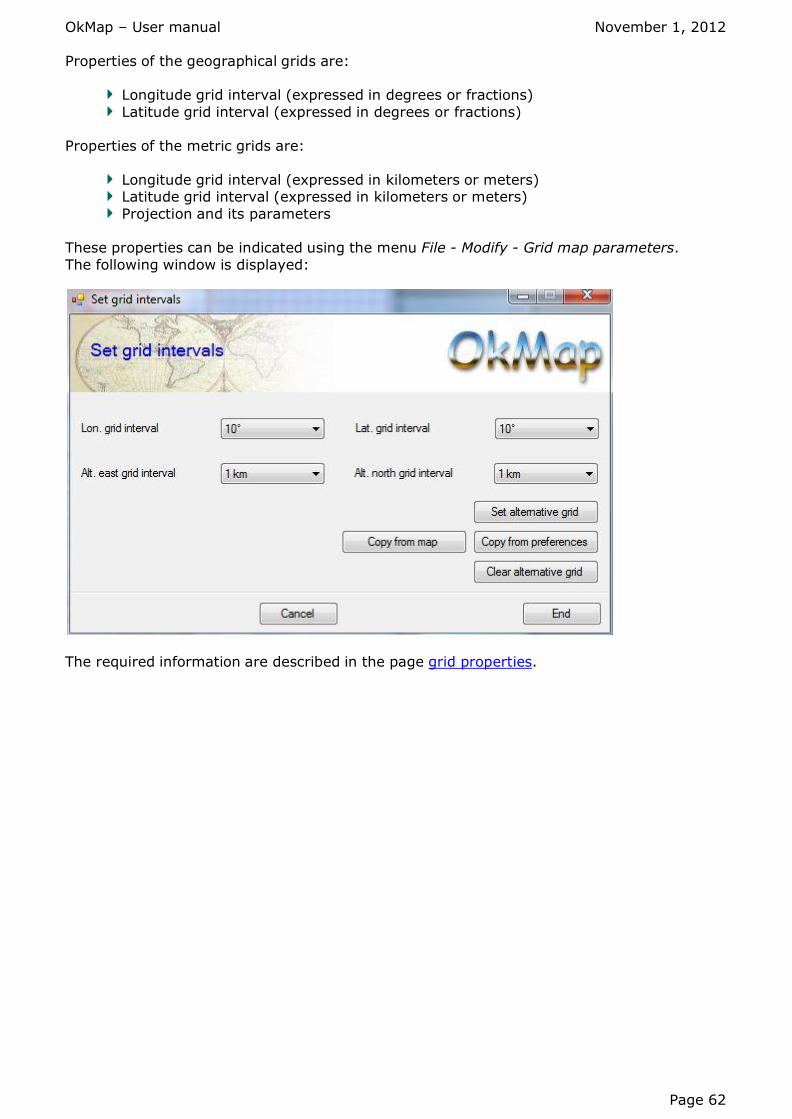
OkMap – User manual November 1, 2012
Page 62
Properties of the geographical grids are:
Longitude grid interval (expressed in degrees or fractions)
Latitude grid interval (expressed in degrees or fractions)
Properties of the metric grids are:
Longitude grid interval (expressed in kilometers or meters) Latitude grid interval (expressed in kilometers or meters)
Projection and its parameters These properties can be indicated using the menu File - Modify - Grid map parameters.
The following window is displayed:
The required information are described in the page grid properties.

OkMap – User manual November 1, 2012
Page 63
DEM data
What area the data DEM
The acronym DEM stands for Digital Elevation Model that is a digital representation of the Earth's surface.
There are several formats of DEM data, in particular OkMap uses the following formats:
SRTM-3 with a resolution of 3 seconds of arc (approximately 90 meters) SRTM-1 with a resolution of 1 seconds of arc (approximately 30 meters)
The acronym stands for SRTM Shuttle Radar Topography Mission. This project was developed by NASA (National Aeronautics and Space Administration) and NGA (National Geospatial-Intelligence Agency).
OkMap uses, for instance, the data DEM for:
Knowing the altitude above sea level of each point on the map Assign to each GPX point (waypoints, points of tracks) the relative altitude
Calculate the minimum and the maximum altitude and the uphill and the downhill of a track
Build the graph of altitude of a track
Both SRTM-1 and SRTM-3 is available free at http://dds.cr.usgs.gov/srtm/version2_1.
The files have extension .hgt and they have the following format:
Hemisphere (1 character N/S) Latitude (2 numeric characters)
East / West (1 character E/W) Longitude (3 numeric characters)
Without browsing to search data covering a particular area (not easy), OkMap can automatically download DEM data, needed to cover a given map previously loaded.
Download DEM data
To automatically download DEM files, necessary to cover a previously loaded map, use the menu DEM - Download DEM files.
A window containing a table with the following information is displayed:
Relative path of the file on the FTP site
File name File size in bytes Status (available, unavailable, downloading)
Status of download progress in percent

OkMap – User manual November 1, 2012
Page 64
For more information about the general use of tables, see the topic Data tables.
To start downloading the file press the Download button. The file is being downloaded show a progress bar with the percentage completed in the column Download%.
The download can be canceled at any time by pressing the Cancel button. The colors of the lines give information on the status:
Green - Available online Celestial - Not available online and ready to be downloaded
Yellow - Downloading
Download a single file with DEM is possible using a context menu after viewing the bounds of the DEM files.
Display the bounds of the DEM data
Displays on a map some rectangles representing the bounds of available or downloadable
DEM data files.

OkMap – User manual November 1, 2012
Page 65
You can also view and some characteristics and eventually download one of these DEM
files according to the needs of the moment. To display the geographical bounds of the DEM files, available or ready to download, use the
menu DEM - View DEM bounds. You can view / hide DEM file names using the menu DEM - View DEM labels.
If the function autoinfo (menu View - Auto info) is activated, by hovering the mouse on the
limits of coverage, you can see a box containing the file name and whether or not available locally.
In any event, to display information about DEM files, you can use the right mouse button, click on the limits of coverage and select the context menu Info - DEM. This window will close automatically by clicking on another point on the map.
To download a DEM file use the context menu Download - DEM.

OkMap – User manual November 1, 2012
Page 66
Vectorial data, themes, shapes
What are the vectorial data With the vectorial you can define the graphic through which is possible to describe an image (in our case a map).
Vectorial data are composed by simple elements (shape) such as points, multipoint, lines and polygons, encoded and stored according to their geographical coordinates.
A point (or multipoint) is identified through its own coordinates (or the coordinates of individual dots that constitute a multipoint), while a line or a polygon by the coordinates of
its nodes. Points (or multipoint) are generally used to describe spatial elements such as poles, trees;
the lines are used to describe roads, railways, rivers, curves of level; the polygons are used to describe buildings, lakes, boundaries of cities, regions, nations.
Generally, vectorial data are classified into themes such so as to bring together all the roads, buildings, rivers, etc...
The purpose of this classification is that to be able to assign different layouts to different vectorial themes. The layouts provide, for example, the colors, the thickness of the lines and fill colors (backgrounds).
Besides, thanks to this classification, you can select which theme you want to design and which not.
List the vectorial themes
It is a function that can produce a list of vectorial themes and their characteristics.
Through this function you can change the properties of the vectorial themes, delete one or more vectorial themes and create new ones.
You can also select a theme or not, changing the value in the Selected; select a theme to
create new vector objects belonging to it; which is why you can select one theme at a time. The information displayed in this window are:
Description of the theme (unique) Selected (Yes / No)
Number of the points (not editable) Number of the multipoints (not editable) Number of the lines (not editable)
Number of the polygons (not editable) Visible or hidden Label visible or hidden
Shape color Shape fill color Line thickness
Font labels

OkMap – User manual November 1, 2012
Page 67
To activate this function use the menu List - Themes.
Where you see a blue icon with a down arrow means that has been arranged a function for easy insertion of information; by pressing the icon opens a window whose function depends
on the type of information you must enter:
Color: opens a dialog box for choosing the color to use to draw the shapes.
Color filling: opens a dialogue box for choosing the color to use to draw the
background of the shapes.
Thickness line: opens a dropdown for selecting the line thickness used to draw the lines of the shapes.
Font labels: opens a dialog box for choosing the font to use for the representation of the labels of the shape.
To delete or to insert the vectorial themes see the topic Data tables.
It is also available a context menu activated with the right mouse button. This menu
provides the following functions:
Reset color: cancels selection of the shape color made earlier and restores the use of
the color defined at global level in the function Preferences - Vectorial data.
Reset fill color: cancels selection of the shape background color made earlier and restores the use of the color defined at global level in the function Preferences -
Vectorial data.
Reset font labels: cancel the choice of a font made earlier and restores the use of
the font defined at global level in the function Preferences - Vectorial data.
Default grid layout: restores the default size of the grid columns.
To save the modified data press the Apply button. To save the changed data and exit function press the Ok button.

OkMap – User manual November 1, 2012
Page 68
To exit without saving the data, press the Cancel button. For more information about the general use of tables, see the topic Data tables.

OkMap – User manual November 1, 2012
Page 69
Shape type point
What are point shapes The point belongs to the category of the vectorial objects (shape).
A point is defined through its own coordinates, it is typically used to describe point-like spatial elements as poles, trees. The point properties managed in OkMap are:
Membership vectorial theme Label
Selected (Yes / No) Visible (Yes / No) Shape color
Shape fill color Line thickness Font labels
Geographical coordinates
Create a point A point can be created:
by the importation of vectorial data from another map in OkMap format (.okm) by the importation of vectorial data in different format (shape) drawing directly on the map
To create it on the map to select, if necessary, the current theme with the function List vectorial themes.
Then select the appropriate tool with the menu Tools - New point and click with the left mouse button on the map in the desired position.
Subsequently, through the modify function, you can specify the property of the new point.
Select the points Select a set of points allows you to perform group operations such as editing or deleting
multiple GPX objects simultaneously.
To select the points you can use one of the following methods:
Click on the map with the left mouse button on the corresponding drawing.
In case of overlapping objects, click the right mouse button to select the point and use the context menu Select - point.
To add other points to the selection hold down the Ctrl key and click on the drawing of the point you want to add.
To select a group of neighboring GPX objects, draw a rectangle by holding down the
Shift key and left mouse button.
To add a group of neighboring GPX objects hold down the Ctrl and Shift keys and draw a rectangle as in the previous case.
You can reverse the selection of objects using the context menu, activated with the

OkMap – User manual November 1, 2012
Page 70
right mouse button, Invert selection.
To deselect all the objects click anywhere on the map where there aren't objects.
Information about a point To obtain information about a point is sufficient, if activated autoinfo (menu View - Auto info), place the mouse on its design.
A panel containing the following information is displayed:
the point label
In any case, you can click the right mouse button on the point and select the context
menu Info - point. A window containing the following information will be opened:
the point label
This window will automatically close when you click on another point on the map.
Modify the points To change the properties of a point click with the right mouse button on the design and select the context menu Modify - point.
A window containing the following information is opened:

OkMap – User manual November 1, 2012
Page 71
Point label Visible
Shape color Shape fill color Line thickness
Font labels
Where an icon appears with an arrow at the bottom, means that a function is available for easy insertion of information; by pressing the icon opens a window whose function depends on the type of information you must enter:
Color: opens a dialog box for choosing the color to use to draw the points.
Fill color: opens a dialog box for choosing the color to use to fill the points.
Line thickness: opens a dropdown for selecting the line thickness to be used in
design.
Font labels: opens a dialog box for choosing the font to use for the representation of the labels of the point.
Where appears an icon with a cross (Shape color, Fill color and Font) means that you want to delete the choice made previously, and restore the default specified in the function
vectorial themes.
To save the modified data press the Apply button. To save the changed data and exit function press the Ok button.
To exit without saving the data, press the Cancel button.
To modify all the selected points click the right mouse button anywhere on the map and select the context menu Modify selected - Points.
A window containing the following information common to multiple points is opened:
Visible Shape color Shape fill color
Line thickness Font labels

OkMap – User manual November 1, 2012
Page 72
Apply the same considerations to editing a point.
To modify all the selected vectorial data click the right mouse button anywhere on the map and select the context menu select the context menu Modify selected - Vectorial data.
Apply the same considerations to editing the selected points.
Move a point To move a point click with the right mouse button on the draw of the point and to select the context menu Move - point.
A window is opened with four arrows buttons.
Press the buttons to move the point in the desired direction. The movement is made of how many pixels are shown in the near combo box.
Alternatively you can click the left mouse button on the object to move, hold and move the object in the desired position.
This is possible only if the menu "Lock objects on map" is disabled.
Delete the points
OkMap – User manual November 1, 2012
Page 73
To delete a point, click the map with the right mouse button on the design of the point and select the context menu Delete - point.
To delete the selected points, click the right mouse button anywhere on the map and select the context menu Delete selected - Points.
To delete all points, click the button right-click anywhere on the map and select the context menu Delete all - Points.
In addition, to delete all the vectorial data click the right mouse button anywhere on the map and select the context menu Delete all - Vectorial data.
Finally, to erase all GPX and vectorial data click the right mouse button anywhere on the map and select the context menu Delete all - All.
Hide and unhide the points To hide a point, click the map with the right mouse button on the design of the point and
select the context menu Hide - point. To hide the selected points make click the right mouse button anywhere on the map and
select the context menu Hide selected - Points. To unhide all the points click the right mouse button anywhere on the map and select the
context menu Unhide all - Points.

OkMap – User manual November 1, 2012
Page 74
Shape type multipoint
What are multipoint shapes The multipoint belongs to the category of the vectorial objects (shape).
A multipoint is a set of points, it is typically used to describe multiple neighboring point- like spatial elements such as poles, trees.
The multipoint properties managed in OkMap are:
Membership vectorial theme
Label Selected (Yes / No) Visible (Yes / No)
Shape color Shape fill color Line thickness
Font labels A list of points with the following properties:
Geographical coordinates
Create a multipoint
A multipoint can be created:
by the importation of vectorial data from another map in OkMap format (.okm)
by the importation of vectorial data in different format (shape) drawing directly on the map
To create it on the map to select, if necessary, the current theme with the function List vectorial themes.
Then select the appropriate tool with the menu Tools - New multipoint and click with the left mouse button on the map in the position relative to the first point of the vectorial shape.
Then proceed to the design of the other points that constitute the multipoint and finally, to close the shape, deselect it.
Subsequently, through the modify function, you can specify the properties of the new multipoint.
Select the multipoints Select a set of multipoints allows you to perform group operations such as editing or
deleting multiple GPX objects simultaneously. To select the multipoints you can use one of the following methods:
Click on the map with the left mouse button on the corresponding drawing.
In case of overlapping objects, click the right mouse button on one of the point of
the multipoint to select and use the context menu Select - point.
To add other multipoints to the selection hold down the Ctrl key and click on a point belonging to the multipoint you want to add.
To select a group of neighboring GPX objects, draw a rectangle by holding down the Shift key and left mouse button.

OkMap – User manual November 1, 2012
Page 75
To add a group of neighboring GPX objects hold down the Ctrl and Shift keys and draw a rectangle as in the previous case.
You can reverse the selection of objects using the context menu, activated with the right mouse button, Invert selection.
To deselect all the objects click anywhere on the map where there aren't objects.
Information about a multipoint To obtain information about a waypoint is sufficient, if activated autoinfo (menu View -
Auto info), place the mouse on one of the points that compose the multipoint.
A panel containing the following information is displayed:
the multipoint label
In any case, you can click the right mouse button on one of the points that compose the multipoint and select the context menu Info - multipoint.
A window containing the following information will be opened:
the multipoint label
the numbers of the points
This window will automatically close when you click on another point on the map.

OkMap – User manual November 1, 2012
Page 76
Modify the multipoints To change the properties of a multipoint click with the right mouse button on one of the points that compose the multipoint and select the context menu Modify - multipoint.
A window containing the following information is opened:
Multipoint label
Visible Shape color Shape fill color
Line thickness Font labels
Where an icon appears with an arrow at the bottom, means that a function is available for easy insertion of information; by pressing the icon opens a window whose function depends
on the type of information you must enter:
Color: opens a dialog box for choosing the color to use to draw the points.
Fill color: opens a dialog box for choosing the color to use to fill the points.
Line thickness: opens a dropdown for selecting the line thickness to be used in design.
Font labels: opens a dialog box for choosing the font to use for the representation of the labels of the multipoint.
Where appears an icon with a cross (Shape color, Fill color and Font) means that you want to delete the choice made previously, and restore the default specified in the function vectorial themes.
To save the modified data press the Apply button. To save the changed data and exit function press the Ok button. To exit without saving the data, press the Cancel button.
To modify all the selected multipoints click the right mouse button anywhere on the map and select the context menu Modify selected - Multipoints.
A window containing the following information common to multiple multipoints is opened:
Visible
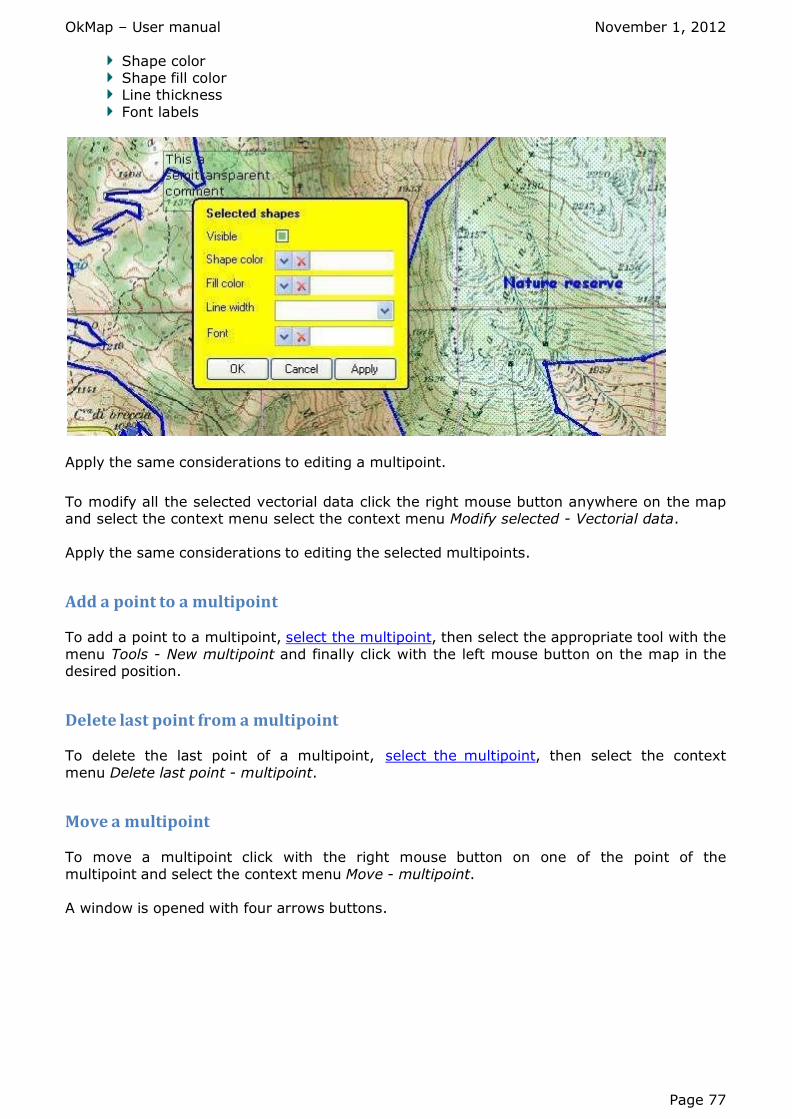
OkMap – User manual November 1, 2012
Page 77
Shape color Shape fill color Line thickness
Font labels
Apply the same considerations to editing a multipoint.
To modify all the selected vectorial data click the right mouse button anywhere on the map and select the context menu select the context menu Modify selected - Vectorial data.
Apply the same considerations to editing the selected multipoints.
Add a point to a multipoint To add a point to a multipoint, select the multipoint, then select the appropriate tool with the
menu Tools - New multipoint and finally click with the left mouse button on the map in the desired position.
Delete last point from a multipoint To delete the last point of a multipoint, select the multipoint, then select the context
menu Delete last point - multipoint.
Move a multipoint To move a multipoint click with the right mouse button on one of the point of the
multipoint and select the context menu Move - multipoint. A window is opened with four arrows buttons.
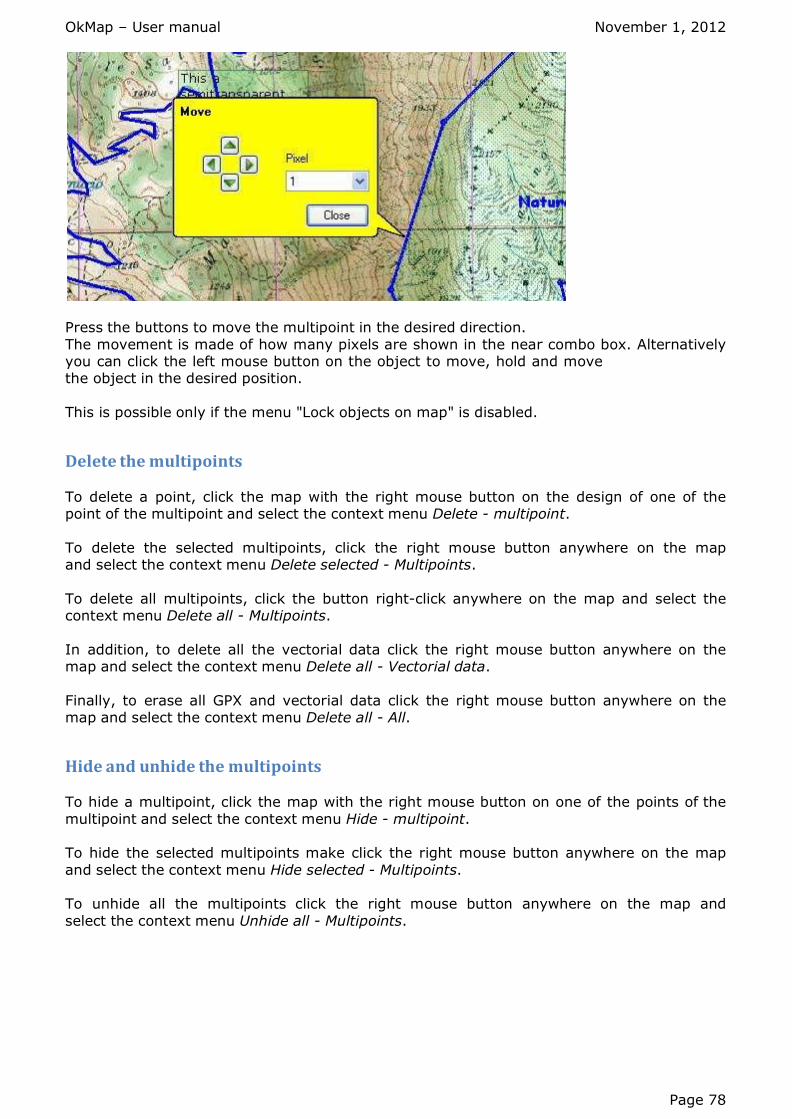
OkMap – User manual November 1, 2012
Page 78
Press the buttons to move the multipoint in the desired direction.
The movement is made of how many pixels are shown in the near combo box. Alternatively you can click the left mouse button on the object to move, hold and move the object in the desired position.
This is possible only if the menu "Lock objects on map" is disabled.
Delete the multipoints
To delete a point, click the map with the right mouse button on the design of one of the point of the multipoint and select the context menu Delete - multipoint.
To delete the selected multipoints, click the right mouse button anywhere on the map and select the context menu Delete selected - Multipoints.
To delete all multipoints, click the button right-click anywhere on the map and select the context menu Delete all - Multipoints.
In addition, to delete all the vectorial data click the right mouse button anywhere on the map and select the context menu Delete all - Vectorial data.
Finally, to erase all GPX and vectorial data click the right mouse button anywhere on the map and select the context menu Delete all - All.
Hide and unhide the multipoints To hide a multipoint, click the map with the right mouse button on one of the points of the
multipoint and select the context menu Hide - multipoint. To hide the selected multipoints make click the right mouse button anywhere on the map
and select the context menu Hide selected - Multipoints. To unhide all the multipoints click the right mouse button anywhere on the map and
select the context menu Unhide all - Multipoints.

OkMap – User manual November 1, 2012
Page 79
Shape type line
What are line shapes The line belongs to the category of the vectorial objects (shape).
A line (broken) is a set of points that define its nodes; it is commonly used to describe spatial elements such as roads, railways, rivers, curves of level. The line properties managed in OkMap are:
Membership vectorial theme Label
Selected (Yes / No) Visible (Yes / No) Shape color
Line thickness Font labels A list of points (knots) with the following properties:
Geographical coordinates
Create a line A line can be created:
by the importation of vectorial data from another map in OkMap format (.okm) by the importation of vectorial data in different format (shape) drawing directly on the map
To create it on the map to select, if necessary, the current theme with the function List vectorial themes.
Then select the appropriate tool with the menu Tools - New line and click with the left mouse button on the map in the position relative to the first point of the vectorial shape.
Then proceed to the design of the other points that constitute the line and finally, to close the shape, deselect it.
Subsequently, through the modify function, you can specify the properties of the new line.
Select the lines
Select a set of lines allows you to perform group operations such as editing or deleting multiple GPX objects simultaneously.
To select the lines you can use one of the following methods:
Click on the map with the left mouse button on the corresponding drawing.
In case of overlapping objects, click the right mouse button to select the line and
use the context menu Select - line.
To add other lines to the selection hold down the Ctrl key and click on the drawing of the line you want to add.
To select a group of neighboring GPX objects, draw a rectangle by holding down the Shift key and left mouse button.
To add a group of neighboring GPX objects hold down the Ctrl and Shift keys and

OkMap – User manual November 1, 2012
Page 80
draw a rectangle as in the previous case.
You can reverse the selection of objects using the context menu, activated with the right mouse button, Invert selection.
To deselect all the objects click anywhere on the map where there aren't objects.
Information about a line
To obtain information about a line is sufficient, if activated autoinfo (menu View - Auto info), place the mouse on its design.
A panel containing the following information is displayed:
the line label
In any case, you can click the right mouse button on the line and select the context menu Info - line.
A window containing the following information will be opened:
the line label the numbers of the parts the numbers of the points
the line length
This window will automatically close when you click on another point on the map.

OkMap – User manual November 1, 2012
Page 81
Modify the lines To change the properties of a line click with the right mouse button on the design and select the context menu Modify - line.
A window containing the following information is opened:
Line label
Visible Shape color Line thickness
Font labels
Where an icon appears with an arrow at the bottom, means that a function is available for easy insertion of information; by pressing the icon opens a window whose function depends on the type of information you must enter:
Color: opens a dialog box for choosing the color to use to draw the line.
Line thickness: opens a dropdown for selecting the line thickness to be used in design.
Font labels: opens a dialog box for choosing the font to use for the representation of the labels of the line.
Where appears an icon with a cross (Shape color and Font) means that you want to delete the choice made previously, and restore the default specified in the function vectorial themes.
To save the modified data press the Apply button. To save the changed data and exit function press the Ok button.
To exit without saving the data, press the Cancel button. To modify all the selected lines click the right mouse button anywhere on the map and
select the context menu Modify selected - Lines. A window containing the following information common to multiple lines is opened:
Visible Shape color Line thickness
Font labels

OkMap – User manual November 1, 2012
Page 82
Apply the same considerations to editing a line.
To modify all the selected vectorial data click the right mouse button anywhere on the map
and select the context menu select the context menu Modify selected - Vectorial data. Apply the same considerations to editing the selected lines.
Add a point to a line
To add a point to a line, select the line, then select the appropriate tool with the menu Tools - New line and finally click with the left mouse button on the map in the desired position.
Delete last point from a line
To delete the last point of a line, select the line, then select the context menu Delete last point - line.
Move a line To move a line click with the right mouse button on the draw of the line and to select the
context menu Move - point. A window is opened with four arrows buttons.

OkMap – User manual November 1, 2012
Page 83
Press the buttons to move the line in the desired direction.
The movement is made of how many pixels are shown in the near combo box. Alternatively you can click the left mouse button on the object to move, hold and move the object in the desired position.
This is possible only if the menu "Lock objects on map" is disabled.
Delete the lines
To delete a line, click the map with the right mouse button on the design of the line and select the context menu Delete - line.
To delete the selected lines, click the right mouse button anywhere on the map and select the context menu Delete selected - Lines.
To delete all lines, click the button right-click anywhere on the map and select the context menu Delete all - Lines.
In addition, to delete all the vectorial data click the right mouse button anywhere on the map and select the context menu Delete all - Vectorial data.
Finally, to erase all GPX and vectorial data click the right mouse button anywhere on the map and select the context menu Delete all - All.
Hide and unhide the lines To hide a line, click the map with the right mouse button on the design of the line and
select the context menu Hide - line. To hide the selected lines make click the right mouse button anywhere on the map and
select the context menu Hide selected - Lines. To unhide all the lines click the right mouse button anywhere on the map and select the
context menu Unhide all - Lines.

OkMap – User manual November 1, 2012
Page 84
Shape type polygon
What are polygon shapes The polygon to the category of the vectorial objects (shape).
A polygon (closed broken line) is a set of points that define its nodes; it is commonly used to describe spatial elements such as buildings, lakes, boundaries of cities, regions and countries.
The polygon properties managed in OkMap are:
Membership vectorial theme Label Selected (Yes / No)
Visible (Yes / No) Shape color Shape fill color
Line thickness Font labels A list of points (knots) with the following properties:
Geographical coordinates
Create a polygon A polygon can be created:
by the importation of vectorial data from another map in OkMap format (.okm) by the importation of vectorial data in different format (shape) drawing directly on the map
To create it on the map to select, if necessary, the current theme with the function List vectorial themes.
Then select the appropriate tool with the menu Tools - New polygon and click with the left mouse button on the map in the position relative to the first point of the vectorial shape.
Then proceed to the design of the other points that constitute the polygon and finally, to close the shape, deselect it.
Subsequently, through the modify function, you can specify the properties of the new line.
Select the polygons
Select a set of polygons allows you to perform group operations such as editing or deleting multiple GPX objects simultaneously.
To select the polygons you can use one of the following methods:
Click on the map with the left mouse button on the corresponding drawing.
In case of overlapping objects, click the right mouse button to select the polygon and use the context menu Select - polygon.
To add other polygons to the selection hold down the Ctrl key and click on the
drawing of the polygon you want to add.
To select a group of neighboring GPX objects, draw a rectangle by holding down the

OkMap – User manual November 1, 2012
Page 85
Shift key and left mouse button.
To add a group of neighboring GPX objects hold down the Ctrl and Shift keys and draw a rectangle as in the previous case.
You can reverse the selection of objects using the context menu, activated with the
right mouse button, Invert selection.
To deselect all the objects click anywhere on the map where there aren't objects.
Information about a polygon
To obtain information about a polygon is sufficient, if activated autoinfo (menu View - Auto info), place the mouse on its design.
A panel containing the following information is displayed:
the polygon label
In any case, you can click the right mouse button on the polygon and select the context menu Info - polygon.
A window containing the following information will be opened:
the polygon label
the numbers of the parts the numbers of the points the perimeter length
the area

OkMap – User manual November 1, 2012
Page 86
This window will automatically close when you click on another point on the map.
Modify the polygons
To change the properties of a polygon click with the right mouse button on the design and select the context menu Modify - polygon. A window containing the following information is opened:
Polygon label
Visible Shape color Shape fill color
Line thickness Font labels
Where an icon appears with an arrow at the bottom, means that a function is available for easy insertion of information; by pressing the icon opens a window whose function depends
on the type of information you must enter:
Color: opens a dialog box for choosing the color to use to draw the polygon.
Fill color: opens a dialog box for choosing the color to use to fill the polygon.
Line thickness: opens a dropdown for selecting the line thickness to be used in
design.

OkMap – User manual November 1, 2012
Page 87
Font labels: opens a dialog box for choosing the font to use for the representation of the labels of the polygon.
Where appears an icon with a cross (Color shape, Fill color and Font) means that you want to delete the choice made previously, and restore the default specified in the function vectorial themes.
To save the modified data press the Apply button. To save the changed data and exit function press the Ok button. To exit without saving the data, press the Cancel button.
To modify all the selected polygons click the right mouse button anywhere on the map
and select the context menu Modify selected - Polygons. A window containing the following information common to multiple polygons is opened:
Visible Shape color Shape fill color
Line thickness Font labels
Apply the same considerations to editing a polygon.
To modify all the selected vectorial data click the right mouse button anywhere on the map
and select the context menu select the context menu Modify selected - Vectorial data. Apply the same considerations to editing the selected polygons.
Move a polygon
To move a polygon click with the right mouse button on the draw of the polygon and to select the context menu Move - point.
A window is opened with four arrows buttons.

OkMap – User manual November 1, 2012
Page 88
Press the buttons to move the polygon in the desired direction.
The movement is made of how many pixels are shown in the near combo box. Alternatively you can click the left mouse button on the object to move, hold and move the object in the desired position.
This is possible only if the menu "Lock objects on map" is disabled.
Add a point to a polygon
To add a point to a polygon, select the polygon, then select the appropriate tool with the menu Tools - New polygon and finally click with the left mouse button on the map in the desired position.
Delete last point from a polygon
To delete the last point of a polygon, select the polygon, then select the context menu Delete last point - polygon.
Delete the polygons To delete a polygon, click the map with the right mouse button on the design of the
polygon and select the context menu Delete - polygon. To delete the selected polygons, click the right mouse button anywhere on the map and
select the context menu Delete selected - Polygons. To delete all polygons, click the button right-click anywhere on the map and select the
context menu Delete all - Polygons. In addition, to delete all the vectorial data click the right mouse button anywhere on the
map and select the context menu Delete all - Vectorial data. Finally, to erase all GPX and vectorial data click the right mouse button anywhere on the
map and select the context menu Delete all - All.
Hide and unhide the polygons To hide a polygon, click the map with the right mouse button on the design of the polygon and select the context menu Hide - polygon.

OkMap – User manual November 1, 2012
Page 89
To hide the selected polygons make click the right mouse button anywhere on the map and select the context menu Hide selected - Polygons.
To unhide all the polygons click the right mouse button anywhere on the map and select the context menu Unhide all - Polygons.

OkMap – User manual November 1, 2012
Page 90
Map add-ons
What are the map add-ons The map add-ons allow you to add graphic objects on the map of the following types:
Icons Comments
The add-on go to be part of the design of the map (persistent) and are treated similarly to vectorial objects.
They are useful to:
Add a small picture (icon) in a precise point on the map
Add text information to a map (comment) Add links to sites that report information concerning a particular point on the map (icons and comments)
Add references to a file in a particular point on the map (icons and comments); the file can be opened with a simple click of the mouse

OkMap – User manual November 1, 2012
Page 91
Map icon
What are the map icons Map icon belongs to the category of add-on maps.
An icon is a small map image and is typically used to add information on a map. The properties of a map icon are:
Description Comment
Associated file External link Visible yes/no
Bitmap Geographic coordinates
Create a map icon A map icon can be created directly on the design of the map.
To do this select the appropriate tool with the menu Tools - New map icon and click with the left mouse button on the map in the desired position.
Subsequently, through the edit function, you can specify the properties of the new icon.
Select a map icon Select a set of map icons allows you to perform group operations such as deleting
multiple objects simultaneously. To select map icons you can use one of the following methods:
Click on the map with the left mouse button on the corresponding drawing. In the case of overlapping objects, click the right mouse button to select the map icon and
use the context menu Select - map icon. To add other map icons to the selection, hold down the Ctrl key and click on the map
icon you want to add.
To select a group of neighboring map icons, draw a rectangle by holding down the
Shift key and left mouse button. To add a group of neighboring map icons hold down the Ctrl and Shift keys and draw
a rectangle as in the previous case. You can reverse the selection of objects using the context menu, activated with the
right mouse button, Invert selection.
To deselect all the objects click anywhere on the map where there aren't objects.
Information about a map icon To obtain information on a map icon is sufficient, if activated autoinfo (menu View - Autoinfo), place the mouse on its design.
A panel containing the following information is displayed:

OkMap – User manual November 1, 2012
Page 92
description comment
associated file
In any case, you can click the right mouse button on the map icon design and select the context menu Info - map icon.
A window containing the following information will be opened:
description comment
bitmap file associated file (can be opened pressing the Open file button) link (url) that can be opened making click with the left key of the mouse
This window will automatically close when you click on another point on the map.
Modify the map icons To change the properties of a map comment click with the right mouse button on the design of the comment and select the context menu Modify - map comment.
A window containing the following information is opened:
Description Comment
Associated file External link

OkMap – User manual November 1, 2012
Page 93
Visible yes/no Bitmap file
Where an icon appears with an arrow at the bottom, means that a function is available for easy insertion of information; by pressing the icon opens a window whose function depends
on the type of information you must enter:
File: opens a dialog box for choosing the file to associate with the icon.
Bitmap: opens a dialog box for choosing the image file to be used for the representation of the icon.
Where appears an icon with a cross (Bitmap) means that means that you want to delete the choice made previously, and restore the default specified in the function Preferences – Map icons.
Where it appears an icon with an exclamation point (File) you can open the file with the associated application (based on file extension).
To save the modified data press the Apply button. To save the changed data and exit function press the Ok button.
To exit without saving the data, press the Cancel button.
Move a map icon To move a map icon click with the right mouse button on the design of the icon and
select the context menu Move - map icon. A window is opened with four arrows buttons.

OkMap – User manual November 1, 2012
Page 94
Press the buttons to move the map icon in the desired direction.
The movement is made of how many pixels are shown in the near combo box. Alternatively you can click the left mouse button on the object to move, hold and move the object in the desired position.
This is possible only if the menu "Lock objects on map" is disabled.
Delete the map icons
To delete a map icon, click the map with the right mouse button on the design of the icon and select the context menu Delete - map icon.
To delete the selected map icons, click the right mouse button anywhere on the map and select the context menu Delete selected - Map icons.
To delete all map icons, click the button right-click anywhere on the map and select the context menu Delete all - Map icons.
Hide and unhide the map icons To hide a map icon click on the map with the right mouse button on the design of the
icon and select the context menu Hide - Map icon. To hide the selected map icons click the right mouse button anywhere on the map and
select the context menu Hide selected - Map icons. To unhide all the map icons click the right mouse button anywhere on the map and
select the context menu Unhide all - Map icons.

OkMap – User manual November 1, 2012
Page 95
Map comment
What are the map comments Map comment belongs to the category of add-on maps.
A map comment is a box with text inside and is typically used to add information on a map.
The properties of a map comment are:
Description
Comment Associated file External link
Visible yes/no Font Background color
Border color Border line thickness Opacity factor
Box size Geographic coordinates
Create a map comment A map comment can be created directly on the design of the map.
To do this select the appropriate tool with the menu Tools - New map comment and click with the left mouse button on the map in the desired position.
Subsequently, through the edit function, you can specify the properties of the new comment.
Select a map comment Select a set of map comments allows you to perform group operations such as deleting multiple objects simultaneously.
To select map comments you can use one of the following methods:
Click on the map with the left mouse button on the corresponding drawing. In the case of overlapping objects, click the right mouse button to select the map comment and use the context menu Select - map comment.
To add other map comments to the selection, hold down the Ctrl key and click on the map comment you want to add.
To select a group of neighboring map comments, draw a rectangle by holding down the Shift key and left mouse button.
To add a group of neighboring map comments hold down the Ctrl and Shift keys and draw a rectangle as in the previous case.
You can reverse the selection of objects using the context menu, activated with the right mouse button, Invert selection.
To deselect all the objects click anywhere on the map where there aren't objects.

OkMap – User manual November 1, 2012
Page 96
Information about a map comment To obtain information on a map comment is sufficient, if activated autoinfo (menu View - Autoinfo), place the mouse on its design.
A panel containing the following information is displayed:
description comment associated file
In any case, you can click the right mouse button on the map icon design and select the context menu Info - map comment.
A window containing the following information will be opened:
description comment associated file (can be opened pressing the Open file button)
link (url) that can be opened making click with the left key of the mouse
This window will automatically close when you click on another point on the map.
Modify the map comments To change the properties of a map icon click with the right mouse button on the design of
the icon and select the context menu Modify - map icon.

OkMap – User manual November 1, 2012
Page 97
A window containing the following information is opened:
Description
Comment Associated file External link
Visible yes/no Font Background color
Border color Border line thickness Opacity factor
Box size
Where an icon appears with an arrow at the bottom, means that a function is available for
easy insertion of information; by pressing the icon opens a window whose function depends on the type of information you must enter:
File: opens a dialog box for choosing the file to associate with the comment.
Font: opens a dialog box for choosing the font to use for the representation of the comment.
Background color: opens a dialog box for choosing the color to use as the background of the comment.
Border color: opens a dialog box for choosing the color to use in the design of the
box border of the comment.
Line thickness: opens a list to choice the thickness of the lines used in the design of
the box border. Where appears an icon with a cross (Background color, Border color and Font) means that
you want to delete the choice made previously, and restore the default specified in the function Preferences – Map comments.
Where it appears an icon with an exclamation point (File) you can open the file with the associated application (based on file extension).
To save the modified data press the Apply button.
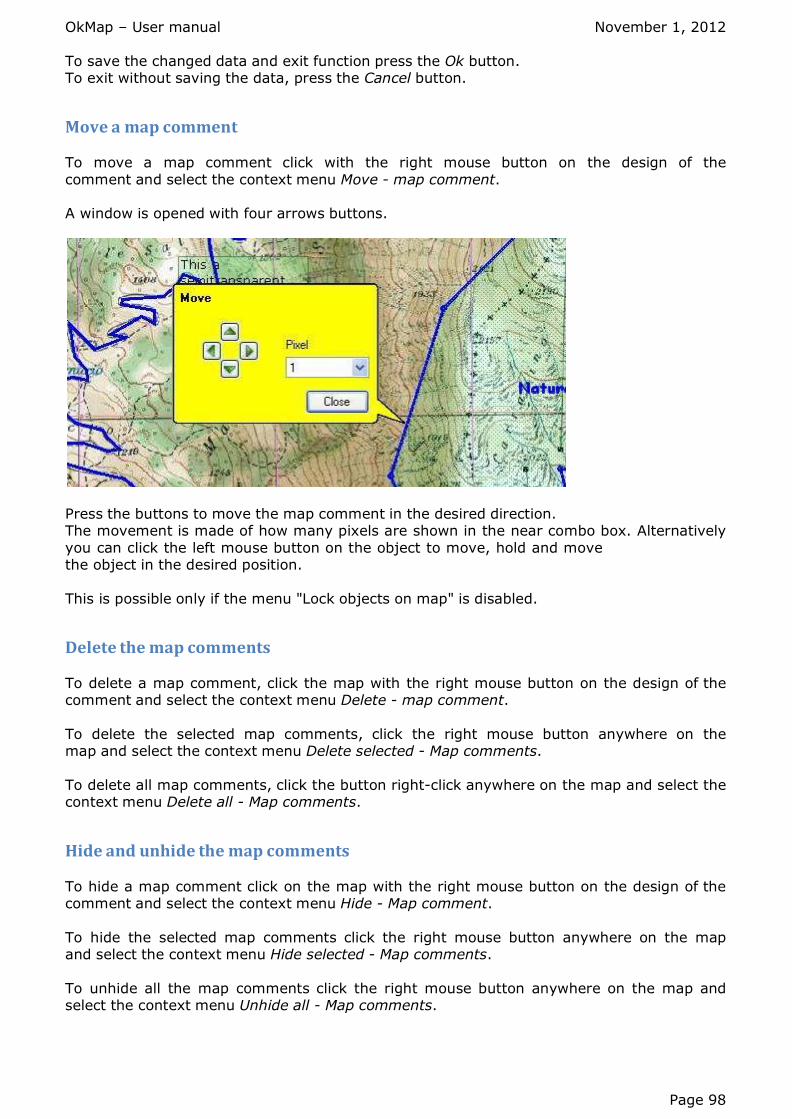
OkMap – User manual November 1, 2012
Page 98
To save the changed data and exit function press the Ok button. To exit without saving the data, press the Cancel button.
Move a map comment To move a map comment click with the right mouse button on the design of the
comment and select the context menu Move - map comment. A window is opened with four arrows buttons.
Press the buttons to move the map comment in the desired direction. The movement is made of how many pixels are shown in the near combo box. Alternatively
you can click the left mouse button on the object to move, hold and move the object in the desired position.
This is possible only if the menu "Lock objects on map" is disabled.
Delete the map comments To delete a map comment, click the map with the right mouse button on the design of the comment and select the context menu Delete - map comment.
To delete the selected map comments, click the right mouse button anywhere on the map and select the context menu Delete selected - Map comments.
To delete all map comments, click the button right-click anywhere on the map and select the context menu Delete all - Map comments.
Hide and unhide the map comments
To hide a map comment click on the map with the right mouse button on the design of the comment and select the context menu Hide - Map comment.
To hide the selected map comments click the right mouse button anywhere on the map and select the context menu Hide selected - Map comments.
To unhide all the map comments click the right mouse button anywhere on the map and select the context menu Unhide all - Map comments.

OkMap – User manual November 1, 2012
Page 99
GPX data
What are the GPX data The acronym GPX stands for GPs eXchange format. It is a type of XML data format designed for the interchange of GPS data between applications and web services on the Internet.
In turn XML stands for eXtensible Markup Language. It is a markup meta language, which is a marker extensible language because it lets you to create custom tags.
The GPS data, representable in GPX format, are:
Waypoints Routes Tracks
More information about the GPX format can be found on page http://www.topografix.com/GPX_for_developers.asp.
More information about XML can be found on page http://www.w3.org/XML.
Load GPX data
To load a data file in GPX format use the menu File - Load - GPX data (multi); it is opened a dialogue box that let you to open one or more file with extension .GPX.
Alternatively, using the combo box of file types, you can upload files in the following formats:
CompeGPS
EasyGPS waypoints Fugawi waypoints Garmin MapSource gdb
Garmin MapSource mps Garmin POI database Garmin POI gpi
Geocaching waypoints Google Earth Kml Google Earth Kmz
GPS TrackMaker Open StreetMap OziExplorer waypoints
OziExplorer routes OziExplorer tracks
When the selection of the files is done, the following window is displayed.

OkMap – User manual November 1, 2012
Page 100
In this window it is possible to specify which types of GPX data you intends to load:
Waypoints
Routes Tracks
The End button acquires the information and loads the data. The Cancel button cancel the data import.
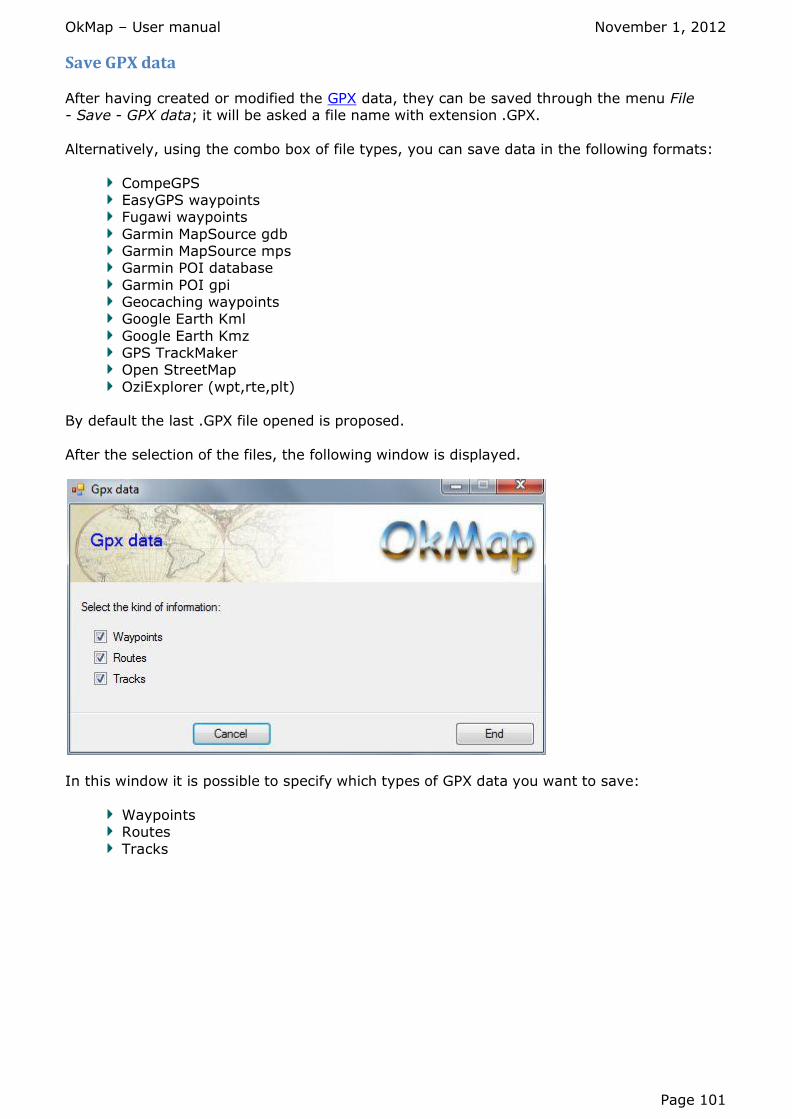
OkMap – User manual November 1, 2012
Page 101
Save GPX data
After having created or modified the GPX data, they can be saved through the menu File - Save - GPX data; it will be asked a file name with extension .GPX.
Alternatively, using the combo box of file types, you can save data in the following formats:
CompeGPS EasyGPS waypoints Fugawi waypoints
Garmin MapSource gdb Garmin MapSource mps Garmin POI database
Garmin POI gpi Geocaching waypoints Google Earth Kml
Google Earth Kmz GPS TrackMaker Open StreetMap
OziExplorer (wpt,rte,plt) By default the last .GPX file opened is proposed.
After the selection of the files, the following window is displayed.
In this window it is possible to specify which types of GPX data you want to save:
Waypoints Routes
Tracks

OkMap – User manual November 1, 2012
Page 102
Waypoints
What are the waypoints Waypoint is a term with which you define the point toward which a boat makes rout. Actually it could be any point where you know the geographic coordinates and possibly
other information. A waypoint can also be designed with OkMap, transferred to a GPS device and used as a
reference point, during the navigation.
Special case of the waypoints are POI (Point Of Interest); they are points of particular
interest such as museums, hotels, restaurants, gas stations, etc.. The terminology used by OkMap always makes use of the term waypoint.
The waypoint properties managed in OkMap are:
Waypoint name
Comment on waypoint Description of the waypoint Origin of the waypoint
Link (URL) to additional information on the waypoint Symbol to be used (default list) Waypoint type
Altitude above sea level Geographical coordinates Visible or hidden
Label visible or hidden Bitmap to draw on the map Font labels
Create a waypoint
A waypoint can be created:
by opening a GPX file created by OkMap or by another application
by an importation function from a different format (OziExplorer, KML) from the receipt of data in a GPS device by saving the current position during navigation
by saving after a conversion or a calculation drawing directly on the map
To create it on the map select the appropriate tool with the menu Tools - New waypoint and click with the left mouse button on the map in the desired position.
Subsequently, through the modify function, you can specify the properties of the new waypoint.
List the waypoints It is a function that can produce a list of waypoints and their characteristics.
Through this function you can change the properties of waypoints and delete one or more waypoints.
You can also select or less a waypoint changing the value contained in the Selected column; select a set of waypoints allows to make group operations such as deleting of multiple
items.
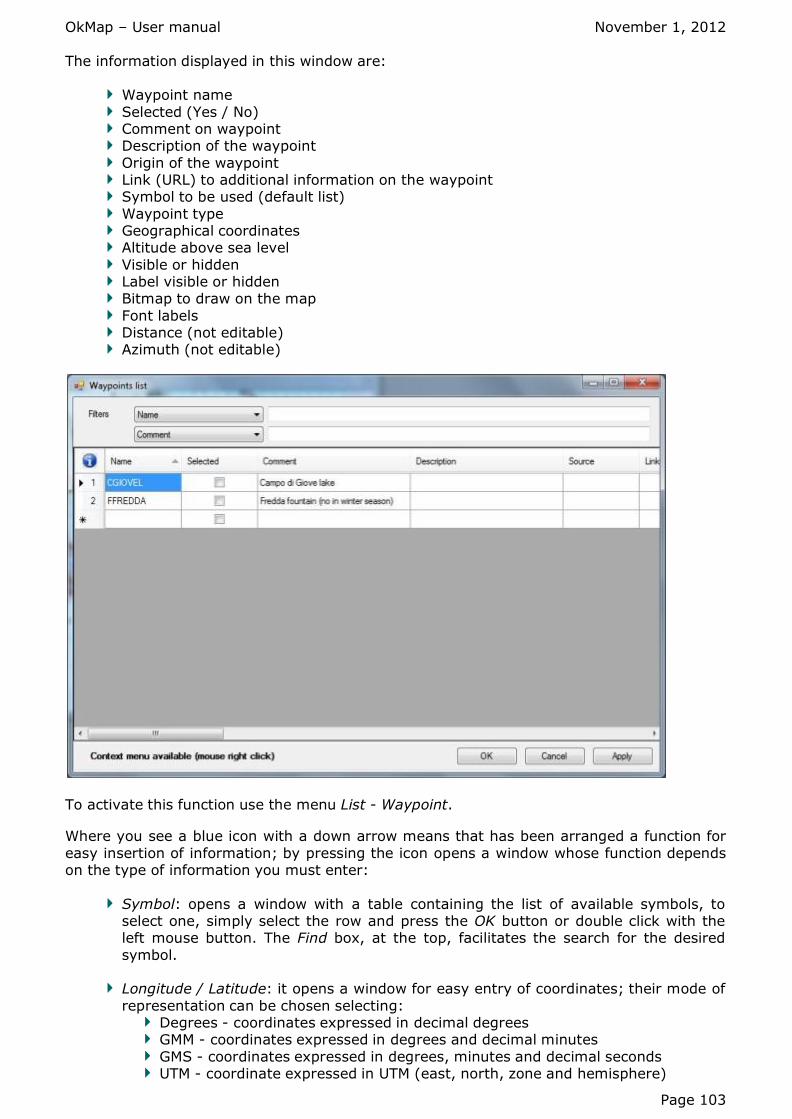
OkMap – User manual November 1, 2012
Page 103
The information displayed in this window are:
Waypoint name
Selected (Yes / No) Comment on waypoint Description of the waypoint
Origin of the waypoint Link (URL) to additional information on the waypoint Symbol to be used (default list)
Waypoint type Geographical coordinates Altitude above sea level
Visible or hidden Label visible or hidden Bitmap to draw on the map
Font labels Distance (not editable) Azimuth (not editable)
To activate this function use the menu List - Waypoint.
Where you see a blue icon with a down arrow means that has been arranged a function for
easy insertion of information; by pressing the icon opens a window whose function depends on the type of information you must enter:
Symbol: opens a window with a table containing the list of available symbols, to select one, simply select the row and press the OK button or double click with the left mouse button. The Find box, at the top, facilitates the search for the desired
symbol.
Longitude / Latitude: it opens a window for easy entry of coordinates; their mode of
representation can be chosen selecting: Degrees - coordinates expressed in decimal degrees GMM - coordinates expressed in degrees and decimal minutes
GMS - coordinates expressed in degrees, minutes and decimal seconds UTM - coordinate expressed in UTM (east, north, zone and hemisphere)
OkMap – User manual November 1, 2012
Page 104
Rad - expressed in decimal radiant
Bitmap position: opens a dialog box for choosing the bitmap file to be used for the representation of the waypoint.
Font labels: opens a dialog box for choosing the font to use for the representation of the labels of the waypoint.
To delete the waypoints see the topic Data tables.
It is also available a context menu activated with the right mouse button. This menu
provides the following functions:
Copy coordinates: copy the coordinates of the current waypoint to the clipboard.
Find on opened map: to locate the waypoint on all the opened maps
Calculate distances: calculate, for all the waypoints of the list, the distance from
current waypoint and the direction of a virtual line joining the two waypoints.
Set DEM altitude: sets the altitude of the current waypoint using the DEM data
available locally. A message may indicate the unavailability of altimetric data.
Set DEM altitude for selected: sets the altitude of all selected waypoints using the DEM data available locally. A message may indicate the unavailability of altimetric data.
Reset position bitmap: cancel the choice of a bitmap made earlier and restores the use of the bitmap defined at global level in the function Preferences - Waypoint.
Reset font labels: cancel the choice of a font made earlier and restores the use of the font defined at global level in the function Preferences - Waypoint.
Default grid layout: restores the default size of the grid columns.
To save the modified data press the Apply button. To save the changed data and exit function press the Ok button.
To exit without saving the data, press the Cancel button. For more information about the general use of tables, see the topic Data tables.
Select the waypoints
Select a set of waypoints allows you to perform group operations such as editing or deleting multiple GPX objects simultaneously.
To select the waypoints you can use one of the following methods:
Use the List - Waypoints function and activate the check in the table in the selected
column in the row corresponding to the waypoint to be selected.
Click on the map with the left mouse button on the corresponding icon.
In case of overlapping objects, click the right mouse button to select the waypoint
and use the context menu Select - waypoint.
To add other waypoints to the selection hold down the Ctrl key and click on the icons of the waypoint you want to add.
To select a group of neighboring GPX objects, draw a rectangle by holding down the

OkMap – User manual November 1, 2012
Page 105
Shift key and left mouse button.
To add a group of neighboring GPX objects hold down the Ctrl and Shift keys and draw a rectangle as in the previous case.
You can reverse the selection of objects using the context menu, activated with the
right mouse button, Invert selection.
To deselect all the objects click anywhere on the map where there aren't objects.
Information about a waypoint To obtain information about a waypoint is sufficient, if activated autoinfo (menu View -
Auto info), place the mouse on its design. A panel containing the following information is displayed:
the waypoint name the comment on the waypoint
the description of the waypoint the geographical coordinates the altitude above sea level
In any case, you can click the right mouse button on the waypoint icon and select the context menu Info - waypoint.
A window containing the following information will be opened:
the waypoint name the comment on the waypoint the description of the waypoint
the geographical coordinates the altitude above sea level link (URL) to additional information on the waypoint

OkMap – User manual November 1, 2012
Page 106
This window will automatically close when you click on another point on the map.
Modify the waypoints
You can modify the properties of a waypoint with the function List Waypoints.
Alternatively you can click the right mouse button on the waypoint icon and select the
context menu Modify - waypoint. A window containing the following information is opened:
Waypoint name Comment on the waypoint
Description of the waypoint Origin of the waypoint Link (URL) to additional information on the waypoint
Symbol to use (default list) Waypoint type Altitude above sea level
Geographical coordinates Visible or hidden Label visible or hidden
Bitmap to draw on the map Font labels

OkMap – User manual November 1, 2012
Page 107
Where an icon appears with an arrow at the bottom, means that a function is available for easy insertion of information; by pressing the icon opens a window whose function depends
on the type of information you must enter:
Symbol: opens a window with a table containing the list of available symbols; to
choose one, simply select the row and press the Ok button or double click with the left mouse button. The Find field, located above, facilitates the search for the desired symbol.
Bitmap: opens a dialog box for choosing the image file to be used for the representation of the waypoint.
Font labels: opens a dialog box for choosing the font to use for the representation of
the labels of the waypoints. Where appears an icon with a cross (Bitmap and Font) means that you want to delete the
choice made previously, and restore the default specified in the function Preferences - Waypoints.
While entering the coordinates can be chosen their mode of representation, selecting:
Degrees - coordinates expressed in decimal degrees GMM - coordinates expressed in degrees and decimal minutes GMS - coordinates expressed in degrees, minutes and decimal seconds
UTM - coordinate expressed in UTM (east, north, zone and hemisphere) Rad - expressed in decimal radiant
To save the modified data press the Apply button. To save the changed data and exit function press the Ok button. To exit without saving the data, press the Cancel button.
To modify all the selected waypoints click the right mouse button anywhere on the map and select the context menu Modify selected - Waypoints.

OkMap – User manual November 1, 2012
Page 108
A window containing the following information common to multiple waypoints is opened:
Visible or hidden
Label visible or hidden Bitmap to be drawn on the map Font labels
Apply the same considerations to editing a waypoint.
Move a waypoint
To move a waypoint click with the right mouse button on the on the icon of the waypoint and to select the context menu Move - waypoint.
A window is opened with four arrows buttons.
Press the buttons to move the waypoint in the desired direction.
The movement is made of how many pixels are shown in the near combo box. Alternatively you can click the left mouse button on the object to move, hold and move
the object in the desired position.
This is possible only if the menu "Lock objects on map" is disabled.

OkMap – User manual November 1, 2012
Page 109
Delete the waypoints You can delete a waypoint with the function List - Waypoints.
Alternatively you can click the right mouse button on the waypoint icon and select the context menu Delete - waypoint. To delete the selected waypoints, click the right mouse button anywhere on the map and select the context menu Delete selected - Waypoints. To delete all waypoints, click the button right-click anywhere on the map and select the context menu Delete all - Waypoints.
In addition, to delete all data GPX click the right mouse button anywhere on the map and select the context menu Delete all – GPX data.
Finally, to erase all GPX and vectorial data click the right mouse button anywhere on the map and select the context menu Delete all - All.
Hide and unhide the waypoints
You can hide a waypoint with the function List - Waypoints.
Alternatively, to hide a waypoint click with the right mouse button on the icon of the waypoint and select the context menu Hide - waypoint.
To hide the selected waypoints make click the right mouse button anywhere on the map and select the context menu Hide selected - Waypoints. To unhide all the waypoints click the right mouse button anywhere on the map and select the
context menu Unhide all - Waypoints.
Set the altitude to a waypoint You can attribute the altitude to a waypoint using the DEM data available locally with the function List - Waypoint, using the context menu Set DEM altitude.
Alternatively you can click the right mouse button on the waypoint icon and select the context menu Set DEM altitude - waypoint. A message indicates the unavailability of the
altimetric data.
Navigate toward a waypoint This function is used to obtain indications about the direction to follow for reaching a waypoint; naturally assumes the use of a connected GPS device. To navigate toward a waypoint, click the right mouse button on the waypoint icon and select the context menu Navigate - waypoint.
OkMap does the following:
Activates the navigation mode Opens the window navigation data Opens the window navigate toward a waypoint
For the use of the single functions, see the relative pages.

OkMap – User manual November 1, 2012
Page 110
Routes
What are the routes The route is a set of Waypoint in sequence, such a pathway. This path is typically a nautical route in which each waypoint indicates a change of direction or a road in which each
waypoint indicates a ramification (intersection, alternative, rotunda, exit, etc..). A route can also be designed with OkMap, transferred to a GPS and used for getting
information, during the navigation, in proximity of the waypoints (change of route). The properties of a route managed in OkMap are:
Route name Comment on the route Description of the route
Origin of the route Link (URL) to additional information on the route Route type
Visible or hidden Label visible or hidden
Color to use in drawing on the map Line thickness Font labels
A list of waypoints defining the route, with the following properties: Relative position of the waypoint Waypoint name
Selected (Yes / No) Comment on the waypoint Description of the waypoint
Origin of the waypoint Link (URL) to additional information on the waypoint Symbol to be used
Waypoint type Geographical coordinates Altitude above sea level
Visible or hidden Label visible or hidden Bitmap to draw on the map
Font labels
Create a route A route can be created:
by opening a GPX file created by OkMap or by another application by an importation function from a different format (OziExplorer, KML) from the receipt of data in a GPS device
drawing directly on the map To create it on the map select the appropriate tool with the menu Tools - New route
waypoint and click with the left mouse button on the map in the position of the first waypoint.
Then using the same technique you can create the next waypoint in sequence. Finally, using the modify function, you can specify the properties of the new route.
To create an additional route use the List routes function, enter the new route and
selected it by activating the indicator. Before drawing the waypoint, make sure that the just inserted route is the only one selected because the waypoints will be added to the first selected route.
OkMap – User manual November 1, 2012
Page 111
List the routes
It is a function that can produce a list of routes and their characteristics.
Moving the cursor on the single routes, all the relative waypoints are displayed in the
second table. Through this function you can change the properties of the routes, the properties of the
waypoints and delete one or more routes or one or more waypoints. You can also select or less the routes or the waypoints changing the value contained in the
Selected column; select a set of routes or waypoints allows to make group operations such as deleting of multiple items.
You can add a new route (with no waypoints) ready to be drawn with the mouse on the
map (selected it first). This window shows two tables: routes and waypoints. The first table (routes) contains the following information:
Route name Selected (Yes / No) Comment on the route
Description of the route Origin of the route Link (URL) to additional information on the route
Symbol to be used (default list) Route type Visible or hidden
Label visible or hidden Color to use in drawing on the map Line thickness
Font labels Number of waypoints in the route (not editable)
The second table (waypoints) contains the following information:
Relative position of the waypoint (not editable)
Name of the waypoint (not editable) Selected (Yes / No) Comment on the waypoint
Description of the waypoint Origin of the waypoint Link (URL) to additional information on the waypoint
Symbol to be used (default list) Waypoint type Geographical coordinates
Altitude above sea level Visible or hidden Label visible or hidden
Bitmap to draw on the map Font labels
Distance from the previous waypoint (not editable) Distance from the beginning of the route (not editable) Azimuth to the next waypoint (not editable)

OkMap – User manual November 1, 2012
Page 112
To activate this function use the menu List - Routes.
Where you see a blue icon with a down arrow means that has been arranged a function for easy insertion of information; by pressing the icon opens a window whose function depends
on the type of information you must enter:
Color: opens a dialog box for choosing the color to use in drawing lines between the
waypoints.
Thickness line: opens a dropdown for selecting the thickness of the lines between waypoints.
Font labels: opens a dialog box for choosing the font to use for the representation of
the labels of the route.
Symbol: opens a window with a table containing the list of available symbols, to select one, simply select the row and press the OK button or double click with the
left mouse button. The Find box, at the top, facilitates the search for the desired symbol.
Longitude / Latitude: it opens a window for easy entry of coordinates; their mode of representation can be chosen selecting:
Degrees - coordinates expressed in decimal degrees GMM - coordinates expressed in degrees and decimal minutes GMS - coordinates expressed in degrees, minutes and decimal seconds
UTM - coordinate expressed in UTM (east, north, zone and hemisphere) Rad - expressed in decimal radiant
Bitmap position: opens a dialog box for choosing the bitmap file to be used for the representation of the waypoint.
To insert the routes or to delete the routes or the waypoints see the topic Data tables.
It is also available a context menu activated with the right mouse button. In the first table (routes) this menu provides the following functions:
OkMap – User manual November 1, 2012
Page 113
Set DEM altitude: sets the altitude of the waypoints of the current route using the DEM data available locally. A message may indicate the unavailability of altimetric data.
Set DEM altitude for selected: sets the altitude of all waypoints of the selected
routes using the DEM data available locally. A message may indicate the unavailability of altimetric data.
Reset color: cancels selection of the line color made earlier and restores the use of the color defined at global level in the function Preferences - Routes.
Reset font labels: cancel the choice of a font made earlier and restores the use of the font defined at global level in the function Preferences - Routes.
Duplicate route: create a new route with the same waypoints of the current route. The name of the new route will be equal to the name of the origin route preceded
by "C".
Invert route: create a new route with the same waypoints of the current route but in inverse sequence. The name of the new route will be equal to the name of the origin route preceded by "I".
Add to Join route: add all the waypoints contained in the current route in the route named "JOIN". If the route JOIN does not exist it is automatically created with the same characteristics as the current route.
Default grid layout: restores the default size of the grid columns.
In the second table (waypoints) the context menu provides the following functions:
Copy coordinates: copy the coordinates of the current waypoint to the clipboard.
Find on opened map: to locate the waypoint on all the opened maps
Set DEM altitude: sets the altitude of the current waypoint using the DEM data available locally. A message may indicate the unavailability of altimetric data.
Set DEM altitude for selected: sets the altitude of all selected waypoints using the DEM data available locally. A message may indicate the unavailability of altimetric
data.
Moves down: moves the current waypoint after the next waypoint (if the current
waypoint is not the last).
Move up: moves the current waypoint before the previous waypoint (if the current waypoint is not the first).
Reset position bitmap: cancel the choice of a bitmap made earlier and restores the
use of the bitmap defined at global level in the function Preferences - Waypoint.
Reset font labels: cancel the choice of a font made earlier and restores the use of the font defined at global level in the function Preferences - Waypoint.
Default grid layout: restores the default size of the grid columns.
To save the modified data press the Apply button.
To save the changed data and exit function press the Ok button. To exit without saving the data, press the Cancel button.
For more information about the general use of tables, see the topic Data tables.

OkMap – User manual November 1, 2012
Page 114
Select the routes Select a single route is useful when you want to add waypoints to the end.
Select a set of routes allows you to perform group operations such as editing or deleting multiple GPX objects simultaneously. To select the routes you can use one of the following methods:
Use the List routes function and activate the check in the table in the selected
column in the row corresponding to the route to be selected.
Click on the map with the left mouse button anywhere on the line connecting the waypoints.
In case of overlapping objects, click the right mouse anywhere on the line
connecting the waypoints and use the context menu Select - route.
To add other routes to the selection hold down the Ctrl key and click on the line of the route you want to add.
To select a group of neighboring GPX objects, draw a rectangle by holding down the
Shift key and left mouse button.
To add a group of neighboring GPX objects hold down the Ctrl and Shift keys and draw a rectangle as in the previous case.
You can reverse the selection of objects using the context menu, activated with the
right mouse button, Invert selection.
To deselect all the objects click anywhere on the map where there aren't objects.
Select the route waypoints Select a single route waypoint is useful when you want to add waypoints in the route, particularly before the selected waypoint.
Select a set of route waypoints allows you to perform group operations such as editing or deleting multiple GPX objects simultaneously. To select the route waypoints you can use one of the following methods:
Use the List routes function and activate the check in the second table in the selected column in the row corresponding to the waypoint to be selected. Click on
the map with the left mouse button on the corresponding icon.
In case of overlapping objects, click the right mouse on the waypoint and use the context menu Select - route waypoint.
To add other route waypoints to the selection hold down the Ctrl key and click on waypoint icon you want to add.
To select a group of neighboring GPX objects, draw a rectangle by holding down the Shift key and left mouse button.
To add a group of neighboring GPX objects hold down the Ctrl and Shift keys and draw a rectangle as in the previous case.
You can reverse the selection of objects using the context menu, activated with the

OkMap – User manual November 1, 2012
Page 115
right mouse button, Invert selection.
To deselect all the objects click anywhere on the map where there aren't objects.
Information about a route To obtain information about a route is sufficient, if activated autoinfo (menu View - Auto info), place the mouse on the line joining two waypoints of the route.
A panel containing the following information is displayed:
the route name the comment on the route the description of the route
In any case, you can click the right mouse button on the waypoint icon and select the context menu Info - route.
A window containing the following information will be opened:
the route name the comment on the route the description of the route
the number of waypoints the route length link (URL) to additional information on the route
This window will automatically close when you click on another point on the map.

OkMap – User manual November 1, 2012
Page 116
Information about a route waypoint
To obtain information about a route waypoint is sufficient, if activated autoinfo (menu View - Auto info), place the mouse on the route waypoint.
A panel containing the following information is displayed:
the route name
the waypoint number the waypoint name the comment on the waypoint
the waypoint description the geographical coordinates the altitude above sea level
In any case, you can click the right mouse button on the route waypoint icon and select the
context menu Info - route waypoint. A window containing the following information will be opened:
the route name the waypoint number
the waypoint name the comment on the waypoint the waypoint description
the geographical coordinates the altitude above sea level link (URL) to additional information on the route

OkMap – User manual November 1, 2012
Page 117
This window will automatically close when you click on another point on the map.
Modify the routes
You can modify the properties of a route with the function List routes.
Alternatively you can click the right mouse button on the line joining two waypoints of the route and select the context menu Modify - route.
A window containing the following information is opened:
Route name Comment on the route
Description of the route Origin of the route Link (URL) to additional information on the route
Route type Visible or hidden Label visible or hidden
Color to use in drawing on the map Line thickness Font labels

OkMap – User manual November 1, 2012
Page 118
Where an icon appears with an arrow at the bottom, means that a function is available for easy insertion of information; by pressing the icon opens a window whose function depends on the type of information you must enter:
Color: opens a dialog box for choosing the color to use in drawing lines between the waypoints.
Thickness line: opens a dropdown for selecting the thickness of the lines between waypoints.
Font labels: opens a dialog box for choosing the font to use for the representation of the labels of the route.
Where appears an icon with a cross (Color and Font) means that you want to delete the choice made previously, and restore the default specified in the function Preferences -
Routes.
To save the modified data press the Apply button.
To save the changed data and exit function press the Ok button. To exit without saving the data, press the Cancel button.
To modify all the selected routes click the right mouse button anywhere on the map and select the context menu Modify selected - Routes. A window containing the following information common to multiple routes is opened:
Visible or hidden Label visible or hidden
Color to use in drawing on the map Line thickness Font labels
Apply the same considerations to editing a route.
Add a waypoint to a route To add a waypoint at the end of a route, select the route, then select the appropriate tool
with the menu Tools - New route waypoint and then click the left mouse button on the map in relative position to the waypoint you want to add.
To add a waypoint in a route, select the waypoint previous to that you want to insert, then proceed as above.
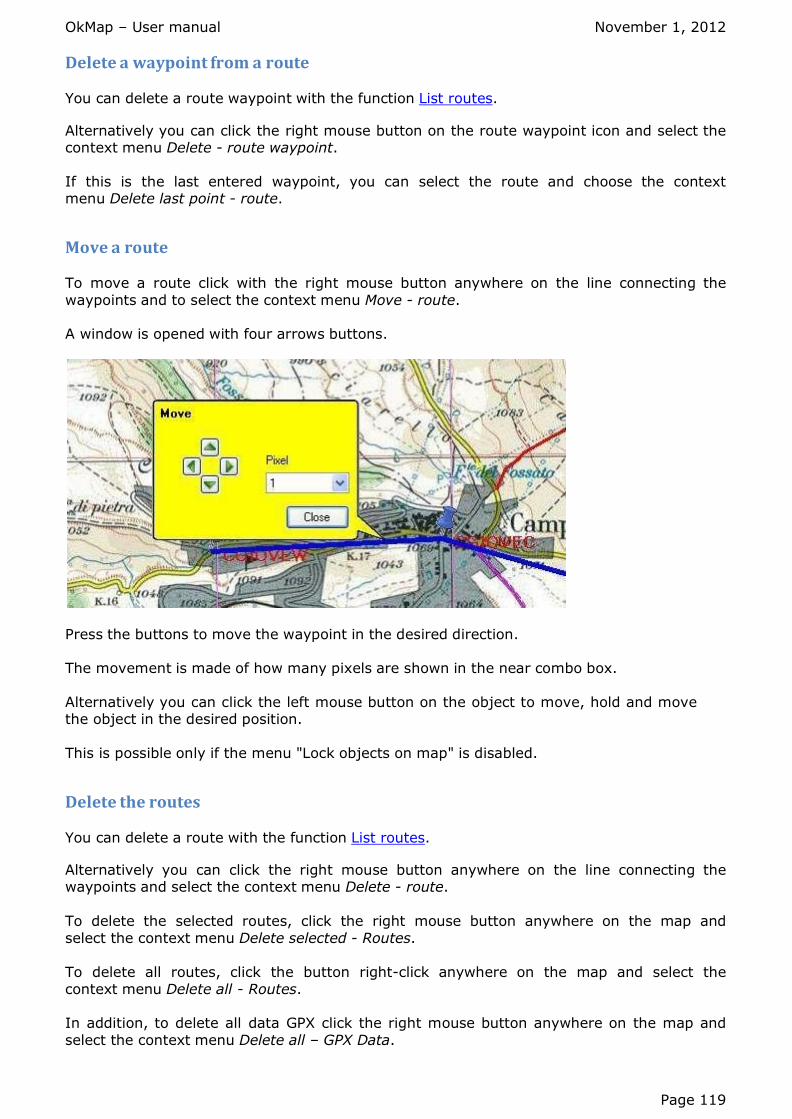
OkMap – User manual November 1, 2012
Page 119
Delete a waypoint from a route You can delete a route waypoint with the function List routes.
Alternatively you can click the right mouse button on the route waypoint icon and select the context menu Delete - route waypoint.
If this is the last entered waypoint, you can select the route and choose the context menu Delete last point - route.
Move a route To move a route click with the right mouse button anywhere on the line connecting the
waypoints and to select the context menu Move - route. A window is opened with four arrows buttons.
Press the buttons to move the waypoint in the desired direction. The movement is made of how many pixels are shown in the near combo box.
Alternatively you can click the left mouse button on the object to move, hold and move the object in the desired position.
This is possible only if the menu "Lock objects on map" is disabled.
Delete the routes
You can delete a route with the function List routes.
Alternatively you can click the right mouse button anywhere on the line connecting the waypoints and select the context menu Delete - route. To delete the selected routes, click the right mouse button anywhere on the map and
select the context menu Delete selected - Routes. To delete all routes, click the button right-click anywhere on the map and select the
context menu Delete all - Routes. In addition, to delete all data GPX click the right mouse button anywhere on the map and
select the context menu Delete all – GPX Data.

OkMap – User manual November 1, 2012
Page 120
Finally, to erase all GPX and vectorial data click the right mouse button anywhere on the map and select the context menu Delete all - All.
Hide and unhide the routes You can hide a route with the function List routes.
In alternative it is possible to make click with the right key of the mouse anywhere on the line connecting the waypoints and select the context menu Hide - route. To hide the selected routes make click the right mouse button anywhere on the map and select the context menu Hide selected - Routes. To unhide all the routes click the right mouse button anywhere on the map and select the
context menu Unhide all - Routes.
Duplicate a route You can duplicate a route with the function List routes, using the context menu Duplicate route.
Alternatively you can click the right mouse button anywhere on the line connecting the route waypoints and select the context menu Duplicate - route.
Create a new route with the same waypoints of the indicated route. The name of the new route will be equal to the name of the origin route preceded by "C.".
Invert a route
You can reverse a route with the function List routes, using the context menu Invert route.
Alternatively you can click the right mouse button anywhere on the line connecting the route waypoints and select the context menu Invert - route.
Create a new route with the same waypoints of the indicated route, but in inverse sequence. The name of the new route will be equal to the name of the origin route preceded by "I.".
Join the routes
You can add all the route waypoints in a route named JOIN with the function List routes, using the context menu Add to the Join route.
Alternatively you can click the right mouse button anywhere on the line connecting the route waypoints and select the context menu Add to Join - route.
All the route waypoints are added in the route named "JOIN." If the route JOIN does not exist it is automatically created with the same characteristics as the current route.
Set the altitude to a route You can set the altitude of the waypoints of the a route using the DEM data available
locally, with the function List routes, using the context menu Set DEM altitude.

OkMap – User manual November 1, 2012
Page 121
Alternatively you can click the right mouse button anywhere on the line connecting the route waypoints and select the context menu Set DEM altitude - route. A message may indicate the possible unavailability of the altimetric data.
If you want set the altitude on only one waypoint of the route, select the route, then click the right mouse button on the waypoint of the route and select the context menu Set DEM
altitude – route waypoint.
Navigate along a route This function is used to obtain indications about the direction to navigate along a route; naturally assumes the use of a connected GPS device.
To navigate along a route, click the right mouse button anywhere on the line connecting the
route waypoints and select the context menu Navigate - route. OkMap does the following:
Activates the navigation mode Opens the window navigation data
Opens the window navigate along a route For the use of the single functions, see the relative pages.

OkMap – User manual November 1, 2012
Page 122
Tracks
What are the tracks Track is a set of points in sequence and very close, such a pathway. This path can be of any nature (road, path, etc. ..) and is usually detected by GPS on the go.
A track can also be designed with OkMap, transferred and used by a GPS during the travel, to follow the path accurately.
The properties of a track managed in OkMap are:
Track name Comment on the track Description of the track
Origin of the track Link (URL) to additional information on the track Track type
Visible or hidden Label visible or hidden
Last position visible or hidden Color to use in drawing on the map Line thickness
Font labels A list of points defining the track, with the following properties:
Number of the segment to which the point belongs
Relative position of the point in the segment Selected (Yes / No) Geographical coordinates
Altitude above sea level Date/time of point detection
Create a track
A track can be created:
by opening a GPX file created by OkMap or by another application by an importation function from a different format (OziExplorer, KML) from the receipt of data in a GPS device
by recording during the navigation with the GPS drawing directly on the map
To create it on the map select the appropriate tool with the menu Tools - New track point and click with the left mouse button on the map in the position of the first point.
Then using the same technique you can create the next point in sequence. Finally, using the
modify, you can specify the properties of the new track.
To create an additional track use the List tracks function, enter the new track and selected it by activating the indicator. Before drawing the point, make sure that the just
inserted track is the only one selected because the points will be added to the first selected track.
List the tracks
It is a function that can produce a list of tracks and their characteristics.
Moving the cursor on the single tracks, all the relative points are displayed in the second table.

OkMap – User manual November 1, 2012
Page 123
Through this function you can change the properties of the tracks, the properties of the points and delete one or more tracks or one or more points.
You can also select or less the tracks or the points changing the value contained in the Selected column; select a set of tracks or points allows to make group operations such as deleting of multiple items.
You can add a new track (with no points) ready to be drawn with the mouse on the map (selected it first).
This window shows two tables: tracks and points. The first table (tracks) contains the following information:
Track name Comment on the track
Description of the track Origin of the track Link (URL) to additional information on the track
Track type Visible or hidden Label visible or hidden
Last position visible or hidden Color to use in drawing on the map Line thickness
Font labels Number of segments in the track (not editable) Number of points in the track (not editable)
The second table (points) contains the following information:
Number of the segment to which the point belongs (not editable) Relative position of the point in the segment (not editable)
Name of the point Selected (Yes / No) Geographical coordinates
Altitude above sea level Date/time of point detection Instant velocity
Distance from the previous point (not editable) Distance from the beginning of the track (not editable) Azimuth toward the following point (not editable)

OkMap – User manual November 1, 2012
Page 124
To activate this function use the menu List - Tracks.
Where you see a blue icon with a down arrow means that has been arranged a function for easy insertion of information; by pressing the icon opens a window whose function depends
on the type of information you must enter:
Color: opens a dialog box for choosing the color to use in drawing lines between the
points.
Thickness line: opens a dropdown for selecting the thickness of the lines between points.
Font labels: opens a dialog box for choosing the font to use for the representation of
the labels of the track.
Longitude / Latitude: it opens a window for easy entry of coordinates; their mode of representation can be chosen selecting:
Degrees - coordinates expressed in decimal degrees GMM - coordinates expressed in degrees and decimal minutes GMS - coordinates expressed in degrees, minutes and decimal seconds
UTM - coordinate expressed in UTM (east, north, zone and hemisphere) Rad - expressed in decimal radiant
To insert the tracks or to delete the tracks or the points see the topic Data tables.
It is also available a context menu activated with the right mouse button. In the first table
(tracks) this menu provides the following functions:
Statistics: displays a window with statistical information
Altitude profile: display a window with a graph of the altitude profile
Set DEM altitude: sets the altitude of the points of the current track using the DEM
data available locally. A message may indicate the unavailability of altimetric data.
Set DEM altitude for selected: sets the altitude of all points of the selected tracks

OkMap – User manual November 1, 2012
Page 125
using the DEM data available locally. A message may indicate the unavailability of altimetric data.
Set travel time: estimates the travel time of the points of the current track. The walking speed, flat is defined in the function Preferences - Tracks.
Set travel time for selected: estimates the travel time of all the points of the selected tracks.
Reset color: cancels selection of the line color made earlier and restores the use of
the color defined at global level in the function Preferences - Tracks.
Reset font labels: cancel the choice of a font made earlier and restores the use of the font defined at global level in the function Preferences - Tracks.
Simplify track: create a new simplified track with a maximum number of points equal to that defined in the function Preferences - Tracks. The name of the new track will be equal to the name of the origin track preceded from "S.".
Duplicate track: create a new track with the same points of the current track. The name of the new track will be equal to the name of the origin track preceded by "C".
Invert track: create a new track with the same points of the current track but in
inverse sequence. The name of the new track will be equal to the name of the origin track preceded by "I".
Merge segment: all segments of the track are merged into a single segment.
Add to Join track: add all the points contained in the current track in the track named "JOIN". If the track JOIN does not exist it is automatically created with the same characteristics as the current track.
Default grid layout: restores the default size of the grid columns.
In the second table (points) the context menu provides the following functions:
Copy coordinates: copy the coordinates of the current point to the clipboard.
Find on opened map: to locate the track point on all the opened maps
Set DEM altitude: sets the altitude of the current point using the DEM data available locally. A message may indicate the unavailability of altimetric data.
Set DEM altitude for selected: sets the altitude of all selected points using the DEM data available locally. A message may indicate the unavailability of altimetric data.
New segment: starting from the current point creates an additional segment breaking, in this way, the current track at that point.
Divide track: creates a new track excluding the points above the current one. The name of the new track will be equal to the name of the origin track preceded by "N".
Default grid layout: restores the default size of the grid columns. To save the modified data press the Apply button.
To save the changed data and exit function press the Ok button. To exit without saving the data, press the Cancel button.
For more information about the general use of tables, see the topic Data tables.

OkMap – User manual November 1, 2012
Page 126
Select the tracks Select a single track is useful when you want to add points to the end.
Select a set of tracks allows you to perform group operations such as editing or deleting multiple GPX objects simultaneously.
To select the tracks you can use one of the following methods:
Use the List tracks function and activate the check in the table in the selected
column in the row corresponding to the track to be selected.
Click on the map with the left mouse button anywhere on the line connecting the points.
In case of overlapping objects, click the right mouse anywhere on the line connecting the points and use the context menu Select - track.
To add other tracks to the selection hold down the Ctrl key and click on the line of the track you want to add.
To select a group of neighboring GPX objects, draw a rectangle by holding down the Shift key and left mouse button.
To add a group of neighboring GPX objects hold down the Ctrl and Shift keys and draw a rectangle as in the previous case.
You can reverse the selection of objects using the context menu, activated with the
right mouse button, Invert selection.
To deselect all the objects click anywhere on the map where there aren't objects.
Select the track points Select a single track point is useful when you want to add points in the track, particularly
before the selected point. Select a set of track point allows you to perform group operations such as editing or
deleting multiple GPX objects simultaneously. To select the track points you can use one of the following methods:
Use the List tracks function and activate the check in the second table in the selected column in the row corresponding to the point to be selected.
Click on the map with the left mouse button on the corresponding little ball. In case of overlapping objects, click the right mouse on the point and use the context menu
Select - track point.
To add other track points to the selection hold down the Ctrl key and click on the point you want to add.
To select a group of neighboring GPX objects, draw a rectangle by holding down the Shift key and left mouse button.
To add a group of neighboring GPX objects hold down the Ctrl and Shift keys and draw a rectangle as in the previous case.
You can reverse the selection of objects using the context menu, activated with the right mouse button, Invert selection.

OkMap – User manual November 1, 2012
Page 127
To deselect all the objects click anywhere on the map where there aren't objects.
Information about a track
To obtain information about a track is sufficient, if activated autoinfo (menu View - Auto
info), place the mouse on the line joining two points of the route. A panel containing the following information is displayed:
the track name the comment on the track
the description of the track
In any case, you can click the right mouse button anywhere on the line joining two point and select the context menu Info - track.
A window containing the following information will be opened:
the track name the comment on the track
the description of the track the number of the segments the number of the points
the track length link (URL) to additional information on the route
This window will automatically close when you click on another point on the map.

OkMap – User manual November 1, 2012
Page 128
Information about a track point
To obtain information about a track point is sufficient, if activated autoinfo (menu View - Auto info), place the mouse on the track point.
A panel containing the following information is displayed:
the track name the segment number
the point number the geographical coordinates
the altitude above sea level the date/time of point detection
In any case, you can click the right mouse button on the track point and select the
context menu Info - track point. A window containing the following information will be opened:
the track name the segment number
the point number the geographical coordinates the altitude above sea level
the date/time of point detection instant velocity

OkMap – User manual November 1, 2012
Page 129
This window will automatically close when you click on another point on the map.
Modify the tracks You can modify the properties of a track with the function List tracks.
Alternatively you can click the right mouse button on the line joining two points of the track and select the context menu Modify - track.
A window containing the following information is opened:
Track name
Comment on the track Description of the track Origin of the track
Link (URL) to additional information on the track Track type Visible or hidden
Label visible or hidden Last position visible or hidden Color to use in drawing on the map
Line thickness Font labels
Where an icon appears with an arrow at the bottom, means that a function is available for easy insertion of information; by pressing the icon opens a window whose function depends
on the type of information you must enter:
Color: opens a dialog box for choosing the color to use in drawing lines between the
points.
Thickness line: opens a dropdown for selecting the thickness of the lines between points.
Font labels: opens a dialog box for choosing the font to use for the representation of
the labels of the track. Where appears an icon with a cross (Color and Font) means that you want to delete the
choice made previously, and restore the default specified in the function Preferences - Tracks.

OkMap – User manual November 1, 2012
Page 130
To save the modified data press the Apply button. To save the changed data and exit function press the Ok button. To exit without saving the data, press the Cancel button.
To modify all the selected tracks click the right mouse button anywhere on the map and select the context menu Modify selected - Tracks.
A window containing the following information common to multiple tracks is opened:
Visible or hidden
Label visible or hidden Last position visible or hidden Color to use in drawing on the map
Line thickness Font labels
Apply the same considerations to editing a track.
Add a point to a track
To add a point at the end of a track, select the track, then select the appropriate tool with
the menu Tools - New track point and then click the left mouse button on the map in relative position to the point you want to add.
To add a point in a track, select the point previous to that you want to insert, then
proceed as above.
Modify a point of a track To modify a point of a track you can click the right mouse button on the track point and select the context menu Modify – track point.
A window containing the following information is opened:
Point name Comment on the point Description of the point
Origin of the point Link (URL) to additional information on the point Symbol to use (default list)

OkMap – User manual November 1, 2012
Page 131
Point type Altitude above sea level Date / hour
Geographical coordinates
Where an icon appears with an arrow at the bottom, means that a function is available for easy insertion of information; by pressing the icon opens a window whose function depends on the type of information you must enter:
Symbol: opens a window with a table containing the list of available symbols; to choose one, simply select the row and press the Ok button or double click with the left mouse button. The Find field, located above, facilitates the search for the desired
symbol.
While entering the coordinates can be chosen their mode of representation, selecting:
Degrees - coordinates expressed in decimal degrees GMM - coordinates expressed in degrees and decimal minutes
GMS - coordinates expressed in degrees, minutes and decimal seconds UTM - coordinate expressed in UTM (east, north, zone and hemisphere) Rad - expressed in decimal radiant
To save the modified data press the Apply button. To save the changed data and exit function press the Ok button.
To exit without saving the data, press the Cancel button.
Delete a point from a track You can delete a route waypoint with the function List tracks.

OkMap – User manual November 1, 2012
Page 132
Alternatively you can click the right mouse button on the track point and select the context menu Delete - track point.
If this is the last entered point, you can select the track and choose the context menu Delete last point - track.
Move a track To move a track click with the right mouse button anywhere on the line connecting the
points and to select the context menu Move - track. A window is opened with four arrows buttons.
Press the buttons to move the waypoint in the desired direction. The movement is made of how many pixels are shown in the near combo box.
Alternatively you can click the left mouse button on the object to move, hold and move the object in the desired position.
This is possible only if the menu "Lock objects on map" is disabled.
Delete the tracks
You can delete a track with the function List tracks.
Alternatively you can click the right mouse button anywhere on the line connecting the points and select the context menu Delete - track.
To delete the selected tracks, click the right mouse button anywhere on the map and select the context menu Delete selected - Tracks.
To delete all tracks, click the button right-click anywhere on the map and select the context menu Delete all - Tracks.
In addition, to delete all data GPX click the right mouse button anywhere on the map and select the context menu Delete all - GPX Data.
Finally, to erase all GPX and vectorial data click the right mouse button anywhere on the map and select the context menu Delete all - All.
Hide and unhide the tracks

OkMap – User manual November 1, 2012
Page 133
It is possible to hide a track with the function List tracks.
In alternative it is possible to make click with the right key of the mouse anywhere on the
line connecting the points and select the context menu Hide - track. To hide the selected tracks make click the right mouse button anywhere on the map and
select the context menu Hide selected - Tracks. To unhide all the tracks click the right mouse button anywhere on the map and select the
context menu Unhide all - Tracks.
Simplify a track You can simplify a track with the function List tracks, using the context menu Simplify track.
Alternatively you can click the right mouse button anywhere on the line connecting the track points and select the context menu Simplify - track.
Create a new track with the same points of the indicated track. The name of the new track will be equal to the name of the origin track preceded by "C.".
Creates a new track with a maximum number of points equal to that defined in the function Preferences - Tracks. The name of the new track will be equal to the name of the origin
track preceded by "S.".
Duplicate a track You can duplicate a track with the function List tracks, using the context menu Duplicate
track. Alternatively you can click the right mouse button anywhere on the line connecting the
track points and select the context menu Duplicate - track. Create a new track with the same points of the indicated track. The name of the new
track will be equal to the name of the origin track preceded by "C.".
Invert a track
You can reverse a track with the function List tracks, using the context menu Invert track.
Alternatively you can click the right mouse button anywhere on the line connecting the track points and select the context menu Invert - track.
Create a new track with the same points of the indicated track, but in inverse sequence. The name of the new track will be equal to the name of the origin track preceded by "I.".
Join the tracks You can add all the track points in a track named JOIN with the function List tracks,
using the context menu Add to the Join track. Alternatively you can click the right mouse button anywhere on the line connecting the
track points and select the context menu Add to Join - track.

OkMap – User manual November 1, 2012
Page 134
All the track points are added in the track named "JOIN." If the track JOIN does not exist it is automatically created with the same characteristics as the current track.
Join the segments of a track
You can merge the segments of a track with the function List tracks, using the context menu One segment.
Alternatively you can click the right mouse button anywhere on the line connecting the track points and select the context menu One segment - track.
Set the altitude to a track
You can set the altitude of the points of a track using the DEM data available locally, with the function List tracks, using the context menu Set DEM altitude.
Alternatively you can click the right mouse button anywhere on the line connecting the
track points and select the context menu Set DEM altitude - track. A message may indicate the possible unavailability of the altimetric data.
If you want set the altitude on only one track point, select the track, then click the right mouse button on the track point and select the context menu Set DEM altitude – track point.
Set the travel time to a track You can set the date and time of the points of a track with the function List tracks, using the
context menu Set travel time. Alternatively you can click the right mouse button anywhere on the line connecting the
track points and select the context menu Set travel time - track.
Navigate along a track This function is used to obtain indications about the direction to navigate along a track;
naturally assumes the use of a connected GPS device. To navigate along a track, click the right mouse button anywhere on the line connecting the
track points and select the context menu Navigate - track. OkMap does the following:
Activates the navigation mode
Opens the window navigation data
Opens the window navigate along a track For the use of the single functions, see the relative pages.
Track statistics
You can get statistic information on a track with the function List tracks, using the context menu Statistics.
Alternatively you can click the right mouse button anywhere on the line connecting the track points and select the context menu Statistics - track.
The following window is displayed:
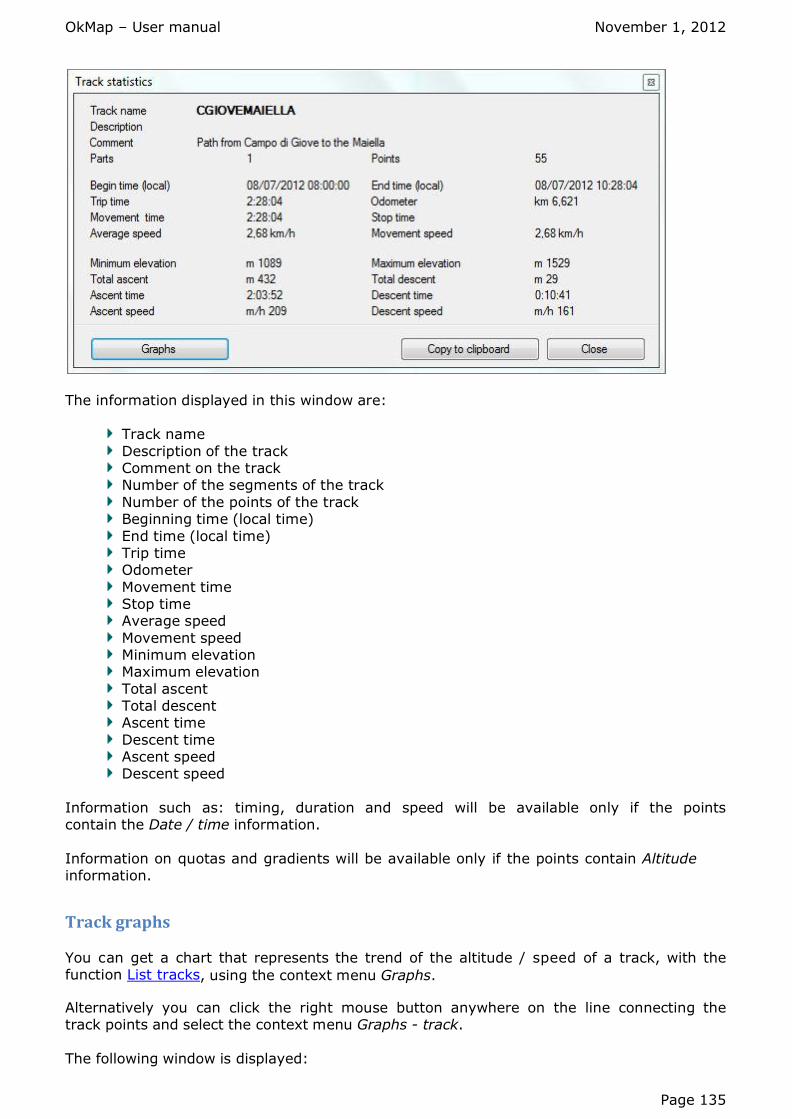
OkMap – User manual November 1, 2012
Page 135
The information displayed in this window are:
Track name
Description of the track Comment on the track Number of the segments of the track
Number of the points of the track Beginning time (local time)
End time (local time) Trip time Odometer
Movement time Stop time Average speed
Movement speed Minimum elevation Maximum elevation
Total ascent Total descent Ascent time
Descent time Ascent speed Descent speed
Information such as: timing, duration and speed will be available only if the points contain the Date / time information.
Information on quotas and gradients will be available only if the points contain Altitude information.
Track graphs
You can get a chart that represents the trend of the altitude / speed of a track, with the function List tracks, using the context menu Graphs.
Alternatively you can click the right mouse button anywhere on the line connecting the track points and select the context menu Graphs - track.
The following window is displayed:

OkMap – User manual November 1, 2012
Page 136
The graph will be displayed only if the points contain the information Altitude (or Time in case of speed).
X axis shows the distance in meters from the origin of the track (or the time from the origin of the track if available) while the y axis shows the altitude (or the speed if the time is available).
You can select some options to modify the graph or make available some information.
Move the mouse over each graph point to obtain information (if available) on the relative point of the track:
Segment number Point number Altitude
Distance from the beginning of the track Time from the beginning of the track Date and time
Instant velocity
There is also a context menu with the following functions:
Copy Coordinates: Copy to the clipboard the coordinates of the current track point
Find on opened map: to locate the track point on all the opened maps

OkMap – User manual November 1, 2012
Page 137
Import vectorial data
Import OkMap vectorial data Import vectorial data from an OkMap map means include in the current map the vectorial data of another map converting, if necessary, projection and reference datum.
The import is activated through the menu File - Import - OkMap vectorial data (multi). Opens a dialog box that allows you to open one or more files with extension .okm.
If no map has been loaded, OkMap automatically creates a new vectorial map with the following features:
Projection: Longitude / Latitude Datum: World Geodetic 1984 (WGS84) Geographical bounds: the same bounds of the vectorial data
The characteristics of the vectorial map automatically created can subsequently be modified through the menu File - Modify - Map parameters.
Import SHP vectorial data Import vectorial data in ESRI shape file format means include such vectorial data in the current map converting, if necessary, projection and reference datum.
The import is activated through the menu File - Import - SHP vectorial data (multi). Opens a dialog box that allows you to open one or more files with extension .shp. After the selection of files, a series of windows (wizard) are displayed to identify the
characteristics of the coordinates and the map (type of coordinates, datum, projection and its parameters); all selected files must have naturally the same characteristics.
To switch between windows use the Next > and< Previous buttons. To close the wizard to press the End button; to cancel it press the Cancel button.
The first window is used to indicate the type of coordinates contained in the shp files.
In this window you must specify whether the coordinates contained in the shp files are
geographical or metric, in which case you must also specify the unit of measurement. The sequence of windows that follows depends on the type of coordinates that were chosen;
in the case of metric coordinates only reference datum is required; following shows the whole sequence that takes place in the case of geographic coordinates.
The next window is to indicate with a simple selection: reference datum, projection type and its parameters.

OkMap – User manual November 1, 2012
Page 138
The data are stored in a database that contains a large number of definitions used by most nations in the layout their own maps.
The list shows only the presets of datum / projections active. To enable or disable one or
more definitions use the function List - Presets.
Once you select the wizard ends. If it was not possible to identify the characteristics of the
map you are creating, you can proceed to a manual selection of information, leaving empty the selection field and pressing the Next > button.
In this case a window is displayed to define the datum used by the map.
The list shows only the presets of datum / projections active. To enable or disable one or more definitions use the function List - Datum.
Going forward, a window is displayed to define the type of projection used by the map.

OkMap – User manual November 1, 2012
Page 139
If the desired projection did not appear in the list and the surface of the map covers a small region, one can obtain a good approximation by selecting the projection Longitude / Latitude.
Once selected the projection, press the button Parameters to indicate the projection parameters.
The type and number of parameters depend on the projection in question. For more
information refer to the Projection parameters of the page What are the cartographic projections.
Do not make the selection of parameters is equivalent to set the center of the projection on the Greenwich meridian to the equator, the false east and north to zero and the scale factor
to 1. The Accept button acquire information about the parameters and redisplays the window of
choice of the projection. The End button ends the wizard related to the setup of the data.

OkMap – User manual November 1, 2012
Page 140
For each imported file, some attributes are required to create the corresponding vectorial theme.
In this window the following are required:
The name of the theme (if it already exists a substitution confirm is required).
The field of the database connected to the shp data where is contained the label to
be attributed to the single shapes (if applicable).
The color to be attributed to the single shapes (if applicable).
The fill color to be attributed to the single shapes (if applicable).
The line thickness to be used in the drawing of the single shapes (if applicable).
The Reset color button cancel the choices of color made in the boxes where appears the writing click to change color.
The Accept button acquires the choices made for the current theme and go to the
following theme (file shp). The Cancel button skips the choices made for the current theme and go to the following
theme (file shp). The Cancel all button cancel the choices made for the current theme and skips the
requests for the following themes (file shp). If no map has been loaded, OkMap automatically creates a new vectorial map with the
following features:
Projection: Longitude / Latitude
Datum: World Geodetic 1984 (WGS84) Geographical bounds: the same bounds of the vectorial data
The characteristics of the vectorial map automatically created can subsequently be modified through the menu File - Modify - Map parameters.
Import DCW polygons

OkMap – User manual November 1, 2012
Page 141
Import vectorial data in DCW format (Digital Chart of World) means include in the current map such vectorial data converting, if necessary, projection and reference datum.
The import is activated through the menu File - Import - DCW polygon data (multi). Opens a dialog box that allows you to open one or more files with extension .txt. After the selection of files, a series of windows (wizard) are displayed to identify the
characteristics of the coordinates and the map (type of coordinates, datum, projection and its parameters); all selected files must have naturally the same characteristics.
To switch between windows use the Next > and< Previous buttons. To close the wizard to press the End button; to cancel it press the Cancel button.
The first window is used to indicate the type of coordinates contained in the Dcw files.
In this window you must specify whether the coordinates contained in the shp files are geographical or metric, in which case you must also specify the unit of measurement.
The next window is to indicate with a simple selection: reference datum, projection type and its parameters.
The data are stored in a database that contains a large number of definitions used by most nations in the layout their own maps.

OkMap – User manual November 1, 2012
Page 142
The list shows only the presets of datum / projections active. To enable or disable one or more definitions use the function List - Presets.
Once you select the wizard ends. If it was not possible to identify the characteristics of the map you are creating, you can proceed to a manual selection of information, leaving empty the selection field and pressing the Next > button.
In this case a window is displayed to define the datum used by the data you are importing.
The list shows only the presets of datum / projections active. To enable or disable one or more definitions use the function List - Datum.
Going forward, a window is displayed to define the type of projection used by the data you are importing.
If the desired projection did not appear in the list and the surface of the map covers a small region, one can obtain a good approximation by selecting the projection Longitude /
Latitude.

OkMap – User manual November 1, 2012
Page 143
Once selected the projection, press the button Parameters to indicate the projection parameters.
The type and number of parameters depend on the projection in question. For more information refer to the Projection parameters of the page What are the cartographic
projections. Do not make the selection of parameters is equivalent to set the center of the projection on
the Greenwich meridian to the equator, the false east and north to zero and the scale factor to 1.
The Accept button acquire information about the parameters and redisplays the window of choice of the projection. The End button ends the wizard related to the setup of the data.
For each imported file will be created a new vectorial theme with the same file name, and if the theme already exists will be asked a confirm of replacement.
If no map has been loaded, OkMap automatically creates a new vectorial map with the following features:
Projection: Longitude / Latitude Datum: World Geodetic 1984 (WGS84)
Geographical bounds: the same bounds of the vectorial data The characteristics of the vectorial map automatically created can subsequently be modified
through the menu File - Modify - Map parameters.

OkMap – User manual November 1, 2012
Page 144
Export vectorial data
Export SHP vectorial data Export vectorial data in ESRI shape file format means creating vectorial data in that format from those loaded in the current map using the requested type of coordinates.
The export is activated through the menu File - Export - SHP vectorial data.
This opens a dialog box to select the folder where to save the files in ESRI shape file format.
Subsequently a window is displayed to acquire the type of coordinates you want to export.
In this window you must specify whether the coordinates contained in the shp files are
geographical or metric, in which case you must also specify the unit of measurement. For each vectorial theme, three files will be created, according to the standard ESRI, with the
extension .shp, .dbf and .shx. The .dbf files are organized in the following format:
ID: progressive number NAME: shape label
COLOR: shape color FILLCOLOR: shape fill color LINEWIDTH: line thickness used in the draw of the shape

OkMap – User manual November 1, 2012
Page 145
GPS communications
Receive data from GPS This function must be used only for GPS devices that support their proprietary communication protocol. For others GPS, copy GPX files directly from the mass storage
device mounted on your computer. Before to access this function, make sure you have properly configured the parameters for
communication with the GPS in the function Preferences - GPS.
Receiving data from the GPS is activated through the menu GPS - Receive.
A window is displayed to select the data you want to receive.
In this window you can specify which types of GPX data you want to receive:
Waypoints Routes Tracks
and the action to do if the element already exists in memory:
Replace: the element lo load replace the existent element; Add with new name: it will be generated a new unique name for the element to load that will be added;
Skip: the element to load will be ignored. The End button acquire the information and receive the data. The Close closes the
window.
Send data to GPS This function must be used only for GPS devices that support their proprietary communication protocol. For others GPS, copy GPX files directly to the mass storage device
mounted on your computer. Before to access this function, make sure you have properly configured the parameters for
communication with the GPS in the function Preferences - GPS.

OkMap – User manual November 1, 2012
Page 146
Transfer data to the GPS is activated through the menu GPS - Send. A window is displayed to select the data you want to send.
In this window you can specify which types of GPX data you want to send:
Waypoints
Routes Tracks
You can also select the objects to send:
All: all the mentioned above GPX data are sent. Only selected: only the mentioned above selected GPX data are sent.
The End button acquire the information and send the data. The Close closes the window.
Turn off the GPS Before to access this function, make sure you have properly configured the parameters for communication with the GPS in the function Preferences - GPS.
You can turn off the GPS through the menu GPS - Turn off. Only some GPS models are enabled to be turned off by software.
OkMap – User manual November 1, 2012
Page 147
Navigation
Navigation mode The navigation mode is used to establish a connection with the connected GPS and to begin receiving data via the NMEA protocol.
NMEA 0183 is a standard interface between digital equipment and is mainly used in nautical applications (autopilot systems, etc..).
Only a subset has importance within the GPS; in these case the system is used to transmit NMEA data from a GPS receiver to a computer.
Before to access this function, make sure you have properly configured the parameters for communication with the GPS in the function Preferences - NMEA and have correctly
plugged the GPS. The function is activated / deactivated through the menu Navigate – NMEA communication.
When you activate the navigation mode, the Navigation data window is displayed.
To exit the navigation mode (receiving NMEA) use again the menu Navigation - NMEA communication.
If the state communication with GPS failed persists check:
The communication parameters set in the Preferences - NMEA function.
The connection cable between computer and GPS or Bluetooth communication. The GPS is turned on and is working.
Navigation simulator The simulation mode is used to simulate the receiving of navigation data from a GPS via the
NMEA protocol. The emulated NMEA sentenced is $GPRMC.
The function is activated through the menu Navigation - NMEA simulator.
The following window is displayed.

OkMap – User manual November 1, 2012
Page 148
Before starting the simulation is necessary to specify the starting coordinates; this can be done:
Manually specifying the coordinates in the formats:
Degrees - coordinates expressed in decimal degrees
GMM - coordinates expressed in degrees and decimal minutes GMS - coordinates expressed in degrees, minutes and decimal seconds UTM - coordinate expressed in UTM (east, north, zone and hemisphere)
Rad - expressed in decimal radiant
Selecting the coordinates through the button Sel. coordinates.
Using the Paste function of the context menu of the box coordinates (before you must have copied the point coordinates on a map with the context menu or you
must have copied the coordinates from another coordinates box).
When you activate the simulation mode with the button Start, the Navigation data
window is displayed.
To stop the simulation use the Stop button. You can change direction and speed increasing / decreasing with the respective buttons.
Navigation data
This function provides real time information on the navigation data received from the connected GPS via NMEA protocol.
This function only works if the Navigation mode or Navigation simulator are active.
The function is activated through the menu Navigate - Navigation data.
The following window is displayed.

OkMap – User manual November 1, 2012
Page 149
The information displayed in this window are:
Connection status Latitude: latitude of the last received position
Longitude: longitude of the last received position Bearing / MV: direction followed and magnetic variation Speed: instant speed
Date/Time: Date and time of the last received position Altitude: last received altitude above sea level
The information is updated automatically when you receive a new NMEA sentence from GPS.
Navigate toward a waypoint
This function provides real time information to reach a waypoint during the NMEA navigation with the connected GPS.
This function only works if the Navigation mode or Navigation simulator are active.
The function is activated through the menu Navigate - Navigate to… - To waypoint. The following window is displayed.

OkMap – User manual November 1, 2012
Page 150
The information displayed in this window are:
Sound on: if activated, near the waypoint, you hear a sound; wav file is configurable in the function Preferences - Sounds
Name of the selected waypoint Latitude wpt: latitude of the selected waypoint Longitude wpt: longitude of the selected waypoint Direction: direction to be followed
Distance: distance between the current position and the waypoint E.T.E. (Estimated Time of Enroute): estimated time to reach the waypoint E.T.A. (Estimated Time of Arrival): estimated time of arrival at waypoint
With the Sel. waypoint button you can choose the waypoint of destination; a table containing the list of selectable waypoints is displayed.
For more information about the general use of tables, see the topic Data tables.
To select a waypoint, select a row and press the Apply button or simply double-click with the left mouse button in the row to be selected.
To facilitate the search of a waypoint, fill the Find field with the leading characters of the column on which the sort order is selected.
The information is updated automatically when you receive a new NMEA sentence from GPS.
Navigate along a route This function provides real time information to follow a route during the NMEA navigation
with the connected GPS. This function only works if the Navigation mode or Navigation simulator are active.

OkMap – User manual November 1, 2012
Page 151
The function is activated through the menu Navigate - Navigate to… - Along a route. The following window is displayed.
The information displayed in this window are:
Reverse: if activated it follows the route beginning from the end
Sound on: if activated, in proximity of a waypoint, a sound is sent forth; the file wav is configurable in the function Preferences - Sounds
Name of the selected route
Comment on the selected route Description of the selected route Next wpt: name of the next waypoint to reach
Latitude wpt: latitude of the next waypoint Longitude wpt: longitude of the next waypoint Bearing: direction to be followed for reaching the next waypoint
Distance: distance between the current position and the next waypoint E.T.E. (Estimated Time of Enroute): estimated time to reach the next waypoint E.T.A. (Estimated Time of Arrival): estimated time of arrival at next waypoint
Distance to end: between the current position and the end of the route E.T.E. (Estimated Time of Enroute): estimated time to reach the end of the route E.T.A. (Estimated Time of Arrival): estimated time of arrival at end of the route
With the Sel. route button you can choose the route to follow; a table containing the list of selectable routes is displayed.
For more information about the general use of tables, see the topic Data tables.
To select a route, select a row and press the Apply button or simply double-click with the left mouse button in the row to be selected.
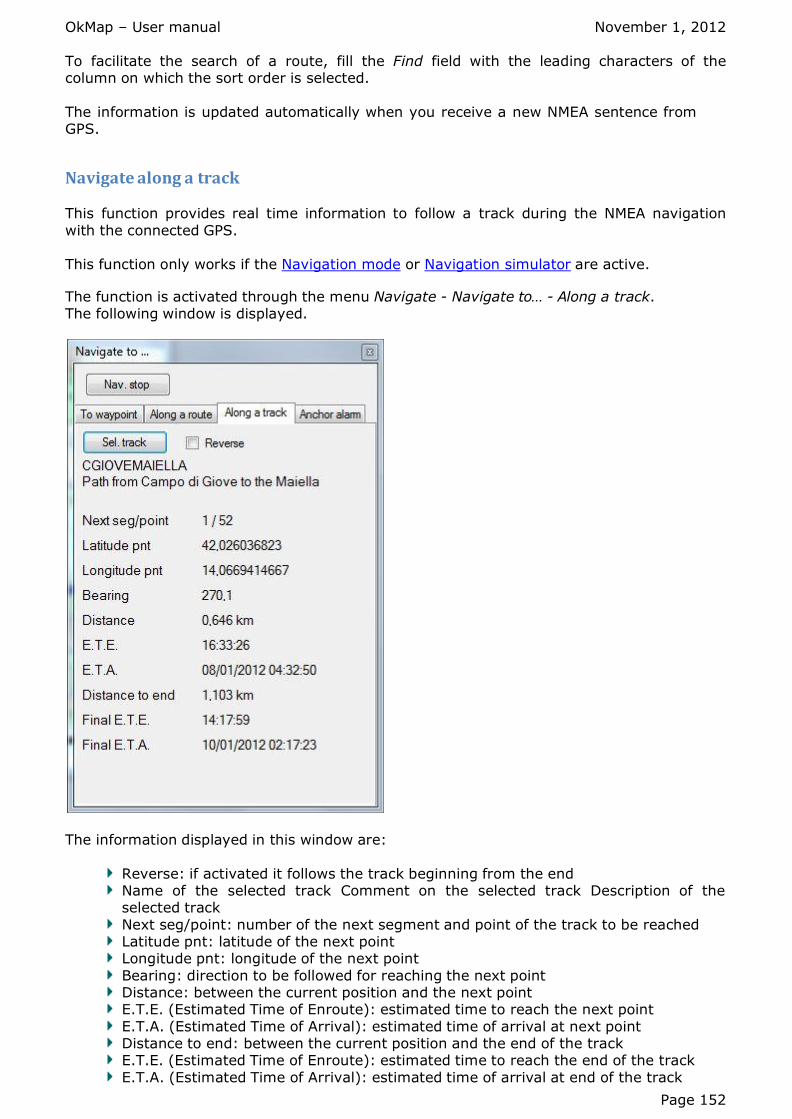
OkMap – User manual November 1, 2012
Page 152
To facilitate the search of a route, fill the Find field with the leading characters of the column on which the sort order is selected.
The information is updated automatically when you receive a new NMEA sentence from GPS.
Navigate along a track This function provides real time information to follow a track during the NMEA navigation
with the connected GPS. This function only works if the Navigation mode or Navigation simulator are active.
The function is activated through the menu Navigate - Navigate to… - Along a track. The following window is displayed.
The information displayed in this window are:
Reverse: if activated it follows the track beginning from the end Name of the selected track Comment on the selected track Description of the selected track
Next seg/point: number of the next segment and point of the track to be reached Latitude pnt: latitude of the next point Longitude pnt: longitude of the next point
Bearing: direction to be followed for reaching the next point Distance: between the current position and the next point E.T.E. (Estimated Time of Enroute): estimated time to reach the next point
E.T.A. (Estimated Time of Arrival): estimated time of arrival at next point Distance to end: between the current position and the end of the track E.T.E. (Estimated Time of Enroute): estimated time to reach the end of the track
E.T.A. (Estimated Time of Arrival): estimated time of arrival at end of the track

OkMap – User manual November 1, 2012
Page 153
With the Sel. track button you can choose the track to follow; a table containing the list of selectable tracks is displayed.
For more information about the general use of tables, see the topic Data tables.
To select a track, select a row and press the Apply button or simply double-click with the left mouse button in the row to be selected.
To facilitate the search of a track, fill the Find field with the leading characters of the column on which the sort order is selected.
The information is updated automatically when you receive a new NMEA sentence from GPS.
Anchor alarm This feature provides an alarm if you deviate too much from a particular point (anchor),
during the NMEA navigation with the connected GPS. This function only works if the Navigation mode or Navigation simulator are active.
The function is activated through the menu Navigate – Navigate to… - Anchor alarm.
The following window is displayed.
The information displayed in this window are:
Sound on: if activated, if you deviate too much from the point, you hear a sound; wav file is configurable in the function Preferences - Sounds Radius: determines the minimum distance to turn on the alarm Latitude pnt: latitude of the selected point

OkMap – User manual November 1, 2012
Page 154
Longitude pnt: longitude of the selected point Direction: direction to be followed for returning to the point Distance: distance between the current position and the selected point
The Reset button establishes a new point with the last position received by the GPS.
To turn off the alarm uncheck the Sound on option or establish a new reference point. The information is updated automatically when you receive a new NMEA sentence from
GPS.
Compass This function provides real time information on the navigation data received from the connected GPS via NMEA protocol.
This function only works if the Navigation mode or Navigation simulator are active.
The function is activated through the menu Navigate - Navigation data. The following window is displayed.
The information displayed in this window are:
A compass with a needle (red) indicating the followed direction and possibly a second needle (green) which indicated the direction to follow when is activated the
function Navigate to…; the background color can be: Red: communication with the GPS failed Yellow: the satellite signal is weak
Green: communication with the GPS working
North up: if activated fixes the north the top center of the compass, otherwise the
ring is rotated depending on the direction followed The information is updated automatically when you receive a new NMEA sentence from
GPS.
Satellites map This function provides real time information on the signal quality of satellites in view received from the connected GPS via NMEA protocol.
This function only works if the Navigation mode or Navigation simulator are active.

OkMap – User manual November 1, 2012
Page 155
The function is activated through the menu Navigate – Satellites map. The following window is displayed.
You'll see a sky map with the location of satellites. Each satellite is represented by a colored dot with the number of the satellite inside.
The meaning of colors is as follows:
Gray: satellite non used
Red: SNR (Signal to Noise Ratio) <= 10 Yellow: SNR (Signal to Noise Ratio) > 10 and <= 20 Green: SNR (Signal to Noise Ratio) > 20
The information is updated automatically when you receive a new NMEA sentence from GPS.
Satellites in view
This function provides real time information on the signal quality of satellites in view received from the connected GPS via NMEA protocol.
This function only works if the Navigation mode or Navigation simulator are active.
The function is activated through the menu Navigate - Satellites.
The following window is displayed.

OkMap – User manual November 1, 2012
Page 156
The information displayed in this window are:
Connection status H V P Dop: Horizontal, Vertical, Position DOP (Dilution of Precision) define the goodness of the geometry of the satellites in view, if the satellites are close together
then the geometry is weak and the DOP value is high, if the satellites are far apart, the geometry is strong and the DOP is low;
Number of active channels
Channel table (maximum 20): Value of SNR (Signal to Noise Ratio) Graph bar of the previous value
For values of DOP you may refer to the following table:
DOP Evaluation
1 Ideal
2-3 Excellent
4-6 Good
7-8 Discreet
9-20 Scarce
21-50 Bad
The information is updated automatically when you receive a new NMEA sentence from GPS.
Record the GPS track log This function is used to record a GPX track (track log) with the data received from the
connected GPS via the NMEA protocol.
This function only works if the Navigation mode or Navigation simulator are active.
The function is activated / deactivated through the menu Navigate - Record GPS track.
The recorded track is named ACTIVE LOG. Each time you resume recording the track a new segment is created.

OkMap – User manual November 1, 2012
Page 157
GPS track statistics This function provides real time statistics on the track log received from the connected GPS via NMEA protocol.
This function only works if the Navigation mode or Navigation simulator are active.
The function is activated through the menu Navigate – GPS track statistics. The following window is displayed.
The function is identical to Track statistics.
The information is updated automatically when you receive a new NMEA sentence from GPS.
GPS track graphs
This function provides real time information on altitude profile / speed of the track log received from the connected GPS via NMEA protocol.
This function only works if the Navigation mode or Navigation simulator are active.
The function is activated through the menu Navigate – GPS track graphs.
The following window is displayed.

OkMap – User manual November 1, 2012
Page 158
The function is identical to Track graphs. The information is updated automatically when you receive a new NMEA sentence from
GPS.
Save the current position With this function you can save the current position as a new waypoint during the NMEA navigation with the connected GPS.
This function only works if the Navigation mode or Navigation simulator are active.
The function is activated through the menu Navigate - Save waypoint position. The new waypoint will be added to the existing data GPX; the name used is an
automatically generated serial number.
Send current position to OkMap This function is used to send the current location to a remote server, during the navigation NMEA with the connected GPS.
The computer that sends data is defined client, while the computer that receives data is defined server; multiple clients can send data simultaneously to the same server.
The OkMap server receives data activating the receive data from remote OkMap
function; this information can be displayed on a map obtaining the tracks of the clients movements.
Before to access this function, make sure you have properly configured the parameters for communication by socket in the function Preferences – Send OkMap and you are connected to the network.
This function only works if the Navigation mode or Navigation simulator are active.
The function is activated / deactivated through the menu Navigate - Send position.

OkMap – User manual November 1, 2012
Page 159
Send current position to GpsGate
This function is used to send the current location to the remote server GpsGate.com, during the navigation NMEA with the connected GPS.
The computer that sends data is defined client, while the computer that receives data (in this case GpsGate.com) is defined server; multiple clients can send data simultaneously to the server.
To use this feature you must first subscribe to GpsGate.com.
To receive the positions of the clients you can activate the receive data from
GpsGate.com function; this information can be displayed on a map obtaining the tracks of
the clients movements. Before to access this function, make sure you have properly configured the parameters for
communication to the server in the function Preferences - GpsGate.com and you are connected to the network.
This function only works if the Navigation mode or Navigation simulator are active.
The function is activated / deactivated through the menu Navigate - Send to
GpsGate.com.
Center the map This function is to keep the map centered during the navigation NMEA with the connected GPS.
This function only works if the Navigation mode or Navigation simulator are active.
The function is activated / deactivated through the menu Navigate - Keep center map.

OkMap – User manual November 1, 2012
Page 160
Receive remote data
Receive data from remote OkMap This function is to receive the current positions of the users that use the send current position to OkMap function.
The computer that sends data is defined client, while the computer that receives data is defined server; multiple clients can send data simultaneously to the same server.
The data received can be displayed on a map in the form of tracks getting constantly geographical locations of the clients.
Before to access this function, make sure you have properly configured the parameters for communication by socket in the function Preferences - Receive OkMap and you are
connected to the network. The function is activated / deactivated through the menu Remote data - Receive OkMap
tracks.
For each client that sends data, a new track will be created with the same name as identifier of that client (as defined in the client computer in the Preferences – Send OkMap function).
To view with an icon the current location of the client, activate the View - Tracks last pos. menu.
The GPX data on the map are continually redesigned to ensure real time display of received data.
Receive data from GpsGate.com This function is to receive the current positions of the users that use the send position to
GpsGate function.
To use this feature you must first subscribe to GpsGate.com.
The computer that sends data is defined client, while the computer that receives data is defined server; multiple clients can send data simultaneously to the same server.
The data received can be displayed on a map in the form of tracks getting constantly geographical locations of the clients.
Before to access this function, make sure you have properly configured the parameters for communication from GpsGate.com in the function Preferences - GpsGate.com and you are
connected to the network. The function is activated / deactivated through the menu Server - GpsGate.com active. For each client that sends data, a new track will be created with the same name as
identifier of that client ((as defined during the subscribing to the site GpsGate.com).
To view with an icon the current location of the client, activate the View - Tracks last
pos. menu.
The GPX data on the map are continually redesigned to ensure real time display of received
data.

OkMap – User manual November 1, 2012
Page 161
Utility functions
Distance calculation This function is used to calculate distances between two or more points on the map using the mouse.
To activate the distance calculation use the menu Tools - Distance; click the left mouse
button on the map to indicate the start point, then indicate, using the same method, the intermediate points and the end point.
On the map is drawn a broken line joining the points; this is the path of which you are making the measurement; the characteristics of the line and the unit of measurement of the result can be customized in the Preferences – Distance, area function.
The calculated measure is indicated in the bottom status bar.
To clear the measurement and the line on the map you can use the menu Tools - Reset
distance / area.
Area calculation This function is used to calculate an area on the map using the mouse.
To activate the area calculation use the menu Tools - Area; click the left mouse button on the map to indicate the first node of the polygon, and subsequently indicate, using the
same method, the remaining nodes of the polygon. On the map is drawn a polygon that identifies the area of which he is effecting the
measure; this is the area of which you are making the measurement; the characteristics of the line and the unit of measurement of the result can be customized in the Preferences – Distance, area function.
The calculated measure is indicated in the bottom status bar.
To clear the measurement and the polygon on the map you can use the menu Tools -
Reset distance / area.
Google Earth his function is used to automatically open Google Earth (which must have been previously installed on your computer) in the same position of the loaded map (either raster
or vectorial) and to display all the GPX data loaded. The map itself, if raster, is displayed overlapped in Google Earth but only if it has
compatible format (jpg, bmp, tif, tga, png, gif, ppm, pgm). To activate Google Earth use the menu Utilities - Google Earth.

OkMap – User manual November 1, 2012
Page 162
Data are stored in Google Earth under the topic Temporary places - OkMap. To change the transparency of the map move the slider contained in the box Places. Google
Earth is already set by OkMap to get a 3D view; you can still act on the sliders of Google Earth to change the display mode.
You can, leave Google Earth open, show OkMap window, load another map and call again Google Earth; you can obtain the union of different maps and data GPX.
Google Maps This function is used to automatically open Google Maps in the same position of the
loaded map (either raster or vectorial). To activate Google Maps use the menu Utilities - Google Maps. Your computer must be
connected to the Internet.
Maps server It's a function that can display and save a map locally and create a calibration file (.okm) for OkMap.

OkMap – User manual November 1, 2012
Page 163
To activate this function use the menu Utilities - Maps server. To display the map, type the location (e.g.: Via Roma, 45 Milano).
Alternately you can input the geographical coordinates of the center of the map; this can be done:
Manually specifying the coordinates in the formats: Degrees - coordinates expressed in decimal degrees GMM - coordinates expressed in degrees and decimal minutes
GMS - coordinates expressed in degrees, minutes and decimal seconds UTM - coordinate expressed in UTM (east, north, zone and hemisphere) Rad - expressed in decimal radiant
Selecting the coordinates through the button Sel. coordinates. Using the Paste function of the context menu of the box coordinates (before you
must have copied the point coordinates on a map with the context menu or you must have copied the coordinates from another coordinates box).
You can select:
The zoom level (0-20)
The image size in pixel to produce Then press the Get image button.
You can choose if produce a grayscale image (less memory usage).
To save the map image and its calibration file for OkMap (.okm), press the Save map
button.
Geocoding It's a function that can determine the geographical coordinates based on a specific street
address.
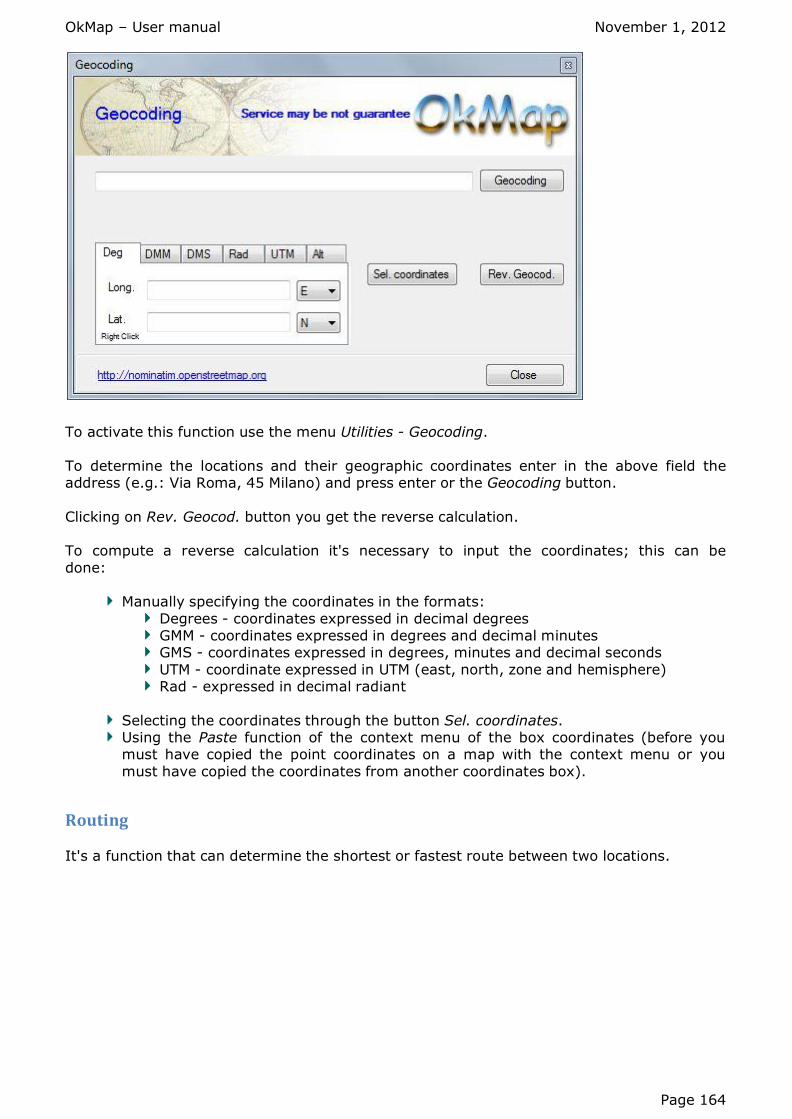
OkMap – User manual November 1, 2012
Page 164
To activate this function use the menu Utilities - Geocoding.
To determine the locations and their geographic coordinates enter in the above field the address (e.g.: Via Roma, 45 Milano) and press enter or the Geocoding button.
Clicking on Rev. Geocod. button you get the reverse calculation. To compute a reverse calculation it's necessary to input the coordinates; this can be
done:
Manually specifying the coordinates in the formats:
Degrees - coordinates expressed in decimal degrees GMM - coordinates expressed in degrees and decimal minutes GMS - coordinates expressed in degrees, minutes and decimal seconds
UTM - coordinate expressed in UTM (east, north, zone and hemisphere) Rad - expressed in decimal radiant
Selecting the coordinates through the button Sel. coordinates. Using the Paste function of the context menu of the box coordinates (before you must have copied the point coordinates on a map with the context menu or you
must have copied the coordinates from another coordinates box).
Routing It's a function that can determine the shortest or fastest route between two locations.

OkMap – User manual November 1, 2012
Page 165
To activate this function use the menu Utilities - Routing.
To determine the track enter the start and the end addresses (e.g.: Via Roma, 45 Milano) and press enter or the Calculate button.
Alternatively you can type the coordinates of the start and end places; this can be done:
Manually specifying the coordinates in the formats:
Degrees - coordinates expressed in decimal degrees
GMM - coordinates expressed in degrees and decimal minutes GMS - coordinates expressed in degrees, minutes and decimal seconds UTM - coordinate expressed in UTM (east, north, zone and hemisphere)
Rad - expressed in decimal radiant
Selecting the coordinates through the button Sel. coordinates.
Using the Paste function of the context menu of the box coordinates (before you must have copied the point coordinates on a map with the context menu or you must have copied the coordinates from another coordinates box).
You can customize:
Transport type (motorcar, bicycle, walking) Fastest or shortest route
Calculated track can be saved by pressing the Save track button; the name must be typed in the beside box.
Map tiling / Garmin custom maps
It 's a function that can subdivide a map orthogonally in smaller maps. Is particularly useful for creating maps compatible with some handheld GPS such as
Garmin.
A video is available for this function.

OkMap – User manual November 1, 2012
Page 166
To activate this function use the menu Utility - Map tiling. Map zooming and panning functions are similar to those of display map window.
You can customize:
The output format (KML, KMZ, JNX v.3, JNX v.4, OruxMaps, OkMap) The format of the output images (JPG, TIF, PNG, GIF, BMP) The quality of the output JPEG images (0=Bad, 100=Good)
The use of extensions kml 2.2 (only for OkMap version) The ID and the map title (only for JNX) The JNX scale (only for JNX)
The KML transparency (0=Transparent, 255=Opaque) The KML draw order (0=Invisible, 1-49=Under the vectorial data, 50-100=On the top)
The image filter to be used in resizing functions The percentage of resizing of the images to generate The size (width and height) of the tiles you want generate or customize the number
of horizontal and vertical tiles number by scrollbars The sub maps you want to generate (using the right mouse button also)
The button Optimize automatically sets the best settings to generate the "Garmin Custom Maps".
The button Create a north oriented map creates a new OkMap map aligned to true north (usefull to create JNX format maps).
To select all the maps press the button Select all. Similarly to unselect all the maps press the button Unselect all.
To activate the generation press the button Generate. While processing a progress bar will show the state of execution. To abort the generation
press the Cancel button.
Orient a map to north It’s a function that creates a new map oriented to north.

OkMap – User manual November 1, 2012
Page 167
You can customize:
The quality of the output JPEG images (0=Bad, 100=Good)
To activate the function press the button Create a north oriented map.
Crop a map It’s a function that creates a new cropped map.
You can customize:

OkMap – User manual November 1, 2012
Page 168
The format of the output images (JPG, TIF, PNG, GIF, BMP) The quality of the output JPEG images (0=Bad, 100=Good)
To specify the size of the new map, draw a rectangle with the left mouse button and Ctrl key. To activate the function press the button Create a cropped map.
Resize a map It’s a function that creates a new resized map.
You can customize:
The format of the output images (JPG, TIF, PNG, GIF, BMP) The quality of the output JPEG images (0=Bad, 100=Good)
The image filter to be used in resizing function The percentage of resizing of the map image to create
To activate the function press the button Create a resized map.
GPSBabel converter Provides a multitude of GPX data conversion functions from one format to another.
To activate this function use the menu Utilities - GPSBabel converter. The following window is displayed.

OkMap – User manual November 1, 2012
Page 169
This function has its own help that can be displayed using the menu Help - GPSBabel Help.
For more information, visit GPSbabel.org.
Xslt transformations Provides a multitude of functions for converting xml data from one format to another, thanks to the method of XSLT transformations.
For more information, visit XSL Transformations (XSLT).
To activate this function use the menu Utilities - Xslt transformations. The following window is displayed.

OkMap – User manual November 1, 2012
Page 170
Indicate the input, processing xslt and output file in the appropriate fields, then press the
Transform button.
Use the buttons with the dots to open the dialog box for selecting files. The Close button
closes the window.
Calculator This is a handy calculator to use for our calculations.
To activate this function use the menu Utilities - Calculator. The following window is displayed.
To make a calculation, write your mathematical formula in the field above and press the
Evaluate button; the result will appear in the field below.
Use the Help button to display a window containing all the constants, the functions and the
operators used in our calculations.

OkMap – User manual November 1, 2012
Page 171
The constants, functions and operators are grouped into categories that can be opened / closed by clicking on the respective symbols + and -.
The elementary items are shown in our formula, in the current position of the cursor, clicking on them with the left mouse button.
Several levels of parentheses are also allowed. The Close button closes the window.
Create toponyms Provides a function to convert some formats of data to toponyms.
To activate this function use the menu Utilities - Create toponyms. The following window is displayed.
Select the input format choosing one of the following:
GPX Garmin custom POI (csv) OziExplorer Name Search
ESRI shape

OkMap – User manual November 1, 2012
Page 172
Then press the Create button.
Opens a dialog box that allows you to open one or more input files. If you choose the ESRI shape, the process involves the acquisition of further information;
this is similar to the function Import SHP vectorial data. After converting operations, opens a dialog box to save all the toponyms in one file with
extension .top. The Close button closes the window.
Create photo list
It provides a function to create a list of georeferenced photos to be displayed on maps. To activate this feature using the menu Utilities - Create photo list.
The following window is displayed.
Choose the folder where photos are stored and eventually select the Include subfolders option.
Then choose the output file; if you select Append option, the data will be appended to any existing file.
Then press the button Create. A bar shows the progress of processing. The Close button closes the window.
Batch conversions of coordinates
This function is used to converts coordinates from one datum to another and from one format to another.
The coordinate pairs are stored in an input csv format file (comma separated value); an output csv file is produced according to the provided specifications.
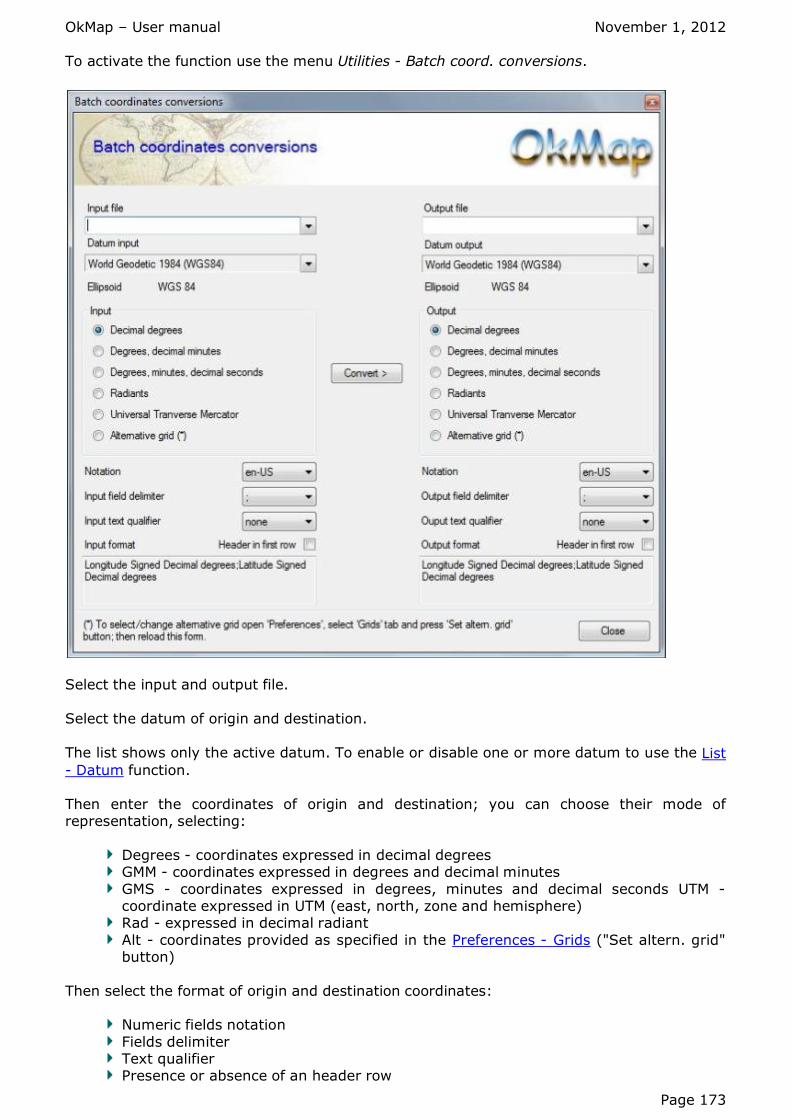
OkMap – User manual November 1, 2012
Page 173
To activate the function use the menu Utilities - Batch coord. conversions.
Select the input and output file.
Select the datum of origin and destination.
The list shows only the active datum. To enable or disable one or more datum to use the List - Datum function.
Then enter the coordinates of origin and destination; you can choose their mode of representation, selecting:
Degrees - coordinates expressed in decimal degrees GMM - coordinates expressed in degrees and decimal minutes
GMS - coordinates expressed in degrees, minutes and decimal seconds UTM - coordinate expressed in UTM (east, north, zone and hemisphere)
Rad - expressed in decimal radiant
Alt - coordinates provided as specified in the Preferences - Grids ("Set altern. grid" button)
Then select the format of origin and destination coordinates:
Numeric fields notation
Fields delimiter Text qualifier Presence or absence of an header row

OkMap – User manual November 1, 2012
Page 174
An example of the input and output format is displayed. To convert press the Convert > button.
Conversions of coordinates
This function is used to converts coordinates from one datum to another. To activate the function use the menu Utilities - Coord. conversions.
Select the datum of origin and destination.
The list shows only the active datum. To enable or disable one or more datum to use the List - Datum function.
Then enter the coordinates of origin; this can be done:
Manually specifying the coordinates in the formats:
Degrees - coordinates expressed in decimal degrees GMM - coordinates expressed in degrees and decimal minutes GMS - coordinates expressed in degrees, minutes and decimal seconds
UTM - coordinate expressed in UTM (east, north, zone and hemisphere) Rad - expressed in decimal radiant
Selecting the coordinates through the button Sel. coordinates. Using the Paste function of the context menu of the box coordinates (before you must have copied the point coordinates on a map with the context menu or you
must have copied the coordinates from another coordinates box). To convert press the Convert > button.
You can make the reverse conversion by pressing the < Convert button.
Calculated coordinates can be stored in a waypoint by pressing the Save waypt button; the name must be typed in the beside box.
Distances and azimuth calculations

OkMap – User manual November 1, 2012
Page 175
This function is used to:
given two geographical points, to calculate distance and azimuth given a geographical location, distance and an azimuth, to calculate a second geographic point
To activate the function use the menu Utilities - Distances, azimuth.
Select the reference datum.
The list shows only the active datum. To enable or disable one or more datum to use the List - Datum function.
Then enter the coordinates of origin; this can be done:
Manually specifying the coordinates in the formats:
Degrees - coordinates expressed in decimal degrees GMM - coordinates expressed in degrees and decimal minutes GMS - coordinates expressed in degrees, minutes and decimal seconds
UTM - coordinate expressed in UTM (east, north, zone and hemisphere) Rad - expressed in decimal radiant
Selecting the coordinates through the button Sel. coordinates. Using the Paste function of the context menu of the box coordinates (before you
must have copied the point coordinates on a map with the context menu or you must have copied the coordinates from another coordinates box).
Then, similarly, choose the coordinates of destination. To calculate press the Compute V button. You can calculate the second geographical coordinate from the first, distance and
azimuth pressing the ^ Compute button. Calculated coordinates can be stored in a waypoint by pressing the Save waypt button;
the name must be typed in the beside box.

OkMap – User manual November 1, 2012
Page 176
Convert vectorial data to GPX This function is to convert vectorial data to GPX data.
The points and the multipoints are converted into waypoint; the lines and the polygons into routes or tracks, chosen by the user.
To activate the function use the menu Data - Convert vectorial to GPX data.
Select the types of vectorial data that you want to convert (points, multipoints, lines e/o polygons).
Choose if you want to convert all vectorial data, those related to selected themes, or only the selected shape.
Choose whether you want to convert lines and polygons in routes or tracks. To make the conversion press the Convert button.
Convert GPX to vectorial data
This function is to convert GPX data to vectorial data. The waypoints are converted into points; the routes and the tracks into lines.
To activate the function use the menu Data - Convert GPX to vectorial data.

OkMap – User manual November 1, 2012
Page 177
Select the types of GPX data that you want to convert (waypoints, routes and / or tracks) and possibly change the name of the theme proposed in the adjacent box.
If the themes do not exist they are automatically created; you can then change their properties with the function List – Vectorial themes.
Choose if you want to convert all data GPX or only selected ones.
Choose which information will be used as label of the vectorial data (name, description or comment).
To make the conversion press the Convert button.
Convert toponyms to waypoints This function is to convert toponyms to waypoints.
To activate the function use the menu Data - Convert toponyms to waypoints.
Choose if you want to convert all toponyms or only the selected ones.

OkMap – User manual November 1, 2012
Page 178
To make the conversion press the Convert button.
Convert waypoints to toponyms This function is to convert waypoints to toponyms.
To activate the function use the menu Data - Convert waypoints to toponyms.
Choose if you want to convert all waypoints or only selected ones. Choose which information will be used as label of the toponyms (name, description or
comment). To make the conversion press the Convert button.
Grid tracks generator
This function is to create a matrix of cells organized in GPX track with the correspondent waypoints to the center of every cell.
It's particularly useful for divide the land into zones; these zones (cells) can be assigned to different teams to use, for example, to search for people in difficulty.
To each team is assigned an area (marked by waypoints office) and upload their GPX with the GPX data generated by this function; so we will have the certainty that each team
does not get into areas assigned to other teams and especially that each team covering your area completely.
To activate the function use the menu Data - Track grid generator.

OkMap – User manual November 1, 2012
Page 179
Select the reference datum.
The list shows only the active datum. To enable or disable one or more datum to use the List - Datum function.
Then select the unit of measurement for distances. Enter the name of the track which will also be the prefix of the generated waypoints. Indicate
whether the coordinates given refer to the center of the grid or to the top left geographical point of the grid.
Specify if you want to generate only the grid and / or waypoints. Then enter the reference coordinates (central point of top left point); this can be done:
Manually specifying the coordinates in the formats:
Degrees - coordinates expressed in decimal degrees
GMM - coordinates expressed in degrees and decimal minutes GMS - coordinates expressed in degrees, minutes and decimal seconds UTM - coordinate expressed in UTM (east, north, zone and hemisphere)
Rad - expressed in decimal radiant
Selecting the coordinates through the button Sel. coordinates.
Using the Paste function of the context menu of the box coordinates (before you must have copied the point coordinates on a map with the context menu or you
must have copied the coordinates from another coordinates box). Specify the distance to be used for each cell in the X and Y axis.
Then indicate the number of cells (steps) that you want to generate in the X and Y directions.
Finally specify the angle of rotation of the whole matrix in degrees (> -90 and < 90). To generate press the Generate button.

OkMap – User manual November 1, 2012
Page 180
Preferences
Preferences - General It's used to customize the OkMap favorite settings, in particular, this refers to the general settings page.
To activate this function use the menu Utilities - Preferences and open, clicking with the mouse, the section General.
The following window is displayed.
In this window you can customize:
Language: is the language used in the interface and changing this information involves the closing and reopening of OkMap.
Coordinates: is how to represent the coordinates displayed in the status bar.
Degrees precision: it is the number of decimal places (precision) with which the value degrees are displayed in the coordinates.
Minutes precision: it is the number of decimal places (precision) with which the
value minutes are displayed in the coordinates. Seconds precision: it is the number of decimal places (precision) with which the value seconds are displayed in the coordinates.
Radiant precision: it is the number of decimal places (precision) with which the radiant coordinates are displayed.
Alt .coord. precision: it is the number of decimal places (precision) with which the east value and north are displayed in the alternative coordinates.
Check new version on startup: If checked, after starting OkMap checks if a newer
version is available and in this case opens a window in the lower right to make the download.
Display tips on startup: If checked, after starting OkMap automatically opens the tips
window. View empty map on load GPX: If checked, after GPX data loading and if is not open a window map, OkMap automatically opens a blank map window ready for use.
Set last pan/zoom after map loading: If checked, after loading a map, sets map zoom and map pan to the last settings.
Ask before exit: if checked, OkMap asks for confirmation before closing.
Activate Undo/Redo on GPX changes: enables the possibility to perform undo and redo changes on GPX data. This function can be disabled for faster GPX data
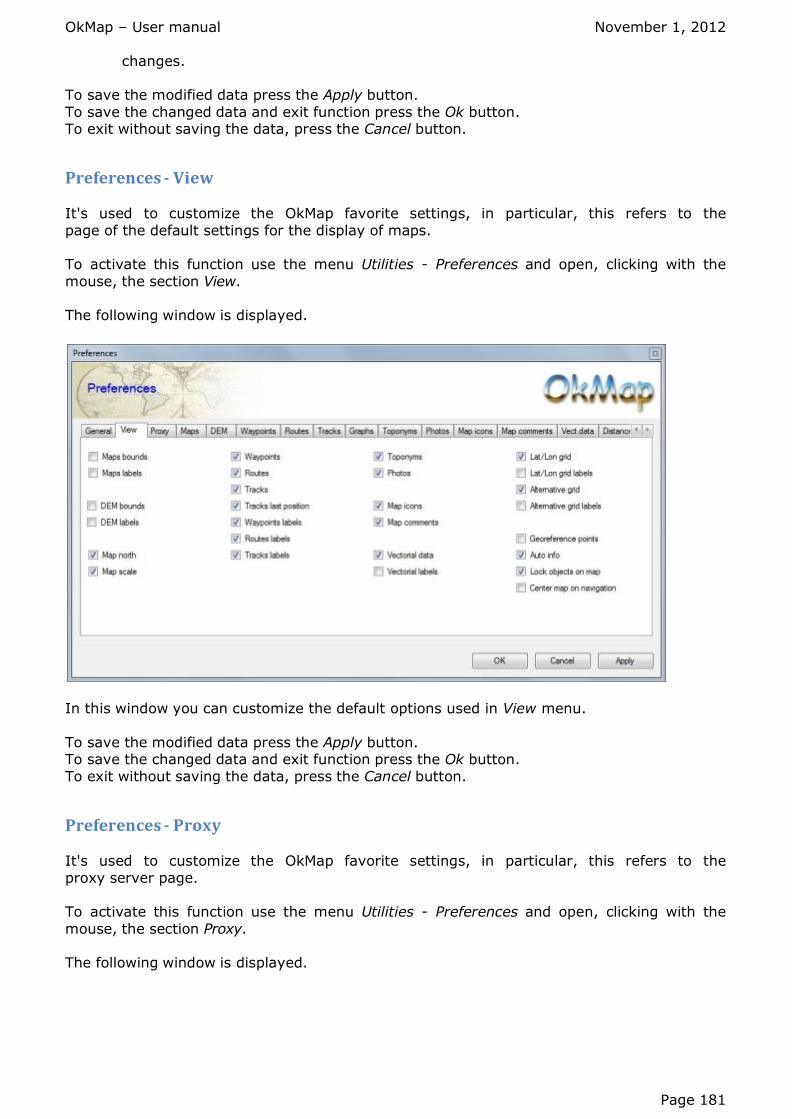
OkMap – User manual November 1, 2012
Page 181
changes.
To save the modified data press the Apply button.
To save the changed data and exit function press the Ok button. To exit without saving the data, press the Cancel button.
Preferences - View It's used to customize the OkMap favorite settings, in particular, this refers to the
page of the default settings for the display of maps. To activate this function use the menu Utilities - Preferences and open, clicking with the
mouse, the section View. The following window is displayed.
In this window you can customize the default options used in View menu.
To save the modified data press the Apply button. To save the changed data and exit function press the Ok button.
To exit without saving the data, press the Cancel button.
Preferences - Proxy It's used to customize the OkMap favorite settings, in particular, this refers to the
proxy server page. To activate this function use the menu Utilities - Preferences and open, clicking with the
mouse, the section Proxy. The following window is displayed.

OkMap – User manual November 1, 2012
Page 182
In this window you can customize:
Address: it’s the IP address of the proxy server.
Port: It’s the port of the proxy server. User name: it’s the user name with which to log. Password: it’s the password with which to log.
To save the modified data press the Apply button. To save the changed data and exit function press the Ok button.
To exit without saving the data, press the Cancel button.
Preferences - Maps It's used to customize the OkMap favorite settings, in particular, this refers to the processing and displaying maps settings page.
To activate this function use the menu Utilities - Preferences and open, clicking with the mouse, the section Maps.
The following window is displayed.

OkMap – User manual November 1, 2012
Page 183
In this window you can customize:
Alternative image map folder: it is the folder where OkMap looks for the map images
during the loading of a map, if these were not present in the same folder of the file map .okm.
Map folder 1/4: is the path where OkMap search maps (file. OKM) to index (you can
specify up to four different locations). Include subfolders: this must be activated if you want to search the maps to index in subfolders.
Line color: it's the color used in the drawing of the maps bounds.
Line width: it's the line thickness in pixel used in the drawing of maps bounds.
Text: it's the font and the color used in the drawing of the maps bounds labels. North bitmap: It’s the bitmap used on the map to display the compass needle pointing north.
Map scale: it's the font and the color used in the drawing of the map scale. To save the modified data press the Apply button.
To save the changed data and exit function press the Ok button. To exit without saving the data, press the Cancel button.
Preferences - DEM
It's used to customize the OkMap favorite settings, in particular, this refers to the processing and displaying data DEM page.
To activate this function use the menu Utilities - Preferences and open, clicking with the mouse, the section DEM.
The following window is displayed.

OkMap – User manual November 1, 2012
Page 184
In this window you can customize:
DEM file folder: is the folder where the DEM files are stored.
Available DEM Line color: it's the color used in drawing the bound of the available DEM data.
Line width: it's the line thickness in pixel used in drawing the bounds of available DEM data.
Text: it's the font and the color used in drawing the relative labels of the
bounds of available DEM data.
Non available DEM Line color: it's the color used in drawing the bounds of the not available DEM
data.
Line width: it's the line thickness in pixel used in drawing the bounds of the not available DEM data.
Text: it's the font and the color used in drawing the relative labels of the bounds of the not available DEM data.
To save the modified data press the Apply button. To save the changed data and exit function press the Ok button.
To exit without saving the data, press the Cancel button.
Preferences - Waypoints It's used to customize the OkMap favorite settings, in particular, this refers to the processing and displaying waypoints page.
To activate this function use the menu Utilities - Preferences and open, clicking with the mouse, the section Waypoint.
The following window is displayed.

OkMap – User manual November 1, 2012
Page 185
In this window you can customize:
Name max length: it's the maximum length in characters used for names of the
waypoints; it's used to ensure compatibility with the GPS used. Position bitmap: it's the name of the file bitmap to be used in drawing the waypoints.
Text: it's the font and the color used in drawing the labels of the waypoints. Action on duplicated GPX data: is the action to take when you try to add a waypoint already exists in those loaded:
Add: an unique name is created for the new waypoint to be added. Ignore: the duplicated waypoint is discarded. Replace: the waypoint preserves the name and replace that the existing one.
Proximity sound distance: is the distance from a waypoint within which you will hear an alert sound when you navigate toward a waypoint or navigate along a route.
To save the modified data press the Apply button. To save the changed data and exit function press the Ok button.
To exit without saving the data, press the Cancel button.
Preferences - Routes It's used to customize the OkMap favorite settings, in particular, this refers to the
processing and displaying routes page. To activate this function use the menu Utilities - Preferences and open, clicking with the
mouse, the section Routes The following window is displayed.

OkMap – User manual November 1, 2012
Page 186
In this window you can customize:
Name max length: it's the maximum length in characters used for names of the routes; it's used to ensure compatibility with the GPS used.
Position bitmap: it's the name of the file bitmap to be used in drawing the
waypoints. Line color: it's the color used in the drawing the lines of the routes. Line width: it's the line width in pixel used in drawing the routes.
Text: it's the font and the color used in drawing the labels of the routes. To save the modified data press the Apply button.
To save the changed data and exit function press the Ok button. To exit without saving the data, press the Cancel button.
Preferences - Tracks It's used to customize the OkMap favorite settings, in particular, this refers to the
processing and displaying tracks page. To activate this function use the menu Utilities - Preferences and open, clicking with the
mouse, the section Tracks. The following window is displayed.

OkMap – User manual November 1, 2012
Page 187
In this window you can customize:
Name max length: it's the maximum length in characters used for names of the tracks; it's used to ensure compatibility with the GPS used.
End position bitmap: it's the name of the file bitmap to be used in drawing the final
position of the tracks; this icon is useful to show where you can find the remote client when receiving remote data from OkMap or GpsGate.com.
Line color: it's the color used in the drawing the lines of the tracks.
Line width: it's the line width in pixel used in drawing the tracks. Text: it's the font and the color used in drawing the labels of the tracks. Simplify: max num. points: it's the maximum number of points of a track created by
the simplify track function. Walking speed, flat (km/h): it’s used to estimate the travel time.
To save the modified data press the Apply button. To save the changed data and exit function press the Ok button. To exit without saving the data, press the Cancel button.
Preferences – Graphs
It's used to customize the OkMap favorite settings, in particular, this refers to the page of settings for displaying of graphics.
To activate this function use the menu Utilities - Preferences and open, clicking with the mouse, the section Graphs.
The following window is displayed.

OkMap – User manual November 1, 2012
Page 188
In this window you can customize:
Gradient colors: the gradient colors of the graph background.
Graph title: it’s the font and color of the graph title. Grid color: it’s the color of the graph grid. Grid width: it’s the thickness of the line of the graph grid.
Grid labels: it’s the font and color of the labels of the graph grid. Line color: it’s the color of the main graph line. Line width: it’s the thickness of the main graph line.
DEM line color: it’s the color of the DEM graph line. DEM line width: it’s the thickness of the DEM graph line. Points color: it’s the color used to draw the graph points.
Points width: it’s the size of the graph points. Comm. lines color: it’s the color used to draw the comments lines (waypoints and toponyms).
Comm. line width: it’s the thickness of the comments lines. Comments: it’s the font and color used for the comments descriptions. Comments rows: it’s the number of rows used for comments descriptions.
To save the modified data press the Apply button.
To save the changed data and exit function press the Ok button. To exit without saving the data, press the Cancel button.
Preferences – Toponyms It's used to customize the OkMap favorite settings, in particular, this refers to the
displaying toponyms data page. To activate this function use the menu Utilities - Preferences and open, clicking with the
mouse, the section Toponyms. The following window is displayed.

OkMap – User manual November 1, 2012
Page 189
In this window you can customize:
Default file: it's the name of the file which is automatically loaded at OkMap startup.
Line color: it's the color used in drawing the toponyms points. Line width: it's the line thickness in pixel used in drawing the toponyms points. Text: it's the font and the color used in drawing the labels of the toponyms.
To save the modified data press the Apply button. To save the changed data and exit function press the Ok button.
To exit without saving the data, press the Cancel button.
Preferences – Photos It's used to customize the OkMap favorite settings, in particular, this refers to the displaying photos data page.
To activate this function use the menu Utilities - Preferences and open, clicking with the mouse, the section Photos.
The following window is displayed.

OkMap – User manual November 1, 2012
Page 190
In this window you can customize:
Default file: it's the name of the file which is automatically loaded at OkMap startup.
Position bitmap: it's the name of the file bitmap to be used in drawing the photos. To save the modified data press the Apply button.
To save the changed data and exit function press the Ok button. To exit without saving the data, press the Cancel button.
Preferences - Map icons It's used to customize the OkMap favorite settings, in particular, this refers to the
displaying map icons page. To activate this function use the menu Utilities - Preferences and open, clicking with the
mouse, the section Map icons. The following window is displayed.

OkMap – User manual November 1, 2012
Page 191
In this window you can customize:
Position bitmap: it's the name of the file bitmap to be used in drawing the icons on the map.
To save the modified data press the Apply button. To save the changed data and exit function press the Ok button. To exit without saving the data, press the Cancel button.
Preferences - Map comments
It's used to customize the OkMap favorite settings, in particular, this refers to the displaying map comments page.
To activate this function use the menu Utilities - Preferences and open, clicking with the mouse, the section Map comments.
The following window is displayed.
In this window you can customize:
Background color: it's the background color to be used in drawing the comments on the maps.
Line color: it's the border color to be used in drawing the comments on the maps.
Line width: it's the line width in pixels used in drawing the border of the comments on the maps.
Text: it's the font and color used in drawing the text of the comments on the maps.
Opacity: is the opacity factor used in drawing the text of the comments on the maps. The value ranges from 0 (transparent) to 255 (fully opaque).
Size: it's the pixel size of the external frame (width and height).
To save the modified data press the Apply button. To save the changed data and exit function press the Ok button.
To exit without saving the data, press the Cancel button.
Preferences - Vectorial data

OkMap – User manual November 1, 2012
Page 192
It's used to customize the OkMap favorite settings, in particular, this refers to the displaying vectorial data page.
To activate this function use the menu Utilities - Preferences and open, clicking with the mouse, the section Vect. data.
The following window is displayed.
In this window you can customize:
Name max length: it's the maximum length in characters used for names of the
vectorial themes. Map background: it's the background color to be used in the representation of vectorial maps.
Line color: it's the color used in drawing the shapes lines (it can be customized for each vectorial theme).
Line width: it's the line thickness in pixel used in drawing the shapes (it can be
customized for each vectorial theme). Text: it's the font and the color used in drawing the labels of the shapes (it can be customized for each vectorial theme).
To save the modified data press the Apply button.
To save the changed data and exit function press the Ok button. To exit without saving the data, press the Cancel button.
Preferences - Distance, area It's used to customize the OkMap favorite settings, in particular, this refers to the
calculation of the distances and the areas. To activate this function use the menu Utilities - Preferences and open, clicking with the
mouse, the section Distance, area. The following window is displayed.
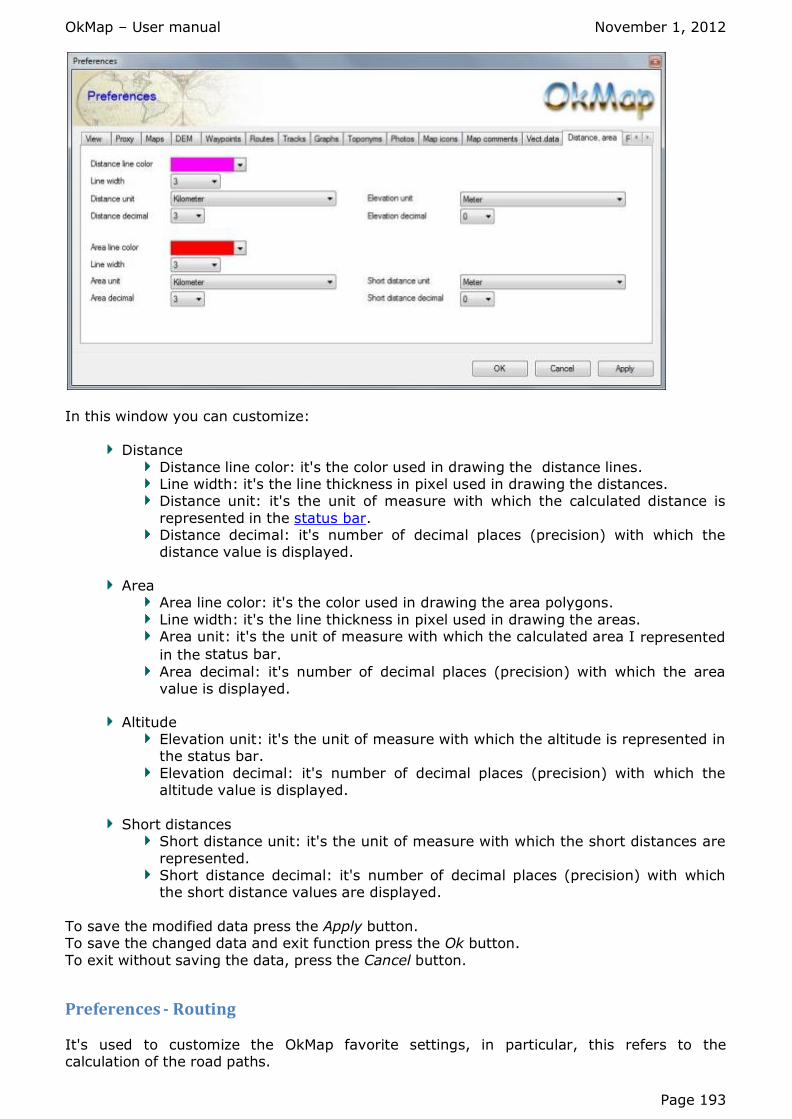
OkMap – User manual November 1, 2012
Page 193
In this window you can customize:
Distance
Distance line color: it's the color used in drawing the distance lines. Line width: it's the line thickness in pixel used in drawing the distances. Distance unit: it's the unit of measure with which the calculated distance is
represented in the status bar.
Distance decimal: it's number of decimal places (precision) with which the distance value is displayed.
Area
Area line color: it's the color used in drawing the area polygons.
Line width: it's the line thickness in pixel used in drawing the areas. Area unit: it's the unit of measure with which the calculated area I represented
in the status bar.
Area decimal: it's number of decimal places (precision) with which the area value is displayed.
Altitude
Elevation unit: it's the unit of measure with which the altitude is represented in the status bar.
Elevation decimal: it's number of decimal places (precision) with which the altitude value is displayed.
Short distances Short distance unit: it's the unit of measure with which the short distances are
represented. Short distance decimal: it's number of decimal places (precision) with which the short distance values are displayed.
To save the modified data press the Apply button. To save the changed data and exit function press the Ok button.
To exit without saving the data, press the Cancel button.
Preferences - Routing It's used to customize the OkMap favorite settings, in particular, this refers to the calculation of the road paths.

OkMap – User manual November 1, 2012
Page 194
To activate this function use the menu Utilities - Preferences and open, clicking with the mouse, the section Routing.
The following window is displayed.
In this window you can customize:
Transport type (motorcar, bicycle, walking)
Fastest or shortest route To save the modified data press the Apply button.
To save the changed data and exit function press the Ok button. To exit without saving the data, press the Cancel button.
Preferences - Grids It's used to customize the OkMap favorite settings, in particular, this refers to the
displaying of the grids. To activate this function use the menu Utilities - Preferences and open, clicking with the
mouse, the section Grids.
The following window is displayed.

OkMap – User manual November 1, 2012
Page 195
In this window it is possible to customize the colors and the line thicknesses used in the visualization of the grids:
Longitude: the meridians in the visualization of the grids. Latitude: the parallels in the visualization of the grids. Center longitude: the meridian referenced to the center of the projection.
Center latitude: the parallel referenced to the center of the projection. Label background: the background color of the labels of the grid coordinates. Text: the font and color of the labels text of the grid coordinates.
Coordinates format: the grid coordinates format. Altern. grid East: the east-west lines in the alternative grid. Altern. grid North: the north-south lines in the alternative grid.
Label background: the background color of the labels of the alternative grid coordinates.
Text: the font and color of the labels text of the alternative grid coordinates.
To save the modified data press the Apply button. To save the changed data and exit function press the Ok button.
To exit without saving the data, press the Cancel button.
Preferences - Georeference It's used to customize the OkMap favorite settings, in particular, this refers to the
displaying of the icons of the points in the georeferencing procedure. To activate this function use the menu Utilities - Preferences and open, clicking with the
mouse, the section Georef.. The following window is displayed.
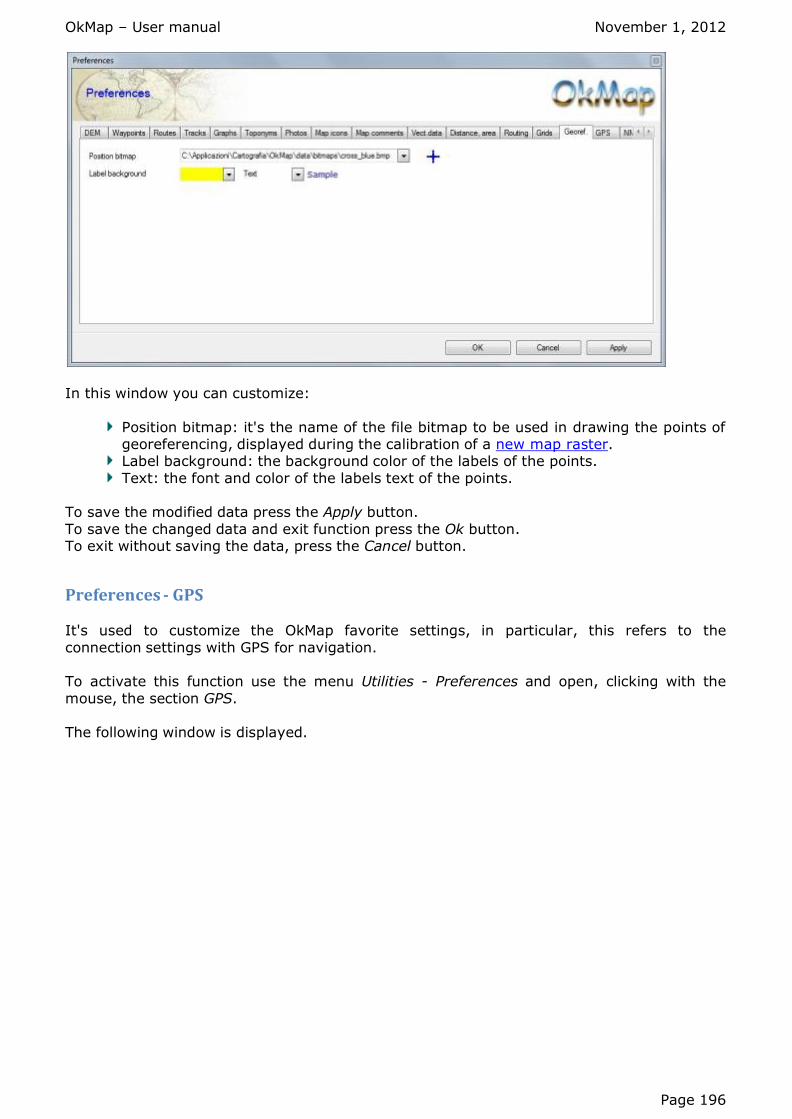
OkMap – User manual November 1, 2012
Page 196
In this window you can customize:
Position bitmap: it's the name of the file bitmap to be used in drawing the points of georeferencing, displayed during the calibration of a new map raster.
Label background: the background color of the labels of the points.
Text: the font and color of the labels text of the points. To save the modified data press the Apply button.
To save the changed data and exit function press the Ok button. To exit without saving the data, press the Cancel button.
Preferences - GPS It's used to customize the OkMap favorite settings, in particular, this refers to the
connection settings with GPS for navigation. To activate this function use the menu Utilities - Preferences and open, clicking with the
mouse, the section GPS. The following window is displayed.

OkMap – User manual November 1, 2012
Page 197
In this window you can customize the settings used in receiving and sending GPX data from/to GPS:
GPS maker: it's the manufacturer of the used GPS.
Transfer datum: it's the reference datum of the received / transmitted GPX object used by GPS device (not editable preset to WGS84).
Serial port: it's the COM port number (among those available) through which the
transfer happens; may also be indicated the USB port. Parity: bit parity check; may be: None, Even, Odd and Mark (not editable and None by default).
Bit stop: it may be: None, One and Two (not editable and One by default). Transfer baud rate: Transmission speed in bits per second.
To save the modified data press the Apply button. To save the changed data and exit function press the Ok button. To exit without saving the data, press the Cancel button.
Preferences - NMEA
It's used to customize the OkMap favorite settings, in particular, this refers to the navigation NMEA.
To activate this function use the menu Utilities - Preferences and open, clicking with the mouse, the section NMEA.
The following window is displayed.

OkMap – User manual November 1, 2012
Page 198
In this window you can customize the settings used by the communication with the GPS during the NMEA navigation:
Transfer datum: it's the reference datum on NMEA sentences received by GPS devices.
File log: if specified, in this file are stored all records received from the GPS NMEA
during the navigation.
Serial port: it's the COM port number (among those available) through which the transfer happens.
Parity: bit parity check; may be: None, Even, Odd and Mark. Bit stop: it may be: None, One and Two. Transfer baud rate: Transmission speed in bits per second.
To save the modified data press the Apply button. To save the changed data and exit function press the Ok button.
To exit without saving the data, press the Cancel button.
Preferences - Navigation It's used to customize the OkMap favorite settings, in particular, this refers to the displaying of our position during the navigation.
To activate this function use the menu Utilities - Preferences and open, clicking with the mouse, the section Navig.
The following window is displayed.
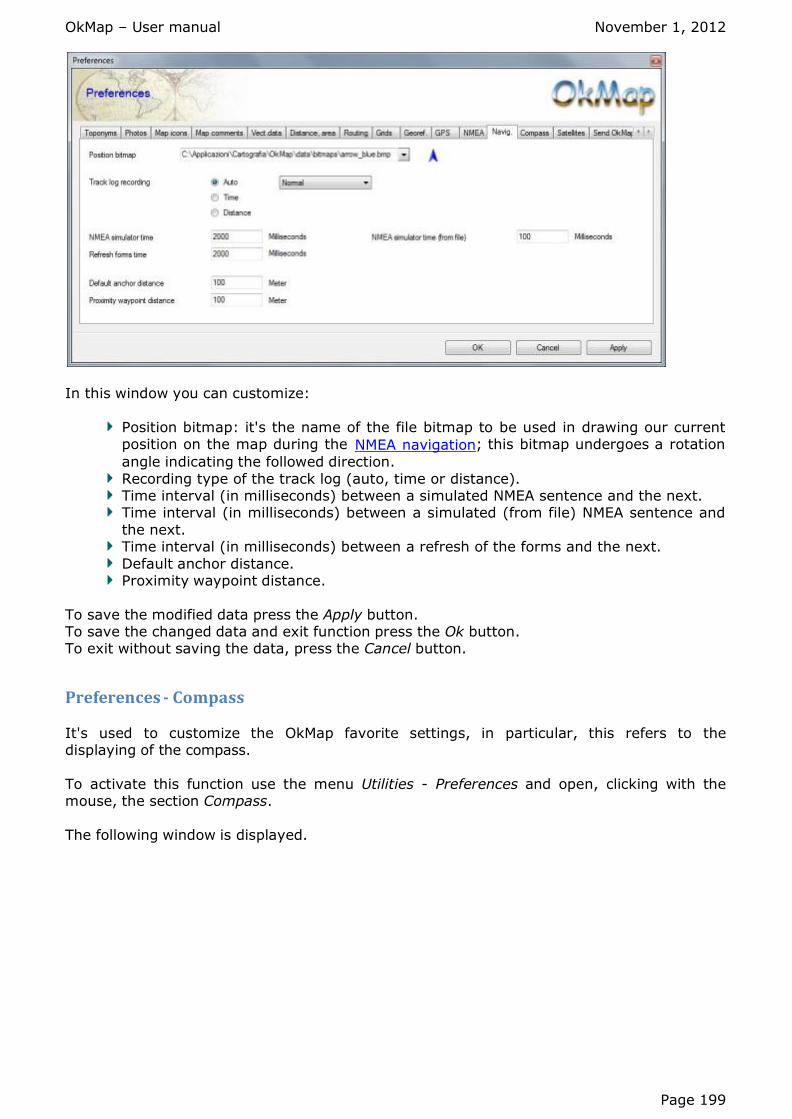
OkMap – User manual November 1, 2012
Page 199
In this window you can customize:
Position bitmap: it's the name of the file bitmap to be used in drawing our current position on the map during the NMEA navigation; this bitmap undergoes a rotation
angle indicating the followed direction.
Recording type of the track log (auto, time or distance). Time interval (in milliseconds) between a simulated NMEA sentence and the next. Time interval (in milliseconds) between a simulated (from file) NMEA sentence and
the next. Time interval (in milliseconds) between a refresh of the forms and the next.
Default anchor distance. Proximity waypoint distance.
To save the modified data press the Apply button. To save the changed data and exit function press the Ok button. To exit without saving the data, press the Cancel button.
Preferences - Compass
It's used to customize the OkMap favorite settings, in particular, this refers to the displaying of the compass.
To activate this function use the menu Utilities - Preferences and open, clicking with the mouse, the section Compass.
The following window is displayed.

OkMap – User manual November 1, 2012
Page 200
In this window you can customize:
Colors for “failed”: the gradient colors used for compass background when status is
“failed”. Colors for “no fix”: the gradient colors used for compass background when status is “no fix”.
Colors for “fix”: the gradient colors used for compass background when status is ”fix”.
Border color: it’s the color of the compass border.
Border width: it’s the thickness of the compass border. Marks color: it’s the color of the marks around the compass. Center color: it’s the color of the central point of the needles.
Cardinal points: it’s the font and color used to draw the cardinal points around the compass.
Needles width: it’s the size of the needles of the compass.
Needle 1 colors: these are the colors used to draw the needle n. 1 (bearing). Needle 2 colors: these are the colors used to draw the needle n. 2 (navigate to...).
To save the modified data press the Apply button. To save the changed data and exit function press the Ok button.
To exit without saving the data, press the Cancel button.
Preferences - Satellites It's used to customize the OkMap favorite settings, in particular, this refers to the displaying of the satellites map.
To activate this function use the menu Utilities - Preferences and open, clicking with the mouse, the section Satellites.
The following window is displayed.

OkMap – User manual November 1, 2012
Page 201
In this window you can customize:
Gradient colors: the gradient colors of the map background.
Cardinal points: it’s the font and color used to draw the cardinal points around the map.
Satellites numbers: it’s the font and color used to draw the numbers of the
satellites. To save the modified data press the Apply button.
To save the changed data and exit function press the Ok button. To exit without saving the data, press the Cancel button.
Preferences - Send OkMap It's used to customize the OkMap favorite settings, in particular, this refers to the
sending function of its position via socket. To activate this function use the menu Utilities - Preferences and open, clicking with the
mouse, the section Send OkMap.
The following window is displayed.
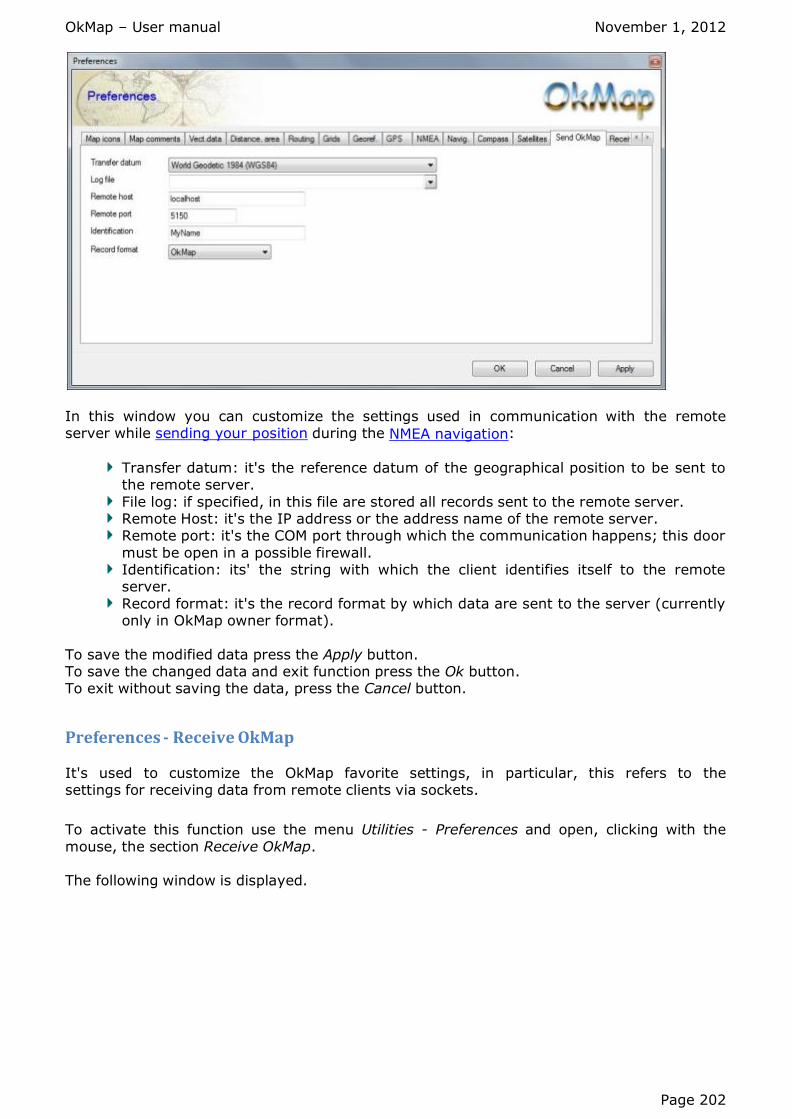
OkMap – User manual November 1, 2012
Page 202
In this window you can customize the settings used in communication with the remote server while sending your position during the NMEA navigation:
Transfer datum: it's the reference datum of the geographical position to be sent to the remote server.
File log: if specified, in this file are stored all records sent to the remote server. Remote Host: it's the IP address or the address name of the remote server. Remote port: it's the COM port through which the communication happens; this door
must be open in a possible firewall. Identification: its' the string with which the client identifies itself to the remote server.
Record format: it's the record format by which data are sent to the server (currently only in OkMap owner format).
To save the modified data press the Apply button. To save the changed data and exit function press the Ok button. To exit without saving the data, press the Cancel button.
Preferences - Receive OkMap
It's used to customize the OkMap favorite settings, in particular, this refers to the settings for receiving data from remote clients via sockets.
To activate this function use the menu Utilities - Preferences and open, clicking with the
mouse, the section Receive OkMap. The following window is displayed.

OkMap – User manual November 1, 2012
Page 203
In this window you can customize the settings used for the activation of the receiving data from remote OkMap:
Transfer datum: it's the reference datum of the geographical position sent by the clients and received by the server.
File log: if specified, in this file are stored all records received by the server. Listener port: it's the COM port through which the communication happens; this port must be open in a possible firewall.
Max connections: it's the maximum number of contemporarily open connections. Record format: it's the record format by which data are received by the server
(currently only in OkMap owner format).
The “Show my IP” button shows the public IP address.
To save the modified data press the Apply button. To save the changed data and exit function press the Ok button.
To exit without saving the data, press the Cancel button.
Preferences - GpsGate.com It's used to customize the OkMap favorite settings, in particular, this refers to the settings for the connection with the server GpsGate.com.
To activate this function use the menu Utilities - Preferences and open, clicking with the mouse, the section GpsGate.com.
The following window is displayed.

OkMap – User manual November 1, 2012
Page 204
In this window you can customize the settings used for the activation of the functions send data to GpsGate.com and receive data from GpsGate.com:
User ID: it's a string that identifies the user in connection to the server GpsGate.com.
Password: it's the authentication password.
Transfer datum: it's the reference datum of the geographical position sent by the clients and received by the server.
File log: if specified, in this file are stored all records received by the server.
Time interval (sec.): it's the time in seconds between data reception and the following one.
To save the modified data press the Apply button. To save the changed data and exit function press the Ok button. To exit without saving the data, press the Cancel button.
Preferences - Sounds
It's used to customize the OkMap favorite settings, in particular, this refers to the settings the sound files used in the navigation.
To activate this function use the menu Utilities - Preferences and open, clicking with the mouse, the section Sounds.
The following window is displayed.

OkMap – User manual November 1, 2012
Page 205
In this window you can customize:
Anchor alarm: sound file used in the anchor alarm function.
Waypoint navigation: sound file used during the navigation toward a waypoint or during the navigation along a route.
Proximity waypoint: sound file used during navigation with Proximity waypoint alarm
enabled. To save the modified data press the Apply button.
To save the changed data and exit function press the Ok button. To exit without saving the data, press the Cancel button.
OkMap – User manual November 1, 2012
Page 206
Glossary
A
Accuracy Accuracy is the degree of precision in the positioning of lines and dots on paper. Many factors affect the accuracy with which the geographical features can be drawn on a map: the scale, the quality of the data source, the thickness of the lines adopted in the representation.
Actuality
is a measure of overall quality of a mapping which measures the percentage change between
the time of detection and the current date.
Address matching
literally address detection, is an alternative system for data geocoding. With some software you can indeed build a system of reference that allows the identification of a point than
through classical coordinate systems (e.g. Latitude and longitude) but by indications of addresses (street, house number, etc..) on, for instance, a road graph.
ADSL
ADSL stands means Asymmetric Digital Subscriber Line and is a technology that allows you to convert analog phone line (the traditional twisted pair copper) in a high speed digital line
for an ultra-fast Internet access. ADSL is ideally suited to the way of browsing the Internet and to the use of multimedia content, both characterized by a greater flow of data from the network towards the user (downstream) and a smaller amount of data and control signals
sent by the user to the network (upstream), which is why it is called 'asymmetric'.
Aero photogrammetric restitution
procedure which allows, using special instruments (analogue or digital photo renderer), to build a map (both on paper and digital) of a portion of land by stereoscopic aerial
photographs.
Algorithm
algorithm well-defined complex instructions or operational requirements that govern the behavior of an operator (mechanical, electronic or human) to solve a problem. In a software corresponds to a set of instructions to the computer.
Arc
linear element stored in vector format consists of a begin pair of coordinates (starting node),
a final pair of coordinates (end node) and a series of coordinate pairs such intermediate vertices. Each arc has a direction and a length. By combining several arcs together by the
nodes it is possible to build some usable graphs, for example, for many types of analysis (road, hydrographic, etc.).
Area compared
see buffer.
Attribute
descriptive information associated with a geographic object and that characterizes it. Generally, in the GISs, indicates the features not graphics of the element or those that
cannot be represented in the scale of acquisition. For example, they might be attributes of a linear element (arc) which represents a road: the type of pavement, the average number of
vehicles in transit, width, etc..
B
Backup process by which you can save the entire patrimony of the data on media that ensure its preservation over time.

OkMap – User manual November 1, 2012
Page 207
Band
frequency range of the electromagnetic spectrum in which, for example, the satellite sensors operate which are able to separate the information collected in the visible and infrared
(temperature, humidity, etc.).
Base mapping
is the set of maps covering a certain territory, built with topographic and photogrammetric techniques, that represent the plans (watercourses, roads, railways, bridges, houses, etc.)
and the altimetry consists of elevation points or curves of level.
BIL (Band Interleaved by Line) is a standard format for raster data, in which information on the various bands are sequencing at the line level (the value of the pixels of the first line of the first band is followed by the match in the second band and so on, before continuing with the second line).
BIP (Band Interleaved by Pixel) is a standard format of raster data, in which information on the various bands are sequencing at the pixel level (the value of the pixel of the first band is followed by the match in the second band and so on, before continue with the second pixel).
Bit character that represents one of the 2-digit binary system: 0 or 1. It is the smallest unit of
information and also indicates the smallest store unit. The name derives from a contraction of BInary diglT.
Buffer, buffering
buffering is an analysis process belonging to the scope: topological overlay. It lets you create
polygons around elements (areas of respect). With it you can determine for example the not building area around roads with heavy traffic or areas around military or industrial zones, etc.. The size and therefore the radius of the respect area can be defined by the attributes of
the items buffered for example on the streets (linear elements) the width or depth of trade for the antennas (elements point) the power of signal for industrial zones (elements ranges) the pollution load.
Byte
array of 8 bits: it is the smallest addressable unit in memory and it corresponds to the
codification of an alphanumeric character.
C
CAD (Computer Aided Design) is a family of systems and software for computer-aided design, used for architectural design,
civil relief, the mechanical and parametric design, the metric calculation, the design of wiring diagrams, etc..
Check point a point of known coordinates recognizable on the image or the map that you want to georeference. Georeferencing algorithms usually require more control points (at least four)
for each sheet.
Class of elements a layer may contain several classes of information elements. Each geographic data can be represented by a class of elements such as an arc, a node, a polygon, an annotation, etc..
Each class of elements may have attributes associated with tables.
Classification
analytical procedure for the determination of classes that group homogeneous types of elements, such as the land use, the type of roads, the urbanization, etc..
Coherence
see logical congruence.

OkMap – User manual November 1, 2012
Page 208
Compression
is a technique for compressing raster images to store them in less space. They used various compression algorithms, which generally must be followed by a decompression before the
image can be used again.
Conformal projections are projection systems generally used for mapping of oceans and atmosphere since they allow to maintain faithful to reality, the angular relationships between the elements and,
therefore, the wind direction or against the weather.
Connection
is a topological properties of the elements of a GIS is represented by the sharing of an arc between two areas.
Connection
is a topological property of the elements of a GIS represented by sharing a node between
two arcs.
Curves of level is the set of constant quota lines that describes the plan land usually obtained by manually or automatically interpolation from a TIN, a DEM or DTM.
D
Data Bank see database.
Database
database (or archive) means a set of information of different kinds. These data are organized according to precise criteria which allow a rapids consultation.
DBMS (Data Base Management System) system for storing and searching for information in a database.
Decompression
see compression.
Default means the default choices made by the system (or program) in the absence of an explicit
indication of the user.
DEM (Digital Elevation Model) is a raster data model that represents the elevation of the land. Can be generated from a plain rated or curves of level and is generally used for conducting analysis of visibility,
generate longitudinal profiles, perform analysis of slope and exposure, etc..
Derived thematic maps they are maps obtained by interpolation of observed values or maps obtained from the analysis and correlation of additional derived thematic maps.
Desktop
feature of computers and programs that can be placed on a desk and used by the user
without requiring additional supports.
DIGEST
is an international standard that defines a data format typically used for topological data interchange among GIS.
Digital mapping
is the digital version of a traditional map, the location and description of the elements are
stored in a series of files on your computer. To locate the position of the geographical elements is used a system of Cartesian coordinates x, y or x, y, z: each point is represented with a single pair of coordinates x, y, and each line is stored as an ordered set of coordinates
x, y; each area is stored as an ordered set of x, y coordinates that define the outer segments

OkMap – User manual November 1, 2012
Page 209
of the closed figure. With coordinates x, y is possible to represent points, lines and polygons as lists of coordinates, rather than as a drawing. In most cases, the storage elements using geographic coordinates of the real world: these coordinates represent a real location on the
surface of the earth, in one of the so many coordinate systems. The relationship between geographic elements are expressed on a digital map, with the use of topology. The characteristics of the geographical features are stored in a computer file, usually called table,
as a set of numbers and characters.
Digital digital data information expressible through integers that can be stored on a magnetic support.
Digitizer hardware device used for the manual acquisition of graphical information (maps, documents,
etc..) in vector format. It allows an operator to draw with a cursor all the graphic elements that compose the document or the map to be scanned.
DIME (Dual Independent Map Encoding) is a standard format for vector data used by the U.S. Census Bureau and had replaced since 1990 by TIGER.
Directory
logic partition of a mass storage, in which a user can store a set of files usually about a specific topic.
DTM (Digital Terrain Model) literally digital terrain model, raster or vector, see DEM and TIN.
DXF (Drawing eXchange File format) format for not topological vector data typical of the CAD used by AutoCAD, but also by many
GIS, to exchange data.
Dynamic segmentation
is an extension of the data model of a GIS that allows to overlap to the physical topological structure a new physical topology, defined in a logical manner, without the need to change the data in the database. For example, data relating to a road network such as the state of
the pavement, the frequency of accidents, speed limits can all be associated to the single traits (route) of the same graph that represents the road network.
E
Eliosynchronous orbit the name comes from the fact that this orbital configuration the angle formed by joining the Sun - the center of the Earth and the orbital plane of the satellite is kept constant over time. This makes the passage of the satellite occurs at the same time for the same latitudes.
Entity
discontinuous objects belong to the category of entity, spatially delimited by precise
boundaries and, possibly, characterized by specific attributes. Examples of entities are the allocation of territory in normative areas or the graph description of a network of transport infrastructure.
Equidistant projections are projection systems that preserve the distances among determined points.
Equivalent projections are projection systems that are generally used in cases where the user must compare the spatial dimensions (e.g. forests or areas for agriculture).
ERDAS
is the name of a software manufacturer for processing remotely sensed images used also to define a owned format for raster data.

OkMap – User manual November 1, 2012
Page 210
Esaustivity
is a measure of overall quality of a cartography that measures the excess or the lack of information.
F
Field in a table of attributes, indicating a location within a record dedicated to a single characteristic of each element of the table. See table of attributes.
G
Gauss-Boaga is a system of coordinates in inverse cylindrical projection typically used for the cartography of the territory in Italy (IGMI, Inventory, Regional Technical Papers, etc..).
GB (Gigabyte) unit of information in the memory, equal to one billion bytes (characters).
Genealogy
is a description of the overall quality of a mapping and it corresponds to all the information
on the sources and on the treatments.
Generalization
algorithm present in many software GIS and CAD that allows you to prune the number of the vertices that compose one or more linear elements. The operations of generalization are
necessary to prune a data and move it to a larger scale, removing the vertexes and making it the most linear element with the level of accuracy defined.
Geographic map
is a graphical representation of geographic elements or other spatial phenomena (lakes, rivers, roads, cities ...) which provides two types of information about the area represented:
the position and the aspect. The location allows you to understand where a particular geographical feature is on the surface of the earth and what are its relationships with the other elements. The issue illustrates us both the qualitative characteristics (name, type ...)
and those quantitative (area, length ...) of the represented element. Each map shows, in addition to descriptive and spatial information, some technical features that define and determine its use. These features include the scale, the accuracy, the projection system, the
system of coordinates.
Geographic projection
is a system of global projection, historically used for first, based on the earth's subdivision in meridians and parallels. Its system of reference, latitude / longitude, measure the angular
distances, respectively, starting from the reference plane of the equator and from the meridian of Greenwich.
Geographical Data Base
database dedicated to information of such territorial.
Geographical database
database dedicated to information of such territorial.
Geomarketing
GIS application that displays the contents of a database, coupled by a geocode (municipality
code, address, sales area, zip code, etc..) to a map, to view marketing phenomena affecting the territory and develop spatial analysis (distribution, counters, basins of use, compared with demographic, etc..).
Geometric congruence
is a parameter of local quality of a cartography defined as the absence of errors of form and
position that cannot be detected without direct verification in the field.

OkMap – User manual November 1, 2012
Page 211
Georeference
software procedure that consists of positioning, by points at known coordinates (control points), vector data or raster image in its respective area of real territory, according to a
fixed reference system.
Geostationary satellite
an orbiting satellite above the equator at a height of about 36,000 km., whose period of revolution around the Earth coincides with a time of Earth's rotation. For this reason the
satellite constantly see the same portion of the Earth (such as METEOSAT). Is also called geosynchronous satellite.
Geosynchronous satellite
see geostationary satellite
GIS (Geographical Information System) a complex set of hardware, software, and human to acquire, to process, to analyze, to store
and to return, in a graphical and alphanumeric format, data related to a territory.
Global quality
set of parameters that characterizes the quality of a geographical database as a whole (exhaustiveness, current affairs, genealogy).
GPS (Global Positioning System) is a system that allows, through a receiver, a dedicated software and a constellation of
satellites to determine the position on the ground and the altitude of a point, with an accuracy that varies from a few millimeters to a few meters depending on the type of equipment and operating procedures of relief used.
Graph
is a related set of arcs that, in a GIS, generally describes a network (road, hydrographic,
technology, etc..). The GIS software have generally functions of analysis and modeling of networks based on a graph (optimal path, optimization of stops, location analysis, etc..).
GRASS (Geographical Resource Analysis Support System) is the name of a software for image processing used to define the corresponding raster data format.
GRID
is the name of the extension of ESRI ARC/INFO processing databases in raster format and is also used to define the corresponding data format.
GUI (Graphical User Interface) software for creating and managing graphical user interfaces. Allows the user to access the system functions through the mouse also and through simple graphical objects (buttons,
scroll lists, icons, images, etc..).
I
IGES (Initial Graphics Exchange Standard) ASCII vector data format not topological and uncompressed, typical of the CAD, made by the
U.S. Department of Commerce and used, sometimes by GISs, to exchange data.
Image processing
set of activities concerning the development of images in raster format. Many of the techniques used in this discipline requires complex mathematical procedures with the objective to determine the phenomena described by the image such as, for instance in GIS,
pollution, humidity and temperature to the ground, vegetation, etc..
Informatics system
Set of computer system hardware and software that characterize an information system.

OkMap – User manual November 1, 2012
Page 212
Informative system
Set of information, system equipment, procedures and people who have the task of collecting, organizing, selecting, storing and communicating data concerning the activities of
an organization. Its aim is to provide operational decision makers all the information necessary to make the best choices possible.
Interpolation
technique through which it is possible to build a linear path, of which it is known only a
discrete number of points. Constructing a grid of points you can get an estimate of the position of points that you do not possess.
ISDN
stands for 'Integrated Services Digital Networks', and is a term created by the organization ITU-T. It is, in practice, a total conversion to digital of the actual telephone net, using the
existing wiring and switching equipment.
Isogonic property of some projection systems to maintain unchanged the measures of the angles among straight lines.
K
KB (Kilobyte) unit of information in memory, equal to one thousand bytes (characters).
L
Lambert is a conic projection that can be conforming or equivalent, particularly used in the U.S. by
the Geological Survey, in Italy and in France.
LANDSAT
family of satellites designed for observing the earth through multispectral sensors.
Latitude
see geographical projection.
Layer, Informative layer or Geographical layer
is the basic unit of data management and defines the positional and thematic attributes for elements of map of a given area. The informative layer or geographical layer are the set of
homogeneous elements that compose a map, such as roads, rivers, forests, etc..
Layer see informative layer.
Legend
is a tool on the papers that associates the graphic symbols used to the single thematic, for readability.
Library
set of software modules common to several programs.
Local quality
set of quality parameters for each individual mapping element (metric precision, resolution, semantic precision, consistency or logical consistency, geometric congruence).
Logical congruence
is a parameter of local quality of a mapping defined as the absence of inconsistency detected independently of a case in reality (a building on a street, two curves of level that intersect,
an attribute with a value outside the indicated range, etc..).

OkMap – User manual November 1, 2012
Page 213
Logical expression
consists of logical operators, operands and pairs of brackets, organized according to syntactic rules specified, so as to express a group of operations that provide a single result. It is used
to make selections between classes of elements in the process of data analysis.
Logical operator entities used to formulate, for instance in a database, the logical conditions for the selection of records in according with the values of the fields. See SQL.
Longitude
see geographical projection.
M
Mass memory device that allows the permanent storage of data (generally the hard drive of the computer).
MB (Megabyte) unit of information in memory, equal to one million bytes (characters).
Metadata
are information about the data sets in a database. A set of metadata can be considered consistent when, in the way most synthetic possible, provides an adequate description of the
content, quality and characteristics of the data.
Metric precision
is a quality parameter of a local mapping defined as the difference in position of a point on the map compared to its real position in the national cartographic reference system.
Mosaicing
is the set of operations that, within the GIS, allows you to merge multiple maps in digital
format to create a territorial continuity.
N
Nadir the vertical drawn from any point within the earth's surface, where is the observer, meets
the celestial sphere in two opposite points. Nadir is what lies below the horizon, the other, which is above, is the zenith.
Native format source format in which an object (program, file, data) was originally written.
Node
is a point with topological characteristics describing the beginning or end of an arc.
Nominal scale
is a parameter that defines the scale of reference for a digital mapping according to the
corresponding scale of a traditional cartography realized following the same requirements of metric accuracy.
NTF (National Transfer Format) data format used for interchange of data between topological GIS (adopted by the Italian
Inventory).
O
Object physical or logical entity defined by a set of characteristics and rules of behavior which express the state of static or dynamic. For example in a GIS object could be the set of a
telephone plant, its connections and its related management procedures.

OkMap – User manual November 1, 2012
Page 214
Open source
mode of software distribution such that the programming code is issued along with the program.
Orthogonalization
see recording.
Orthophotography
technology for the production of orthophotos employing tools and procedures can provide a metric representation of the land in the form of photographic images.
Overlay, topological overlay
procedure of spatial analysis that allows to overlap and to intersect the layers uniting the
information associated with each of them to produce a new layer of synthesis.
P
Pan positioning function of the graphic images on the screen depending on the choice of a new central point or on the scroll of the graphic window.
Password
keyword, which is the access code for a given user name.
Path
ordered set of nodes and arcs that connect origin and destination.
Photogrammetric see aero photogrammetric restitution.
Photo interpretation
technique that allows experts to determine and classify spatial phenomena by reading aerial photographs or remotely sensed images such as, for example, vegetation types,
determination of faults or updating of existing cartographic maps.
Photo plain
mosaic of aerial photos straighten particularly applicable to flat land.
Pixel contraction of picture element, is the basic component of a raster image characterized by an associated value.
Plotter equipment that is used to draw graphs or drawings prepared by a computer. Can be a pen,
electrostatic, inkjet or thermal transfer.
Plug-in
is the addition of some option / application to another application. Between sheets of Excel, for example, consists of inserting 'specific options' to see particular sheets.
Point geometric element used to define the position of items that are points in the scale of
acquisition, defined by a pair of coordinates (x, y) and eventually by a quota (z).
Polygon
closed area delimited by arcs.
Primary key
one or more fields whose values uniquely identify a row in a table of the database.
Process
the term process is intended to indicate an ordered sequence of operations whose final purpose is to obtain new data or revise existing ones in a form which facilitates the
interpretation and evaluation. Fundamental elements for the definition of a process are the

OkMap – User manual November 1, 2012
Page 215
data, the operators and the links between the operators to determine their order of execution.
Projection systems are systems that can represent the surface almost spherical Earth on a plane, keeping some conformity (isogons, equivalence, equidistance, etc..): the best known are the Geographical
one, the UTM, the Gauss-Boaga and the Lambert others are the Conic, the Polar, the Stereographic, the Cylindrical and the Planar also variously combined.
Projection
see geographic projection.
Q
Query set of SQL statements that allow you to extract information from the geographical and alphanumeric database
R
Raster image any image can be thought of as consisting of a set of small equal areas (pixels), arranged along lines and columns, such as to constitute a matrix. The values associated with each cell may express both graphical information (color, shade of gray, etc.) and descriptive
(temperature, slope, etc..).
Rasterization
operation that allows to automatically obtain a raster image from vector image or paper documents (scanner).
Record
group of contiguous positions of information (fields), including uneven, which can be
accessed according to different modes. See table of attributes.
Recording
are the necessary techniques to georeference and rectify raster images. In fact, aerial photos and satellite images, as well as having to be positioned correctly (collimating the coordinates of known points on the ground with those of image objects) are also to be re-calculated
using the angle from which it was taken.
Reference system
each projection has its own reference system from which it starts to calculate the distances. For example, the geography projection uses as a reference the intersection of the Greenwich
meridian and the Equator, the UTM provides six degrees of predetermined segments called fused these divided into zones (for Italy 32, 33 and 34), the Gauss-Boaga, starts from Monte Mario (Rome) and uses coordinates conventionally measured in kilometers from 1500 to
2520 left and right of the meridian of reference.
Regression
is an interpolation between different statistical surveys, such that a correlation is identified between the data, often due to geometric curves.
Relational database
method of structuring data in the form of a collection of tables that are logically related to
each other through shared fields. Each element can be found in relation to the table name, the name of the field, and the value of the primary key.
Relationship
in a relational database the relationship is the logical link among two tables of data through the primary and secondary keys.

OkMap – User manual November 1, 2012
Page 216
Resolution
is a measure of quality local of a mapping and it corresponds to the size of the smallest detail represented in the mapping vector and to the length of the side of the cell (pixel) in raster
format.
RLC (Run Length Coded) is a standard of raster data compression. See compression.
Route
element at the base of the dynamic segmentation to which can be associated attributes. The route can be constituted by a portion or subset of arcs without its beginning or end node
must coincide with the start or end of an arc.
Routine
compilation of a sequence of actions necessary to perform an operation, which are invoked by the program whenever it is necessary to perform such operation.
S
Scale indicates, in practice, how many times a portion of the land surface has been reduced in order to be represented on a sheet of paper. It is expressed, in general, as the ratio between a distance on the paper and the corresponding distance on the ground. The ratio of scale
used for a map determines the information content and the size of which can reasonably be represented. We define large-scale maps (1:500, 1:1000, 1:2000), medium scale (1:5000, 1: 10000) and small-scale (1:25000 onwards).
Scanner hardware device for the automatic acquisition in digital format of graphic elements (maps, photos, pictures, etc..). Graphical information is stored in raster format. It is possible nevertheless through special tools software to convert such information in vector format
(vectorization).
Secondary key one or more fields whose values uniquely identify a row in another table of the database through a relationship with the primary key.
Semantic precision
is a quality parameter of a local mapping defined as the correspondence between reality and
the qualitative attribute associated with the object.
Sensor detector used in remote sensing that converts electromagnetic radiation into electrical signals interpretable. Active sensors measure the energy reflected by the objects, but emitted from a device on board. Active radar sensors, in particular, are characterized by the fact that they
can operate even in the presence of weather disturbances, such as SAR (Synthetic Aperture Radar) on the satellite ERS-1. Passive sensors measure the energy emitted by the sun and reflected by the earth or energy spontaneously emitted from objects, such as the TM
(Thematic Mapper) and MSS (Multi Spectral Scanning) on Landsat 5.
Shortest path
is an algorithm of analysis that can determine within a graph, the path that optimizes a parameter in the networks, the impedance or that determines the difficulty of crossing the
auction of the graph, such as a road network the route that minimizes the distance or time within the limits of speed, track, maximum weight allowed, etc..
Simple thematic maps maps entered into the system and here used without modification or GIS maps created internally but still represent 'primitive' maps, not derived from processing of other elements
of the database.
SIT (Territorial Informative System) Italian acronym corresponding to the Anglo-Saxon GIS.

OkMap – User manual November 1, 2012
Page 217
Spatial data
data characterized by a geographical reference.
Spatial relationships see topology, contiguity and connection.
SPOT (Système Probatoire d’Observation de la Terre) satellite family for multispectral remote sensing system with mobile aim system. The
definition on the ground is 20 meters for the multispectral and 10 meters for the panchromatic. The first launch of this French system dates back to 1986.
SQL (Structured Query Language) structured language for the consultation and the selection of information in a relational
database.
Symbols are the graphical primitives used to represent on paper or video phenomena occurring in the territory. The symbols can be landing-nets to prime an area, linear (continuous, dashed, drawn - point, etc..), to trace linear features or point (cross, star, triangle, etc..), to indicate
a specific location. Each symbol can be designed in a wide variety of colors.
T
Table of attributes tables are an integral part of the layer information. Each table is for a homogeneous group of
geographic map (roads, rivers, contours, etc..) and consists of a variable number of rows and columns. Each row (record) contains a description of a single geographical feature and each column (field or attribute) stores a specific type of information. The characteristics of the
geographical elements are generally translated into numeric or alphabetic, before being inserted in the relevant table.
Template
in GISs, template are graphic elements (usually linear) that belong to different layers of information. The presence of templates greatly complicates the management of geographic
database, for example by imposing rules for updating the data. If you update some elements of a layer information should be updated in all layers that contain words related to the same elements. A typical example is the limit for buildings in the layer on the building, which
coincides with the start of the pavement layer on the streets.
Territorial continuity
means a continuous geographical coverage, in alternative to the classical subdivision by map sheets.
Thematism
representation of a raster or vector maps in which points, lines or surfaces are associated
with symbols, textures, or colors that represent the result of analysis of quality (land use, zoning areas, intensity of traffic on a road, etc..).
Theodolite
topographical tool used for geodetic measures.
TIFF (Tag Image File Format) is a standard format for the interchange of raster data.
TIGER (Topologically Integrated Geographic Encoding and Referencing) is a standard format for vector data used by the U.S. Census Bureau since 1990 in place of
DIME.
TIN (Triangulated Irregular Network) literally irregular network of triangles, is a three-dimensional model of the terrain generated from a sparse set of points listed (rated plan) consists of a network of triangles as
equiangular, equilateral, and therefore, not possible since which can interpolate contours,

OkMap – User manual November 1, 2012
Page 218
conduct analysis of visibility, generate longitudinal profiles, perform analysis of slope and exposure, etc..
Topology
is a set of rules to define explicitly the relationships, the relationships of connection and contiguity between spatial elements and to link these elements with their descriptions
(attributes). In a topological data model, for example, you can recognize and identify the areas adjoining the lines that demarcate each area (boundaries).
UMTS
is the acronym of Universal Mobile Telephone System and stands for the third generation of
mobile telephone services. The analogical network was the first generation of mobile telephony, the GSM network, which is still active, is the second. The new UMTS technology seeks to improve and expand existing capacity of mobile technologies, radio and satellite,
providing more capacity and a range of superior services. Through the new UMTS technology will be available a series of individual multimedia services, such as the association of the number of the person, and not to a number of customers or an office.
U
User-name name by which the user is preventively identified to access a computer network, database or protected file.
User interface
is the set of tools, the purpose of which is the communication between the user and the
procedures of the hardware and software system used.
UTM (Universal Transverse Mercator) is a cylindrical projection inverse adopted worldwide.
V
Vectorial is a system for storing graphics data according to which the objects are stored according to
the Cartesian coordinates of the points and lines that compose them.
Vectorialization
procedure that allows an automatic or semiautomatic way (e.g., with the assistance of an operator) to draw a set of vectors from a raster image.
W
Wizard installation programs or assisted creation of documents or applications, which guide the user step by step towards a final objective.
Z
Zenith see nadir.
Zoom
enlarging or reducing video function (in, out) present in the most of graphic software.