oklahoma state university committee for the assessment of ... · 5. there are 16 value rubrics; two...
TRANSCRIPT

America’s Brightest ORANGE
Oklahoma State University Committee for the Assessment of General Education
and The Office of University Assessment and Testing
Annual Report, 2014
Committee for the Assessment of General Education: Jon Comer, Ph.D., (Chair), Geography
Melanie Bayles, Ph.D., Plant and Soil Sciences Carol Beier, M.S., Nutritional Sciences
John Gelder, Ph.D., Chemistry Bridget Miller, Ph.D., Applied Health & Educational Psychology
Greg Wilber, Ph.D., Civil & Environmental Engineering
Office of University Assessment & Testing: Sarah R. Gordon, Ph.D., Director
Lisa D. Cota, M.S., Assistant Director, Assessment & Analysis Sean Bulleigh, Graduate Research Assistant
[email protected] (405)744-6687
Contents
List of Figures ............................................................................................................................ 3 List of Tables ............................................................................................................................. 4 Executive Summary ................................................................................................................... 5 Overview .................................................................................................................................... 6
Introduction ............................................................................................................................ 6 The Review Process and Reporting for the Voluntary System of Accountability ..................... 6 AAC&U VALUE Rubrics ......................................................................................................... 7 Analytic Strategy .................................................................................................................... 7
Key Findings: Critical Thinking ..................................................................................................10 Class Rank. .......................................................................................................................10 GPA. ..................................................................................................................................12 ACT. ..................................................................................................................................16 Academic College. .............................................................................................................18 Subscale Scores. ...............................................................................................................21
Key Findings: Written Communication ...................................................................................23 Class Rank. .......................................................................................................................23 GPA. ..................................................................................................................................25 ACT. ..................................................................................................................................29 Academic College. .............................................................................................................33 Subscale Scores. ...............................................................................................................37
Use of Results and Future Plans ...........................................................................................38 APPENDIX A: Assessment of Critical Thinking Skills ................................................................40
Critical Thinking Artifact Collection ........................................................................................40 Scoring Process and Reliability Estimation ............................................................................41
APPENDIX B: Assessment of Written Communication Learning Outcome ................................44 Written Communication Artifact Collection .............................................................................44 Scoring Process and Reliability Estimation ............................................................................45
General Education Assessment: 2014 2

List of Figures
Figure 1. Critical Thinking Artifact Scores by Classification .......................................................10 Figure 2. Box Plot of Critical Thinking Scores by Classification .................................................11 Figure 3. Hypothesized Pattern of Critical Thinking Scores by Classification ............................12 Figure 4. Box Plot of OSU GPA and Critical Thinking Scores ....................................................13 Figure 5. Histogram of GPA and Critical Thinking Score ...........................................................15 Figure 6. Histogram of GPA and Critical Thinking Score with Proportions Displayed ................15 Figure 7. Box Plot of ACT Score and Critical Thinking Scores ..................................................16 Figure 8. Histogram of ACT Scores and Critical Thinking Scores ..............................................17 Figure 9. Histogram of ACT Scores and Critical Thinking Scores with Proportions Displayed ...18 Figure 10. Box Plot of Distribution of Critical Thinking Scores by College .................................19 Figure 11. Histogram of College by Critical Thinking Score .......................................................20 Figure 12. Histogram of College by Critical Thinking with Proportions Displayed ......................20 Figure 13. Original Crossed Pattern Analysis and Modeled Imprecision ...................................21 Figure 14. Written Communication Artifact Scores by Classification ..........................................23 Figure 15. Box Plot of Written Communication Scores by Classification ...................................24 Figure 16. Hypothesized Pattern of Written Communication Scores by Classification ...............24 Figure 17. Box Plot of GPA and Written Communication Score ................................................26 Figure 18. Histogram of GPA and Written Communication Scores ............................................28 Figure 19. Histogram of GPA and Written Communication Score with Proportions Displayed ...28 Figure 20. Box Plot of ACT Score and Written Communication Scores .....................................29 Figure 21. Histogram of ACT Scores and Written Communication Scores ................................31 Figure 22. Histogram of ACT Scores and Written Communication Score with Proportions Displayed ..................................................................................................................................31 Figure 23. Histogram of Analysis Conforming ACT Scores to Written Communication Scores ..32 Figure 24. Histogram of Analysis Conforming ACT Scores to Written Communication Scores with Proportions Displayed ........................................................................................................33 Figure 25. Box Plot of Distribution of Written Communication Scores by College ......................34 Figure 26. Histogram of College by Written Communication Score ...........................................36 Figure 27. Histogram of College by Written Communication Scores with Proportions Displayed .................................................................................................................................................36 Figure 28. Written Communication Scores by College ..............................................................37 Figure 29. Original Crossed Pattern Analysis and Modeled Imprecision ...................................38
General Education Assessment: 2014 3

List of Tables
Table 1. Ordinal Logistic Regression Coefficients, GPA and Critical Thinking Scores ...............13 Table 2. Ordinal Logistic Regression Coefficients, ACT and Critical Thinking Scores ...............16 Table 3. Critical Thinking Pattern Analysis: Original Model and Modeled Imprecision ...............21 Table 4. Ordinal Logistic Regression Coefficients, GPA and Written Communication Scores ...26 Table 5. Ordinal Logistic Regression Coefficients, ACT and Written Communication Scores ....30 Table 6. Mean Written Communication Score Differences Between Colleges ...........................35 Table 7. Written Communication Pattern Analysis: Original Model and Modeled Imprecision ....38 Table A1. 2014 Collection of Critical Thinking Artifacts……………………………………………..39 Table A2. Inter-Rater Reliability (Critical Thinking) …………………………………..……………..41 Table A3. Critical Thinking Scores, 2014 …………………………………………………………….42 Table B1. 2014 Collection of Written Communication Artifacts…………………………………….43 Table B2. Inter-Rater Reliability (Written Communication)…………………..……………………..45 Table B3. Written Communication Scores, 2014…………………………………………………….46
General Education Assessment: 2014 4

Executive Summary The purpose of general education assessment is to provide information on students’ achievement of the objectives of the General Education program outcomes using an institutional portfolio process. In Summer 2014, five teams of faculty raters scored 674 artifacts using the AAC&U Critical Thinking VALUE rubric, and five teams of faculty raters scored 669 artifacts using the AAC&U Written Communication VALUE rubric. Key findings: • There is very little difference in the Critical Thinking scores of freshmen and seniors. The
majority of the students sampled scored a 3, regardless of class rank. • There was a distinct difference in the Written Communication scores of freshman and
seniors. While the number of students who scored a 3 was roughly equal for freshman and seniors, more seniors scored a 4 than did freshmen, and more freshmen scored a 2 than did seniors.
• Comparisons to assessments of Critical Thinking and Written Communication in previous years is not possible with 2014 data because different rubrics were used this year than in previous years (see full report for more details).
Recommendations: • Inter-rater reliabilities are greatly improved since 2012 when Critical Thinking and Written
Communication were last assessed. One possible explanation for this improvement is that the VALUE rubrics are scored on a scale of 1 to 4, as opposed to the OSU rubrics used for the 2012 assessment, which were scored on a scale of 1 to 5. Further discussion as to why inter-rater reliabilities improved and whether Oklahoma State University should move to 1 to 4 scale and/or use VALUE rubrics for other general education area assessments is warranted.
Assessment of general education is a critical aspect of our work to continuously improve our institution. We are fortunate that Oklahoma State University provides substantial resources to assess students’ learning and to consider ways in which learning might be improved. Our challenge moving forward is clear: to make the most of this investment by using the results to make meaningful changes to our programs. Thank you for your time and support of general education assessment. Please let us know if you have any additional questions or comments. Sincerely, Sarah R. Gordon, Ph.D. Lisa D. Cota, M.S. Director, University Assessment and Testing Assistant Director, Assessment & Analysis, University Assessment and Testing University Assessment and Testing Oklahoma State University Oklahoma State University December 2014
General Education Assessment: 2014 5

Overview Introduction General education at Oklahoma State University (OSU) is intended to: A. Construct a broad foundation for the student’s specialized course of study, B. Develop the student’s ability to read, observe, and listen with comprehension, C. Enhance the student’s skills in communicating effectively, D. Expand the student’s capacity for critical analysis and problem solving, E. Assist the student in understanding and respecting diversity in people, beliefs, and societies, and F. Develop the student’s ability to appreciate and function in the human and natural environment. Full details of the General Education program can be found at http://academicaffairs.okstate.edu/images/documents/gened/gened-criteriagoals.pdf OSU has been involved in assessment of general education for more than 10 years. Three approaches are used to evaluate the general education program: institutional portfolios, review of general education course database, and college-, department-, and program-level approaches. This report focuses on OSU’s use of institutional portfolios to assess the general education program. Institutional portfolios provide direct evidence of student achievement of the overall goals of general education. Institutional portfolios have been developed in five areas that represent the overall goals of the general education program (letters in parentheses map portfolios to the goals above): 1. Written communication (B and C) 2. Critical thinking (D) 3. Math problem solving (D) 4. Scientific Reasoning (D) 5. Diversity (E and F) Recognizing that these goals cannot be achieved only through completion of courses with general education designations, student artifacts are collected from courses across campus that reveal students’ achievement in each institutional portfolio area. These student artifacts are then assessed by a panel of faculty members using rubrics created by faculty members at OSU. The Review Process and Reporting for the Voluntary System of Accountability The general education assessment process is organized by the faculty on the Committee for the Assessment of General Education (CAGE) and facilitated by staff in the Office of University Assessment and Testing (UAT). Students are informed about their possible participation in this assessment process in the Assessment section of the University Catalog1. In 2013, in order to be more efficient in terms of both assessment money and faculty time, CAGE decided to combine the annual general education assessment effort and OSU’s participation in the Voluntary System of Accountability (VSA)2 into one process. According to VSA administration and reporting guidelines3, a statistically representative sample of artifacts from freshman in their first semester of enrollment and a statistically representative
1 http://registrar.okstate.edu/University-Catalog 2 For more information about the VSA, please visit http://www.voluntarysystem.org. or http://www.collegeportraits.org. 3 https://cp-files.s3.amazonaws.com/32/AAC_U_VALUE_Rubrics_Administration_Guidelines_20121210.pdf
General Education Assessment: 2014 6

sample of artifacts from seniors in their last semester of enrollment should be evaluated in an effort to demonstrate value-added and gains made during students’ college careers. At OSU, as in previous years, these artifacts were reviewed by teams of faculty volunteers. In 2014, 20 faculty reviewers participated in the assessment process—10 reviewers were assigned to Critical Thinking assessment (five teams of two raters each), and 10 reviewers were assigned to Written Communication assessment (five teams of two raters each). AAC&U VALUE Rubrics For VSA reporting purposes, results from assessments using the AAC&U’s VALUE rubrics4 can be used to report student learning outcomes on the VSA’s College Portrait5. There are 16 VALUE Rubrics; two of these rubrics—Critical Thinking and Written Communication—were used in the 2014 general education assessment at OSU. In order to combine the general education assessment effort and VSA reporting into one process, the VALUE rubrics were used instead of the rubrics that had been developed by OSU6 and used for the same topics in previous years. Though the VALUE and OSU rubrics were similar in content and purpose, the VALUE rubrics are scored on a scale of 1 to 4 (where 1 is low and 4 is high), as opposed to the OSU rubrics which are scored on a scale of 1 to 5 (where 1 is low and 5 is high). A score of 0 can be assigned to any work that does not meet benchmark standards (i.e., a score of 1). Analytic Strategy Data from 2014 were analyzed statistically using Observation Oriented Modeling (OOM) as well as traditional inferential statistical methods. Data scored on a 1 to 4 scale, as is the case with general education assessment data, are considered ordinal data; therefore, parametric statistics (e.g., t-tests, ANOVAs, linear regressions) are not appropriate analytic techniques for these data. Nonparametric techniques are more appropriate but have the disadvantage of being difficult to interpret. Thus, to allow for a more complete analysis and understanding of the data, both OOM and nonparametric analyses are presented in this report. Overview of Observation Oriented Modeling (OOM) OOM provides an appropriate methodology for both parametric and nonparametric data alike, and it provides results that are comprehendible and free of common statistical assumptions. Rather than applying a series of statistical analyses to a sample dataset and then extrapolating to a population, OOM involves an analysis of the observed data only without generalizing to a hypothetical population. The underlying philosophy is the Aristotelian definition of the cause of an occurrence. Modeling in OOM necessitates the researcher consider the cause/effect relationships of the variables in question. The mathematical techniques underlying OOM also differ from null hypothesis statistical testing (NHST). Where traditional statistical methods such as t-tests or ANOVAs involve comparing the means of two or more groups in order to assess possible group differences, OOM assesses data at the level of the individual observation. Testing a hypothesis in OOM involves reducing a research question to a yes/no answer, then evaluating participants individually to assess whether or not a participant conformed to the hypothesis statement. Mathematically, the data are analyzed using a matrix algebra rotation called a binary Procrustes rotation.
4 See https://www.aacu.org/value/rubrics for more information. 5 See http://www.collegeportraits.org. 6 Visit http://tinyurl.com/osurubric to view the OSU rubrics.
General Education Assessment: 2014 7

Variables are referred to as observations and can be considered either causal observations or conforming observations. Causal observations are conceptually similar to independent variables in NHST, and conforming observations are conceptually similar to dependent variables. The objective of an OOM analysis is to use a matrix algebra rotation to align the conforming observations to the causal observations. Mathematically, the observations are transposed into the binary system of zeroes and ones. This coding provides a matrix for both the causal and conforming observations, referred to in OOM as the deep structure. The deep structure matrix of the conforming observations is then rotated into the same number of units as the causal observations. The causal observations are then compared to the rotated deep structure matrix of the conforming observations in order to evaluate the percentage of observations classified correctly (PCC). Results of the analyses are available in the form of frequency histograms. As with other statistical programs, the counts for the frequency histograms are derived from the number of participants in a given category. For example, in the context of general education assessment, a histogram can be constructed to visually represent the distribution of scores on an assessment rubric based on the class rank of participants in a sample; the bars of the histogram will visually show the number of freshmen who received a 1, number of freshmen who received a 2, and so on. In OOM, the bars of the histograms are also color-coded based on the results of the matrix algebra rotation used in the analysis: Green bars represent correctly classified observations, and red bars represent incorrectly classified observations. The terms correctly classified and incorrectly classified must be considered by the researcher with a critical eye; in OOM, correct means that the classification conforms to the matrix algebra rotation but does not necessarily speak to the actual veracity of that classification. Researchers must evaluate critically both the shape of the distributions in the histograms as well as the accuracy of what is considered a correctly classified observation in the analysis. Researchers can then assess how often they might have arrived at their results by chance. This objective is accomplished through the use of randomization trials, the number of which is determined by the researcher. The randomization trials for the standard analysis involve shuffling the deep structure matrix of the target observations, performing the rotation, and then comparing the randomization results to the observed results. For all other tests, a random number generator is used to randomly assign values to the deep structure matrix of the target observations, and then the matrix is rotated and compared to the observed results. The percentage of trials classified correctly during the randomization trials are compared to the number classified correctly during the initial analyses. The resulting ratio is called the chance-value, or c-value. A crucial difference between OOM and null-hypothesis statistical testing is that there is no ideal c-value, as opposed to the p-value (e.g., p <.05) commonly encountered in traditional statistical analyses. In OOM, the researcher is left to determine whether or not the obtained results are meaningful without referencing a set cut-off point. For example, results of an OOM analysis may show a correct classification rate of 88%, and a c-value of 0.13. Were the same study analyzed using NHST methods, a p-value of 0.13 would almost certainly result in a failure to reject the null hypothesis. However, there is no acceptable c-level cut-off in OOM, and the researcher may decide that the correct classification rate of 88% is important, even if that classification rate occurred by chance 13% of the time during the randomization trials. It is not necessarily the case that statistically significant results calculated using traditional analyses will also be unique patterns of data when utilizing OOM; it is entirely possible to obtain
General Education Assessment: 2014 8

statistically significant results that are essentially meaningless because they occur entirely at random in the obtained data. Likewise, it is possible to have results that are not statistically significant, even though the data forms unique, meaningful patterns. The word “significance” should be used with great caution in any research, and not at all with OOM. OOM answers the question of whether the patterns in the obtained data occur randomly or are unique. If a pattern is unique, it will occur randomly very infrequently; if it occurs randomly, then even though it may be statistically significant in terms of a NHST analysis, there may not be a meaningful relationship between the two variables. OOM provides a different way of conceptualizing, evaluating and analyzing data. OOM analyses evaluate data at the level of the individual, not the aggregate. Hypotheses in OOM are heavily theory driven; researchers must specify exact patterns expected in data, as opposed to the classic tripartite hypotheses in NHST. The results of OOM analyses are framed in terms of percent of the data classified correctly by the hypothesized pattern, as opposed to using sample statistics and p-values. Finally, there are no estimates of population parameters in OOM as there are with NHST analyses, therefore the conclusions apply only to the data collected. This is crucial: in NHST analyses, inferences are made about population parameters; in OOM, the inference is to the best explanation, also called an abductive inference. In practical terms specific to this report, we cannot take the results of the NHST analyses and say that, for example, differences in Written Communication scores exist between freshmen and seniors because students develop these skills throughout their academic career at OSU (i.e., an abductive inference). When using NHST analyses, we must say that the differences exist because the populations from which the samples are drawn are different, and we cannot conclude those differences exist because of anything that occurs as part of the OSU general education curriculum. In contrast, when considering OOM analyses, we may make inferences to what causes these differences to occur, as there are no population parameters with which to contend. A final word should be said about statistical assumptions. One assumption, which underlies both parametric and nonparametric analyses alike, is the assumption of independence. This assumption can be said to be met if random sampling or random assignment to groups has occurred. The general education assessment process as it exists currently does not use random sampling or random assignment. Artifacts for the assessment process are collected from faculty who are willing to participate and/or who have assignments that fit the criteria for the general education area that is being assesses in a given year. Of the artifacts that are submitted for assessment, some either do not meet the requirements for use with the rubrics or are simply too short to evaluate, and thus cannot be used. NHST statistical tests are applicable insofar as the assumptions underlying the tests are met; when an assumption about the test is not met, the actual distribution of the population is unknown, and therefore the Type I error rate is actually unknown. In other words, because the assumption of independence is not met, the sample cannot be said to represent the population with any certainty, and therefore the actual p-value in any NHST test for that data is unknown (not 0.05), and the actual Type I error rate is incalculable. Thus, the p-value, while familiar, should not be taken to mean that the results of the NHST analyses in this report are accurate in terms of the population parameters. However, because the OOM analyses are free from statistical assumptions, the conclusions drawn from those analyses are an accurate description of the patterns in this data. In this report, both nonparametric and OOM analyses are provided to help give the reader multiple lenses with which to view the data and draw conclusions regarding the patterns present in the results.
General Education Assessment: 2014 9
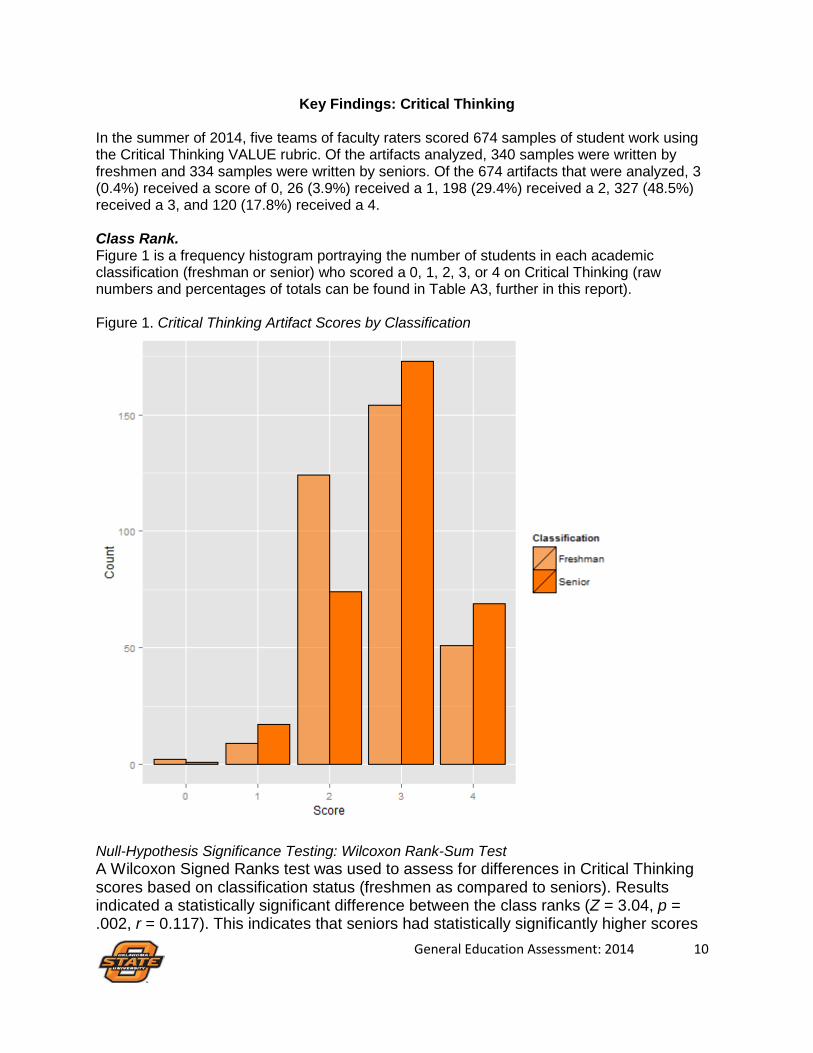
Key Findings: Critical Thinking In the summer of 2014, five teams of faculty raters scored 674 samples of student work using the Critical Thinking VALUE rubric. Of the artifacts analyzed, 340 samples were written by freshmen and 334 samples were written by seniors. Of the 674 artifacts that were analyzed, 3 (0.4%) received a score of 0, 26 (3.9%) received a 1, 198 (29.4%) received a 2, 327 (48.5%) received a 3, and 120 (17.8%) received a 4. Class Rank. Figure 1 is a frequency histogram portraying the number of students in each academic classification (freshman or senior) who scored a 0, 1, 2, 3, or 4 on Critical Thinking (raw numbers and percentages of totals can be found in Table A3, further in this report). Figure 1. Critical Thinking Artifact Scores by Classification
Null-Hypothesis Significance Testing: Wilcoxon Rank-Sum Test A Wilcoxon Signed Ranks test was used to assess for differences in Critical Thinking scores based on classification status (freshmen as compared to seniors). Results indicated a statistically significant difference between the class ranks (Z = 3.04, p = .002, r = 0.117). This indicates that seniors had statistically significantly higher scores
General Education Assessment: 2014 10

than freshman, although the effect size (r) is small. A box plot of the distribution of scores based on classification status is shown in Figure 2. Figure 2. Box Plot of Critical Thinking Scores by Classification
To reiterate, Figure 2 shows a statistically significant difference between the two populations as represented by this sample, with a small effect size per Cohen’s (1988)7 conventions. However, upon visual inspection, it is clear that the distribution of Critical Thinking scores was quite similar between freshmen and seniors. Observation Oriented Modeling As mentioned previously, upon visual inspection, the distribution of Critical Thinking scores was quite similar between freshmen and seniors (see Figure 2). A non-specific analysis showed that the distribution of scores occurred in a unique pattern (as represented by the c-value), albeit with poor overall accuracy (as represented by the Percent Classified Correctly, or PCC, index; PCC = 57.12%, c = 0.001). Hypothesized patterns were tested for freshmen and seniors separately using a Concatenated Pattern Analysis, with freshmen hypothesized to score a 0, 1, or 2, and seniors hypothesized to score a 3 or a 4 (see Figure 3).
7 See Cohen, J. (1988). Statistical power analysis for the behavioral sciences (2nd ed.). Hillsdale, NJ: Lawrence Erlbaum Associates
General Education Assessment: 2014 11

Figure 3. Hypothesized Pattern of Critical Thinking Scores by Classification
8 In Figure 3, the green boxes represent the hypothesized patterns. The second image shows a frequency count of Critical Thinking scores based on student classification. For freshmen, the expected pattern was rather inaccurate and occurred at random (PCC = 37.91%, c = 1.00). For seniors, the opposite was true: the pattern was reasonably accurate, classifying nearly 75% of the seniors accurately, and the pattern was unique (PCC = 72.46, c < .001) Based on this analysis, there is virtually no difference in the distribution of Critical Thinking scores when comparing freshmen and seniors. 72.46% of the seniors scored in the desired 3 to 4 range, indicating many of them perform at a satisfactory level. However, 62.09% of freshmen scored in this range as well. Because this is the first year using the VALUE rubrics and comparison to previous years is not possible, it is difficult to say whether these scores are an accurate representation of student performance or if the fact that students overwhelmingly receive scores of 3 actually reflects uncertainty in using the new rubrics. GPA. Null-hypothesis significance testing: Ordinal Logistic Regression and Kruskal-Wallis Test Two options for assessing the relationship between a continuous Independent Variable and an ordinal Dependent Variable are presented. The first option is an ordinal logistic regression; the second option involves switching the order of the two variables (such that the ordinal variable is treated as the independent variable, and the continuous variable is treated as the dependent variable), then analyzing the data with an ANOVA. Option 1—Ordinal Logistic Regression To provide for visual inspection of the data, the relationship between OSU GPA and Critical Thinking score was graphed in the form of a scatterplot of GPA scores overlaid on a box plot of Critical Thinking scores (see Figure 4).
8 Note: this figure is generated using a Crossed Pattern Analysis, not a Concatenated Pattern Analysis; a Crossed Pattern Analysis evaluates the pattern on the two groups simultaneously, while the Concatenated Pattern Analysis evaluates the pattern on the two groups separately; however, the graphic from the Crossed Pattern Analysis may be easier to understand for individuals who are not familiar with OOM.
General Education Assessment: 2014 12

Figure 4. Box Plot of OSU GPA and Critical Thinking Scores
As is evident from the box plot, the majority of students received a Critical Thinking score of 3, although many received a 2. GPA is also not normally distributed, as is evident by the density of the cluster of points above a 2. An ordinal logistic regression was used to evaluate the relationship between OSU GPA and Critical Thinking scores. A table of coefficients is presented in Table 1. Table 1. Ordinal Logistic Regression Coefficients, GPA and Critical Thinking Scores Value Std. Error t-value
GPA 0.47 0.10 4.70
0:1 -4.07 0.64 -6.36
1:2 -1.76 0.34 -5.21
2:3 0.71 0.30 2.34
3:4 2.97 0.33 9.11
As indicated in the results displayed in Table 1, for every unit increase in GPA, there is an expected 0.47 increase in the expected value of Critical Thinking on the log odds scale (95% confidence interval = 0.27, 0.68).
General Education Assessment: 2014 13

To aid in the interpretation of the results, the ordinal logistic regression coefficients were converted into standard odds ratios. The odds ratio for Critical Thinking is 1.60; that is, for every unit increase in GPA, the odds of moving from one category in Critical Thinking score to any other category are multiplied by 1.6 (95% CI = 1.32, 1.95). Option 2—Modified ANOVA Another option when evaluating the relationship between a continuous independent variable and an ordinal dependent variable is to switch the order of the two variables (such that the ordinal variable is treated as the independent variable, and the continuous variable is treated as the dependent variable), then analyze the data with an ANOVA. For this specific analysis, Critical Thinking scores act as a grouping variable, with the different scores operating as five “levels” of the independent variable. The Shapiro-Wilk test was conducted to test normality of the distribution of GPA. The Shapiro-Wilk test of normality was statistically significant (W = 0.94, p <0.001). This indicates a violation of the assumption of normality, meaning an ANOVA is not an appropriate statistical test. The nonparametric alternative is a Kruskal-Wallis test, which indicated a statistically significant difference between the mean ranks of the Critical Thinking scores [Χ2 (4)= 19.12, p < .001]. A post-hoc analysis using Tukey’s correction for multiple comparisons indicated statistically significant differences between GPAs of individuals who received a Critical Thinking score of a 3 as compared to a 1 (difference = 0.469, p = 0.013), a 4 as compared to a 1 (difference = 0.565, p = 0.003), a 3 as compared to a 2 (difference = 0.205, p = 0.014), and a 4 as compared to a 2 (difference = 0.301, p = 0.003). Observation Oriented Modeling OOM was also used to examine the relationship between OSU GPA and Critical Thinking scores, with GPA as the target variable (similar to an independent variable) and Critical Thinking score as the conforming variable (similar to a dependent variable). A binary Procrustes rotation uses matrix algebra to rotate the target variable into conformation with the conforming variable. In this case, leaving GPA as a continuous variable would mean that the matrix algebra rotation would need to conform the five obtained Critical Thinking scores (0-4) into over 200 different reported GPAs. As such, GPA was subdivided into four categories (less than 2.5, 2.5 to 2.99, 3.0 to 3.49, and 3.5 to 4.0; these are the same groupings used for GPA in previous years). An expected pattern was not defined; rather, the matrix algebra routine “correctly” classified observations. In this example, individuals with GPAs below a 2.5 were classified correctly if they received a Critical Thinking score of a 0, 1, or 2; individuals with GPAs between 3.0 and 3.49 were classified correctly if they received a Critical Thinking score of a 3; and individuals with GPAs between 3.5 and 4.0 were classified correctly if they scored a 4 (see Figure 5). This model classifies 29.97% of the observations correctly (c = 0.12). It should be noted that the low classification rate is due in part to the algorithm attempting to classify correctly four separate categories of GPA scores.
General Education Assessment: 2014 14

Figure 5. Histogram of GPA and Critical Thinking Score
Looking at the histogram, it becomes clear that the flaw with this specific hypothesis is there is no correct classification for individuals with GPAs between a 2.50 and a 2.99. The same histogram, with proportions displayed, is shown in Figure 6. Figure 6. Histogram of GPA and Critical Thinking Score with Proportions Displayed
By proportion, there is a difference in Critical Thinking scores between people who have lower GPAs as compared to individuals with higher GPAs. The difference is most obvious when considering individuals who received Critical Thinking scores of 2—Critical Thinking scores of 2 were obtained by nearly 38% of the individuals with GPAs below 2.5, yet the same can be said for only 26% of the individuals with GPAs between 3.5 and 4.0. Individuals with GPAs between 3.0 and 3.49 obtained scores of a 3 more in terms of proportion than did any other group (52% of that group, as compared to 42% of the individuals with GPAs less than 2.5). Likewise, individuals with GPAs between a 3.5 and a 4.0 obtained scores of 4 more than any other group (22% of that group, as compared to 12% of the individuals with GPAs below a 2.5). The relatively low c-value of 0.12 suggests that this pattern, while relatively vague, is somewhat unique, although how meaningful these differences are is subject to interpretation.
General Education Assessment: 2014 15

ACT. Null-hypothesis significance testing: Ordinal Logistic Regression and Kruskal-Wallis Test As with GPA, two options are presented for evaluating the relationship between a continuous independent variable and an ordinal dependent variable: Ordinal Logistic Regression and a Kruskal-Wallis Test. To provide for visual inspection of the data, the relationship between ACT score and Critical Thinking score was graphed in the form of a scatterplot overlaid on a box plot (see Figure 7). Figure 7. Box Plot of ACT Score and Critical Thinking Scores
There is greater variability when examining the relationship between ACT scores and Critical Thinking scores. There is a less noticeable pattern here, as the distributions are quite similar when comparing the GPAs of students who received Critical Thinking scores of 2, 3, and 4. An ordinal logistic regression was used to evaluate the relationship between ACT and Critical Thinking scores. A table of coefficients is presented in Table 2. Table 2. Ordinal Logistic Regression Coefficients, ACT and Critical Thinking Scores
Value Std. Error t-value
ACT 0.11 0.02 5.31
0:1 -3.03 0.85 -3.56
1:2 -0.55 0.52 -1.06
2:3 2.01 0.50 4.02
3:4 4.37 0.53 8.21
General Education Assessment: 2014 16
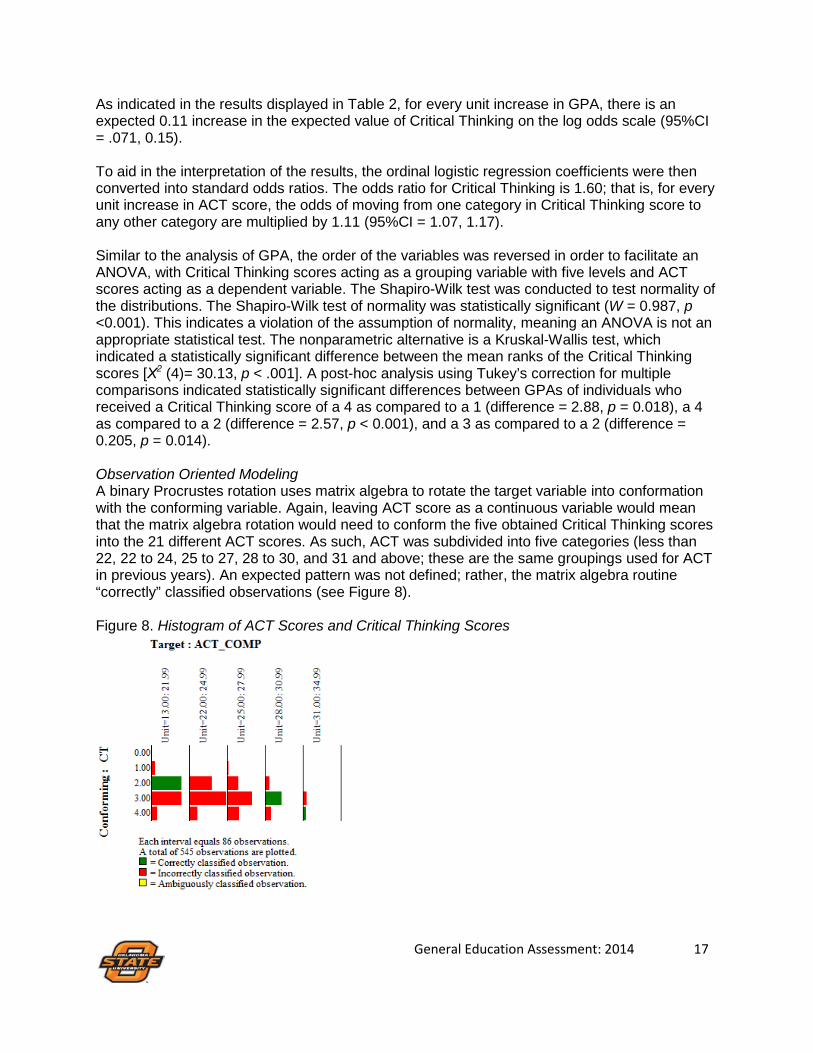
As indicated in the results displayed in Table 2, for every unit increase in GPA, there is an expected 0.11 increase in the expected value of Critical Thinking on the log odds scale (95%CI = .071, 0.15). To aid in the interpretation of the results, the ordinal logistic regression coefficients were then converted into standard odds ratios. The odds ratio for Critical Thinking is 1.60; that is, for every unit increase in ACT score, the odds of moving from one category in Critical Thinking score to any other category are multiplied by 1.11 (95%CI = 1.07, 1.17). Similar to the analysis of GPA, the order of the variables was reversed in order to facilitate an ANOVA, with Critical Thinking scores acting as a grouping variable with five levels and ACT scores acting as a dependent variable. The Shapiro-Wilk test was conducted to test normality of the distributions. The Shapiro-Wilk test of normality was statistically significant (W = 0.987, p <0.001). This indicates a violation of the assumption of normality, meaning an ANOVA is not an appropriate statistical test. The nonparametric alternative is a Kruskal-Wallis test, which indicated a statistically significant difference between the mean ranks of the Critical Thinking scores [Χ2 (4)= 30.13, p < .001]. A post-hoc analysis using Tukey’s correction for multiple comparisons indicated statistically significant differences between GPAs of individuals who received a Critical Thinking score of a 4 as compared to a 1 (difference = 2.88, p = 0.018), a 4 as compared to a 2 (difference = 2.57, p < 0.001), and a 3 as compared to a 2 (difference = 0.205, p = 0.014). Observation Oriented Modeling A binary Procrustes rotation uses matrix algebra to rotate the target variable into conformation with the conforming variable. Again, leaving ACT score as a continuous variable would mean that the matrix algebra rotation would need to conform the five obtained Critical Thinking scores into the 21 different ACT scores. As such, ACT was subdivided into five categories (less than 22, 22 to 24, 25 to 27, 28 to 30, and 31 and above; these are the same groupings used for ACT in previous years). An expected pattern was not defined; rather, the matrix algebra routine “correctly” classified observations (see Figure 8). Figure 8. Histogram of ACT Scores and Critical Thinking Scores
General Education Assessment: 2014 17

In this example, students with ACT scores below a 22 were classified correctly if they received a Critical Thinking score of a 2; students with ACT scores between 28 and 30 were classified correctly if they received a Critical Thinking score of a 3; and students with ACT scores of a 31 or above were classified correctly if they received a Critical Thinking score of 1 or 4. This model classifies 22.20% of the observations correctly, and the c-value is rather poor (c = 0.36), meaning this particular pattern occurs randomly 36% of the time. Again, there are some problems with this model. First, there is no correct classification for students with ACT scores between 22 and 24, a group to which the majority of the individuals in the assessment belonged; there is also no correct classification for students with ACT scores between 25 and 27. That students with high ACT scores would also be classified correctly if they scored a 1 is counterintuitive. There is also no correct classification for Critical Thinking scores of 0. The proportions of score ranges are shown in Figure 9. Figure 9. Histogram of ACT Scores and Critical Thinking Scores with Proportions Displayed
By proportion, students with ACT scores of 31 or above achieved a Critical Thinking score of 4 much more than students with ACT scores in any other group. ACT scores of 2 were much more common in students with ACT scores of 21 or below than in any other group; 42% of that group scored a 2, as compared to 33% of the students with ACT scores between a 22 and 24, 23% of the students with ACT scores between a 25 and 27, 18% of the students with ACT scores between a 28 and a 30, and 16% of the students with ACT scores of 31 or above. However, the fact remains that the highest proportion of Critical Thinking scores of 1 were also achieved by students with ACT scores of 31 or above (8% of that group), followed by students with ACT scores of 21 or below (6% of that group). Academic College. Null-hypothesis significance testing: Kruskal-Wallis Test A Kruskal-Wallis test is the appropriate nonparametric statistical test when evaluating the relationship between a categorical independent variable and an ordinal dependent variable. The
General Education Assessment: 2014 18

distributions of Critical Thinking scores by College is shown in Figure 10 (raw numbers can be found in Table A3 later in this report). Figure 10. Box Plot of Distribution of Critical Thinking Scores by College
This figure should be interpreted with caution, as it gives the illusion that Critical Thinking scores are a continuous quantity, when in fact they are not. The majority of students in all the colleges with the exception of the College of Agricultural Sciences and Natural Resources scored a 2 or a 3. More students in LASSO9 scored a 3 than a 2. Results of a Kruskal-Wallis Test show a statistically significant difference between the Critical Thinking scores of the academic colleges [Χ2 (6) = 21.21, p = .002]. Post-hoc tests indicated statistically significant differences between the mean scores of students in the College of Education students and the College of Arts and Sciences (difference = -0.345, p = 0.041), between students in LASSO and students in the College of Arts and Sciences (difference = -0.335, p = 0.012), and students in LASSO and students in the College of Human Sciences (difference = -0.333, p =0.035). Observation Oriented Modeling Figure 11 shows a histogram portraying the distribution of scores based on academic college (raw numbers are summarized in A3, later in this report).
9 While LASSO is not technically a ‘college’, it is reported by IRIM as such, and therefore analyzed as such.
General Education Assessment: 2014 19

Figure 11. Histogram of College by Critical Thinking Score
An analysis conforming academic college (i.e., Arts & Sciences, Spears School of Business, etc.) to artifact score yielded 25.22% of artifacts classified correctly, with a c-value of 0.002. A score of 3 is most common for students in all colleges except LASSO (where a score of 2 was most common). Proportions of college by Critical Thinking scores are shown in Figure 12. Figure 12. Histogram of College by Critical Thinking with Proportions Displayed
The College of Education had a relatively high proportion of students who scored a 1 (12%) as compared to the other colleges. LASSO had a high proportion of students who scored a 2 (48%) as compared to other colleges; it is also the only college where the majority of students scored below a 3. While it is difficult to draw any significant conclusions from this data, it is clear by the low c-value that the observations aren’t entirely random.
General Education Assessment: 2014 20

Subscale Scores. Each of the five VALUE rubric subscales was evaluated separately to determine the extent to which scores on that subscale related to the overall artifact score. A Crossed Pattern Analysis was specified for each subscale. It was expected that lower scores on the given subscale would be associated with lower overall artifact scores, and higher subscale scores would be associated with higher artifact scores. An example, using the evidence subscale, is shown in Figure 13. Figure 13. Original Crossed Pattern Analysis and Modeled Imprecision
Original Modeled Imprecision
The subscales were also tested with a modeled imprecision, whereby the accepted hypothetical region was expanded by a region of one. Results of these analyses are shown in Table 3. Table 3. Critical Thinking Pattern Analysis: Original Model and Modeled Imprecision
Original Analysis Modeled Imprecision
Subscale PCC c PCC c
A. Explanation of issues
71.92 <0.001 98.81 <0.001
B. Evidence
69.69 <0.001 98.81 <0.001
C. Influence of context and assumptions
69.54 <0.001 98.96 <0.001
D. Student’s position (perspective, thesis/hypothesis)
71.17 <0.001 98.07 <0.001
E. Conclusion and related outcomes (implications and consequences
74.74 <0.001 99.25 <0.001
There was a distinct relationship between the subscales and the overall score. Overall accuracy in the original analysis was good, and allowing for some imprecision in the model improved the PCC rates to above 98% for all five subscale scores, meaning that a given subscale score was within one point of the overall score for over 98% of the artifacts. Results from this analysis
General Education Assessment: 2014 21

should not be interpreted in terms of a linear relationship; however, this analysis indicates the overall score does appear to adequately reflect performance on the individual subscales.
General Education Assessment: 2014 22

Key Findings: Written Communication Also in the summer of 2014, 669 samples of student work were evaluated using the Written Communication VALUE rubric. Of the 669 artifacts that were analyzed, 341 were written by freshmen and 328 were written by seniors. Of the 669 samples, 0 students received a score of 0, 39 (5.8%) received a score of 1, 158 (23.6%) received a 2, 355 (53.1%) received a 3, and 117 (17.5%) received a 4. Class Rank. Figure 14 is a frequency histogram portraying the number of students in each academic classification (freshman or senior) who scored a 1, 2, 3, or 4 on Written Communication (raw numbers and percentages of totals can be found in Table B3, further in this report). Figure 14. Written Communication Artifact Scores by Classification
Note: No students scored a 0 on the Written Communication VALUE rubric. Null-Hypothesis Significance Testing: Wilcoxon Rank-Sum Test A Wilcoxon Signed Ranks test was used to assess for differences in Written Communication scores based on classification status (freshmen as compared to seniors). Results indicated a statistically significant difference between the class ranks (Z = 7.96, p < .001, r = 0.301). This
General Education Assessment: 2014 23
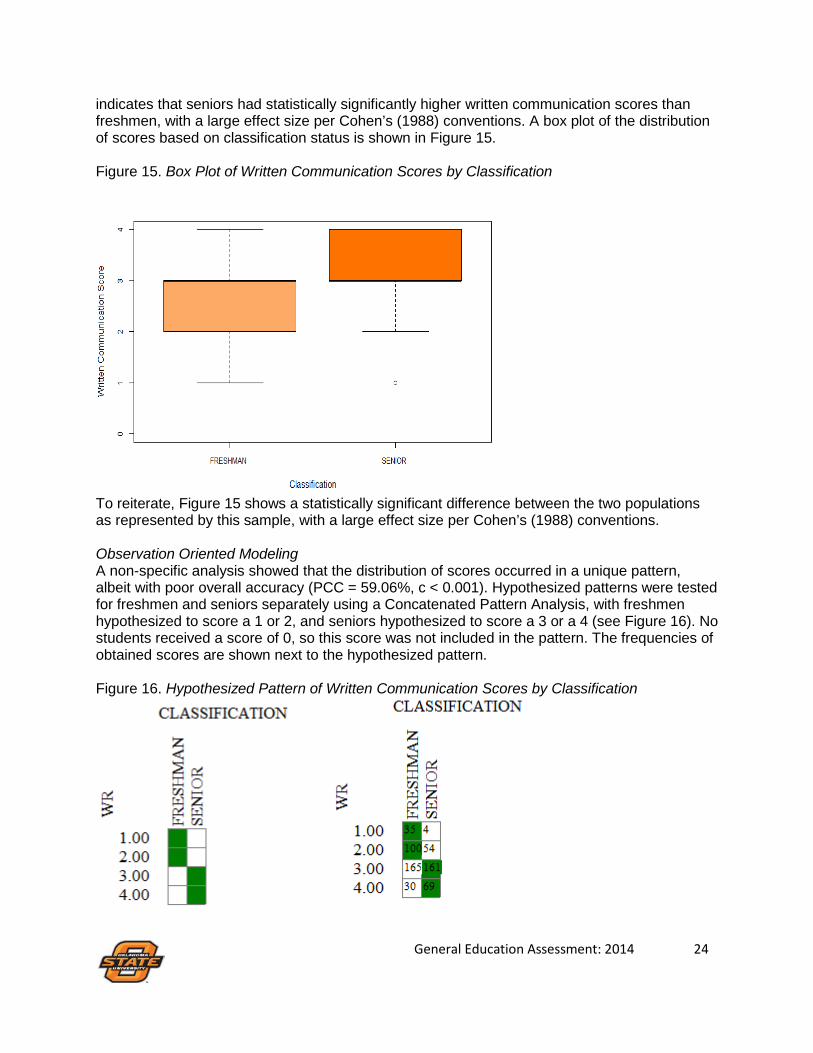
indicates that seniors had statistically significantly higher written communication scores than freshmen, with a large effect size per Cohen’s (1988) conventions. A box plot of the distribution of scores based on classification status is shown in Figure 15. Figure 15. Box Plot of Written Communication Scores by Classification
To reiterate, Figure 15 shows a statistically significant difference between the two populations as represented by this sample, with a large effect size per Cohen’s (1988) conventions. Observation Oriented Modeling A non-specific analysis showed that the distribution of scores occurred in a unique pattern, albeit with poor overall accuracy (PCC = 59.06%, c < 0.001). Hypothesized patterns were tested for freshmen and seniors separately using a Concatenated Pattern Analysis, with freshmen hypothesized to score a 1 or 2, and seniors hypothesized to score a 3 or a 4 (see Figure 16). No students received a score of 0, so this score was not included in the pattern. The frequencies of obtained scores are shown next to the hypothesized pattern. Figure 16. Hypothesized Pattern of Written Communication Scores by Classification
General Education Assessment: 2014 24

For freshmen, the expected pattern was rather inaccurate and occurred at random (PCC = 40.91%, c = 1.00). For seniors, the opposite was true: the pattern was reasonably accurate, classifying nearly 75% of the seniors accurately, and the pattern was unique (PCC = 79.86, c < .001) There was more of a difference in the distribution of Written Communication scores based on class rank than there was in the distribution of Critical Thinking scores, although that difference is still quite small. 79.86% of the seniors scored in the desired 3 to 4 range, indicating that many seniors performed at a satisfactory level. However, it should be noted that 59.09% of freshmen scored in this range as well. Clearly more freshmen (n = 35) scored a 1 than seniors (n = 4), more freshmen (n = 100) scored a 2 than seniors (n = 54), and more seniors (n = 69) scored a 4 than did freshmen (n = 30). However, a score of 3 was still the most commonly occurring score, regardless of class rank. Because this is the first year using the VALUE rubrics and comparison to previous years is not possible, it is difficult to say whether these scores are an accurate representation of student performance or if the fact that students overwhelmingly receive scores of 3 actually reflects uncertainty in using the new rubrics. GPA. Null-hypothesis significance testing: Ordinal Logistic Regression and Kruskal-Wallis Test Two options for assessing the relationship between a continuous Independent Variable and an ordinal Dependent Variable are presented. The first option is an ordinal logistic regression; the second option involves switching the order of the two variables (such that the ordinal variable is treated as the independent variable, and the continuous variable is treated as the dependent variable), then analyzing the data with an ANOVA. Option 1—Ordinal Logistic Regression To provide for visual inspection of the data, the relationship between OSU GPA and Written Communication score was graphed in the form of a scatterplot of GPA scores overlaid on a box plot of Written Communication scores (see Figure 17).
General Education Assessment: 2014 25

Figure 17. Box Plot of GPA and Written Communication Score
As is evident from the box plot, the majority of students received a Written Communication score of 3, although many received a 2, although there appears to be a more clear relationship between GPA and Written Communication scores than there was between GPA and Critical Thinking scores noted earlier (see Figure 4). Again, GPA is also not normally distributed, as is evident by the density of the cluster of points above a 2. An ordinal logistic regression was used to evaluate the relationship between OSU GPA and Written Communication scores. A table of coefficients is presented in Table 4. Table 4. Ordinal Logistic Regression Coefficients, GPA and Written Communication Scores
Value Std. Error t-value
GPA 0.74 0.11 7.11
1:2 -0.69 0.33 -2.10
2:3 1.30 0.31 4.14
3:4 3.87 0.35 11.14
General Education Assessment: 2014 26

As indicated in the results displayed in Table 4, for every unit increase in GPA, there is an expected 0.74 increase in the expected value of Written Communication on the log odds scale (95% confidence interval = 0.54, 0.96). To aid in the interpretation of the results, the ordinal logistic regression coefficients were then converted into standard odds ratios. The odds ratio for Written Communication is 2.11; that is, for every unit increase in GPA, the odds of moving from one category in Written Communication score to any other category are multiplied by 2.11 (95% CI = 1.72, 2.60). Option 2—Modified ANOVA Another option when evaluating the relationship between a continuous independent variable and an ordinal dependent variable is to switch the order of the two variables (such that the ordinal variable is treated as the independent variable, and the continuous variable is treated as the dependent variable), then analyze the data with an ANOVA. For this specific analysis, Written Communication scores act as a grouping variable, with the different scores operating as four “levels” of the independent variable. When checking for violations of assumptions, the Shapiro-Wilk test of normality was statistically significant, (W (3) = 0.9412, p <.000). This indicates a violation of the assumption of normality, meaning an ANOVA is not an appropriate statistical test. The nonparametric alternative is a Kruskal-Wallis test, which indicated a statistically significant difference between the mean ranks of the Written Communication scores [Χ2 (3)= 52.09, p < .001]. A post-hoc analysis using Tukey’s correction for multiple comparisons indicated statistically significant differences between GPAs of individuals who received a Written Communication score of a 3 as compared to a 1 (mean difference = 0.487, p < 0.001), a 4 as compared to a 1 (mean difference = 0.777, p < 0.001), a 3 as compared to a 2 (mean difference = 0.242, p = 0.002), a 4 as compared to a 2 (difference = 0.532, p < 0.001), and a 4 as compared to a 3 (mean difference = 0.29, p < 0.001). Observation Oriented Modeling OOM was used to examine the relationship between OSU GPA and Written Communication scores, with GPA as the target variable (similar to an independent variable) and Written Communication score as the conforming variable (similar to a dependent variable). A binary Procrustes rotation uses matrix algebra to rotate the target variable into conformation with the conforming variable. In this case, leaving GPA as a continuous variable would mean that the matrix algebra rotation would need to conform the four obtained Written Communication scores into over 200 different reported GPAs; as such, GPA was subdivided into four categories (less than 2.5, 2.5 to 2.99, 3.0 to 3.49, and 3.5 to 4.0; these are the same groupings used for GPA in previous years). An expected pattern was not defined; rather, the matrix algebra routine “correctly” classified observations. In this example, individuals with GPAs below a 2.5 were classified correctly if they received a Written Communication score of a 1 or 2; individuals with GPAs between 2.5 and 2.99 were classified correctly if they received a Written Communication score of a 3; and individuals with GPAs between 3.5 and 4.0 were classified correctly if they scored a 4 (see Figure 18). This model classifies 31.23% of the observations correctly (c = 0.03).
General Education Assessment: 2014 27

Figure 18. Histogram of GPA and Written Communication Scores
Looking at the histogram, it becomes clear that the flaw with this specific hypothesis is that there is no correct classification for individuals with GPAs between a 3.00 and a 3.49. The same histogram, with proportions displayed, is shown in Figure 19. Figure 19. Histogram of GPA and Written Communication Score with Proportions Displayed
By proportion, there is a difference in Written Communication scores between people who have lower GPAs as compared to individuals with higher GPAs. The difference is most obvious when considering individuals who received Written Communication scores of 4: Written Communication scores of 4 were achieved by 20% of the individuals with GPAs between 3.0 and 3.49 and 25% of the individuals with GPAs between 3.5 and 4.0, but only 9% of individuals with GPAs between a 2.5 and 2.9 and only 5% of the individuals with GPAs below a 2.5 scored a 4. Written Communication scores of 2 were also achieved more often by individuals with GPAs below a 3.0 as compared to individuals with GPAs above a 3.0; the divide is particularly noticeable when considering 37% of individuals with GPAs below a 2.5 scored a 2, as compared to only 18% of individuals with GPAs of 3.5 to 4.0. The low c-value of 0.03 suggests that this pattern does not occur at random.
General Education Assessment: 2014 28
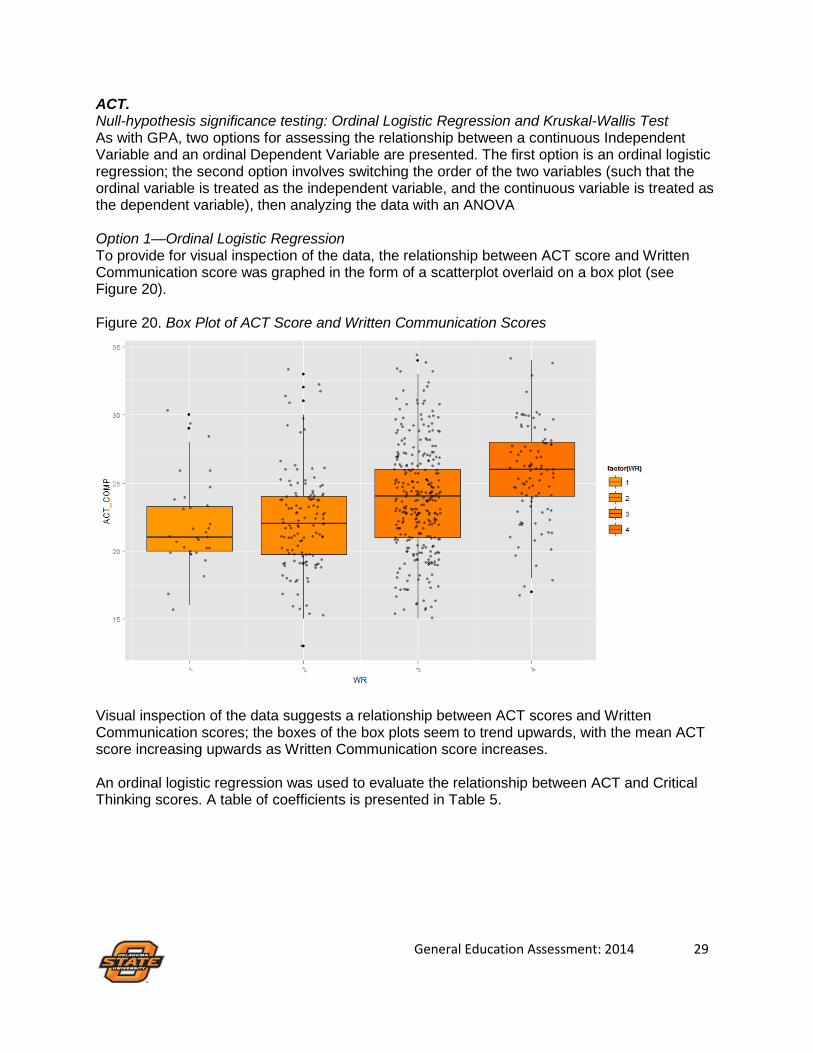
ACT. Null-hypothesis significance testing: Ordinal Logistic Regression and Kruskal-Wallis Test As with GPA, two options for assessing the relationship between a continuous Independent Variable and an ordinal Dependent Variable are presented. The first option is an ordinal logistic regression; the second option involves switching the order of the two variables (such that the ordinal variable is treated as the independent variable, and the continuous variable is treated as the dependent variable), then analyzing the data with an ANOVA Option 1—Ordinal Logistic Regression To provide for visual inspection of the data, the relationship between ACT score and Written Communication score was graphed in the form of a scatterplot overlaid on a box plot (see Figure 20). Figure 20. Box Plot of ACT Score and Written Communication Scores
Visual inspection of the data suggests a relationship between ACT scores and Written Communication scores; the boxes of the box plots seem to trend upwards, with the mean ACT score increasing upwards as Written Communication score increases. An ordinal logistic regression was used to evaluate the relationship between ACT and Critical Thinking scores. A table of coefficients is presented in Table 5.
General Education Assessment: 2014 29

Table 5. Ordinal Logistic Regression Coefficients, ACT and Written Communication Scores Value Std. Error t-value
GPA 0.15 0.02 6.81
1:2 -0.59 0.52 1.14
2:3 2.52 0.51 4.98
3:4 5.19 0.55 9.39
As indicated in the results displayed in Table 5, for every unit increase in ACT score, there is an expected 0.15 increase in the expected value of Written Communication on the log odds scale (95%CI = .106, 0.192). To aid in interpretation, the ordinal logistic regression coefficients were then converted into standard odds ratios. The odds ratio for Written Communication is 1.16; that is, for every unit increase in ACT score, the odds of moving from one category in Written Communication score to any other category are multiplied by 1.16 (95%CI = 1.11, 1.21). Option 2—Modified ANOVA Similar to the analysis of GPA and Written Communication scores, the order of the variables was reversed in order to facilitate an ANOVA, with Written Communication scores acting as a grouping variable with four levels and ACT scores acting as a dependent variable. The Shapiro-Wilk test of normality was statistically significant (W = 0.99, p <0.001. This indicates a violation of the assumption of normality, meaning an ANOVA is not an appropriate statistical test. The nonparametric alternative is a Kruskal-Wallis test, which indicated a statistically significant difference between the mean ranks of the Written Communication scores [Χ2 (3)= 55.34, p < .001]. A post-hoc analysis using Tukey’s correction for multiple comparisons indicated statistically significant differences between ACT scores of individuals who received a Written Communication score of a 3 as compared to a 1 (mean difference = 0.49, p < 0.001), a 4 as compared to a 1 (difference = 0.78, p < 0.0.0), a 3 as compared to a 2 (difference = 0.24, p = 0.002), and a 4 as compared to a 2 (difference = 0.29, p < 0.001). Observation Oriented Modeling A binary Procrustes rotation uses matrix algebra to rotate the target variable into conformation with the conforming variable. Again, leaving ACT score as a continuous variable would mean that the matrix algebra rotation would need to conform the four obtained Written Communication scores into the 21 different ACT scores. As such, ACT was subdivided into five categories (less than 22, 22 to 24, 25 to 27, 28 to 30, and 31 and above). An expected pattern was not defined; rather, the matrix algebra routine “correctly” classified observations (see Figure 21).
General Education Assessment: 2014 30

Figure 21. Histogram of ACT Scores and Written Communication Scores
In this analysis, individuals with ACT scores below a 22 were classified correctly if they received a Written Communication score of a 1 or a 2; individuals with ACT scores between 28 and 30 were classified correctly if they received a Written Communication score of a 4; and individuals with ACT scores of a 31 or above were classified correctly if they scored a 3. This model classifies 21.78% of the observations correctly, and the c-value is poor (c = 0.49). Again, there are some problems with this model. First, there is no correct classification for individuals with ACT scores between 22 and 24, a group to which the majority of the individuals in the assessment belonged. Also, more students with ACT scores between 28 and 30 scored a 4 than did students with ACT sores of 31 or above. While a matrix algebra rotation might classify this “correctly”, this clearly does not make sense in terms of an expected pattern. The proportions of score ranges are shown in Figure 22. Figure 22. Histogram of ACT Scores and Written Communication Score with Proportions Displayed
General Education Assessment: 2014 31
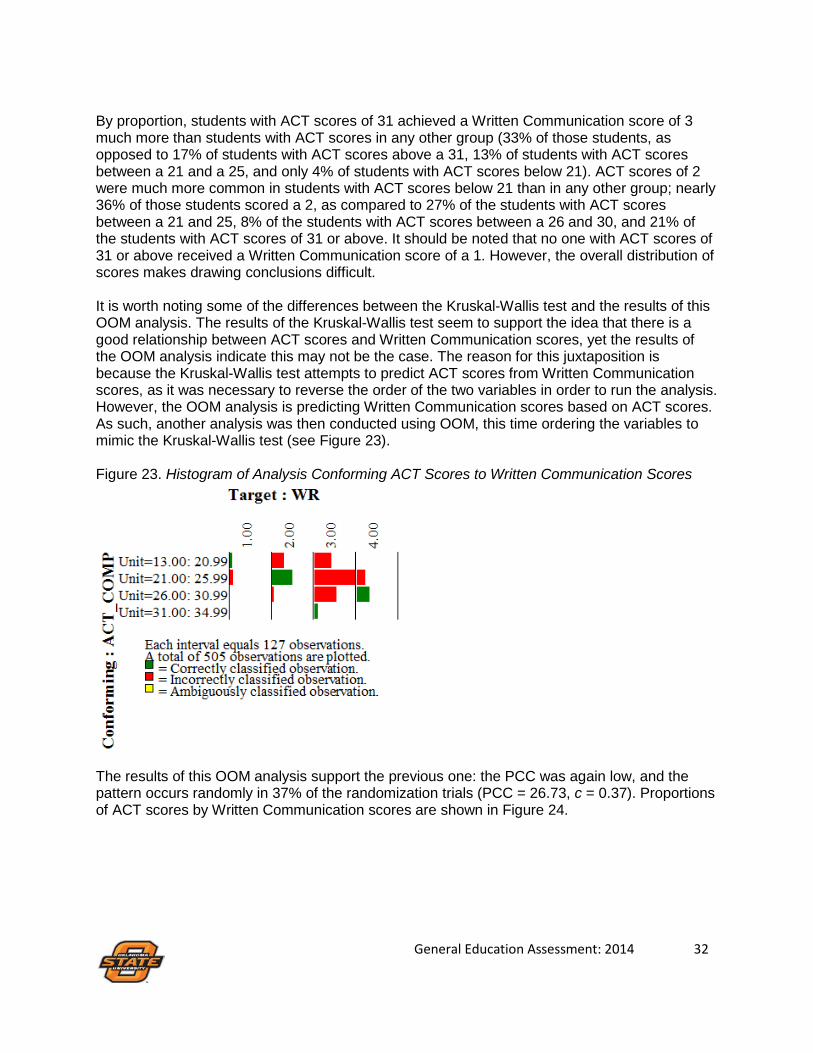
By proportion, students with ACT scores of 31 achieved a Written Communication score of 3 much more than students with ACT scores in any other group (33% of those students, as opposed to 17% of students with ACT scores above a 31, 13% of students with ACT scores between a 21 and a 25, and only 4% of students with ACT scores below 21). ACT scores of 2 were much more common in students with ACT scores below 21 than in any other group; nearly 36% of those students scored a 2, as compared to 27% of the students with ACT scores between a 21 and 25, 8% of the students with ACT scores between a 26 and 30, and 21% of the students with ACT scores of 31 or above. It should be noted that no one with ACT scores of 31 or above received a Written Communication score of a 1. However, the overall distribution of scores makes drawing conclusions difficult. It is worth noting some of the differences between the Kruskal-Wallis test and the results of this OOM analysis. The results of the Kruskal-Wallis test seem to support the idea that there is a good relationship between ACT scores and Written Communication scores, yet the results of the OOM analysis indicate this may not be the case. The reason for this juxtaposition is because the Kruskal-Wallis test attempts to predict ACT scores from Written Communication scores, as it was necessary to reverse the order of the two variables in order to run the analysis. However, the OOM analysis is predicting Written Communication scores based on ACT scores. As such, another analysis was then conducted using OOM, this time ordering the variables to mimic the Kruskal-Wallis test (see Figure 23). Figure 23. Histogram of Analysis Conforming ACT Scores to Written Communication Scores
The results of this OOM analysis support the previous one: the PCC was again low, and the pattern occurs randomly in 37% of the randomization trials (PCC = 26.73, c = 0.37). Proportions of ACT scores by Written Communication scores are shown in Figure 24.
General Education Assessment: 2014 32

Figure 24. Histogram of Analysis Conforming ACT Scores to Written Communication Scores with Proportions Displayed
There appears to be a relationship between Written Communication and ACT scores when considering the lowest and the highest Written Communication scores. 85% of the students who scored a 1 and 88% of the students who scored a 2 also had ACT scores below a 26, as compared to 68% of the students who scored a 3, and only 43% of the students who scored a 4. Similarly, 57% of the students who scored a 4 had ACT scores of 26 or above, as compared to 33% of the students who scored a 3, 12% of the students who scored a 2, and 16% of the students who scored a 1. However, the fact remains that a 3 is still the most commonly-received Written Communication score. Academic College. Null-hypothesis significance testing: Kruskal-Wallis Test A Kruskal-Wallis test is the appropriate nonparametric statistical test when evaluating the relationship between a categorical independent variable and an ordinal dependent variable. The distributions of Critical Thinking scores by college is shown in Figure 25.
General Education Assessment: 2014 33

Figure 25. Box Plot of Distribution of Written Communication Scores by College
Again, this graph is somewhat misleading, as it gives the impression that Written Communication scores are continuous, when in fact they are ordinal. Regardless, there is a distinct difference in the distribution of Written Communication scores by college. Results of a Kruskal-Wallis Test show a statistically significant difference between the Written Communication scores of the academic colleges [Χ2 (6) = 58.83, < .001]. Mean differences between the colleges are displayed in Table 6.
General Education Assessment: 2014 34
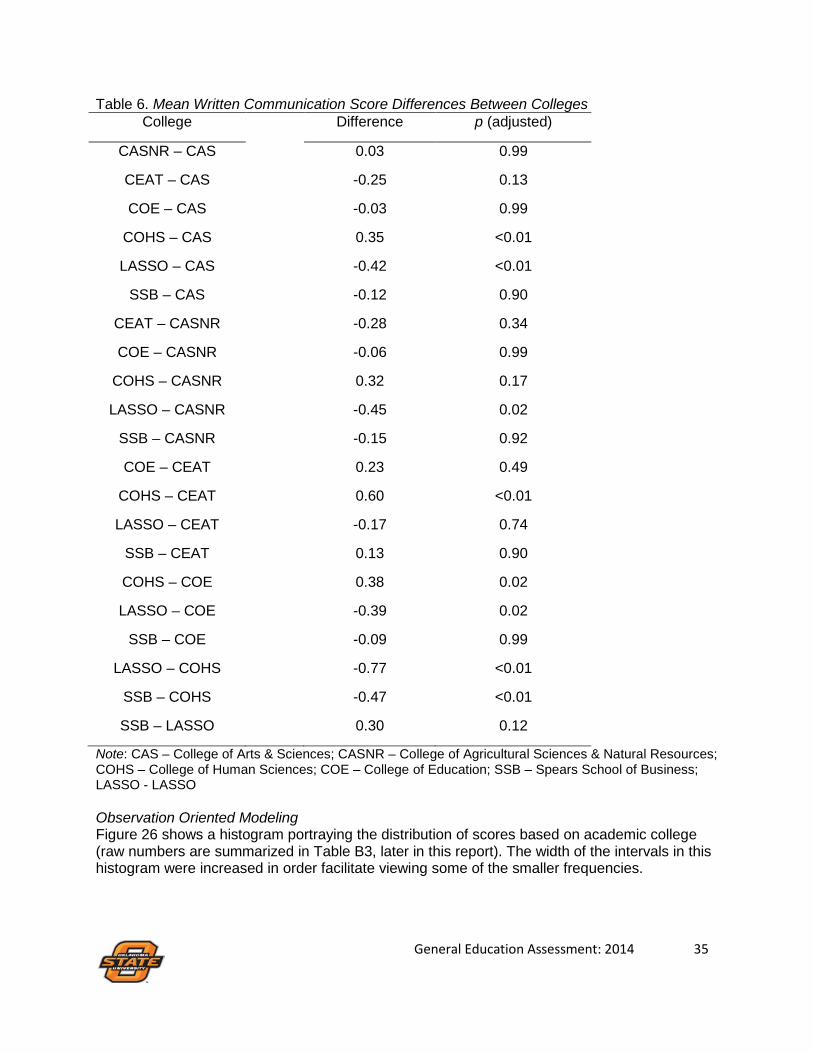
Table 6. Mean Written Communication Score Differences Between Colleges College Difference p (adjusted)
CASNR – CAS 0.03 0.99
CEAT – CAS -0.25 0.13
COE – CAS -0.03 0.99
COHS – CAS 0.35 <0.01
LASSO – CAS -0.42 <0.01
SSB – CAS -0.12 0.90
CEAT – CASNR -0.28 0.34
COE – CASNR -0.06 0.99
COHS – CASNR 0.32 0.17
LASSO – CASNR -0.45 0.02
SSB – CASNR -0.15 0.92
COE – CEAT 0.23 0.49
COHS – CEAT 0.60 <0.01
LASSO – CEAT -0.17 0.74
SSB – CEAT 0.13 0.90
COHS – COE 0.38 0.02
LASSO – COE -0.39 0.02
SSB – COE -0.09 0.99
LASSO – COHS -0.77 <0.01
SSB – COHS -0.47 <0.01
SSB – LASSO 0.30 0.12
Note: CAS – College of Arts & Sciences; CASNR – College of Agricultural Sciences & Natural Resources; COHS – College of Human Sciences; COE – College of Education; SSB – Spears School of Business; LASSO - LASSO Observation Oriented Modeling Figure 26 shows a histogram portraying the distribution of scores based on academic college (raw numbers are summarized in Table B3, later in this report). The width of the intervals in this histogram were increased in order facilitate viewing some of the smaller frequencies.
General Education Assessment: 2014 35

Figure 26. Histogram of College by Written Communication Score
An analysis conforming Written Communication score to academic college yielded 20.71% of artifacts classified correctly (c = 0.10). Proportions of scores by college are shown in Figure 27. Figure 27. Histogram of College by Written Communication Scores with Proportions Displayed
A score of 3 was most common for students in all colleges except the College of Human Sciences; the College of Human Sciences also has a disproportionate number of students who scored a 4 (40%) as compared to the other colleges; the closest is the College of Agricultural Sciences and Natural Resources, with 19% of its students scoring a 4. LASSO is the only college where the majority of students scored below a 3. It is difficult to draw any meaningful conclusions from these data; however, it is clear by our low c-value that the observations aren’t entirely random. When the matrix algebra routine in the OOM software attempts to conform the Written Communication scores to the colleges, it essentially tries to rotate a variable with four categories (Written Communication scores) into a variable with seven categories (academic college). It is much easier mathematically to conform seven variables to four variables. As such, a second analysis was conducted, this time attempting to conform academic college to Written Communication score. This analysis correctly classified 43.85% of the observations correctly (c <0.001). The histogram for this analysis is shown in Figure 28 with and without proportions displayed.
General Education Assessment: 2014 36

Figure 28. Written Communication Scores by College
Whereas the last previous analysis attempted to predict Written Communication score from college, this analysis attempts to predict college based on Written Communication score. The proportions here are slightly different due to the matrix algebra, although it tells a similar story: for example, LASSO students were the source of 33% of the scores of 1, while College of Human Sciences students were the source of 47% of the scores of 4. Students in the College of Arts and Sciences were the source of 29% of the scores of 3. Subscale Scores. Each of the five VALUE rubric subscales were evaluated separately to determine the extent to which scores on that subscale related to the overall artifact score. A Crossed Pattern Analysis was specified for each subscale. It was expected that lower scores on the given subscale would be associated with lower overall artifact scores, and higher subscale scores would be associated with higher artifact scores. The subscales were also tested with a modeled imprecision, whereby the accepted hypothetical region was expanded by a region of one. An example, using the evidence subscale, is shown in Figure 29.
General Education Assessment: 2014 37

Figure 29. Original Crossed Pattern Analysis and Modeled Imprecision Original Modeled Imprecision
Results of these analyses are shown in Table 7. Table 7. Written Communication Pattern Analysis: Original Model and Modeled Imprecision
Original Analysis
Modeled Imprecision
Subscale
PCC
C PCC
c
A. Context and purpose
70.36
<0.001 99.70
<0.001
B. Content Development
78.44
<0.001 99.85
<0.001
C. Genre and disciplinary convention
71.71
<0.001 100.00
<0.001
D. Sources and evidence
58.86
<0.001 92.03
<0.001
E. Control of syntax and mechanics
70.81
<0.001 99.70
<0.001
There was a distinct relationship between the subscales and the overall score. Results from this analysis should not be interpreted in terms of a linear relationship; however, the overall score did appear to adequately reflect performance on the individual subscales. Even with the apparently low PCC of the sources and evidence subscale, the scores did not occur randomly, and the PCC was improved when the imprecision was modeled. Use of Results and Future Plans Based upon the results of this data, the Committee for the Assessment of General Education (CAGE) determined that more resources to assist faculty with teaching and assessing critical thinking would be beneficial. As such, the Provost’s Initiative: Focus on General Education workshops (offered through UAT) in 2015-2016 will focus exclusively on critical thinking (instead of on three different general education outcomes as they have in the past). Each of the workshops will focus on incorporating critical thinking assignments into classes in one of three specific discipline areas—arts and humanities, natural and mathematical sciences, and social
General Education Assessment: 2014 38

and behavioral sciences. Further, the Chair and Co-chair of CAGE are helping lead efforts to discuss ways in which a better selection of artifacts can be collected for each general education outcome in order to continue to improve the artifact pool collected each year. Finally, there was a joint meeting of the three committees or councils that share primary responsibility for the General Education program (Assessment and Academic Improvement Council, General Education Advisory Council, and the Committee for the Assessment of General Education) in March 2015. The primary purpose of this meeting, which is held annually, is to discuss the contents of this annual report specifically and the broader implications and directions of assessment at OSU more generally. Though no firm recommendations or plans of action came from the discussion, members of the Committee for the Assessment of General Education are working to review the general education assessment process to ensure that general education outcomes are appropriately assessed across the University.
General Education Assessment: 2014 39

APPENDIX A: Assessment of Critical Thinking Skills Critical Thinking Artifact Collection Critical Thinking artifacts (embedded course assignments) were collected from faculty by direct request from three sources: 1) courses that carry a general education designation (e.g., S, H, I, or D); 2) courses that do not carry a general education designation but require students to complete assignments that meet the criteria for the general education outcomes being assessed; and 3) courses in which the instructor of record attended the Provost’s Faculty Development Initiative: Focus on General Education assessment workshop series. The courses from which artifacts were sampled are shown in Table A1. Artifacts selected for the Institutional Portfolio were coded, and all identifying information was removed. Demographic data were collected separately from the Office of Institutional Research and Information Management (IRIM); these data were used for statistical analysis only and cannot be used to identify individual students. Student demographic and course information were not shared with reviewers prior to scoring. Table A1. 2014 Collection of Critical Thinking Artifacts
Course No.
Course Name
General Education
Designation (if any)
Number of Artifacts
Submitted
Number of Artifacts Scored
AMIS 2013 Intro to American Indian Studies
D 4 4
AMST 2103 Intro to American Studies D, H 29 29
AMST 3723 Culture of American Sports
D, H 12 12
ANSI 4863 Capstone Animal Agriculture
4 4
CS 4883 Social Issues in Computer Science
18 18
ECON 3823 American Econ History S 1 1 ECON 2103 Intro to Microeconomics S 4 4
EPSY 3213 Psychology of Adolescence
8 8
ENGL 1113 Composition 1 174 164 ENGL 2413 Intro to Literature D, H 5 5 ENGL 2543 Survey of British Lit 1 3 3
ENGL 3190 Coming of Age in Indigenous Lit
9 9
ENGL 3410 Popular Fiction 5 5
ENGL 3473 Race, Gender, Ethnic American Film
4 4
GEOG 1113 Intro to Cultural Geography
I, S 63 62
HDFS 2113 Lifespan Human S 2 0
General Education Assessment: 2014 40

Development
HDFS 4533 Critical Issues in Human
Development and Family Science
29
29
HHP 3643 Health Behavior Theory 12 12
HIST 1623 Western Civilization After 1500
H 8 8
HRAD 3213 Hospitality and Tourism
Management and Organizations
12
12
HRAD 4850 Purchasing for Food Services
10 10
MC 1143 Media in a Diverse Society
D, S 4 4
MGMT 4613 International Management
I 2 2
MSIS 3223 Operations Management 3 3 NREM 4001 Issues in Global Change 1 1
NSCI 4643 Capstone for Nutritional Sciences
49 49
PHIL 1013 Philosophical Classics H 13 13 PHIL 1213 Philosophies of Life H 17 17 PHIL 4313 Philosophy of Mind H 7 7
POLS 4010 Interstate Conflict and War
8 8
POLS 5710 The Federal Judiciary and Separation of Power
4 4
RMTR 4933 Advanced Methods in Therapeutic Recreation
11 11
SOC 1113 Intro to Sociology S 57 44 SOC 3523 Juvenile Delinquency D, S 11 11
SPCH 2713 Intro to Speech Communication
S 91 87
SPCH 3733 Elements of Persuasion S 10 10
SPCH 4793 Nonverbal Communication
S 1 0
Total Number of Critical Thinking Artifacts 705 674 Scoring Process and Reliability Estimation All reviewers met for a training session in the beginning of Summer 2014. After reviewing the Critical Thinking rubric, reviewers examined Critical Thinking artifacts from previous years. This provided raters with the opportunity to ask questions or discuss any concerns, as well as aligned raters’ scores with each other.
General Education Assessment: 2014 41

Five teams, each composed of two raters, reviewed the artifacts independently. Each artifact received a score from 1 to 4, with 1 being the lowest possible score, and 4 being the highest possible score. Though not an official category on the rubric, a score of 0 could be assigned to any work that did not meet benchmark standards (i.e., a score of 1). Reviewers also scored the artifacts on five subscales: explanation of issues; evidence; influence of context and assumptions; student’s position (perspective, thesis/hypothesis); and conclusions and related outcomes (implications and consequences). After the teams rated the artifacts, the team captain reviewed the scores. Artifacts on which the reviewers differed by more than one point were discussed as a group. The team captain attempted to bring the reviewers to a consensus; absent that, the team captain scored the artifact in question. Estimates of inter-rater reliability are provided in Table A2. Table A2. Inter-Rater Reliabilities10(Critical Thinking)
Team 1 Team 2 Team 3 Team 4 Team 5 Method Value SE CI Value SE CI Value SE CI Value SE CI Value SE CI
AC1 1
0
1 to 1
1
0
1 to 1
0.97
0.01
0.945 to 1
1
0
1 to 1
0.44
0.05
0.34 to
0.54 Kappa
1
0 1 to 1
1
0
1 to 1
0.97
0.02
0.931 to 1
1
0
1 to 1
0.31
0.07
0.18 to
0.44 PI
1
0 1 to 1
1
0
1 to 1
0.97
0.02
0.931 to 1
1
0
1 to 1
0.31
0.07
0.18 to
0.44 BP
1
0 1 to 1
1
0
1 to 1
0.97
0.02
0.943 to 1
1
0
1 to 1
0.42
0.05
0.32 to
0.52 There are numerous ways to evaluate the adequacy of reliability estimates. Guidelines proposed by Altman (1991) are provided below:
• < .20 = Slight Agreement • .21 to .40 = Fair Agreement • .41 to .60 = Moderate Agreement • .61 to .80 = Good Agreement • .81 to 1.00 = Very Good.
These guidelines indicate that teams 1, 2, 3, and 4 had “very good” levels of agreement, and team 5 had “fair” or “moderate” levels of agreement, depending on the method. Many raters came to an agreement on differing scores following their discussion, which led to perfect agreement on final scores for some of the raters.
10 Descriptions of reliability coefficient may be found at http://agreestat.com/research_papers.html. AC1 = variation of Kappa statistic and BP statistic that incorporates the conditional probability that two random rater will agree given no chance agreement; Kappa = omnibus measure of percent agreement among raters when corrected for chance agreement wherein chance is defined as the expected value if ratings were completely independent; PI = probability that a randomly selected rater will classify a randomly selected artifact into specific category. BP = Brennan-Prediger modification of Kappa statistic that incorporates a modification of marginal estimates so that chance is redefined to adjust for the number of possible categories.
General Education Assessment: 2014 42

Table A3 represents descriptive statistics for the Critical Thinking artifacts and scores. Table A3. Critical Thinking Scores, 2014 % SCORE n(%) 0 1 2 3 4 N
Overall 3 (0.4%) 26 (3.9%) 198 (29.4%) 327 (48.5%) 120 (17.8%) 674
Class Freshman 2 (0.6%) 9 (2.6%) 124 (36.5%) 154 (45.3%) 51 (15.0%) 340
Senior 1 (0.3%) 17 (5.1%) 74 (22.2%) 173 (51.8%) 69 (20.7%) 334
College CAS 0 (0.0%) 2 (1.3%) 39 (24.5%) 89 (56.0%) 29 (18.2%) 159
CASNR 1 (2.1%) 1 (2.1%) 10 (21.3%) 25 (53.2%) 10 (21.3%) 47 SSB 0 (0.0%) 3 (3.4%) 23 (26.4%) 45 (51.7%) 16 (18.4%) 87 COE 0 (0.0%) 8 (11.9%) 18 (26.9%) 36 (53.7%) 5 (7.5%) 67 CEAT 1 (1.0%) 5 (5.1%) 31 (31.6%) 42 (42.9%) 19 (19.4%) 98 COHS 1 (0.0%) 3 (71.0%) 35 (29.0%) 59 (0.0%) 30 (0.0%) 128 UAS 0 (0.0%) 4 (45.5%) 42 (45.5%) 31 (9.1%) 11 (0.0%) 88
Gender
Male 2 (0.7%) 10 (3.3%) 97 (31.6%) 139 (45.3%) 59 (19.2%) 307 Female 1 (0.3%) 16 (4.4%) 101 (27.5%) 188 (51.2%) 61 (16.6%) 367
General Education Assessment: 2014 43

APPENDIX B: Assessment of Written Communication Learning Outcome Written Communication Artifact Collection Written Communication artifacts (embedded course assignments) were collected from faculty by direct request from three sources: 1) courses that carry a general education designation (e.g., S, H, I, or D); 2) courses that do not carry a general education designation but require students to complete assignments that meet the criteria for the general education outcomes being assessed; and 3) courses in which the instructor of record attended the Provost’s Faculty Development Initiative: Focus on General Education assessment workshop series. The courses from which artifacts were sampled are shown in Table B1. Artifacts selected for the Institutional Portfolio were coded, and all identifying information was removed. Demographic data were collected separately from the Office of Institutional Research and Information Management (IRIM); these data were used for statistical analysis only and cannot be used to identify individual students. Student demographic and course information were not shared with reviewers prior to scoring. Table B1. 2014 Collection of Written Communication Artifacts
Course No.
Course Name
General Education
Designation (if any)
Number of Artifacts
Submitted
Number of Artifacts Scored
AMIS 2103 Intro to American Indian Studies
D 4 4
AMST 2103 Intro to American Studies D, H 29 29
AMST 3723 Culture of American Sports
D, H 12 12
ANSI 4863 Capstone Animal Agriculture
4 4
CS 4883 Social Issues in Computer Science
18 18
ECON 3823 American Econ History S 1 1 ECON 2103 Intro to Microeconomics S 4 4
EDSY 3213 Psychology of Adolescence
8 8
ENGL 1113 Composition 1 174 165 ENGL 2413 Intro to Literature D, H 5 1 ENGL 2543 Survey of British Lit 1 3 3
ENGL 3190 Coming of Age in Indigenous Lit
9 9
ENGL 3410 Popular Fiction 5 5
ENGL 3473 Race, Gender, Ethnic American Film
4 4
GEOG 1113 Intro to Cultural Geography
I, S 63 62
HDFS 2113 Lifespan Human S 2 0
General Education Assessment: 2014 44
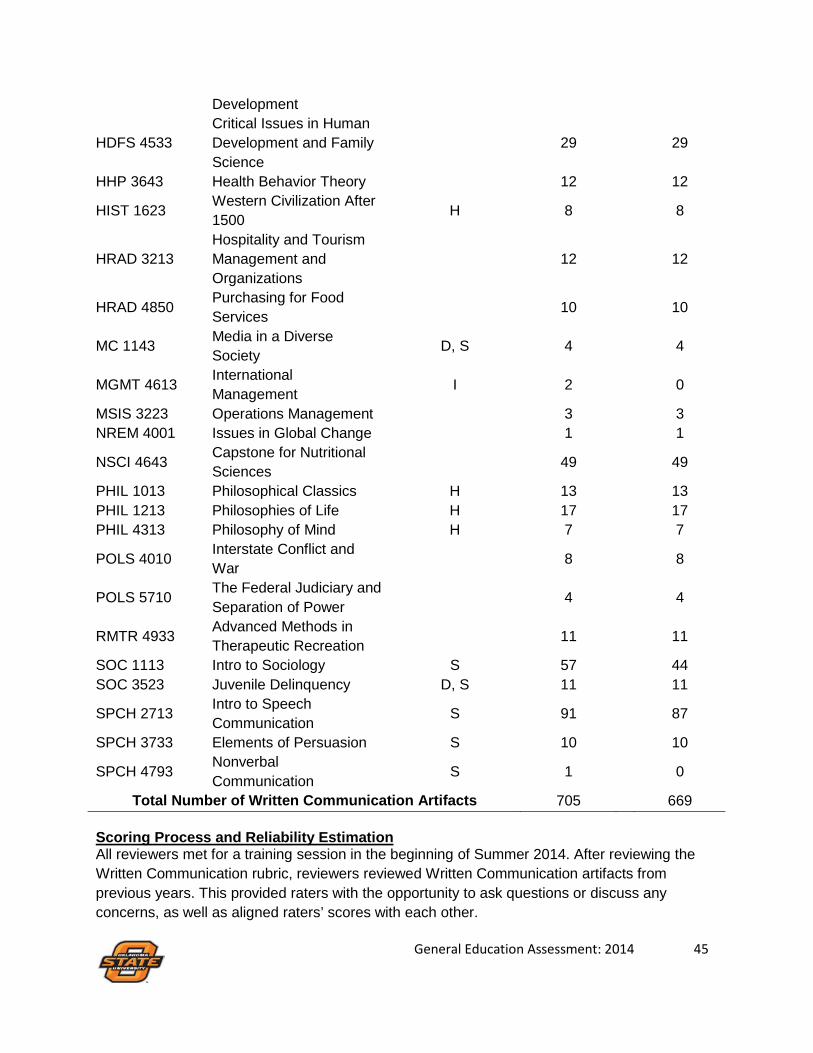
Development
HDFS 4533 Critical Issues in Human
Development and Family Science
29
29
HHP 3643 Health Behavior Theory 12 12
HIST 1623 Western Civilization After 1500
H 8 8
HRAD 3213 Hospitality and Tourism
Management and Organizations
12
12
HRAD 4850 Purchasing for Food Services
10 10
MC 1143 Media in a Diverse Society
D, S 4 4
MGMT 4613 International Management
I 2 0
MSIS 3223 Operations Management 3 3 NREM 4001 Issues in Global Change 1 1
NSCI 4643 Capstone for Nutritional Sciences
49 49
PHIL 1013 Philosophical Classics H 13 13 PHIL 1213 Philosophies of Life H 17 17 PHIL 4313 Philosophy of Mind H 7 7
POLS 4010 Interstate Conflict and War
8 8
POLS 5710 The Federal Judiciary and Separation of Power
4 4
RMTR 4933 Advanced Methods in Therapeutic Recreation
11 11
SOC 1113 Intro to Sociology S 57 44 SOC 3523 Juvenile Delinquency D, S 11 11
SPCH 2713 Intro to Speech Communication
S 91 87
SPCH 3733 Elements of Persuasion S 10 10
SPCH 4793 Nonverbal Communication
S 1 0
Total Number of Written Communication Artifacts 705 669 Scoring Process and Reliability Estimation All reviewers met for a training session in the beginning of Summer 2014. After reviewing the Written Communication rubric, reviewers reviewed Written Communication artifacts from previous years. This provided raters with the opportunity to ask questions or discuss any concerns, as well as aligned raters’ scores with each other.
General Education Assessment: 2014 45

Five teams, each composed of two raters, reviewed the artifacts independently. Each artifact received a score from 1 to 4, with 1 being the lowest possible score, and 4 being the highest possible score. Though not an official category on the rubric, a score of 0 could be assigned to any work that did not meet benchmark standards (i.e., a score of 1). Reviewers also scored the artifacts on five subscales: context and purpose of writing; content development; genre and disciplinary conventions; sources and evidence; and control of syntax and mechanics. After the teams rated the artifacts, the team captain reviewed the scores. Artifacts on which the reviewers differed by more than one point were discussed as a group. The team captain attempted to bring the reviewers to a consensus; absent that, the team captain scored the artifact in question. Estimates of inter-rater reliability are provided in Table B2. Table B2. Inter-Rater Reliabilities (Written Communication)
Team 1 Team 2 Team 3 Team 4 Team 5 Method Value SE CI Value SE CI Value SE CI Value SE CI Value SE CI
AC1 1
0
1 to 1
0.98
0.01
0.96 to 1
0.97
0.02
0.94 to 1
0.97
0.02
0.94 to 1
0.97
0.02
0.94 to 1
Kappa 1
0
1 to 1
0.98
0.02
0.94 to 1
0.97
0.02
0.94 to 1
0.95
0.02
0.91 to 1
0.96
0.02
0.92 to 1
PI 1
0
1 to 1
0.98
0.02
0.98 to 1
0.97
0.02
0.94 to 1
0.96
0.02
0.91 to 1
0.96
0.02
0.92 to 1
BP 1
0
1 to 1
0.98
0.01
0.96 to 1
0.97
0.02
0.94 to 1
0.97
0.02
0.93 to 1
0.97
0.02
0.93 to 1
There are numerous ways to evaluate the adequacy of reliability estimates. Guidelines proposed by Altman (1991) are provided below:
• < .20 = Slight Agreement • .21 to .40 = Fair Agreement • .41 to .60 = Moderate Agreement • .61 to .80 = Good Agreement • .81 to 1.00 = Very Good.
These guidelines indicate that all teams had “very good” levels of agreement. Many raters came to an agreement on differing scores following their discussion, which led to perfect agreement on final scores for some of the raters. Table B3 represents descriptive statistics for the diversity artifacts and scores.
General Education Assessment: 2014 46

Table B3. Written Communication Artifact Scores, 2014
SCORE n(%) 0 1 2 3 4 N Overall 0 (0.0%) 39 (5.8%) 158 (23.6%) 355 (53.1%) 117 (17.5%) 669 Class
Freshman 0 (0.0%) 35 (10.3%) 103 (30.2%) 173 (50.7%) 30 (8.8%) 341 Senior 0 (0.0%) 4 (1.2%) 55 (16.8%) 182 (55.5%) 87 (26.5%) 328 College
CAS 0 (0.0%) 7 (4.4%) 30 (18.9%) 100 (62.9%) 22 (13.8%) 159 CASNR 0 (0.0%) 2 (4.3%) 9 (19.1%) 28 (59.6%) 8 (17.0%) 47
SSB 0 (0.0%) 5 (5.9%) 23 (27.1%) 46 (54.1%) 11 (12.9%) 85 COE 0 (0.0%) 3 (4.5%) 13 (19.4%) 43 (64.2%) 8 (11.9%) 67 CEAT 0 (0.0%) 8 (8.4%) 31 (32.6%) 46 (48.4%) 10 (10.5%) 95 COHS 0 (0.0%) 1 (0.8%) 23 (18.0%) 52 (40.6%) 52 (40.6%) 128 UAS 0 (0.0%) 13 (14.8%) 29 (33.0%) 40 (45.4%) 6 (6.8%) 88
Gender
Male 0 (0.0%) 23 (7.6%) 75 (24.8%) 175 (57.8%) 30 (9.9%) 303 Female 0 (0.0%) 16 (4.4%) 83 (22.7%) 180 (49.2%) 87 (23.4%) 366
General Education Assessment: 2014 47