oklahoma monthly climate summary january 2021
TRANSCRIPT
Copyright © 2021 Board of Regents of the University of Oklahoma. Oklahoma Monthly Climate Summary 1
JANUARY 2021Oklahoma Monthly Climate Summary
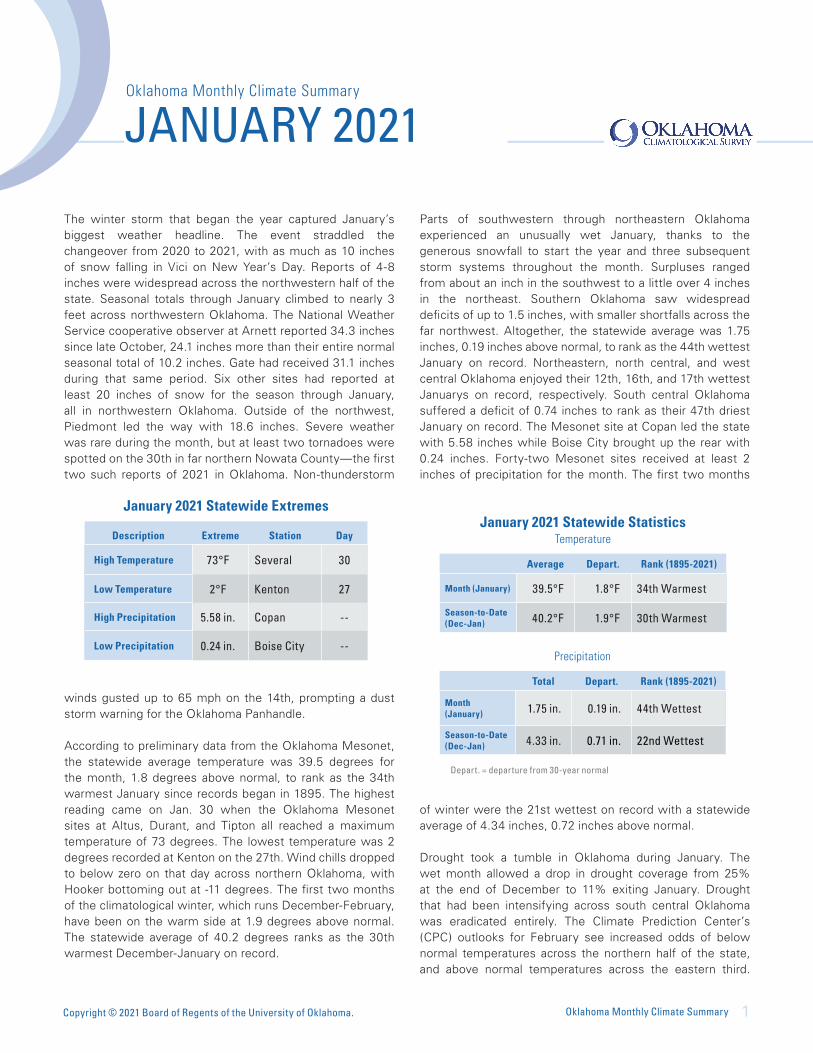
January 2021 Statewide Extremes
Description Extreme Station Day
High Temperature 73°F Several 30
Low Temperature 2°F Kenton 27
High Precipitation 5.58 in. Copan --
Low Precipitation 0.24 in. Boise City --
January 2021 Statewide StatisticsTemperature
Average Depart. Rank (1895-2021)
Month (January) 39.5°F 1.8°F 34th Warmest
Season-to-Date (Dec-Jan) 40.2°F 1.9°F 30th Warmest
Precipitation
Total Depart. Rank (1895-2021)
Month (January) 1.75 in. 0.19 in. 44th Wettest
Season-to-Date (Dec-Jan) 4.33 in. 0.71 in. 22nd Wettest
Depart. = departure from 30-year normal
The winter storm that began the year captured January’s biggest weather headline. The event straddled the changeover from 2020 to 2021, with as much as 10 inches of snow falling in Vici on New Year’s Day. Reports of 4-8 inches were widespread across the northwestern half of the state. Seasonal totals through January climbed to nearly 3 feet across northwestern Oklahoma. The National Weather Service cooperative observer at Arnett reported 34.3 inches since late October, 24.1 inches more than their entire normal seasonal total of 10.2 inches. Gate had received 31.1 inches during that same period. Six other sites had reported at least 20 inches of snow for the season through January, all in northwestern Oklahoma. Outside of the northwest, Piedmont led the way with 18.6 inches. Severe weather was rare during the month, but at least two tornadoes were spotted on the 30th in far northern Nowata County—the first two such reports of 2021 in Oklahoma. Non-thunderstorm
winds gusted up to 65 mph on the 14th, prompting a dust storm warning for the Oklahoma Panhandle.
According to preliminary data from the Oklahoma Mesonet, the statewide average temperature was 39.5 degrees for the month, 1.8 degrees above normal, to rank as the 34th warmest January since records began in 1895. The highest reading came on Jan. 30 when the Oklahoma Mesonet sites at Altus, Durant, and Tipton all reached a maximum temperature of 73 degrees. The lowest temperature was 2 degrees recorded at Kenton on the 27th. Wind chills dropped to below zero on that day across northern Oklahoma, with Hooker bottoming out at -11 degrees. The first two months of the climatological winter, which runs December-February, have been on the warm side at 1.9 degrees above normal. The statewide average of 40.2 degrees ranks as the 30th warmest December-January on record.
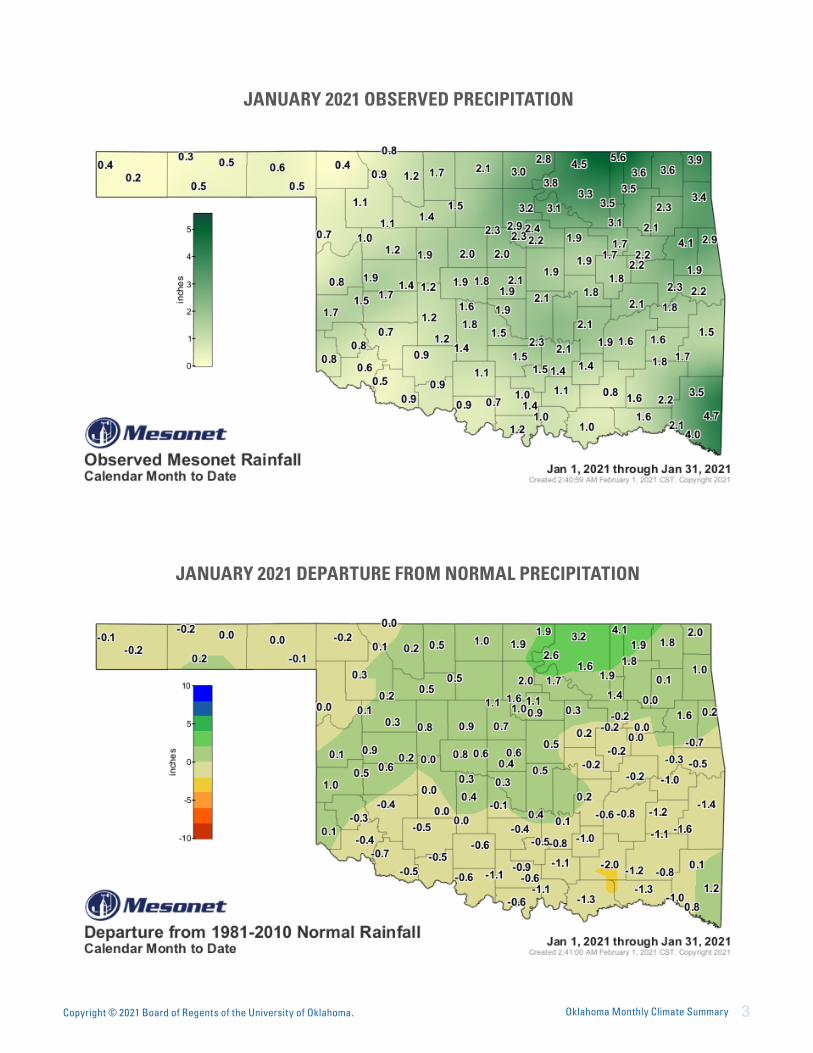
Parts of southwestern through northeastern Oklahoma experienced an unusually wet January, thanks to the generous snowfall to start the year and three subsequent storm systems throughout the month. Surpluses ranged from about an inch in the southwest to a little over 4 inches in the northeast. Southern Oklahoma saw widespread deficits of up to 1.5 inches, with smaller shortfalls across the far northwest. Altogether, the statewide average was 1.75 inches, 0.19 inches above normal, to rank as the 44th wettest January on record. Northeastern, north central, and west central Oklahoma enjoyed their 12th, 16th, and 17th wettest Januarys on record, respectively. South central Oklahoma suffered a deficit of 0.74 inches to rank as their 47th driest January on record. The Mesonet site at Copan led the state with 5.58 inches while Boise City brought up the rear with 0.24 inches. Forty-two Mesonet sites received at least 2 inches of precipitation for the month. The first two months
of winter were the 21st wettest on record with a statewide average of 4.34 inches, 0.72 inches above normal.
Drought took a tumble in Oklahoma during January. The wet month allowed a drop in drought coverage from 25% at the end of December to 11% exiting January. Drought that had been intensifying across south central Oklahoma was eradicated entirely. The Climate Prediction Center’s (CPC) outlooks for February see increased odds of below normal temperatures across the northern half of the state, and above normal temperatures across the eastern third.

Copyright © 2021 Board of Regents of the University of Oklahoma. Oklahoma Monthly Climate Summary 2
Outside of those areas, equal chances exist for above-, below-, and near-normal temperatures and precipitation. CPC’s February drought outlook expects a static map, with neither development nor removal of drought by the end of the month. February is normally a relatively dry month in Oklahoma. Therefore, near- or below-normal precipitation combined with near- or below-normal temperatures would not be favorable conditions for drought development.
Copyright © 2021 Board of Regents of the University of Oklahoma. Oklahoma Monthly Climate Summary 3
JANUARY 2021 OBSERVED PRECIPITATION
JANUARY 2021 DEPARTURE FROM NORMAL PRECIPITATION

Copyright © 2021 Board of Regents of the University of Oklahoma. Oklahoma Monthly Climate Summary 4
JANUARY 2021 PERCENT OF NORMAL PRECIPITATION

Copyright © 2021 Board of Regents of the University of Oklahoma. Oklahoma Monthly Climate Summary 5
JANUARY 2021 AVERAGE TEMPERATURE
JANUARY 2021 DEPARTURE FROM NORMAL TEMPERATURE

Copyright © 2021 Board of Regents of the University of Oklahoma. Oklahoma Monthly Climate Summary 6
MESONET MONTHLY SUMMARY FOR JANUARY 2021
MEAN HIGH LOW TOT HIGH MEAN HIGH LOW TOT HIGHNAME TEMP TEMP DAY TEMP DAY HDD CDD PPT 24-HR DAY NAME TEMP TEMP DAY TEMP DAY HDD CDD PPT 24-HR DAY
PANHANDLE Arnett 38.0 69 13 13 12 837 0 .71 .36 24 Goodwell 36.1 71 29 5 27 896 0 .52 .19 10Beaver 36.6 66 5 10 27 882 0 .59 .23 24 Hooker 35.4 67 5 3 27 916 0 .50 .18 10Boise City 34.5 67 29 4 11 945 0 .24 .07 10 Kenton 35.0 69 29 2 27 931 0 .37 .11 10Buffalo 37.3 67 13 17 27 860 0 .43 .29 25 Slapout 37.6 66 13 15 27 851 0 .54 .18 25Eva ***** *** *** *** *** **** **** .32 .21 10
NORTH CENTRAL Alva 37.7 64 13 19 12 845 0 1.16 .67 25 May Ranch 38.3 66 13 16 27 829 0 .78 .48 25Blackwell 36.8 61 30 18 28 874 0 2.98 .91 30 Medford 37.6 61 30 20 28 850 0 2.12 .87 25Breckinridge 37.7 64 30 20 9 846 0 ***** 1.01 25 Newkirk 37.1 59 30 18 27 863 0 2.83 .98 25Cherokee 37.8 64 30 20 28 842 0 1.65 .78 25 Red Rock 37.8 63 30 17 28 844 0 3.24 1.13 25Fairview 39.3 65 30 21 28 797 0 1.41 .64 25 Seiling 38.2 64 30 21 12 830 0 1.08 .52 25Freedom 37.8 65 13 18 28 844 0 .88 .49 25 Woodward 38.6 66 13 19 26 819 0 1.07 .51 25Lahoma 37.6 64 30 20 28 849 0 1.50 .64 25
NORTHEAST Bixby 39.9 67 30 23 11 779 0 1.72 .58 1 Pawnee 38.4 62 30 17 11 826 0 3.12 .82 25Burbank 37.6 62 30 17 11 850 0 3.82 1.57 25 Porter 39.9 67 30 23 9 777 0 2.22 .68 25Copan 37.6 58 13 20 11 849 0 5.58 2.06 30 Pryor 38.1 63 30 20 11 835 0 2.26 .60 1Foraker 37.6 60 30 21 11 850 0 4.45 1.52 25 Skiatook 39.0 62 30 20 11 805 0 3.52 1.02 1Inola 38.4 66 30 20 9 823 0 2.14 .55 1 Talala 37.7 61 30 20 11 847 0 3.50 .87 1Jay 38.3 62 30 19 11 827 0 3.39 .78 25 Tulsa 40.1 65 30 22 11 772 0 3.10 .83 1Miami 37.7 58 5 21 11 846 0 3.90 .98 25 Vinita 37.2 59 5 18 11 862 0 3.63 1.02 25Nowata 37.7 61 30 18 11 846 0 3.62 1.08 25 Wynona 38.1 62 30 19 11 832 0 3.29 .99 25
WEST CENTRAL Bessie 39.8 67 30 19 28 782 0 1.70 .67 25 Erick 39.2 65 30 18 12 799 0 1.73 1.25 24Butler 39.1 66 30 17 12 803 0 1.91 1.09 24 Putnam 38.5 62 30 21 28 821 0 1.24 .48 24Camargo 37.5 64 13 17 12 851 0 .99 .55 25 Watonga 39.3 65 30 21 28 796 0 1.92 .79 24Cheyenne 39.9 63 30 22 28 779 0 .83 .48 24 Weatherford 39.4 66 30 21 16 794 0 1.39 .51 25Elk City 39.8 67 30 19 28 780 0 1.50 .68 24
CENTRAL Acme 40.4 70 30 20 28 762 0 1.35 .54 25 Norman 40.2 68 30 19 28 768 0 1.86 .68 25Bristow 39.2 66 30 18 9 801 0 1.88 .48 1 Oilton 38.6 64 30 17 11 819 0 1.94 .61 25Lake Carl Blac 37.5 64 30 15 28 854 0 2.87 .67 25 OKC East 39.9 67 30 18 28 777 0 1.87 .60 1Chandler 40.2 66 30 19 28 768 0 1.91 .61 1 Okemah 39.6 65 30 20 12 789 0 1.78 .70 25Chickasha 39.8 70 30 18 28 780 0 1.77 .85 25 Perkins 39.2 63 30 18 28 799 0 2.23 .57 25El Reno 37.7 67 30 15 28 846 0 1.86 .61 24 Seminole 41.0 67 30 18 28 745 0 1.48 .40 1Guthrie 39.6 65 30 19 28 788 0 2.01 .40 1 Shawnee 40.4 66 30 20 28 762 0 2.09 .55 6Kingfisher 38.7 67 30 20 28 816 0 1.98 .74 25 Spencer 40.1 66 30 18 28 771 0 2.08 .53 24Marena 38.7 64 30 17 28 815 0 2.34 .69 1 Stillwater 38.5 64 30 17 28 822 0 2.42 .89 1Minco 39.2 68 30 20 28 799 0 1.58 .38 2 Washington 41.0 70 30 19 13 745 0 1.50 .38 24Marshall 38.0 64 30 19 28 836 0 2.31 .67 25 Yukon 39.0 67 30 18 28 805 0 1.82 .47 25
EAST CENTRAL Cookson 39.3 64 30 19 9 798 0 1.89 .56 25 Sallisaw 40.2 66 30 19 12 768 0 2.20 1.00 6Eufaula 41.4 67 30 21 9 732 0 2.14 1.22 25 Stigler 40.5 68 30 19 12 760 0 1.81 .63 25Haskell 39.4 67 30 21 9 794 0 2.24 .64 25 Stuart 41.7 68 30 22 9 723 0 1.90 .76 25Hectorville 40.1 65 30 22 9 772 0 1.66 .58 1 Tahlequah 38.8 64 30 20 9 813 0 4.11 2.55 25Holdenville 41.0 66 30 20 28 745 0 2.10 .80 25 Webbers Falls 40.4 66 30 21 12 762 0 2.31 .95 25McAlester 41.0 69 30 19 9 744 0 1.57 .42 1 Westville 38.8 63 30 22 9 811 0 2.85 1.50 25Okmulgee 39.5 67 30 19 12 790 0 1.83 .42 1
SOUTHWEST Altus 41.5 73 30 23 16 729 0 .62 .25 25 Hollis 40.6 71 30 20 12 756 0 .80 .36 25Apache 40.1 71 30 18 28 772 0 1.23 .46 1 Mangum 39.7 71 30 15 12 785 0 .79 .28 1Fort Cobb 39.5 69 30 19 13 790 0 1.16 .39 25 Medicine Park 41.7 70 30 21 28 723 0 .88 .38 1Grandfield 42.4 72 30 22 28 701 0 .86 .48 25 Tipton 41.6 73 30 21 16 726 0 .46 .17 25Hinton 38.9 65 30 20 28 808 0 1.16 .40 25 Walters 42.2 72 30 21 28 708 0 .85 .32 25Hobart 39.9 70 30 19 28 777 0 .65 .27 1
SOUTH CENTRAL Ada 41.2 67 30 18 28 739 0 2.12 .82 25 Lane 42.2 71 30 18 12 706 0 .80 .21 6Ardmore 43.4 68 30 21 28 670 0 1.37 .63 25 Madill 43.3 70 30 20 9 673 0 1.04 .46 25Burneyville 42.9 70 30 19 28 684 0 1.17 .61 25 Newport 43.4 68 30 22 9 **** **** .96 .27 25Byars 41.6 67 30 20 28 725 0 2.32 .81 25 Pauls Valley 41.7 69 30 19 28 721 0 1.45 .71 25Centrahoma 41.6 70 30 18 28 724 0 1.40 .83 25 Ringling 43.3 69 30 21 28 673 0 .66 .25 24Durant 44.1 73 30 24 9 647 0 1.02 .40 25 Sulphur 41.0 68 30 17 12 745 0 1.47 .53 25Fittstown 41.1 66 30 19 9 739 0 1.35 .47 25 Tishomingo 41.6 68 30 19 12 727 0 1.11 .62 25Ketchum Ranch 42.1 70 30 20 28 711 0 1.05 .39 25 Waurika 43.2 71 30 19 28 677 0 .85 .31 1
SOUTHEAST Antlers 42.1 72 30 18 12 709 0 1.59 .55 6 Mt Herman 41.0 65 25 19 9 743 0 3.45 1.26 6Broken Bow 42.8 67 25 22 12 688 0 4.65 2.48 6 Talihina 41.3 69 30 16 12 736 0 1.70 1.08 6Clayton 41.4 68 30 19 12 731 0 1.80 .88 6 Valliant 42.8 71 30 20 12 688 0 2.09 .92 6Cloudy 41.9 69 30 20 12 715 0 2.22 .82 6 Wilburton 40.8 69 30 19 12 749 0 1.58 .57 25Hugo 43.8 72 30 23 28 657 0 1.58 .42 25 Wister 40.4 70 25 18 12 763 0 1.54 .98 6Idabel 43.2 69 30 20 12 677 0 3.95 1.72 6

Copyright © 2021 Board of Regents of the University of Oklahoma. Oklahoma Monthly Climate Summary 7
2021 STATEWIDE PRECIPITATION MONTHLY TOTALS VS. NORMAL
Mon
thly
Pre
cipi
tatio
n (in
ches
)
January 2021 Mesonet Precipitation Comparison
Climate DivisionPrecipitation
(inches)Departure from Normal (inches) Rank since 1895
Wettest on Record (Year)
Driest on Record (Year)
Jan-20 (inches)
Panhandle 0.47 -0.07 53rd Wettest 1.94 (2017) 0.00 (1923) 1.23
North Central 1.73 0.76 16th Wettest 4.16 (1949) 0.00 (1986) 1.90
Northeast 3.33 1.61 12th Wettest 6.87 (1916) 0.01 (1986) 4.14
West Central 1.47 0.56 17th Wettest 3.74 (1949) 0.00 (1976) 1.40
Central 1.95 0.51 31st Wettest 5.58 (1949) 0.00 (1986) 4.03
East Central 2.20 -0.22 56th Wettest 11.21 (1916) 0.04 (1986) 5.75
Southwest 0.86 -0.26 58th Wettest 4.48 (1949) 0.00 (1912) 2.36
South Central 1.26 -0.74 47th Driest 7.70 (1916) 0.03 (1986) 5.18
Southeast 2.38 -0.73 53rd Driest 11.13 (1949) 0.20 (1943) 6.09
Statewide 1.75 0.19 44th Wettest 5.35 (1949) 0.03 (1986) 3.59

Copyright © 2021 Board of Regents of the University of Oklahoma. Oklahoma Monthly Climate Summary 8
January 2021 Mesonet Temperature Comparison
Climate DivisionAverage Temp (F)
Departure from Normal (F) Rank since 1895
Hottest on Record (Year)
Coldest on Record (Year) Jan-20 (F)
Panhandle 36.3 1.4 36th Warmest 42.9 (2006) 19.7 (1940) 37.9
North Central 37.9 2.8 21st Warmest 45.0 (2006) 18.8 (1940) 39.4
Northeast 38.3 2.5 29th Warmest 46.2 (2006) 20.6 (1940) 40.5
West Central 39.2 2.2 24th Warmest 46.1 (2006) 21.3 (1930) 41.6
Central 39.4 1.5 38th Warmest 47.7 (2006) 22.8 (1930) 42.9
East Central 40.2 1.6 45th Warmest 48.0 (1923) 24.8 (1918) 43.0
Southwest 40.7 1.3 37th Warmest 48.1 (2006) 23.6 (1930) 44.3
South Central 42.3 1.5 39th Warmest 49.7 (1923) 27.5 (1930) 45.4
Southeast 42.0 1.6 41st Warmest 48.7 (1907) 27.7 (1918) 44.9
Statewide 39.5 1.8 34th Warmest 46.8 (2006) 23.7 (1940) 42.1
Mai
n Te
mpe
ratu
re (d
egre
es F
)
2021 STATEWIDE TEMPERATURE MONTHLY TOTALS VS. NORMAL
Copyright © 2021 Board of Regents of the University of Oklahoma. Oklahoma Monthly Climate Summary 9
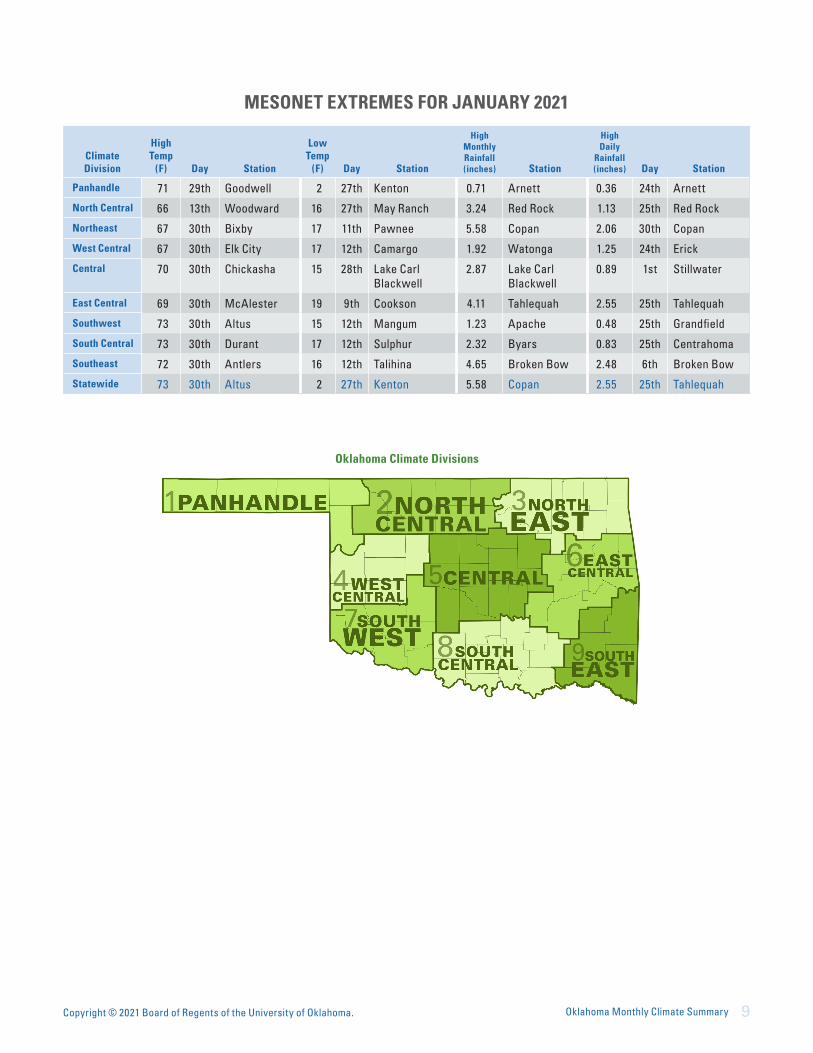
MESONET EXTREMES FOR JANUARY 2021
Climate Division
High Temp
(F) Day Station
Low Temp
(F) Day Station
High Monthly Rainfall (inches) Station
High Daily
Rainfall (inches) Day Station
Panhandle 71 29th Goodwell 2 27th Kenton 0.71 Arnett 0.36 24th Arnett
North Central 66 13th Woodward 16 27th May Ranch 3.24 Red Rock 1.13 25th Red Rock
Northeast 67 30th Bixby 17 11th Pawnee 5.58 Copan 2.06 30th Copan
West Central 67 30th Elk City 17 12th Camargo 1.92 Watonga 1.25 24th Erick
Central 70 30th Chickasha 15 28th Lake Carl Blackwell
2.87 Lake Carl Blackwell
0.89 1st Stillwater
East Central 69 30th McAlester 19 9th Cookson 4.11 Tahlequah 2.55 25th Tahlequah
Southwest 73 30th Altus 15 12th Mangum 1.23 Apache 0.48 25th Grandfield
South Central 73 30th Durant 17 12th Sulphur 2.32 Byars 0.83 25th Centrahoma
Southeast 72 30th Antlers 16 12th Talihina 4.65 Broken Bow 2.48 6th Broken Bow
Statewide 73 30th Altus 2 27th Kenton 5.58 Copan 2.55 25th Tahlequah
Oklahoma Climate Divisions

Copyright © 2021 Board of Regents of the University of Oklahoma. Oklahoma Monthly Climate Summary 10
Copyright © 2021 Board of Regents of the University of Oklahoma. Oklahoma Monthly Climate Summary 11
Oklahoma Climatological Survey is the State Climate Office for Oklahoma
Dr. Kevin Kloesel DirectorDr. Chris Fiebrich Associate Director
EDITOR Gary D. McManus State Climatologist
CONTENT AND LAYOUT ASSISTANTAndrea Dawn Melvin Outreach Coordinator
For more information, contact:Oklahoma Climatological SurveyThe University of Oklahoma120 David L. Boren Blvd., Suite 2900Norman, OK 73072-7305
TEL: 405-325-2541FAX: 405-325-7282E-MAIL: [email protected]: http://climate.ok.gov
OklahomaClimatological Survey
INTERPRETATION INFORMATIONMEAN DAILY TEMPERATURE: Calculated from an average of the daily maximum and minimum temperatures. Daily averages are summed for each day, and then divided by the number of valid data points – typically the number of days in the month. Although this November differ from the “true” daily average, it is consistent with historical methods of observation and comparable to the normals and extremes for stations and regions of the state.
DEGREE DAYS: Degree Days are calculated each day of the month for which there is a temperature report and the mean temperature for the day is less than (Heating Degree Days) or greater than (Cooling Degree Days) 65 degrees. Daily values are summed to arrive at a monthly total. HDD/CDD are qualitative measures of how much heating/cooling was required to maintain a comfortable indoor temperature. Missing observations November result in an artificially high or low value.
ADDITIONAL RESOURCESSUNRISE / SUNSET TABLESU.S. Naval Observatory: http://aa.usno.navy.mil/data
SEVERE STORM REPORTSStorm Prediction Center: http://spc.noaa.gov/climo/
National Centers for Environmental Information:https://www.ncdc.noaa.gov/stormevents/
SEASONAL OUTLOOKSClimate Prediction Center: http://www.cpc.ncep.noaa.gov/products/OUTLOOKS_index.shtml
CLIMATE CALENDARS AND OTHER LOCAL WEATHER AND CLIMATE INFORMATIONOklahoma Climatological Survey:http://climate.mesonet.org or http://climate.ok.gov/