oil&gas in europe today… and tomorrow? - european energy … · 29-11-2017 · source: iea...
TRANSCRIPT

Oil&Gas in Europe Today…And Tomorrow?
François-Régis MoutonIOGP Director EU Affairs
Rob JamesRegional Director EMEA, Oil Spill Response Limited
29 May 2018

2
Oil/gas exploration
& production
Refining Transport Marketing
Upstream
Business segment

Over 80 Members around the world
Map shows locations of Member Head Offices. Many operate globally3

EU Energy Mix in 2016
4
OIL 33%
WIND, SOLAR 3%BIOMASS,
BIOFUELS,
BIOGAS 10%
GAS 24%
HYDRO 2%
NUCLEAR
18%
COAL 5%
Oil & Gas – 57%
Source: IEA World Energy Outlook 2017, 2016 estimate

EU Energy Mix in 2040 - 1.7C°
5
Oil & Gas – 40%
Source: IEA World Energy Outlook 2017, Sustainable Development Scenario
OIL 16%
WIND, SOLAR 14%
BIOMASS,
BIOFUELS,
BIOGAS 19%
GAS 24%
HYDRO 3%
NUCLEAR 18% COAL 5%

6
FuelsEurope, 2017
The Role of
Oil Today
94% of EU transport is
fuelled by oil refined
products
1bn annual EU air
passengers
Used as raw material
for everyday products

7
The Role of
Oil Tomorrow
50-80% of EU Transport in
2040 (Source: IEA scenarios)
Doubling of global air
passengers to 7,8bn in
2036 (Source: IATA)
Increased use as non-
burnable feedstock for
insulation, plastics, etc.

8
The Role of
Gas Today
45% of heating in the EU
16% of power
generation
30% of energy/heat
used in industrial
processes
Enables
more renewables
in the grid
Energy Prices in 2017, News Release, 29 Nov. 2017
Full electrification of heating will not solve
Energy Poverty

9
The Role of
Gas Today
45% of heating in the EU
16% of power
generation
30% of energy/heat
used in industrial
processes
Enables
more renewables
in the grid
Dispatchable
Flexible
Large-scale
Intermittent
Zero-emissions
Small-scale
Reliable grids need to be flexible and responsive
Large-scale battery storage far from available
As share of renewables grows,
so will the need for flexible backup

Coal-to-Gas Shift
10
2015 EU Power Sector Emissions (MtCO2)*
3200
*Source: IEA WEO 2017
2015 EU Electricity Generation (TWh)*
6%
15.5%
2%
10.5%
27%
26%
13%
Oil Gas Coal Total power
emissions
2015
CO2
reduction
from coal-
to-gas
CO2
reduction
still required
by 2030
75%
75%
Coal = 26% of power generation but 75% of emissions
Coal to gas shift = cutting power gen. emissions by 44%
= 53% of remaining EU emission cuts required by 2030

Gas: ~4x Cheaper than Electricity
Energy Prices in 2017, News Release, 29 Nov. 2017
11
Full electrification of heating will not solve Energy Poverty

12
The Role
of Gas
Tomorrow
Clean energy with biogas
& hydrogen from gas
Affordable large-scale
storage & transport
of energy
Cost-efficient
deep decarbonization
Source: Energinet, Poyry
(~12 billion EVs)

© Copyright 2018. Oil Spill Response Limited.
Oil Spill Response Limited

© Copyright 2018. Oil Spill Response Limited. 14
Who we are
Largest international industry funded cooperative
Owned by major oil and gas production / transportation
companies
Providing resources to prepare for and respond to oil spills
efficiently and effectively on a global basis

© Copyright 2018. Oil Spill Response Limited. 15
OSRL - Proven Expertise
Corporate memory derived from over 30 years and 350 spills
Dedicated Technical Department to keep abreast of developments in oil spill response technology
In-house SME programme to provide a bank of resources for our preparedness and response teams to call upon.

© Copyright 2018. Oil Spill Response Limited. 16
Response Deliverables
18 response
team members*
~700m3 dispersants
Two aircraft (in SG and UK)
Access to 50 percent of
equipment by typeFree technical
advice (5x5)

© Copyright 2018. Oil Spill Response Limited. 17
Response Tools
Source control
Marine monitoring
and response
Shoreline
Subsea Well
Intervention
Surveillance
and monitoring
Dispersant
Application
In-situ Burning
Surface
Containment and
recovery
Shoreline survey
and clean-up
Oiled wildlife
response

Europe: Still an E&P Hotspot
18
Cautious but Optimistic – Objective is to preserve efficiency gains

50% of EU gas demand is currently supplied by EU28 + Norway
Over 6000bcm of known and potential resources
Enough to cover 50% of EU demand for over 25 years
19
European Gas Resources

European Oil Resources
32.5 bnboe of known and potential resources.
Enough to sustain current oil production levels for 13 years to 26 years.
20
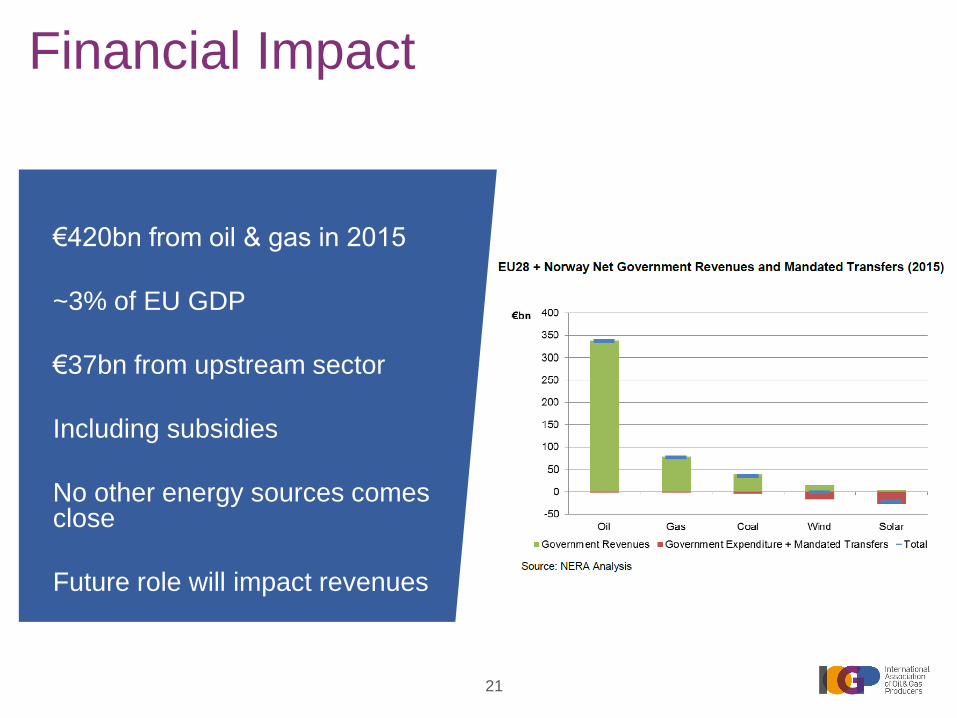
Financial Impact
€420bn from oil & gas in 2015
~3% of EU GDP
€37bn from upstream sector
Including subsidies
No other energy sources comesclose
Future role will impact revenues
21

Producing oil & gasin Europe means
• 30% lower
environmental impact
• €37bn in government
revenues from
upstream sector
• Domestic supply =
competitive
advantage
22
• Improve our own
energy efficiency
• Reduce methane
emissions further
• Find solutions
applicable to other
industries
We will strive to

For more information please contact:
www.iogp.org
Registered Office
City Tower
40 Basinghall Street 14th Floor
London EC2V 5DE
United Kingdom
T +44 (0)20 3763 9700
F +44 (0)20 3763 9701
Brussels Office
Bd du Souverain,165
4th Floor
B-1160 Brussels
Belgium
T +32 (0)2 566 9150
F +32 (0)2 566 9159
Houston Office
16225 Park Ten Place, Suite 500
Houston, Texas 77084
United States
T +1 (713) 338 3494
François-Régis Mouton
Director EU Affairs