oil prices, exchange rates and
TRANSCRIPT


Oil Prices, Exchange Rates andthe U.S. Economy:
An Empirical InvestigationBharat Trehan*
Tn general, research on the impact ()j6ilprice shocks on the U.S.economy has assumed that oil price changes are exogenous - determined almost exclusively by the actions ofOPEC. This paper uses vectorautoregressions to demonstrate that the foreign exchange value of thedollar has a substantial impact on the price ofoil. Thus, the practice ofusing changes in the dollar price of oil as a measure of the underlyingsupply shocks is likely to exaggerate the effects of exogenous oil pricechanges.
Research on the effects of oil supply shocks onthe United States' economy has assumed thatchanges in the price of oil are exogenous, determined largely by the actions of OPEC. Significanthistorical episodes seem to support this assumption.For instance, oil prices. approximately tripled inboth 1973 and 1979 as a result of OPEC's decisionto curtail the supply of oil. This assumption ofexogeneity is critical, because it permits researchersto associate changes in the price of oil with shocksto its supply. Researchers can then determine theeffects of a shock to the supply of oil simply bylooking at the response of the economy to a changeinthe price of oil.
In this paper, we demonstrate that it is incorrect totreat all changes in the dollar price of oil asexogenous. More specifically, we show that theforeign exchange value of the dollar has a substantial impact on the dollar price of oil. This result hasimportant implications. First, exclusion of theexchange rate in any study of the impact of oilsupply shocks will lead to incorrect estimates of theeffect of oil price changes on the economy sincesome of the effects of exchange rate changes will beattributed to oil price changes. Second, the existence ofexchange rate effects implies that changes
* Economist, Federal Reserve Bank of San Francisco.
25
in the price of oil cannot always be associated withexogenous supply shocks but must be recognized asthe result of a mix of factors. Thus, changes in theprice of oil should not be used as a measure ofsupply shocks.
We examine these issues using a statistical technique known as vector autoregressions (VARs). Thisapproach is "atheoretical" in the sense that it doesnot use economic theory to impose any restrictionsupon how different variables should interact withone another. In addition, it treats all variables asdetermined within the system itself - a featurewhose importance will be evident below. This technique is well-suited for the issues at hand becauseshocks to oil supply affect the economy throughseveral channels (see the discussion in Section II).Because of the multiplicity of channels and the lackof prior knowledge about their relative importance,the more conventional technique of placing specificrestrictions upon the ways that a supply shock willaffect the economy is likely to distort the empiricalresults.
A number of previous empirical studies haveexamined the relationship between oil price changesand the U. S. economy using VARs but none of themtake the exchange rate into account. 1 For instance,Hamilton (1983) showed that the price of oil haspredictive power for real GNP, the GNPdeftator,and a host of other variables, butthatthe oil price is

not affected by them. His results suggest that oilprice changes are determined by considerationsexternal to the U.S. economy, and that oil priceincreases have contributed significantly to businesscycles in the U.S. in the post World War IIperiod.2 ,3 Burbidge and Harrison (1984) also present evidence supporting the view that oil priceshave had a significant impact upon both industrialproduction and the consumer price index in the U.S.
Below, we present some empirical evidence onthis issue. Section I focuses on the relationshipbetween the exchange rate and the price of oil. It
contains a discussion of why changes in the value ofthe dollar will have an effect on the price of oil, aswell as some empirical tests of this relationship,Section II then demonstrates how the measuredimpact ofoil price changes on the U,S. economy issensitive to the inclusion of exchange rates. In thatsection, we first discuss what economic theory tellsus about the impact of oil price shocks on theeconomy and what the historical experience hasbeen in terms of both oil supply shocks andexchange rate changes. Empirical results follow.Section III contains the conclusions.
Quantity0 .....-------........---
Price
will discover that the price of oil in terms of theirown currencies has declined. Consequently therewill be a contraction in the quantity ofoil supplied atthe prevailing dollar price.4 In the diagram above,this is shown as a leftward shift in the supply curvefor oil. To equate demand and supply, the dollarprice of oil will then increase from Po to Pl' In thesame way, increases in the value of the dollar wouldsetinto motion declines in the dollar price of oil.
There are, of course, other factors that determinethe price of oil. The ability of the members of OPECto act in concert was the primary reason that oilprices approximately tripled in both 1973 and in
I. The Dollar and Oil Prices
The Effect of aDecline in the Value of theDollar on the Price of Oil
Crude oil traded in world markets is priced indollars, This fact has important implications for therelationship between the value of the dollar and theprice of oil because oil importers who do not use thedollar as currency must, in effect, obtain dollars topurchase oil. Thus, if the value of the dollarchanges, the price they pay in terms of their owncurrencies will change. For similar reasons, oilexporters will also not be indifferent to fluctuationsin the value of the dollar.
To understand the way in which a change in thevalue of the dollar affects the price of oil, considerthe figure below. Assume that the curve labeled Dorepresents the demand for oil by the oil importersand the curve labeled So represents oil supply. Theworld market for oil is then at equilibrium when theprice of oil is $Po per barrel.
Now suppose that the dollar falls in value againstthe currencies of other oil-importing nations andagainst the currencies of the oil exporters. If thedollar price of oil remains unchanged, the other oilimporting countries will find that the price of oil interms of their own currencies has declined. Consequently, their consumption ofoil will go up. In termsof the diagram, the demand curve for oil willshift to the right. It is worth pointing out that thisincrease in demand at an unchanged dollar priceoccurs only because oil is priced in dollars. If oilwere priced in yen, for instance, a decrease in thevalue of the dollar would actually lead to a decreasein the U.S. demand for oil. The demand for oil byother oil-importing countries would not be affected.
A change in the value of the dollar affects thesupply of oil as well. If the dollar falls, oil exporters
26

1979. The preceding discussion i~ not meant to denya role to OPEC, but to point out a role for the dollar.For instance, it is difficult to believe that OPEC doesnot take the value of the dollar into account whensetting the dollar price of oil.
The discussion above has shown how changes inthe value of the dollar affect the price of oil. Whilewe have not discussed what factors influence thevalue of the dollar itself, this should not be taken toimply that the dollar is immune to developments inthe U.S. and the rest of the world. In fact, the dollarreacts to factors such as differences in the rate ofinflation between the U.S. and the rest of the world,interest rate differentials, and shocks to productivity. For example, many economists contend that animportant reason for the depreciation of the dollarduring the two periods 1971-72 and 1978-79 wasthe relatively loose monetary policy being followedby the U.S. during those years.
The Empirical Relationship
We now present some empirical evidence on therelationship between the dollar and the price of oil.
We use the multilateral trade-weighted nominalexchange rate constructed by the Federal ReserveBoard as our proxy for the value of the dollar. 5 Thisis not the precise empirical counterpart to theexchange rate in the discussion above. Theexchange rate relevant to world oil demand wouldperhaps be one that used oil imports as weights.However, the data necessary to construct such anindex is not readily available. Moreover, our resultsmay notbe very sensitive to the choice of index.6
Consequently, the trade-weighted exchange rate isused here.
The measure of the oil price is the crudepetroleum component of the producer price index.This measure is probably the most relevant to bothreal activity and inflation in the U.S. Both theexchange rate and the oil price measures have alsobeen widely used in previous research on the U.S.economy.
Before examining the statistical relationshipbetween oil prices and exchange rates, it seemsuseful to look at how the two variables have behavedover our sample period. Chart 1 shows the relation-
Oil Price ...
Chart 1Quarterly Growth Rates* of the Nominal
Exchange Rate of the Price of Oil
8
4
Percent
16
12
-4
- 85657 59 61 63 6567 69 71 73 75 77 79 81 83 85
*3-quarter moving averages of the first difference of logs.
27

28
29

ship between the growth rate of the oil price and theexchange rate using quarterly data from the secondquarter of 1956 to the fourth quarter of 1985. Threequarter moving averages have been used in the chartto smooth out fluctuations.
The chart shows that the price of oil was muchmore stable in the fixed exchange rate period than inthe floating exchange rate period. Growth rates ofboth the exchange rate and the price ofoil were close
to zero prior to 1970 but have been much morevolatile since then. In addition, both periods ofextended drops in the dollar (approximately theperiods 1970-73 and 1977-79 in the chart) werefollowed by substantial increases in the price of oil- the two oil price"shocks" - while the appreciation of the dollar in the first half of the eighties hasbeen accompanied by falling oil prices. This patternof co-movement between these two variables is
30
what the analysis above would suggest.The increase in the volatility of oil prices in the
floating rate era is one piece of evidence supportingour hypothesis. Stronger confirmation is providedby· the fact that periods of dollar depreciation havebee.u followed by increases in the dollar price of oil,while an appreciation of the dollar has been followed by decreases in the dollar price of oil.
Results from VARsWe now employ VARs to present some formal
evidence for our hypothesis.? The results of theestimation are in Table lAo They reveal that theexchange rate has predictive power for the price ofoil, while the oil price is not very useful in predicting exchange rates. Approximately halfof the variation in oil prices is unpredictable on the basis of pastvalues of the exchange rate and the price of oil.
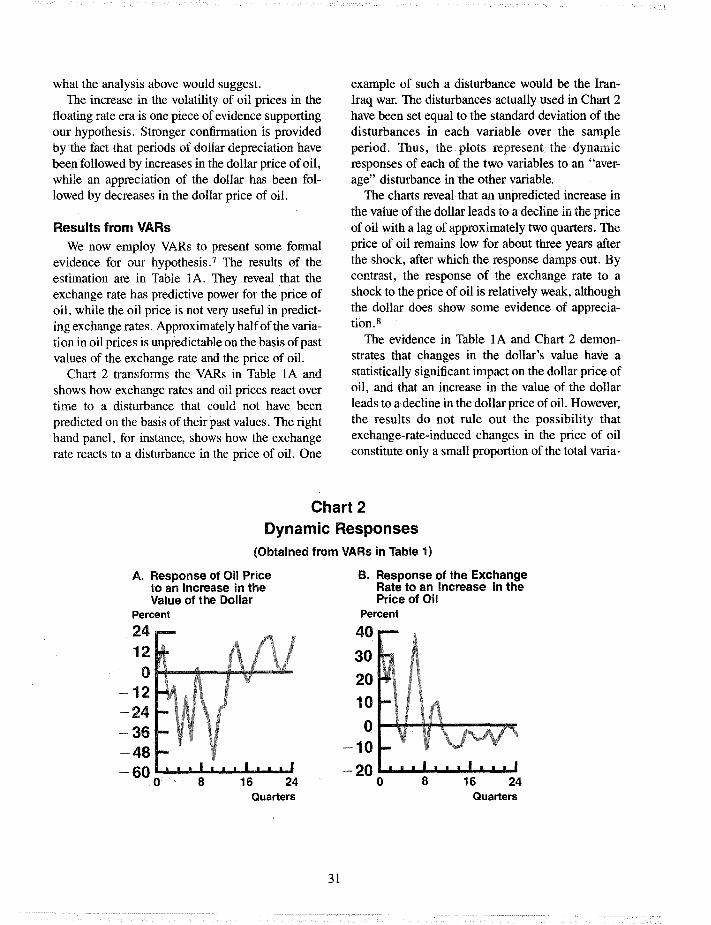
Chart 2 transforms the VARs in Table lA andshows how exchange rates and oil prices react overtime to a disturbance that could not have beenpredicted on the basis of their past values. The righthand panel, for instance, shows how the exchangerate reacts to a disturbance in the price of oil. One
example of such a disturbance would be the IranIraq war. The disturbances actually used in Chart 2have been set equal to the standard deviation of thedisturbances in each variable over the sampleperiod. Thus, the plots represent the dynamicresponses of each of the two variables to an "average" disturbance in the other variable.
The charts reveal that an unpredicted increase inthe value of the dollar leads to a decline in the priceof oil with a lag of approximately two quarters. Theprice of oil remains low for about three years afterthe shock, after which the response damps out. Bycontrast, the response of the exchange rate to ashock to the price of oil is relatively weak, althoughthe dollar does show some evidence of appreciation. 8
The evidence in Table lA and Chart 2 demonstrates that changes in the dollar's value have astatistically significant impact on the dollar price ofoil, and that an increase in the value of the dollarleads to a decline in the dollar price of oil. However,the results do not rule out the possibility thatexchange-rate-induced changes in the price of oilconstitute only a small proportion of the total varia-
Chart 2Dynamic Responses
(Obtained from VARs in Table 1)
16 24Quarters
A. Response of Oil Priceto an Increase in theValue of the Dollar
Percent
2412o
-12-24
36-48- 60 0....&...&........8.........a...&....
161..1o..&...&...24
Quarters
31
B. Response of the ExchangeRate to an Increase in thePrice of Oil
Percent
40302010
o-10- 20 ......................,L",I,........I..I..IU
o 8

tion inthepriceof oil over the sample period. ToeXamine this issue, consider the results in Table 1B.Disturbances .to •the exchange rate account for aprogressively greater proportion of the variance oftheerfoririforecastirigtheprice of oil. At thetwenty-quarter horizon, for instance, exchange ratedisturbances account for 42 percent of the forecasterrpr "arian~~?f?ilprice~.9These results imply thatshock.s to the exchange rate have been an importantsourceof'variationsin the price of oil over thesample period.
Sin.ceexchange rate changes account for a substantial proportion of the changes in oil prices overthe period sampled, it is natural to wonder about therole played by exchange rate changes during particular episodes within the period. More specifically, how much of the two oil price shocks of the1970s can be predicted on the basis of past changesin exchange rates alone?
To answer this question, the growth rate of oilprices was regressed on past growth rates of theexchange rate. 10 Chart 3 shows the growth rate of oil
prices and the fitted values obtained fromestimatingthe equation over 1959Q2-1985Q4. The equationtracks changes in the growth rate of oiL pricesreasonably well. It reveals that oil prices would havebeen expected to increase over the periods(1973-74and 1978-81 on the basis of the relationship betweenoil prices and exchange rates alone. Needless to say,the equation does not explain the entire increase inoil prices during those periods. The equation alsosuggests that oil prices should have deCliriedbverthe period 1981-1985.
A common criticism of exercises of this. sort isthat the estimated equation has simply correlatedchanges in the two variables. Consequently, whilesuch an equation provides a reasonable fit over thesample period, it is not likely to perform very well inexplaining events beyond the period over which itwas estimated. To test this proposition, the sameequation was estimated from 1959Q2 to 1978Q4,that is, up to the year before the second "oilshock".11 The coefficients from this equation andthe actual values of the exchange rate from 1979Ql
Chart 3Actual and Fitted* Values of the Growth
Rate of the Price of OilPercent
40
30Actual--
20
10
73 75 77 79 81 83 85
Fitted values obtained by regressing oil price on lagsof exchange rate only.See footnote 10 for details.
32
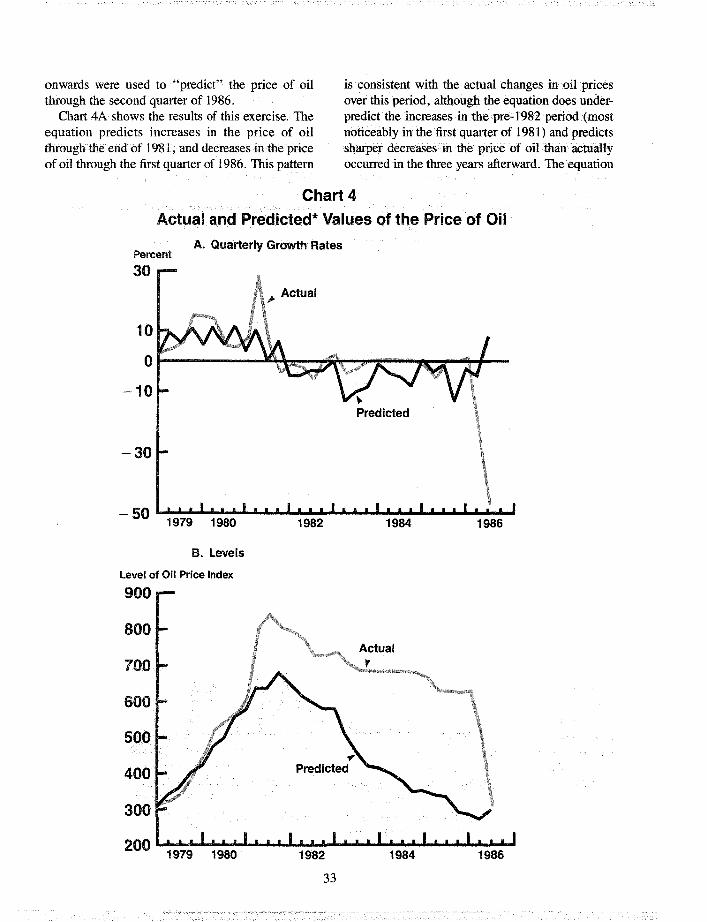
onwards were used to "predict" the price of oilthrough the second quarter of 1986.
Chart 4A shows the results of this exercise; Theequation predicts increases in the price of oilthrough the end of 1981, and decreases in the priceof oil through the first quarter of 1986. This pattern
is· consistent with the actual changes in oil pricesover this period, although the equation does underpredict the increases inthepre--1982 period (mostnoticeably in the first quarter of 1981) and predictssharper decreases irlthe price of oil than actuallyoccurred in the three years afterward. The equation
Chart 4
Actual and Predicted* Values of the Price of Oil
~ Actual
A. Quarterly Growth RatesPercent
30
-30
10
OI-------I~~-J'I!Sn-..,..~-__,...iIIII:-I~
-10
-50 1979 1982 1984 1986
B. levels
level of Oil Price Index
900
800
700
600
500
400
300
2001979 1982 1984 1986
33

also misses the large fall in oil prices in the secondquarter of 1986, when it predicts a small increase.
Chart 4B transforms these results to express themin terms of the level of oil prices. The predictedva.llles track the actual price of oil quite closely untilthe fourth quarter of 1980, but miss the largeincrease that took place in the first quarter of 1981.It is perhaps significant that the Iran-Iraq war beganin September 1980. The equation correctly predictsdeclining oil prices from the third quarter of 1981onwards, but a faster pace of decline than whatactually occurred. The large drop in oil prices that
took place over the first half of this year actuallybrings oil prices back into line with those predictedby the equation.
While these results should not be interpreted toimplythat the exchange rate is the only variable thatmatters for the price of oil, they do offer strongevidence that the exchange rate is an importantdeterminant of oil prices. Since it is well-known thatthe exchange rate itself is influenced by a host ofdevelopments both in the V. S. and abroad, theresults imply that oil price changes cannot always beregarded as exogenous to economic developments.
II. Oil Prices and Economic ActivityThe results demonstrating that changes in the
exchange rate have a substantial effect on the priceof oil have, in tum, important implications forstudies that attempt to estimate the impact of oilsupply shocks on the V.S. economy. They imply,first, that studies that omit exchange rates willmismeasure the impact that oil supply shocks haveon the economy since some of the impact ofexchange rate changes will be attributed to oil pricechanges. Second, they imply that it is incorrect touse changes in the price of oil as a measure of theunderlying supply shock because some of theseprice changes are caused by other factors. Thus,studies that attempt to analyze the effects of oilsupply shocks must first isolate the component ofoilprice changes that is not due to these factors. Beforeproceeding to an empirical examination of theseissues, we review the channels through which ashock to the supply of oil will affect the economy.
Effects of Oil Supply ShocksAlong with labor and capital, energy is an input
to the production process. Oil in tum is an importantcomponent of total energy sources. An increase inthe price of oil due to an OPEC shock to supply willforce business firms to economize on the use of oil.Since close substitutes for oil are not readily available, this will lead to a reduction in energy input anda consequent decline in aggregate supply.
There will be other effects as well. Analysts haveoften likened exogenous increases in the price of oilto a tax increase for consumers that leads to areduction in demand. An increase in the price of oil
34
also redistributes income between the V .S. and therest of the world because the V. S. is a net importerof oil. Within industry, profits are redistributed fromoil-consuming to oil-producing firms.
The last effect reveals an aspect that is potentiallyimportant when trying to determine the net impactof oil supply shocks on economy-wide output. Justas oil consuming industries react to an exogenousincrease in the price of oil by reducing output,industries involved in the production of oil will reactby increasing output. They do so because the higherprice of oil makes it profitable to engage in bothexploration and drilling for oil in locations where itwas previously unprofitable to do so. An increase inthe level of activity by firms directly engaged in theproduction of oil leads, in tum, to increased production in industries that supply these firms with inputs.Similarly, an exogenous decrease in the price of oilwill force a contraction in the output of industriesinvolved in producing oil.
Thus, the overall effects of any exogenous changein the price of oil on real output will depend uponthe relative magnitude of the effects on the oilconsuming and oil-producing sectors. While previous research has focused upon the impact ofexogenous oil price changes on oil-consuming sectors of the economy, recent evidence suggests thatthe impact upon the oil-producing sector may besubstantial as well. In particular, experience overthe short period since the oil price decline in early1986 suggests that the immediate impact on oilproducers may be large enough to outweigh theimpilct on oil consumers.

These considerations imply that using theoryalone to predict the exact response of aggregateoutput to an exogenous change in the supply of oilwould lead to a somewhat ambiguous answer. Incontrast, the effect on the •price .level. is •unambiguous. An exogenous reduction in the oil supplyleads to an increase in the priceafoil and in theaggregate price level. (It is this increase in the priceofail that causes domestic oil producers to increasetheir output.)
We have contended that the omission ofexchangerates will bias the measured impact that oil pricechanges have on the economy. To see what theprecise effects will be, it is necessary to examinewhat economic theory tells us about the impact ofexchange rate changes on the economy. Recall,first, that the sample period of this study includestwo episodes of sharp increases in the price of oil.Oil prices almost tripled in 1973 and then again overthe 1979-81 period. As Chart 1 indicates, bothepisodes were preceded by declines in the value ofthe dollar. The proximity of these dollar declinessuggests that omitting the effects of the exchangerate changes would exaggerate the effect of oil priceshocks.
For instance, theory tells us that an increase in thevalue of the dollar will lead to lower inflation. Ahigher dollar implies that the price of U.S. importsdeclines and that domestic producers must lowerprices on goods sold in the U.S. In addition, ifdomestic producers are to remain competitive inworld markets, they must reduce export prices aswell. Similarly, when the dollar falls, the price ofimports goes up. In addition to the direct impact onthe price level, a decline in the dollar's value alsoallows domestic producers to raise prices on products that compete with imports. For our purposes,this implies that ignoring exchange rate effects willlead one to attribute the inflation that followed thedollar's depreciation in both the early and late 1970slargely to the oil price increases. 12
Empirical.ResultsWe now tum to a discussion of the formalempiri
cal tests. InTable 2,we examine whether changes inthe price of oil help predict changes in real output.To isolate the role played by different variables, wepresent a series of VARs. The first VAR looks at the
35
relationship between real GNP and the price of oilalone and indicates that the price of oil is extremelysignificantin predicting real GNP. The reverse istrue as well, that is, real GNP predicts the price ofoil..Similarly, in the systemconsisting ofoil pricesand the GNP deflator, both variables "cause"·eachother.· These conclusions hold up in the three-variable system as well, although in not as strong aform..The results reported in· these VARson theeffect of oil prices on both real GNP and the pricelevel are essentially similar to what has beenreported in earlier studies.
To test our major hypothesis, we added theexchange rate to the VAR. The result of this additionis that the price of oil is no longer significant atconventional statistical levels in predicting real output. This finding is consistent with our discussionabove since it demonstrates that the significance ofthe measured impact of oil price changes on realoutput depends on whether exchange. rates areincluded in the VAR. While oil prices are stillsignificant in .predicting the GNP .det1ator, thedynamic response functions show that their impactis considerably smaller once exchange rates areincluded. These results are discussed below. Table 2also reveals that both real GNP and the exchangerate provide information about future values of theprice of oil.
A problem in interpreting the results above is thatthe dollar is a financial asset. Since financial markets react to new information much more rapidlythan goods markets, results from causality testsoften show that financial market variables haveconsiderable predictive power for other variables inthe model. (See Sims, 1982, for a discussion of thisissue and an example.) Thus, it is possible. that theexchange rate is significant in the ;)hove equationsb¢cause it is "picking up" information about thefuture course of events in the economy.
In Section I, we showed that changes in the valueof the dollar predict a reasonable p¢rcentageof theoil price increases in both 1973 and 1979. •Thisresult suggests that the relationship between thedollar and oilprices is not due to the anticipation byass.et markets ofincreases in the price ofoil becauseit is generally agreed that the dollar's depreciationprior to both these. episodes was due to factors suchas the difference between.the policy stance of the

United States and other industrialized countries.As a formal test of whether the exchange rate is
falsely significant in the above equations, wereplaced the exchange rate by the Standard andPoor's 500 stock price index in the VAR. Thechange does not alter the significance of the oil pricevariable in the real GNP equation at all (that is, itremains the same as in the three-variable VAR). Nordoes the stock price index predict changes in theprice of oil. 13
As a final check, the last system shown in Table 2adds the Standard and Poor 500 stock index to theVAR that also contains the exchange rate. If theexchange rate were significant only because thedollar is a financial asset, this experiment should
reduce its predictive power. Table 2 reveals that theaddition of the S&P index does not materially alterthe significance of the exchange rate. 14 Together,the results from these tests suggest it is unlikely thatthe exchange rate is significant in the VAR simplybecause it is acting as a proxy for developments inthe financial market.
The different VARs reported above appear torepresent robust results. Slope dummies were usedin order to test for stability. For each variable on theright-hand side of a given equation, another variablewas created that takes the value of that particularvariable up to 1973Q1 and zero after that. Thesenew variables were then included in all equations inaddition to the original variables.
36

If the relationships under study changed betweenthe periods 1959Q2-1973Q1 and 1973Q2-1985Q4,then including these variables would significantlyalter the pattern of unpredicted changes in the variables (such as real GNP and oil prices) whosebehavior is being explained. The tests show thatthere is no significant difference between the twoperiods for either the five-variable system or thefour-variable system (which contains real GNP, theGNP deflator, the exchange rate, and the oil price).
However, when the exchange rate is dropped fromthe VAR, the test reveals a significant differencebetween the two periods. A second test involving anexamination of the individual equations shows thatthe source of this difference lies in the oil priceequation. This finding implies that there is a significant difference in unpredictable oil price changesbetween the two periods if exchange rates areexcluded from the oil price equation but not whenthey are included.!S
We now examine the responses of output and theprice level to an oil price shock. Chart 5 shows howthe responses of both these variables change whenthe exchange rate is included in the system. In the
left-hand panel, we show that the effect of anincrease in the price of oil on the GNP deflatorbecomes noticeably smaller once the exchange rateis included in. the VAR. In particular, including theexchange rate •. reduces both. the magnitude of theinitial impact and the duration of the effect. Theresponse of real GNP to an oil price shock changesin a similar manner. That is, including the exchangerate in theVAR reduces both the size as well as theduration of the real GNP response to an oil priceshock. (Notice also that in the system excluding theexchange rate, an oil price shock leads to a contemporaneous increase in real GNP. This anomaly isremoved when the exchange rate is added to thesystem.)
It is interesting to examine the implications ofthese results for specific episodes such as the1973-1975 period of oil price increases. Using twoof the VARs shown in Table 2, we examine theimpact on real GNP.
Chart 6A shows the forecasts we would havemade using the three-variable system containingreal GNP, the GNP deflator, and the price of oil withthe model used to generate these forecasts estimated
o
-20
- 30 .......L;"L.I....................................
o 8 16 24Quarters
-10
16 24Quarters
8
Chart 5Dynamic Effects of an Increase in the Price of Oil
(Obtained from VARs in Table 2)
A. Response of the GNP Deflator B. Response of Real GNPPercent Change Percent Change
50 1040
302010O....--~---,.
-100
37

Chart 6Actual and Forecast Real GNP Growth*
Growth Rate* (Percent)
42 31975
1
Pure Forecast,
A. Forecasts From the Three-Variable VAR
- 2 .....__.......-.I_......_ ............_ ...__.a-......to........................
01 2 3 4 1 2 3 41973 1974
-1
~
Pure ForecastPlus Oil FromChart Above
Actual....
Pure Forecast andExchange Rate
~
B. Forecasts From Four-Variable VAR
2
1
Growth Rate* (Percent)
3
-1
- 20..1-....2-.....3--4""-.....1..........2--3..........14..........1--2..........3-.....14
1973 1974 1975*Growth Rates are measured quarter over quarter.
38

using data up to 1985Q4. The line labeled "PureForecast" is the real GNP we would have predictedbefore any data for 1973 becameavailable. The linelabeled "Pure Forecast Plus Oil" adds the effects ofthe oil price shocks.. We see that including the oilprice shocks improves the forecast, .1ll0st noticeably during the fourth quarter of 1974 and the firstquarter of 1975 when real GNP was contracting.
Chart 6Bshows the results from a similar exerciseusing the four-variable system consisting of realGNP, the GNP deflator, the price of oil, and theexchange rate. The line labeled "Pure Forecast PlusOil" shows what we would have predicted at the endof 1972 had we known the behavior of oil pricesover the next two years. The continuous line isreproduced from Chart 6A for comparison. Comparing the two lines reveals that the effect of the oilprice shock on real GNP growth is smaller in thefour-variable system, most noticeably in the firstquarter of 1975. The smaller impact is due tounpredictable exchange rate changes, captured inthe line labeled "Pure Forecast Plus ExchangeRate." This outcome supports our contention that
omitting the exchange rate will cause the. effect ofexchange rate changes to be attributed to changes inthe price of oil.
To obtain an idea of how much of the totalvariation in.both real GNP and the price level overthe.entire sample period is due to oil price sho(':ks,consider the results shown in Tables 3 and 4.Table 3shows the results for real GNP. Once again, we firstconsider a system consisting.of only real GNP. andthe price of oil and successively add the GNPdeflator and the exchange rate.
While disturbances to the price of oil have arelatively large impact on real GNP when only thesetwo variables are included in the VAR, the additionof other variables noticeably reduces their explanatory power. The results for the GNP deflator in Table4 tell a similar story. Oil price disturbances doaccount for a relatively large percentage of thevariance of the error made in predicting the GNPdeflator in the first two systems. However, addingthe exchange rate lowers their relative importance.
The results reported here maximize the roleplayed by oil price shocks because only oil price
39

shocks are allowed to affect everything else in theVAR contemporaneously. Removing the restrictionon other variables noticeably reduces the responseofboth real GNP and the deflator to oilpriceshocks,especially when the exchange rate is included in theVAR. The effects of an oil price shock are alsosusceptible to an increase in the lag length used inthe VAR. For instance, an increase in the number oflags in the VAR from 4 to 8 causes the real GNPresponse to an oil price shock to become even
40
smaller (while the real GNP response to anexchange rate shock becomes somewhat larger). 16
Finally, while the results are not shown, disturbances. to the. exchange rate account fora relativelylarge proportion of the variance of the oil priceforecast error in the larger systems as well. Forexample, in the four-variable system, the percentageof. the oil price forecast error variance due toexchange rate disturbances is 38 at the ten-quarterhorizon and 40 at the twenty-quarter horizon. 17

m. Interpretation and ConclusionsThe empirical results in Section I above demon
strate that changes in the value of the dollar have asubstantial impact upon the dollar price of oil.However, we must emphasize that the estimatedequations do not explain all the variation in oilprices over the period studied. The results do notimply that OPEC was unable to increase oil pricesabove what they otherwise would have been. Theydo suggest that the dollar price of oil would haverisen in the 1970s as the dollar depreciated andwould have fallen in the 1980s as the dollar appreciated even without the existence of OPEC. Thiscontradicts the common view that changes in theprice of oil are generally exogenous. Such a viewmay have resulted from an excessive focus on therole of OPEC in setting oil prices and the belief thatOPEC's decisions are made independently of economic developments.
The analysis suggests that a considerable proportion of the changes in the price of oil during the socalled oil price shocks were simply discontinuousprice adjustments to changes in the economicenvironment. This discontinuity is probably theresult of the cartel's mode of operation, which hasbeen one of making large adjustments in outputwhile adhering to a pre-announced dollar price.
Of particular interest in this context was the steepfall in oil prices in early 1986. While disagreementswithin the cartel were the proximate cause of thelarge decline in prices, it is likely that the appreciation of the dollar until early 1985 played an important part. The appreciating dollar tended to reducenon-U.S. demand for oil while increasing supplyfrom countries other than OPEC. Since OPEC wastrying to maintain a constant dollar price of oil, itwas forced to make large reductions in output.Disagreements about how these reductions in outputwere to be allocated led to a collapse in OPEC'sagreements. In all likelihood, the output reductionsforced upon the cartel would have been smaller inthe absence of the dollar's appreciation.
Viewed differently, the evidence (especiallyChart 4) suggests that, during the early 1980s, thecartel succeeded in keeping prices above what thehistorical relationship between exchange rates and
41
oil prices would suggest. However, pressures thatarose from doing so led to abreakdown of the cartel.The large oil price decline in early 1986 thenbrought prices back to more "normal" levels.
While our analysis ignores other factors that mayaffect the price ofoil, our interpretation is consistentwith the behavior of other commodity prices. Ingeneral, commodity prices have been decliningsince the dollar began to appreciate. Were it not forthe cartel, oil prices probably would have declinedsignificantly more prior to 1986.
The relationship between oil prices and the valueof the dollar is the basis for questioning studies thatpurportedly measure the impact of oil price shockson the economy while ignoring either the impact ofthe exchange rate on the price of oil or the impact ofthe exchange rate on the economy. In Section II, wedemonstrated that once the exchange rate is takeninto account, changes in the price of oil no longerhave a significant impact on real GNP. An examination of the 1973 "oil shock" episode also revealsthat omitting the exchange rate exaggerates thecontraction in real GNP following the oil priceincrease. Furthermore, the results in Table 3 suggestthat output variations induced by oil price changeshave not constituted a large proportion of the totalvariation in real output over the sample period as awhole. Taken together, this evidence suggests thatthe large decline in oil prices in the beginning of1986 is not likely to provide as big a boost to realGNP as would be predicted on the basis of previousstudies.
Finally, the results in Section II also show thatinclusion of the exchange rate in the VAR reducesthe impact of changes in the oil price on the GNPdeflator. Most noticeable is the reduction in thelength of time for which oil price changes continueto have an effect on the price level. Apparently, theeffect of oil price changes is concentrated in the firstfew quarters following an oil price shock. Thisfinding reinforces our point that omitting theexchange rate causes the oil price variable to pick upthe inflation that may actually have been due to thedollar's depreciation.

FOOTNOTES1. Structural models that take the exchange rate intoaccount when studying the effects of oil shocks on theeconomy assume that the price of oil is determinedexogenously (which is halfway between including andexcluding exchange rates in the corresponding VAR). Anexception is Hooper and Lowrey (1979), which studies theimpact of exchange rate changes under two alternativeassumptions: first, that exchange rate changes have noimpact on the price of oil, and second, that half of the oilprice increase in 1979 was due to the fall in the value of thedollar.
2. In view of the results to follow, it is interesting that hefound that the price of imports (which reflects the value ofthe dollar) had a significant impact on the price of oil andyet dismissed the finding as inconsequential.
3. Gisser and Goodwin (1986) build upon the"exogeneity" results of Hamilton, and use the price of oil ina reduced form, St. Louis-type equation to show that theprice of oil affects output, inflation, etc.
4. Oil exporters will be indifferent to changes in the valueof the dollar only if the entire proceeds from the sale of oilare used to purchase dollar-denominated products acondition that is hardly likely to be satisfied in practice.
5. An exchange rate index for the dollar measures thevalue of the dollar against a weighted average of a basketof currencies. A multilateral trade-weighted index uses theratio of a country's total trade (exports plus imports) to thetotal trade of all countries in the basket as weights.
6. It appears that alternative dollar indices will movetogether as long as changes in these indices originate fromchanges in the value of the dollar. However, the indices willmove differently if non-dollar currency realignments tendto be larger or more common. For our purposes, it isprobably sufficient that the dollar depreciation during theearly, as well as late 1970s, was not accompanied by largechanges in the value of nondollar currencies against eachother.
See Brown and Phillips (1986) for a study that uses oilconsumption weights to construct an index for the dollar.They show that an increase in the value of the dollar leadsto a decline in the dollar price of Saudi Arabian oil.
7. Sample size and data frequency were dictated by theavailability of exchange rate data. Data on the FederalReserve Board's trade-weighted exchange rate is available in quarterly average form starting in 1956.
All variables are included as the first difference of logs. AllVARs include a constant and a time trend. Lag lengthswere chosen as follows. I started with a specification of 12lags. A likelihood ratio test was then used to compare thiswith lag lengths of 4, 8 and 16 lags. (The test used isdiscussed in Sims 1980, and includes a correction for thenumber of explanatory variables in each equation.) For theVAR containing the price of oil and the exchange rate, thetests reveal that the 12-lag specification is different fromthe 4- and 8-lag specifications at the 1 percent level, but isno different from the 16-lag specification. The lag of 12quarters implies that estimation begins from 195902. Tokeep the results comparable, all other VARs are estimatedover the same period, even though each of them containsonly four lags o/each variable.
42
8. The moving average representations and the variancedecompositions shown here - and in the rest of the paper- have all been obtained by placing oil prices first andexchange rates last in the ordering imposed upon the errorterms. In other words, it is assumed that any shock common to oil prices and other variables in the VAR is dueentirely to a change in oil prices. This ordering will, ingeneral, maximize the role played by oil price shocks andminimize that of exchange rate shocks.
9. Placing exchange rates first in the ordering substantially increases the effect of exchange rate disturbances.Exchange rate shocks account for 33 percent of the forecast error variance of oil prices at the 5-quarter horizon, 51percent althe 1O-quarter horizon, and 54 percent althe 20quarter horizon. The effect of oil price shocks becomescorrespondingly and noticeably smaller. Oil prices shocksaccount for 5 percent of the forecast error variance ofexchange rates at the 5-quarter horizon, 11 percent at the1O-quarter horizon, and 11 percent at the 20-quarter horizon.
10. The first difference of the log of the price of oil isregressed on 12 lags of the first difference of the log of theexchange rate. The equation also contains a constant anda time trend. The R2 for the equation is .48, the adjusted R2is .41. The Standard Error is .041, and the Durbin-Watsonstatistic is 1.66.
11. The R2 from this exercise is .47, the adjusted R2 is .37.The Standard Error of the equation is .034 and the OW.statistic is 1.86.
12. Theory also tells us that a fall in the value of the dollarwill lead to an increase in output. However, the empiricalresults indicate that this increase is only temporary andthat it is followed by a contraction in real output.
While this result is counterintuitive, it has been reported byother researchers as well. Simulations with the Board ofGovernors MPS model suggest that a fall in the value of thedollar first raises real output but then reduces it, so that twoyears later, the level of real GNP is below its initial level. Animportant assumption in their simulation is that monetarypolicy remains unchanged. In our analysis, the results arenotsignificantly altered when the money supply is includedin the VAR.
13. When the S&P 500 is included (and the exchange ratedropped from the VAR), the oil price has a marginalsignificance level (M.S.L.) of .06 in the real GNP equation,which is the same as when the VAR contains only real GNP,the real GNP deflator, and the price of oil. The S&P 500 hasa M.S.L. of .11 in the oil price equation, .81 in the GNPdeflator equation, and .02 in the real GNP equation. In thevariance decompositions, the S&P 500 accounts for nomore than (a) 7 percent of the forecast error variance of theoil price; (b) 4 percent of the forecast error variance of theGNP deflator, and (c) 10 percent of the variance of realGNP, at forecast horizons up to 20 quarters.
14. The variance decompositions reveal that the share offorecast error variances explained by the S&P 500 is nomore than 4 percent for oil prices, 4 percent for the GNPdeflator, and 9 percent for real GNP at any forecast horizon. Inclusion of either the 1O-year or the 20-year Treasurybond rate also does not alter the significance levels of the

exchange rate in the VAR, although the long rates doexplain a considerable proportion of the GNP deflator'sforecast error variance, Finally, the nature of the results isunaffected by the inclusion of M1 in the VAR.
15, For the system stability tests, a likelihood ratio test,discussed in Sims (1980), was used, F,testswere carriedout on the individual equations, For the 5,variable systemin Table 2, the Chi,square statistic - calculated under thenull hypothesis of no change between the two periods had a marginal significance level of ,85, For the 4-variablesystem, the computed Chi-square has a marginal significance level of A 1, Finally, for the 3-variable system, thetest statistic has a marginal significance level of ,02, In thissystem, the oil price equation has a F(12,81) statistic of 2,5,which is significant at 5 percent
16, The effect of increasing the lag length is especiallynoticeable in an examination of the 1973 "oil shock" episode, While the impact of the change in oil prices in the3-variable VAR is more or less the same in both the 4 and 8lag versions, it becomes much smaller once the exchangerate is included, Specifically, knowledge of the oil priceshocks does not appear to be useful in "predicting" muchof the decline in real GNP over 197403-197501,
17, To test the robustness of this result with respect toother output and inflation measures, a system containingindustrial production and the producer price index wasalso estimated, While the oil price is significant at less thanone percent in the industrial production equation whenonly oil prices and industrial production are included, itsmarginal significance level increases to,76 when both theproducer price index and the exchange rate are added tothe system,
In the variance decompositions, the oil price variableaccounts for a maximum of 6 percent of the forecast errorvariance of industrial production even when it is placedfirst (in a four-variable VAR which included the exchangerate), With oil prices placed last, this number falls to 4percent In the same system, oil prices (when placed first)account for 13 percent of the variance of the error inpredicting producer prices in the contemporaneous quarter. This falls to 8 percent at the ten-quarter horizon, Whenoil prices are placed last, they account for more than 5percent of the forecast error variance of the PPI only once,
43
REFERENCESBrayton, F, and E, Mauskopf. "The MPS Model of the
United States Economy," Board of Governors of theFederal Reserve System, February 1985,
Brown, S,PA and K,R. Phillips, "Exchange Rates andWorld Oil Prices," Economic Review, Federal ReserveBank ofDallas, March 1986,
Burbidge, J, and A Harrison, "Testing for the Effects of OilPrice Rises Using Vector Autoregressions," International Economic Review, June 1984, pp, 459-484,
Cooley, T.F, and SF LeRoy, "Atheoretical Macroeconometrics: A Critique," Journal of Monetary Economics,November 1985, pp, 283-308,
Gisser, M, and T,H, Goodwin, "Crude Oil and the Macroeconomy: Tests of Some Popular Notions," Journalof Money, Credit and Banking, February 1986, pp,95-103,
Hamilton, JD, "Oil and the Macroeconomy Since WorldWar II," Journal of Political Economy, April 1983, pp,228-48,
Hooper, P, and B,R, Lowrey, "Impact of the DollarDepreciation on the U,S, Price Level: An AnalyticalSurvey of Empirical Estimates," Staff Studies 103,Washington: Board of Governors of the FederalReserve System, 1979,
Sargent, T,J, and CA Sims, "Business Cycle ModelingWithout Pretending to Have Too Much A Priori Theory," in CA Sims, ed" New Methods of BusinessCycle Research: Proceedings from a Conference,Federal Reserve Bank of Minneapolis 1977,
Sims, CA "Econometrics and Reality," Econometrica,1980, pp, 1-48,
Sims, CA "Policy Analysis With Econometric Models,"Brookings Papers on Economic Activity, 1: 1982,