oil price shocks
DESCRIPTION
Oil Price ShocksTRANSCRIPT
Journal of Comparative Economics 41 (2013) 1220–1239
Contents lists available at SciVerse ScienceDirect
Journal of Comparative Economics
journal homepage: www.elsevier .com/ locate / jce
Oil price shocks and stock market activities: Evidencefrom oil-importing and oil-exporting countries
0147-5967/$ - see front matter � 2012 Association for Comparative Economic Studies Published by Elsevier Inc. All rights reserved.http://dx.doi.org/10.1016/j.jce.2012.12.004
⇑ Corresponding author.E-mail addresses: [email protected] (Y. Wang), [email protected] (C. Wu), [email protected] (L. Yang).
1 See Bjørnland (2009) for a general literature review.
Yudong Wang a, Chongfeng Wu a,⇑, Li Yang b
a Antai College of Economics & Management, Shanghai Jiao Tong University, Fahuazhen Road 535, Shanghai, PR Chinab School of Banking and Finance, University of New South Wales, Sydney 2052, Australia
a r t i c l e i n f o
Article history:Received 20 May 2012Revised 4 October 2012Available online 4 January 2013
JEL classification:G12G15Q43
Keywords:Oil pricesStock marketsOil-importing and oil-exporting countriesOil demand shockOil supply shock
a b s t r a c t
Wang, Yudong, Wu, Chongfeng, and Yang, Li—Oil price shocks and stock market activi-ties: Evidence from oil-importing and oil-exporting countries
While the relationship between oil prices and stock markets is of great interest to econo-mists, previous studies do not differentiate oil-exporting countries from oil-importingcountries when they investigate the effects of oil price shocks on stock market returns.In this paper, we address this limitation using a structural VAR analysis. Our main findingscan be summarized as follows: First, the magnitude, duration, and even direction ofresponse by stock market in a country to oil price shocks highly depend on whether thecountry is a net importer or exporter in the world oil market, and whether changes inoil price are driven by supply or aggregate demand. Second, the relative contribution ofeach type of oil price shocks depends on the level of importance of oil to national economy,as well as the net position in oil market and the driving forces of oil price changes. Third,the effects of aggregate demand uncertainty on stock markets in oil-exporting countriesare much stronger and more persistent than in oil-importing countries. Finally, positiveaggregate and precautionary demand shocks are shown to result in a higher degree ofco-movement among the stock markets in oil-exporting countries, but not among thosein oil-importing countries. Journal of Comparative Economics 41 (4) (2013) 1220–1239.Antai College of Economics & Management, Shanghai Jiao Tong University, Fahuazhen Road535, Shanghai, PR China; School of Banking and Finance, University of New South Wales,Sydney 2052, Australia.� 2012 Association for Comparative Economic Studies Published by Elsevier Inc. All rights
reserved.
1. Introduction
Given the essential role of crude oil in the world economy, the impact of crude oil price shocks on economy has been amatter of great concern to economists since the seminal work of Hamilton (1983) (see, e.g., Barsky and Kilian, 2004;Hamilton, 1996, 2003; Hooker, 1996; Kilian, 2008, 2009; Kilian and Park, 2009). Nevertheless, most studies in the literaturehave paid attention to the economy of the US, the largest oil importer, rather than those of oil-exporting countries. A possibleconcern is that the impact of oil price shocks on the national economies of oil-exporting countries can be different from thoseof oil-importing countries. For example, while the linkage between oil price and macroeconomic activities has been alwaysreported as negative,1 increases in oil prices may induce positive effects on the national economies of oil-exporting countries.

Y. Wang et al. / Journal of Comparative Economics 41 (2013) 1220–1239 1221
Although higher oil prices may induce increases in industry costs and inflation rates, as well as a reduction of expenditure onnon-oil goods (e.g., Barsky and Kilian, 2004) in oil-importing countries, they may generate more income for oil-exporting coun-tries due to the low price elasticity of crude oil demand (e.g., Bjørnland, 2009; Jung and Park, 2011). Given this heterogeneity,the response of stock market returns to oil price shocks in oil-exporting countries can be determined by the relative significanceof positive and negative impacts on these countries.
In this paper, we focus on the effects of oil price shocks on stock markets in both oil-importing and oil-exporting coun-tries. Our main findings indicate that the response of stock market returns to oil price shocks in a country greatly depend onthe country’s net position in crude oil market and on the driving forces of oil price shocks. In addition, the total contributionof oil price shocks to variations of stock market returns in a country is shown to depend on the relative importance of oil toits national economy.
There is a vast body of studies which contribute to the analysis of relationship between changes in oil prices and stockmarket returns. Most studies focus on the stock markets in oil-importing countries, especially the US market. There is a con-sensus among these studies about the existence of negative relationship between oil prices and stock market activities (e.g.,Basher et al., 2012; Chen, 2010; Elder and Serletis, 2010; Jones and Kaul, 1996; Kilian and Park, 2009; Masih et al., 2011;Sadorsky, 1999; Wei, 2003), although a few studies show that the impact of oil price changes on stock markets is not alwaysas significant as one generally believes (e.g., Huang et al., 1996; Apergis and Miller, 2009; Miller and Ratti, 2009).
On the other hand, investigation of the relationship between oil prices and stock markets in oil-exporting countries can befound in few studies. Bjørnland (2009) shows that a 10% increase in oil price can result in an approximately two point 5%increase in stock prices in Norway, an oil-exporting country. Park and Ratti (2008) also find that increases in oil prices havepositive effects on the Norwegian stock market, in contrast to those in oil-importing countries on which increases in oilprices have negative effects. More recently, Jung and Park (2011) compare the significance of response to oil supply and de-mand shocks by stock markets in an oil-exporting country (Norway) and an oil-importing country (Korea). Their findingsshow that the response of stock market returns to oil price shocks in these two countries differ greatly to each other. Overall,the results in these three studies indicate that the impacts of oil price shocks on stock markets in oil-exporting and oil-importing countries are heterogeneous to each other. One limitation of the above-mentioned studies is that they focus onlyon a single oil-exporting country (Norway) or on developed countries. Some countries produce and export more crude oilthan Norway (e.g., Saudi Arabia and Russia), and several emerging economies such as China and India may be more respon-sible for the oil price increases in recent years (e.g., Hamilton, 2009; Kilian, 2009). Thus, it is of great importance to inves-tigate the impacts of oil price shocks on stock markets in other oil-exporting economies and in developing oil-importingeconomies. The relative importance of oil to different economies is heterogeneous. A question motivated from the existingstudies is whether the differences of the impacts on stock markets are widely existed between oil-exporting economies andoil-importing economies.
In this paper, we will answer this question from several perspectives. First, we examine whether the relationship betweenoil price shocks and stock market returns is nonlinear. We employ two types of nonlinearity tests and find that there is nosignificant nonlinear relationship between changes in oil price and stock market returns for most countries in our sample.This finding ensures that the use of a linear VAR specification is reasonable in this study.
Second, using the structural VAR model specification proposed by Kilian and Park (2009), we decompose oil price shocksinto oil supply shocks, aggregate demand shocks, and other oil-specific shocks, and then investigate their impacts on stockmarket returns in nine oil-importing countries and seven oil-exporting countries. Based on the impulse response analysis,we compare the direction, magnitude, timing, duration of response from stock market returns to oil price shocks. Our find-ings indicate that the response of stock market returns to oil price shocks in a country depends on the net position of thecountry in global oil market and the driving forces of oil price shocks. Specifically, the impact of oil supply shocks on stockmarkets in oil-exporting countries is insignificant, while the impact in some of oil-importing countries is significantly posi-tive but short-lived. The response of stock markets in most countries to aggregate demand shocks is significantly positive.Moreover, the response of stock markets in oil-exporting countries is more persistent and stronger than in oil-importingcountries. In addition, oil price increases driven by precautionary demand shocks significantly stimulate stock market re-turns in some oil-exporting countries, while they insignificantly depress stock market returns in oil-importing countries.
Third, using the method of forecasting variance decomposition, we compare the contributions of oil price shocks to stockreturn variations in different countries. We find that the explanatory power of oil price shocks for stock return variation in acountry again depends on the net position in oil market and the driving forces of shocks. Overall, the contributions of oilprice shocks to both short-term and long-term stock return variations are larger in oil-exporting countries than in oil-importing countries. A possible explanation is that crude oil is of greater importance for oil-exporting economies than foroil-importing economies. Differences between the contributions of oil price shocks to stock return variations in oil-exportingcountries and those in oil-importing countries can also be partly explained by differences in the level of importance of crudeoil for each country.
Fourth, we investigate the effects of oil price uncertainty on stock market returns. Although there are a number of studieson the relationship between oil price and stock market returns, much fewer studies examine the impact of oil price uncer-tainty on stock markets (see, e.g., Park and Ratti, 2008; Elder and Serletis, 2010; Masih et al., 2011). Moreover, a commonlimitation of previous studies on this issue is that they only focus on oil-importing economies and do not differentiatethe effects of supply uncertainty and aggregate demand uncertainty. In this paper, we use the structural VAR frameworkto address this limitation. Our results imply that the effects of oil price uncertainty differ depending on a country’s net
1222 Y. Wang et al. / Journal of Comparative Economics 41 (2013) 1220–1239
position in the world crude oil market. Oil supply uncertainty is shown to significantly depress stock markets in both oil-importing and oil-exporting countries and this impact persists several months. The effects of aggregate demand uncertaintyon stock market returns in oil-exporting countries are negative and they are much stronger and more persistent than in oil-importing countries.
Finally, we investigate the effects of oil price shocks on stock market comovement because price comovement has impor-tant implications for asset diversification and portfolio management. To the best of our knowledge, this is the first time thatthe relationship between oil price and stock market comovement is investigated. Our results imply that increases in aggre-gate demand and precautionary demand result in a higher degree of co-movement of stock markets in oil-exporting coun-tries, whereas the impacts of changes in these demands on stock market co-movement among oil-importing countries areinsignificant.
The remainder of this paper is organized as follows. Section 2 provides the data description. Section 3 outlines the meth-odology of nonlinear tests and the corresponding empirical results. Section 4 shows the methodology of structural VAR andpresents the main empirical results. Section 5 concludes.
2. Data description
Our sample data consist of oil prices and stock indices in major oil importing and exporting countries, during the periodfrom January 1999 to December 2011.2 Our selection criteria for major importing and exporting countries are based on Kilianet al. (2009), but there are some differences as follows: First, we add China, Korea and India as major importers since they arethe world’s second, fourth and sixth largest net importers in 2011, respectively. Second, we exclude several major exporters inKilian et al. (2009) since the data are not available or very limited for these countries (Jung and Park, 2011). Third, we excludeIndonesia, which is one of the major exporters in Kilian et al. (2009), because it has been a net importer since 2003. Finally, weadd Canada, which has been a net exporter since 1982 and is the world’s thirteenth largest net exporter, as a major exporter.3
With these differences, our final dataset includes nine oil-importing countries (US, Japan, Germany, France, UK, Italy, China, Kor-ea and India) and seven oil-exporting countries (Saudi Arabia, Kuwait, Mexico, Norway, Russia, Venezuela and Canada).
As a proxy for stock market, we use a major stock index for each of our oil-exporting and oil-importing countries: S&P 500(US), NIKKEI 225 (Japan), DAX (Germany), CAC 40 (France), FTSE 100 (UK), FTSE MIB (Italy), Shanghai Composite (China),KOSPI Composite (Korea), BSE Sensex (India), Tadawul All Share (Saudi Arabia), Kuwait Stock Exchange Index (Kuwait), BolsaIPC (Mexico), OSEAX (Norway), MICEX (Russia), IBVC (Venezuela) and S&P/TSX Composite (Canada). According to MSCI list inAugust 2012, Stock markets in two oil-exporting countries and five oil-importing countries are developed markets (Canada,Norway, France, Germany, Japan, UK and US). Index values are collected from Datastream, and then divided by the ConsumerPrice Index (CPI) of each country, which are also collected from Datastream, to get the inflation-adjusted real values.
As a proxy for world oil price level, we use the monthly price data of West Texas Intermediate (WTI) crude oil. WTI oilprice is widely being used as the benchmark for oil pricing, and is highly correlated with the prices for other two major cat-egories of crude oil, Brent and Dubai.4 WTI price data are collected from the World Bank website, and then divided by the U.S.CPI to get the inflation-adjusted real prices. The monthly U.S. CPI data is collected from the Federal Reserve Bank of Saint Louiswebsite. To strengthen the robustness of our results, following Park and Ratti (2008), we also denominate the oil price in thelocal currency of each country in our sample, and then divide these newly denominated prices by the CPI of each country toget inflation-adjusted prices. With this methodology, we have proxies for two types of oil price: world price and domestic price.The exchange rate of each currency to US dollars is also collected from Datastream.
We use two different approaches to obtain a proxy for each of global oil supply and demand. As a proxy for the global oilsupply, we use monthly global oil production data collected from the U.S. Energy Information Administrate (EIA) website. Onthe other hand, we use the global index of dry cargo single voyage freight rates, constructed by Kilian (2009), to estimate thescale of global economic activity as a proxy for global oil demand.5 In the previous literature, the scale of economic activity of acountry is usually measured by real gross domestic production (GDP) (see, e.g., Hamilton, 1983; Rotemberg and Woodford,1996) or industrial production (e.g., Papapetrou, 2001). As Kilian (2009) points out, however, there are several difficulties inmeasuring global economic activity using global real GDP or industrial production. In contrast, the global index of Kilian(2009) has several advantages over the two measures above. Especially, this index provides more detailed information onthe dynamics of global economic activities, since it is calculated on monthly basis while the other two measures are publishedquarterly or annually in most cases. Based on these advantages, this index has been adopted by several recent studies to quan-tify the scale of global economic activities (e.g., Apergis and Miller, 2009; Basher et al., 2012; Jung and Park, 2011).
Table 1 reports two sets of information about oil import and export by country: (1) the average daily oil import (export)by the oil-importing (oil-exporting) countries in our sample, and (2) the ratio of net revenue or expenditure from oil trade toits GDP, in 2011. The net expenditure or revenue from oil trade is calculated as the annual average of world oil price
2 To conduct comparisons, we need data of all countries at each time point. This condition restricts the sample time period in our study.3 This information is obtained from the U.S. Energy Information Administration (EIA).4 Based on the sample data, we find that the correlation coefficient between WTI and Brent oil price returns and between WTI and Dubai oil returns are 0.935
and 0.915, respectively.5 We obtain this index data from Kilian’s website: http://www-personal.umich.edu/~lkilian. For a detailed description, please see the seminal work of Kilian
(2009).

Table 1Crude oil net imports (exports) and net oil expenditure (revenue) to GDP ratios in 2011.
The volume of crude oil net exports(thousand barrels per day)
Oil expenditure(revenue) to GDP ratios
Oil-importing countriesCHN 5487 2.61FRA 1697 2.12GER 2235 2.17IND 2349 4.41ITA 1292 2.04JPN 4329 2.56KOR 2170 6.74UK 450.16 0.64USA 8728 2.01
Oil-exporting countriesCAN 1405 2.81KSA 8336 50.1KUW 2343 46.0MEX 826 2.48NOR 1752 12.5RUS 7083 13.2VEN 1715 18.8
This table reports net oil imports of oil importing countries and net oil exports of oil-exporting countries. Moreover, itreports annual oil expenditure of importing countries (revenue of exporting countries) to GDP ratios in 2011. Theaverage annual WTI oil price in 2011 is 95.04 dollars per barrel obtained from EIA website. We calculate theexpenditure (revenue) of a country’s net oil imports (exports) by the following formula: Daily oil imports(exports) � number of days in a year � the annual WTI oil price.
Y. Wang et al. / Journal of Comparative Economics 41 (2013) 1220–1239 1223
multiplied by the net import or export volume. According to the EIA website, the annual average of WTI oil price in 2011 is95.04 US dollars per barrel. The GDP data denominated by US dollars are collected from the World Bank website.
From Table 1, we can find that Saudi Arabia and Russia are the two largest oil exporters, while US and China are the twolargest oil importers. In addition, among the group of oil exporters, Saudi Arabia and Kuwait show the highest net revenue toGDP ratio. The net revenue from oil trade accounts for about a half of their GDP in 2011. In contrast, the ratios for Canada andMexico are lower than 3%, while the ratios for all the other five exporters are higher than 10%. Among the group of importingcountries, the three Asian countries show the highest net expenditure to GDP ratios, possibly because of their rapid economicgrowth. These ratios are useful to quantify the importance of oil to each country’s economy.
3. Nonlinearity tests
We adopt the Vector Autoregression (VAR) framework, which has been widely used to examine the effects of oil priceshocks on macroeconomic variables. Since a VAR model assumes that the variables are linearly related, Nonlinearity testis performed to ensure the validity of model. Previous literature documents an asymmetric relationship between crudeoil price and US macroeconomic variables (e.g., Hamilton, 1996, 2003, 2011b; Mork, 1989), and this further emphasizesthe importance of nonlinearity test in our study. Hence, we first investigate whether there is an asymmetric effect of oil pricechange on stock market returns.6 Specifically, we test whether the increases in oil price have significantly larger or smallereffects on index returns than the decreases have.
Let opt denote the logarithm of real oil price at month t, and Dopt = opt � opt�1 the monthly change in opt during the per-iod from month t � 1 to month t. Then we separate positive changes from negative ones by defining two auxiliary variables,Dopþt ¼maxð0;DoptÞ and Dop�t ¼ minð0;Dopt), to identify asymmetric effects. Next, we follow Hamilton (2003) to estimatethe model for stock price dynamics as
6 Her7 We
with thfollowin
Dspt ¼ c þXp
i¼1
aiDspt�i þXp
i¼1
biDopt�i þXp
i¼1
ciDop#t�i þ et ; ð1Þ
where Dspt is the logarithmic change in real stock price, i.e., stock market returns, during the period from month t � 1 tomonth t, Dop#
t 2 fDopþt ; Dop�t g, and et is a Gaussian error term. We choose six as the lag length p.7 In this test, the nullhypothesis is that there is no asymmetric effects of changes in oil prices on subsequent stock market returns, i.e., H0:c1 = c2 = � � � = c6 = 0. Standard Wald tests are applied to evaluate the null hypothesis for each country in our sample.
e, we thank the anonymous referee for this suggestion.use several criteria such as AIC, BIC, LR, and HQ to choose the lag length but the results are inconsistent. We finally choose the lag length p = 6, because
is length we can obtain relatively more accurate test results for the response of stock market returns to oil price shocks, which will be discussed in theg section. The same choice of lag length can be seen in Park and Ratti (2008).

Table 2Asymmetry and Hamilton’s nonlinearity test results.
Asymmetry tests Hamilton’s nonlinearity tests
World oil price Country-specific oil price World oil price Country-specific oil price
Oil-importing countriesChina 2.267 (0.894) 2.485 (0.870) 4.964 (0.548) 4.926 (0.553)France 4.586 (0.598) 4.798 (0.570) 0.843 (0.991) 1.225 (0.976)Germany 4.956 (0.550) 5.860 (0.439) 2.700 (0.846) 3.470 (0.748)India 3.959 (0.682) 6.135 (0.408) 2.731 (0.842) 3.067 (0.800)Italy 4.350 (0.629) 5.398 (0.494) 4.357 (0.629) 4.351 (0.629)Japan 6.252 (0.396) 5.582 (0.472) 2.361 (0.884) 1.417 (0.965)Korea 8.262 (0.220) 7.830 (0.251) 10.34 (0.111) 11.24� (0.081)United Kingdom 2.763 (0.838) 4.319 (0.634) 4.345 (0.630) 4.883 (0.559)United States 3.998 (0.677) 3.998 (0.677) 4.485 (0.611) 4.485 (0.611)
Oil-exporting countriesCanada 0.248 (1) 2.801 (0.833) 2.679 (0.848) 3.885 (0.692)Saudi Arabia 10.29 (0.113) 10.29 (0.113) 8.811 (0.185) 8.811 (0.185)Kuwait 2.764 (0.838) 3.776 (0.707) 7.728 (0.259) 8.105 (0.231)Mexico 2.706 (0.845) 1.964 (0.923) 3.474 (0.748) 5.092 (0.532)Norway 2.199 (0.901) 3.365 (0.762) 5.815 (0.444) 5.771 (0.449)Russia 6.085 (0.414) 5.659 (0.462) 5.111 (0.530) 5.280 (0.509)Venezuela 1.606 (0.952) 6.213 (0.400) 7.154 (0.307) 2.731 (0.842)
This table reports the results of the test for asymmetric effect. The null hypothesis of no asymmetric effect of changes in oil price on stock market returns isto be tested based on the model specification: Dspt ¼ c þ
Ppi¼1aiDspt�i þ
Ppi¼1biDopt�i þ
Ppi¼1ciDop#
t�i þ et . The null hypothesis is that there is no asym-metric effects of changes in oil prices on subsequent stock market returns, which can written as H0: c1 = c2 = � � � = c6 = 0 (e.g., Hamilton, 2011b). The chi-square statistics with degrees of freedom of 6 and its p-values in parentheses are reported. Asterisks �, �� and ��� denote the 10%, 5%, and 1% significancelevels, respectively.
Table 3Results of nonlinear causality tests.
World oil price Country-specific oil price
lx = ly = 1 lx = ly = 2 lx = ly = 1 lx = ly = 2
Oil-importing countriesChina �0.923 (0.822) �0.865 (0.807) �0.967 (0.833) �1.240 (0.893)France �0.088 (0.535) �0.318 (0.625) �0.088 (0.535) �0.327 (0.628)Germany 1.073 (0.142) 0.371 (0.355) 1.008 (0.157) 0.738 (0.230)India �0.233 (0.592) 0.361 (0.359) 0.646 (0.259) 0.884 (0.188)Italy �0.525 (0.700) �0.347 (0.636) �0.453 (0.675) 0.781 (0.217)Japan 1.552� (0.060) �0.020 (0.508) 1.033 (0.151) �0.084 (0.534)Korea 0.574 (0.283) 0.604 (0.273) 0.136 (0.446) 0.810 (0.209)United Kingdom 0.718 (0.237) �0.426 (0.665) �0.500 (0.691) �0.987 (0.838)United States 0.747 (0.228) 0.975 (0.165) 0.747 (0.228) 0.975 (0.165)
Oil-exporting countriesCanada �0.603 (0.727) �0.054 (0.522) �0.400 (0.655) 0.765 (0.222)Saudi Arabia 0.714 (0.238) 0.984 (0.163) 0.714 (0.238) 0.984 (0.163)Kuwait 1.075 (1.141) 0.644 (0.260) 0.808 (0.210) �0.051 (0.520)Mexico 1.017 (0.155) 0.573 (0.283) 0.957 (0.169) 1.028 (0.152)Norway 0.208 (0.417) 1.311� (0.095) 0.551 (0.291) 1.507� (0.066)Russia 0.004 (0.498) 1.894�� (0.029) 0.170 (0.432) 1.731�� (0.041)Venezuela 0.462 (0.322) 1.160 (0.123) 0.326 (0.372) 0.631 (0.264)
The table reports the statistics of Diks and Panchenko’s nonlinearity tests for causality behavior running from changes in oil price to stock market returns.The numbers in parentheses are the p-values implied by the statistics. Asterisks �, �� and ��� denote the 10%, 5% and 1% significance levels, respectively.
1224 Y. Wang et al. / Journal of Comparative Economics 41 (2013) 1220–1239
Hamilton (1996) argues that many of the increases in crude oil prices are corrective movements to the fundamental pricelevel, i.e., these increases show the mean reverting characteristics of oil prices. Therefore, Hamilton (1996) defines the mea-sure of oil price increase as, Dnopt = max[0,opt �max(opt�1, opt�2, . . . ,opt�n)], to take into account corrective movements.Hamilton (1996, 2003) suggests that n should be large enough so that the current price can be compared to historical pricesduring the previous year or 2 years. Given the monthly data, twenty-four observations will be lost if we strictly follow thissuggestion, and there will be no enough observations to perform the test. For this reason, following Park and Ratti (2008), wechoose n = 6. Next, we replace Dop#
t�i in Eq. (1) by Dnopt�i and perform the test again.Table 2 reports the test results. We find that the null hypothesis cannot be rejected for most of the countries in our sam-
ple, regardless of which proxy for oil prices is used (world price or domestic price). The only exception is that the null

Y. Wang et al. / Journal of Comparative Economics 41 (2013) 1220–1239 1225
hypothesis is rejected at the 10% significance level for Korea, when the corrective movements are considered. Overall, theresults suggest that there are no significant asymmetric effects from oil price shocks on the subsequent stock market returnsacross all the importing and exporting countries in our sample.
To further ensure the validity of VAR framework, we perform one more nonlinearity test. We use a nonparametric test ofDiks and Panchenko (2006), which is a modified version of one in Hiemstra and Jones (1994), on the residuals obtained froma structural VAR (SVAR) specification to find whether there is a nonlinear causality from oil price shocks to stock marketreturns.8 For brevity, we leave the details of this test to the reader. Table 3 reports the test results. Overall, the results suggestthat there is no significant nonlinear causality from oil price changes to stock market returns for most countries in our sample.The only two exceptions are Russia and Norway, for which the null hypothesis cannot be rejected at the 10% significance level.
The above two nonlinearity tests show that there is little evidence of nonlinearity across all the countries in this paper.9
This finding suggests that a linear specification may well capture the linkage between crude oil market and stock market in thecontext of this study. The evidence reinforces the conclusion drawn by Kilian and Vigfusson (2011) that the linear symmetricmodel provides a good approximation in modeling the response of real output to innovations in the real price of oil. The absenceof the above-mentioned nonlinearity reduces the likelihood of model misspecification in this paper and increases the reliabilityof our results.
4. Structural VAR and empirical results
It has been well documented in the literature that the results of impulse responses implied by a simple VAR model can beaffected by the order of variables. On the other hand, a SVAR model can help overcome the ordering problem with imposingrestrictions on the system according to the relative importance of variables. Motivated by this advantage, we employ theSVAR framework to investigate the impact of oil price shocks on stock market returns.
4.1. Structural VAR and identifying assumptions
The standard structural VAR model is specified as:
8 We9 Not
Ayt ¼ aþXj
i¼1
Biyt�i þ et ; ð2Þ
where yt = (DGOPt, DKIt, Dopt, Dspt)0 is a vector including changes in variables. GOPt is the logarithm of global oil production,KIt is the Kilian (2009) index, opt is the logarithm of real WTI crude oil price, and spt is the logarithm of inflation-adjustedstock index. D denotes the first order difference between the value in month t � 1 and month t. The exogenous error termsin vector, et, are assumed to be serially and mutually independent and interpreted as structural innovations. The lag length jis again chosen to be six. A is a full rank matrix.
Following Kilian and Park (2009), we decompose the structural innovations by defining et = A�1et, specifically
et ¼
eDGOPt
eDKIt
eDOPt
eDSPt
26664
37775 ¼
a11000a21a2200a31a32a330a41a42a43a44
26664
37775
eOil supply shockt
eAggregate demand shockt
eOther oil�specific shockst
eOther stock�specific shockst
266664
377775: ð3Þ
Thus, we can relate the shocks to the structural innovations as follows:
� Oil supply shocks are innovations in oil supply.� Aggregate demand shocks are innovations in global economic activity which cannot be explained by oil supply shocks.� Other oil-specific shocks are innovations in crude oil prices which cannot be explained by oil supply shocks or aggre-
gate demand shocks.� Other stock-specific shocks are innovations in stock prices which cannot be explained by the three shocks above.
The above decomposition structure is based on three assumptions of short-term restrictions. The first assumption is that,in the short term, the innovations in oil supply do not respond to the changes in aggregate demand, oil price, or stock price.With this assumption, we can treat the oil supply shocks as exogenous. Some of the rationales behind this assumption are asfollows:
� The existence of monopoly in the crude oil markets (e.g., OPEC’s behavior) implies that, to a certain extent, oil supply isexogenously controlled by several large producers. The political events that lead to a temporary reduction in oil pro-duction are usually not predictable.
discuss this model specification in the next section.e that there might be other types of nonlinearities in the data.

-.05
.00
.05
.10
.15
2 4 6 8 10 12
Oil supply shock
-.05
.00
.05
.10
.15
2 4 6 8 10 12
Aggregate demand shock
-.05
.00
.05
.10
.15
2 4 6 8 10 12
Other oil-specific shocks
Fig. 1. Accumulative responses of world real oil returns to structural shocks.
1226 Y. Wang et al. / Journal of Comparative Economics 41 (2013) 1220–1239
� Oil production projects are capital-intensive and time-consuming. This characteristics lead to a very low price elastic-ity of oil supply in the short term (e.g. Mu and Ye, 2011). Although oil producers may adjust their oil production if oilprice persistently increases or decreases over a long period, they do not respond to occasional shocks.
The second assumption is that while the global economic activity responds to oil supply shocks almost immediately, ittakes more than a month for the global economy to react to other oil-specific shocks. Although it has been widely consideredthat the disruption of crude oil supply has significant influences on global economic activity (see, e.g., Hamilton, 1983; Kilian,2009), the response of global economy to oil price change is known as lagging behind, as discussed in Kilian (2009). More-over, changes in stock prices in one country cannot affect global economic activity in the short-term, as in Kilian and Park(2009). This is plausible because it is nearly impossible that one country’s stock market can affect global economic activity ina very short period of time.
Finally, the last assumption is that other oil-specific shocks can be explained by the changes in ‘precautionary demand’,which is induced by the expected shortfall in oil supply. More detailed discussions on precautionary demand can be found inKilian (2009) and Kilian and Park (2009). Because this type of shocks are mainly caused by the uncertainty in future supply, itis plausible that crude oil price does not respond to stock price innovations in a local market within 1 month period. On theother hand, shocks classified as ‘other stock-specific shocks’ may be caused by many other factors related to the stock mar-kets, such as changes in interest rates or exchange rates that are discussed in Basher et al. (2012), Bjørnland (2009) and Jungand Park (2011).
4.2. Response of crude oil price to supply and demand shocks
Before investigating the effects of oil price shocks on stock market returns, we first examine the impacts of oil supply anddemand shocks on changes in oil prices to understand the dynamics of oil prices in more details.10 Fig. 1 illustrates the re-sponse of world oil price to structural shocks. The upper and lower lines represent plus and minus two standard errors bands,respectively. Our results show that the effect of oil supply shocks on crude oil price changes is not significant, and this is incon-sistent with the previous studies (e.g., Kilian and Park, 2009; Kilian, 2009; Basher et al., 2012) which show that the response of
10 Although this issue has been analyzed in Kilian and Park (2009) and Kilian (2009), it is worth reviewing it here since our sample covers more observationsof several recent years, in which a dramatic plunge in oil price is caused by the global economic depression. Furthermore, participants and fundamentals incrude oil market have changed considerably since 2003. Emerging countries such as China and India have become the major driving forces of high oil price(Hamilton (2009)).
Y. Wang et al. / Journal of Comparative Economics 41 (2013) 1220–1239 1227
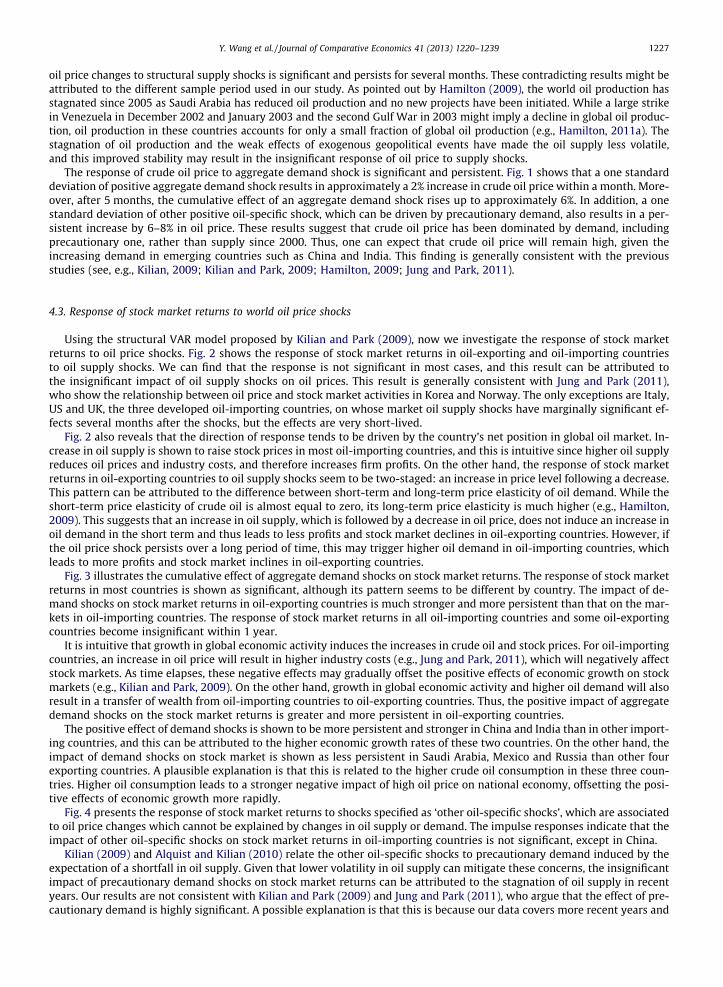
oil price changes to structural supply shocks is significant and persists for several months. These contradicting results might beattributed to the different sample period used in our study. As pointed out by Hamilton (2009), the world oil production hasstagnated since 2005 as Saudi Arabia has reduced oil production and no new projects have been initiated. While a large strikein Venezuela in December 2002 and January 2003 and the second Gulf War in 2003 might imply a decline in global oil produc-tion, oil production in these countries accounts for only a small fraction of global oil production (e.g., Hamilton, 2011a). Thestagnation of oil production and the weak effects of exogenous geopolitical events have made the oil supply less volatile,and this improved stability may result in the insignificant response of oil price to supply shocks.
The response of crude oil price to aggregate demand shock is significant and persistent. Fig. 1 shows that a one standarddeviation of positive aggregate demand shock results in approximately a 2% increase in crude oil price within a month. More-over, after 5 months, the cumulative effect of an aggregate demand shock rises up to approximately 6%. In addition, a onestandard deviation of other positive oil-specific shock, which can be driven by precautionary demand, also results in a per-sistent increase by 6–8% in oil price. These results suggest that crude oil price has been dominated by demand, includingprecautionary one, rather than supply since 2000. Thus, one can expect that crude oil price will remain high, given theincreasing demand in emerging countries such as China and India. This finding is generally consistent with the previousstudies (see, e.g., Kilian, 2009; Kilian and Park, 2009; Hamilton, 2009; Jung and Park, 2011).
4.3. Response of stock market returns to world oil price shocks
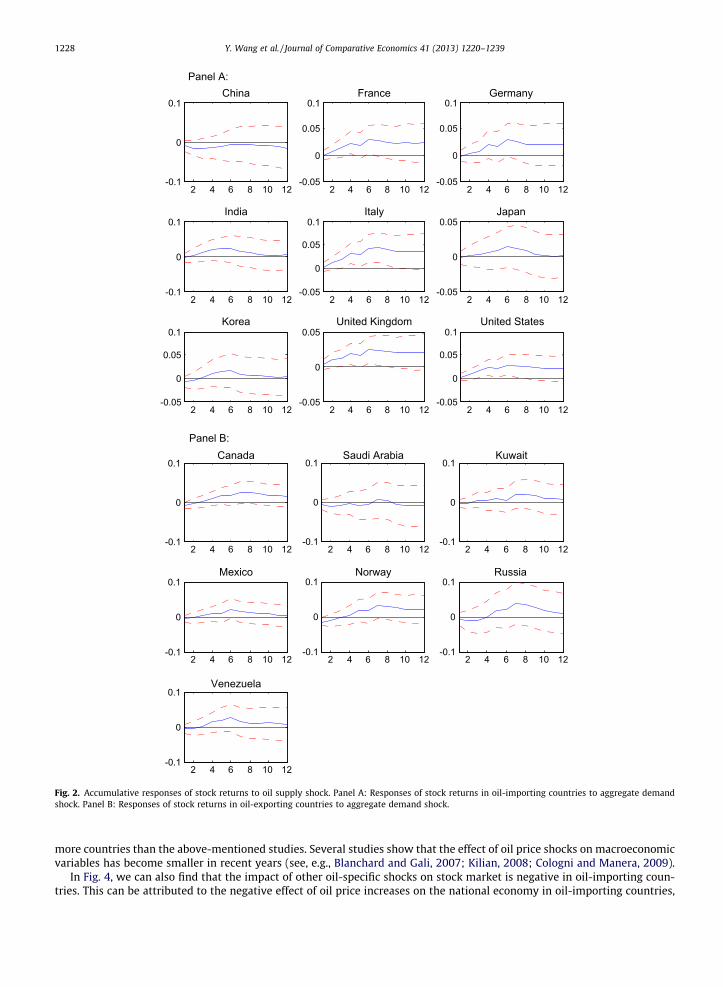
Using the structural VAR model proposed by Kilian and Park (2009), now we investigate the response of stock marketreturns to oil price shocks. Fig. 2 shows the response of stock market returns in oil-exporting and oil-importing countriesto oil supply shocks. We can find that the response is not significant in most cases, and this result can be attributed tothe insignificant impact of oil supply shocks on oil prices. This result is generally consistent with Jung and Park (2011),who show the relationship between oil price and stock market activities in Korea and Norway. The only exceptions are Italy,US and UK, the three developed oil-importing countries, on whose market oil supply shocks have marginally significant ef-fects several months after the shocks, but the effects are very short-lived.
Fig. 2 also reveals that the direction of response tends to be driven by the country’s net position in global oil market. In-crease in oil supply is shown to raise stock prices in most oil-importing countries, and this is intuitive since higher oil supplyreduces oil prices and industry costs, and therefore increases firm profits. On the other hand, the response of stock marketreturns in oil-exporting countries to oil supply shocks seem to be two-staged: an increase in price level following a decrease.This pattern can be attributed to the difference between short-term and long-term price elasticity of oil demand. While theshort-term price elasticity of crude oil is almost equal to zero, its long-term price elasticity is much higher (e.g., Hamilton,2009). This suggests that an increase in oil supply, which is followed by a decrease in oil price, does not induce an increase inoil demand in the short term and thus leads to less profits and stock market declines in oil-exporting countries. However, ifthe oil price shock persists over a long period of time, this may trigger higher oil demand in oil-importing countries, whichleads to more profits and stock market inclines in oil-exporting countries.
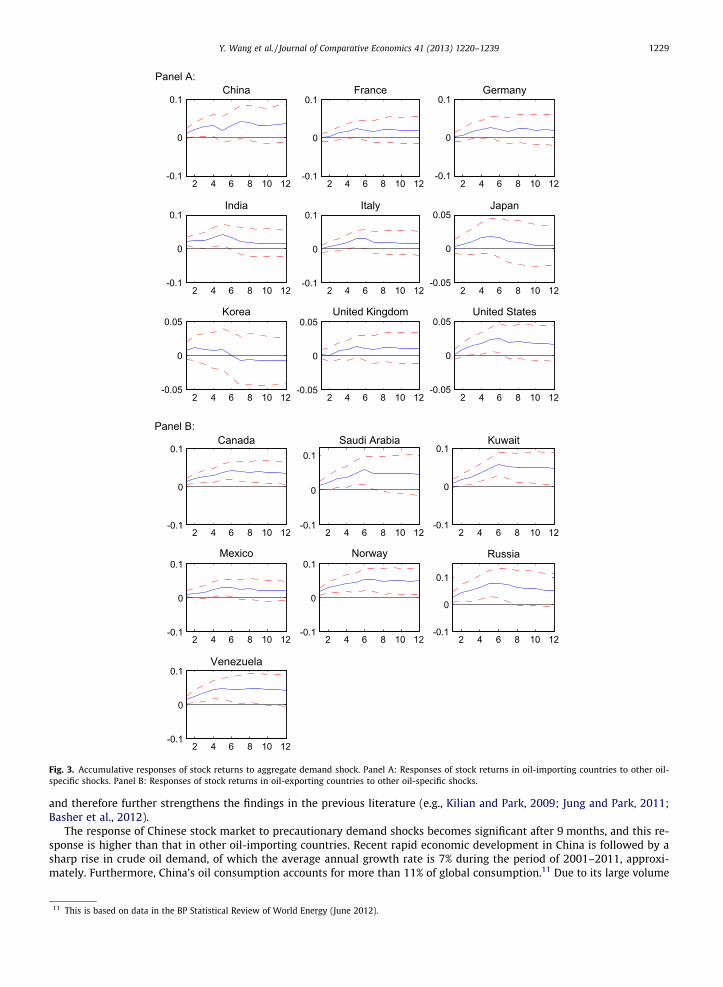
Fig. 3 illustrates the cumulative effect of aggregate demand shocks on stock market returns. The response of stock marketreturns in most countries is shown as significant, although its pattern seems to be different by country. The impact of de-mand shocks on stock market returns in oil-exporting countries is much stronger and more persistent than that on the mar-kets in oil-importing countries. The response of stock market returns in all oil-importing countries and some oil-exportingcountries become insignificant within 1 year.
It is intuitive that growth in global economic activity induces the increases in crude oil and stock prices. For oil-importingcountries, an increase in oil price will result in higher industry costs (e.g., Jung and Park, 2011), which will negatively affectstock markets. As time elapses, these negative effects may gradually offset the positive effects of economic growth on stockmarkets (e.g., Kilian and Park, 2009). On the other hand, growth in global economic activity and higher oil demand will alsoresult in a transfer of wealth from oil-importing countries to oil-exporting countries. Thus, the positive impact of aggregatedemand shocks on the stock market returns is greater and more persistent in oil-exporting countries.
The positive effect of demand shocks is shown to be more persistent and stronger in China and India than in other import-ing countries, and this can be attributed to the higher economic growth rates of these two countries. On the other hand, theimpact of demand shocks on stock market is shown as less persistent in Saudi Arabia, Mexico and Russia than other fourexporting countries. A plausible explanation is that this is related to the higher crude oil consumption in these three coun-tries. Higher oil consumption leads to a stronger negative impact of high oil price on national economy, offsetting the posi-tive effects of economic growth more rapidly.
Fig. 4 presents the response of stock market returns to shocks specified as ‘other oil-specific shocks’, which are associatedto oil price changes which cannot be explained by changes in oil supply or demand. The impulse responses indicate that theimpact of other oil-specific shocks on stock market returns in oil-importing countries is not significant, except in China.
Kilian (2009) and Alquist and Kilian (2010) relate the other oil-specific shocks to precautionary demand induced by theexpectation of a shortfall in oil supply. Given that lower volatility in oil supply can mitigate these concerns, the insignificantimpact of precautionary demand shocks on stock market returns can be attributed to the stagnation of oil supply in recentyears. Our results are not consistent with Kilian and Park (2009) and Jung and Park (2011), who argue that the effect of pre-cautionary demand is highly significant. A possible explanation is that this is because our data covers more recent years and
2 4 6 8 10 12-0.1
0
0.1China
2 4 6 8 10 12-0.05
0
0.05
0.1France
2 4 6 8 10 12-0.05
0
0.05
0.1Germany
2 4 6 8 10 12-0.1
0
0.1India
2 4 6 8 10 12-0.05
0
0.05
0.1Italy
2 4 6 8 10 12-0.05
0
0.05Japan
2 4 6 8 10 12-0.05
0
0.05
0.1Korea
2 4 6 8 10 12-0.05
0
0.05United Kingdom
2 4 6 8 10 12-0.05
0
0.05
0.1United States
Panel A:
Panel B:
2 4 6 8 10 12-0.1
0
0.1Canada
2 4 6 8 10 12-0.1
0
0.1Saudi Arabia
2 4 6 8 10 12-0.1
0
0.1Kuwait
2 4 6 8 10 12-0.1
0
0.1Mexico
2 4 6 8 10 12-0.1
0
0.1Norway
2 4 6 8 10 12-0.1
0
0.1Russia
2 4 6 8 10 12-0.1
0
0.1Venezuela
Fig. 2. Accumulative responses of stock returns to oil supply shock. Panel A: Responses of stock returns in oil-importing countries to aggregate demandshock. Panel B: Responses of stock returns in oil-exporting countries to aggregate demand shock.
1228 Y. Wang et al. / Journal of Comparative Economics 41 (2013) 1220–1239
more countries than the above-mentioned studies. Several studies show that the effect of oil price shocks on macroeconomicvariables has become smaller in recent years (see, e.g., Blanchard and Gali, 2007; Kilian, 2008; Cologni and Manera, 2009).
In Fig. 4, we can also find that the impact of other oil-specific shocks on stock market is negative in oil-importing coun-tries. This can be attributed to the negative effect of oil price increases on the national economy in oil-importing countries,
Panel A:
2 4 6 8 10 12-0.1
0
0.1China
2 4 6 8 10 12-0.1
0
0.1France
2 4 6 8 10 12-0.1
0
0.1Germany
2 4 6 8 10 12-0.1
0
0.1India
2 4 6 8 10 12-0.1
0
0.1Italy
2 4 6 8 10 12-0.05
0
0.05Japan
2 4 6 8 10 12-0.05
0
0.05Korea
2 4 6 8 10 12-0.05
0
0.05United Kingdom
2 4 6 8 10 12-0.05
0
0.05United States
Panel B:
2 4 6 8 10 12-0.1
0
0.1Canada
2 4 6 8 10 12-0.1
0
0.1Saudi Arabia
2 4 6 8 10 12-0.1
0
0.1Kuwait
2 4 6 8 10 12-0.1
0
0.1Mexico
2 4 6 8 10 12-0.1
0
0.1Norway
2 4 6 8 10 12-0.1
0
0.1
Russia
2 4 6 8 10 12-0.1
0
0.1Venezuela
Fig. 3. Accumulative responses of stock returns to aggregate demand shock. Panel A: Responses of stock returns in oil-importing countries to other oil-specific shocks. Panel B: Responses of stock returns in oil-exporting countries to other oil-specific shocks.
Y. Wang et al. / Journal of Comparative Economics 41 (2013) 1220–1239 1229
and therefore further strengthens the findings in the previous literature (e.g., Kilian and Park, 2009; Jung and Park, 2011;Basher et al., 2012).
The response of Chinese stock market to precautionary demand shocks becomes significant after 9 months, and this re-sponse is higher than that in other oil-importing countries. Recent rapid economic development in China is followed by asharp rise in crude oil demand, of which the average annual growth rate is 7% during the period of 2001–2011, approxi-mately. Furthermore, China’s oil consumption accounts for more than 11% of global consumption.11 Due to its large volume
11 This is based on data in the BP Statistical Review of World Energy (June 2012).

Panel A:
2 4 6 8 10 12
-0.1
0
0.1China
2 4 6 8 10 12-0.1
0
0.1France
2 4 6 8 10 12-0.1
0
0.1Germany
2 4 6 8 10 12-0.1
0
0.1India
2 4 6 8 10 12-0.1
0
0.1Italy
2 4 6 8 10 12-0.1
0
0.1Japan
2 4 6 8 10 12-0.1
0
0.1Korea
2 4 6 8 10 12-0.1
0
0.1United Kingdom
2 4 6 8 10 12-0.1
0
0.1United States
Panel B:
2 4 6 8 10 12-0.05
0
0.05Canada
2 4 6 8 10 12-0.1
0
0.1Saudi Arabia
2 4 6 8 10 12-0.1
0
0.1Kuwait
2 4 6 8 10 12-0.05
0
0.05Mexico
2 4 6 8 10 12-0.1
0
0.1Norway
2 4 6 8 10 12-0.2
0
0.2Russia
2 4 6 8 10 12-0.1
0
0.1Venezuela
Fig. 4. Accumulative responses of stock returns to other oil-specific shocks. Panel A: Responses of stock returns in oil-importing countries to other stock-specific shocks. Panel B: Responses of stock returns in oil-exporting countries to other stock-specific shocks.
1230 Y. Wang et al. / Journal of Comparative Economics 41 (2013) 1220–1239
of oil consumption and high growth rate of oil demand, the effect of oil price changes driven by precautionary demand onChinese stock market returns can be stronger than that on the stock market returns in other oil-importing countries. Laggedresponses can be explained by the inefficiency in Chinese stock market (Groenewold et al., 2003, 2004), which is responsiblefor the untimely transmission of information from crude oil market to stock market.
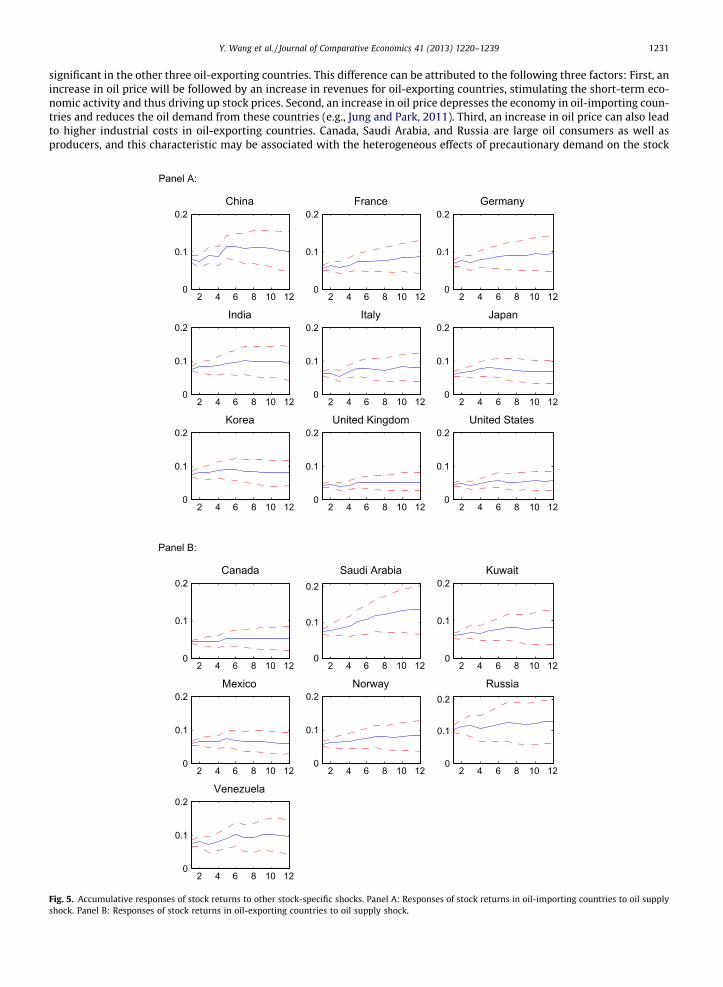
The response of stock market returns to a positive one standard deviation of precautionary demand shock is significantlypositive and persists 6 months in four oil-exporting countries (Canada, Saudi Arabia, Norway and Russia), while it is not
Y. Wang et al. / Journal of Comparative Economics 41 (2013) 1220–1239 1231
significant in the other three oil-exporting countries. This difference can be attributed to the following three factors: First, anincrease in oil price will be followed by an increase in revenues for oil-exporting countries, stimulating the short-term eco-nomic activity and thus driving up stock prices. Second, an increase in oil price depresses the economy in oil-importing coun-tries and reduces the oil demand from these countries (e.g., Jung and Park, 2011). Third, an increase in oil price can also leadto higher industrial costs in oil-exporting countries. Canada, Saudi Arabia, and Russia are large oil consumers as well asproducers, and this characteristic may be associated with the heterogeneous effects of precautionary demand on the stock
Panel A:
2 4 6 8 10 120
0.1
0.2China
2 4 6 8 10 120
0.1
0.2France
2 4 6 8 10 120
0.1
0.2Germany
2 4 6 8 10 120
0.1
0.2India
2 4 6 8 10 120
0.1
0.2Italy
2 4 6 8 10 120
0.1
0.2Japan
2 4 6 8 10 120
0.1
0.2Korea
2 4 6 8 10 120
0.1
0.2United Kingdom
2 4 6 8 10 120
0.1
0.2United States
Panel B:
2 4 6 8 10 120
0.1
0.2Canada
2 4 6 8 10 120
0.1
0.2Saudi Arabia
2 4 6 8 10 120
0.1
0.2Kuwait
2 4 6 8 10 120
0.1
0.2Mexico
2 4 6 8 10 120
0.1
0.2Norway
2 4 6 8 10 120
0.1
0.2Russia
2 4 6 8 10 120
0.1
0.2Venezuela
Fig. 5. Accumulative responses of stock returns to other stock-specific shocks. Panel A: Responses of stock returns in oil-importing countries to oil supplyshock. Panel B: Responses of stock returns in oil-exporting countries to oil supply shock.

1232 Y. Wang et al. / Journal of Comparative Economics 41 (2013) 1220–1239
market returns in oil-exporting countries. The way stock market returns in oil-exporting countries respond to precautionarydemand shocks depends on the relative significance of these three factors.
Fig. 5 illustrates the response of stock market returns to shocks classified as ‘other stock-specific shocks’. We find that theresponse of stock market returns to these shocks is significantly positive and persists more than 12 months. This is contraryto the efficient market hypothesis, which assumes that well-functioning markets can respond to new information quickly(Basher et al., 2012). On the other hand, the impact of ‘other stock-specific shocks’ on the stock market returns in developedcountries, whose markets are known as more efficient, are weaker than those in emerging market countries, for both cases ofexporting and importing countries. In addition, it is also shown that the stock markets in four European countries (France,Germany, Italy, and UK) respond to this type shocks in a very similar way, as well as the other three types of shocks. Thisimplies a high degree of integration among these markets.
4.4. Country-specific oil price shocks
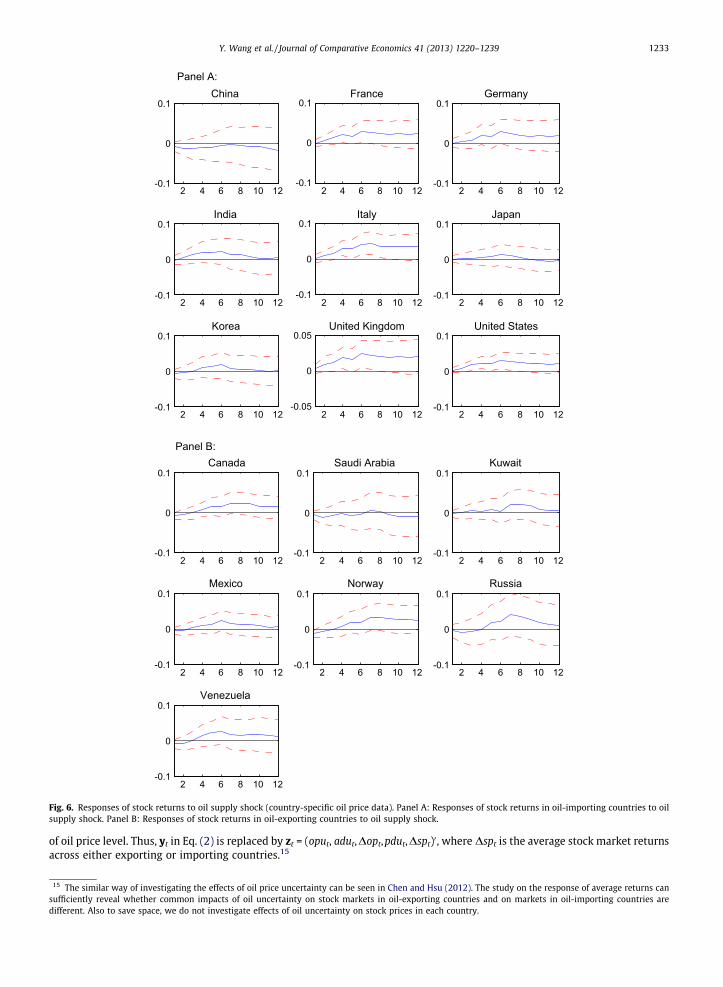
Next, we again examine the response of stock market returns to the structural shocks discussed above, this time using thecountry-specific (national) oil price measure.12 Fig. 6 depicts the responses of stock market returns to the structural oil supplyshocks. We find that the results are very similar to those in Fig. 2. We also investigate the responses of stock market returns toother three types of shocks, and again obtain results similar to those we get when the world oil price is used as a proxy.13 Parkand Ratti (2008) point out that stock markets anticipate that an oil price shock will have a global impact, and this impact isbetter captured by the world oil price than by country-specific prices that reflect the offsetting movements in exchange rates.Hence, in the following analyses, we abandon country-specific prices and use the world oil price only.
4.5. Contribution of oil price shocks to variations of stock prices—evidence from variance decomposition
To quantify the contributions of oil price shocks to variations in stock market returns, we employ the variance decompo-sition method. Figs. 7 and 8 show the variance decomposition results of forecasting errors in stock market returns at the fore-cast lengths of 1 month (short-term) and 12 months (long-term), respectively. The contributions of oil price shocks are muchlarger in the long-term than in the short-term. Oil price shocks can explain 20–30% of the variations in stock market returns.The explanatory power of oil price shocks to stock market return variations in oil-exporting countries are stronger than thosein developed oil-importing countries. This finding can be attributed to the fact that crude oil is of greater importance for oil-exporting countries than for oil-importing ones (see Table 1).
Within the group of oil-exporting countries, the percent contributions to stock market return volatility in Canada andMexico are smaller than those in Saudi Arabia, Russia, Venezuela and Norway. A possible reason is that the relative sizeof oil trade to GDP is low in Canada and Mexico (see Table 1). In the long term, the contributions of oil supply shocks to stockmarket return variations in Russia and Saudi Arabia are smaller, because these two countries are the largest oil producers aswell as exporters so that they can adjust productions to mitigate the shocks in world oil supply.
Within the group of oil-importing countries, oil price shocks can explain a higher percentage of both short-term and long-term stock market return variations in three emerging Asian countries (China, India, and Korea). This finding can also be ex-plained by the greater importance of oil for these three countries. The explanatory power of aggregate demand shocks forstock market return variations in China and India is stronger, possibly because of their high economic growth. Precautionarydemand shocks are shown to contribute a larger part of variations in Chinese and Korean stock market returns. This can beattributed to the absence of crude oil futures markets in these two countries, which precludes market participants fromhedging oil-related risks effectively.
4.6. Impact of oil price uncertainty on stock market returns
Besides the impact of oil shocks on economic activity, the impact of oil price uncertainty is also of great interest for econ-omists (e.g., Elder and Serletis, 2010). This is motivated by the theories under uncertainty and of real options, which implythat uncertainty about investment returns caused by oil price fluctuations can result in cyclical fluctuations in investment(see, e.g., Henry, 1974; Bernanke, 1983; Brennan and Schwartz, 1985; Majd and Pindyck, 1987). Thus, it is of worth to inves-tigate the response of stock market returns to oil price uncertainty.
To quantify oil price uncertainty, we first use the three-variable structural VAR model proposed by Kilian (2009) todecompose oil price shocks into supply shocks, aggregate demand shocks, and precautionary demand shocks. Next, wesquare the values to measure oil supply uncertainty (oput), aggregate demand uncertainty (adut), precautionary demanduncertainty (pdut) and the total price uncertainty which consists of these three components.14 We then investigate the effectof each category of uncertainty on stock market returns using the VAR framework again. Following Park and Ratti (2008), wealso include the oil price change (Dopt) in the VAR framework in order to isolate the effect of oil price uncertainty from the effect
12 We thank one anonymous referee for this suggestion.13 To save space, we do not provide the results here. They are available upon request.14 To save space, we do not show the detailed description of Kilian’s three-variable VAR. One can see the seminal work of Kilian (2009) or the short-term
restrictions of oil price shocks in Eq. (3).
Panel A:
2 4 6 8 10 12-0.1
0
0.1China
2 4 6 8 10 12-0.1
0
0.1France
2 4 6 8 10 12-0.1
0
0.1Germany
2 4 6 8 10 12-0.1
0
0.1India
2 4 6 8 10 12-0.1
0
0.1Italy
2 4 6 8 10 12-0.1
0
0.1Japan
2 4 6 8 10 12-0.1
0
0.1Korea
2 4 6 8 10 12-0.05
0
0.05United Kingdom
2 4 6 8 10 12-0.1
0
0.1United States
Panel B:
2 4 6 8 10 12-0.1
0
0.1Canada
2 4 6 8 10 12-0.1
0
0.1Saudi Arabia
2 4 6 8 10 12-0.1
0
0.1Kuwait
2 4 6 8 10 12-0.1
0
0.1Mexico
2 4 6 8 10 12-0.1
0
0.1Norway
2 4 6 8 10 12-0.1
0
0.1Russia
2 4 6 8 10 12-0.1
0
0.1Venezuela
Fig. 6. Responses of stock returns to oil supply shock (country-specific oil price data). Panel A: Responses of stock returns in oil-importing countries to oilsupply shock. Panel B: Responses of stock returns in oil-exporting countries to oil supply shock.
Y. Wang et al. / Journal of Comparative Economics 41 (2013) 1220–1239 1233
of oil price level. Thus, yt in Eq. (2) is replaced by zt = (oput, adut,Dopt,pdut,Dspt)0, where Dspt is the average stock market returnsacross either exporting or importing countries.15
15 The similar way of investigating the effects of oil price uncertainty can be seen in Chen and Hsu (2012). The study on the response of average returns cansufficiently reveal whether common impacts of oil uncertainty on stock markets in oil-exporting countries and on markets in oil-importing countries aredifferent. Also to save space, we do not investigate effects of oil uncertainty on stock prices in each country.

0%
20%
40%
60%
80%
100%
CAN KSA KUW MEX NOR RUS VEN CHN FRA GER IND ITA JPN KOR UK USA
Oil supply shock Aggregate demand shock Other oil-specific shocks Other stock-specific shocks
Fig. 7. Decompositions of 1-month stock price variations (the left panel lists oil-exporting countries and the right panel lists oil-importing countries).
0%
20%
40%
60%
80%
100%
CAN KSA KUW MEX NOR RUS VEN CHN FRA GER IND ITA JPN KOR UK USA
Oil supply shock Aggregate demand shock Other oil-specific shocks Other stock-specific shocks
Fig. 8. Decompositions of 12-month stock price variations (the left panel lists oil-exporting countries and the right panel lists oil-importing countries).
1234 Y. Wang et al. / Journal of Comparative Economics 41 (2013) 1220–1239
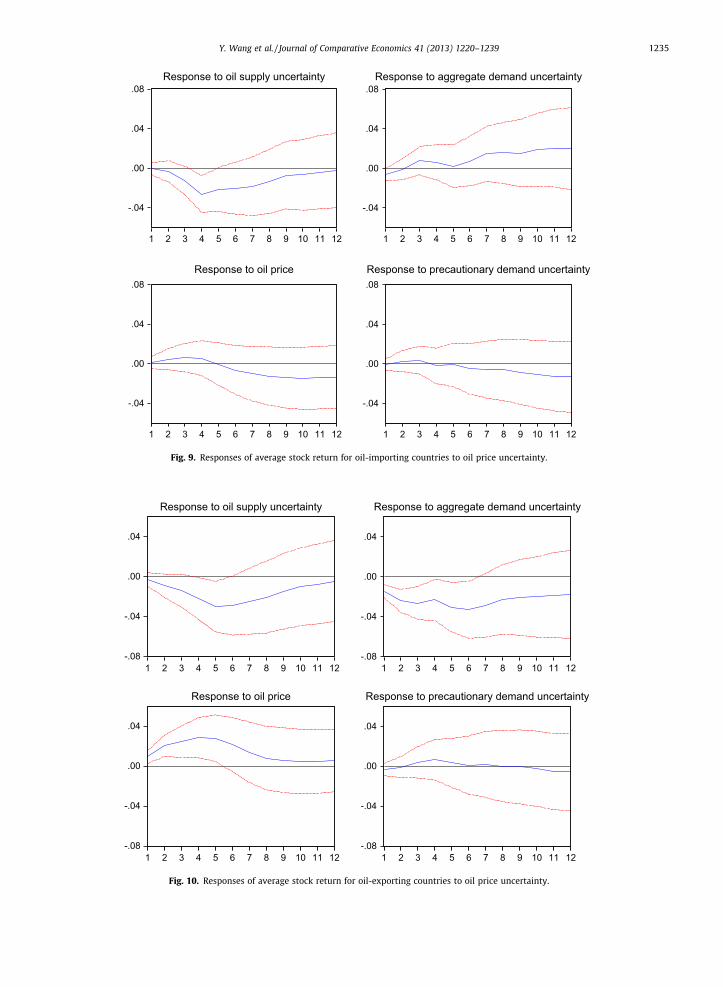
Figs. 9 and 10 illustrate the impact of oil price uncertainty on average stock returns in oil-importing and oil-exportingcountries, respectively. We find that oil supply uncertainty significantly depress stock returns in both types of countries.Similarly, the impact of aggregate demand uncertainty on stock returns in oil-importing countries is shown as significantlynegative at the month when the shock has arrived, although it loses its significance as time elapses. On the other hand, theimpact is also significantly negative and even more persistent in the exporting countries, where it lasts for 7 months,whereas the impact of precautionary demand uncertainty is shown as not significant.
We can explain these results as follows. An increase in business uncertainty depresses global economic activity (e.g.,Bachmann et al., 2010), resulting in lower oil demand and price. As time elapses, the decrease in oil price will lead to a reduc-tion of industry costs in oil-importing countries, partly offsetting the negative effects of increased business uncertainty. Onthe other hand, the lower oil demand is followed by a reduction of revenues in the oil-exporting countries. Thus, the negativeeffect of global demand uncertainty on the economies in oil-exporting countries is stronger. On the other hand, insignificanteffects of precautionary demand on stock markets can be followed by an insignificant response of stock market returns to theprecautionary demand uncertainty.
For a robustness check, we change the order of variables in the vector zt and obtain results that are highly consistent withthose in Figs. 9 and 10. In addition, there is again no inconsistency when we use absolute innovations as a proxy for uncer-tainty. The test results can be provided upon request.
-.04
.00
.04
.08
1 2 3 4 5 6 7 8 9 10 11 12
Response to oil supply uncertainty
-.04
.00
.04
.08
1 2 3 4 5 6 7 8 9 10 11 12
Response to aggregate demand uncertainty
-.04
.00
.04
.08
1 2 3 4 5 6 7 8 9 10 11 12
Response to oil price
-.04
.00
.04
.08
1 2 3 4 5 6 7 8 9 10 11 12
Response to precautionary demand uncertainty
Fig. 9. Responses of average stock return for oil-importing countries to oil price uncertainty.
-.08
-.04
.00
.04
1 2 3 4 5 6 7 8 9 10 11 12
Response to oil supply uncertainty
-.08
-.04
.00
.04
1 2 3 4 5 6 7 8 9 10 11 12
Response to aggregate demand uncertainty
-.08
-.04
.00
.04
1 2 3 4 5 6 7 8 9 10 11 12
Response to oil price
-.08
-.04
.00
.04
1 2 3 4 5 6 7 8 9 10 11 12
Response to precautionary demand uncertainty
Fig. 10. Responses of average stock return for oil-exporting countries to oil price uncertainty.
Y. Wang et al. / Journal of Comparative Economics 41 (2013) 1220–1239 1235
-.04
-.02
.00
.02
.04
.06
.08
1 2 3 4 5 6 7 8 9 10 11 12
Oil supply shock
-.04
-.02
.00
.02
.04
.06
.08
1 2 3 4 5 6 7 8 9 10 11 12
Aggregate demand shock
-.04
-.02
.00
.02
.04
.06
.08
1 2 3 4 5 6 7 8 9 10 11 12
Other oil-specific shock
-.04
-.02
.00
.02
.04
.06
.08
1 2 3 4 5 6 7 8 9 10 11 12
Other shocks to CSSD
Fig. 11. Responses of CSSD for oil-importing countries to oil price shocks.
-.04
.00
.04
.08
1 2 3 4 5 6 7 8 9 10 11 12
Oil supply shock
-.04
.00
.04
.08
1 2 3 4 5 6 7 8 9 10 11 12
Aggregate demand shock
-.04
.00
.04
.08
1 2 3 4 5 6 7 8 9 10 11 12
Other oil-specific shock
-.04
.00
.04
.08
1 2 3 4 5 6 7 8 9 10 11 12
Other shocks to CSSD
Fig. 12. Responses of CSSD for oil-exporting countries to oil price shocks.
1236 Y. Wang et al. / Journal of Comparative Economics 41 (2013) 1220–1239
Y. Wang et al. / Journal of Comparative Economics 41 (2013) 1220–1239 1237
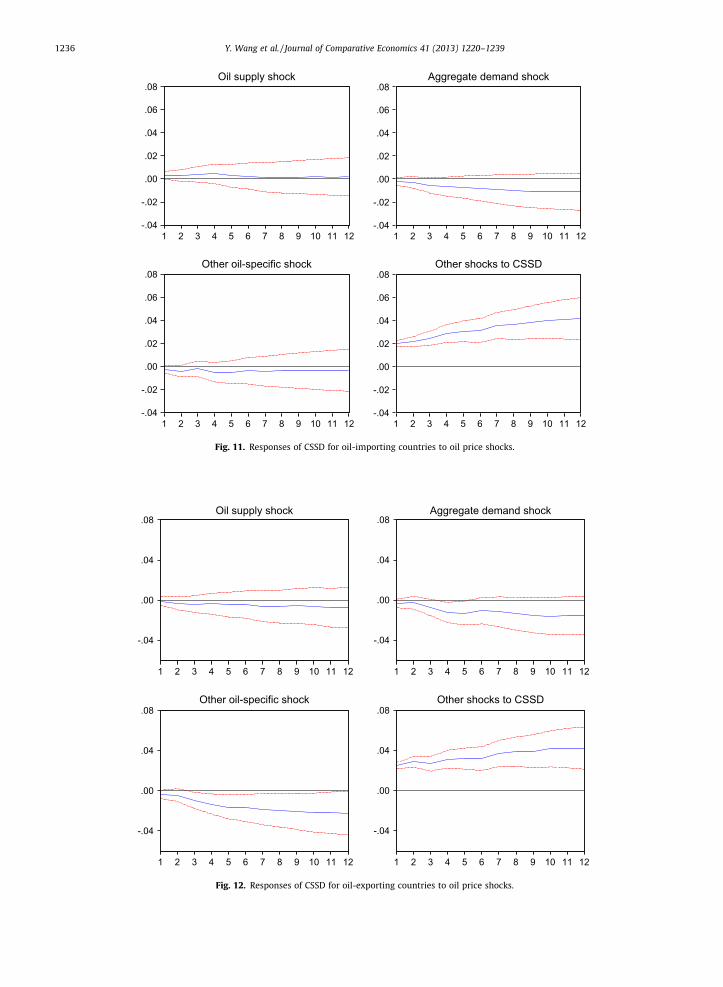
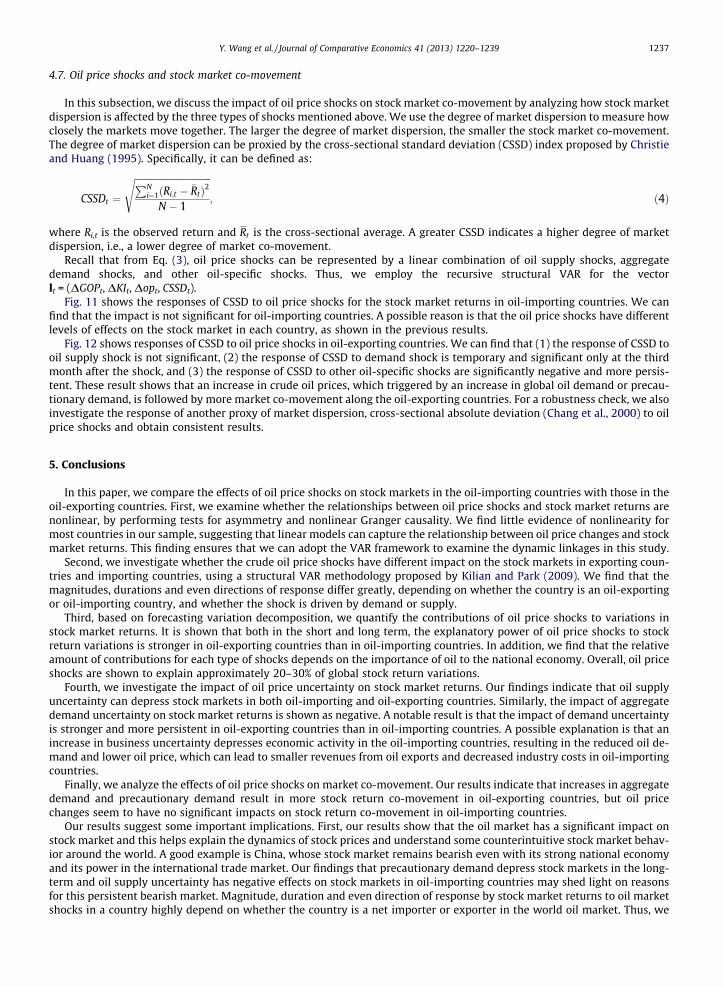
4.7. Oil price shocks and stock market co-movement
In this subsection, we discuss the impact of oil price shocks on stock market co-movement by analyzing how stock marketdispersion is affected by the three types of shocks mentioned above. We use the degree of market dispersion to measure howclosely the markets move together. The larger the degree of market dispersion, the smaller the stock market co-movement.The degree of market dispersion can be proxied by the cross-sectional standard deviation (CSSD) index proposed by Christieand Huang (1995). Specifically, it can be defined as:
CSSDt ¼
ffiffiffiffiffiffiffiffiffiffiffiffiffiffiffiffiffiffiffiffiffiffiffiffiffiffiffiffiffiffiffiffiffiPNi¼1ðRi;t � �RtÞ2
N � 1
s; ð4Þ
where Ri,t is the observed return and Rt is the cross-sectional average. A greater CSSD indicates a higher degree of marketdispersion, i.e., a lower degree of market co-movement.
Recall that from Eq. (3), oil price shocks can be represented by a linear combination of oil supply shocks, aggregatedemand shocks, and other oil-specific shocks. Thus, we employ the recursive structural VAR for the vectorlt = (DGOPt, DKIt, Dopt, CSSDt).
Fig. 11 shows the responses of CSSD to oil price shocks for the stock market returns in oil-importing countries. We canfind that the impact is not significant for oil-importing countries. A possible reason is that the oil price shocks have differentlevels of effects on the stock market in each country, as shown in the previous results.
Fig. 12 shows responses of CSSD to oil price shocks in oil-exporting countries. We can find that (1) the response of CSSD tooil supply shock is not significant, (2) the response of CSSD to demand shock is temporary and significant only at the thirdmonth after the shock, and (3) the response of CSSD to other oil-specific shocks are significantly negative and more persis-tent. These result shows that an increase in crude oil prices, which triggered by an increase in global oil demand or precau-tionary demand, is followed by more market co-movement along the oil-exporting countries. For a robustness check, we alsoinvestigate the response of another proxy of market dispersion, cross-sectional absolute deviation (Chang et al., 2000) to oilprice shocks and obtain consistent results.
5. Conclusions
In this paper, we compare the effects of oil price shocks on stock markets in the oil-importing countries with those in theoil-exporting countries. First, we examine whether the relationships between oil price shocks and stock market returns arenonlinear, by performing tests for asymmetry and nonlinear Granger causality. We find little evidence of nonlinearity formost countries in our sample, suggesting that linear models can capture the relationship between oil price changes and stockmarket returns. This finding ensures that we can adopt the VAR framework to examine the dynamic linkages in this study.
Second, we investigate whether the crude oil price shocks have different impact on the stock markets in exporting coun-tries and importing countries, using a structural VAR methodology proposed by Kilian and Park (2009). We find that themagnitudes, durations and even directions of response differ greatly, depending on whether the country is an oil-exportingor oil-importing country, and whether the shock is driven by demand or supply.
Third, based on forecasting variation decomposition, we quantify the contributions of oil price shocks to variations instock market returns. It is shown that both in the short and long term, the explanatory power of oil price shocks to stockreturn variations is stronger in oil-exporting countries than in oil-importing countries. In addition, we find that the relativeamount of contributions for each type of shocks depends on the importance of oil to the national economy. Overall, oil priceshocks are shown to explain approximately 20–30% of global stock return variations.
Fourth, we investigate the impact of oil price uncertainty on stock market returns. Our findings indicate that oil supplyuncertainty can depress stock markets in both oil-importing and oil-exporting countries. Similarly, the impact of aggregatedemand uncertainty on stock market returns is shown as negative. A notable result is that the impact of demand uncertaintyis stronger and more persistent in oil-exporting countries than in oil-importing countries. A possible explanation is that anincrease in business uncertainty depresses economic activity in the oil-importing countries, resulting in the reduced oil de-mand and lower oil price, which can lead to smaller revenues from oil exports and decreased industry costs in oil-importingcountries.
Finally, we analyze the effects of oil price shocks on market co-movement. Our results indicate that increases in aggregatedemand and precautionary demand result in more stock return co-movement in oil-exporting countries, but oil pricechanges seem to have no significant impacts on stock return co-movement in oil-importing countries.
Our results suggest some important implications. First, our results show that the oil market has a significant impact onstock market and this helps explain the dynamics of stock prices and understand some counterintuitive stock market behav-ior around the world. A good example is China, whose stock market remains bearish even with its strong national economyand its power in the international trade market. Our findings that precautionary demand depress stock markets in the long-term and oil supply uncertainty has negative effects on stock markets in oil-importing countries may shed light on reasonsfor this persistent bearish market. Magnitude, duration and even direction of response by stock market returns to oil marketshocks in a country highly depend on whether the country is a net importer or exporter in the world oil market. Thus, we
1238 Y. Wang et al. / Journal of Comparative Economics 41 (2013) 1220–1239
must identify the driving forces of crude oil price dynamics and the net position of a country in crude oil market to properlyanalyze the impact of oil price shocks on its domestic stock market.
Second, our results reveal some properties in stock market dynamics which are directly related to oil-related risk man-agement. For example, it is shown that the effects of oil demand uncertainty on stock markets in oil-exporting countries aresignificant and persist 7 months, whereas the effects in oil-importing countries are shown as temporary. This difference im-plies that the market participants in oil-exporting countries should use futures contracts or other financial instruments tohedge demand uncertainty, while the participants in oil-importing countries do not need to pay much attention to demanduncertainty.
Third, our results suggest an impact of oil-related shocks on global portfolio management. Diversification will be lesseffective if the asset returns are more correlated so that the risk cannot be fully diversified away. This study shows thatoil price shocks tend to induce more market co-movement in oil-exporting countries but not in oil-importing countries.Therefore, a portfolio of stocks in oil-importing countries can be a better choice than a portfolio of stocks in oil-exportingcountries in terms of diversification.
Acknowledgments
We would like to thank two anonymous referees whose comments and suggestions greatly improve the quality of theearlier manuscript. This work is supported by the National Natural Science Foundation of China (No. 70831004). Li Yangthanks the financial support from Australian Research Council Linkage grant LP0882468.
References
Alquist, Ron, Kilian, Lutz, 2010. What do we learn from the price of crude oil futures? Journal of Applied Econometrics 25, 539–573.Apergis, Nicholas, Miller, Stephen M., 2009. Do structural oil-market shocks affect stock prices? Energy Economics 31, 569–575.Bachmann, Rudiger, Elstner, Steffen, Sims, Eric R., 2010. Uncertainty and Economic Activity: Evidence from Business Survey Data. NBER Working Paper
16143.Barsky, Robert, Kilian, Lutz, 2004. Oil and macroeconomy since the 1970s. Journal of Economic Perspectives 18, 115–134.Basher, Syed A., Haug, Alfred A., Sadorsky, Perry, 2012. Oil prices, exchange rates and emerging stock markets. Energy Economics 34, 227–240.Bernanke, Ben S., 1983. Irreversibility, uncertainty, and cyclical investment. Quarterly Journal of Economics 98, 85–106.Bjørnland, Hilde C., 2009. Oil price shocks and stock market booms in an oil-exporting country. Scottish Journal of Political Economy 56, 232–254.Blanchard, Olivier, Gali, Jordi, 2007. The Macroeconomic Effects of Oil Price Shocks: Why are 2000’s So Different from the 1970’s?. National Bureau of
Economic Research Working Paper 13368.Brennan, Michael, Schwartz, Eduardo, 1985. Evaluating natural resource investment. Journal of Business 58, 1135–1157.Chang, Eric C., Cheng, Joseph W., Khorana, Ajay, 2000. An examination of herd behavior in equity markets: an international perspective. Journal of Banking
and Finance 24, 1651–1679.Chen, Shiu-Sheng, 2010. Do higher oil prices push the stock market into bear territory? Energy Economics 32, 490–495.Chen, Shiu-Sheng, Hsu, Kai-Wei, 2012. Reverse globalization: does high oil price volatility discourage international trade? Energy Economics 34, 1634–
1643.Christie, William G., Huang, Roger D., 1995. Following the pied piper: do individual returns herd around the market? Financial Analysts Journal 51, 31–37.Cologni, Alessandro, Manera, Matteo, 2009. The asymmetric effects of oil shocks on output growth: a Markov-switching analysis for the G-7 countries.
Economic Modelling 26, 1–29.Diks, Cees, Panchenko, Valentyn, 2006. A new statistic and practical guidelines for nonparametric Granger causality testing. Journal of Economic Dynamics
& Control 30, 1647–1669.Elder, John, Serletis, Apostolos, 2010. Oil price uncertainty. Journal of Money, Credit and Banking 42, 1137–1159.Groenewold, Nicolaas, Tang, Sam H.K., Wu, Yanrui, 2003. The efficiency of the Chinese stock market and the role of the banks. Journal of Asian Economics 14,
593–609.Groenewold, Nicolaas, Tang, Sam H.K., Wu, Yanrui, 2004. The dynamic interrelationships between the Greater China share markets. China Economic Review
15, 45–62.Hamilton, James D., 1983. Oil and the macroeconomy since World War II. Journal of Political Economy 91, 228–248.Hamilton, James D., 1996. This is what happened to the oil price-macroeconomy relationship. Journal of Monetary Economics 38, 215–220.Hamilton, James D., 2003. What is an oil shock? Journal of Econometrics 113, 363–398.Hamilton, James D., 2009. Understanding crude oil prices. Energy Journal 30, 179–206.Hamilton, James D., 2011a. Historical Oil Shocks. Working paper, University of California, San Diego.Hamilton, James D., 2011b. Nonlinearities and the macroeconomic effects of oil prices. Macroeconomic Dynamics 15, 364–378.Henry, Claude, 1974. Investment decisions under uncertainty: the irreversibility effect. American Economic Review 64, 1006–1012.Hiemstra, Craig, Jones, Jonathan D., 1994. Testing for linear and nonlinear Granger causality in the stock price-volume relation. Journal of Finance 49, 1639–
1664.Hooker, Mark A., 1996. What happened to the oil price-macroeconomy relationship? Journal of Monetary Economics 38, 195–213.Huang, Roger, Masulis, Ronald, Stoll, Hans, 1996. Energy shocks and financial markets. Journal of Futures Markets 16, 1–27.Jones, Charles, Kaul, Gautam, 1996. Oil and stock markets. Journal of Finance 51, 463–491.Jung, Hansol, Park, Cheolbeom, 2011. Stock market reaction to oil price shocks: a comparison between an oil-exporting economy and an oil-importing
economy. Journal of Economic Theory and Econometrics 22, 1–29.Kilian, Lutz, 2008. Exogenous oil supply shocks: how big are they and how much do they matter for the US economy? Review of Economics and Statistics 90,
216–240.Kilian, Lutz, 2009. Not all oil price shocks are alike: disentangling demand and supply shocks in the crude oil market. American Economic Review 99, 1053–
1069.Kilian, Lutz, Park, Cheolbeom, 2009. The impact of oil price shocks on the US stock market. International Economic Review 50, 1267–1287.Kilian, Lutz, Vigfusson, Robert J., 2011. Nonlinearities in the oil price-output relationship. Macroeconomic Dynamics 15, 337–363.Kilian, Lutz, Rebucci, Alessandro, Spatafora, Nikola, 2009. Oil shocks and external balances. Journal of International Economics 77, 181–194.Majd, Saman, Pindyck, Robert S., 1987. Time to build, option value, and investment decisions. Journal of Financial Economics 18, 7–27.Masih, Rumi, Peters, Sanjay, Mello, Lurion De, 2011. Oil price volatility and stock price fluctuations in an emerging market: evidence from South Korea.
Energy Economics 33, 975–986.Miller, J. Isaac, Ratti, Ronald A., 2009. Crude oil and stock markets: stability, instability and bubbles. Energy Economics 31, 559–568.

Y. Wang et al. / Journal of Comparative Economics 41 (2013) 1220–1239 1239
Mork, Knut A., 1989. Oil and the macroeconomy when prices go up and down: an extension of Hamilton’s results. Journal of Political Economy 91, 740–744.Mu, Xiaoyi, Ye, Haichun, 2011. Understanding the crude oil price: how important is the China factor? The Energy Journal 32, 69–92.Papapetrou, Evangelia, 2001. Oil price shocks, stock market, economic activity and employment in Greece. Energy Economics 23, 511–532.Park, Jungwook, Ratti, Ronald A., 2008. Oil price shocks and stock markets in the US and 13 European countries. Energy Economics 30, 2587–2608.Rotemberg, Julio J., Woodford, Michael, 1996. Imperfect competition and the effects of energy price increases on economic activity. Journal of Money, Credit
and Banking 28, 549–577.Sadorsky, Perry, 1999. Oil price shocks and stock market activity. Energy Economics 21, 449–469.Wei, Chao, 2003. Energy, the stock market, and the Putty-Clay investment model. American Economic Review 93, 311–323.