oil palm bulletin 52 (may 2006) p. 25 – 47 modelling vegetative...
TRANSCRIPT

Modelling Vegetative Dry Matter Production of Oil Palm
25
Modelling Vegetative Dry Matter Production of OilPalm**
Ian E Henson*
Oil Palm Bulletin 52 (May 2006) p. 25 – 47
ABSTRACT
Previous oil palm simulation models such asOPSIM and SIMPALM have relied on directmeasurements of vegetative biomass andbiomass production as a basis for predictingtotal biomass production and bunch yield. Toovercome the limitations imposed by the needfor extensive on site measurements, methods ofsimulating vegetative biomass production(VBP) are needed. This paper describesapproaches adopted for this purpose in themechanistic, process-orientated model,OPRODSIM, a new comprehensive model of oilpalm dry matter production and development.
Using the standard method, leaf areaindex (LAI) is first simulated and used to givetotal VBP from an empirically derived curve.The VBP is then partitioned between the mainvegetative organs, fronds, trunk and roots,using either constant or age-dependentpartition coefficients. In an alternative method,frond biomass production (FBP) is derivedsuccessively from frond emission rate, singlefrond dry weight and planting density whileroot and trunk biomass production (RBP andTBP, respectively) are obtained from typicalgrowth curves produced using data from theliterature. FBP, RBP and TBP are summed togive total VBP. Age-dependent partitioncoefficients for frond, trunk and root biomassproduction are then calculated from the dataand can be used for partitioning the VBPderived by the standard method. A furtheroption is to derive FBP as for the alternativemethod and then partition the remainingbiomass production between roots and trunk.
Model outputs using various options arecompared and the effects of additionalmodifying factors on VBP explored. Asensitivity analysis showed specific leaf area,
* Malaysian Palm Oil Board, P. O. Box 10620, 50720 Kuala Lumpur, Malaysia.** This is the second of a series of papers describing various aspects of mechanistic simulation modelling of oil palm considered
during the course of constructing the oil palm growth model, OPRODSIM. The third and fourth part are available in MPOBTechnology No. 28 and No. 29 respectively.
planting density, single frond dry weight andfrond number per palm to have the greatesteffect on VBP using the standard approachwhile for the alternative method, only frondproduction and planting density were foundimportant. In simulation tests for three datasets, the model gave mean values of VBP thatwere within 3% to 8% of actual means usingthe standard method and 4% to 10% using thealternative method. The consequences of thevarious options for bunch yield are alsodescribed.
ABSTRAK
Simulasi model sawit sebelum ini sepertiOPSIM dan SIMPALM bergantung padaukuran terus biojisim tampang danpengeluaran biojisim sebagai asas untukmeramal jumlah pengeluaran biojisim danhasil tandan. Bagi mengatasi masalahkeperluan mengukur di lapangan, kaedahsimulasi pengeluaran biojisim tampang (VBP)adalah diperlukan. Artikel ini menghuraikanpendekatan yang diambil bagi tujuan modelmekanistik proses-orientasi, OPRODSIM, satumodel baru pengeluaran dan pembangunanbiojisim kering sawit yang menyeluruh.
Dengan menggunakan kaedah piawai,indeks luas daun mula disimulasikan dandigunakan untuk memberikan jumlah VBPdari keluk yang diperoleh secara empirikal.VBP ini kemudiannya dibahagi antara organtampang utama iaitu pelepah, batang danakar menggunakan sama ada malar ataupekali pembahagi penggantungan umur.Dalam kaedah alternatif, pengeluaranbiojisim pelepah (FBP) diperoleh secaraberperingkat dari kadar pengeluaran pelepah,berat pelepah kering tunggal dan kepadatantanaman, manakala pengeluaran biojisim

Oil Palm Bulletin 52
26
akar (RBP) dan pengeluaran biojisim batang(TBP) diperoleh dari keluk pertumbuhanbiasa yang disediakan dengan menggunakandata dari penulisan. FBP, RBP dan TBPdijumlahkan menjadi VBP. Pekali pembahagipenggantungan umur untuk pengeluaranbiojisim pelepah, akar dan batang kemudiandikira dari data dan digunakan untukmembahagikan VBP diperoleh melalui kaedahpiawai. Pilihan seterusnya ialahmendapatkan PBP sebagai kaedah alternatifdan kemudian bahagi baki biojisim antaraakar dan batang.
Model output menggunakan pelbagaipilihan dibandingkan dan kesan faktorperubahan tambahan dikaji. Ujian sensitivitimenunjukkan luas daun spesifik, kepadatantanaman, berat kering pelepah tunggal danbilangan pelepah sepokok mempunyai kesanterbesar ke atas VBP menggunakan kaedahpiawai, manakala pengeluaran pelepah dankepadatan tanaman ditemui mustahak dalamkaedah alternatif. Untuk ujian simulasi tigaset data, model ini memberi nilai purata VBPdalam lingkungan 3%-8% dari purata sebenarmenggunakan kaedah piawai, dan 4%-10%menggunakan kaedah alternatif. Kesan daripelbagai pilihan untuk hasil tandan jugadihuraikan.
Keywords: modelling, oil palm, vegetative drymatter production, assimilate partitioning.
INTRODUCTION
The hypothesis that vegetative growth of oilpalm has priority over reproductive growth foravailable assimilate (Corley et al., 1971a; Corley,1976) has proved to be a useful, although notinfallible, guideline. It was adopted as a centralprecept when constructing the oil palmsimulation model OPSIM (van Kraalingen, 1985;van Kraalingen et al., 1989), an extendedversion of OPSIM (Gerritsma, 1988) and arelated model, SIMPALM (Dufrene, 1989;Dufrene et al., 1990). A consequence of thisapproach is that the simulation of vegetative drymatter or vegetative biomass production (VBP)assumes prime importance for yield prediction.In the above-mentioned models, measuredvalues of VBP (SIMPALM) or valuesinterpolated from such measurements (OPSIM),were used to facilitate the simulation of bunchyields and total dry matter production. The useof field measurements of VBP obviously assists
in arriving at a realistic yield assessment but, atthe same time, severely limits the application ofthe models to sites for which detailed vegetativedata are available, and their usefulness assimulation tools. Such models can, therefore,only be described as partial since important andmajor growth components are not independentlysimulated.
The mechanistic, process-orientatedmodel, OPRODSIM, which is being developed atMPOB (Henson, 2005), is essentially anextension of these earlier models but is producedwith the aim of overcoming these and otherlimitations. This paper describes the methodsused in the model for the simulation of VBP andits components.
MODEL OPTIONS AND PROCEDURES
Overview
Two main methods together with asubsidiary one, have been developed forestimating VBP. In the first, or the standardmethod, VBP is obtained from leaf area index(LAI) using an empirical regression. It is thenpartitioned directly into its major components,namely, root, trunk and frond biomassproduction (RBP, TBP and FBP, respectively)using constant or age-dependent partitioncoefficients (Figure 1a).
The second or alternative option (Figure1c) takes another route whereby growth of roots,trunk and fronds are independently simulatedand then summed to give the total VBP.Partition coefficients for frond, trunk and rootbiomass production can be calculated from thedata and used for partitioning the VBP derivedby the standard method.
In a later developed variation of thestandard method (Figure 1b), FBP is separatelycalculated from single frond dry weight, andthen subtracted from total VBP to give aresidual production. This is then partitionedinto trunk and root components.
In all cases, simulation commences fromthe time of planting in the field and may extendto cover the whole economic lifetime (20-30years) of the stand. Standard planting densities(PD) and other cultural practices are assumedas defaults, but effects on VBP of varying PDand operations such as frond pruning, standthinning and ablation, may also be simulated, asmay the variation in the innate characteristics

Modelling Vegetative Dry Matter Production of Oil Palm
27
Frond No. per palm
Frond No. per palm

Oil Palm Bulletin 52
28
of the planting material (e.g. frond productionrate, rate of frond dry matter increase, specificleaf area and root turnover). For sites prone towater deficits, the effects of drought and itsrelief by irrigation can also be explored.
Simulating VBP Using the StandardMethod
The central feature of this simulationmethod relies on an empirical relationshipbetween VBP and LAI. LAI is calculated from itscomponents, mean single frond area (SFA), frondnumber per palm and PD. SFA is calculatedfrom single frond dry weight and specific leafarea (SLA; m2 kg-1) (Figure 1a).
Single frond dry weight. The frond towhich the single frond dry weight (SFDW) refersis assumed to represent the average sized frond
Figure 1. Flow charts showing sequences involved in simulating oil palm vegetativebiomass (dry matter) production (VBP) using three methods.
Notes: The items in solid boxes represent the main elements in the calculations; those in dashed boxes aremodifying factors. In the standard method (a), total VBP is derived from leaf area index and then partitionedinto frond biomass production (FBP), trunk biomass production (TBP) and root biomass production (RBP). In avariant of this method (b), FBP is derived from single frond dry weight, frond production rate and plantingdensity and the difference between VBP and FBP is then partitioned between TBP and RBP. In both cases,partitioning of the components may be done using either constant, or age-dependent, partition coefficients. Inthe alternative method (c), total VBP is the sum of FBP, derived as for (b) from single frond dry weight andother components, TBP and RBP, both obtained from standard growth curves.
on the palm. SFDW is a convenient startingpoint since it is perhaps the most frequently andreadily assessed oil palm vegetative character. Itis usually derived indirectly from measurementsof petiole cross-section (Corley et al., 1971b;Corley and Breure, 1981) using frond 17, thoughfor young palms where frond production is rapidand the frond size quickly changes, a youngerfrond may be more representative. Otherwise,frond 17 is easily located (being two fronds downfrom frond one on the same whorl), about mid-way between the youngest and oldest fronds.SFDW is generally assessed annually and isoften done in conjunction with frond samplingfor leaf nutrient analysis, a routine practice inmost oil palm estates.
The size of such an average frond willvary, both with the planting material and sitefactors such as soil type, fertility, climate and
Frond BP per hectare

Modelling Vegetative Dry Matter Production of Oil Palm
29
during the early years after planting. Corley andGray (1976) provide an example showing therate to be low (c. 1.6 to 2 per month) in the firstyear, to rise to a peak during the second andthird years and then to decline, perhapsstabilizing around the 10th year. These data,together with others, are represented in Figure4. As with other palm parameters, there isconsiderable variation and, again, data arelacking for older palms.
Calculation of FPR in the model wasmainly based on the curve from Gerritsma andSoebagyo (1999) which falls between theextremes shown in Figure 4. The lower portionof the curve also coincides with the linear trendof Squire (1985), so lending it credence.However, the data do not commence until twoyears after planting (YAP) and it was necessaryto modify the curve by assuming an initially lowrate of frond production (after Corley and Gray,1976) followed by a rapid increase. Also, if thecurve from Gerritsma and Soebagyo (1999) isextrapolated past the last year of measurement(14 YAP), the subsequent decline is so gradualthat FPR at 20 years is still above 22 and notmuch less by 30 YAP (21.9). As it is uncertainwhether such a rate would normally besustained in old palms, an option is provided inthe model to progressively lower the rate to 16fronds per year by year 30. The resultant trendsin FPR produced by these modifications areshown in Figure 5a.
TFNP was calculated from FPR based ona linear relationship observed between the two,derived from data of the first experiment ofGerritsma and Soebagyo (1999). The TFNP inthe later years of a planting (Figure 5b) thusdepends on whether a high or a low FPR isselected (Figure 5a).
Examples of LAI, calculated as theproduct of SFA, TFNP and PD, are shown inFigure 6. In the calculation, PD is assumedconstant after planting (i.e. no losses of palmsare allowed for), although options to thin thestand and for a progressive loss of stand (e.g.due to disease) are available in a later version.
Vegetative dry matter production fromLAI. Both above-ground and total VBP show agood relationship to LAI but it is total VBP thatis required by the model. As most studies haveassessed only above-ground dry matter there arefew data sets for total VBP. The relationship fortotal VBP is shown in Figure 7.
soil water supply. Presently, data are insufficientto reliably predict SFDW from such factors andso, in the model, an option is provided to selecta low, medium or high growth frond rate givingrise to different SFDW in any one year. Curvesrepresenting these options are shown in Figure2 which also gives examples of SFDW forvarious sites and palm ages. Given thevariability, the curves were not fitted toparticular data but chosen to represent theapproximate minimum, medium and maximumgrowth encountered. Corley and Gray (1976)presented data for palms on inland latosols thatshowed much less scatter, and where therelationship with age could be represented bytwo linear regressions (the first having thesteeper slope), which intersected at about theseventh year. The general trend was initiallysimilar to that of the high curve shown in Figure2 but later, fell somewhat below it.
As noted by Corley and Tinker (2003),SFDW data are lacking for palms above 20 yearsand, consequently, there is some uncertainty inestimating SFDW for palms above this age.
Provision is made within the model forSFDW to be reduced by a soil water deficit. Thisis discussed further elsewhere (Henson, 2006b).
Frond area and leaf area index. Thearea of a frond is calculated as the product ofSFDW and SLA. SLA can be defined on the basisof either leaflet or total frond weight. The latteris used here. For numerous trials, Squire (1985)found SLA (total frond basis) to be around 2.6 m2
kg-1 but this is known to change with age (e.g.Corley et al., 1971a). Variation in SLA is evidentfrom the data assembled in Figure 3 whichcovers a wide range of palm ages. The curveobtained (r2 = 0.911) was used in the model toderive SFA from SFDW.
LAI (m2 m-2) is calculated in theconventional way (Corley and Breure, 1981) asthe product of SFA, total frond number per palm(TFNP) and PD. Either site-dependent defaultor user-specified values may be used for thelatter. TFNP results from the difference betweenfrond production (strictly emission) and fronddeath or removal by pruning. In practice, frondsare usually cut off before they senesce. WhileTFNP can thus be simulated using the rates offrond production and pruning, a different andless complex approach was taken in the modelwith TFNP being related to frond productionrate (FPR) as described below.
FPR, determined by recording frondopening or emission, changes dramatically

Oil Palm Bulletin 52
30
Figure 2. Representative frond dry weight growth curves used in the model compared with field data.
Notes: Three third-order polynomial curves represent low, medium and high frond growth rate options. Thesources of field data are given below. Most data were derived from petiole cross-section measurements convertedto dry weight using the equation of Corley et al. (1971b). For palms < six years in the field, corrections wereapplied to the data as described by Henson (1993). All data are from Malaysia except for those of Breure (1982).
Data set Source(s) Notes
Inland 1 Henson (unpublished) three sitesCorley and Breure (1992) non-ablated controlsHenson and Chang (1990) unirrigated controls
Inland 2 Henson (unpublished) –
Inland 3 Rao et al. (1992) means of three planting densities
Lys. Foong (2000) control palms surrounding lysimeter
Coastal 1 Gray (1969) –
Coastal 2 Henson and Chang (1990) unirrigated palms
Coastal 3 Henson (unpublished) –
Coastal 4 Kwan (1994) trial in Sabah
Peat Henson and Mohd Tayeb(2003) trial in Perak
PNG Breure (1982) trials in Papua New Guinea
Changes in single frond dry weight over time
Sin
gle
fron
d dr
y w
t (k
g)
Years after planting

Modelling Vegetative Dry Matter Production of Oil Palm
31
Figure 3. Relationships between single frond leaflet area and dry weight calculatedfrom field measurements.
Notes: A fourth-order polynomial curve, forced to zero, was fitted through the data (r2 = 0.911). Data sources aregiven below. Most data were derived using non-destructive measurements as described by Corley et al. (1971b)with corrections applied for young palms as described by Henson (1993). All data are from Malaysia except forthose of Breure (1982).
Data set Source(s) Notes
Inland 1 Henson (unpublished) three sitesCorley and Breure (1992) non-ablated controlsHenson and Chang (1990) unirrigated controls
Inland 2 Henson (unpublished) -
Inland 3 Rao et al. (1992) means of three planting densities
Lys. Foong (2000) control palms surrounding lysimeter
Coastal 1 Henson (unpublished) -
Coastal 2 Kwan (1994) trial in Sabah
Peat Henson and Mohd Tayeb(2003) trial in Perak
PNG Breure (1982) in Papua New Guinea
Frond area vs. dry weight
Sin
gle
fron
d ar
ea (
m2 )
16
14
12
10
8
6
4
2
0
Single frond dry weight (kg)
0 1 2 3 4 5 6 7

Oil Palm Bulletin 52
32
Figure 4. Examples of changes in frond production (emission) rates (per palm per year) with palm age.
Notes: Four data sets are shown:
1. Inland - approximate annual means from a graph of Corley and Gray (1976) for inland latosols in Malaysia.2. Sumatra – mean data from Gerritsma and Soebagyo (1999) representing three cultivars in two density trials.3. Misc. - data from Squire (1985) for maximum yield plots in Malaysian fertilizer trials.4. Peat - data from Henson and Mohd Tayeb (2003) - means of three planting densities in a trial in Perak.
VBP also shows a good relationship toSFDW (data not presented) and this could beused to short-cut the above intervening steps.However, it was considered preferable to includethem in order to make the model more versatile.
Partitioning of vegetative biomassproduction. Partitioning the total assimilateschanneled into VBP represents the final step inFigure 1a. There is little understanding of themechanisms involved in partitioning and so anempirical approach using partition coefficientswas adopted. Several alternatives were exploredand are provided as options. The first involvesthe use of coefficients that are fixed, i.e.independent of palm age. However, these werefound to result in rather atypical growth curves,especially for the trunk, as described in aprevious paper (Henson, 2006a). A second usesage-dependent partition coefficients derived
from the independent organ growth curves usedto derive VBP as in the alternative method (seebelow). The resultant partitioning was found tobe generally reflective of that shown by the dataof Corley et al. (1971a). Figure 8 gives thedetails and compares the results of usingconstant, as opposed to age-dependent,coefficients.
A third approach, shown in Figure 1b,uses the FBP calculated from SFDW (describedin the next section), and subtracts this from thetotal VBP. The residual production is thenpartitioned between trunk and roots usingeither constant or age-dependent partitioncoefficients.
Partitioning of root biomassproduction. It is important in the case of RBPto consider the two components of production,
Misc.
Frond production rates
Ann
ual
fron
d pr
oduc
tion
Years in field

Modelling Vegetative Dry Matter Production of Oil Palm
33
Figure 5. (a) Curves used to give the annual frond production rate (FPR).(b) Total frond number per palm calculated from the FPR data.
Notes: In (a) two options are provided, high and low, differing in the extent of decline in FPR from the 14th yearafter planting. Production during the first two years is described using a separate equation.
Annual frond production rateF
rond
pro
duct
ion
per
palm
per
yea
r
Years after planting
Total frond number per palm
Tota
l fr
ond
num
ber
per
palm
Years after planting

Oil Palm Bulletin 52
34
Figure 6. Leaf area index (LAI) simulated for inland, dry and coastal sites.
Note: Differences in LAI are due to planting density (136 palms per hectare at the coastal and 148 at the othersites) and soil water deficit (simulated for the dry but not for the other sites.
VBP (total) vs. LAI
VB
P (
t ha
-1 y
r-1)
Leaf area index (m2 m-2)
Figure 7. Total (shoot plus root) vegetative biomass production (VBP)plotted against leaf area index (LAI) for several palm stands in West Malaysia.
Notes: Root biomass production includes a measure or allowance for turnover. A third-order polynomial curve,forced to zero, was fitted through the data (r2=0.967).
LAI
(m2
m-2)
Changes in LAI simulated for three sites
Years after planting

Modelling Vegetative Dry Matter Production of Oil Palm
35
Figure 8. Partitioning of total vegetative biomass production (VBP) derived by the standardmethod into root (R), trunk (TR) and frond (FR) biomass production, using either
(a) constant, or (b) age-dependent, partition coefficients.
Notes: Data are for a coastal site with 136 palms per hectare. The constant coefficients used are: root, 0.18; trunk,0.12; frond, 0.70. The age-dependent coefficients are third-order polynomials (Henson, 2006a).
Bio
mas
s pr
oduc
tion
(t h
a-1 y
r--1 )
Bio
mas
s pr
oduc
tion
(t h
a-1 y
r--1 )
VBP partitioning using constant partition coefficients
Years after planting
VBP partitioning using variable partition coefficients
Years after planting

Oil Palm Bulletin 52
36
namely, biomass increment and turnover1. Theneed to consider the components arises from thefact that for a given amount of assimilateallocated for root production, the greater theturnover, the less is the accumulation ofstanding biomass (SB). As SB also usesassimilates for maintenance respiration (MR),the lower the SB, the lower will be the MR. Anage-dependent division between root biomassincrement (RBI) and root biomass turnover(RBT) is employed in partitioning, thederivation of which is described in the nextsection.
Alternative Method for Simulating VBP
The processes involved in this method areshown in Figure 1c. Here, VBP is obtained asthe sum of separate production curves for roots,trunk and fronds, with FBP being calculatedfrom SFDW.
Frond biomass production. Calculationof FBP from SFDW has several steps in commonwith those leading to derivation of LAI. Firstly,SFDW is estimated as previously described. Perpalm, FBP is the product of SFDW and FPR,and per hectare, of SFDW, FPR and PD. FPR isknown to be affected by soil water status as wellas planting density, though effects of the latterare generally small. Both factors are built intothe model while there is also a user option todirectly vary FPR to represent differentmaterials and site conditions.
In Figure 9a, FBP obtained by thisprocedure is compared with FBP obtained by thestandard method of partitioning the total VBPusing either constant or age-dependent partitioncoefficients. It can be seen that the curveresulting from apportioning a constant fractionof VBP to fronds differs somewhat from theother two. However, the differences between thethree approaches are not very substantial.
Trunk biomass production. Details ofderiving TBP are given in a previous paper(Henson, 2006a). Comparative curves obtainedusing the different options are shown in Figure9b. Here, the use of a constant partition factormarkedly changes the pattern of growthcompared with the standard growth curve, andcannot be recommended where realisticsimulation of trunk growth is desired.
Root biomass production and itscomponents. While for the fronds and trunk, noseparate accounting of the components ofproduction, namely, biomass increment andturnover, is required, as mentioned above this isnot true for the roots. In the alternative method,RBI is obtained as the difference betweensuccessive samplings of standing root biomass(SRB), data for which are presented in Figure10. These were derived in various ways andindicate the very large variation and, hence,uncertainty, that typifies root measurements.From these data, annual mean values wereobtained and a trend line fitted. The resultantequation was then used to define daily andannual values of SRB and RBI.
RBT is even more difficult to assess anddata concerning it are sparse. The presentestimation was based mostly on Malaysian datacollected using the ingrowth core methodsupplemented by a carbon balance approach(Henson and Chai, 1997), and on the estimatesby Dufrene (1989) based on root pit observationsin West Africa. The pooled data indicate arelationship between RBT and SRB where:
RBT (kg palm-1 yr-1)= -0.0704 + 0.2391 x SRB (kg palm-1) (1)
(Henson and Mohd Tayeb, 2003).
For the model, the above linear regression isforced to zero giving:
RBT (kg palm-1 yr-1)= 0.2123 x SRB (kg palm-1) (2)
Figure 11 shows the resultant (standardmethod) annual trends in RBP, RBT and RBIand the ratio of turnover to production whileFigure 9c shows the comparative RBP curvesusing the different methods. From Figure 11, itcan be seen that RBT assumes an increasingproportion of RBP as the palm ages. The ratio ofRBT to RBP (termed the root turnover factor,RTF) is calculated in the model on both a dailyand an annual basis using fourth-orderpolynomials.
Comparison of Methods
In both the standard and alternativemethods, the extent of RBT can be varied via auser-selected turnover coefficient that changes
1For trunks, production equals increment while for fronds, the method of measuring biomass production is independent ofturnover.

Modelling Vegetative Dry Matter Production of Oil Palm
37
FBP assessed by three methods
Trun
k bi
omas
s pr
oduc
tion
(t h
a-1yr
-1)
TBP assessed by three methods
Roo
t bi
omas
s pr
oduc
tion
(t h
a-1yr
-1)
RBP assessed by three methods
Figure 9. Biomass production curves for (a) fronds, (b) trunk and(c) roots, generated using either constant or age-dependent partition
coefficients with the standard option, or created from independent growth curveswith the alternative option of OPRODSIM.
Fro
nd b
iom
ass
prod
uctio
n(t
ha-1
yr-1)
Years after planting
Years after planting
Years after planting

Oil Palm Bulletin 52
38
Figure 10. Changes in standing root biomass (SRB) with time as determined in various studies.
Notes: Data either represent direct measurements, curves based on direct measurements, or values calculatedbased on assumed root: shoot ratios. The trend line, a second order polynomial, was fitted using annual meandata. Data sources are given below. Except where otherwise stated, data are from Malaysia. Updated from Figure3 of Henson and Chai (1997) and Figure 4.3 of Henson and Chang (2000).
Data set Source(s) Notes
Inland 1 Henson (unpublished) two sites
Inland 2 Teoh and Chew (1988) three sites
Inland 3 Tan (1979) estimated from graphical data
Inland 4 Khalid et al. (1999) -
Coastal 1 Teoh and Chew (1988) -
Henson and Chai (1997) -
Coastal 2 Corley et al. (1971a)
Coastal 3 Ng et al. (1968) points derived from curve fitted to trial data
Peat Henson and MohdTayeb (2003) calculated based on shoot biomass
Colombia Reyes et al. (1997) -
Sumatra Lamade and Setiyo (1996) -
Roo
t st
andi
ng b
iom
ass
(t h
a-1)
Root standing biomass
Years after planting
24
20
16
12
8
4
0
0 5 10 15 20 25 30 35

Modelling Vegetative Dry Matter Production of Oil Palm
39
the values of the age-dependent partitioningbetween increment and turnover.
With the alternative method, it can beseen that calculations start with root incrementand give root production by addition of rootturnover, whereas with the standard method,production is fixed first and then partitioned togive increment and turnover. The twoapproaches hence have differing consequencesfor assimilate allocation. Whereas in thestandard case a change in RBT affects RBI, SRB(and also MR), with RBP and VBP beingunaffected, the opposite is true with thealternative method. Examples are given in Table1. The contrasting effect on bunch biomassproduction (BBP) is especially worth noting.
Both methods gave similar curves forannual VBP (Figure 12). If the age-dependentpartition coefficients obtained from thealternative method are used in the standardmethod, then the VBP components simulated bythe two approaches are quite similar, as is thetotal VBP.
Calculation of Standing Palm Biomass
SB is calculated by summing theindividual biomass increments. For the fronds,SB is a product of the mean SFDW, TFNP andPD. For the trunk, since there is no discernableturnover, SB is equal to cumulative biomassproduction. For roots, as already described, theannual biomass increment represents thedifference between production and turnover andSB is equal to cumulative biomass increment.
The size of the SB is important forestimating MR, a major component of the standcarbon budget. Calculation of MR in oil palm isdetailed elsewhere (van Kraalingen, 1985;Dufrene, 1989; Henson, 2003).
Limiting Conditions
In the first few years after planting, theproduction of assimilates may not always besufficient to sustain the level of biomassproduction anticipated. Because of this,additional procedures are required to matchproduction to the available resources and tobalance assimilate allocation between competingprocesses such as VBP, MR, male inflorescenceand bunch production. Although VBP takesprecedence over inflorescence and bunchproduction, it may still be limited if assimilatesupply is not high enough. Limits also need to beapplied, in the case of the alternative option, tothe separate components of VBP.
An outline of the limiting conditionsprocedures is given in Appendix 1.
Effects of Different Options on VegetativeBiomass Production
It is apparent that a large number offactors can affect VBP and hence, there areseveral choices offered in the model. Theseinclude different rates of single frond growthand frond production, partitioning of VBP(standard method only) and root biomass, andchanging the SLA ratio and the sensitivity ofvegetative growth to soil water deficit andcarbon dioxide concentration. In addition,management practices such as planting density,ablation, additional frond pruning andirrigation, which all have an impact onvegetative growth, can be altered. Theconsequences of exercising some of these optionsare illustrated below but those aspects requiringmore detailed treatment are dealt with insubsequent publications.
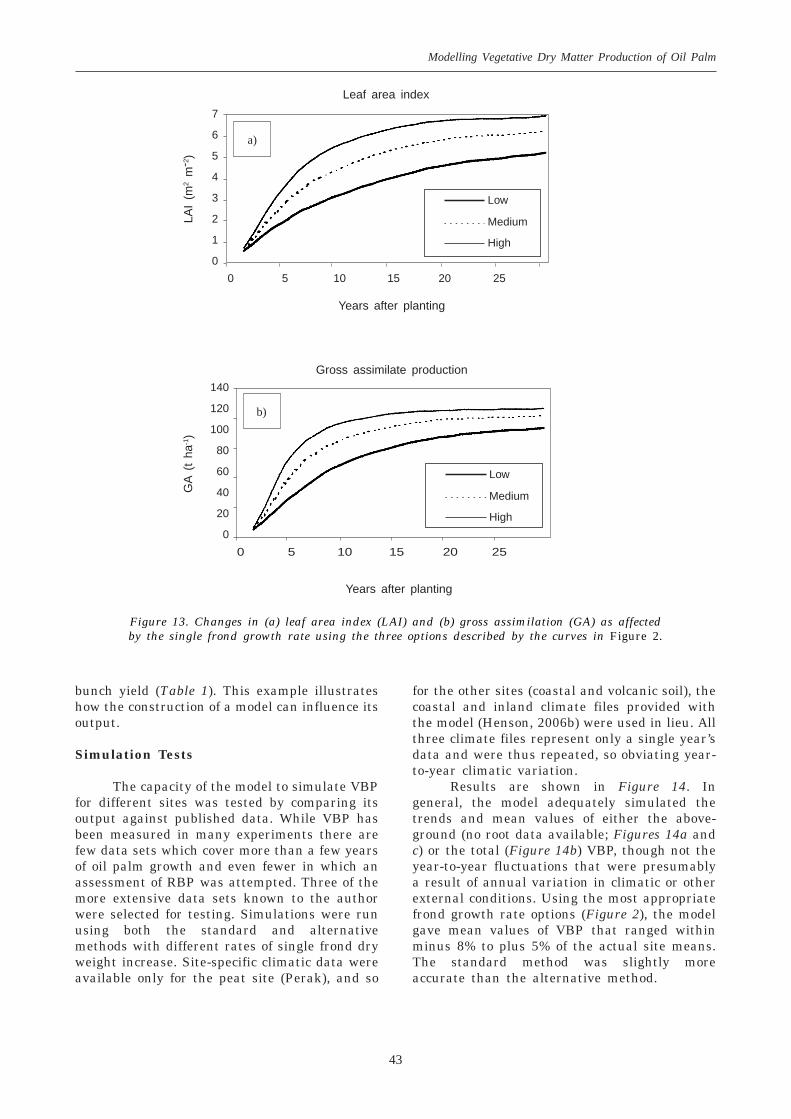
Effect of single frond growth rate. Forthe standard option, the model uses the mediumrate of frond dry weight increase shown inFigure 2. Selection of the low or high ratealternatives has a substantial impact on LAIand GA (Figure 13) and hence, as shown inFigure 12, on VBP.
Effect of frond production rate. Themodel provides two ways to vary FPR. One is toopt for either the normal or lower and steadilydeclining rate from around 15 YAP (Figure 5a).The other is to vary the rate throughout the lifeof the planting via an appropriate modifyingcoefficient. The choice of these options issomewhat arbitrary unless data support theiruse for specific situations.
Sensitivity Analysis
The relative importance of differentfactors for estimating VBP and other variablescan best be assessed by a sensitivity analysis. Inthis, the effects of an individual factor weretested by increasing its level by a givenpercentage, with all other factors remainingconstant. Such tests have been conducted withprevious oil palm models (Squire, 1985; vanKraalingen et al., 1989; Dufrene et al., 1990)where the effects on bunch or oil yield were themain focus of interest. The effects inOPRODSIM, on both vegetative and bunchbiomass production of a 10% increase in thosefactors most affecting VBP, are shown in Table2.

Oil Palm Bulletin 52
40
TABLE 1. EFFECTS OF CHANGING THE ROOT TURNOVER FACTOR (RTF) ON ROOTBIOMASS INCREMENT (RBI), ROOT BIOMASS TURNOVER (RBT), ROOT BIOMASS
PRODUCTION (RBP), STANDING ROOT BIOMASS (SRB), VEGETATIVE MAINTENANCERESPIRATION (VMR), VEGETATIVE BIOMASS PRODUCTION (VBP) AND BUNCH
BIOMASS PRODUCTION (BBP) USING THE STANDARD AND ALTERNATIVESIMULATION METHODS*
Relative RTF RBI RBT RBP SRB VMR VBP BBP
t ha-1 yr-1 t ha-1 t ha-1 yr-1
Standard method0.6 1.94 1.82 3.76 27.6 58.4 21.0 9.60.8 1.34 2.42 3.76 21.1 53.5 21.0 11.91.0 0.73 3.03 3.76 14.6 48.6 21.0 14.21.2 0.19 3.57 3.76 8.2 43.6 21.0 16.5
Alternative method0.6 0.66 1.55 2.21 13.3 48.2 19.2 15.70.8 0.66 2.06 2.72 13.3 48.2 19.7 15.41.0 0.66 2.58 3.24 13.3 48.2 20.2 15.01.2 0.66 3.04 3.70 13.3 48.2 20.7 14.7
*Note: Data are for an inland site 15 YAP.
Figure 11. Changes over time in annual root biomass increment (RBI), turnover (RBT),production (RBP) (where RBP = RBI + RBT) and the ratio of root turnover to root production (RBT/RBP).
Bio
mas
s (t
ha-1
yr--
1 )Root production components
Years after planting
RB
T/R
BP

Modelling Vegetative Dry Matter Production of Oil Palm
41
Low
Medium
High
25
20
15
10
5
00 5 10 15 20 25
Low
Medium
High
25
20
15
10
5
00 5 10 15 20 25
The factors having the greatest effect onVBP using the standard method were SLA, PD,SFDW and TFNP. Using the alternativemethod, FPR and PD were the most influential.No factor led to VBP being much reduced. Forbunch biomass production (BBP), with thestandard method VBP partitioning to frondsfollowed by SLA and SFDW had the biggesteffect. For BBP with the alternative method,increasing SLA and SFDW had the most impact.It is readily apparent that for both methods,BBP was more sensitive to the changes thanVBP.
The effects on BBP can generally beexplained by examining the correspondingimpacts on the rates of gross assimilation (GA)and vegetative maintenance respiration (VMR)(Table 3). Assimilates available for bunchgrowth can be increased either by an increase inGA or a reduction in VMR. In the majority of
cases, there were increases in both GA and VMRdue to increases in the vegetative components.With the standard method, the increase in BBPwith increased partitioning to fronds, despitelittle change in GA, could be accounted for by areduction in VMR. The reduction in VMR withincreased partitioning into fronds may appearsurprising in view of the high rate of frond MRcompared with other biomass components (vanKraalingen, 1985; Dufrene, 1989; Henson, 2003)but can be explained by a reduction in totalstanding vegetative biomass associated with thisoption.
As previously indicated, the effect ofincreased root turnover differed for the standardand alternative methods. In the first case,increased RT reduced standing biomass and MR,leading to more assimilates becoming availablefor bunch production. In the second case, RTincreased total VBP which led to reductions in
Figure 12. Changes in vegetative biomass production, simulated using the standard (a) or thealternative method (b) and the three single frond growth rates described by the curves in Figure 2.
Years after planting
Years after planting
Standard method
VB
P (
t ha
-1)
VB
P (
t ha
-1)
Atternative method
a)
b)

Oil Palm Bulletin 52
42
TABLE 3. RESPONSES TO A 10% INCREASE IN THE MAIN FACTORS AFFECTING VBP, ONTHE SIMULATED VALUES OF GROSS ASSIMILATION (GA) AND VEGETATIVE MAINTENANCE
RESPIRATION (VMR) USING STANDARD AND ALTERNATIVE OPTIONS*
Factor Default GA VMRvalue t ha-1 yr-1 % t ha-1 yr-1 %
change change
Standard methodPlanting density 148 ha-1 92.9 + 5.5 37.5 + 8.1Frond partition factor 0.70 91.5 + 3.8 32.8 - 5.6Trunk partition factor 0.12 87.6 - 0.6 34.6 - 0.4Root partition factor 0.18 87.3 - 0.9 34.2 - 1.3Specific leaf area 2.6 m2 kg-1 93.5 + 6.1 35.3 + 1.7Frond production 91.7 + 4.1 36.4 + 4.9Frond number/palm 93.0 + 5.6 37.2 + 7.2Frond dry weight 92.8 + 5.3 35.4 + 2.0Root turnover factor 88.1 0 33.6 - 3.2
Alternative methodPlanting density 148 ha-1 92.9 + 5.5 40.9 + 9.2Specific leaf area 2.6 m2 kg-1 93.5 + 6.1 37.1 + 0.5Frond production 91.7 + 4.1 38.2 + 3.5Frond number/palm 93.0 + 5.6 39.0 + 5.7Frond dry weight 92.8 + 5.3 37.1 + 0.5Root turnover factor 88.1 0 36.9 0
*Notes: Data are means over 20 years, calculated using the mean default values where GA = 88.1 t ha-1 yr-1
(both methods) and VMR = 34.7 and 36.9 t ha-1 yr-1 for the standard and alternative methods, respectively.
TABLE 2. RESPONSES TO A 10% INCREASE IN THE MAIN FACTORS AFFECTING VBP,ON THE SIMULATED VALUES OF VBP AND BBP USING STANDARD AND ALTERNATIVE
OPTIONS*
Factor Default VBP BBPvalue t ha-1 yr-1 % t ha-1 yr-1 %
change change
Standard methodPlanting density 148 ha-1 18.02 + 3.9 13.06 + 3.9Frond partition factor 0.70 17.84 + 2.8 15.03 + 19.6Trunk partition factor 0.12 17.36 - 0.3 12.28 - 2.3Root partition factor 0.18 17.25 - 0.6 11.98 - 4.7Specific leaf area 2.6 m2 kg-1 18.08 + 4.2 14.30 + 13.8Frond production 17.86 + 2.9 13.10 + 4.2Frond number/palm 18.00 + 3.8 13.25 + 5.4Frond dry weight 18.02 + 3.9 13.98 + 11.2Root turnover factor 17.35 0 13.09 + 4.1
Alternative methodPlanting density 148 ha-1 17.64 + 6.0 12.02 - 0.1Specific leaf area 2.6 m2 kg-1 16.72 + 0.5 14.43 + 20.0Frond production 17.84 + 7.2 12.29 + 2.2Frond number/palm 16.71 + 0.4 13.31 + 10.6Frond dry weight 16.73 + 0.5 14.08 + 17.0Root turnover factor 16.34 + 0.9 12.24 - 0.9
*Notes: Data are means over 20 years for an inland site, calculated using the mean default values, where VBP= 17.35 and 16.64 t ha-1 yr-1 and BBP = 12.57 and 12.03 t ha-1 yr-1 for the standard and alternative methods,respectively.
Age-dependent}
} Age-dependent
Age-dependent}
Age-dependent}
Modelling Vegetative Dry Matter Production of Oil Palm
43
Figure 13. Changes in (a) leaf area index (LAI) and (b) gross assimilation (GA) as affectedby the single frond growth rate using the three options described by the curves in Figure 2.
LAI
(m2
m-2
)G
A (
t ha
-1)
bunch yield (Table 1). This example illustrateshow the construction of a model can influence itsoutput.
Simulation Tests
The capacity of the model to simulate VBPfor different sites was tested by comparing itsoutput against published data. While VBP hasbeen measured in many experiments there arefew data sets which cover more than a few yearsof oil palm growth and even fewer in which anassessment of RBP was attempted. Three of themore extensive data sets known to the authorwere selected for testing. Simulations were runusing both the standard and alternativemethods with different rates of single frond dryweight increase. Site-specific climatic data wereavailable only for the peat site (Perak), and so
for the other sites (coastal and volcanic soil), thecoastal and inland climate files provided withthe model (Henson, 2006b) were used in lieu. Allthree climate files represent only a single year’sdata and were thus repeated, so obviating year-to-year climatic variation.
Results are shown in Figure 14. Ingeneral, the model adequately simulated thetrends and mean values of either the above-ground (no root data available; Figures 14a andc) or the total (Figure 14b) VBP, though not theyear-to-year fluctuations that were presumablya result of annual variation in climatic or otherexternal conditions. Using the most appropriatefrond growth rate options (Figure 2), the modelgave mean values of VBP that ranged withinminus 8% to plus 5% of the actual site means.The standard method was slightly moreaccurate than the alternative method.
Leaf area index
Years after planting
Gross assimilate production
Years after planting
Low
Medium
High
Low
Medium
High
7
6
5
4
3
2
1
0
0 5 10 15 20 25
140
120
100
80
60
40
20
0
0 5 10 15 20 25
a)
b)

Oil Palm Bulletin 52
44
Abo
ve-g
roun
d V
BP
(kg
per
pal
m)
Tota
l V
BP
(kg
per
pal
m)
Abo
ve-g
roun
d V
BP
(kg
per
pal
m)
Figure 14. Comparison of measured and simulated total or above-ground vegetativebiomass production (VBP) for three sites using the standard and alternative
methods with appropriate adjustments for planting density.
Above-ground VBP on a coastal soil in Sabah
Total VBP on a peat soil in Perak
Above-ground VBP on a volcanic soil in PNG
Years after planting
Years after planting
Years after planting

Modelling Vegetative Dry Matter Production of Oil Palm
45
Notes for Figure 14: In (a), measured data (Kwan, 1994) are for above-ground VBP for palms at a density of 143per hectare, and simulations were run using the coastal climate file and high frond growth rate option. In (b),measured (adjusted) data (Henson and Mohd Tayeb, 2003) are for total VBP for palms at a density of 160 perhectare and simulations were run using the peat climate file and low frond growth rate option. In (c), measureddata (Breure, pers com., quoted by van Kraalingen, 1985) are for above-ground VBP for palms at a density of 143-148 per hectare, and simulations were run using the inland climate file and high frond growth rate option.
Comparisons of actual and modelled mean VBP values (kg palm-1 yr-1) using either the standard or alternativemethod, are given below;
Site and age Model frond size Method Mean VBP % of actual
Coastal high actual 116.6 -(6 to 13 YAP) standard 114.7 98.3
alternative 121.7 104.3
Peat low actual 101.0 -(4 to 16 YAP) standard 102.2 92.9
alternative 92.9 92.0
Volcanic high actual 99.6 -(1 to 14 YAP) standard 97.2 97.5
alternative 104.2 104.5
CONCLUSIONS
The present model offers numerous options forsimulating vegetative biomass production thatinclude two main approaches, each with anumber of alternative choices. Unlike previousoil palm simulation models, OPRODSIM doesnot require any pre-existing biomass data torun. However, its output will depend on thechoices made and on the empirically-derivedgrowth curves selected from the range ofpossibilities. The vegetative growth generatedby the model appears realistic as shown by itsability to adequately simulate VBP at differentsites. However, the precision of the model outputfor individual sites might be enhanced by theuse of more extensive, site-specific climate data.The expected and frequently observed greatersensitivity of bunch, compared with vegetative,biomass production was demonstrated. Thefinding that different approaches to simulatingVBP may lead to different outcomes with respectto the impact of root turnover, again emphasizesthe need to better document and understand therole of this important facet of oil palmproductivity.
ACKNOWLEDGEMENTS
I would like to express my appreciation toChang, K C, Dr N Rajanaidu and DrChristopher Teh for their patient and criticalreading of the manuscript and many helpfulsuggestions for its improvement.
REFERENCES
BREURE, C J (1982). Factors affecting yield andgrowth of oil palm in West New Britain.Oleagineux, 37: 213-227.
CORLEY, R H V (1976). Photosynthesis andproductivity. Chapter 5. Oil Palm Research (R HV, Corley; Hardon, J J and Wood, B J eds.).Elsevier, Amsterdam. p. 55-76.
CORLEY, R H V and BREURE, C J (1981).Measurements in Oil Palm Experiments.Internal Report, Unilever Plantations Group,London. 21 pp.
CORLEY, R H V and BREURE, C J (1992).Fruiting activity, growth and yield of oil palm. I.Effects of fruit removal. ExperimentalAgriculture, 28: 99-109.
CORLEY, R H V and GRAY, B S (1976). Growthand morphology. Chapter 2. Oil Palm Research(R H V, Corley; Hardon, J J and Wood, B J eds.).Elsevier, Amsterdam. p. 7-21.
CORLEY, R H V and TINKER, P B (2003). TheOil Palm. 4th edition. Blackwell Science,Oxford, UK. 562 pp.
CORLEY, R H V; GRAY, B S and NG S K(1971a). Productivity of the oil palm (Elaeisguineensis) in Malaysia. ExperimentalAgriculture, 7: 129-136.
Oil Palm Bulletin 52
46
CORLEY, R H V; HARDON, J J and TAN, G Y(1971b). Analysis of growth of the oil palm(Elaeis guineensis Jacq.). I. Estimation ofgrowth parameters and application in breeding.Euphytica, 20: 307-315.
DUFRENE, E (1989). Photosynthese,consommation en eau et modelisation de laproduction chez le palmier a huile (Elaeisguineensis Jacq.). Ph. D. thesis, UniversiteParis-Sud, Orsay. 154 pp.
DUFRENE, E; OCHS, R and SAUGIER, B(1990). Oil palm photosynthesis andproductivity linked to climatic factors.Oleagineux, 45: 345-355.
FOONG, S F (2000). Impact of moisture onpotential evapotranspiration, growth and yieldof oil palm. Proc. of the 1999 PORIMInternational Palm Oil Congress - AgricultureConference. PORIM, Bangi. p. 265-287.
GERRITSMA, W (1988). Simulation of Oil PalmYield. Internal report. Department ofTheoretical Production Ecology, AgriculturalUniversity, Wageningen. 36 pp.
GERRITSMA, W and SOEBAGYO, F X (1999).An analysis of the growth of leaf area of oilpalms in Indonesia. Experimental Agriculture,35: 293-308.
GRAY, B S (1969). A Study of the Influence ofGenetic, Agronomic and Environmental Factorson the Growth, Flowering and Bunch Productionof the Oil Palm on the West Coast of WestMalaysia. Ph. D thesis, University of Aberdeen.947 pp.
HENSON, I E (1993). Assessing frond drymatter production and leaf area development inyoung oil palms. Proc. of the 1991 PORIM PalmOil Development Conference. Module 1(Agriculture). PORIM, Bangi. p. 473-478.
HENSON, I E (2003). Estimating maintenancerespiration of oil palm. Oil Palm Bulletin No. 48:1-10.
HENSON, I E (2005). OPRODSIM, a versatile,mechanistic simulation model of oil palm drymatter production and yield. Proc. of the PIPOC2005 International Palm Oil Congress -Agriculture, Biotechnology and SustainabilityConference. MPOB, Bangi. p. 801-832.
HENSON, I E (2006a). Measuring andmodelling oil palm trunk growth. Oil PalmBulletin No. 52: 1-24.
HENSON, I E (2006b). Modelling the impact ofclimatic and climate-related factors on oil palmgrowth and productivity. MPOB Technology No.28: 45 pp.
HENSON, I E and CHAI, S H (1997). Analysisof oil palm productivity. II. Biomass,distribution, productivity and turnover of theroot system. Elaeis, 9: 78-92.
HENSON, I E and CHANG, K C (1990).Evidence for water as a factor limitingperformance of field palms in West Malaysia.Proc. of the 1989 PORIM International Palm OilDevelopment Conference. Module II.Agricultural. PORIM, Bangi. p. 487-498.
HENSON, I E and CHANG, K C (2000). Oilpalm productivity and its component processes.Advances in Oil Palm Research. Vol. 1. MPOB,Bangi. p. 97-145.
HENSON, I E and MOHD TAYEB, D (2003).Physiological analysis of an oil palm densitytrial on a peat soil. J. Oil Palm Research Vol.15 No. 2: 1-27.
KHALID, H; ZIN, Z Z and ANDERSON, J M(1999). Quantification of oil palm biomass andnutrient value in a mature plantation. II. Below-ground biomass. J. Oil Palm Research Vol. 11No. 2: 63-71.
KWAN, B K W (1994). The effect of plantingdensity on the first fifteen years of growth andyield of oil palm in Sabah. Techncal Bulletin No.11. Department of Agriculture, Sabah. 26 pp.
LAMADE, E and SETIYO, I E (1996). Test ofDufrene’s production model on two contrastingfamilies of oil palm in North Sumatra. Proc. ofthe 1996 PORIM International Palm OilCongress - Agricultural Conference. PORIM,Bangi. p. 427-435.
NG, S K; THAMBOO, S and DE SOUZA (1968).Nutrient contents of oil palms in Malaya. II.Nutrient contents in vegetative tissues. TheMalaysian Agricultural Journal, 46: 332-390.
RAO, V; RAJANAIDU, N; KUSHAIRI, A andJALANI, B S (1992). Density effects in the oilpalm. Proc. of the Workshop on Yield Potentialin the Oil Palm (Rao, V; Henson, I E andRajanaidu, N eds.). International Society for OilPalm Breeders/PORIM. p. 71-79.
REYES CUESTA, R; BASTIDAS PEREZ, S andPENA ROJAS, E A (1997). Distribucion delsistema radical de la palma de aceite (Elaeis

Modelling Vegetative Dry Matter Production of Oil Palm
47
guineensis Jacq.) en Tumaco, Colombia. RevistaPalmas, 18: 49-57.
SQUIRE, G R (1985). A physiological analysisfor oil palm trials. PORIM Bulletin No. 12: 12-31.
TAN, K S (1979). Root development of oil palmson inland soils of West Malaysia. Soil PhysicalProperties and Crop Production in the Tropics(Lal, R and Greenland, D J eds.). John Wileyand Sons. p. 363-374.
TEOH, K C and CHEW, P S (1988). Potassiumin the oil palm ecosystem and some implications
for manuring practice. Proc. of the 1987International Oil Palm/Palm Oil Conferences.Conference 1: Agriculture (Abdul Halim, H;Chew, P S; Wood, B J and Pushparajah, E eds.).PORIM, Bangi. p. 277-286.
van KRAALINGEN, D W G (1985). Simulationof Oil Palm Growth and Yield. Thesis,Wageningen Agricultural University. 106 pp.
van KRAALINGEN, D W G; BREURE, C J andSPITTERS, C J T (1989). Simulation of oil palmgrowth and yield. Agricultural and ForestMeteorology, 46: 227-244.
Appendix 1
Procedures for matching VBP to available assimilate supply
a) For both standard and alternative options
If GA < VMR + VAR + MAR then:
VAR = 0.43 x GA - MARVMR = GA - VAR - MARVBP = VAR x 0.69VGR = VAR – VBP
b) Additionally, for the alternative option:
If GA < VMR + VAR + MAR then:
FBP = VPFF x VBPTRBP = VPFT x VBPRBP = VBP – FBP – TRBP
where: VMR = vegetative maintenance respirationVAR = vegetative assimilate requirement (= VBP + VGR)MAR = male inflorescence assimilate requirementGA = gross assimilate productionVGR = vegetative growth respirationVPFF = vegetative partition factor for frondsVPFT = vegetative partition factor for trunk
with the other terms as previously defined.