oil –oil correlations to establish a basis for mapping ... · oil-oil correlations to establish a...
TRANSCRIPT
Oil-oil correlations to establish a basis for mapping petroleum systems, San Joaquin Basin, California Compiled PowerPoint Slides
by Lillis, P.G., and Magoon, L.B. This report is preliminary and has not been reviewed for conformity with the U.S. Geological Survey editorial standards or with the North American Stratigraphic Code. Any use of trade names is for descriptive purposes only and does not imply endorsement by the U.S. Government. U.S. Geological Survey Open-File Report 2004-1037 U.S. DEPARTMENT OF THE INTERIOR U.S. GEOLOGICAL SURVEY

Oil-oil correlations to establish a basis for mapping petroleum systems, San Joaquin Basin, California by Lillis, Paul G.1 and Magoon, Leslie B.2
_________________________________________________ Open-File Report 2004-1037 2004 This report is preliminary and has not been reviewed for conformity with U.S. Geological Survey editorial standards or with the North American Stratigraphic Code. Any use of trade names is for descriptive purposes only and does not imply endorsement by the U.S. Government. U.S. DEPARTMENT OF THE INTERIOR U.S. GEOLOGICAL SURVEY 1U.S. Geological Survey, Denver, CO 80225 2U.S. Geological Survey, Menlo Park, CA 94025 Preface
The PowerPoint presentation in this report was given at a public forum presented by the U.S. Geological Survey entitled “Petroleum Assessment of San Joaquin Basin—Project Details and Workshop,” which was hosted by the San Joaquin Geological Society in Bakersfield, California, April 2, 2003. It presents new results of a petroleum geochemical study of the San Joaquin basin based on recently analyzed data combined with published data in order to characterize oil types and establish a basis for mapping petroleum systems in the basin. Some diagrams that appeared in the original presentation have been updated in this report.
The approach for this study was to first correlate the crude oils into genetic types
or families by evaluating the similarities of various bulk and molecular geochemical parameters using x-y plots and hierarchical cluster analysis, then map the distribution of the oil types in the basin. Chemical parameters most useful for oil correlation are stable carbon isotope ratios and biomarker composition including pristane/phytane, sterane, and terpane ratios.
In previous studies, the middle and upper Miocene Monterey and the middle
Eocene Kreyenhagen formations were recognized as the main sources of petroleum in the basin, while the Upper Cretaceous portion of the Moreno Formation was considered a minor source. The results of the current study show that there are three main oil types: the Kreyenhagen, upper Eocene Tumey Formation, and the Monterey Formation and equivalents. The Moreno Formation is again recognized as only a minor oil type.
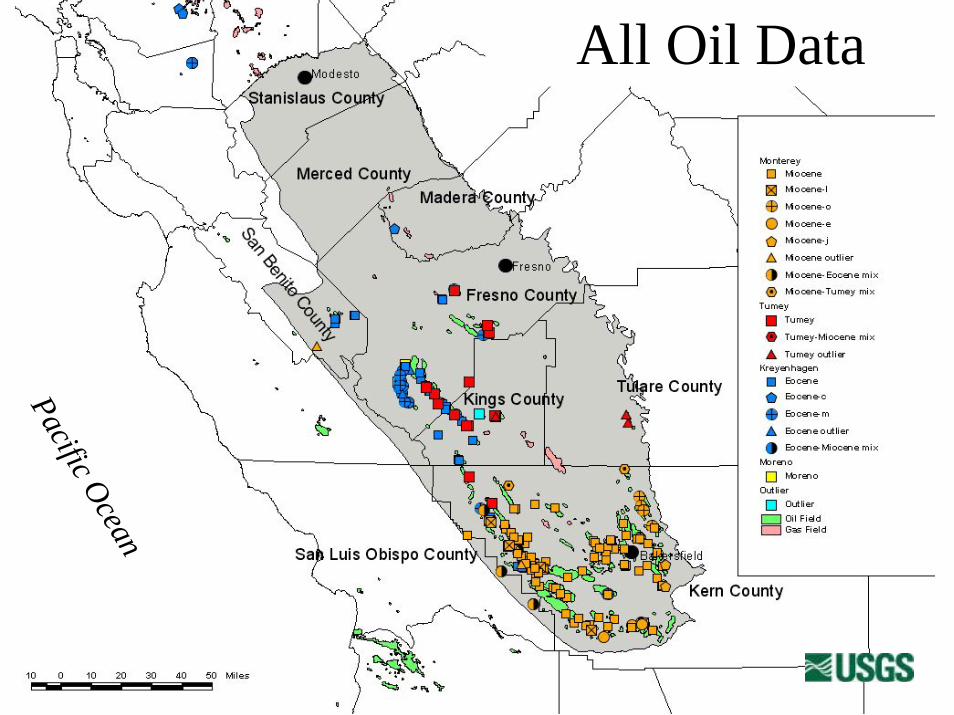
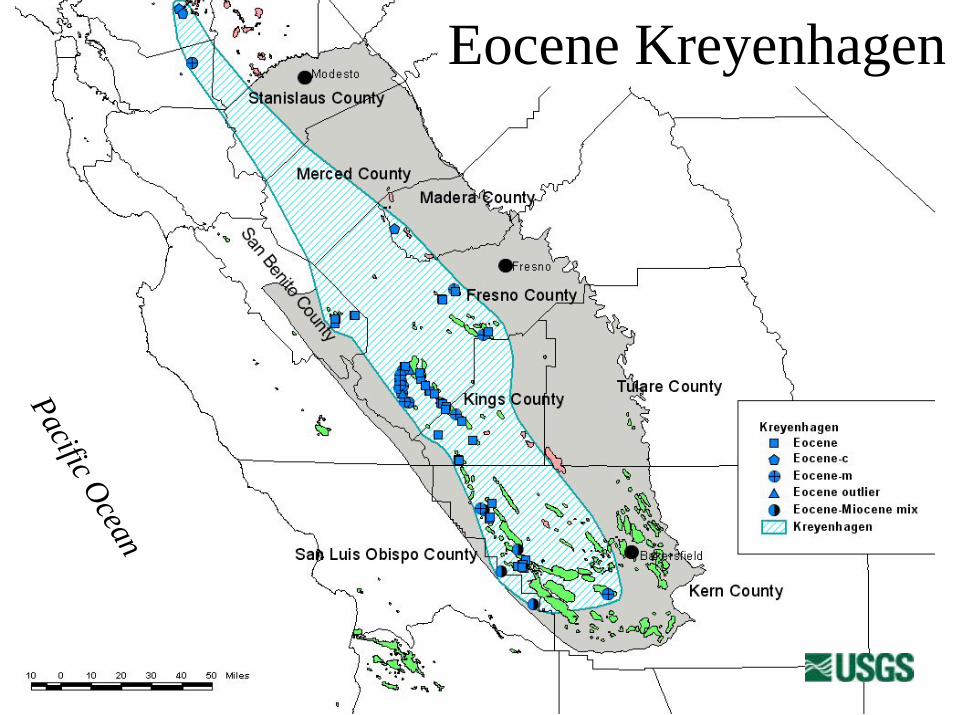
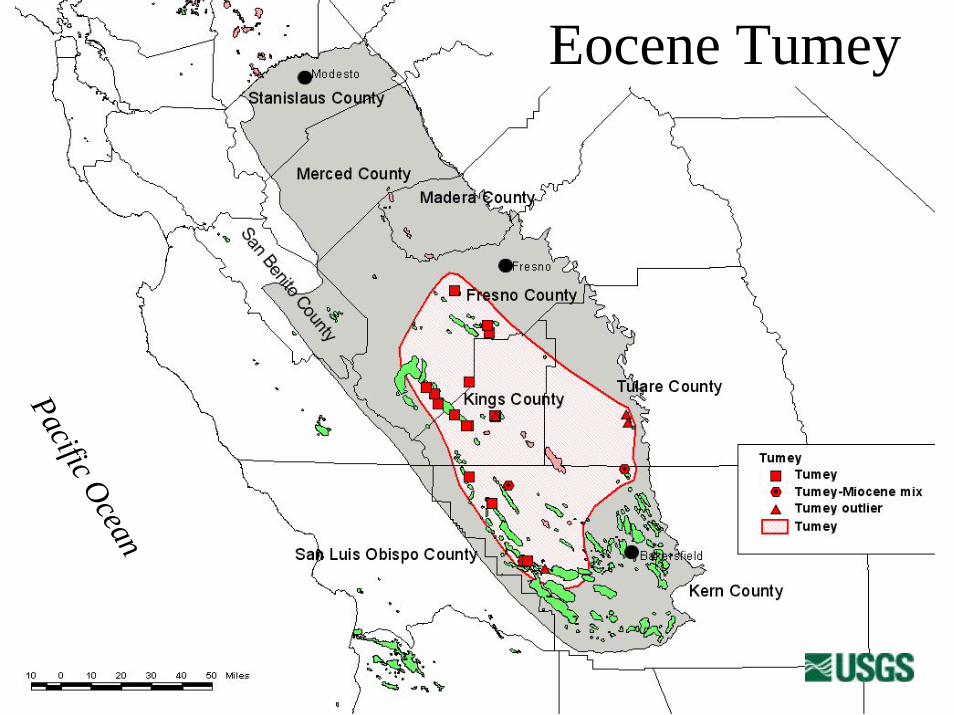
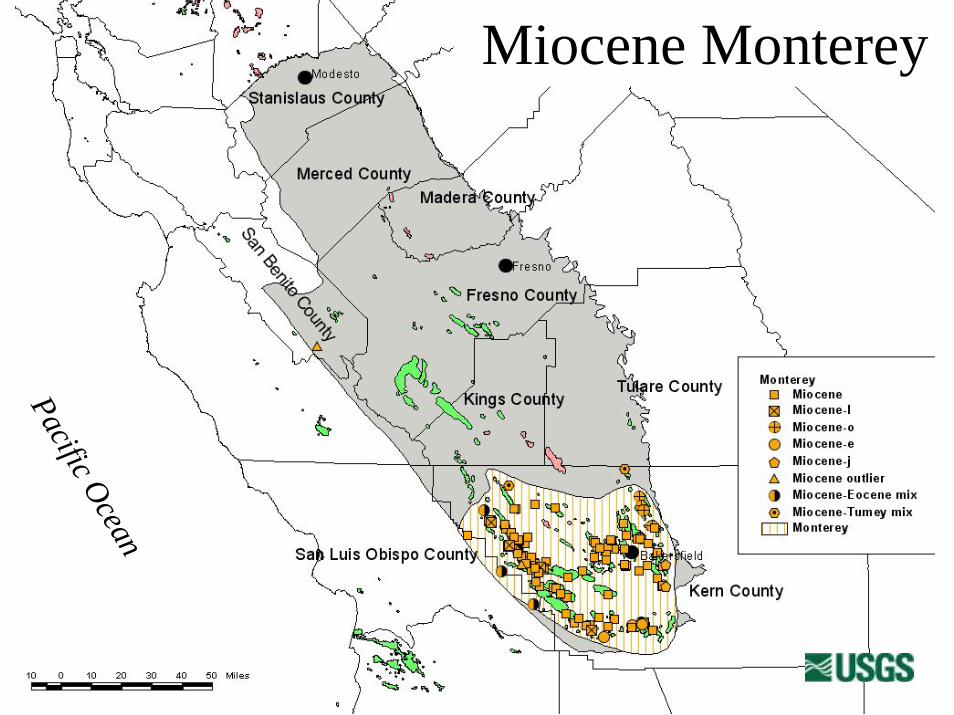
Mapping the distribution of the oil types shows that the Miocene Monterey is largely restricted to Kern County at the southern end of the basin, while the Eocene

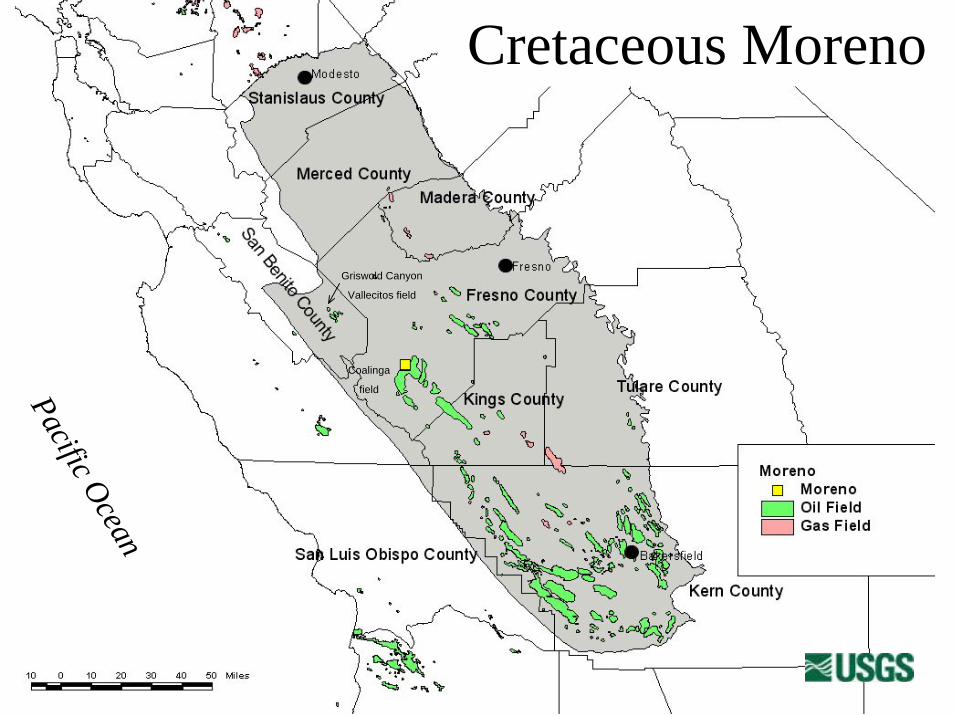
Kreyenhagen is widely distributed along the western half of the basin. Tumey oil is also predominantly present along the west side, but a few occurrences are found on the east side. The Cretaceous Moreno oil has been found only in the Coalinga area, southwestern Fresno County, and the Griswold Canyon area of Vallecitos field, San Benito County (McGuire, 1988). These maps provide the basis for petroleum system maps that incorporate source rock distribution and burial history, migration pathways, and geologic framework. Petroleum system maps are, in turn, used for USGS resource assessments of the basin. References Beyer, L.A., 1995, San Joaquin Basin Province (010), in Gautier, D. L., Dolton, G.L.,
Takahashi, K.I., and Varnes, eds., 1995 National assessment of United States oil and gas resources--Results, methodology, and supporting data: U.S. Geological Survey Digital Data Series DDS-30, Release 2, one CD-ROM.
Curiale, J.A., Cameron, D. and Davis, D.V.,1985, Biological marker distribution and significance in oils and rocks of the Monterey Formation, California: Geochimica et Cosmochimica Acta, v. 49, p. 271-288.
Kaplan, I.R., Alimi, M.H., Lu, S.T., Jeffrey, A., Shepard, L.S., Meredith, D.E., and Polovini, J.S., 1988 [2000], The petroleum geochemistry of crude oils and potential source rocks from the Paleogene of the San Joaquin and Ventura/Santa Barbara Basins, data synthesis and text, v.1, in Kaplan, I.R., ed., Collection of papers about the oil, gas, and source rock investigations carried out in the San Joaquin Santa Maria, Santa Barbara, Ventura, and Los Angeles basins, California, Pacific Section American Association of Petroleum Geologists CD ROM Series 1, 283 p.
Lillis, P.G., Magoon, L.B., Stanley, R.G., McLaughlin, R.J., and Warden, A., 2001, Characterization of Northern California Petroleum by stable carbon isotopes: U.S. Geological Survey Open-File Report 99-164, 13p.
McGuire, D.J., 1988, Stratigraphy, depositional history, and hydrocarbon source-rock potential of the Upper Cretaceous-lower Tertiary Moreno Formation, central San Joaquin Basin, California: Stanford, Calif., Stanford University, Ph.D. dissertation, 308 p.
Orr, W.L., 2001, Evaluating kerogen sulfur content from crude oil properties: Cooperative Monterey Organic Geochemistry Study, in Isaacs, C.M. and Rullkotter, J., eds., The Monterey Formation – from rocks to molecules: Columbia University Press, New York, p.348-367.
Peters, K.E., Pytte, M.H., Elam, T.D., and Sundararaman, P., 1994, Identification of petroleum systems adjacent to the San Andreas Fault, California, in Magoon, L.B. and Dow, W.G., eds., The petroleum system – from source to trap: American Association of Petroleum Geologists Memoir 60, p. 423-436.
Seifert, W.K., and Moldowan, J.M., 1978, Applications of steranes, terpanes and monoaromatics to the maturation, migration and source of crude oils: Geochimica et Cosmochimica Acta, v. 42, p. 77-95.

Sellers, C., Fox, B., and Pautz, J. 1996, Bartlesville Project Office crude oil analysis user's guide: U.S. Department of Energy DOE/BC-96/3/SP, 23 p.
Sofer, Z., 1984, Stable carbon isotope compositions of crude oils: application to source depositional environments and petroleum alteration: American Association of Petroleum Geologists Bulletin, v. 68, p. 31-49.
Slides: Slide 1. Title. Oil –oil correlations to establish a basis for mapping petroleum systems, San Joaquin Basin, California. Slide 2. Acknowledgments. Slide 3. Talk outline. Slide 4. Index map. Map of San Joaquin Basin (gray shading) showing location of cities, counties, and oil (green) and gas (red) fields. Slide 5. Generalized stratigraphic chart. San Joaquin Basin stratigraphy showing the Cretaceous through Eocene. Potential source rocks are identified with green stars. Slide 6. Generalized stratigraphic chart. San Joaquin Basin stratigraphy showing the Oligocene through Pliocene. Potential source rocks are identified with green stars. Slide 7. List of previous geochemical studies. Slide 8. List of conclusions of previous geochemical studies. Slide 9. List of methods and approach. Slide 10. Plot of San Joaquin API gravity vs. sulfur (COA data). Data from the U.S. Bureau of Mines Crude Oil Analysis (COA) database (Sellers and others, 1996). Most San Joaquin oil has low to moderate sulfur content, and is not derived from Type II-S kerogen as defined by Orr (2001). Slide 11. Plot of San Joaquin API gravity vs. sulfur (USGS data). Data from new USGS analyses, as well as from Kaplan and others (1988) and Peters and others (1994). Most San Joaquin oil has low to moderate sulfur content, although some Miocene Monterey oil is derived from Type II-S kerogen as defined by Orr (2001). Slide 12. Description of stable carbon isotopes. Slide 13. Plot of stable carbon isotopes of oils from Northern California. Example of a previous study that identifies Eocene, Cretaceous, and Miocene source oils in Northern

California using stable carbon isotopes (Lillis and others, 2001). Sofer (1984) defined a line (dashed line) for this type of plot that best separates waxy oils from nonwaxy oils. Waxy oils are usually derived from terrigenous organic matter, whereas nonwaxy oils are usually derived from marine organic matter. Slide 14. Plot of stable carbon isotopes of oils from San Joaquin Basin. Three main oil types can be identified – Eocene Kreyenhagen, Eocene Tumey, and Miocene Monterey. Data from new USGS analyses, as well as from Kaplan and others (1988), Curiale and others (1985) and Peters and others (1994). Letter designation after oil type refers to reservoir age (j = Jurassic, e = Eocene, o = Oligocene, m = Miocene). The black line separates waxy (terrigenous source) from nonwaxy (marine source) oils (Sofer, 1984). Slide 15. List of biomarkers. Biomarker ratios used for correlation in this study include the pristane/phytane ratio, and various sterane (m/z 217) and terpane (m/z 191) ratios. Slide 16. Mass chromatograms of terpanes, Kreyenhagen. Example m/z 191 mass chromatograms of the Kreyenhagen oil type. Identified peaks are C26 tricyclic terpanes, C24 tetracyclic terpane, hopane, C31-C35 extended hopanes, and gammacerane (g). Kreyenhagen oils are characterized by low concentrations of tricyclics and gammacerane relative to the hopanes, and low C26 tricyclic/C24 tetracyclic values. Slide 17. Mass chromatograms of terpanes, Tumey. Example m/z 191 mass chromatograms of the Tumey oil type. Identified peaks are C26 tricyclic terpanes, C24 tetracyclic terpane, oleanane (o), hopane, C31-C35 extended hopanes, and gammacerane (g). Slide 18. Mass chromatograms of terpanes, Monterey. Example m/z 191 mass chromatograms of the Monterey oil type. Identified peaks are C26 tricyclic terpanes, C24 tetracyclic terpane, bisnorhopane (b), oleanane (o), hopane, C31-C35 extended hopanes, and gammacerane (g). Monterey oils are characterized by high concentrations of bisnorhopane relative to hopane, higher C35/C34 extended hopane values, and moderate to high C26 tricyclic/C24 tetracyclic values. Slide 19. Plot of δ13C aromatic hydrocarbons vs. C26 tricyclic terpanes/C24 tetracylic terpane. Kreyenhagen oils (low values) can be distinguished from Tumey and Monterey oils (moderate to high values) using this biomarker ratio. San Joaquin oil data from the USGS. Slide 20. Plot of δ13C aromatic hydrocarbons vs. pristane/phytane of San Joaquin oils. Oil types can be distinguished, in part, using the pristane/phytane ratio. San Joaquin oil data from the USGS and from Kaplan and others (1988). Slide 21. Hierarchical cluster analysis diagram. Full-scale hierarchical cluster analysis dendrogram showing the degree of similarity of oil samples based on the stable carbon isotope and biomarker composition. Although no single biomarker parameter can distinguish oil types using x-y plots, the combination of several biomarker parameters in

the cluster analysis distinguishes Moreno, Kreyenhagen, Tumey, and Monterey oil types, as well as, three Monterey subtypes. Slide 22. Hierarchical cluster analysis diagram. Enlarged portion of the same dendrogram in the previous slide (Slide 21). Slide 23. List of main oil types. The list of oil types based on this study. Slide 24. Outline of oil-source rock correlation. Slide 25. Plot of stable carbon isotopes of oils from San Joaquin Basin. Repeat of Slide 14. Slide 26. Plot of stable carbon isotopes of San Joaquin source rocks. Source rock data are plotted with the boundary boxes of the three main oil types from Slide 25. Eocene Tumey Formation and unnamed Oligocene source rock bitumen are similar in composition to the Tumey oil type (red box). Data from Kaplan and others (1988) and Curiale and others (1985). Slide 27. Plot of δ13C aromatic hydrocarbons vs. pristane/phytane of San Joaquin oils. Repeat of Slide 20. Slide 28. Plot of δ13C aromatic hydrocarbons vs. pristane/phytane of San Joaquin source rocks. Source rock data are plotted with the boundary boxes of the three main oil types from Slide 27. Eocene Tumey source rock bitumen is similar in composition to the Tumey-Temblor oil type (red box). Data from Kaplan and others (1988) and Curiale and others (1985). Slide 29. List of petroleum system maps. Slide 30. Index map of San Joaquin Basin. Map of San Joaquin Basin (gray shading) showing location of cities, counties, oil localities, and oil (green) and gas (red) fields. Slide 31. Map of all oil data localities in San Joaquin Basin. Data from new USGS analyses and from Kaplan and others (1988), Curiale and others (1985) and Peters and others (1994). Letter designation after oil type refers to reservoir age (j = Jurassic, e = Eocene, o = Oligocene, l = lower Miocene, m = Miocene). Slide 32. Map of Cretaceous Moreno oil localities. The Moreno oil type has only been found in the Coalinga area, southwestern Fresno County, and the Griswold Canyon area of Vallecitos field, San Benito County (McGuire, 1988). Slide 33. Map of Eocene Kreyenhagen oil localities. The Kreyenhagen oil type is widely distributed along the western half of the basin. Slide 34. Map of Eocene Kreyenhagen oil localities. Also shown is the Kreyenhagen petroleum system boundary.

Slide 35. Map of Eocene Tumey oil localities. The Tumey oil type is predominantly present along the west side, but a few occurrences are found on the east side. Slide 36. Map of Eocene Tumey oil localities. Also shown is the Tumey petroleum system boundary. Slide 37. Map of Miocene Monterey oil localities. Miocene Monterey is largely restricted to Kern County at the southern end of the basin. Letter designation after oil type refers to reservoir age if older than middle Miocene (j = Jurassic, e = Eocene, o = Oligocene, l = lower Miocene). Slide 38. Map of Miocene Monterey oil localities. Also shown is the Monterey petroleum system boundary. Letter designation after oil type refers to reservoir age if older than middle Miocene (j = Jurassic, e = Eocene, o = Oligocene, l = lower Miocene). Slide 39. Map of Miocene Monterey oil localities. Also shown are the locations of Monterey oil type in Oligocene (o), Eocene (e) and Jurassic (j) age reservoirs along the margins of the basin. Slide 40. Map of outlier oil localities. Outliers are oils with compositions that differ from the main oil types and the confidence in the correlation is low. Slide 41. Map of all oil localities and petroleum systems. Slide 42. Summary listing of San Joaquin petroleum systems.

Oil –oil correlations to establish a basis for mapping petroleum
systems -San Joaquin Basin
Paul Lillis and Les MagoonU.S.Geological Survey

Acknowledgments
• Analytical work was performed by Dave King, Augusta Warden, and Mike Pribil at the USGS Organic Geochemistry Lab, Denver, CO.
• Numerous operators, too many to list here, kindly allowed access for sampling by Les Magoon, George Claypool, Paul Lillis, Tom Lorenson, Elizabeth Rowan, Keith Kvenvoldenand Zenon Valin.
• Several samples were provided by Ken Peters, Joe Curiale, and Ian Kaplan
Outline
• Previous studies• Methods• Results

San Joaquin Basin, Calif.
Pacific Ocean
Source rocks
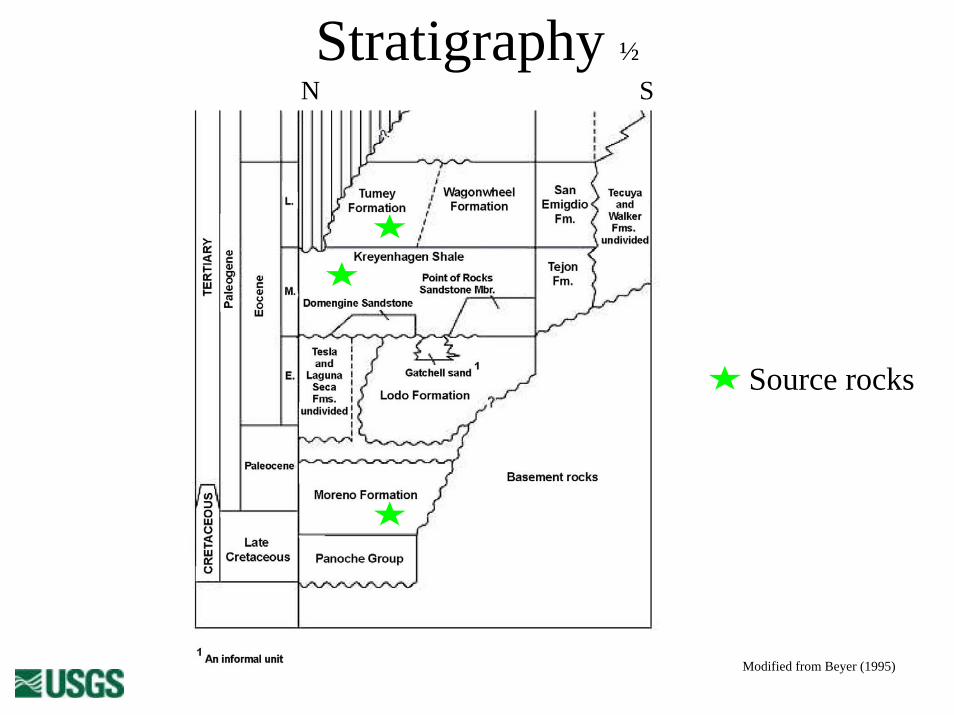
Stratigraphy ½N S
Modified from Beyer (1995)

Stratigraphy 2/2N S
Source rocks
Modified from Beyer (1995)

Previous Geochemical Studies• Seifert and Moldowan, 1978, Applications of steranes,
terpanes and monoaromatics to the maturation, migration and souce of crude oils: Geochim. Cosmochim. Acta, v. 42, p. 77-95.
• Curiale and others, 1985 Biological marker distribution and significance in oils and rocks of the Monterey Formation, California: Geochimica et Cosmochimica Acta, v. 49, p. 271-288.
• Kaplan and others 1988, The petroleum geochemistry of crude oils and potential source rocks from the Paleogene of the San Joaquin and Ventura/Santa Barbara Basins, Pacific Section AAPG CD ROM Series 1, 2000
• Peters and others, 1994, Identification of petroleum systems adjacent to the San Andreas Fault, California, AAPG Memoir 60
• Lillis and others, 2001, Characterization of Northern California Petroleum by stable carbon isotopes, Open-File Report 99-164
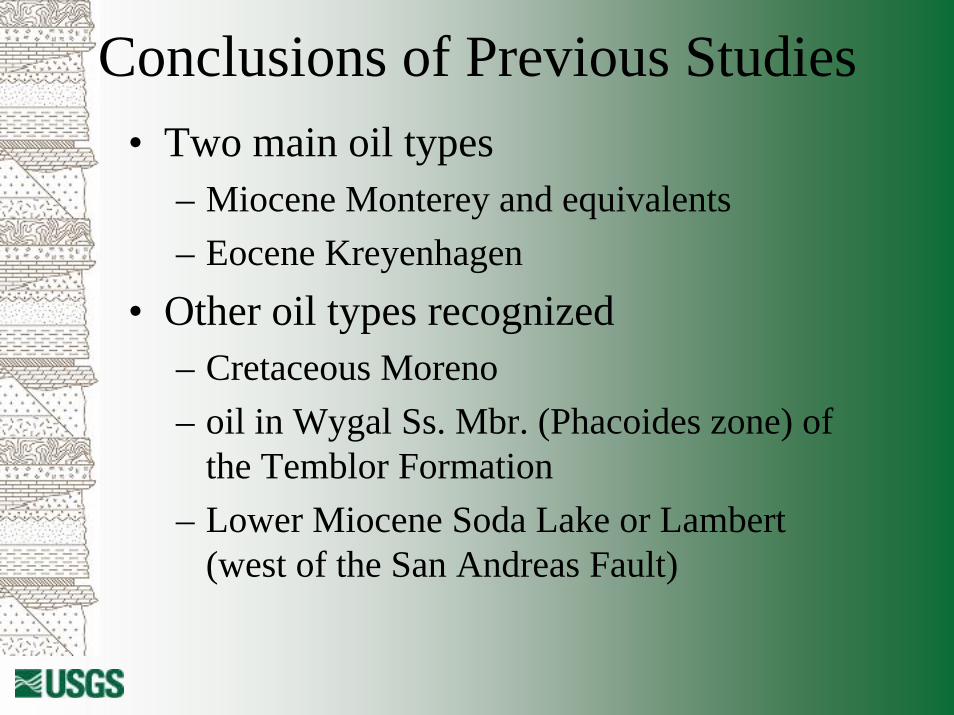
Conclusions of Previous Studies• Two main oil types
– Miocene Monterey and equivalents– Eocene Kreyenhagen
• Other oil types recognized– Cretaceous Moreno– oil in Wygal Ss. Mbr. (Phacoides zone) of
the Temblor Formation– Lower Miocene Soda Lake or Lambert
(west of the San Andreas Fault)

Methods and Approach
• Analysis of 123 crude oils– Stable carbon isotopes– API gravity – Sulfur content– Biomarkers– Ni/V
• Integration with other data• Statistical Analysis• GIS mapping of oil types for each petroleum
system
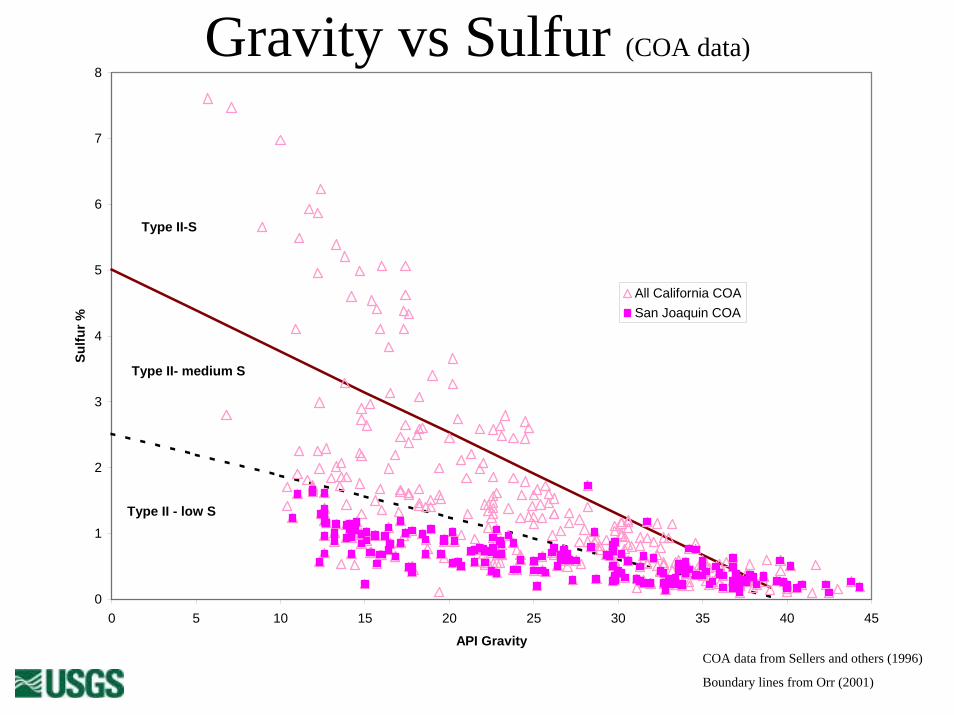
0
1
2
3
4
5
6
7
8
0 5 10 15 20 25 30 35 40 45
API Gravity
Sulfu
r %
All California COASan Joaquin COA
Type II-S
Type II- medium S
Type II - low S
Gravity vs Sulfur (COA data)
COA data from Sellers and others (1996)
Boundary lines from Orr (2001)

0.0
1.0
2.0
3.0
4.0
5.0
6.0
7.0
8.0
0 5 10 15 20 25 30 35 40 45
API Gravity
Sulfu
r (w
t%)
MioceneTumey-TemblorEocene KreyenhagenCretaceous
Type II-S
Type II-medium S
Type II-low S
Gravity vs Sulfur (USGS)San Joaquin Basin
Data from USGS, Kaplan and others (1988),
and Peters and others (1994)

Stable Carbon Isotopes
• C15+ saturated and aromatic hydrocarbons• Powerful tool for oil typing • Previous studies separate Eocene,
Cretaceous, and Miocene oils
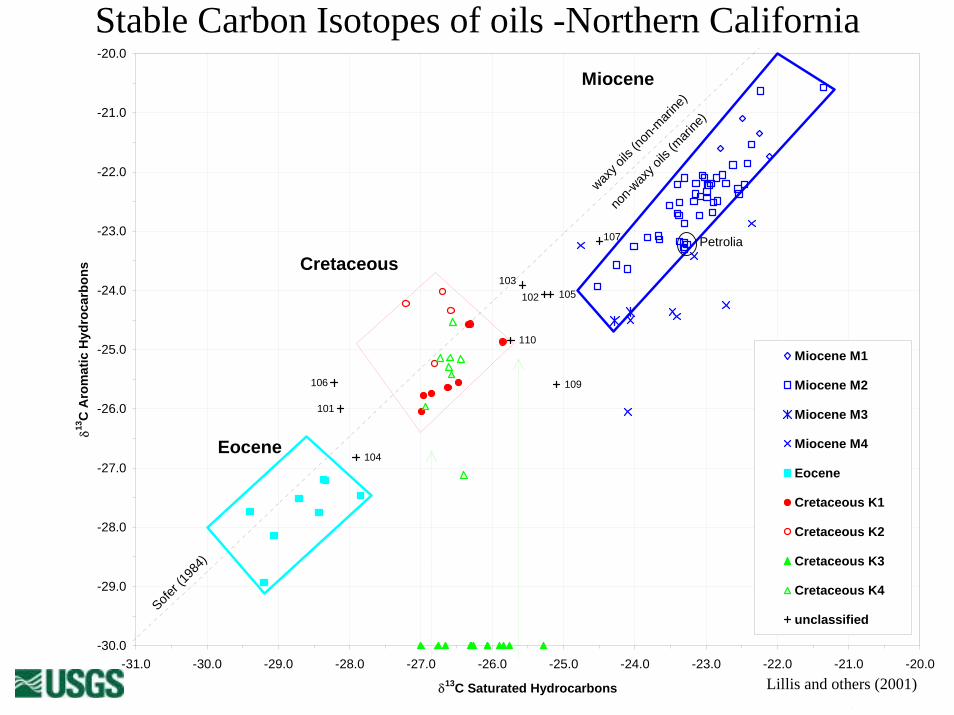
Figure 2. Isotopic composition of oils, oil seeps, and oil stains, northern California. See table 2 for oil boundary
non-w
axy o
ils (m
arine
)
waxy o
ils (n
on-m
arine
)
Sofer (1
984)
107
110
101
106
102103
109
105
104
-30.0
-29.0
-28.0
-27.0
-26.0
-25.0
-24.0
-23.0
-22.0
-21.0
-20.0
-31.0 -30.0 -29.0 -28.0 -27.0 -26.0 -25.0 -24.0 -23.0 -22.0 -21.0 -20.0
δ13C Saturated Hydrocarbons
δ13C
Aro
mat
ic H
ydro
carb
ons
Miocene M1
Miocene M2
Miocene M3
Miocene M4
Eocene
Cretaceous K1
Cretaceous K2
Cretaceous K3
Cretaceous K4
unclassified
Miocene
Cretaceous
Eocene
Petrolia
Stable Carbon Isotopes of oils -Northern California
Lillis and others (2001)

-30
-29
-28
-27
-26
-25
-24
-23
-22
-21
-20
-32 -31 -30 -29 -28 -27 -26 -25 -24 -23 -22
δ13C saturated hydrocarbons
δ13C
aro
mat
ic h
ydro
carb
ons
MioceneMiocene-oMiocene-eMiocene-jTumey-TemblorTumey-Temblor-eEoceneEocene-mCretaceousoutliersMiocene-Eocene
Stable Carbon Isotopes of oils - San Joaquin Basin
Data from USGS and from Kaplan and others (1988),Curiale and others(1985) and Peters and others (1994).

Biomarkers
• Pristane/phytane• Steranes (m/z 217)• Terpanes (m/z 191)

Mass Chromatograms of Terpanes - Kreyenhagen
g = gammacerane

Mass Chromatograms of Terpanes - Tumey
o = oleanane
g = gammacerane

Mass Chromatograms of Terpanes - Monterey
b = bisnorhopane
o = oleanane
g = gammacerane

0.00
2.00
4.00
6.00
8.00
10.00
12.00
14.00
-30 -29 -28 -27 -26 -25 -24 -23 -22 -21 -20
δ13C aromatic hydrocarbons
C26
tric
yclic
terp
anes
/ C24
te
trac
yclic
terp
ane
MioceneMiocene-oMiocene-eMiocene-jTumey-TemblorTumey-Temblor-eMiocene-EoceneEoceneEocene-mCretaceousoutliers
Terpane Ratio vs δ13C aromatic hydrocarbons
Data from USGS

0.5
1
1.5
2
2.5
3
3.5
4
-30 -29 -28 -27 -26 -25 -24 -23 -22 -21 -20
δ13C aromatic hydrocarbons
pris
tane
/phy
tane
MioceneMiocene-oMiocene-eMiocene-jTumey-TemblorTumey-Temblor-eEoceneEocene-mCretaceousoutlier
δ13C aromatic hydrocarbons vs pristane/phytaneSan Joaquin Oils
Data from USGS and Kaplan and others (1988)

Hierarchical Cluster AnalysisGroup3 plus C28S Gamm:HCA 12051075
mixed233Tem-m230Mio91Mio78Mio76Mio 135Mio 112Mio 106Mio-J174Mio-J173Mio 141Mio 139Mio 134Mio 133Mio 118Mio 116Mio 105Mio 98Mio 124Mio 120Mio 115Mio90Mio81Mio74Mio73Mio-o187Mio-o184Mio-o183Mio97Mio-o186Mio127Mio129Mio122Mio131Mio123Mio126Mio-e170Mio89Mio77Mio96Mio87Mio94Mio84Mio83Mio130Mio125Mio117Mio100Mio113Mio138Mio-o185Mio109Mio103Mio-J175Mio 104Mio 101Mio-e171Mio99Cre4Cre3Tem-e227Tem211Tem203Tem205Tem-e226Tem213Tem212Tem-e225Tem204Tem208Tem206Tem200Mio72Eo40Eo36Eo17Eo8Eo31Eo30Eo18Eo7Eo25Eo21Eo16
0.20.40.60.81.0
Hierarchical Cluster Analysis

Main Oil Types
• Kreyenhagen– Middle Eocene
• Tumey – Temblor (?)– Upper Eocene - Oligocene (?)
• Monterey and equivalents (3 sub-types)– Middle and upper Miocene
Cretaceous Moreno is a minor oil typeLower Miocene oil not recognized east of San
Andreas Fault

Oil-Source Rock Correlation
• Published source rock data– Kaplan and others (1988)– Curiale and others (1985)
• Moreno, Monterey and Kreyenhagen correlations already established in the literature
• What is the origin of Temblor reservoir oil?

-30
-29
-28
-27
-26
-25
-24
-23
-22
-21
-20
-32 -31 -30 -29 -28 -27 -26 -25 -24 -23 -22
δ13C saturated hydrocarbons
δ13C
aro
mat
ic h
ydro
carb
ons
MioceneMiocene-oMiocene-eMiocene-jTumey-TemblorTumey-Temblor-eEoceneEocene-mCretaceousoutliersMiocene-Eocene
Stable Carbon Isotopes of oils - San Joaquin Basin
Data from USGS and from Kaplan and others (1988),Curiale and others(1985) and Peters and others (1994).

Stable Carbon Isotopes of San Joaquin Source Rocks
Data from Kaplan and others (1988)
and Curiale and others (1985)
-30
-29
-28
-27
-26
-25
-24
-23
-22
-21
-20
-32 -31 -30 -29 -28 -27 -26 -25 -24 -23 -22
δ13C saturated hydrocarbons
δ13C
aro
mat
ic h
ydro
carb
ons
Miocene Santa MargaritaMiocene MontereyOligoceneOligocene WhepleyEocene TumeyEocene KreyenhagenEocene Markley

0.5
1
1.5
2
2.5
3
3.5
4
-30 -29 -28 -27 -26 -25 -24 -23 -22 -21 -20
δ13C aromatic hydrocarbons
pris
tane
/phy
tane
MioceneMiocene-oMiocene-eMiocene-jTumey-TemblorTumey-Temblor-eEoceneEocene-mCretaceousoutlier
δ13C aromatic hydrocarbons vs pristane/phytaneSan Joaquin Oils
Data from USGS and Kaplan and others (1988)

Data from Kaplan and others (1988)
and Curiale and others (1985)
0.5
1
1.5
2
2.5
3
3.5
4
-30 -29 -28 -27 -26 -25 -24 -23 -22 -21 -20δ13C aromatic hydrocarbons
pris
tane
/phy
tane
Miocene Santa MargaritaMiocene MontereyOligoceneOligocene WhepleyEocene TumeyEocene KreyenhagenEocene Markley
δ13C aromatic hydrocarbons vs pristane/phytane of San Joaquin Source
Rocks
Petroleum System Maps
• Moreno• Kreyenhagen• Tumey• Monterey
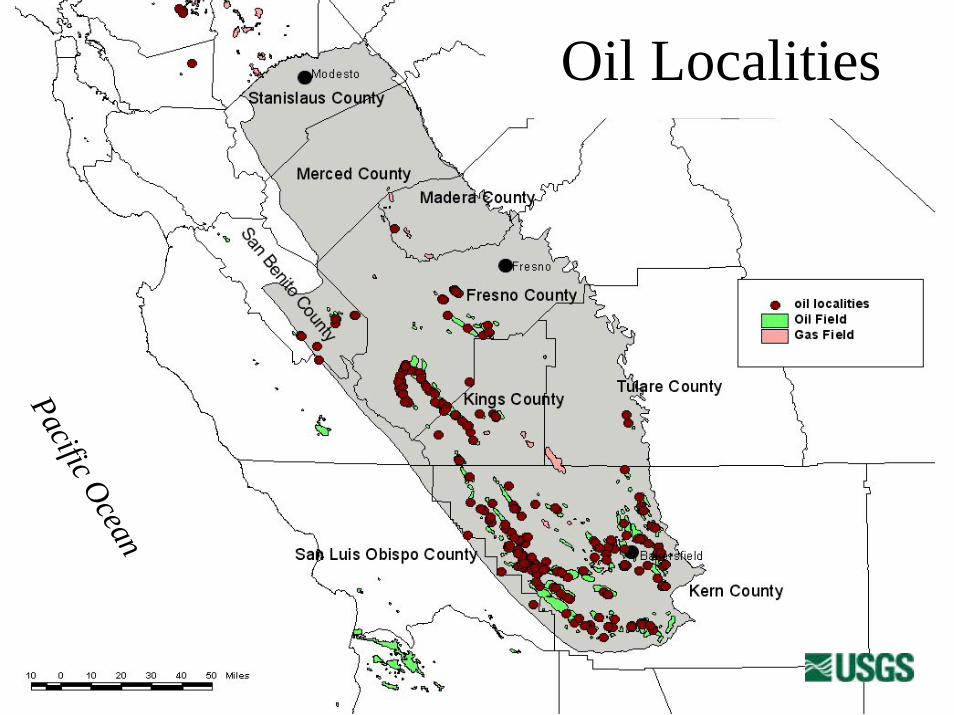
Oil Localities
Pacific Ocean
All Oil Data
Pacific Ocean
Cretaceous Moreno
Pacific Ocean
Griswold Canyon
Vallecitos field
Coalinga
field

Eocene Kreyenhagen
Pacific Ocean
Eocene Kreyenhagen
Pacific Ocean

Eocene Tumey
Pacific Ocean
Eocene Tumey
Pacific Ocean

Miocene Monterey
Pacific Ocean
Miocene Monterey
Pacific Ocean

Miocene Monterey
Pacific Ocean

Outliers
Pacific Ocean

All Oil Systems
Pacific Ocean

Petroleum Systems Summary
• Cretaceous Moreno – limited extent • Middle Eocene Kreyenhagen• Upper Eocene Tumey • Middle and Upper Miocene Monterey
and equivalents