oil & natural gas technology - national energy … library/research/oil-gas/enhanced oil... ·...
TRANSCRIPT
Oil & Natural Gas Technology
DOE Award No.: DE-FE0001243
Clean and Secure Energy from Domestic
Oil Shale and Oil Sands Resources
Quarterly Progress Report (July - September 2010)
Submitted by: Institute for Clean and Secure Energy
155 S. 1452 E. Room 380 Salt Lake City, Utah 84112
Prepared for:
United States Department of Energy National Energy Technology Laboratory
November 17, 2010
Office of Fossil Energy
Clean and Secure Energy from Domestic Oil Shale and Oil Sands
ResourcesDOE Award No.: DE-FE0001243
Quarterly Progress ReportJuly 2010 to September 2010
Submitted by:Institute for Clean and Secure Energy
155 S. 1452 E. Room 380Salt Lake City, UT 84112
Principal Investigator: Philip J. SmithProject Period: October 1, 2009 to March 31, 2011
Prepared for:U.S. Department of Energy
National Energy Technology Laboratory

Acknowledgment: "This material is based upon work supported by the Department of Energy under Award Number DE-FE0001243." Disclaimer: "This report was prepared as an account of work sponsored by an agency of the United States Government. Neither the United States Government nor any agency thereof, nor any of their employees, makes any warranty, express or implied, or assumes any legal liability or responsibility for the accuracy, completeness, or usefulness of any information, apparatus, product, or process disclosed, or represents that its use would not infringe privately owned rights. Reference herein to any specific commercial product, process, or service by trade name, trademark, manufacturer, or otherwise does not necessarily constitute or imply its endorsement, recommendation, or favoring by the United States Government or any agency thereof. The views and opinions of authors expressed herein do not necessarily state or reflect those of the United States Government or any agency thereof."
2
EXECUTIVE SUMMARY
The Clean and Secure Energy from Domestic Oil Shale and Oil Sands Resources program is part of the research agenda of the Institute for Clean and Secure Energy (ICSE) at the University of Utah. In this quarter, the Clean and Secure Energy program was involved in multiple technology transfer and outreach activities. ICSE researchers received feedback from the ICSE Industrial Advisory Board, laid the groundwork for transfer of the ICSE digital repository to the digital collections of the University of Utah’s Marriott Library, and optimized the interactive map for search engine recognition.
In Task 3.0, ICSE researchers completed their life-cycle greenhouse gas (GHG) comparison of fuel from a refinery employing oxy-fuel firing for CO2 capture with that from a conventional refinery. Although oxyfiring requires additional electricity generation, if the power is provided by a 53% efficient natural gas combined cycle plant, oxyfiring still offers a net reduction in GHG emissions ranging from 18 – 34%. Oxy-gas and air-fired simulations of an International Flame Research Foundation furnace are proceeding in order to compare the heat release from these two types of flames. The recent acquisition of an allocation on a massively parallel computer at Lawrence Berkeley National Laboratory will aid completion of these simulations.
In Task 4.0, ICSE researchers continued work with a hierarchical approach to developing simulation tools for predicting production rates of liquid fuel from in-situ thermal treament processes of oil shale/sands. The Subtask 4.1 team addressed meshing issues in Star-CCM+ by using a surface-wrapping model and by further mesh refinement of the Ecoshale rubblized oil shale bed. Team members are also running simulations with a coarser computational mesh and no turbulence models (e.g. laminar flow) to improve overall stability of the solution. The Subtask 4.2 team simulated a sequential process consisting of pyrolysis, in-situ combustion, and carbon dioxide reinjection was studied to address the challenges of in-situ thermal treatment, including heating efficiency, low permeability, and potential GHG constraints. The sequential hybrid process outperformed the pyrolysis in terms of both energy efficiency and oil produced. The Subtask 4.3 team performed experiments on Mahogany zone oil shale core samples (0.75 inches diameter and 3.5 inches long) under both isothermal and non-isothermal conditions at a back pressure of 500 psi. Analysis of the shale oil and gases produced under different conditions revealed that higher temperature/pressure produced more naphtha while lower heating rates and higher pressure produced more middle distillates. The Subtask 4.4 team performed three types of pyrolysis experiments to evaluate the effect of oil shale pyrolysis on water compositions, including oil shale samples soaked in water and then pyrolyzed, oil shale hydrous pyrolysis, and oil shale pyrolysis with nitrogen as carrier gas. Because such small amounts of water samples were collected, the type of analyses to perform is being carefully considered. The Subtask 4.5 team performed a geometry analysis of the pore network structure in three pyrolyzed oil shale core samples using computed tomography data. Porosities obtained from the pore voxel volume divided by the total voxel volume indicated higher porosities were present in the kerogen-rich layers of the samples. The Subtask 4.6 team focused on the interaction of six asphaltene model structures reported last quarter with an inorganic illite structure. The calculation of the interaction between the asphaltene structure and the illite was completed at the molecular mechanic level of theory using the Universal Force Field.
In Task 5.0, ICSE researchers characterized and researched access to oil shale and oil sands resources, met with Department of the Interior officials regarding land planning processes, and investigated other land planning issues such as School Trust Lands oil shale lease offerings and recent lease auctions. For the policy analysis of water availability and produced water issues, ICSE researchers reviewed state statutes, regulations, litigation, and related documents. Additionally, they evaluated water produced during natural gas extraction as a potential source of supply for oil shale or oil sands development.
3
In Task 6.0, ICSE researchers focused on the writing of draft section of the Market Assessment report and completing the engineering and economic analyses for the five unconventional fuels development scenarios to be included in the Market Assessment (ex-situ oil shale, in-situ oil shale, ex-situ oil sands, in-situ oil sands, Alaskan heavy oil). Due to inconsistencies in the economic models, the release of the draft Market Assessment report has been delayed until the next quarter. In addition, a report is being prepared that compares Utah and Canadian pre-leasing environmental requirements for tar sands and legal challenges to tar sands development and related case law.
PROGRESS, RESULTS, AND DISCUSSION
Task 1.0 - Project Management and Planning
During this quarter, there were no schedule/cost variances or other situations requiring updating/amending of the PMP.
Task 2.0 -Technology Transfer and Outreach
This task aims to enhance the dialogue between ICSE and industry and to engage in academic and public outreach/education efforts. One aspect of this task is soliciting feedback and guidance from the External Advisory Board (EAB). Substantive feedback was received from members of the EAB at the annual meeting (held last quarter), and a written summary of final EAB recommendations was prepared and approved by EAB members this quarter. Completing the final EAB recommendations satisfied a Task 2.0 milestone for this quarter. A copy of the final recommendations is attached to this quarterly report as Appendix A.
The ICSE Web Applications Programmer, Terrance Davis, specified, acquired and configured new DSpace hardware. In addition, the new version of DSpace has been installed and is now running on Institute hardware. Completion of these activities satisfied a Task 2.0 milestone for this quarter. Mr. Davis has also been developing a migration strategy for transitioning the ICSE Repository collections to the digital collections at the University of Utah’s Marriott Library.
The ICSE Librarian, Wendy Ajax, has continued to work on developing the public and private Scholarship collections housed in the ICSE Digital Repository. She has also continued to work with ICSE researchers on maintaining the Digital Repository’s private collections.
Interactive Map work this past quarter focused on installing a new server and ArcGIS Server software for the Interactive Map, which are two of the three steps required for the milestone of updating the Interactive Map’s mapping software. Work on the third step, recreating the map application using the new software, has begun. Additional efforts this quarter focused on optimizing the interactive map for search engine recognition. As a result of this optimization, the Interactive Map appears in the first three pages of search results when users Google with search phrases like "heavy oil map utah" or "oil shale map utah". The ICSE GIS Applications Developer, Michelle Kline, also presented the Interactive Map at the September 2010 Water and Energy Symposium in Pittsburgh, PA.
Finally, the redesigned ICSE website was launched this quarter, with initial coding and design efforts completed by the ICSE Webmaster, Andrew Morgenegg, and the ICSE Graphic Designer, Adam Taylor.
4

Task 3.0 - Clean Oil Shale and Oil Sands Utilization with CO2 Management
Subtask 3.1 – Macroscale CO2 Analysis (PI: Kerry Kelly, David Pershing)
During this quarter, the Project Team completed their life-cycle greenhouse gas (GHG) comparison of fuel from a refinery employing oxy-fuel firing for CO2 capture with that from a conventional refinery. The analysis was based on a study of the conversion of process heaters and boilers in a refinery to oxyfiring for CO2 capture (Allam et al., 2005) as well as Argonne National Laboratory’s (ANL) GREET tool (ANL, 2009). The boilers and process heaters are responsible for approximately 40% of the CO2 emissions from the refinery; the other CO2 sources are much less cost effective to capture. Conversion to oxyfiring of boilers and process heaters would require additional energy for the operation of an air separation unit (ASU) and for compression, cleanup, and transport of CO2. In the Allam study (2005), this additional electricity was produced with a 53% efficient natural gas combined cycle (NGCC) plant.
Figure 1 shows the results of this comparison for the following cases:
• Process Heat Efficiency: Improvements to refinery process heater efficiency from an average of 83% to 95%, resulting in a 5% reduction in well-to-pump (WTP) and a 1% reduction in well-to-wheel (WTW) GHG emissions.
• Case 1: A gas turbine and associated steam production provides power for the ASU and CO2 purification, compression, and transport, resulting in an 18% reduction in WTP and a 3% reduction in WTW GHG emissions.
• Case 2: A gas turbine provides power to the ASU and other equipment, but steam from the turbine replaces a portion of the boiler steam, resulting in a lower oxygen (O2) requirement, a smaller ASU, and less cooling water. A 19% reduction in WTP and a 4% reduction in WTW GHG emissions are achieved.
• Case 3: The gas turbine is run in precombustion decarbonization mode, part of the O2 is used for hydrogen production, and CO2 removal is achieved with amine scrubbing. A 34% reduction in WTP and a 6% WTW GHG emissions are achieved.
5

Figure 1: Comparison of life-cycle GHG well-to-pump emissions for one case with improved process heater improved efficiency and three oxyfiring cases.
Although the GHG emissions associated with the additional electricity generation and with the extraction/transport of the natural gas required to power the NGCC plant are significant (green bar and lowest blue bar in Figure 1), oxyfiring still offers a net reduction in GHG emissions ranging from 18 – 34%. However, if the additional electricity for Case 1 was produced with a 33% efficient coal power plant, the net reduction in WTP GHG emissions would be 9% instead of 18%. If the additional electricity were produced with solar photovoltaics, wind, or hydropower, the net reduction in WTP GHG emissions would be 22%, 25%, and 24%, respectively. Finally improvements in air-separation technology are expected to reduce the electricity requirement for oxygen production from 193 kWh/tonne O2 (Case 1) to 145 kWh/tonne O2 by 2015 (Beysel, 2009). These improvements would reduce WTP GHG emissions by 25% (instead of 18% for Case 1), making oxyfiring more attractive. The Project Team also began evaluating the life-cycle GHG emissions for several of the air and oxy scenarios developed under Subtask 6.1. The results from the Subtask 6.1 ASPEN/Promax models can be exported into Excel, so the Team is developing a strategy to quickly perform an analysis of GHG emissions using Excel. Because the results from Subtask 6.1 have been evolving, this strategy is still being developed. However, the preliminary life-cycle analysis results have provided useful data for comparing the results of the Subtask 6.1 scenarios.
The milestone to identify or develop appropriate tools for predicting life-cycle GHG emissions from a given technology is not yet complete. For the refinery analysis discussed above, the Project Team employed the GREET model from ANL. For the air and oxy scenarios developed under Subtask 6.1, the strategy has also been evolving as discussed in the previous paragraph. The Team anticipates completing this milestone by January 2010.
Finally, the Project Team made a few modifications to the carbon management section of the assessment based on internal-review comments.
6
Subtask 3.2 - Flameless Oxy-gas Process Heaters for Efficient CO2 Capture (PI: Jennifer Spinti)
The Project Team focused simulation efforts on a recent oxy-gas experimental dataset featuring a new burner, the ENEL TEA-C burner, and the option for flue gas recirculation (Coraggio and Laiola, 2009). Burner drawings were obtained from the authors so that inlet areas/velocities could be matched. In the experiments, the burner was operated in both air-fired and oxy-fired modes. In the oxy-fired mode, recycled flue gas (RFG) was mixed with O2 prior to injection into the furnace. Reaction tables were created for both these modes and initial simulations were performed. These initial simulations were run under adiabatic conditions with very diffusive numerics in order to obtain a stable solution. The computational domain is 2m x 2m x 2m with a mesh resolution of 225 x 225 x 225. With this resolution, the burner inlets are reasonably resolved. These inlets include an inner jet for air or RFG+O2, and annular ring for the fuel (natural gas) injection, and a second annular ring for air or RFG+O2. These cases are computationally intensive, requiring 729 cores for approximately 5 days in order to obtain results for one simulation. Initial work was performed on a University of Utah cluster with 2048 cores. However, completion of the validation/uncertainty quantification test matrix will require extensive resources to complete approximately 25 production runs. Recently, the Project Team applied for and received a large allocation on Franklin, a Cray XT4 massively parallel processing system with 38,128 Opteron compute cores and a peak performance of 352 TFlops/sec. Franklin is located at the DOE Office of Science User Facility at Lawrence Berkeley National Laboratory. An oxy-fuel simulation run on Franklin has been stable for 2 seconds of simulation time and queue wait times have been short, indicating that Franklin will provide the necessary platform for the completion of this project.
Task 4.0 - Liquid Fuel Production by In-situ Thermal Processing of Oil Shale/Sands
Subtask 4.1 - Development of CFD-based Simulation Tools for In-situ Thermal Processing of Oil Shale/Sands (PI: Philip Smith)
The Project Team is using the Star-CCM+ commercial software package to simulate rubbilized in-situ thermal treatment of oil shale. All mesh generation techniques to produce an optimal mesh have been considered and the Team has finalized the mesh generation strategy.
Meshing issues have been addressed in Star-CCM+ by using a surface-wrapping model and by further mesh refinement. Figure 2 shows a comparison of previous geometry details in the simple eight-piece shale case to the wrapped surface geometry. Surface wrapping is used to wrap problematic details in the geometry, such as the corner of a cube or the sharp angle between two pieces of shale. Surface wrapping corrects these areas by combining regions. An example of the corner of a cube being combined into the cube below it is seen in Figure 2.
7

Figure 2: Comparison of original geometry and mesh (top) with newly-adapted wrapped surface geometry and mesh (bottom).
Figures 3 and 4 show images of a refined mesh (14 million cells) that could reduce the possibility of solution oscillation. However, this mesh greatly increases the computational time required.
Figure 3: Refined mesh – close up view of problematic area.
8
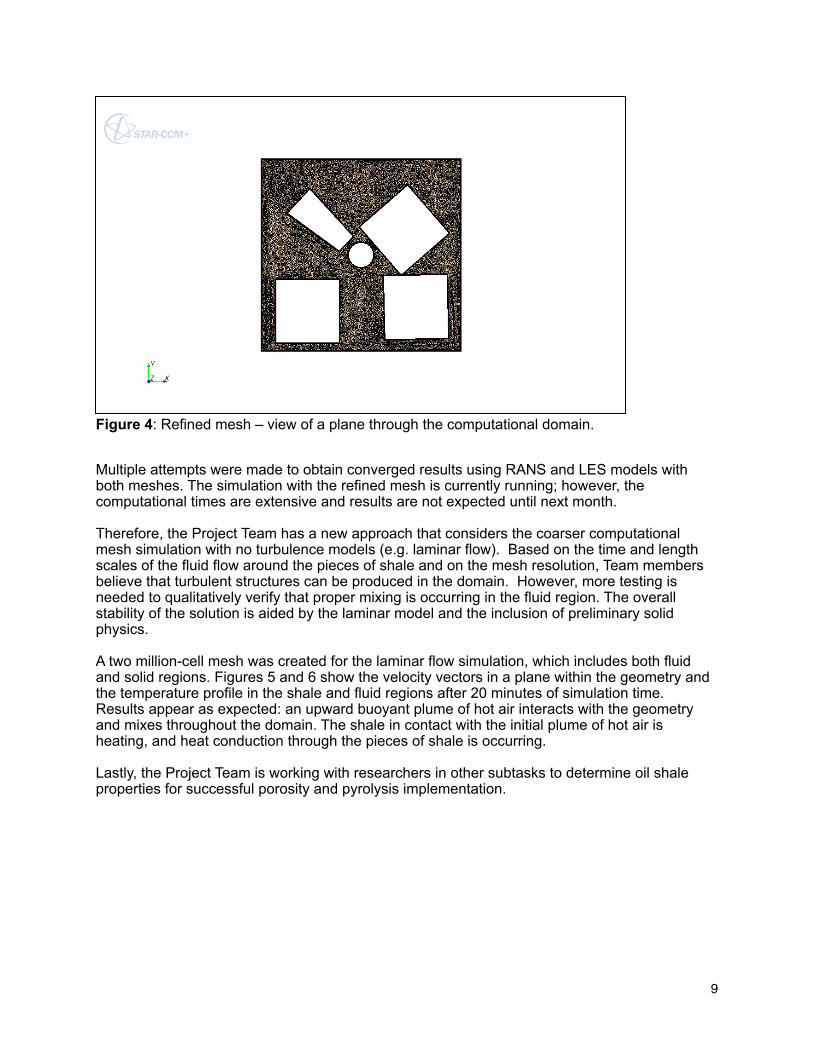
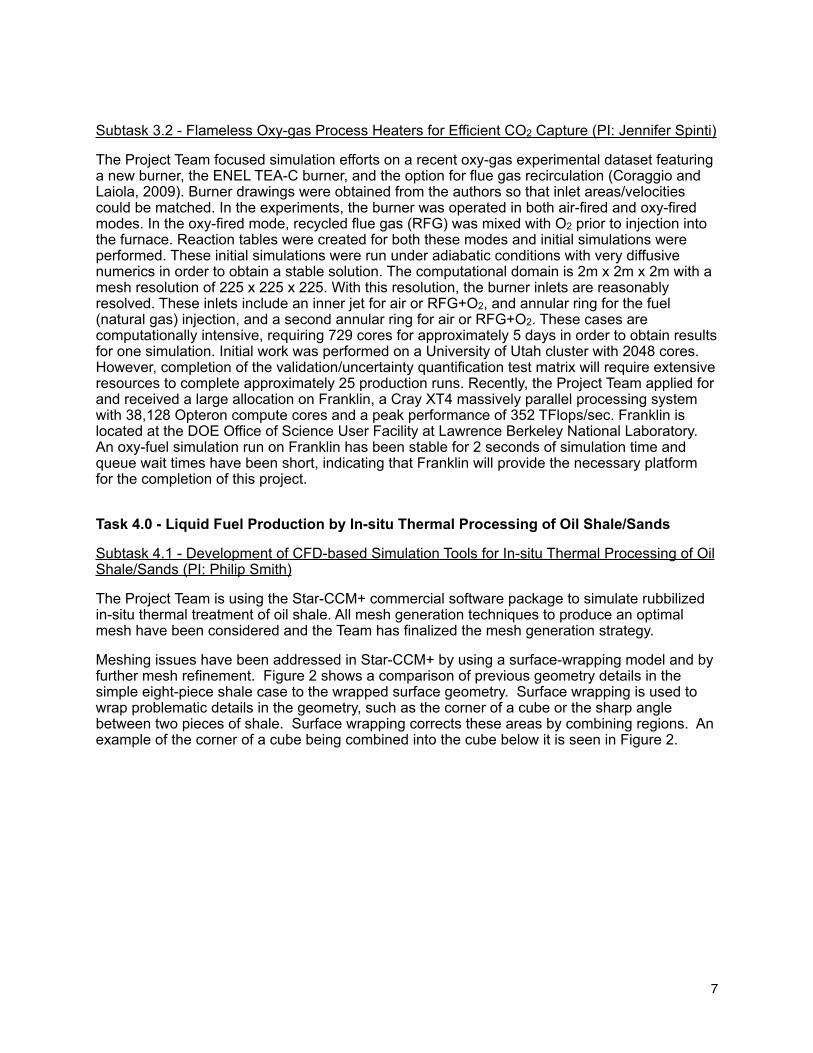
Figure 4: Refined mesh – view of a plane through the computational domain.
Multiple attempts were made to obtain converged results using RANS and LES models with both meshes. The simulation with the refined mesh is currently running; however, the computational times are extensive and results are not expected until next month.
Therefore, the Project Team has a new approach that considers the coarser computational mesh simulation with no turbulence models (e.g. laminar flow). Based on the time and length scales of the fluid flow around the pieces of shale and on the mesh resolution, Team members believe that turbulent structures can be produced in the domain. However, more testing is needed to qualitatively verify that proper mixing is occurring in the fluid region. The overall stability of the solution is aided by the laminar model and the inclusion of preliminary solid physics.
A two million-cell mesh was created for the laminar flow simulation, which includes both fluid and solid regions. Figures 5 and 6 show the velocity vectors in a plane within the geometry and the temperature profile in the shale and fluid regions after 20 minutes of simulation time. Results appear as expected: an upward buoyant plume of hot air interacts with the geometry and mixes throughout the domain. The shale in contact with the initial plume of hot air is heating, and heat conduction through the pieces of shale is occurring.
Lastly, the Project Team is working with researchers in other subtasks to determine oil shale properties for successful porosity and pyrolysis implementation.
9

Figure 5: Velocity vectors for laminar simulation on a coarse mesh with heat conduction through the shale.
Figure 6: Temperature profile in shale and fluid regions.
Subtask 4.2 - Basin-wide Characterization of Oil Shale Resource in Utah and Examination of In-situ Production Models (PI: Milind Deo)
Key challenges for successful deployment of in-situ oil shale production strategies include: heating rate, heating efficiency, permeability, and GHG constraints. First, heating rates of in-situ resources are generally slow because heat transfer depends on conduction of heat through rock. Product distributions depend on the time/temperature history of the resource, and slow
10

heating rates tend to decrease the yield of oil from oil shale. Second, since heat is required as an input for oil production from oil shale, heating efficiency is crucial. The amount and quality of the total energy produced from the process must exceed the amount and quality of the energy required to drive it. This efficiency depends on the source of the input energy and on the underground heating strategy for the oil shale resource. Third, oil shale is typically characterized by very low initial permeability. Without adequate permeability, generated products cannot be produced by conventional methods. Fourth, process heating requirements obtained from conventional sources would contribute to GHG emissions, the fuel products would eventually be contributors to further emissions, and carbonate mineral decomposition within these resources at the process temperatures could be another significant GHG contributor.
A sequential process consisting of pyrolysis, in-situ combustion, and carbon dioxide reinjection was studied to address these challenges. STARS, a thermal reservoir simulator by CMG, was used to evaluate some of the characteristics of such a process. Pyrolysis (heating in the absence of air) was the first step in the process. Under pyrolysis conditions, permeability increases as the solid kerogen in pore spaces converts to fluids. An exponential model within STARS, equation (1) was used to relate permeability to available porosity.
Equation (1)
In equation (1), the empirical constant kmul = 5. The initial permeability was between 0 and 1 millidarcies (md), and maximum permeability after heating was between 4 and 5 md.
Initially, the rock was heated by pyrolysis at a rapid rate in order to maximize heat flux into the reservoir and to generate sufficient permeability to allow for air injection in the combustion step. During pyrolysis, residual coke is generated due to the high temperatures. This coke can be used as a fuel for in-situ combustion to generate process heat farther from the heating well. At 600 days, pyrolysis heating was terminated and air was injected. In-situ combustion results in energy savings because the process supplies its own heat, and external heat generation is no longer required.
After 2000 days, CO2 injection replaced air injection in order to drive out any remaining products and to provide permanent CO2 sequestration. Figures 7 and 8 show a comparison of simulated results for the sequential hybrid process vs. a process using pyrolysis only (no in-situ combustion step) followed by CO2 injection.
11

Figure 7: Comparison of energy supply requirements for the sequential hybrid and pyrolysis only processes.
Figure 8: Comparison of energy supply requirements for the sequential hybrid and pyrolysis only processes.
These results show that the sequential hybrid process outperforms the pyrolysis only process with 112 million BTU energy savings, 157 barrels more oil produced (not shown in figures), and almost 200,000 standard cubic feet (scf) more gas produced. These results are somewhat counterintuitive since some oil and gas may be consumed during in situ combustion. Upon further investigation of the pyrolysis only process, it was discovered that there was significant oil pooling at the bottom of the reservoir (see Figure 9) because there was not sufficient permeability generated at the bottom of the reservoir connecting products to the production well. As CO2 was injected, the injected gasses and gravity drove the oil downward into low permeability zones, prohibiting significant flow toward the producer. Additional simulations where more heat was supplied by pyrolysis confirmed these conclusions as more oil was produced during the same time period.
12
Figure 9: Oil pooling in low permeability zone at the bottom of the reservoir after pyrolysis only production.
The CO2 balance comparison between a pyrolysis only process and the sequential hybrid process depends on assumptions made for the energy source supplying pyrolysis heat. Net CO2 injection was 8040 cubic feet (ft3). In the sequential hybrid process, only a small fraction of the generated CO2 was injected back into the reservoir; 600,000 ft3 of CO2 were generated from in-situ combustion for a net CO2 injection of -597,000 ft3. It should be noted that inorganic carbonate decomposition reactions were not considered in these simulations.
For the basin-wide characterization portion of the project, the Project Team finished the description of the Coyote Wash 1 core, finished construction of the core log, and complete XRF analyses on Coyote Wash. A report summarizing this work is being prepared. rite a report sometime this fall or early winter.
Subtask 4.3 – Multiscale Thermal Processing of Oil Shale (PI: Milind Deo, Eric Eddings)
The Project Team obtained Mahogany zone oil shale core samples from Utah Geological Survey (UGS) that were 0.75 inches diameter and 3.5 inches long. The experiments were performed with these samples as received (e.g. no pre-treatment). Figure 10 shows the schematic diagram of the experimental setup; experimental conditions and results are summarized in Table 1. Nitrogen was used as sweep gas with the flow rate of 60 ml/min. Surface temperature was used as the controlling probe for all the experiments. Isothermal experiments were performed at the final temperature for the duration of 24 hours while non-isothermal experiments were stopped when the temperature reached 500ºC. A back pressure regulator was used to hold the system at the desired pressure (500 psi). Liquid samples were collected from the receiver and from the two condensers at the end of each experiment. Tedlar bags of 1 liter capacity were used to collect the gases evolved during pyrolysis. The amount of gas loss was estimated by the difference of weight loss and oil yield.
13

Figure 10: Schematic diagram of the experimental setup used for ambient and pressure pyrolysis study.
Table 1. Experimental conditions and results obtained from isothermal and non-isothermal heating of Mahogany zone oil shale core samples.
TGA analyses from different sections of core samples indicate that different sections have different amounts of organic matter. Thus, the results were analyzed in terms of oil to coke ratio, which is likely to be independent on initial weight of oil shale and the amount of organic matter in each sample. Figure 11 shows the ratio of oil to coke formed during pyrolysis at different conditions.
14

Figure 11: Ratio of oil yield and coke formed during core pyrolysis.
Based on the results shown in Figure 11, the oil yield is higher in ambient pyrolysis compared to elevated pressure at the same temperature, an increase in temperature increases the oil to coke ratio, and higher oil yields are favored at high temperature, high heating rate and low pressure. For ambient pyrolysis, a lower heating rate produces less oil compared to coke while at higher pressures, this trend is reversed.
The shale oil and gases produced under different conditions were analyzed using gas chromatography. The chromatograms of liquid samples were apportioned into naphtha (C7-C12), middle distillate (C13-C20) and fuel oil (C21-C47) to compare oil qualities; results are shown in Figure 12. The effect of the experimental conditions on shale oil quality can be summarized as follows:
• Higher temperature and higher pressure produce more naphtha
• Lower heating rate and higher pressure produce more middle distillates.
Figure 12: Comparison of oil quality produced at various temperatures, heating rates, and pressures.
15
Gas analyses showed that at higher temperatures, more non-condensable gases were produced. At higher pressures and temperatures, more condensable gases were generated. Higher pressure oil samples were less viscous, less dense, and had lower wax appearance temperatures.
An experiment with a 2.5-inch core sample was also completed. Results are still being analyzed.
Subtask 4.4 - Effect of Oil Shale Processing on Water Compositions (PI: Milind Deo)
Three types of pyrolysis experiments were performed to evaluate the effect of oil shale pyrolysis on water compositions.
1. Oil shale samples were soaked in water for various durations and then were pyrolyzed in the pyrolysis experimental set up. TGA, crushed rock and core experiments were performed using these water-soaked samples.
2. Oil shale hydrous pyrolysis experiments were performed at a low pyrolysis temperature (200ºC). These experiments were performed in batch mode; water and oil samples were collected at the end of the experiment.
3. Oil shale pyrolysis experiments were performed with nitrogen as carrier gas, and water along with hydrocarbons were collected. Significant amounts of water were collected only when a large oil shale sample was pyrolyzed. For example, during the pyrolysis of 2.5-inch core (760 g initial weight), about 5 ml of water was collected. The pyrolysis experiment was carried out at 500ºC and 500 psia.
Since small amounts of water samples have been collected, the Project Team must be careful about the type of analyses to perform. They may perform some in-house gas chromatographic work with small quantities before sending the sample out to commercial laboratories in Houston.
Subtask 4.5 - Pore Scale Analysis of Oil Shale/Sands Pyrolysis (PI: Jan Miller, Chen-Luh Lin)
As reported in the previous quarter, the Project Team is conducting analyses on 15-cm long pyrolyzed core samples. First, they loaded the core sample in the pyrolysis reactor. To investigate the effect of reaction temperature, drill core of oil shale samples were pyrolyzed at different temperatures and the conditions are summarized in Table 2. For all three experiments, the heating rate was 100ºC/minute.
Table 2. Sample number of oil shale under pyrolysis at three different reaction temperatures.
Sample No. Type Temperature (oC) ModeMD-3 ¾” drill core 300 N2 flowMD-4 ¾” drill core 350 N2 flowMD-5 ¾” drill core 400 N2 flow
During this quarter, the Project Team performed a geometry analysis of the pore network structure in the three core samples. Porosity, the simplest property of porous systems, is defined as the volume fraction of pores. Porosity can be used to predict the permeability defined by Darcy’s law. The porosity of oil shale after pyrolysis can be used to predict the permeability
16

from pore-scale network modeling or from Lattice-Boltzman simulations as reported previously. In addition, information such as porosity change after pyrolysis at different reaction temperatures/reaction rates can be provided to other subtasks doing process/reservoir scale simulation
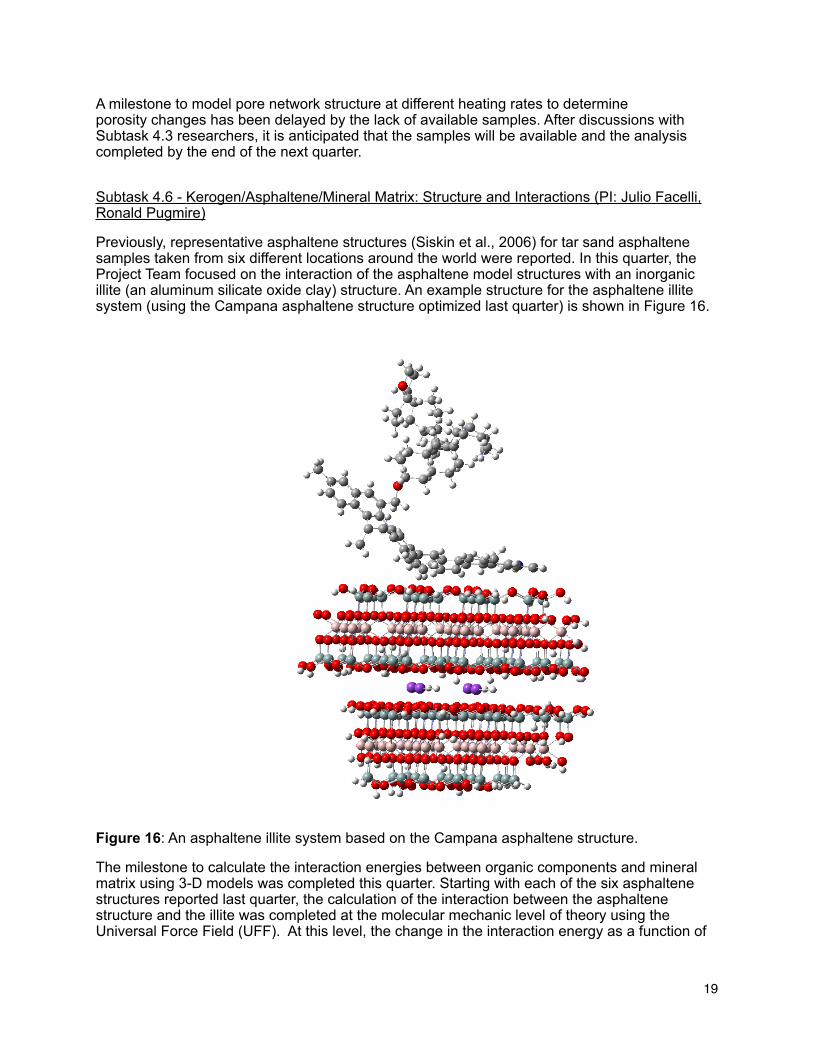
Quantitative information on porosity change of Mahogany zone oil shale samples after pyrolysis can be determined from the computed tomography (CT) data. To facilitate the pore geometry analysis, the bottom portions of the original grayscale CT image data (512x512x512 voxels) were treated to extract the pore features as shown in left-hand side of Figures 13, 14 and 15 for samples MD-3, MD-4 and MD-5, respectively. Cracks and voids are observed in the kerogen-rich lamella layers / dark regions. The light regions are the silicate-rich lamella layers.
The porosity was measured as the pore voxel volume divided by the total voxel volume of the 3-D data set. The measured porosity profiles are shown as a function of the height of the drill core sample on the right-hand side of Figures 13, 14, and 15. The mean porosities of MD-3, MD-4, and MD-5 are 9.44%, 13.37%, and 13.36% respectively. As expected, higher porosities are obtained from the kerogen-rich layer of the pyrolyzed oil shale drill core samples.
Figure 13: Overall view of MD-3 core sample after pyrolysis. Cracks are identified by the black regions in the left sample image. The porosity variation with sample height as measured from CT data is shown at right.
17
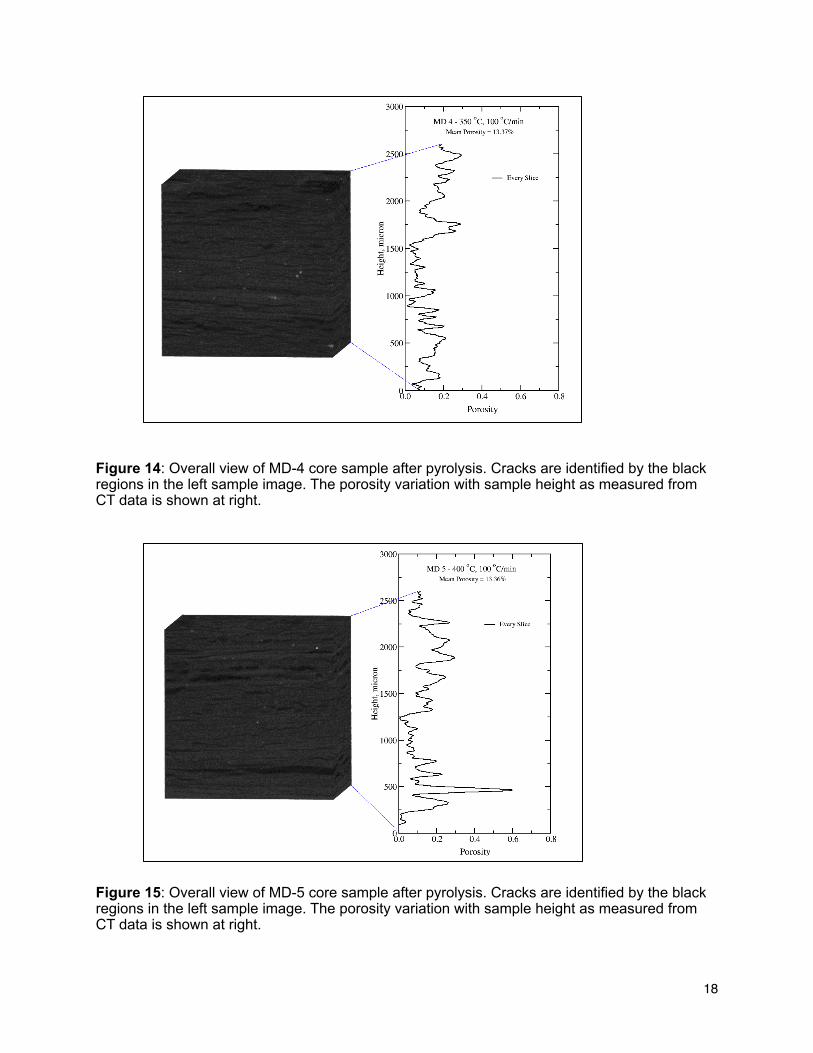
Figure 14: Overall view of MD-4 core sample after pyrolysis. Cracks are identified by the black regions in the left sample image. The porosity variation with sample height as measured from CT data is shown at right.
Figure 15: Overall view of MD-5 core sample after pyrolysis. Cracks are identified by the black regions in the left sample image. The porosity variation with sample height as measured from CT data is shown at right.
18
A milestone to model pore network structure at different heating rates to determineporosity changes has been delayed by the lack of available samples. After discussions with Subtask 4.3 researchers, it is anticipated that the samples will be available and the analysis completed by the end of the next quarter.
Subtask 4.6 - Kerogen/Asphaltene/Mineral Matrix: Structure and Interactions (PI: Julio Facelli, Ronald Pugmire)
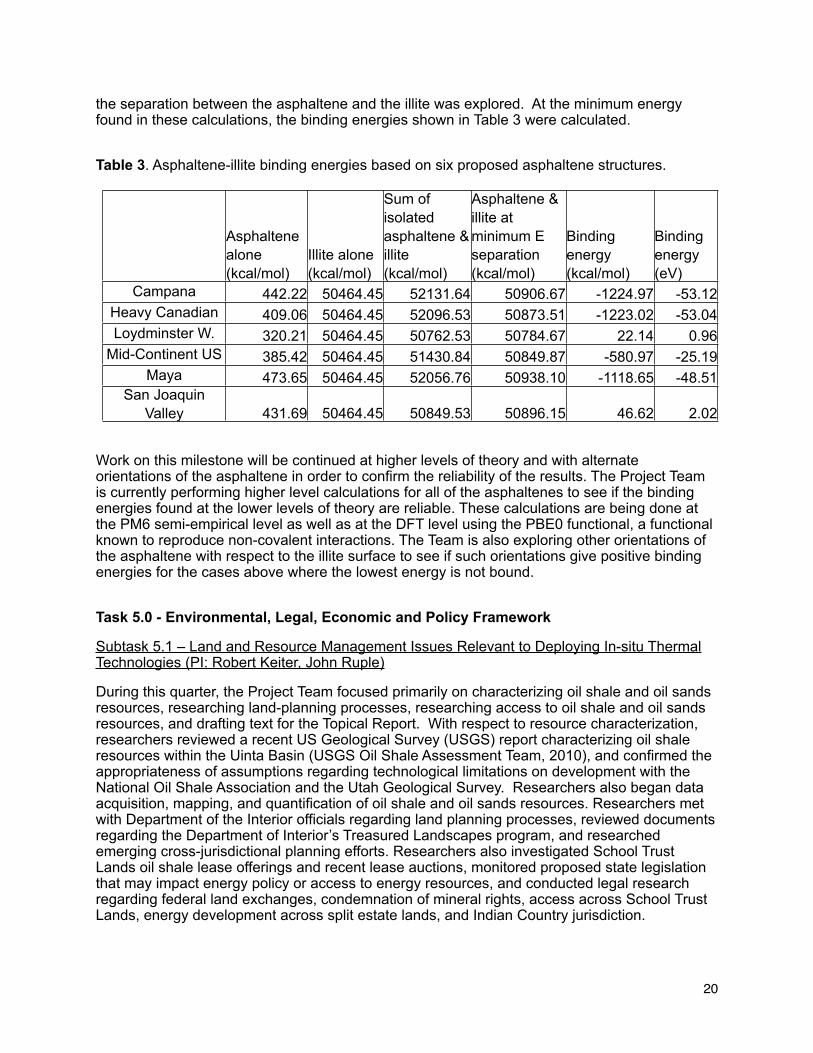
Previously, representative asphaltene structures (Siskin et al., 2006) for tar sand asphaltene samples taken from six different locations around the world were reported. In this quarter, the Project Team focused on the interaction of the asphaltene model structures with an inorganic illite (an aluminum silicate oxide clay) structure. An example structure for the asphaltene illite system (using the Campana asphaltene structure optimized last quarter) is shown in Figure 16.
Figure 16: An asphaltene illite system based on the Campana asphaltene structure.
The milestone to calculate the interaction energies between organic components and mineral matrix using 3-D models was completed this quarter. Starting with each of the six asphaltene structures reported last quarter, the calculation of the interaction between the asphaltene structure and the illite was completed at the molecular mechanic level of theory using the Universal Force Field (UFF). At this level, the change in the interaction energy as a function of
19
the separation between the asphaltene and the illite was explored. At the minimum energy found in these calculations, the binding energies shown in Table 3 were calculated.
Table 3. Asphaltene-illite binding energies based on six proposed asphaltene structures.
Asphaltene alone (kcal/mol)
Illite alone (kcal/mol)
Sum of isolated asphaltene & illite (kcal/mol)
Asphaltene & illite at minimum E separation (kcal/mol)
Binding energy (kcal/mol)
Binding energy (eV)
Campana 442.22 50464.45 52131.64 50906.67 -1224.97 -53.12Heavy Canadian 409.06 50464.45 52096.53 50873.51 -1223.02 -53.04Loydminster W. 320.21 50464.45 50762.53 50784.67 22.14 0.96
Mid-Continent US 385.42 50464.45 51430.84 50849.87 -580.97 -25.19Maya 473.65 50464.45 52056.76 50938.10 -1118.65 -48.51
San Joaquin Valley 431.69 50464.45 50849.53 50896.15 46.62 2.02
Work on this milestone will be continued at higher levels of theory and with alternate orientations of the asphaltene in order to confirm the reliability of the results. The Project Team is currently performing higher level calculations for all of the asphaltenes to see if the binding energies found at the lower levels of theory are reliable. These calculations are being done at the PM6 semi-empirical level as well as at the DFT level using the PBE0 functional, a functional known to reproduce non-covalent interactions. The Team is also exploring other orientations of the asphaltene with respect to the illite surface to see if such orientations give positive binding energies for the cases above where the lowest energy is not bound.
Task 5.0 - Environmental, Legal, Economic and Policy Framework
Subtask 5.1 – Land and Resource Management Issues Relevant to Deploying In-situ Thermal Technologies (PI: Robert Keiter, John Ruple)
During this quarter, the Project Team focused primarily on characterizing oil shale and oil sands resources, researching land-planning processes, researching access to oil shale and oil sands resources, and drafting text for the Topical Report. With respect to resource characterization, researchers reviewed a recent US Geological Survey (USGS) report characterizing oil shale resources within the Uinta Basin (USGS Oil Shale Assessment Team, 2010), and confirmed the appropriateness of assumptions regarding technological limitations on development with the National Oil Shale Association and the Utah Geological Survey. Researchers also began data acquisition, mapping, and quantification of oil shale and oil sands resources. Researchers met with Department of the Interior officials regarding land planning processes, reviewed documents regarding the Department of Interior’s Treasured Landscapes program, and researched emerging cross-jurisdictional planning efforts. Researchers also investigated School Trust Lands oil shale lease offerings and recent lease auctions, monitored proposed state legislation that may impact energy policy or access to energy resources, and conducted legal research regarding federal land exchanges, condemnation of mineral rights, access across School Trust Lands, energy development across split estate lands, and Indian Country jurisdiction.
20

One milestone was completed this quarter: drafting a detailed outline and abstract for the Topical Report that is the deliverable for this subtask. Copies of the outline and abstract are included in Appendices A and B, respectively.
Subtask 5.2 - Policy Analysis of Water Availability and Produced Water Issues Associated with In-situ Thermal Technologies (PI: Robert Keiter, John Ruple)
The Project Team focused on a review of state statutes, regulations, litigation, and related documents regarding produced water development and disposal permitting. Team members reviewed reports on produced water management authored by the National Academy of Sciences and ANL, as well as reports by Western Resource Advocates on water for oil shale and oil sands development. Researchers continue to evaluate water produced during natural gas extraction as a potential source of supply for oil shale or oil sands development and to monitor pending federal and state legislation regarding produced water management and hydraulic fracturing. Researchers attended conferences on Colorado River management and watershed planning.
One milestone was completed in this quarter: drafting a detailed outline and abstract for the Topical Report that is the deliverable for this subtask. Copies of the outline and abstract are included in Appendices C and B, respectively.
6.0 – Economic and Policy Assessment of Domestic Unconventional Fuels Industry
Subtask 6.1 Engineering Process Models for Economic Impact Analysis (PI: Terry Ring)
During the quarter, the Project Team was engaged in writing drafts of sections for the Market Assessment (Subtask 6.3), completing the engineering and economic analyses for the five unconventional fuels development scenarios to be included in the Market Assessment (ex-situ oil shale, in-situ oil shale, ex-situ oil sands, in-situ oil sands, Alaskan heavy oil), and checking the various scenarios for internal and scenario-to-scenario consistency. One graduate student, Bernardo Castro, finished his MS thesis and left to pursue his PhD thesis elsewhere during the quarter. Team members have encountered some internal and scenario-to-scenario inconsistencies during the quarter and have had to slow work on writing the final report to be assured that the data going into it is accurate. This accuracy checking must be completed before the finalized data can be reported out.
Subtask 6.2 - Policy analysis of the Canadian oil sands experience (PI: Kirsten Uchitel)
The Project Team continued to research and analyze issues related to taxes and royalties levied on oil sands production as well as downstream and marketing challenges facing oil sands development. Team members conducted research on the differences between pre-leasing requirements in the U.S. and Canada. A report is being prepared that compares Utah and Canadian pre-leasing environmental requirements for tar sands and legal challenges to tar sands development and related case law. Research conducted this quarter also focused on comparative analysis of oil sands development in Utah and Canada from the Native American/First Nations perspective, including research and review of recent studies, litigation, and potential claims, as well as analysis of current legal challenges to federal oil sands leasing.
21
Subtask 6.3 – Market Assessment Report (PI: Jennifer Spinti)
The focus of the Project Team during this quarter was the preparation of a draft release of the Market Assessment report. The release of the draft, scheduled for the end of September 2010, was delayed due to some inconsistencies in the supply cost analysis as described in Subtask 6.1. One section entitled “Scenario-based Approach to Microeconomic Analysis of Unconventional Liquid Fuel Development” was completed and provided in draft form to Program Manager Robert Vagnetti. It is anticipated that the remainder of the sections will be completed and released in draft form to reviewers by the end of the next quarter. Reviewers include Yinka Ogunsola (DOE), Robert Vagnetti (DOE), Glen Snarr (Earth Energy Resources), Gary Aho (Sage Geotech), Laura Nelson (Red Leaf Resources), Roger Day (AMSO), Andy Wolfserg (LANL), and Rob Simmons (USTAR).
CONCLUSIONS
The Clean and Secure Energy from Domestic Oil Shale and Oil Sands Resources program is wrapping up work with its DSpace repository of unconventional fuels documents in preparation for moving it to a new host, the University of Utah’s Institutional Repository. Researchers in the thrust area related to oil shale and sands utilization with CO2 management have completed an analysis of CO2 emissions from conventional versus oxy-fired refining and are running simulations of the oxy-gas-fired IFRF furnace. Researchers in the thrust area related to liquid fuel production from in-situ thermal treatment of oil shale/sands have made progress in the development of physical models (e.g. kerogen pyrolysis, porosity, kerogen/clay structural models) and in the application of simulation tools to in-situ thermal treatment processes (e.g. pyrolysis/in-situ combustion and rubblized beds). Researchers in the environment and policy thrust area have examined both federal and state land planning processes as they apply to oil shale/sands development and have reviewed state statutes, regulations, and litigation regarding produced water development and disposal permitting. Researchers in the market assessment thrust area are continuing to work on a draft of the Market Assessment report that will be released to reviewers in the next quarter.
22
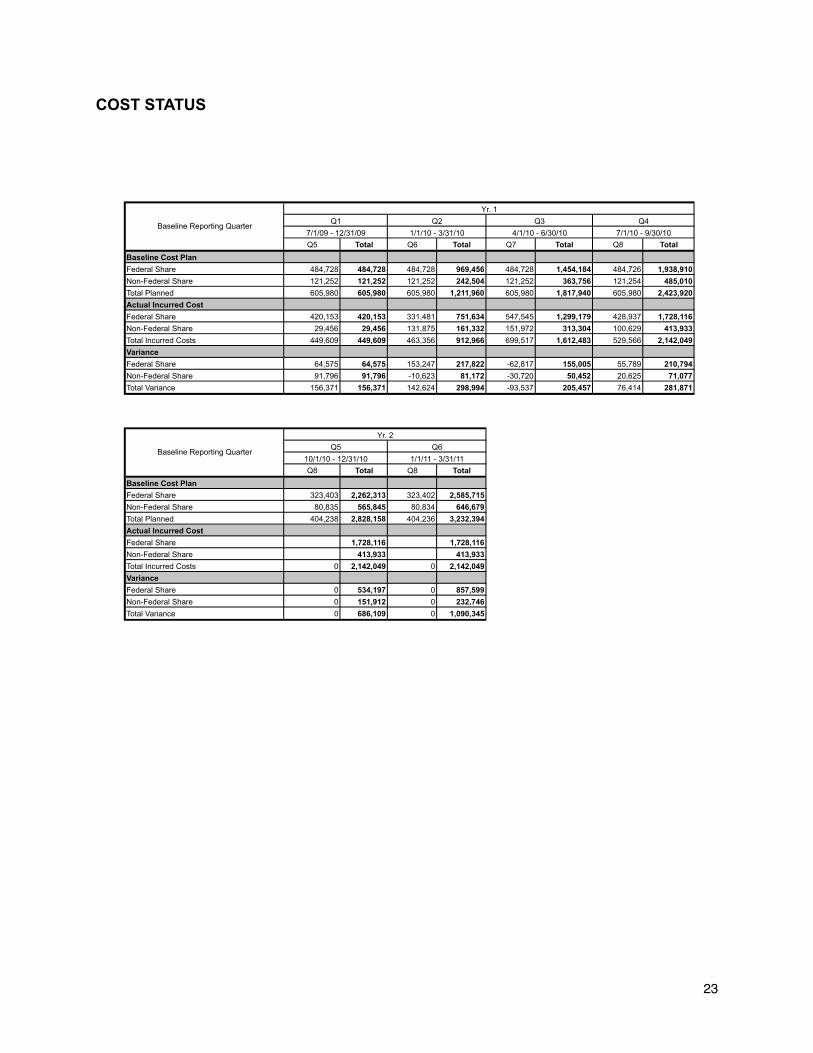
COST STATUS
Q5 Total Q6 Total Q7 Total Q8 Total
Baseline Cost Plan
Federal Share 484,728 484,728 484,728 969,456 484,728 1,454,184 484,726 1,938,910
Non-Federal Share 121,252 121,252 121,252 242,504 121,252 363,756 121,254 485,010
Total Planned 605,980 605,980 605,980 1,211,960 605,980 1,817,940 605,980 2,423,920
Actual Incurred Cost
Federal Share 420,153 420,153 331,481 751,634 547,545 1,299,179 428,937 1,728,116
Non-Federal Share 29,456 29,456 131,875 161,332 151,972 313,304 100,629 413,933
Total Incurred Costs 449,609 449,609 463,356 912,966 699,517 1,612,483 529,566 2,142,049
Variance
Federal Share 64,575 64,575 153,247 217,822 -62,817 155,005 55,789 210,794
Non-Federal Share 91,796 91,796 -10,623 81,172 -30,720 50,452 20,625 71,077
Total Variance 156,371 156,371 142,624 298,994 -93,537 205,457 76,414 281,871
Q8 Total Q8 Total
Baseline Cost Plan
Federal Share 323,403 2,262,313 323,402 2,585,715
Non-Federal Share 80,835 565,845 80,834 646,679
Total Planned 404,238 2,828,158 404,236 3,232,394
Actual Incurred Cost
Federal Share 1,728,116 1,728,116
Non-Federal Share 413,933 413,933
Total Incurred Costs 0 2,142,049 0 2,142,049
Variance
Federal Share 0 534,197 0 857,599
Non-Federal Share 0 151,912 0 232,746
Total Variance 0 686,109 0 1,090,345
Baseline Reporting Quarter
Yr. 2
Q5 Q6
10/1/10 - 12/31/10 1/1/11 - 3/31/11
Q2 Q3 Q4Baseline Reporting Quarter
7/1/09 - 12/31/09 1/1/10 - 3/31/10 4/1/10 - 6/30/10 7/1/10 - 9/30/10
Yr. 1
Q1
23
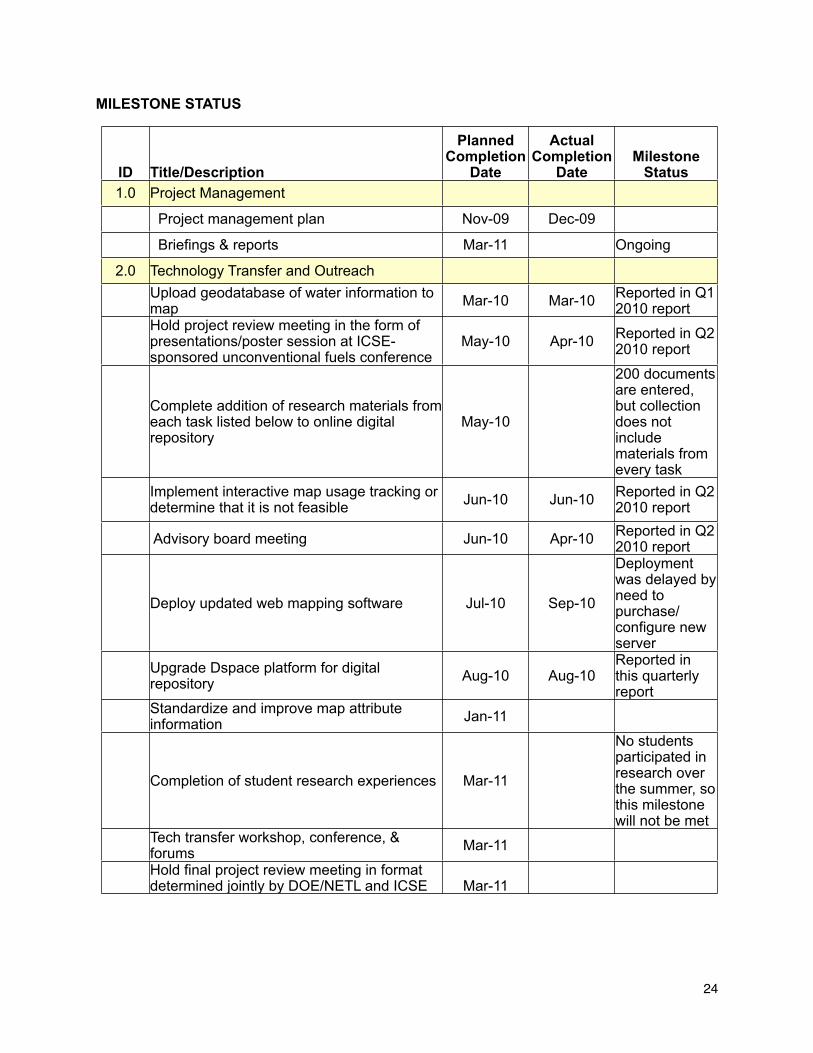
MILESTONE STATUS
ID Title/Description
Planned Completion
Date
Actual Completion
DateMilestone
Status1.0 Project Management
Project management plan Nov-09 Dec-09
Briefings & reports Mar-11 Ongoing
2.0 Technology Transfer and Outreach
Upload geodatabase of water information to map Mar-10 Mar-10 Reported in Q1
2010 report
Hold project review meeting in the form of presentations/poster session at ICSE-sponsored unconventional fuels conference
May-10 Apr-10 Reported in Q2 2010 report
Complete addition of research materials from each task listed below to online digital repository
May-10
200 documents are entered, but collection does not include materials from every task
Implement interactive map usage tracking or determine that it is not feasible Jun-10 Jun-10 Reported in Q2
2010 report
Advisory board meeting Jun-10 Apr-10 Reported in Q2 2010 report
Deploy updated web mapping software Jul-10 Sep-10
Deployment was delayed by need to purchase/configure new server
Upgrade Dspace platform for digital repository Aug-10 Aug-10
Reported in this quarterly report
Standardize and improve map attribute information Jan-11
Completion of student research experiences Mar-11
No students participated in research over the summer, so this milestone will not be met
Tech transfer workshop, conference, & forums Mar-11
Hold final project review meeting in format determined jointly by DOE/NETL and ICSE Mar-11
24
ID Title/Description
Planned Completion
Date
Actual Completion
DateMilestone
Status
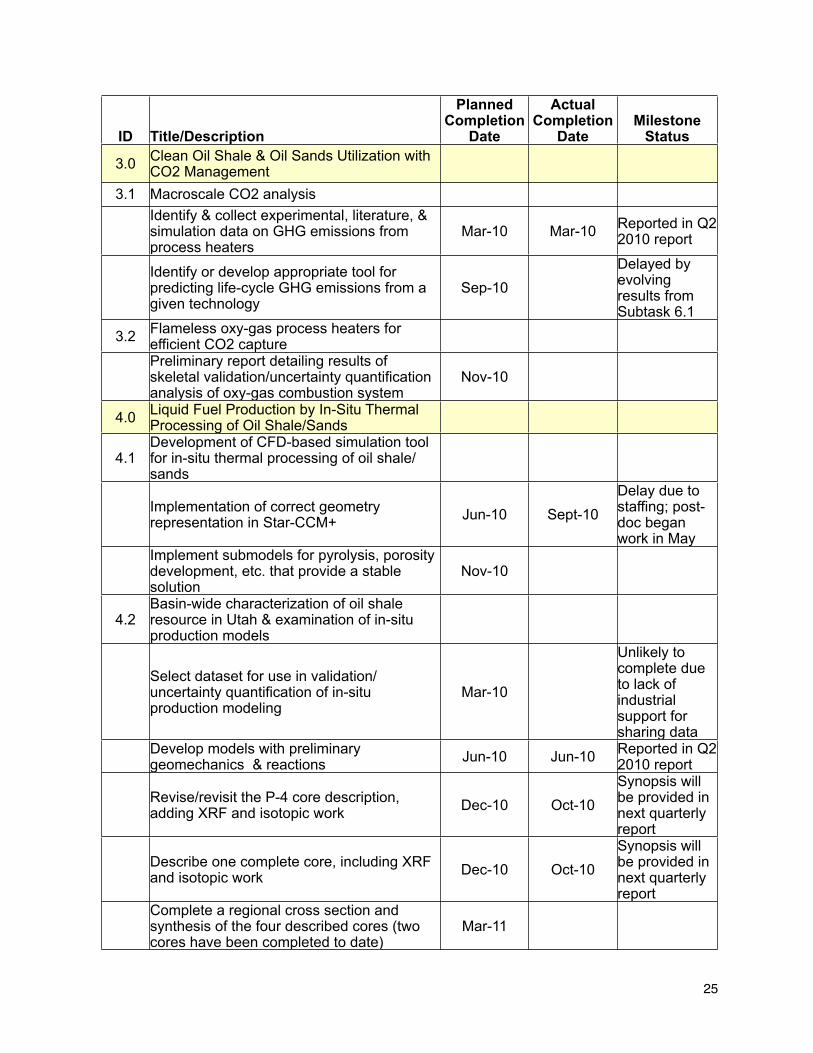
3.0 Clean Oil Shale & Oil Sands Utilization with CO2 Management
3.1 Macroscale CO2 analysis
Identify & collect experimental, literature, & simulation data on GHG emissions from process heaters
Mar-10 Mar-10 Reported in Q2 2010 report
Identify or develop appropriate tool for predicting life-cycle GHG emissions from a given technology
Sep-10 Delayed by evolving results from Subtask 6.1
3.2 Flameless oxy-gas process heaters for efficient CO2 capture
Preliminary report detailing results of skeletal validation/uncertainty quantification analysis of oxy-gas combustion system
Nov-10
4.0 Liquid Fuel Production by In-Situ Thermal Processing of Oil Shale/Sands
4.1Development of CFD-based simulation tool for in-situ thermal processing of oil shale/sands
Implementation of correct geometry representation in Star-CCM+ Jun-10 Sept-10
Delay due to staffing; post-doc began work in May
Implement submodels for pyrolysis, porosity development, etc. that provide a stable solution
Nov-10
4.2Basin-wide characterization of oil shale resource in Utah & examination of in-situ production models
Select dataset for use in validation/uncertainty quantification of in-situ production modeling
Mar-10
Unlikely to complete due to lack of industrial support for sharing data
Develop models with preliminary geomechanics & reactions Jun-10 Jun-10 Reported in Q2
2010 report
Revise/revisit the P-4 core description, adding XRF and isotopic work Dec-10 Oct-10
Synopsis will be provided in next quarterly report
Describe one complete core, including XRF and isotopic work Dec-10 Oct-10
Synopsis will be provided in next quarterly report
Complete a regional cross section and synthesis of the four described cores (two cores have been completed to date)
Mar-11
25

ID Title/Description
Planned Completion
Date
Actual Completion
DateMilestone
Status
4.3 Multiscale thermal processing (pyrolysis) of oil shale
Complete pyrolysis experiments at two different scales Feb-10 Mar-10 Reported in Q1
2010 report
Complete mass balances for oil/gas/coke at different scales Apr-10 Apr-10
Analysis to be provided in next quarterly report
Develop preliminary kinetic model for oil shale pyrolysis Jun-10 Sep-10
Reported in Q2 2010 report & in paper manuscript
Develop compositional representation of shale oils Sep-10
Analysis to be provided in next quarterly report
Design experiments for performing pyrolysis under stress Nov-10
4.4 Effect of oil shale processing on water compositions
Complete preliminary analysis of process water, including some tables of aqueous phase organic species concentrations
Nov-10 Negotiating analyses type & cost with Datachem
Determine compositional impact on reservoir scale of soluble pyrolysis products Dec-10
4.5 Pore scale analysis of oil shale/sands pyrolysis
Perform XMT/XNT analysis of samples of pyrolysis products at different temperatures Jun-10 Jun-10
Model pore network structure at different heating rates to determine porosity changes Sep-10
Delayed because samples not received from Subtask 4.3
Use multiphase LB model to analyze fluid penetration into porous samples & to provide transport information such as connectivity, conductivity, & permeability
Dec-10
4.6 Kerogen/asphaltene/mineral matrix: structure & interactions
Develop 3D models of kerogen & asphaltenes based on existing 2D models Mar-10 Mar-10 Reported in Q1
2010 report
26
ID Title/Description
Planned Completion
Date
Actual Completion
DateMilestone
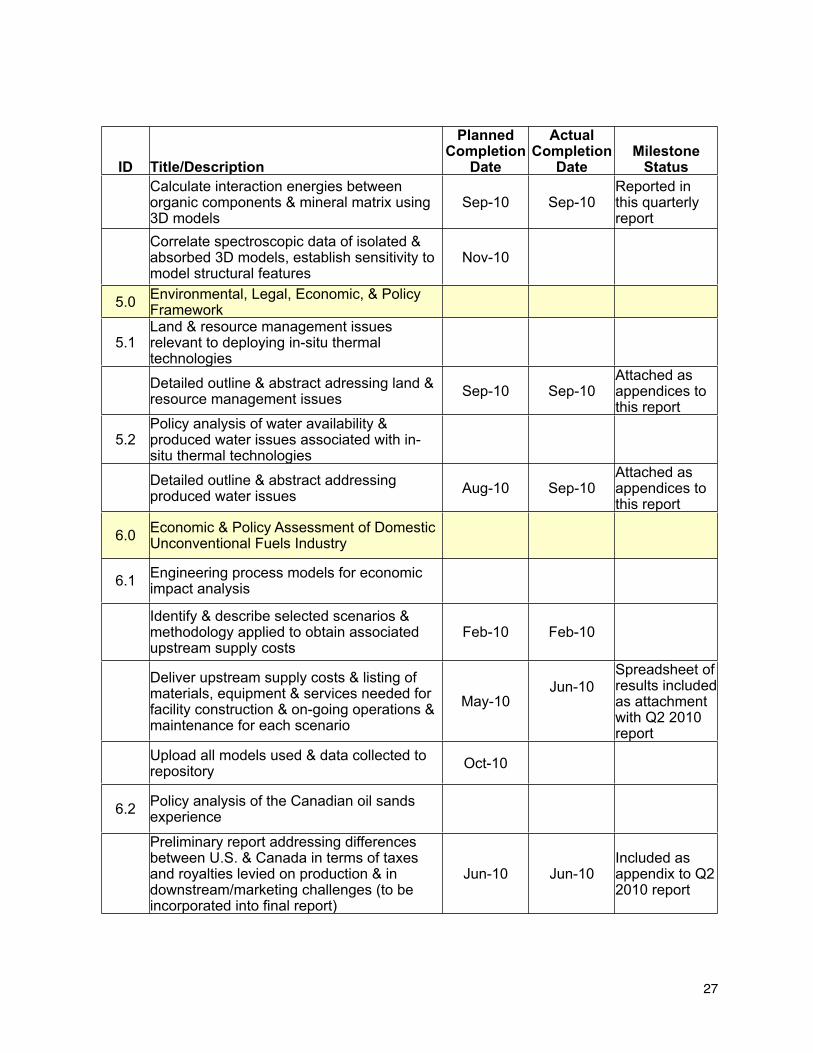
StatusCalculate interaction energies between organic components & mineral matrix using 3D models
Sep-10 Sep-10Reported in this quarterly report
Correlate spectroscopic data of isolated & absorbed 3D models, establish sensitivity to model structural features
Nov-10
5.0 Environmental, Legal, Economic, & Policy Framework
5.1Land & resource management issues relevant to deploying in-situ thermal technologies
Detailed outline & abstract adressing land & resource management issues Sep-10 Sep-10
Attached as appendices to this report
5.2Policy analysis of water availability & produced water issues associated with in-situ thermal technologies
Detailed outline & abstract addressing produced water issues Aug-10 Sep-10
Attached as appendices to this report
6.0 Economic & Policy Assessment of Domestic Unconventional Fuels Industry
6.1 Engineering process models for economic impact analysis
Identify & describe selected scenarios & methodology applied to obtain associated upstream supply costs
Feb-10 Feb-10
Deliver upstream supply costs & listing of materials, equipment & services needed for facility construction & on-going operations & maintenance for each scenario
May-10Jun-10
Spreadsheet of results included as attachment with Q2 2010 report
Upload all models used & data collected to repository Oct-10
6.2 Policy analysis of the Canadian oil sands experience
Preliminary report addressing differences between U.S. & Canada in terms of taxes and royalties levied on production & in downstream/marketing challenges (to be incorporated into final report)
Jun-10 Jun-10Included as appendix to Q2 2010 report
27

ID Title/Description
Planned Completion
Date
Actual Completion
DateMilestone
Status
6.3 Market assessment report
Identify & describe criteria used to select scenarios for further study Dec-09 Dec-09
Included as appendix to Q4 2009 report
Identify & describe methodology applied to assess impact of downstream market conditions on potential revenue of upstream scenarios
Feb-10 Feb-10 Reported in Q1 2010 report
Describe methodology & preliminary results of supply cost analysis for one scenario, including effect of system shocks or input variability
Apr-10 Dec-10
Will be released with rest of draft Market Assessment
Deliver assessment of impacts to revenue corresponding to each scenario May-10 Jun-10
Included as appendix to Q2 2010 report
Preliminary report summarizing first three sections of Market Assessment (role of unconventional fuels in current energy climate; role of policy & government, role of externalities & public perception
Sept-10 Dec-10
Will be released with rest of draft Market Assessment
NOTEWORTHY ACCOMPLISHMENTS
For Subtask 4.5, anisotropic features of oil shale permeability have been quantified and may be the first reported 3-D imaging of pyrolyzed oil shale by high resolution X-ray Micro CT (HRXMT) and Nano-CT.
PROBLEMS OR DELAYS
For Subtask 3.1, the milestone to identify or develop appropriate tool for predicting life-cycle GHG emissions from a given technology was delayed by evolving results from Subtask 6.1 for both air- and oxy-fired upgrading scenarios. Team members anticipate completing this milestone by January 2010.
The Subtask 4.3 has been delayed in providing an analysis for two milestones due to the sudden death of a key team member’s parent. Analysis related to oil/gas/coke mass balances and a compositional representation of shale oil will be provided in next quarter’s report.
For Subtask 4.5, the milestone to model pore network structure at different heating rates to determine porosity changes was delayed because researchers did not receive the requisite samples from Subtask 4.3. The PI for Subtask 4.3 has assured the Project Team that appropriate samples will be provided for their analysis. The anticipated completion date for this milestone is December 2010.
28
The Subtask 4.6 Project Team is still holding the manuscript from last year entitled “Three-Dimensional Structure of the Siskin Green River Oil Shale Kerogen Model: A Computational Study” by Pimienta, Orendt, Pugmire, Facelli, Locke, Winans, Chapman and Chupas until team members can get experimental atomic pairwise distribution function measurements on a kerogen sample isolated from a section of the Uinta Basin oil shale core sample that ICSE obtained in May 2010. This experimental data will be used to evaluate the 3-D kerogen structure based on the Siskin model (Siskin et al., 2006) obtained from previous computational efforts for this task. In addition, one post-doctoral researcher, Dr. Ian Pimienta, left the project for a permanent faculty position and a new post-doctoral researcher, Dr. Shyam Badu, joined the project. There was a gap of several weeks between the two that led to a slight delay in getting the additional calculations completed in time for this report.
The draft version of the Market Assessment report has been delayed, which includes two Subtask 6.3 milestones: (1) description of methodology & preliminary results of supply cost analysis for one scenario and (2) preliminary report summarizing first three sections of the Market Assessment. This delay occurred because of some inconsistencies in the supply cost analysis for several of the scenarios. The Project Team has been working hard to correct these problems and anticipated a release of the draft report by the end of the next quarter.
RECENT AND UPCOMING PRESENTATIONS/PUBLICATIONS
K. E. Kelly, A. F. Sarofim, and D. W. Pershing, “Opportunities for reducing CO2 emissions from conventional and unconventional fuels using oxyfiring: A life-cycle perspective,” AFRC International Pacific Rim Combustion Symposium, Maui, HI, September 26-29, 2010.
C. L. Lin, J. D. Miller, C. H. Hsieh, P. Tiwari and M. D. Deo, “Pore scale analysis of oil shale pyrolysis by X-ray CT and LB simulation,” submitted for publication in the Proceedings of the 6th World Congress on Industrial Process Tomography, Beijing, China, September 2010.
J. H. Bauman and M. D. Deo, “Simulation of a rubblized oil shale surface pyrolysis process,” 30th Oil Shale Symposium, Colorado School of Mines, Golden, CO, October 18-20, 2010.
J. H. Bauman, P. Mandalaparty, P. Tiwari, and M. D. Deo, “A low CO2 hybrid in situ oil shale liquid production process,” 30th Oil Shale Symposium, Colorado School of Mines, Golden, CO, October 18-20, 2010.
L. Birgenheier and M. Vanden Berg, “Detailed geologic characterization of the Upper Green River Formation, Uinta Basin, UT,” 30th Oil Shale Symposium, Colorado School of Mines, Golden, CO, October 18-20, 2010.
P. Tiwari and M. D. Deo, “The effect of pressure on oil shale thermal treatment,” 30th Oil Shale Symposium, Colorado School of Mines, Golden, CO, October 18-20, 2010.
J. H. Bauman and M. D. Deo, “Relationship between kinetic and flow parameter representations in complex in situ reactive processes,” AICHE Annual Meeting, Salt Lake City, UT, November 7-12, 2010.
K. E. Kelly, T. Ring, J. Wilkey, B. Castro, A.F. Sarofim, and D.W. Pershing, “Opportunities for oxyfiring to reduce upstream life-cycle greenhouse gas emissions from transportation fuels,” AIChE Annual Meeting, Salt Lake City, UT, November 7-12, 2010.
B. Isaac, M. Hradisky, P. Smith, “Development of CFD-based simulation tools for in-situ thermal processing of oil shale/sands,” AICHE Annual Meeting, Salt Lake City, UT, November 7-12, 2010.
29

C. L. Lin, J. D. Miller, and C. H. Hsieh. “Flow simulation with the Lattice Boltzmann method in 3D porous structures of pyrolyzed oil shale cores using multiscale X-Ray CT imaging,” AICHE Annual Meeting, Salt Lake City, UT, November 7-12, 2010.
P. Tiwari and M. Deo, “Thermal gravimetric – mass spectrometry analysis of oil shale,” AICHE Annual Meeting, Salt Lake City, UT, November 7-12, 2010.
C. L. Lin, A. R. Videla and J. D. Miller, “Advanced 3D multiphase flow simulation in porous media reconstructed from X-ray micro tomography using the He-Chen-Zhang Lattice Boltzmann model,” Flow Measurement and Instrumentation, in press.
P. Tiwari & M. Deo, “Detailed kinetic analysis of oil shale pyrolysis TGA data.” Manuscript submitted for review to AIChE Journal.
J. H. Bauman and M. D. Deo, “Parameter space reduction and sensitivity analysis in complex thermal subsurface production processes.” Manuscript submitted for review to Energy and Fuels.
I. S. O. Pimienta, A. M. Orendt, J. C. Facelli, and R. J. Pugmire, ”Ab initio calculation and molecular dynamics simulation of asphaltenes.” Anticipated submission to a journal in November 2010.
I. S. O. Pimienta, A. M. Orendt, R. J. Pugmire, J. C. Facelli , D. R. Locke, R. E. Winans, K. W. Chapman, and P. J. Chupas, “Three-dimensional structure of the Siskin Green River oil shale kerogen model: A computational study.” Publication of manuscript has been delayed pending acquisition of experimental data.
REFERENCES
Allam, R., White, V., Ivens, N., & Simmonds, M. (2005). The oxyfuel baseline: Revamping heaters and boilers to oxyfiring by cryogenic air separation and flue gas recycle. In C.F. Gilboy (Ed), Greenhouse Gas Control Technologies, Volume I (Chapter 26). Location: Elsevier.
ANL. (2009). The greenhouse gases, regulated emissions, and energy use in transportation (GREET) model, version 1.8c0. Retrieved from http://www.transportation.anl.gov/modeling_simulation/GREET/index.html.
Beysel, G. (2009). Enhanced cyrogenic air separation: A proven technology applied to oxyfuel. First Oxyfuel Combustion Conference, Cottbus, Germany, September 8, 2009.
Coraggio, G. & Laiola, M. (2009). Combustion of NG and pulverized coal in a mixture of oxygen and RFG (IFRF. Doc. No F110/y/01). Pisa, Italy: International Flame Research Foundation.
Siskin, M., Kelemen, S. R., Eppig, C. P., Brown, L. D., & Afeworki, M. (2006). Asphaltene molecular structure and chemical influences on the morphology of coke produced in delayed coking, Energy & Fuels, 20, 1227-1234.
USGS Oil Shale Assessment Team. (2010). Oil Shale resources of the Uinta Basin, Utah and Colorado (DDS–69–BB). Denver, CO: U.S. Geological Survey.
30

APPENDIX A. Outline for Subtask 5.1 Topical Report
1. Introduction 1.1. Why We Should Care About Oil Shale and Oil Sands 1.2. The Problem and Advantage of Nascent Industries 1.2.1. The Problem of Nascent Industries 1.2.2. The Advantage of Nascent Industries 1.3. A Reasonable Path Forward2. Land & Resource Ownership 2.1. Background & Historical Perspective 2.2. Split Estates 2.2.1. Conflicts Between Competing Estates 2.2.2. Federal Split Estate Management 2.2.3. State Split Estate Management 2.3. Oil Shale Ownership and Control 2.4. Oil Sands Ownership and Control3. Land Planning, Regulation, Management Objectives, & Access to Resources 3.1. Federal Public Land Regulation 3.1.1. Federal Public Land Planning 3.1.2. State Regulation of Energy Development on Federal Public Lands 3.1.3. Federal Oil Shale and Oil Sands Leasing Laws & Regulations 3.1.3.1. Oil Shale 3.1.3.2. Oil Sands 3.1.3.3. Oil Shale Related Litigation 3.1.3.4. Development Update 3.2. State Oil Shale and Oil Sands Regulation 3.2.1. Utah State Lands 3.2.2. Development of Oil Shale and Oil Sands on Non-Federal Lands 3.3. “Indian Country” & Regulation of Indian Lands 3.3.1. Defining “Indian Country” 3.3.2. Tribal Jurisdiction 3.3.3. State Jurisdiction 3.3.4. The Leasing Process in Indian Country 3.3.5. Environmental Regulation 3.3.6. Implications 3.4. Access to Oil Shale and Oil Sands Resources 3.4.1. Accessing Resources Landlocked by Federal Lands 3.4.2. Accessing Other Landlocked Resources 3.4.3. Seep Ridge Road 3.5. Competing Mineral Interests 3.6. Implications4. Land & Resource Consolidation and Reallocation 4.1. Land Exchanges 4.2. Logical Mining Units and Unitization 4.3. Utah Legislation Impacting Resource Access 4.3.1. Background 4.3.2. Ownership & Control of Public Lands 4.3.3. Obligations to Dispose of Federal Public Lands 4.3.4. Eminent Domain of Federal Public Lands 4.3.5. Enclave Clause Claims 4.4. The Limits of the Federal Government’s Power of Condemnation 4.5. Federal Legislation Impacting Resource Access 4.6. The Rebirth of Ecosystem Management5. Conclusion and Recommendations
31
APPENDIX B. Abstract for Subtask 5.1 Topical Report
Utah is home to oil shale resources containing roughly 1.3 trillion barrels of oil equivalent and our nation’s richest oil sands resources. If environmentally responsible means of tapping these resources can be developed, these resources could provide a safe and stable domestic energy source for decades to come. In Utah, oil shale and oil sands resources underlay a patchwork of federal, state, private, and tribal lands that are subject to a complex network of regulation and conflicting management objectives. Evaluating the development potential of Utah’s oil shale and oil sands resources requires an understanding of jurisdictional issues and the challenges they present to deployment and efficient utilization of emerging technologies. The jurisdictional patchwork and divergent management requirements inhibit efficient, economic, and environmentally responsible development. This report examines these barriers to resource development, methods of obtaining access to landlocked resources, and options for consolidating resource ownership.
Recent efforts to wrest control of western public lands from the federal government could dramatically reshape resource control and access, though these efforts appear to fall far short of their stated goals. Federal land exchanges represent a more efficient and mutually beneficial means of consolidating management control and improving management efficiency.
32

APPENDIX C. Outline for Subtask 5.2 Topical Report
I. Introduction – (Why the Oil Shale / Sands Industries Should Pay Attention to Produced Water)
II. Produced Water and It’s Role in Commercial Oil Shale / Sands DevelopmentA. Produced Water Defined B. Produced Water as a Source of Supply
1.Water Needs for Oil Shale / Sands Development2.Conventional Water Availability 3.Water Potentially Available from Oil, Gas, and Coalbed Methane
Development in Utaha. Volumeb. Quality
4.Amount of Water Potentially Available From Oil Shale / Sands Development
C. Oil Shale and Oil Sands Produced Water Disposal1.Amount of Water Requiring Disposal2.Disposal Methods
a. Surface Disposal[Evaporation, infiltration, discharge to surface waters, beneficial use]
b. Underground Injection[Deep injection, shallow injection]
3.Disposal CapacityD. Hydraulic Fracturing
1.In Oil, Gas, and CBM Production 2.In Oil Shale / Sands Production
III. CBM Produced Water RegulationA. Background
[regulated as a waste product][regulation changed with CBM in the PRB]
B. Production Regulation1.Appropriation and Beneficial Use
a. When does Beneficial Use Occur - Withdrawal or Discharge? [Compare: Colorado, Montana, New Mexico, Utah, Wyoming]
b. Secondary Beneficial UseC. Discharge Regulation
1.Federal / State / Tribal Jurisdiction2.Surface Disposal
a. Evaporation b. Infiltrationc. Discharge to Surface Waters d. Beneficial Use
3.Underground Injectiona. Deep Injection b. Shallow Injection and Aquifer Recharge
D. Hydraulic Fracturing1.Pending Federal Legislation2.Pending State Legislation
[Compare: Colorado, Montana, New Mexico, Utah, Wyoming] IV. Utah Water Law and Oil Shale and Oil Sands Produced Water Regulation
A. Production Regulation1.Beneficial Use Requirements
a. When does it Occur - Withdrawal or Discharge?
33

b. Secondary Beneficial UseB. Disposal Regulation
1.Surface Disposala. Evaporationb. Infiltration c. Discharge to Surface Waters d. [Treatment and] Beneficial Use
2.Underground Injectiona. Deep Injection b. Shallow Injection and Aquifer Recharge
C. Hydraulic Fracturing RegulationV. Conclusion and Recommendations
34
APPENDIX D. Abstract for Subtask 5.2 Topical Report
Commercial-scale oil shale or oil sands development will require water; the amount of water depends on the technologies adopted and scale of development that occurs. Water in oil shale and oil sands country is already in scarce supply, and the State of Utah normally does not issue new water rights in oil shale or oil sands-rich areas. Prospective oil shale and oil sands developers can acquire water rights from willing sellers, but large and secure water supplies are hard to find and expensive to acquire, driving oil shale and oil sands developers to seek alternative sources of supply. Produced water is one such potential source of supply.
When oil and gas are developed, operators often encounter groundwater that must be removed and disposed of to facilitate hydrocarbon extraction. Water produced through mineral extraction was traditionally poor in quality and treated as a waste product rather than a valuable resource. The increase in produced water volume and the often-higher quality water associated with coalbed methane development have drawn attention to potential uses of produced water and its treatment under appropriations law. Growing interest in produced water has lead to litigation and statutory changes that must be understood and evaluated if produced water is to be harnessed. Conversely, if water is generated as a byproduct of oil shale or oil sands production, consideration must be given to how this water will be disposed of. This report explores the role produced water could play in commercial in commercial oil shale or oil sands production, explaining the evolving regulatory framework associated with produced water, Utah water law and produced water regulation, and the obstacles that must be overcome if produced water is to play a major role in support of the nascent oil shale and oil sands industries.
35

APPENDIX B. Agenda for University of Utah Unconventional Fuels Conference
36
National Energy Technology Laboratory 626 Cochrans Mill Road P.O. Box 10940 Pittsburgh, PA 15236-0940 3610 Collins Ferry Road P.O. Box 880 Morgantown, WV 26507-0880 One West Third Street, Suite 1400 Tulsa, OK 74103-3519 1450 Queen Avenue SW Albany, OR 97321-2198 2175 University Ave. South Suite 201 Fairbanks, AK 99709 Visit the NETL website at: www.netl.doe.gov Customer Service: 1-800-553-7681