oil & natural gas technology library/research/oil-gas/methane... · service by trade name, ......
TRANSCRIPT

Oil & Natural Gas Technology
DOE Award No.: DE-NT0006553
Progress Report Second Half 2011
ConocoPhillips Gas Hydrate
Production Test
Submitted by: ConocoPhillips 700 G Street
Anchorage, AK 99501 Principal Investigator: David Schoderbek
Prepared for:
United States Department of Energy National Energy Technology Laboratory
January 31, 2012
Office of Fossil Energy

2
Disclaimer This report was prepared as an account of work sponsored by an agency of the United States Government. Neither the United States Government nor any agency thereof, nor their employees, makes any warranty, express or implied, or assumes any legal liability or responsibility for the accuracy, completeness, or usefulness of any information, apparatus, product, or process disclosed, or represents that its use would not infringe privately owned rights. Reference herein to any specific commercial product, process, or service by trade name, trademark, manufacturer, or otherwise does not necessarily constitute or imply its endorsement, recommendation, or favoring by the United States Government or any agency thereof. The view and opinions expressed herein do not necessarily state of reflect those of the United States Government or any agency thereof.
Executive Summary Accomplishments
• Continuation Application submitted by COP and approved by NETL/DOE • Final Well Design and draft Test Design completed and reviewed by NETL/DOE • Completed design, fabrication, and testing of injection and measurement systems • Ice pad construction completed for Winter 2012 activities
Current Status
• Continuing laboratory experimental program. • Continuing reservoir simulator development • Executing 2012 exchange fieldtrial
Introduction Work began on the ConocoPhillips Gas Hydrates Production Test (DE-NT0006553) on October 1, 2008. This report is the ninth progress report for the project and summarizes project activities from July 1, 2011 to December 31, 2011. The most significant milestones in this period were design of the injection/flowback/drawdown test and design and construction of injection, artificial lift, and measurement systems. Another major milestone was approval of Continuation Application to close Phase 3A and enter Phase 3B. Iġnik Sikumi #1 was drilled and completed in early 2011, with perforation, injection, flowback, and depressurization to be conducted in 2012. Ice pad construction for winter 2012 operations was completed December 20, 2011. Laboratory Experimental Summary
Laboratory experimental results are detailed in Appendix 1. Experiments in Q3/Q4’11 were designed to continue development of injection strategies to minimize the impact of high excess/free-water saturations in hydrate-bearing sands. While these experiments confirmed the experimental difficulty of establishing two-phase, high initial hydrate saturation in a sand pack prior to injection, they also demonstrated that nitrogen gas was successful, both as a pre-flush to displace mobile water and during a test to remove blockages. In addition to displacement of water from the sand pack, N2 caused some

3
hydrate dissociation, creating flow pathways. Q3/Q4 experiments also evaluated CO2/N2 mixtures to deliver CO2 as a gas rather than as a liquid. Recent results support earlier conclusions, indicating that CO2 exchange is not affected by the reduction in absolute concentration, but rather that exchange remains efficient and fast under gas-phase CO2 conditions. Laboratory experimental results are detailed in Appendix 1. Reservoir Simulator Development and Numerical Modeling To design the injection/flowback test it is necessary to understand phase behavior of the reservoir system during each planned stage of the test, i.e., N2-preflush, CO2-N2 injection, and flow back. An appropriate simulator must be able to correctly capture phase behavior of mixtures of gases (N2, CO2, CH4) and their respective gas- hydrates. Unfortunately there is no commercially available gas-hydrate simulator that can simulate these phase behaviors. Development of an adequate in-house mixed-gas-and-hydrate reservoir simulator was estimated to take more than a year, so a decision was made to instead develop a simplified gas-hydrate model focusing on prediction of the system phase behavior during each stage of the test. Results of in-house simulator development and predictions generated by isothermal and adiabatic cell-to-cell models can be found in Appendix 2. Project Management, Test/Equipment Design, and Construction ConocoPhillips provided project management as well as oversight of Schlumberger, Expro, and Pinnacle/Halliburton equipment design, construction, commissioning, and shipping. In-house project management activities included permitting, scheduling, drafting, procurement, hazard reviews, and coordination with Prudhoe Bay Unit operator, BP Exploration Alaska, Inc (BPXA). ConocoPhillips also developed field test protocols and procedures, as well as artificial lift, downhole equipment, and oriented perforating programs. Details of project management, test and equipment design, and construction are detailed in Appendix 3. Task 5 (Phase 2): Detailed Well Planning/Engineering: COMPLETED Detailed well planning and engineering transitioned from “preliminary” to “final” with DOE approval of Phase 3B. In early November, ConocoPhillips submitted draft Continuation Application materials to DOE, supporting proposed transition from Phase 3A (Field Test Well Drilling, Logging, and Completion) to Phase 3B (Production Testing). Continuation Application was approved by DOE and Contract Modification 15 was acknowledged by ConocoPhillips on December 19, 2011. Task 6 (Phase 2) through Task 12 (Phase 3A): COMPLETED See DOE “Progress Report, First Half 2011” for details.

4
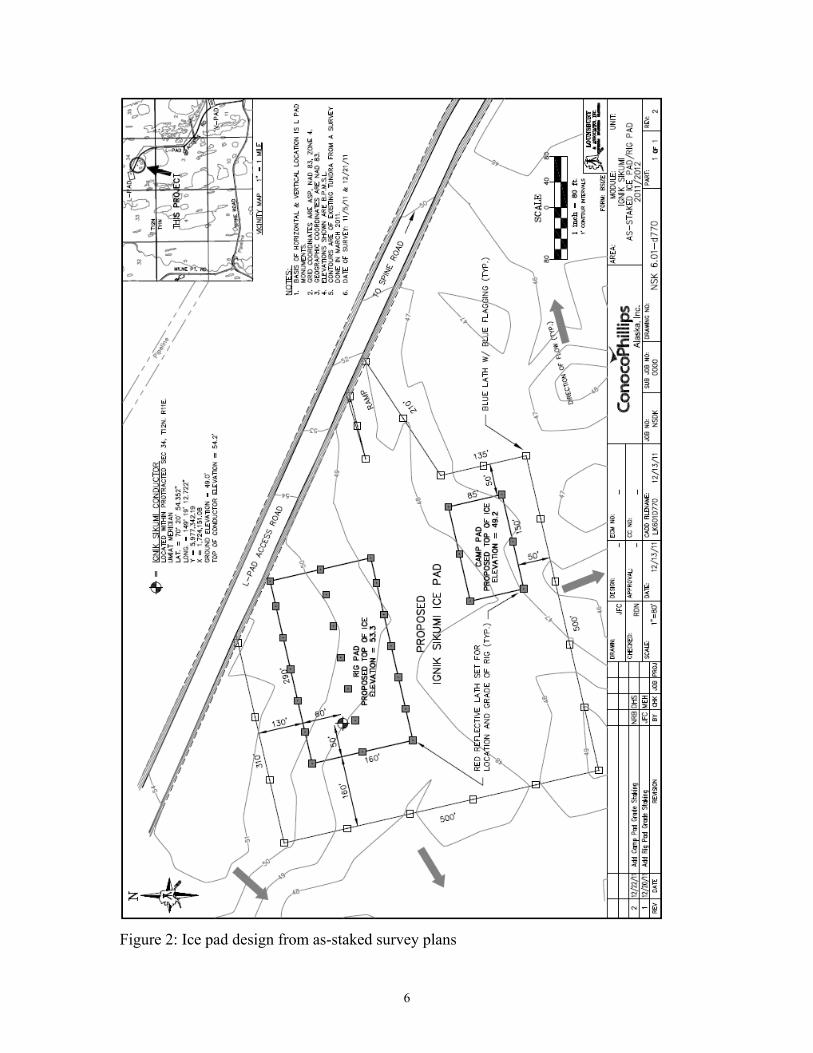
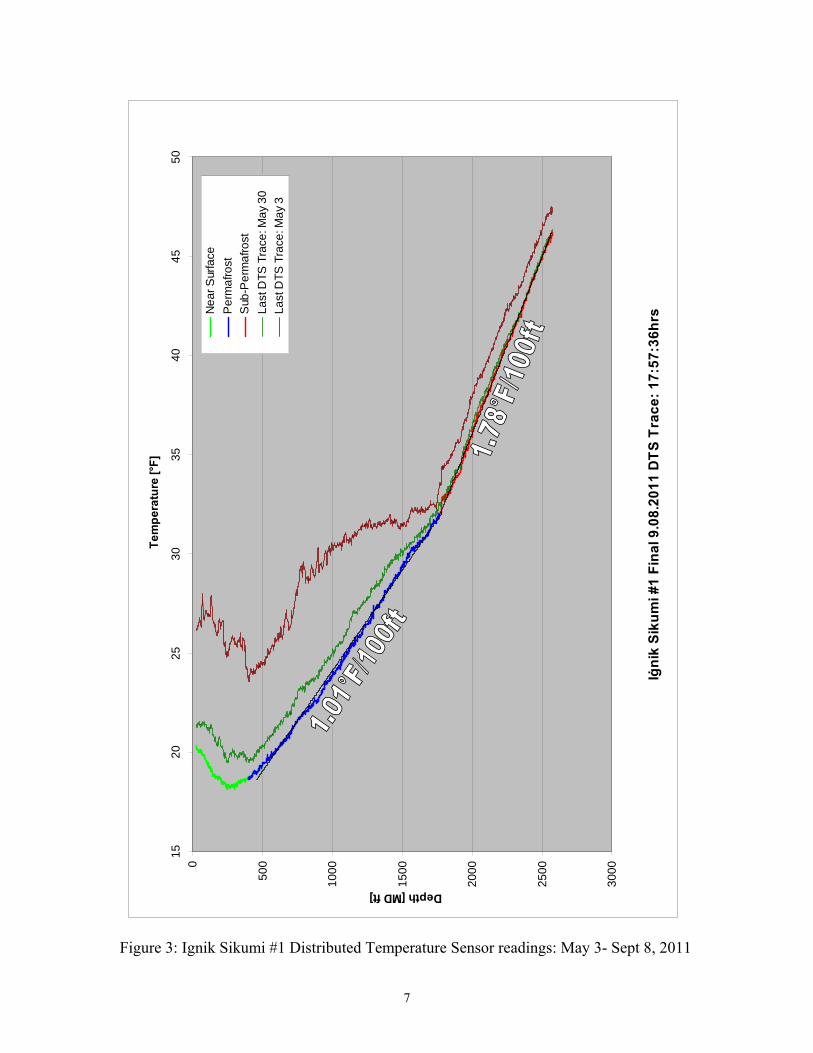
Task 13 (Phase 3B): Update of Production Test Plan: UNDERWAY Updating of the Production Test Plan is underway, and has matured in parallel with in-house reservoir simulator development. Updated Basis of Design (Figure 1) summarizes planned temperature, pressure, and liquid/gas rate ranges for the five-step production test plan developed in Q3/Q4’11. Reservoir conditions measured in 2011 are also summarized in Figure 1: Treservoir ~41°F, Preservoir ~1100psi, Pbreakdown ~1400psi. Basis of design was updated to ensure field equipment design was sufficient to accommodate reservoir and wellbore conditions expected during the test. Injection pressure is designed not to exceed formation breakdown pressure. Safety factors have been chosen to maintain injection temperatures above 32°F (freezing point of fresh water) and below 50°F (hydrate dissociation temperature). Model results (see Appendix 2) indicate that injection of 100% nitrogen, initially planned to physically displace free water near the wellbore, will lead to hydrate dissociation and may cause temperatures to drop below 32°F. Consequently, the injection of 100% may be eliminated. Isothermal and adiabatic cell-to-cell modeling is ongoing to determine the injection volume and optimal mixture of nitrogen and carbon dioxide to minimize both near-wellbore hydrate dissociation and secondary CO2-hydrate formation in the reservoir. Following injection of CO2/N2 gas mixture, two-stage drawdown is currently planned. Initial drawdown pressure is will proceed from ~1400psi (elevated reservoir pressure after injection) to ~750psi and remain above gas hydrate stability pressure (PGHS). Subsequent depressurization below PGHS expected to dissociate near-wellbore hydrate, including CH4-hydrate, secondary CO2-hydrate, and mixed CO2/CH4-hydrate. Artificial lift has been designed to accommodate water rates up to 400bwpd. Task 14 (Phase 3B): Establishment of Site Infrastructure: UNDERWAY Establishment of site infrastructure is underway at the end of Q4’11. Ice pad construction started December 11, based on staked design (Figure 2). Ice pad construction was completed December 20, utilizing 1,259,370 gallons of water and 603,271 gallons of ice. Camp modules arrived on site before year-end, and their assembly is underway. Fiber-optic Distributed Temperature Sensor (DTS) cable and permanent downhole pressure-temperature gauges have been monitored twice since Iġnik Sikumi #1 was temporarily suspended May 3, 2011. DTS data, showing gradual thermal recovery of wellbore to ambient reservoir conditions is shown in Figure 3.

5
Figure 1: Basis of Design matches equipment to expected reservoir/wellbore conditions
6
Figure 2: Ice pad design from as-staked survey plans
7
Figure 3: Ignik Sikumi #1 Distributed Temperature Sensor readings: May 3- Sept 8, 2011
Iġni
k Si
kum
i #1
Fina
l 9.0
8.20
11 D
TS T
race
: 17:
57:3
6hrs
0
500
1000
1500
2000
2500
3000
1520
2530
3540
4550
Tem
pera
ture
[°F]
Depth [MD ft]
Nea
r Sur
face
Per
maf
rost
Sub
-Per
maf
rost
Last
DTS
Tra
ce: M
ay 3
0La
st D
TS T
race
: May
3

8
Cost Status Expenses incurred during this period were below the Baseline Cost Plan as shown in Exhibit 1.
Exhibit 1: Cost Plan/Status Milestone Status The Milestone Status is shown in Exhibit 2 below.
Exhibit 2: Milestone Status

9
Appendix 1: Laboratory Experimental Results Prepared by James Howard and Keith Hester, ConocoPhillips (Bartlesville) Experimental Results The second half of 2011 saw a continuation of a series of experiments that were designed to evaluate several issues confronting the plans associated with the Alaska Field Test (Table 1-1). One of the most pressing concerns involved the challenge of adding a hydrate former (CO2) into hydrate-bearing sediments that contain excess water, which is the anticipated scenario at the field-test site. The experimental challenge was to create a two-phase hydrate-water system with high (~60%) initial hydrate saturation. Earlier efforts to form high initial hydrate saturated samples noted the very slow kinetics of formation, sometimes requiring several months to convert all/most of the water into hydrate. Given the abbreviated timeframe requirements of the field test, a second approach was tested where the hydrate was established in a system with intermediate amounts of water (~50%) and free gas, and then the remaining gas was displaced with a waterflood. The homogeneous nature of the sand pack, based on a narrow range of sand grain sizes used to build the pack, and the water-wet nature of the quartz grains encouraged the expectation that the water would efficiently displace the free gas in the pores. The excess water experiment also posed the challenge of developing suitable methods to minimize the formation of hydrate plugs in the small-diameter gas lines on upstream and downstream sides of the sand pack. A second set of experiments dealt with the operational issue of replacing liquid CO2 as the injectant with a CO2/N2 gas mixture. This issue evolved once it was determined that supplying liquid CO2 to the reservoir would be difficult, both in terms of the temperature of the liquid supplied at the well-site and the pressure due to the weight of the liquid column in the borehole. The CO2/N2 mixture falls in the gas region of the phase diagram, reducing the pressure due to the head in the borehole while retaining sufficient amounts of CO2 to affect the exchange with the hydrate. Table 1. List of Experiments Test ID Medium Sw Fluids Description
06_Sand pack_2
Sand 0.58 N2; CO2/N2;
Excess water, N2 pre-flush followed by CO2/N2
07_Sand pack Sand 0.52 N2; CO2/N2;
Excess water, N2 pre-flush followed by CO2/N2 repeat
08_Sand pack Sand 0.53 N2; CO2/N2;
Excess water, N2 pre-flush followed by CO2/N2 repeat. Heated wire added to front to minimize blockages
09_BentSand 09_Sand pack
Sand 1.00 N2; CO2/N2;
Imaging test on Bentheim. Start with dry sand, flood to full saturation. Form hydrate, N2 pre-flush, CO2/N2 exchange
The experiment 06_Sand pack_2 was designed to investigate the effectiveness of CO2 exchange when injected in a gaseous state along with the importance of a pre-flush stage that minimized the early formation of a CO2-hydrate that would accompany initial CO2

10
injection. Methane hydrate was formed in the standard sand pack configuration with an initial water saturation of 58%. The initial water saturation was homogenous as determined by the MRI imaging. Most of this water was converted to hydrate as determined by CH4 consumption volumes and the loss of MRI signal. Additional water was then injected into the system by means of a slow waterflood, 1.0 cm3/minute, until water breakthrough was observed. Blockages in the gas lines and in the end pieces of the core holder through the formation of new hydrate were mitigated by the use of a custom-designed heated wire system on the outlet end that raised the temperature at this point by several degrees. An initial effort to inject a CO2/N2 gas mixture (60/40 mole percent) was unsuccessful due to a blockage on the upstream end that was not managed by the heated wire for an extended period of time. In contrast, a flood of low-flow rate N2 injection re-established communication along the length of the sand pack and kept it open (Figure 1-1).
0
5
10
15
20
25
30
35
7/8 12:00 7/9 0:00 7/9 12:00 7/10 0:00 7/10 12:00 7/11 0:00 7/11 12:00
Time
CH
4 (M
ol %
)
0
10
20
30
40
50
60
70
80
90
100
N2 (
Mol
%)
N2 Breakthrough ‐ Communication Restored
CH4
N2
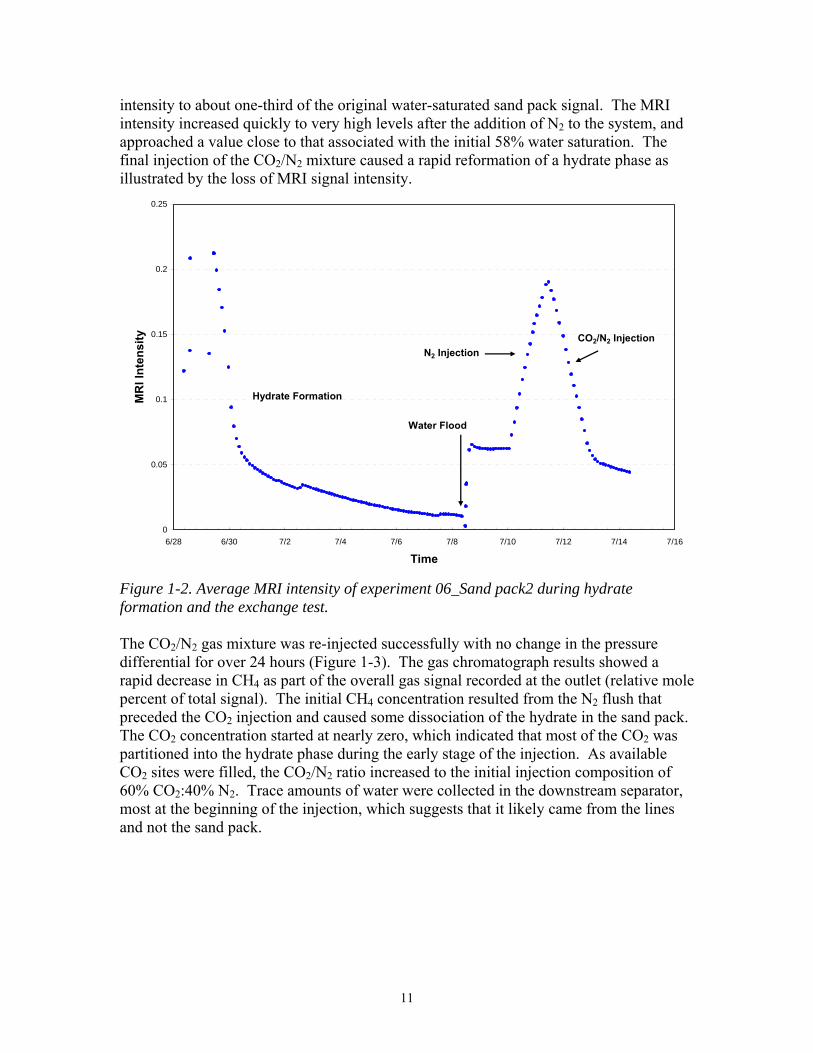
Figure 1-1. Methane production during initial nitrogen flow to establish pressure communication along length of core. Methane reads on right-hand scale; Nitrogen reads on left-hand scale. After a period of N2 injection, the gas chromatograph at the outlet/downstream end detected a significant increase in the CH4 that represented a breakthrough through the core. With time the CH4 concentration decreased from a high of 33% of the total gas flow to approximately 23% of the total gas. This methane represented gas released from hydrate dissociation that accompanied the N2 injection. The average MRI intensity of the sand pack during this stage showed a significant increase that accompanied the N2 injection (Figure 1-2). The initial hydrate formation reduced the MRI signal to near-zero after one week. The addition of water to the gas-filled pores increased the signal
11
intensity to about one-third of the original water-saturated sand pack signal. The MRI intensity increased quickly to very high levels after the addition of N2 to the system, and approached a value close to that associated with the initial 58% water saturation. The final injection of the CO2/N2 mixture caused a rapid reformation of a hydrate phase as illustrated by the loss of MRI signal intensity.
0
0.05
0.1
0.15
0.2
0.25
6/28 6/30 7/2 7/4 7/6 7/8 7/10 7/12 7/14 7/16
Time
MR
I Int
ensi
ty
Hydrate Formation
Water Flood
N2 InjectionCO2/N2 Injection
Figure 1-2. Average MRI intensity of experiment 06_Sand pack2 during hydrate formation and the exchange test. The CO2/N2 gas mixture was re-injected successfully with no change in the pressure differential for over 24 hours (Figure 1-3). The gas chromatograph results showed a rapid decrease in CH4 as part of the overall gas signal recorded at the outlet (relative mole percent of total signal). The initial CH4 concentration resulted from the N2 flush that preceded the CO2 injection and caused some dissociation of the hydrate in the sand pack. The CO2 concentration started at nearly zero, which indicated that most of the CO2 was partitioned into the hydrate phase during the early stage of the injection. As available CO2 sites were filled, the CO2/N2 ratio increased to the initial injection composition of 60% CO2:40% N2. Trace amounts of water were collected in the downstream separator, most at the beginning of the injection, which suggests that it likely came from the lines and not the sand pack.

12
0
10
20
30
40
50
60
70
80
90
7/11 4:48 7/11 7:12 7/11 9:36 7/11 12:00 7/11 14:24 7/11 16:48 7/11 19:12 7/11 21:36 7/12 0:00 7/12 2:24 7/12 4:48
Time
Mol
% N
2 and
CO
2
0
5
10
15
20
25
30
Mol
% C
H 4
N2CO2CH4
Initiate CO2/N2 Injection
Figure 1-3. Methane production during CO2 injection shows a rapid decrease in CH4 (right-hand scale) at the outlet end and a concomitant increase in the CO2/N2 ratio (left-hand scale)towards the original value of 0.6. MRI intensity was nearly constant during the CO2 injection, indicating that only a small amount of additional hydrate formed in the sand pack. MRI images showed non-uniform distribution of the original hydrate after the N2 pre-flush and before the CO2 injection (Figure 1-4). This was somewhat unexpected as the initial water saturation in the core was homogenous. This illustrated the heterogeneity of hydrate formation and accents the need for imaging to truly characterize the fluid and solid saturations in the core. The N2 created a hydrate-deficient zone along the upper edge of the sand pack and at the inlet end (left). The introduction of CO2 caused the reformation of hydrate, which was maintained during the injection.

13
Figure 1-4. Longitudinal MRI images of sand pack at various stages of experiment. N2 pre-flush (top) generated an uneven distribution of free water (warm colors). The introduction of CO2 (middle and bottom) reformed hydrate. The experiment 07_Sand pack was designed to duplicate the previous experiment of investigating methods to overcome problems associated with hydrate-bearing sediments that contain excess water in the pores. A uniform distribution of hydrate was formed in the sand pack that started with an initial water saturation of 52%. At this point the hydrate saturation was calculated to be 61%. Permeability to CH4 was measured by monitoring the pressure gradient across the sand pack at several flow rates. At this point the permeability was approximately 0.2 mD. Additional water was added to the system by injection at a rate of 1.0 cm3/min until water breakthrough was observed at the outlet end. Blockages in the lines were remediated by applying a small amount of heat to the core holder outlet end piece by means of a resistive wire heater. There was a sharp increase in MRI signal intensity that was localized at the inlet end of the core; otherwise the distribution of hydrate and excess water was fairly uniform throughout the sand pack (Figure 1-5).
Figure 1-5. Longitudinal MRI image of sand pack after hydrate formation and the introduction of water to fill the remaining gas-filled pores. A gas mixture of CO2/N2 (60/40 mole percent) was injected into the hydrate and water-saturated sand pack. Almost immediately blockages were formed in the core that caused significant pressure increases. A stream of N2 gas was then injected into the system that restored pressure communication. Permeability calculated from the N2 injection step was calculated as 0.9 mD. MRI images of the sand pack at this stage showed evidence of hydrate-free channels being formed (Figure 1-6). The N2 caused hydrate dissociation on a localized level and thereby created a high-permeability pathway (Figure 1-7). Once it was determined that it was not possible to inject additional CO2/N2 mixture, the system was depressurized to 250 psi, below PGHS, the hydrate stability pressure.

14
Figure 1-6. Longitudinal MRI images of sand pack show the distribution of free water after initial hydrate formation and water flood that filled the remaining pore volume (top) and after an interval of N2 injection (bottom) from the left side. The warm colors correspond to free water released by the dissociation of some of the hydrate.
Figure 1-7. Series of transverse slices of an MRI image collected after waterflood of the hydrate-saturated sand pack (left), and after N2 injection that removed blockages in the core (right) The experiment 08_Sand pack was the next effort to evaluate strategies for mitigating blockage issues associated with excess water in the hydrate-saturated pores. Another modification to the experimental setup was the addition of a resistive wire heater in the core-holder’s end piece at the inlet end that mirrored the one on the outlet end.
15
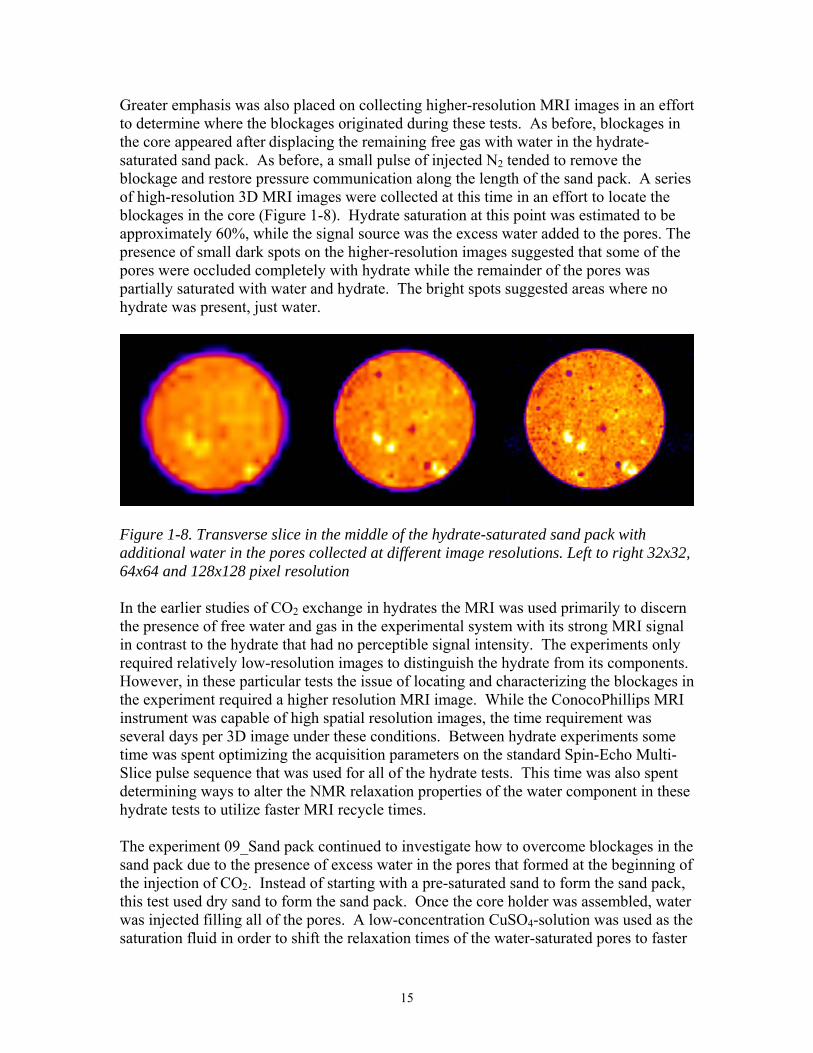
Greater emphasis was also placed on collecting higher-resolution MRI images in an effort to determine where the blockages originated during these tests. As before, blockages in the core appeared after displacing the remaining free gas with water in the hydrate-saturated sand pack. As before, a small pulse of injected N2 tended to remove the blockage and restore pressure communication along the length of the sand pack. A series of high-resolution 3D MRI images were collected at this time in an effort to locate the blockages in the core (Figure 1-8). Hydrate saturation at this point was estimated to be approximately 60%, while the signal source was the excess water added to the pores. The presence of small dark spots on the higher-resolution images suggested that some of the pores were occluded completely with hydrate while the remainder of the pores was partially saturated with water and hydrate. The bright spots suggested areas where no hydrate was present, just water.
Figure 1-8. Transverse slice in the middle of the hydrate-saturated sand pack with additional water in the pores collected at different image resolutions. Left to right 32x32, 64x64 and 128x128 pixel resolution In the earlier studies of CO2 exchange in hydrates the MRI was used primarily to discern the presence of free water and gas in the experimental system with its strong MRI signal in contrast to the hydrate that had no perceptible signal intensity. The experiments only required relatively low-resolution images to distinguish the hydrate from its components. However, in these particular tests the issue of locating and characterizing the blockages in the experiment required a higher resolution MRI image. While the ConocoPhillips MRI instrument was capable of high spatial resolution images, the time requirement was several days per 3D image under these conditions. Between hydrate experiments some time was spent optimizing the acquisition parameters on the standard Spin-Echo Multi-Slice pulse sequence that was used for all of the hydrate tests. This time was also spent determining ways to alter the NMR relaxation properties of the water component in these hydrate tests to utilize faster MRI recycle times. The experiment 09_Sand pack continued to investigate how to overcome blockages in the sand pack due to the presence of excess water in the pores that formed at the beginning of the injection of CO2. Instead of starting with a pre-saturated sand to form the sand pack, this test used dry sand to form the sand pack. Once the core holder was assembled, water was injected filling all of the pores. A low-concentration CuSO4-solution was used as the saturation fluid in order to shift the relaxation times of the water-saturated pores to faster
16
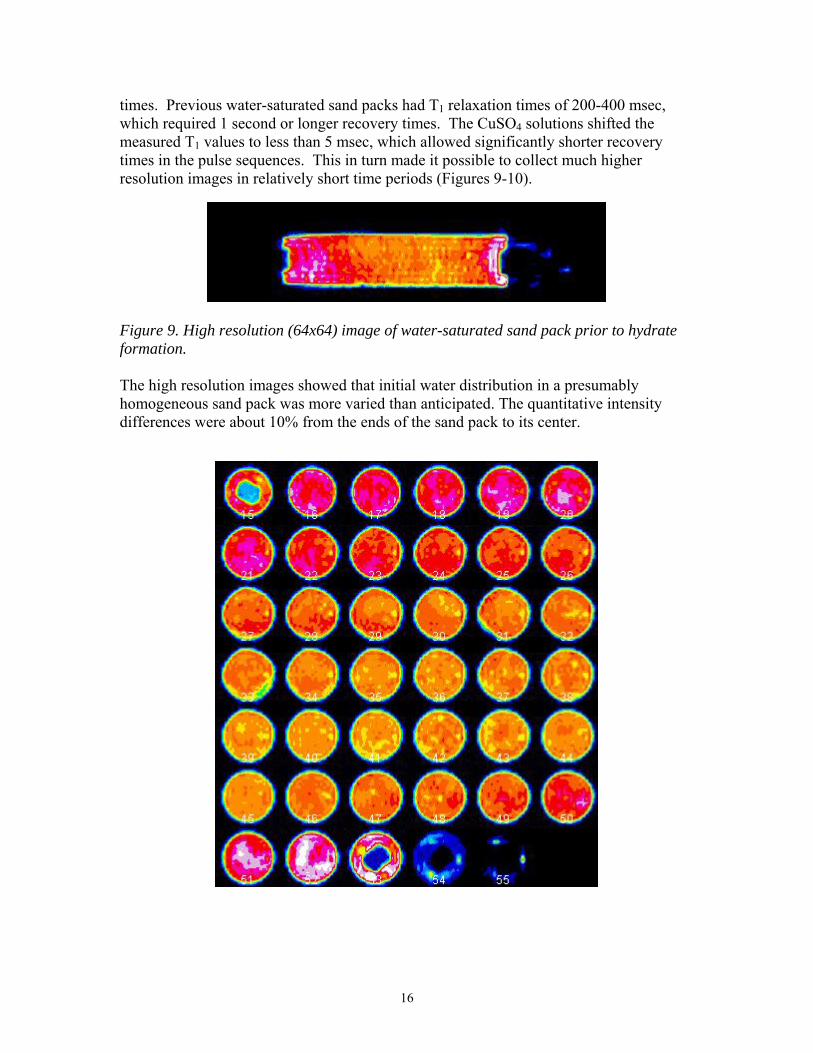
times. Previous water-saturated sand packs had T1 relaxation times of 200-400 msec, which required 1 second or longer recovery times. The CuSO4 solutions shifted the measured T1 values to less than 5 msec, which allowed significantly shorter recovery times in the pulse sequences. This in turn made it possible to collect much higher resolution images in relatively short time periods (Figures 9-10).
Figure 9. High resolution (64x64) image of water-saturated sand pack prior to hydrate formation.
The high resolution images showed that initial water distribution in a presumably homogeneous sand pack was more varied than anticipated. The quantitative intensity differences were about 10% from the ends of the sand pack to its center.

17
Figure 10. Series of high-resolution transverse slices of image collected on water-saturated sand pack that shows variations in water distribution. Warmer colors correspond to high water saturation. These results illustrate the difficulties in setting-up and running a two-phase hydrate and water experiment. Despite efforts to duplicate initial conditions for several of these tests, the results for each test differed because of slight modifications and changes in the experimental parameters that were imposed by blockages and other constraints. The preliminary assessment was that starting with a fully saturated sand pack would take too long to form hydrate saturations that approached field values (Sh = 50% to 75%), so the idea of using a waterflood to fill the remaining pores was tested. The expectation that water would efficiency displace the gas was not met in these tests, despite the homogeneity of the initial system and the strongly water-wet nature of the quartz sand packs. Residual gas saturations in these tests after the waterflood ranged from 2% to 5% with one test approach a residual gas saturation of 10%. The MRI images also indicated that the water quickly found high-permeability pathways through the sand pack and thereby by-passed some of the core. Challenges creating a two-phase hydrate- and water-saturated system for lab work make field testing a more practical alternative to laboratory experimentation. The nitrogen pre-flush was effective in displacing some of the excess water from the pores and into the outlet lines and downstream separator. The nitrogen pre-flush also caused significant hydrate dissociation, in large part due to the amounts of N2 used. Previous permeability tests had limited the amount of N2 used to less than one pore volume, and thus its impact on the hydrate stability was limited. MRI imaging played a major role in identifying the creation of heterogeneous pathways in the hydrate-saturated sand pack after the use of the N2 injection. The reformation of the hydrate after this stage of the experiment was much less homogeneous than the original distribution of hydrate.

18
Appendix 2: Reservoir Simulator Development and Numerical Modeling Prepared by Suntichai Silpngarmlert, ConocoPhillips (Houston) A cell-to-cell model or tank model, based on a concept of sequential flow in a multi-tank system has been developed (Figure 2-1). Because this is a volume-based model, all the simulation results are based on injected and produced volumes. The model assumes that each cell or tank instantaneously reaches equilibrium conditions. The Multiflash simulator was used for phase equilibrium calculations and coupled with the cell-to-cell model. Multiflash provides both accuracy and numerical stability. Two models were developed in this study, an isothermal cell-to-cell model and an adiabatic cell-to-cell model. 1. Isothermal cell-to-cell model In the isothermal model it is assumed that heat transfer between a hydrate layer and its surrounding is very rapid so that the temperature of the hydrate layer does not change. Simulation runs were performed to test its capability to predict hydrate phase behavior. In this test, CO2 injection was simulated in a single tank which was initially filled with water and methane gas. Because there was no outflow from the tank, the tank pressure increases during the injection. When the tank pressure reaches the CO2-CH4 hydrate formation pressure, CO2-CH4 hydrate starts forming resulting in pressure decline. At some point, no additional hydrate will be form, since all water has been used to form hydrate. The tank pressure starts to increase again as injection continues.
Figure 2-1: Diagram of the cell-to-cell model
Figure 2-2 shows the comparison between the results from the cell-to-cell model and STARSTM simulator (CMG)[1]. Predictions from the two models are consistent.
. . . .
N2or
N2+CO2P = 1400 psi
1 2 3 n
CH4Hydrate +Water
P = 1000 psi
. . . .
N2or
N2+CO2P = 1400 psi
1 2 3 n
CH4Hydrate +Water
P = 1000 psi

19
Figure 2-2: Comparison of CO2-storage simulation results (Tank model vs. STARSTM)
Even though STARSTM can be used to conduct CO2-storage study, it is unlikely to be able to model this pilot test because one must assume ideal mixing for hydrate phase in STARSTM model, and this can introduce significant error especially for the exchange process in multi-component hydrate systems. A simple simulation study was performed to test the ideal-mixing assumption and the results from non-ideal mixing and ideal mixing cases were significantly different. 1.1 Simulation of N2-preflush
N2-preflush simulation was performed to investigate hydrate-phase behavior during this stage. N2 was injected with constant BHP at 1400 psi into a system filled with 50% methane hydrate and 50% water. Initial pressure and temperature of the system were 1,000 psi and 41 oF, respectively. The model predicts that, initially, additional hydrate forms in tank 1. With additional injection the hydrate in the tank starts to dissociate. When the mixed gas in tank 1 (N2 + released CH4) moves to down-stream tanks (deeper into the formation), it forms additional hydrate in these tanks (see Figure 2-3). Hydrate saturation in the downstream tanks (see tanks 2 and 3 in the plot) starts declining when the inflows to these tanks have sufficient N2 concentration. Note that the tank model predicts no hydrate formation when N2 is injected into the system filled with 100% water under the same condition, since N2-hydrate is not stable at this condition. This indicates that ideal-mixing assumption (treating CH4-N2 hydrate as
CO2 CH4 (g) + water (290 psi, 41 oF)
Pressure and saturations vs time
25 (m3)
STARS (CMG)
Pressure and saturations vs time
25 (m3)
STARS (CMG)
Pressure and saturations vs injected CO2
0
1000
2000
3000
4000
0 5 10 15 20 25
Injected CO2 (m3)
pres
sure
(kPa
)
0.0
0.2
0.4
0.6
0.8
1.0
satu
ratio
ns
Pressure Sh Sw
Tank model (COP)
Pressure and saturations vs injected CO2
0
1000
2000
3000
4000
0 5 10 15 20 25
Injected CO2 (m3)
pres
sure
(kPa
)
0.0
0.2
0.4
0.6
0.8
1.0
satu
ratio
ns
Pressure Sh Sw
Tank model (COP)

20
two separate pure-component hydrates: CH4-hydrate and N2-hydrate) may introduce significant errors in phase equilibrium prediction. 1.2 Simulation of N2-preflush followed by CO2+N2 injection
In this simulation case, injection of 50% CO2 + 50% N2 was simulated after N2-preflush simulation. Figure 2-4 shows the change of hydrate saturation in the first 3 tanks and hydrate saturation profiles during these two stages. As expected, the model predicts that hydrates in near-wellbore region (tank 1) started reforming after switching to CO2+N2 injection stage, and the hydrate saturation in tank 1 inclines to a certain value before it stops increasing. The stable hydrate saturation in tank 1 depends on injectant composition.

21
Figure 2-3: Hydrate saturation change and hydrate saturation profile during N2-preflush from the isothermal tank model
Sh vs Injected Volume
0.0
0.2
0.4
0.6
0.8
1.0
0 2000 4000 6000 8000 10000 12000
Injected volume (scf)
Sh
Tank 1 Tank 2 Tank 3
100% N2 inlet (tank 1)
N2 + CH4 inlet (tanks 2 & 3)
Sh Profiles at Various Injected Volume
0.0
0.2
0.4
0.6
0.8
1.0
0.5 1.5 2.5 3.5 4.5 5.5 6.5Radius (ft)
Sh
3 Mscf 6 Mscf 9 Mscf 12 Mscf
Hydrate forms
Hydrate dissociates

22
Figure 2-4: Hydrate saturation change and hydrate saturation profile during N2-preflush followed by CO2+N2 injection from the isothermal tank model
2. Adiabatic cell-to-cell model This model can capture temperature change in each cell based on a simplified internal energy balance. It assumes no heat transfer between the system and its surroundings. Energy change is caused by fluid flow, i.e., the enthalpy difference between inflow and outflow.
outfoutfinfinfrockprockffff HmHmTcmUmUm _____2211 ⋅−⋅=Δ⋅⋅+⋅−⋅
Sh Profiles at Various Injected Volume
0.0
0.2
0.4
0.6
0.8
1.0
0.5 1.5 2.5 3.5 4.5 5.5 6.5Radius (ft)
Sh
6 Mscf 12 Mscf 18 Mscf 24 Mscf
Sh vs Injected Volume
0.0
0.2
0.4
0.6
0.8
1.0
0 5000 10000 15000 20000 25000
Injected volume (scf)
Sh
Tank 1 Tank 2 Tank 3
Start CO2+N2 injection

23
where mf1 = Total mole of fluids at previous calculation step mf2 = Total mole of fluids at current calculation step Uf1 = Molar internal energy at previous calculation step Uf2 = Molar internal energy at current calculation step mf_in = Total mole of fluids flowing into the tank mf_out = Total mole of fluids flowing out of the tank Hf_in = Molar enthalpy of inlet fluid Hf_in = Molar enthalpy of outlet fluid mrock = Total mass of porous rock cp_rock = Specific heat of porous rock ΔT = Temperature change Generally, hydrate formation will increase temperature which makes hydrates become less stable. On the other hand, hydrate dissociation will decrease temperature which makes hydrates become more stable. 2.1 Simulation study of N2-preflush
The case in section 1.1 was simulated using the adiabatic cell-to-cell model. Figure 2-5 shows hydrate saturation change, hydrate saturation profile, and temperature profile at various injected volumes. The model predicts that near wellbore temperature will significantly drop due to hydrate dissociation. Hence, ice formation may occur. Comparing to hydrate saturation profile in Figure 2-3, the adiabatic tank model predicts less hydrate dissociation in tank 1 as temperature drop retards further hydrate disassociation. The model also predicts less additional hydrate formation in the deeper zone (farther away from the well) because temperature increase in this zone inhibits hydrate formation.

24
Figure 2-5: Hydrate saturation and temperature profiles during N2-preflush from the adiabatic tank model
Sh vs Injected Volume
0.0
0.2
0.4
0.6
0.8
1.0
0 2000 4000 6000 8000 10000 12000
Injected volume (scf)
Sh
Tank 1 Tank 2 Tank 3
Sh Profiles at Various Injected Volumes
0.0
0.2
0.4
0.6
0.8
1.0
0.5 1.5 2.5 3.5 4.5 5.5 6.5
Radius (ft)
Sh
3 Mscf 6 Mscf 9 Mscf 12 Mscf
Temp Profiles at Various Injected Volumes
25
30
35
40
45
50
55
60
0.5 1.5 2.5 3.5 4.5 5.5 6.5Radius (ft)
Tem
pera
ture
(F)
3 Mscf 6 Mscf 9 Mscf 12 Mscf

25
2.2 Simulation of N2-preflush followed by CO2+N2 injection The case in section 1.2 was simulated using the adiabatic cell-to-cell model.
Figure 2-6 shows hydrate saturation change, hydrate saturation profile, and temperature profile at various injected volumes. The model predicted that near wellbore temperature would increase after switching from N2-preflush to CO2+N2 injection due to hydrate formation. Similarly, the adiabatic tank model predicted less hydrate formation in tank 1.

26
Figure 2-6: Hydrate saturation and temperature profiles during N2-preflush followed by CO2+N2 injection from the adiabatic tank model
Sh Profiles at Various Injected Volumes
0.0
0.2
0.4
0.6
0.8
1.0
0.5 1.5 2.5 3.5 4.5 5.5 6.5
Radius (ft)
Sh
6 Mscf 12 Mscf 18 Mscf 24 Mscf
Sh vs Injected Volume
0.0
0.2
0.4
0.6
0.8
1.0
0 5000 10000 15000 20000 25000
Injected volume (scf)
Sh
Tank 1 Tank 2 Tank 3
Temp Profiles at Various Injected Volumes
25
30
35
40
45
50
55
60
0.5 1.5 2.5 3.5 4.5 5.5 6.5Radius (ft)
Tem
pera
ture
(F)
6 Mscf 12 Mscf 18 Mscf 24 Mscf
27
Appendix 3: Project Management, Test/Equipment Design, and Construction Prepared by Bruce Smith, Legacy Energy Ventures (Houston) and David Schoderbek, ConocoPhillips (Anchorage)
ConocoPhillips Project Management
Permitting All necessary permits have been secured to allow for the planned 2012 testing operations. These include federal, state, and municipal permits. Federal permits from DOE (Categorical Exclusion for NEPA Environmental Questionnaire) and US Fish & Wildlife (Letter of Authorization for polar bear take) were procured. State permits from Alaska Department of Natural Resources (Lease Operations/North Slope and Tundra Travel permits), Alaska Department of Environmental Conservation (“Minor General 1” permit for emissions), and Alaska Oil and Gas Conservation Commission (Enhanced Recovery Injection Order and Sundry Notices) were obtained. Administrative Approval to conduct operations on their lands was also acquired from the North Slope Borough.
Scheduling Schedules have been coordinated with contractors and suppliers to train personnel, and secure, fabricate, and deliver all necessary equipment and supplies to the North Slope.
Contract Services Team used existing, modified existing, or established new contracts, to provide equipment, consumables, and services necessary for the 2012 well testing operations. The majority of costs for the 2012 operations are contract services and consumables.
Drafting Contract drafting services were used to prepare P&ID, and site layout drawings in preparation for rigging up the testing equipment.
Procurement ConocoPhillips Procurement purchased tangible equipment needed for 2012 well testing operations, such as the sand screen assembly and downhole pump assemblies. Equipment purchases are minor costs, and will for the most part either be abandoned in the well or consumed during the 2012 operations. CO2 supply and transport was contracted , along with ultra high purity (UHP) carrier gases, and the specialized tracer gases SF6 (sulfur hexafluoride) and R114 (C2Cl2F4, of 1,2-dichlorotetrafluoroethane). A pressure-build coil for offloading CO2 was purpose-built for this project by subcontractor to facilitate offloading on the North Slope during cold ambient temperatures.
Hazard Reviews Thorough hazard reviews have been completed with Expro and Schlumberger for their equipment and operations.

28
BPXA Coordination Hazard reviews and simultaneous operations (SimOps) procedures and protocols have been developed, reviewed with, and approved by BPExploration Alaska, Inc (BPXA), operator of the Prudhoe Bay Unit. These are necessary tasks associated with the location of the project inside the Prudhoe Bay Unit. ConocoPhillips Emergency Response Plan (ERP) has been bridged with BPXA ERP to provide full alignment. Daily SimOps conversations will occur during winter 2012 Operations. As part of COP-managed permitting process, tanks planned for use on Iġnik Sikumi #1 wellsite and their inspection records were provided to BPXA, who included the tanks in an amendment to their ODPCP (Oil Discharge Prevention and Contingency Plan) on file at the Alaska Department of Environmental Conservation.
Procedures
Protocols High-level project-specific protocols have been developed that document and reference the requirements necessary to comply with operating requirements on the North Slope. These protocols include guidelines for management of simultaneous operations, risk assessment, training & competency, incident investigation, reporting, data management, roles & responsibilities, and foul-weather guidelines.
Normal Procedures Project-specific operational procedures have been prepared that include all activities planned at the wellsite. Procedures range from site rig up and well preparation, through perforating, injection, and flowback, and to permanent abandonment. Procedures also include sand screen installation, artificial lift installation, tracer operations, and surface sampling.
Contingency Procedures Project specific procedures have been prepared for unplanned, yet possible events. Additional contingency procedures will be developed as the need arises.
Decision Trees Decision trees have been prepared to guide the decision process in the event of low injection capacity and low productivity.
Artificial Lift
Mechanical Pumps Hydraulic driven mechanical sucker rod pumps have been designed, built, and tested by Cormorant Engineering. The pumps are in transit to the North Slope.
Jet Pumps Jet pumps are available on the North Slope and are commonly used by ConocoPhillips in conventional operations. Costs for jet pumps will include consumable, re-dressing, and inventory charges.

29
Downhole Equipment
Sand Screen Screens for downhole sand control were ordered from Delta Screens for the Upper C sand, and as contingency for the D sand. The screens were shipped to Unique Machine in Anchorage where an assembly including seals and a DB-6 lock was built for space-out across the Sagavanirktok “Upper C” sand. Screens have been configured for running and setting inside the 4½”monobore. The assembly and contingency screens will be transported to the North Slope. Sand screen design was a two step process, overseen by ConocoPhillips Technology experts in Bartlesville, Oklahoma. The first step was to assemble and analyze all available particle size distributions from the nearby BPXA/DOE - Mt Elbert #1 hydrate core test. Grain-size distributions for the BPXA/DOE - Mt Elbert #1 core were provided by DOE (see Rose, et al, 2011). Over four-hundred grain-size distributions are summarized graphically in Figure 3-1. Correlation of Mt Elbert #1 subsurface data to logs from ConocoPhillips - Ignik Sikumi #1 focused grain-size analysis on the Sagavanirktok “C” and “D” sandstones, shown in Figure 3-2. The second step was to build, based on Mt Elbert #1 grain-size distributions, three bulk sand samples, representing coarse, medium, and fine-grained portions of the distributions (see Figure 3-3). These bulk sand samples were tested against a variety of commercially available screens, and Delta Elite 200 screen was chosen.

30
Figure 3-1: Core-based grain-size distributions from Mt Elbert #1 core

31
Figure 3-2: Laser grain-size analyses, Mt Elbert #1 Sagavanirktok “C” and “D” sands

32
Figure 3-3: Synthetic Bulk Sand Samples: Median (d50) grain size vs Mt Elbert #1 cores

33
Chemical Injection Valve A chemical injection valve, for placement in the chemical injection mandrel, installed in 2011, with a 1,500 psi set pressure was ordered from Schlumberger and will be transported to the North Slope.
Jet Pump Assemblies Reverse jet pump assemblies were machined, including 2 DB-6 locks and a lower seal assembly. Jet pump engineering design work was completed, and a variety of throats and nozzles have been secured to span a wide range of expected operating conditions..
Cormorant Pump Assemblies Downhole pump assemblies have been designed, built, and tested. Comorant hydraulic pumps, illustrated in Figure 3-4, will be powered by hydraulic fluid, pumped from the surface, via the chemical injection mandrel. Chemical injection mandrel is connected to central ¾” line of triple flatpack. Four Comorant pumps (two 3¼” pumps and two 2½” pumps) will be transported to the North Slope.

34
Figure 3-4: Cormorant Pump schematic Oriented Perforating Oriented perforating has been investigated, development efforts have been pursued, tool selection has been made, and operational procedures have been developed. The Schlumberger’s Wireline Perforating Platform (WPP) is planned to be used to detect the location of the fiber-optic and electronic cables, and a downhole gyroscopic orientation

35
tool will be used to verify the orientation of the perforations to avoid damage to the cables. A perforating test was recently performed by to successfully test the survival of the downhole gauges in close proximity to perforating charges.
Gas Injection Contractor: Schlumberger
Carbon Dioxide Tank A 50-ton CO2 tank was purchased, then hydro-tested, refurbished, and fitted with new pipe work, valves, and pressure relief valves.
Nitrogen Tanks Two 2000-gallon N2 tanks were secured then refurbished from contractor’s existing inventory and made ready for this project.
Line Heater Contractor will provide a diesel-fired line heater to heat the glycol water heating medium for wellbore heating. The line heater was secured then refitted with a new control panel and burner from Schlumberger existing inventory and made ready for this project.
Pipe Work, Hoses, Valves Various pipe work, hoses and valves were purchased and assembled, for specific use on this project, by Schlumberger.
Data Management Schlumberger will provide data management services and electronic delivery of data via their InterACT site. A Well Site Data Hub (WSDH), with redundant backup, will be supplied to serve as a data concentrator for gas mixing, fluid measurement, and downhole data. Data from the WSDH will stream to an internet server and be made available to the project team and stakeholders. At the end of the project, the WSDH and data will belong to ConocoPhillips, with permanent media versions provided to the stakeholders.
Crew Training Schlumberger began crew training in October as part of adding personnel to their North Slope operations. The training consisted of job shadowing and on the job training in North Slope operations.
Contract Personnel Experienced Schlumberger personnel commenced work in October to assist in planning, training, and making equipment ready for North Slope operations for the 2012 testing operations.
Gas Mixing Skid (GMS) Pumps, valves, meters, piping, and operator console are the main elements of the Gas Mixing Skid (GMS). Nitrogen and carbon dioxide injectants are stored on-site as cold, relatively low-pressure liquids. Liquid nitrogen is stored near -300°F and 50psi; liquid carbon dioxide is stored near 0°F and 300psi. The GMS will control heating,

36
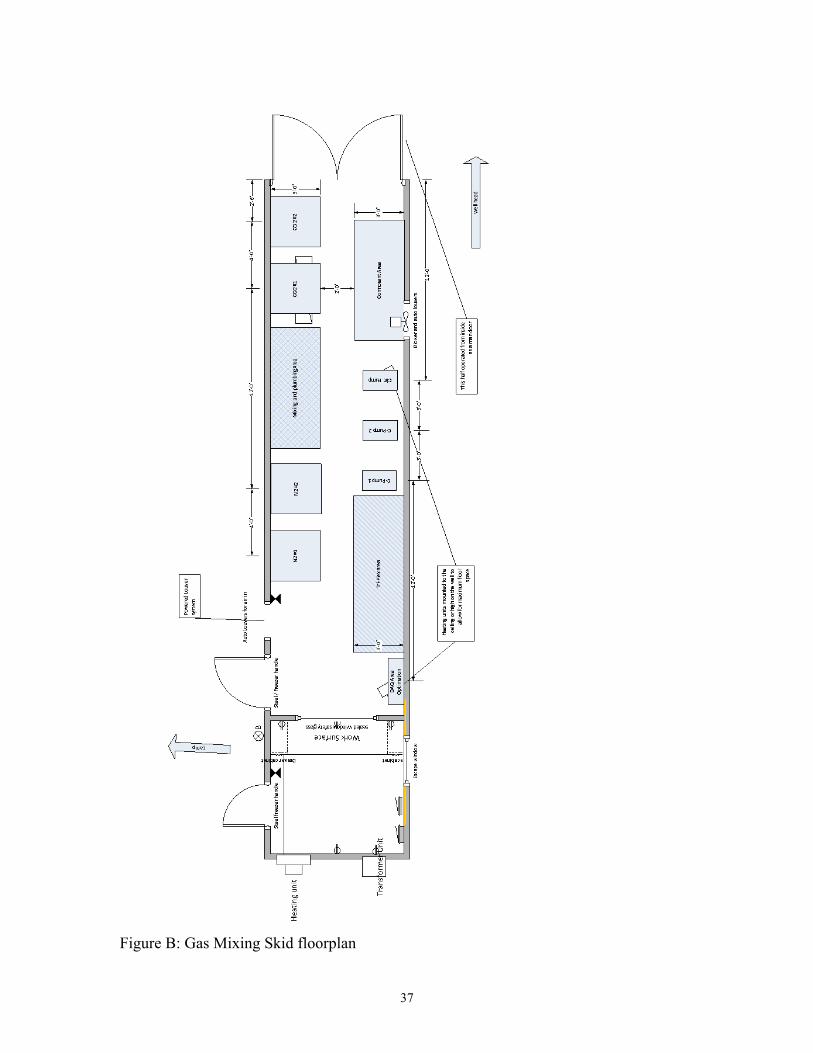
vaporization to gas phase, and accurate mixing of N2 and CO2 injectants. Floor plan of the GMS is shown in Figure A. The GMS was built inside a 40ft x 8ft x 8ft shipping container. The GMS was purpose built by Schlumberger for this project, and consists of the components described in the remainder of this section.
37
Figure B: Gas Mixing Skid floorplan
38
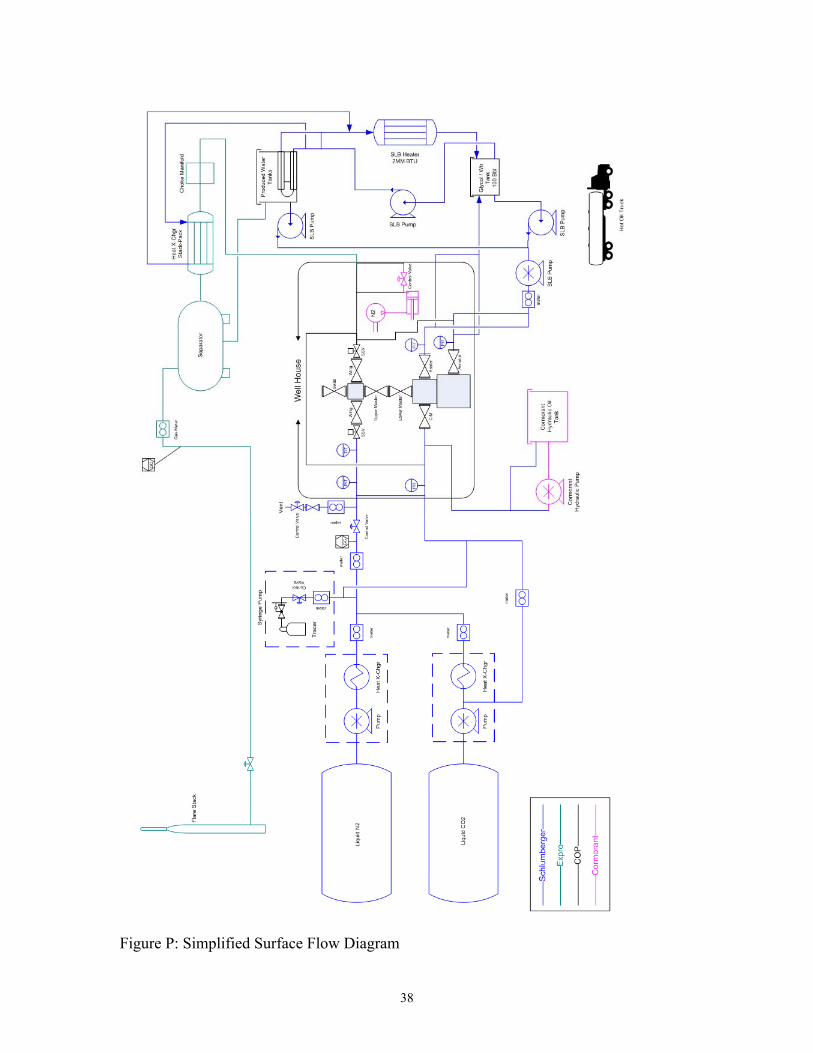
Figure P: Simplified Surface Flow Diagram
39
Liquid Pumps
Triplex Pumps Two 30-horsepower Triplex pumps for circulating the glycol/water heating medium in the wellbore were purchased and installed. These pumps will also supply reverse jet pump power fluid.
Centrifugal Pumps Two 5-horsepower centrifugal pumps to charge the Triplex pumps were purchased, as was a 10-horsepower centrifugal pump to circulate the glycol/water heating medium through the Schulmberger line heater at surface.
Process Logic & Control Optimation was subcontracted to write the computer code for operating logic and process control, along with managing and storing the data on the Well Site Data Hub (WSDH).
Gas Chromatograph A research-grade gas chromatograph will be used to measure injection and tracer blends, as well as gas and tracer concentrations during flowback. GC will be installed in the Gas Mixing Skid or GMS.
Tracer A syringe pump, specific for this project, will meter and inject tracer gases into the mixed-gas injection stream.
Hazard Review A hazard review of the GMS was performed in Houston late in December. Schlumberger GMS operators, L&S Cryogenics engineers, and ConocoPhillips project management and operations staff actively participated in hazard identification, documentation, and mitigation.
Transport The GMS, Line Heater, CO2 tank, N2 tanks, WSDH, and other miscellaneous items have been shrink-wrapped for highway transport to the North Slope. Transport to the North Slope will begin early in January, 2012
Separation/Measurement Contractor: Expro
Separator A 3-phase 1440 psi working-presure separator was secured and inspected, hydro-tested, and made ready for the 2012 testing operations. A Project Manager from contractor’s staff has been assigned responsibilities for inspections, modifications, logistics and readiness for operations.

40
Winterization Shelter A building was obtained for use as a winterization enclosure for the separator. Modifications were made to the enclosure and included, door latches and restraints, electrical wiring, lighting, gas detection, and alarms.
Low-rate Gas Metering & Flow Control Two thermal mass gas flow meters will measure flow rates from 0 – 20 MCFPD and 20 – 300 MCFPD. A low-flow backpressure control valve will control flow at low gas rates. Contractor equipment will be mounted in the Winterization Shelter, described above, to comprise the LGMS(low-rate gas metering skid), which is slated for transport to the North Slope early in January, 2012.
Hazard Review A hazard review was conducted for the separator, pipe work, and flare stack.
Downhole Data Measurement Contractor: Pinnacle
Distributed Temperature Sensor (DTS) ConocoPhillips Technology purchased the fiber-optic interrogator for use on this project, independent of the Gas Hydrates Project. Ownership of this fiber-optic interrogator will remain with ConocoPhillips at the end of the project. ConocoPhillips is loaning this equipment to the project. A DTS engineer will be onsite during the 2012 testing operations to manage the DTS data.
Downhole P/T Gauges ConocoPhillips Technology purchased the electronic interrogator for use on this project. Ownership of this electronic interrogator will remain with ConocoPhillips. ConocoPhillips will loan this equipment to the project. A DTS engineer will be onsite during the 2012 testing operations to manage the P/T gauge data in addition to the DTS data.
Distributed Acoustic Sensor (DAS) DAS is an emerging technology. A DTS Engineer, using acoustic interrogation equipment, will monitor and mange acoustic data during the 2012 testing. A DAS Scientist will train the DTS engineer to operate the equipment and manage the acoustic data in addition to the DTS data.
2012 Operations
Ice Pad The ice pad for the 2012 operations was completed in December 2011.
41
SimOps with BPXA Simultaneous operations guidelines have been established with BPXA. A SimOps meeting is held at 7am daily at the test site as part of the SimOps management plan between BPXA and ConocoPhillips.
Rig Camp Nordic Camp # 6 was contracted from Nordic-Calista. This camp was built in Canada by Nordic in fall of 2011, and was transported to the North Slope late in December, 2012.
Generator Power Generator power for the Schlumberger and Expro equipment has been contracted with Peak Precision Power on the North Slope.
Tanks Several tanks are required for the 2012 testing operations. Tanks will be supplied from various 3rd party suppliers and ConocoPhillips inventory. All tanks have been included in the Contingency Plans for both ConocoPhillips and BPXA, and recorded with the State of Alaska regulatory authority.
Secondary Containment Secondary containment (referred to as berming and/or revetment) is being constructed for all tanks, vessels and external pipeways. This service will be provided by a third-party North Slope contractor. References Rose, Kelly, Ray Boswell, and Timothy Collett, 2011, Mount Elbert Gas Hydrate Stratigraphic Test Well, Alaska North Slope: Coring operations, core sedimentology, and lithostratigraphy: Marine and Petroleum Geology, v.28, p 311-331.

42
Figrue Z: Ignik Sikumi #1 Camp Design Proposal
43
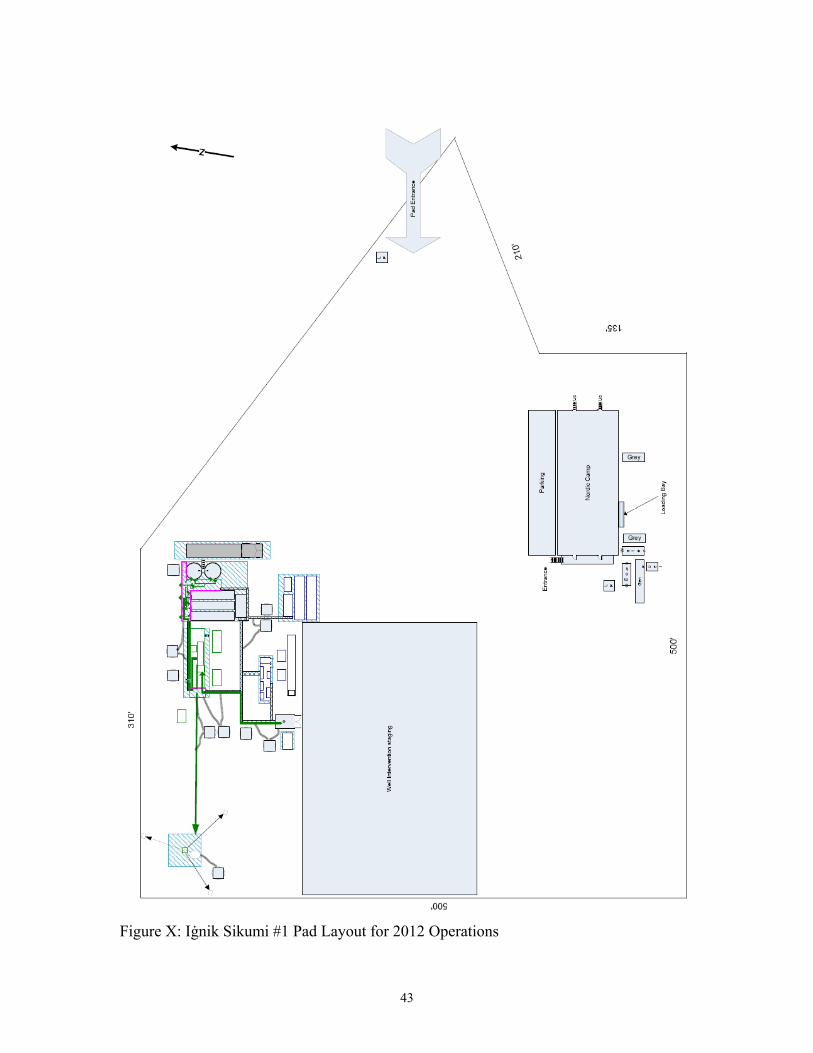
Figure X: Iġnik Sikumi #1 Pad Layout for 2012 Operations

44
Figure Y: Ignik Sikumi #1 2012 Operations: Wellhead Area Layout

45