oil market report template - international energy agency the last few months, questions lingered...
TRANSCRIPT

12 October 2017
HIGHLIGHTS • Following very strong year-on-year demand growth of 2.2 mb/d in
2Q17, the pace slowed to 1.2 mb/d in 3Q17, reflecting relatively weak July and August data and the impact of hurricanes in September. Our forecast of global demand growth remains unchanged at 1.6 mb/d in 2017 (or 1.6%) and 1.4 mb/d in 2018 (or 1.4%).
• Global oil supply rose 90 kb/d in September to 97.5 mb/d as non-
OPEC output edged higher. Output stands 620 kb/d higher than last year. In 2017, non-OPEC supplies are expected to grow by 0.7 mb/d, followed by a 1.5 mb/d increase in 2018.
• OPEC crude output was virtually unchanged in September as slightly higher flows from Libya and Iraq offset lower supply from Venezuela. Output of 32.65 mb/d was down 400 kb/d on a year ago. Compliance with supply cuts for the year-to-date is 86%.
• OECD commercial stocks fell 14.2 mb in August from an upwardly
revised July. The surplus over the five-year average fell to 170 mb. Global stocks are likely to have drawn in 3Q17 as reductions in floating storage and the OECD outweighed net builds in China.
• Benchmark crude prices rose by $2-4/bbl in September versus
August, marking the third straight month of gains. Middle distillate prices increased almost twice as fast as crude, reflecting lower refinery throughputs and higher demand.
• For 4Q17, our refinery throughput forecast edges up to 80.9 mb/d,
up 0.1 mb/d quarter-on-quarter. Our first forecast for January 2018 implies 1.2 mb/d year-on-year growth, although runs decline by 0.4 mb/d from December to just under 82 mb/d.
• Our global crude and product balances show inventories drawing in 2017 by 0.1 mb/d and 0.2 mb/d, respectively. For next year, the crude and product markets look broadly balanced, assuming OPEC holds output steady at around current levels.

PUBLISHING SCHEDULE – 2018
• Friday 19 January
• Tuesday 13 February (1)
• Thursday 15 March
• Friday 13 April
• Wednesday 16 May
• Wednesday 13 June (2)
• Thursday 12 July
• Friday 10 August (3)
• Thursday 13 September
• Friday 12 October
• Wednesday 14 November
• Thursday 13 December
The Market Report Series Oil 2018 edition will be released on 5th March.
1 The 13th February OMR will comprise the usual data and projections through end-2018, but with abridged text.
2. Supply/demand forecasts will be ‘rolled out’ to 2019 in the report dated 13 June 2018.
3. The Annual Statistical Supplement 2018 Edition will be published in conjunction with the report dated 10 August 2018.
NB: On each of these dates, the report will be released at 10:00 am Paris local time.

TABLE OF CONTENTS
HIGHLIGHTS ............................................................................................................................................................................................ 1
Building on success ................................................................................................................................................................................... 4
DEMAND ................................................................................................................................................................................................... 5 Summary ................................................................................................................................................................................................ 5 Global overview ................................................................................................................................................................................... 5 OECD ..................................................................................................................................................................................................... 6 Non-OECD ........................................................................................................................................................................................ 10
Other Non-OECD ...................................................................................................................................................................... 11 Saudi Arabia’s product demand swings widely ................................................................................................................................ 12
SUPPLY .................................................................................................................................................................................................... 14 Summary ............................................................................................................................................................................................. 14 OPEC crude oil supply .................................................................................................................................................................... 14 Non-OPEC overview ...................................................................................................................................................................... 20 OECD .................................................................................................................................................................................................. 22
North America ............................................................................................................................................................................. 22 North Sea ...................................................................................................................................................................................... 24
Non-OECD ........................................................................................................................................................................................ 25 Former Soviet Union .................................................................................................................................................................. 25 Asia .................................................................................................................................................................................................. 27 Latin America ............................................................................................................................................................................... 28
STOCKS .................................................................................................................................................................................................. 29 Summary ............................................................................................................................................................................................. 29 Global Overview .............................................................................................................................................................................. 29 OECD inventory position at end-August and revisions to preliminary data .................................................................... 30 Did global oil stocks draw in 3Q17? ................................................................................................................................................. 31 Recent OECD industry stock changes ....................................................................................................................................... 31
OECD Americas .......................................................................................................................................................................... 31 OECD Europe .............................................................................................................................................................................. 33 OECD Asia Oceania ................................................................................................................................................................... 33
Other stock developments ............................................................................................................................................................ 34
PRICES ...................................................................................................................................................................................................... 37 Summary ............................................................................................................................................................................................. 37 Market overview ............................................................................................................................................................................... 37 Futures markets ................................................................................................................................................................................ 37 Spot crude oil prices ........................................................................................................................................................................ 39 Spot product prices ......................................................................................................................................................................... 41 Freight ................................................................................................................................................................................................. 43
REFINING ............................................................................................................................................................................................... 44 Summary ............................................................................................................................................................................................. 44 Global refinery overview ................................................................................................................................................................ 44 Global crude oil and refined product balances ................................................................................................................................ 45
Margins ........................................................................................................................................................................................... 48 OECD refinery throughput ........................................................................................................................................................... 49 Non-OECD refinery throughput ................................................................................................................................................. 51
TABLES .................................................................................................................................................................................................... 54

MARKET OVERVIEW INTERNATIONAL ENERGY AGENCY - OIL MARKET REPORT
4 12 OCTOBER 2017
Building on success Over the last few months, questions lingered about whether producers were seriously committed to their agreement to cut output and balance the market (“All in it together?,” OMR August 2017). While there may still be doubts about some of them, the market heavyweights have once again walked into the ring. A few weeks ahead of the next OPEC meeting, Saudi Arabia and Russia have strengthened their relationship with a high level summit, and a series of investment agreements accompanied by statements suggesting that the current oil output cuts might be tightened. Of course, we must wait and see what happens. But there is little doubt that leading producers have re-committed to do whatever it takes to underpin the market and to support the long process of re-balancing. The backdrop to these high-level manoeuvers is the recent volatility we have seen in the Brent crude market, with prices coming close to the symbolic level of $60/bbl before retreating to $57/bbl. Uncertainty with some suppliers (Libya, Venezuela, Iran and northern Iraq) and signs of possibly slower than expected growth in US shale production, coupled with strong oil demand, provided upward momentum to the market. Producers looking for higher prices were on the verge of declaring victory. The number of net long positions held by money managers in Brent futures rose to their highest-ever level through September. However, more recently, enthusiasm has peaked and profit taking has set in. For WTI, the mini bull run was more limited because logistical constraints saw crude oil stocks increase at Cushing, causing the discount to Brent to blow out to nearly $7/bbl from only $2/bbl in June. Even the huge increase in US crude oil exports in late September to a record level of close to 2mb/d only increased the value of WTI versus Brent by about 95 cents/bbl. Markets have a tendency to over-shoot during headline-heavy periods, which is probably what we saw with Brent.
Meanwhile, detailed analysis of the global balance shows that in 2017 each quarter will show a deficit, other than a tiny build in 1Q17, and, for the year as a whole, stocks will fall by 0.3 mb/d. This assumes OPEC crude oil production remaining at 32.7 mb/d. Data is of course subject to revision, but we can now clearly see a major reduction in floating storage, oil in transit, and stocks held in some independent areas. In the OECD, the five-year average stock overhang is now down to 170 mb from 318 mb at the end of January and stocks have fallen in months when they normally increase, offsetting net builds in China. In the case of China, there is always a margin for error in data that is often derived rather than reported, but crude imports have fallen every month since June and the implied net build for China’s stocks in September was relatively small at 100 kb/d.
Looking into 2018, we see that three quarters out of four will be roughly balanced -- again using an assumption of unchanged OPEC production, and based on normal weather conditions. However, our current numbers for 1Q18 imply a stock build of up to 0.8mb/d. Taking 2018 as a whole, oil demand and non-OPEC production will grow by roughly the same volume and it is this current outlook that might act as the ceiling for aspirations of higher oil prices. Leading oil producers will have looked at their market balances and probably drawn the same conclusion. The next few weeks ahead of the producers’ meeting in Vienna on 30 November will be crucial in shaping their decision on output. A lot has been achieved towards stabilising the market, but to build on this success in 2018 will require continued discipline.
-2.0
-1.0
0.0
1.0
2.0
3.0
90
92
94
96
98
100
4Q14 4Q15 4Q16 4Q17 4Q18
mb/dmb/d Demand/Supply Balance until 4Q18
Total Stock Ch. & Misc Demand Supply*
Note: For scenario purposes, OPEC/non-OPEC cuts remain constant.

INTERNATIONAL ENERGY AGENCY - OIL MARKET REPORT DEMAND
12 OCTOBER 2017 5
DEMAND Summary • After the very strong year-on-year growth of 2.2 mb/d seen in 2Q17, oil demand growth returned to
more normal levels in July/August. Demand increases in OECD countries were moderate in July and preliminary data point to a further slowdown in August. Non-OECD growth continued to slow, more or less in line with our forecast. As a result, our overall outlook remains roughly unchanged, with small revisions to historical data offsetting each other. We forecast global demand growth of approximately 1.6 mb/d in 2017 (or 1.6%) and 1.4 mb/d in 2018 (or 1.4%).
• Following the strong performance seen in 2Q17, growth slowed to 1.2 mb/d in 3Q17, reflecting relatively weak July and August (preliminary) data and the expected impact of hurricanes Harvey and Irma in September. Demand is expected to bounce back in 4Q17, expanding by 1.7 mb/d year-on-year (y-o-y), assuming normal northern hemisphere winter temperatures.
• US July data were weaker than seen recently, showing demand growth of 250 kb/d y-o-y after an
increase of 650 kb/d in June. Gasoline demand was slightly below last year for the first time in four months. LPG/ethane demand rose by 100 kb/d y-o-y after posting an increase of 240 kb/d in June.
• According to domestic data, German oil consumption declined by 100 kb/d y-o-y in August, on
lower naphtha deliveries. Gasoil demand growth slowed to 70 kb/d y-o-y. French deliveries dropped by 35 kb/d in August and Italian demand ended up slightly below last year.
• Chinese demand rose by 310 kb/d y-o-y in August, supported by an increase in naphtha and other
product demand. Growth continues to slow, and both gasoline and gasoil apparent demand contracted in August.
• Indian demand dropped by 210 kb/d y-o-y in August, on exceptional weather conditions. LPG was
the only product posting positive growth.
Global Oil Demand (2016-2018)(million barrels per day)*
1Q16 2Q16 3Q16 4Q16 2016 1Q17 2Q17 3Q17 4Q17 2017 1Q18 2Q18 3Q18 4Q18 2018Africa 4.2 4.2 4.0 4.1 4.1 4.4 4.2 4.1 4.2 4.2 4.4 4.3 4.2 4.4 4.3Americas 31.1 31.1 31.7 31.4 31.3 30.9 31.5 31.7 31.8 31.5 31.1 31.8 32.1 31.9 31.7Asia/Pacif ic 33.4 32.8 32.2 33.3 32.9 34.3 33.9 33.0 34.3 33.8 35.0 34.5 33.7 35.2 34.6Europe 14.3 14.6 15.2 14.9 14.8 14.6 15.0 15.3 15.0 15.0 14.5 15.0 15.5 15.1 15.0FSU 4.6 4.6 4.9 4.9 4.8 4.6 4.8 5.0 4.9 4.8 4.7 4.8 5.1 5.0 4.9Middle East 7.9 8.4 8.7 8.1 8.3 7.9 8.4 8.8 8.3 8.4 8.1 8.6 8.9 8.4 8.5World 95.4 95.6 96.7 96.8 96.1 96.6 97.8 97.9 98.5 97.7 97.9 99.1 99.5 99.9 99.1Annual Chg (%) 2.1 1.3 0.7 1.5 1.4 1.3 2.3 1.2 1.8 1.6 1.3 1.3 1.7 1.4 1.4Annual Chg (mb/d) 1.9 1.2 0.7 1.5 1.3 1.2 2.2 1.2 1.7 1.6 1.3 1.3 1.7 1.4 1.4Changes from last OMR (mb/d) 0.0 0.0 0.0 -0.1 0.0 0.1 -0.1 0.1 -0.2 0.0 0.0 0.1 0.1 -0.1 0.0* Including biofuels Global overview Estimates of global oil product demand growth in 2017 have been left unchanged compared to last month’s Report, as 3Q17 provisional demand numbers were more or less in line with our expectations. The US Department of Energy (DOE) revised up oil demand in 2016 by 55 kb/d with the release of its

DEMAND INTERNATIONAL ENERGY AGENCY - OIL MARKET REPORT
6 12 OCTOBER 2017
Petroleum Supply Annual. In our global forecast, however, the positive change to 2016 US demand was offset by a downward revision of 65 kb/d for Venezuela. Our estimate of global oil demand is roughly unchanged at 97.7 mb/d for 2017, rising to 99.1 mb/d in 2018, with growth in each year of 1.6 mb/d and 1.4 mb/d, respectively.
-500
0
500
1000
1500
2000
2500
3000
1Q2015 3Q2015 1Q2016 3Q2016 1Q2017 3Q2017
kb/d Global Oil Demand Growth, y-o-y
Europe China India US Total
44
45
46
47
48
49
JAN APR JUL OCT JAN
mb/d OECD: Total Products Demand
Range 12-16 20162017 5-year avg
OECD In this Report, we include finalised data through July for all OECD countries. Preliminary estimates are available for the US, Mexico, Japan, Korea and some European countries for August. This data point to an end of a period of particularly strong growth for oil deliveries in July and further deceleration in August.
OECD Demand based on Adjusted Preliminary Submissions - August 2017(million barrels per day)
mb/d % pa mb/d % pa mb/d % pa mb/d % pa mb/d % pa mb/d % pa mb/d % paOECD Americas* 11.38 -1.2 2.11 3.6 4.76 1.9 0.41 -6.1 0.60 -5.1 6.14 -1.63 25.40 -0.5
US50 9.56 -1.3 1.78 3.6 3.92 3.0 0.08 3.0 0.32 1.5 4.69 0.39 20.35 0.4 Canada 0.88 -0.8 0.17 2.2 0.29 2.1 0.26 -7.8 0.04 -5.0 0.83 -3.94 2.48 -2.2 Mexico 0.79 -0.9 0.09 9.7 0.35 -8.0 0.04 -13.6 0.12 -22.9 0.50 -13.53 1.90 -7.4
OECD Europe 2.05 1.0 1.56 0.3 5.02 0.2 1.33 -0.9 0.91 -1.4 3.56 -5.69 14.42 -1.4 Germany 0.46 5.0 0.22 -0.8 0.82 6.0 0.35 6.7 0.09 -0.9 0.42 -31.37 2.35 -4.2 United Kingdom 0.30 3.2 0.32 0.9 0.52 2.0 0.16 0.4 0.03 -0.3 0.29 -4.93 1.62 0.5 France 0.19 1.0 0.17 -0.2 0.68 -3.8 0.23 -1.9 0.04 -0.2 0.36 -1.25 1.67 -2.0 Italy 0.19 -4.6 0.13 8.2 0.44 -1.5 0.09 -1.4 0.07 8.9 0.33 -1.44 1.24 -0.5 Spain 0.12 0.6 0.16 2.0 0.47 -0.9 0.12 -2.4 0.16 0.6 0.26 0.27 1.30 -0.1
OECD Asia & Oceania 1.67 -3.7 0.70 2.1 1.34 -1.2 0.43 -3.7 0.58 0.5 3.22 -0.05 7.94 -1.0 Japan 0.99 -4.1 0.32 3.2 0.42 -1.9 0.28 -5.7 0.33 5.9 1.48 -0.12 3.82 -1.0 Korea 0.23 -9.9 0.17 2.1 0.39 -10.2 0.09 3.8 0.22 -7.4 1.51 0.88 2.62 -2.5 Australia 0.32 0.3 0.15 -0.9 0.47 8.3 0.00 0.0 0.02 -0.5 0.16 -5.89 1.12 2.2
OECD Total 15.10 -1.2 4.37 2.2 11.12 0.7 2.17 -2.5 2.09 -2.0 12.92 -2.40 47.75 -0.9 * Including US territories
Total ProductsGasoline Jet/Kerosene Diesel Other Gasoil RFO Other
Americas The latest monthly data for July showed lower oil demand growth in the US, at 250 kb/d compared to 650 kb/d in June, reducing OECD Americas demand growth to 290 kb/d y-o-y in July. Growth in Canada jumped to 125 kb/d in July, supported by strong LPG and other gasoil deliveries. Mexican demand continued to decline, by 90 kb/d y-o-y in July.
INTERNATIONAL ENERGY AGENCY - OIL MARKET REPORT DEMAND
12 OCTOBER 2017 7
23.0
23.5
24.0
24.5
25.0
25.5
26.0
JAN APR JUL OCT JAN
mb/d OECD Americas: Total Products Demand
Range 12-16 20162017 5-year avg
9.5
10.0
10.5
11.0
11.5
12.0
JAN APR JUL OCT JAN
mb/d OECD Americas: Motor Gasoline Demand
Range 12-16 20162017 5-year avg
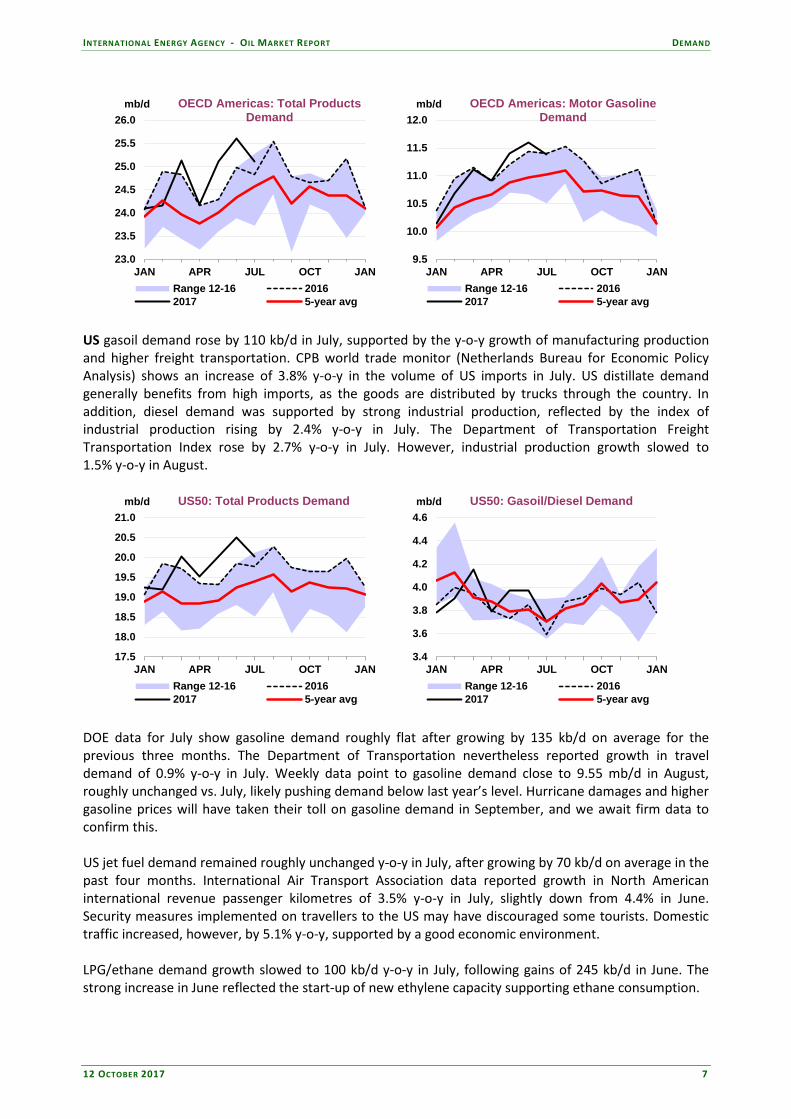
US gasoil demand rose by 110 kb/d in July, supported by the y-o-y growth of manufacturing production and higher freight transportation. CPB world trade monitor (Netherlands Bureau for Economic Policy Analysis) shows an increase of 3.8% y-o-y in the volume of US imports in July. US distillate demand generally benefits from high imports, as the goods are distributed by trucks through the country. In addition, diesel demand was supported by strong industrial production, reflected by the index of industrial production rising by 2.4% y-o-y in July. The Department of Transportation Freight Transportation Index rose by 2.7% y-o-y in July. However, industrial production growth slowed to 1.5% y-o-y in August.
17.5
18.0
18.5
19.0
19.5
20.0
20.5
21.0
JAN APR JUL OCT JAN
mb/d US50: Total Products Demand
Range 12-16 20162017 5-year avg
3.4
3.6
3.8
4.0
4.2
4.4
4.6
JAN APR JUL OCT JAN
mb/d US50: Gasoil/Diesel Demand
Range 12-16 20162017 5-year avg
DOE data for July show gasoline demand roughly flat after growing by 135 kb/d on average for the previous three months. The Department of Transportation nevertheless reported growth in travel demand of 0.9% y-o-y in July. Weekly data point to gasoline demand close to 9.55 mb/d in August, roughly unchanged vs. July, likely pushing demand below last year’s level. Hurricane damages and higher gasoline prices will have taken their toll on gasoline demand in September, and we await firm data to confirm this. US jet fuel demand remained roughly unchanged y-o-y in July, after growing by 70 kb/d on average in the past four months. International Air Transport Association data reported growth in North American international revenue passenger kilometres of 3.5% y-o-y in July, slightly down from 4.4% in June. Security measures implemented on travellers to the US may have discouraged some tourists. Domestic traffic increased, however, by 5.1% y-o-y, supported by a good economic environment. LPG/ethane demand growth slowed to 100 kb/d y-o-y in July, following gains of 245 kb/d in June. The strong increase in June reflected the start-up of new ethylene capacity supporting ethane consumption.

DEMAND INTERNATIONAL ENERGY AGENCY - OIL MARKET REPORT
8 12 OCTOBER 2017
8.0
8.5
9.0
9.5
10.0
JAN APR JUL OCT JAN
mb/d US50: Motor Gasoline Demand
Range 12-16 20162017 5-year avg
1.2
1.3
1.4
1.5
1.6
1.7
1.8
JAN APR JUL OCT JAN
mb/d US50: Jet & Kerosene Demand
Range 12-16 20162017 5-year avg
Ethane demand is expected to remain strong in August but should fall sharply in September, as hurricane Harvey closed half of the US Gulf Coast petrochemical facilities at the start of the month. Our estimate of US demand in 3Q17 remains roughly unchanged from last month’s Report. After a very strong 2Q17, with demand increasing by 515 kb/d y-o-y, demand in 3Q17 is expected to be 40 kb/d below last year. Gasoline demand in particular is forecast to drop by 110 kb/d compared with last year, based on July data, August preliminary numbers and the impact of hurricanes Harvey and Irma in September. LPG/ethane demand will also likely have been impacted by Harvey. On the other hand, gasoil demand will have remained strong, supported by reconstruction work and as some facilities use gasoil generators to produce electricity. Total oil demand in expected to bounce back in 4Q17 with y-o-y growth of 290 kb/d. For 2017 as a whole, US demand is expected to grow by 180 kb/d to 20.2 mb/d, and for 2018 at a slightly slower pace of 135 kb/d to 20.3 mb/d. Europe European oil demand grew by 490 kb/d y-o-y in July after averaging 565 kb/d over the previous two months. Preliminary data point to a y-o-y decline in August. Naphtha demand, in particular, is expected to drop sharply with German naphtha deliveries recording a 30% y-o-y decline in August.
12.5
13.0
13.5
14.0
14.5
15.0
JAN APR JUL OCT JAN
mb/d OECD Europe: Total Products Demand
Range 12-16 20162017 5-year avg
2.1
2.2
2.3
2.4
2.5
2.6
2.7
JAN APR JUL OCT JAN
mb/d Germany: Total Products Demand
Range 12-16 20162017 5-year avg
German oil demand rose by 80 kb/d y-o-y in July, supported by very strong gasoil demand. Preliminary data point to a 100 kb/d contraction in August. In July, gasoil consumption rose by 125 kb/d in spite of a small y-o-y decline in diesel demand, supported by an increase of 135 kb/d in other gasoil (mainly heating oil) deliveries. Preliminary data for August indicates that the German heating oil buying spree ended, growing by only 20 kb/d y-o-y after having averaged 130 kb/d over the preceding three months. German gasoline demand declined by 5 kb/d y-o-y in July but it is estimated to have grown by 20 kb/d in

INTERNATIONAL ENERGY AGENCY - OIL MARKET REPORT DEMAND
12 OCTOBER 2017 9
August. Weakness in naphtha, for which demand is estimated to have fallen by 115 kb/d y-o-y in August, pushed total German demand growth into negative territory. Data for France show a slowdown in oil demand growth from 170 kb/d y-o-y in June to 50 kb/d in July. Demand is expected to contract by 35 kb/d in August. A notable slowdown was seen for gasoil: growth was 100 kb/d in June, 30 kb/d in July and is estimated to have gone negative by 30 kb/d in August. In Italy, demand grew by 45 kb/d in July, supported by strong naphtha deliveries. Gasoline and gasoil demand contracted, however. Preliminary data point to a small contraction in total demand in August. Poland posted strong total oil demand growth of 90 kb/d in July, accounted mostly for by gasoil, which grew by 80 kb/d. Strong gasoil growth started in August 2016, partly reflecting better data collection. The y-o-y difference should therefore start to narrow in August 2017. European oil demand should significantly slow in August compared to the previous few months. After an average increase of 540 kb/d in May-July, demand should contract by 210kb/d in August, according to preliminary data. Overall, we expect growth of 140 kb/d in 3Q17 and 100 kb/d in 4Q17. For 2017 and 2018, European oil demand is forecast to grow by 210 kb/d and 50 kb/d, respectively. Asia Oceania Asia Oceania demand gained 165 kb/d y-o-y in July. Gasoil demand, in particular, increased by 195 kb/d. Gasoline demand increased by 35 kb/d y-o-y. Preliminary data point to a contraction of 80 kb/d in regional demand in August.
7.0
7.5
8.0
8.5
9.0
9.5
10.0
JAN APR JUL OCT JAN
mb/d OECD Asia Oceania: Total Products Demand
Range 12-16 20162017 5-year avg
3.0
3.5
4.0
4.5
5.0
5.5
JAN APR JUL OCT JAN
mb/d Japan: Total Products Demand
Range 12-16 20162017 5-year avg
Japanese oil demand dropped by 140 kb/d y-o-y in July and is expected to further contract by 40 kb/d in August. Gasoline and gasoil were both weak in August, dropping by 40 kb/d and 25 kb/d respectively. In South Korea, demand rose by 160 kb/d y-o-y in July on strong naphtha deliveries but dropped by 70 kb/d in August as record rains and floods triggered a fall in transportation demand and slowed down construction activity. Motor gasoline demand fell by 25 kb/d while diesel demand contracted by 45 kb/d. In Australia, gasoil demand rose by 95 kb/d y-o-y in July after an increase of 100 kb/d in June. Gasoil demand has been increasing since the start of 2017, in part supported by the restart of operations at several coal mines at the end of 2016. Asia OECD oil demand is expected to decrease by 20 kb/d in 2017 and 135 kb/d in 2018.
DEMAND INTERNATIONAL ENERGY AGENCY - OIL MARKET REPORT
10 12 OCTOBER 2017
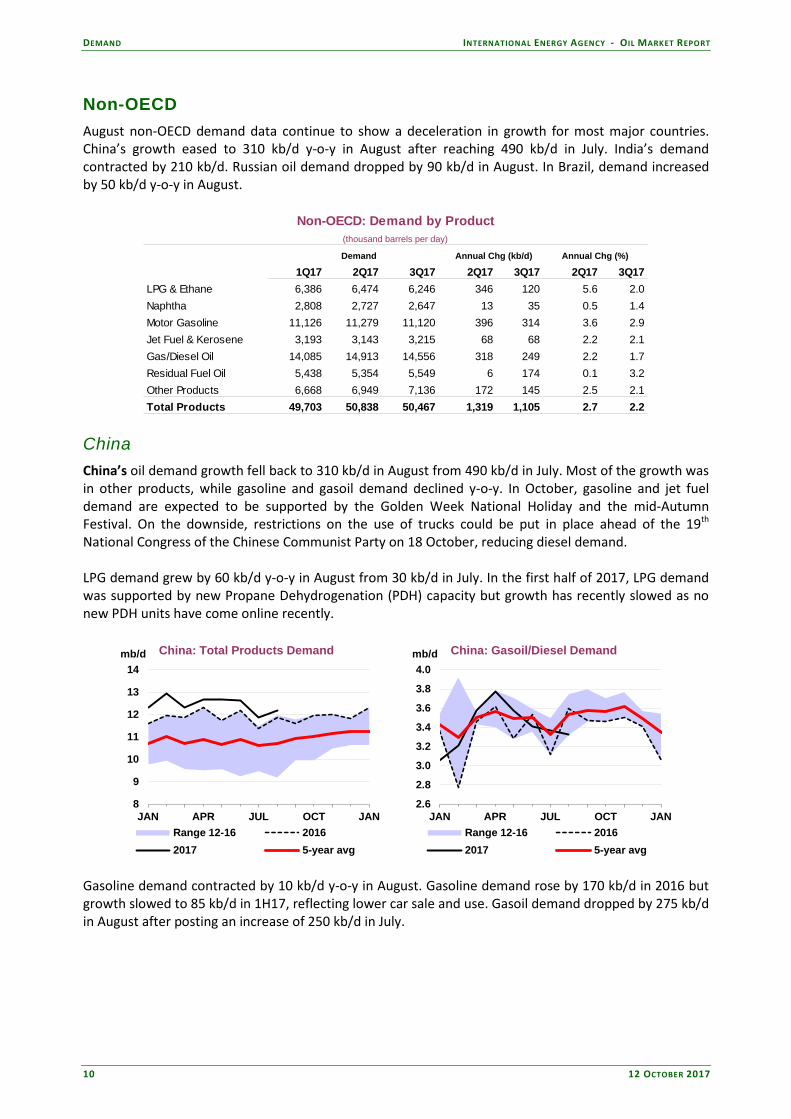
Non-OECD August non-OECD demand data continue to show a deceleration in growth for most major countries. China’s growth eased to 310 kb/d y-o-y in August after reaching 490 kb/d in July. India’s demand contracted by 210 kb/d. Russian oil demand dropped by 90 kb/d in August. In Brazil, demand increased by 50 kb/d y-o-y in August.
Non-OECD: Demand by Product(thousand barrels per day)
Annual Chg (kb/d) Annual Chg (%)
1Q17 2Q17 3Q17 2Q17 3Q17 2Q17 3Q17LPG & Ethane 6,386 6,474 6,246 346 120 5.6 2.0Naphtha 2,808 2,727 2,647 13 35 0.5 1.4Motor Gasoline 11,126 11,279 11,120 396 314 3.6 2.9Jet Fuel & Kerosene 3,193 3,143 3,215 68 68 2.2 2.1Gas/Diesel Oil 14,085 14,913 14,556 318 249 2.2 1.7Residual Fuel Oil 5,438 5,354 5,549 6 174 0.1 3.2Other Products 6,668 6,949 7,136 172 145 2.5 2.1Total Products 49,703 50,838 50,467 1,319 1,105 2.7 2.2
Demand
China China’s oil demand growth fell back to 310 kb/d in August from 490 kb/d in July. Most of the growth was in other products, while gasoline and gasoil demand declined y-o-y. In October, gasoline and jet fuel demand are expected to be supported by the Golden Week National Holiday and the mid-Autumn Festival. On the downside, restrictions on the use of trucks could be put in place ahead of the 19th National Congress of the Chinese Communist Party on 18 October, reducing diesel demand. LPG demand grew by 60 kb/d y-o-y in August from 30 kb/d in July. In the first half of 2017, LPG demand was supported by new Propane Dehydrogenation (PDH) capacity but growth has recently slowed as no new PDH units have come online recently.
8
9
10
11
12
13
14
JAN APR JUL OCT JAN
mb/d China: Total Products Demand
Range 12-16 20162017 5-year avg
2.6
2.8
3.0
3.2
3.4
3.6
3.8
4.0
JAN APR JUL OCT JAN
mb/d China: Gasoil/Diesel Demand
Range 12-16 20162017 5-year avg
Gasoline demand contracted by 10 kb/d y-o-y in August. Gasoline demand rose by 170 kb/d in 2016 but growth slowed to 85 kb/d in 1H17, reflecting lower car sale and use. Gasoil demand dropped by 275 kb/d in August after posting an increase of 250 kb/d in July.

INTERNATIONAL ENERGY AGENCY - OIL MARKET REPORT DEMAND
12 OCTOBER 2017 11
0.5
1.0
1.5
2.0
JAN APR JUL OCT JAN
mb/d China: LPG Demand
Range 12-16 20162017 5-year avg
1.5
2.0
2.5
3.0
3.5
JAN APR JUL OCT JAN
mb/d China: Motor Gasoline Demand
Range 12-16 20162017 5-year avg
Looking at 2017 as a whole, we expect Chinese oil demand growth to accelerate to 540 kb/d from 310 kb/d in 2016, supported by the strength in 1H17. For 2018, we expect growth to slow to 325 kb/d.
China: Demand by Product
(thousand barrels per day)
Annual Chg (kb/d) Annual Chg (%)
2016 2017 2018 2017 2018 2017 2018LPG & Ethane 1,531 1,663 1,706 132 43 8.6 2.6Naphtha 1,093 1,122 1,143 28 22 2.6 1.9Motor Gasoline 2,870 2,963 3,023 92 61 3.2 2.1Jet Fuel & Kerosene 656 703 734 47 31 7.2 4.5Gas/Diesel Oil 3,386 3,457 3,552 71 95 2.1 2.8Residual Fuel Oil 339 362 359 23 -2 6.8 -0.7Other Products 1,993 2,139 2,213 146 74 7.3 3.4Total Products 11,868 12,408 12,731 540 324 4.6 2.6
Demand
Other Non-OECD In this Report, we have revised down our estimate for Venezuelan oil demand in 2016. Monthly data are often difficult to interpret but after examining consumption indicators for main products in 2016 we have revised down our estimate for demand by 65 kb/d. IMF data shows that Venezuela’s GDP contracted by 14% in 2015 and 19% in 2016.
3.0
3.5
4.0
4.5
5.0
5.5
JAN APR JUL OCT JAN
mb/d India: Total Products Demand
Range 12-16 20162017 5-year avg
0.4
0.5
0.6
0.7
0.8
0.9
JAN APR JUL OCT JAN
mb/d India: LPG Demand
Range 12-16 20162017 5-year avg
Indian oil demand contracted by 210 kb/d y-o-y in August, after a drop of 10 kb/d in July. Gasoil demand contracted 60 kb/d y-o-y, with diesel demand impacted by severe flooding, which reduced freight and manufacturing activities. Seasonal rainfall caused floods in Assam, West Bengal, Bihar and Gujarat
DEMAND INTERNATIONAL ENERGY AGENCY - OIL MARKET REPORT
12 12 OCTOBER 2017
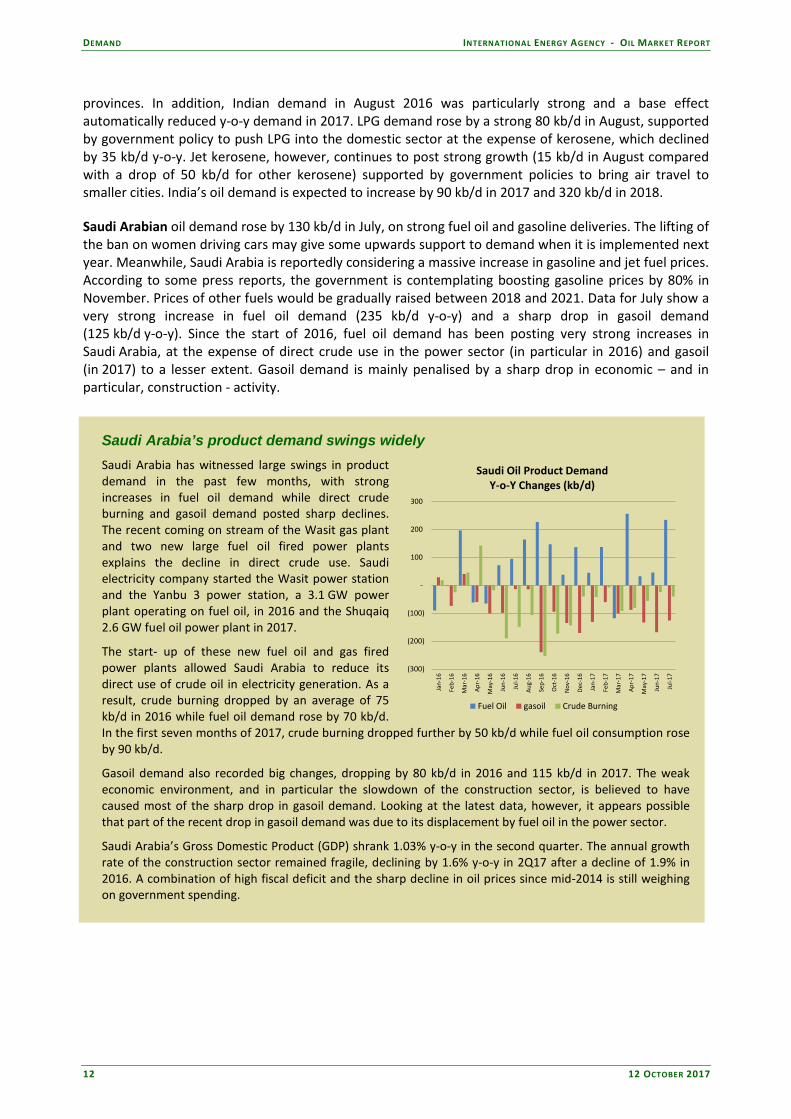
provinces. In addition, Indian demand in August 2016 was particularly strong and a base effect automatically reduced y-o-y demand in 2017. LPG demand rose by a strong 80 kb/d in August, supported by government policy to push LPG into the domestic sector at the expense of kerosene, which declined by 35 kb/d y-o-y. Jet kerosene, however, continues to post strong growth (15 kb/d in August compared with a drop of 50 kb/d for other kerosene) supported by government policies to bring air travel to smaller cities. India’s oil demand is expected to increase by 90 kb/d in 2017 and 320 kb/d in 2018. Saudi Arabian oil demand rose by 130 kb/d in July, on strong fuel oil and gasoline deliveries. The lifting of the ban on women driving cars may give some upwards support to demand when it is implemented next year. Meanwhile, Saudi Arabia is reportedly considering a massive increase in gasoline and jet fuel prices. According to some press reports, the government is contemplating boosting gasoline prices by 80% in November. Prices of other fuels would be gradually raised between 2018 and 2021. Data for July show a very strong increase in fuel oil demand (235 kb/d y-o-y) and a sharp drop in gasoil demand (125 kb/d y-o-y). Since the start of 2016, fuel oil demand has been posting very strong increases in Saudi Arabia, at the expense of direct crude use in the power sector (in particular in 2016) and gasoil (in 2017) to a lesser extent. Gasoil demand is mainly penalised by a sharp drop in economic – and in particular, construction - activity.
Saudi Arabia’s product demand swings widely Saudi Arabia has witnessed large swings in product demand in the past few months, with strong increases in fuel oil demand while direct crude burning and gasoil demand posted sharp declines. The recent coming on stream of the Wasit gas plant and two new large fuel oil fired power plants explains the decline in direct crude use. Saudi electricity company started the Wasit power station and the Yanbu 3 power station, a 3.1 GW power plant operating on fuel oil, in 2016 and the Shuqaiq 2.6 GW fuel oil power plant in 2017.
The start- up of these new fuel oil and gas fired power plants allowed Saudi Arabia to reduce its direct use of crude oil in electricity generation. As a result, crude burning dropped by an average of 75 kb/d in 2016 while fuel oil demand rose by 70 kb/d. In the first seven months of 2017, crude burning dropped further by 50 kb/d while fuel oil consumption rose by 90 kb/d.
Gasoil demand also recorded big changes, dropping by 80 kb/d in 2016 and 115 kb/d in 2017. The weak economic environment, and in particular the slowdown of the construction sector, is believed to have caused most of the sharp drop in gasoil demand. Looking at the latest data, however, it appears possible that part of the recent drop in gasoil demand was due to its displacement by fuel oil in the power sector.
Saudi Arabia’s Gross Domestic Product (GDP) shrank 1.03% y-o-y in the second quarter. The annual growth rate of the construction sector remained fragile, declining by 1.6% y-o-y in 2Q17 after a decline of 1.9% in 2016. A combination of high fiscal deficit and the sharp decline in oil prices since mid-2014 is still weighing on government spending.
(300)
(200)
(100)
-
100
200
300
Jan-
16
Feb-
16
Mar
-16
Apr
-16
May
-16
Jun-
16
Jul-1
6
Aug
-16
Sep-
16
Oct
-16
Nov
-16
Dec
-16
Jan-
17
Feb-
17
Mar
-17
Apr
-17
May
-17
Jun-
17
Jul-1
7
Saudi Oil Product DemandY-o-Y Changes (kb/d)
Fuel Oil gasoil Crude Burning
INTERNATIONAL ENERGY AGENCY - OIL MARKET REPORT DEMAND
12 OCTOBER 2017 13
2.0
2.5
3.0
3.5
4.0
JAN APR JUL OCT JAN
mb/d Saudi Arabia: Total Products Demand
Range 12-16 20162017 5-year avg
0.0
0.2
0.4
0.6
0.8
1.0
JAN APR JUL OCT JAN
mb/d Saudi Arabia: Residual Fuel Demand
Range 12-16 20162017 5-year avg
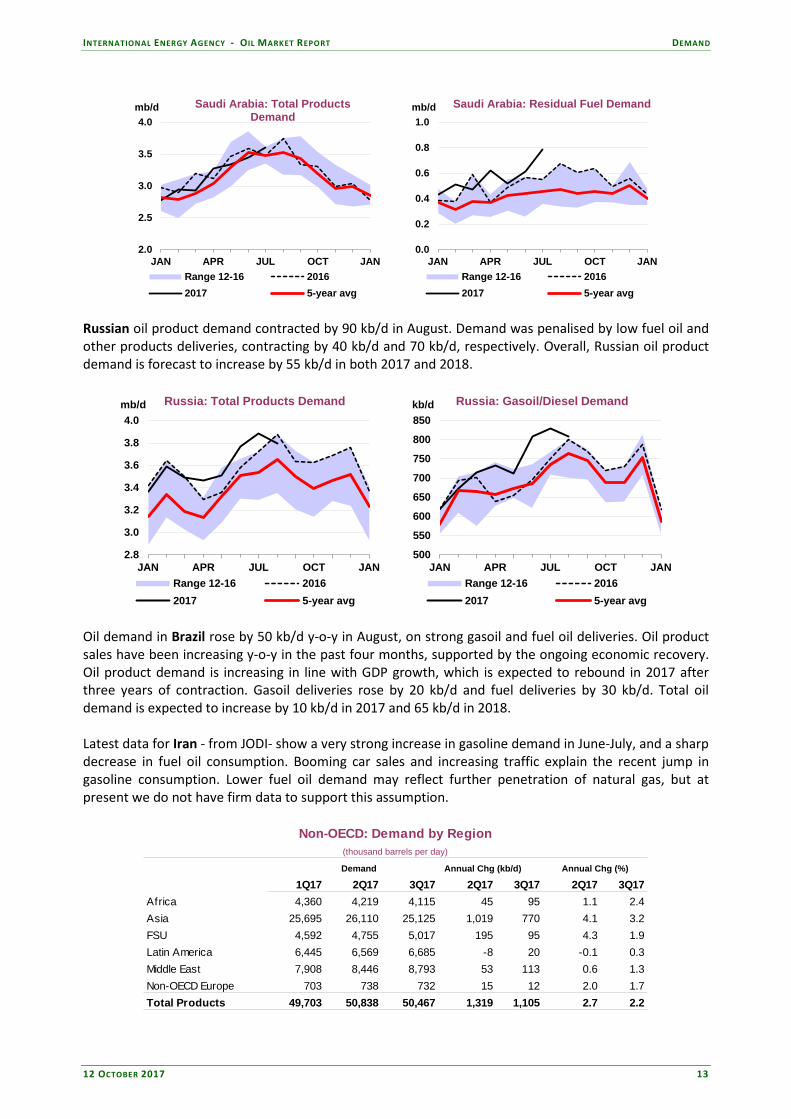
Russian oil product demand contracted by 90 kb/d in August. Demand was penalised by low fuel oil and other products deliveries, contracting by 40 kb/d and 70 kb/d, respectively. Overall, Russian oil product demand is forecast to increase by 55 kb/d in both 2017 and 2018.
2.8
3.0
3.2
3.4
3.6
3.8
4.0
JAN APR JUL OCT JAN
mb/d Russia: Total Products Demand
Range 12-16 20162017 5-year avg
500
550
600
650
700
750
800
850
JAN APR JUL OCT JAN
kb/d Russia: Gasoil/Diesel Demand
Range 12-16 20162017 5-year avg
Oil demand in Brazil rose by 50 kb/d y-o-y in August, on strong gasoil and fuel oil deliveries. Oil product sales have been increasing y-o-y in the past four months, supported by the ongoing economic recovery. Oil product demand is increasing in line with GDP growth, which is expected to rebound in 2017 after three years of contraction. Gasoil deliveries rose by 20 kb/d and fuel deliveries by 30 kb/d. Total oil demand is expected to increase by 10 kb/d in 2017 and 65 kb/d in 2018. Latest data for Iran - from JODI- show a very strong increase in gasoline demand in June-July, and a sharp decrease in fuel oil consumption. Booming car sales and increasing traffic explain the recent jump in gasoline consumption. Lower fuel oil demand may reflect further penetration of natural gas, but at present we do not have firm data to support this assumption.
Non-OECD: Demand by Region(thousand barrels per day)
1Q17 2Q17 3Q17 2Q17 3Q17 2Q17 3Q17Africa 4,360 4,219 4,115 45 95 1.1 2.4Asia 25,695 26,110 25,125 1,019 770 4.1 3.2FSU 4,592 4,755 5,017 195 95 4.3 1.9Latin America 6,445 6,569 6,685 -8 20 -0.1 0.3Middle East 7,908 8,446 8,793 53 113 0.6 1.3Non-OECD Europe 703 738 732 15 12 2.0 1.7Total Products 49,703 50,838 50,467 1,319 1,105 2.7 2.2
Demand Annual Chg (kb/d) Annual Chg (%)
SUPPLY INTERNATIONAL ENERGY AGENCY - OIL MARKET REPORT
14 12 OCTOBER 2017
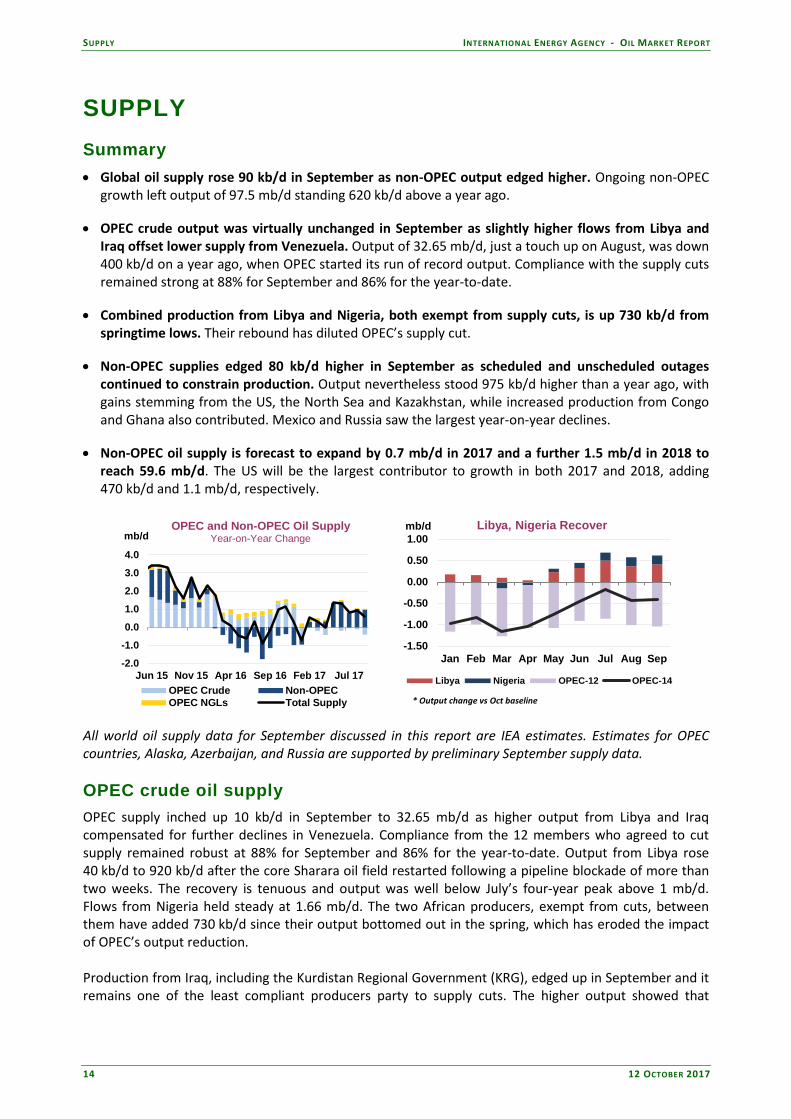
SUPPLY Summary • Global oil supply rose 90 kb/d in September as non-OPEC output edged higher. Ongoing non-OPEC
growth left output of 97.5 mb/d standing 620 kb/d above a year ago.
• OPEC crude output was virtually unchanged in September as slightly higher flows from Libya and Iraq offset lower supply from Venezuela. Output of 32.65 mb/d, just a touch up on August, was down 400 kb/d on a year ago, when OPEC started its run of record output. Compliance with the supply cuts remained strong at 88% for September and 86% for the year-to-date.
• Combined production from Libya and Nigeria, both exempt from supply cuts, is up 730 kb/d from springtime lows. Their rebound has diluted OPEC’s supply cut.
• Non-OPEC supplies edged 80 kb/d higher in September as scheduled and unscheduled outages continued to constrain production. Output nevertheless stood 975 kb/d higher than a year ago, with gains stemming from the US, the North Sea and Kazakhstan, while increased production from Congo and Ghana also contributed. Mexico and Russia saw the largest year-on-year declines.
• Non-OPEC oil supply is forecast to expand by 0.7 mb/d in 2017 and a further 1.5 mb/d in 2018 to reach 59.6 mb/d. The US will be the largest contributor to growth in both 2017 and 2018, adding 470 kb/d and 1.1 mb/d, respectively.
-2.0
-1.0
0.0
1.0
2.0
3.0
4.0
Jun 15 Nov 15 Apr 16 Sep 16 Feb 17 Jul 17
mb/dOPEC and Non-OPEC Oil Supply
Year-on-Year Change
OPEC Crude Non-OPECOPEC NGLs Total Supply
-1.50
-1.00
-0.50
0.00
0.50
1.00
Jan Feb Mar Apr May Jun Jul Aug Sep
mb/d Libya, Nigeria Recover
Libya Nigeria OPEC-12 OPEC-14
* Output change vs Oct baseline All world oil supply data for September discussed in this report are IEA estimates. Estimates for OPEC countries, Alaska, Azerbaijan, and Russia are supported by preliminary September supply data. OPEC crude oil supply OPEC supply inched up 10 kb/d in September to 32.65 mb/d as higher output from Libya and Iraq compensated for further declines in Venezuela. Compliance from the 12 members who agreed to cut supply remained robust at 88% for September and 86% for the year-to-date. Output from Libya rose 40 kb/d to 920 kb/d after the core Sharara oil field restarted following a pipeline blockade of more than two weeks. The recovery is tenuous and output was well below July’s four-year peak above 1 mb/d. Flows from Nigeria held steady at 1.66 mb/d. The two African producers, exempt from cuts, between them have added 730 kb/d since their output bottomed out in the spring, which has eroded the impact of OPEC’s output reduction. Production from Iraq, including the Kurdistan Regional Government (KRG), edged up in September and it remains one of the least compliant producers party to supply cuts. The higher output showed that

INTERNATIONAL ENERGY AGENCY - OIL MARKET REPORT SUPPLY
12 OCTOBER 2017 15
heightened tension over the Kurdish region's independence referendum has yet to affect exports from northern Iraq through Turkey (see Iraqi output rises despite threats to KRG oil). Saudi Arabia pumped a touch less in September as lower domestic consumption more than offset slightly higher crude shipments to world markets. In Venezuela, production declined by 50 kb/d as imports of diluent to blend with heavy Orinoco oil fell because of Hurricane Harvey. Supply eased a touch in Angola and held steady in Iran, which received a slight increase under the OPEC agreement.
29
30
31
32
33
34
Jan Mar May Jul Sep Nov Jan
mb/d OPEC Crude Supply
2014 2015 2016 2017
(3)
9 4 18
(606)
(14)(151) (249)
(1,000)
(800)
(600)
(400)
(200)
-
(20)
-
20
40
60
80
Saudi Iran Iraq Russia
kb/d$ mln/d Jan-Sept 2017 vs 4Q16 change
Change in gross crude oil revenuesChange in crude oil production (RHS)
For Saudi Arabia and Russia, who worked together to forge the OPEC/non-OPEC agreement, there is a strong economic incentive to support oil prices by limiting supply. Their relationship was strengthened by King Salman’s early October visit to Moscow, the first by a Saudi monarch. For 2017 to date, OPEC as a whole and Russia have earned more while pumping less. Libya and Nigeria, spared from cuts, account for half of OPEC’s higher gross revenues. However, Saudi Arabia, which is shouldering the cut, earned slightly less than in 4Q16 – when Middle East producers and Russia pumped at record rates ahead of the output deal.
Aug 2017 Sep 2017 SeptemberSupply Supply Actual Cut2
Algeria 1.06 1.06 1.09 -0.050 -0.03 58% 58% 62%Angola 1.68 1.66 1.75 -0.078 -0.09 91% 117% 129%Ecuador 0.54 0.54 0.55 -0.026 -0.01 31% 31% 65%Equatorial Guinea 0.12 0.13 0.14 -0.012 -0.01 167% 83% 118%Gabon 0.18 0.19 0.20 -0.009 -0.01 244% 133% 41%Iran3
3.84 3.84 3.71 0.090 0.13 NA NA NAIraq 4.49 4.52 4.56 -0.210 -0.04 34% 20% 34%Kuwait 2.70 2.71 2.84 -0.131 -0.13 105% 98% 99%Qatar 0.61 0.61 0.65 -0.030 -0.04 127% 127% 119%Saudi Arabia 9.96 9.94 10.54 -0.486 -0.60 120% 124% 123%UAE 2.93 2.93 3.01 -0.139 -0.08 60% 60% 52%Venezuela 1.99 1.94 2.07 -0.095 -0.13 81% 134% 30%Total OPEC 12 30.10 30.07 31.11 -1.176 -1.04 86% 88% 86%Libya4 0.88 0.92Nigeria4 1.66 1.66Total OPEC 32.64 32.65
1 Based on October 2016 OPEC secondary source figures, except Angola which is based on September 2016.
2 From OPEC supply baseline.
3 Iran was given a slight increase.
4 Libya and Nigeria are exempt from cuts.
September Compliance
2017 Average Compliance
August Compliance
Supply Baseline1 Agreed Cut
(million barrels per day)OPEC Crude Production
Total OPEC crude output in September was down 400 kb/d on a year ago, when the group’s Middle East members started to ramp up. Saudi Arabia (-660 kb/d), Venezuela (-230 kb/d), the UAE (-220 kb/d) and Kuwait (-210 kb/d) showed the largest year-on-year (y-o-y) declines. Libyan production was up 560 kb/d y-o-y, Nigerian supply stood 370 kb/d higher while Iranian flows were up 130 kb/d.

SUPPLY INTERNATIONAL ENERGY AGENCY - OIL MARKET REPORT
16 12 OCTOBER 2017
As for the market balances, the call on OPEC crude rises to 32.98 mb/d in 4Q17, 0.33 mb/d above September’s output, but falls to 31.87 mb/d in 1Q18. Supply from Saudi Arabia dipped 20 kb/d to 9.94 mb/d, as a decline in domestic consumption more than offset slightly higher crude shipments to world markets. The Kingdom has pumped below its 10.06 mb/d supply target since the OPEC cut commenced in January. Preliminary tanker tracking data suggest that exports were around 6.7 mb/d during September, up slightly on August. Exports typically rebound in the autumn after falling during the summer when more crude is burned in power plants and as global crude demand from refiners rises following maintenance. Saudi shipments are due to rise, although Aramco said that despite “very strong demand” for its crude of more than 7.7 mb/d in November, it would limit loadings to 7.15 mb/d in order to stay within its OPEC supply target. Saudi Aramco described the 560 kb/d cut in customer requests for November as “unprecedented”.
9.4
9.6
9.8
10.0
10.2
10.4
10.6
10.8
Jan Mar May Jul Sep Nov Jan
mb/d Saudi Arabia Crude Supply
2014 2015 2016 2017
200300400500600700800kb/d Saudi Implied Crude Direct Burn
5 year average Jan-May 2017
Source: JODI
The latest official data from the Joint Organisations Data Initiative (JODI) show Saudi shipments of crude during July sank to 6.69 mb/d – the lowest since August 2014. During the first seven months of this year, exports were roughly 7.1 mb/d versus 7.5 mb/d in the same period of 2016, according to JODI figures. To stay below its OPEC supply target, Saudi Aramco has made sharp cuts in loadings to clients in the US and to a lesser extent to Europe, while sparing most of its customers in Asia. It raised the official selling price differential for November loadings of light crude into Asia, but made sharp cuts on grades bound for Northwest Europe and a slight reduction to light grades for the US. On the domestic front, the amount of crude burned in power plants eased to 660 kb/d in July versus 680 kb/d in June as the Kingdom sought to optimize the gas processing capacity it brought online a year ago. Crude oil for power generation is also increasingly being replaced by fuel oil (see Demand). In 2016, about 630 kb/d of crude was used in power plants during the peak 2Q-3Q period. Saudi Aramco’s long-awaited public listing of up to 5% of its shares is on track to take place in 2H18, according to Energy Minister Khalid al-Falih. The initial public offering is the main plank of Vision 2030, a bold reform plan to diversify the Saudi economy beyond oil. Output in neighbouring Gulf countries was broadly steady. Production in both the UAE and Qatar was flat at 2.93 mb/d and 610 kb/d, respectively. Supply from Kuwait rose a touch to 2.71 mb/d. For Iran, the focus is on the possibility of the US withdrawing from the nuclear deal agreed in 2015. The easing of sanctions allowed by the deal has seen Iran boost production above 3.8 mb/d from around 3 mb/d at the start of 2016 and more than double exports. Uncertainty around the nuclear deal is growing at the same time as Iran seeks to attract foreign investors into its oil and gas sector. Total has already finalised a deal for the South Pars 11 project, and Tehran hopes to secure more deals by the end of 1Q18. Meanwhile, output in September held steady at 3.84 mb/d.

INTERNATIONAL ENERGY AGENCY - OIL MARKET REPORT SUPPLY
12 OCTOBER 2017 17
Iran is nonetheless pressing ahead with development of the West of Karun region, the backbone of its expansion effort. Output from the southern section of the Azadegan field is expected to rise by 65 kb/d to 145 kb/d by the end of 1Q18. International and Iranian companies are now seeking to form consortia to bid for a project to boost the entire Azadegan field to around 650 kb/d. Pre-selected companies have until the end of January to submit bids for the field that straddles the border with Iraq’s Majnoon. Elsewhere in West of Karun, some 25 kb/d is due to start up at the South Yaran field by the end of this year while Yadavaran, which pumps around 115 kb/d, is expected to be offered to investors under a new upstream contract. Iran is expected to launch its new West of Karun crude next year, with production of the heavy grade now just under 300 kb/d.
2.6
2.8
3.0
3.2
3.4
3.6
3.8
4.0
Jan Mar May Jul Sep Nov Jan
mb/d Iran Crude Supply
2014 2015 2016 2017
0.0
0.5
1.0
1.5
2.0
2.5
Sep 15 Jan 16 May 16 Sep 16 Jan 17 May 17 Sep 17
mb/d Iran Crude Oil Loadings
Europe China India Korea Japan Other
Source: Lloyd's List Intelligence
As for crude oil sales, shipments during September dipped by around 40 kb/d to 2.42 mb/d as customers in China and Europe reduced liftings, according to preliminary tanker tracking data. The amount of oil stored at sea was steady at 3 mb – down from 26 mb a year ago. Exports to China fell by 170 kb/d and dropped by 120 kb/d to Europe. Loadings rose by 130 kb/d to India and by 70 kb/d to Japan. As for condensates loaded from Assaluyeh, Iranian officials pegged September exports at more than 400 kb/d. Shipments are expected to fall to around 300 kb/d in October, due to maintenance at the South Pars gas field, which produces condensates. The work could reportedly stretch through November. South Korea is Iran’s biggest lifter of condensates, while the UAE and Japan are also regular buyers.
Iraqi output rises despite threats to KRG oil The Kurdish region’s independence referendum on 25 September has driven a wedge between Erbil and Baghdad although production and exports are flowing as normal. Output during September rose by 30 kb/d to 4.52 mb/d as exports edged higher from southern Iraq. Shipments from the northern, semi-autonomous region through Turkey were relatively steady at 580 kb/d.
2.0
2.5
3.0
3.5
4.0
4.5
5.0
Jun-15 Oct-15 Feb-16 Jun-16 Oct-16 Feb-17 Jun-17
mb/d Iraqi Production and Exports
Basra exports Northern exportsProduction
0100200300400500600700kb/d Northern Iraq Exports
Italy Croatia Greece IsraelOthers Spain UAE Cyprus
Source: Kpler
Supported by neighbouring Turkey and Iran, Baghdad has called for the KRG to cancel the referendum result or face sanctions, international isolation and possible military strikes. For its part, Baghdad swiftly sought to

SUPPLY INTERNATIONAL ENERGY AGENCY - OIL MARKET REPORT
18 12 OCTOBER 2017
Iraqi output rises despite threats to KRG oil (continued)
reclaim control in the north. Prime Minister Haider al-Abadi and parliament have demanded the return of control over oil fields that belong to the federal North Oil Co (NOC) and that all oil sales be handled by the State Oil Marketing Organization (SOMO). Although Baghdad officially calls Kurdish oil sales illegal, it has turned a blind eye to most trade. Baghdad also plans to repair and reopen its oil pipeline from the fields of Kirkuk to Ceyhan in Turkey in a bid to largely bypass Kurdistan. Iraq halted use of the route in 2014 after the so-called Islamic State (IS) swept through the region, but hopes to ship between 250 kb/d to 400 kb/d through the line. Repairs are likely to take some time as the network has been badly damaged.
For now, exports from northern Iraq continue to flow via the KRG’s oil pipeline that links to the twin Kirkuk-Ceyhan pipeline at Fishkabour on the border with Turkey. But Ankara, which fears independence will inflame its Kurdish population, has threatened to turn off the pipeline that ships Kurdish-controlled crude across its territory to the Mediterranean. Any move to halt flows would be crippling for Erbil, which exports all of its crude - providing most of its income – through Turkey.
Some 600 kb/d, roughly half from the Kirkuk field that is overseen by Kurdish forces but claimed by Baghdad, is piped via Turkey. Another 40 kb/d is sent to Turkey by truck from Gulf Keystone's Shaikan field. For Baghdad, the referendum intensifies long-running feuds over the status of oil-rich Kirkuk, the KRG's right to independent oil sales and revenue sharing. The KRG had been shpping a share of exports on behalf of the federal government, but no transfers have occurred since June.
A halt to flows would also cause problems for mainly European buyers of crude from northern Iraq. Italy is the biggest importer, with Croatia, Greece, Spain and Israel ranking as regular lifters. Foreign companies drilling for oil in Kurdistan must also be concerned. The KRG only recently settled debts with DNO and Genel. Just ahead of the referendum, Rosneft expanded its energy deal with the KRG. It is moving ahead with plans to invest in Kurdistan's crude oil pipeline to Turkey, and intends to finance a gas export pipeline. The KRG and Rosneft struck a wide-ranging deal in February including the development of five oil and gas blocks, investment in the oil export pipeline to Turkey, and purchases of crude exports from the KRG.
As for the upstream, the fields that Baghdad is demanding that the KRG return include Bai Hassan and Avana dome, along with Ain Zalah, Sufaya and Butmah. Kurdistan produces just under 600 kb/d from fields under its control: nearly half is pumped from the Avana dome and Bai Hassan, which the KRG has controlled since Kurdish Peshmerga forces secured the area after IS militants swept through northern Iraq in 2014. The KRG has exported that oil independently since then.
Iraqi Oil Minister Jabbar al-Luaibi has instructed NOC to raise output from the northern Nineveh province to more than 30 kb/d. Output from the fields, some of which are disputed by the KRG, is expected to meet higher demand from local refineries in areas formerly under the control of IS. Oil fields in the region include Qayara, now pumping roughly 10 kb/d, as well as Sulfaya, Ain Zalah and Butmah – each with capacity of around 10 kb/d. The upstream plan follows the restart of the 20 kb/d Qayara refinery near Mosul, the provincial capital, which is now running at half capacity.

INTERNATIONAL ENERGY AGENCY - OIL MARKET REPORT SUPPLY
12 OCTOBER 2017 19
Iraqi output rises despite threats to KRG oil (continued) Operations have also resumed at the 16 kb/d Haditha refinery in the western Anbar province. Luaibi also called for the urgent rehabilitation of damaged oil installations and fields in Kirkuk and Salah-al-Din.
As for southern Iraq, which produces the lion’s share of exports, Royal Dutch Shell’s plan to exit the 220 kb/d Majnoon oil field could make it more challenging for Baghdad to achieve its longer term plans to boost capacity. Shell had aimed to raise Majnoon's output to 420 kb/d within three years. It holds a 45% stake in the field that it operates under a technical service contract (TSC). Petronas holds a 30% stake, while the Iraqi government has 25%. Luaibi said Chevron and Total have expressed willingness to work on the field. The Iraqi oil minister also said Exxon Mobil was in advanced talks on an integrated water injection project that is crucial to sustaining output from the south. The scheme includes the development of the Bin Umar, Nassiriya, Luhais, Ratawi and Tuba fields. The international oil companies that are running Iraq’s southern mega-projects requested a review of the TSCs after the oil price collapse at the end of 2014 strained Baghdad’s budget and impeded its ability to repay them.
Libyan production bounced back in September, edging up 40 kb/d to 920 kb/d after output from its largest field, Sharara, restarted following a pipeline blockade of more than two weeks. Sharara produced for most of September, but an armed group forced yet another brief closure in early October. The 300 kb/d capacity field, crucial to Libya’s recovery, has been producing at just over 200 kb/d. A sustained comeback – even to the recent peak of 1 mbd reached in July - may prove difficult given the ongoing security challenges. The National Oil Corp is working to prevent rebel groups taking over installations and shutting down oil fields.
0.00.20.40.60.81.01.21.41.6
2011 2012 2013 2014 2015 2016 2017
mb/d Libya Crude Supply
1.0
1.2
1.4
1.6
1.8
2.0
2.2
2011 2012 2013 2014 2015 2016 2017
mb/d Nigeria Crude Supply
Nigerian production held at 1.66 mb/d during September, the highest level since February 2016, before militants stepped up their oil sector attacks in the Niger Delta. A lull in the violence has allowed flows to rise steadily and to stand 370 kb/d above September 2016, when production was at a three-decade low. Militant attacks have fallen since early this year after the government intensified peace talks with rebel leaders. Civil conflict and targeted attacks on its oil sector had spared Nigeria from OPEC cuts. Now that production is recovering, the oil minister has said that it will not rise above 1.8 mb/d. Production in Angola eased by 20 kb/d in September to 1.66 million b/d, which pushed compliance with OPEC cuts to 117%. This apparently exemplary discipline is mostly due to declines from ageing oil fields. Seeking to arrest the decline, Sonangol aims to review and possibly sweeten commercial terms offered to oil investors and reduce excessive bureaucracy. Angola’s new president, Joao Lourenco, has merged the ministries of mineral resources and petroleum, appointing Diamantino Pedro Azevedo as its head. Crude oil production from Gabon crept up 10 kb/d in September to 190 kb/d, while supply from Equatorial Guinea inched up to 130 kb/d. Algerian production was steady at 1.06 mb/d. Output from Venezuela fell 50 kb/d to 1.94 mb/d after Hurricane Harvey cut imports of diluents needed to process extra heavy oil from the Orinoco Belt. In any event, the worsening economic and political crisis has sped the decline in production as operations slow at Orinoco upgraders. The situation is
SUPPLY INTERNATIONAL ENERGY AGENCY - OIL MARKET REPORT
20 12 OCTOBER 2017
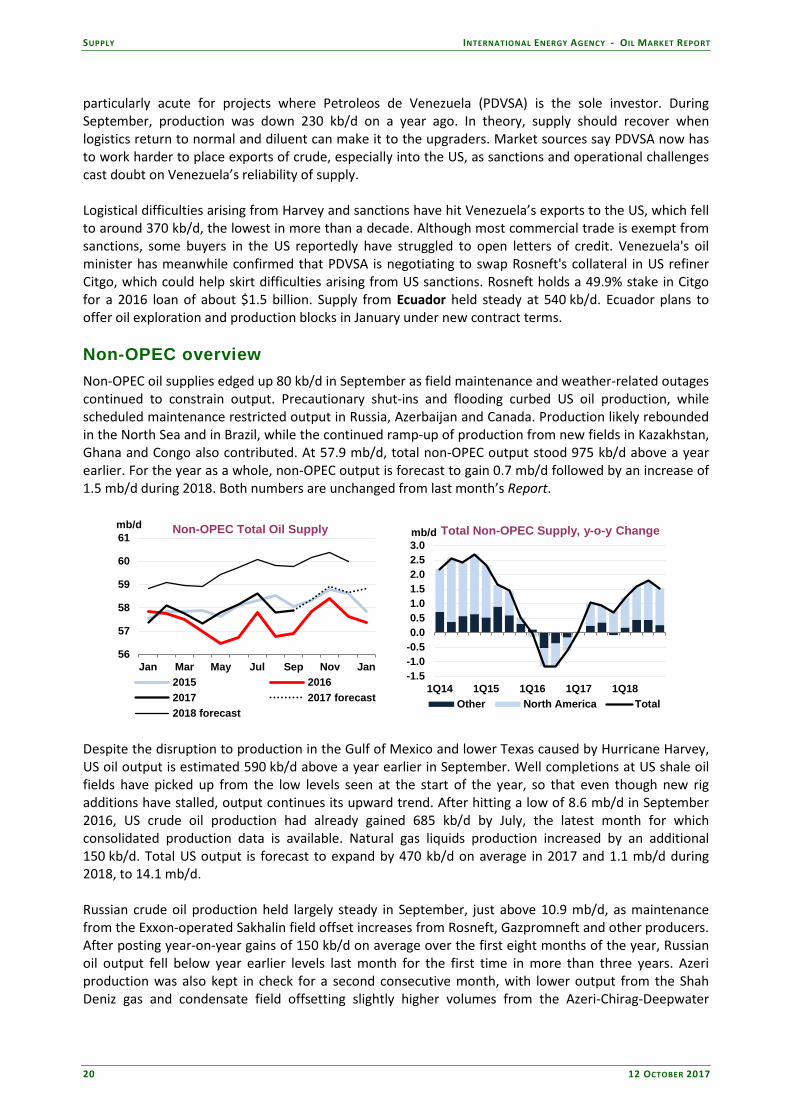
particularly acute for projects where Petroleos de Venezuela (PDVSA) is the sole investor. During September, production was down 230 kb/d on a year ago. In theory, supply should recover when logistics return to normal and diluent can make it to the upgraders. Market sources say PDVSA now has to work harder to place exports of crude, especially into the US, as sanctions and operational challenges cast doubt on Venezuela’s reliability of supply. Logistical difficulties arising from Harvey and sanctions have hit Venezuela’s exports to the US, which fell to around 370 kb/d, the lowest in more than a decade. Although most commercial trade is exempt from sanctions, some buyers in the US reportedly have struggled to open letters of credit. Venezuela's oil minister has meanwhile confirmed that PDVSA is negotiating to swap Rosneft's collateral in US refiner Citgo, which could help skirt difficulties arising from US sanctions. Rosneft holds a 49.9% stake in Citgo for a 2016 loan of about $1.5 billion. Supply from Ecuador held steady at 540 kb/d. Ecuador plans to offer oil exploration and production blocks in January under new contract terms. Non-OPEC overview Non-OPEC oil supplies edged up 80 kb/d in September as field maintenance and weather-related outages continued to constrain output. Precautionary shut-ins and flooding curbed US oil production, while scheduled maintenance restricted output in Russia, Azerbaijan and Canada. Production likely rebounded in the North Sea and in Brazil, while the continued ramp-up of production from new fields in Kazakhstan, Ghana and Congo also contributed. At 57.9 mb/d, total non-OPEC output stood 975 kb/d above a year earlier. For the year as a whole, non-OPEC output is forecast to gain 0.7 mb/d followed by an increase of 1.5 mb/d during 2018. Both numbers are unchanged from last month’s Report.
56
57
58
59
60
61
Jan Mar May Jul Sep Nov Jan
mb/d Non-OPEC Total Oil Supply
2015 20162017 2017 forecast2018 forecast
-1.5-1.0-0.50.00.51.01.52.02.53.0
1Q14 1Q15 1Q16 1Q17 1Q18
mb/d
Other North America Total
Total Non-OPEC Supply, y-o-y Change
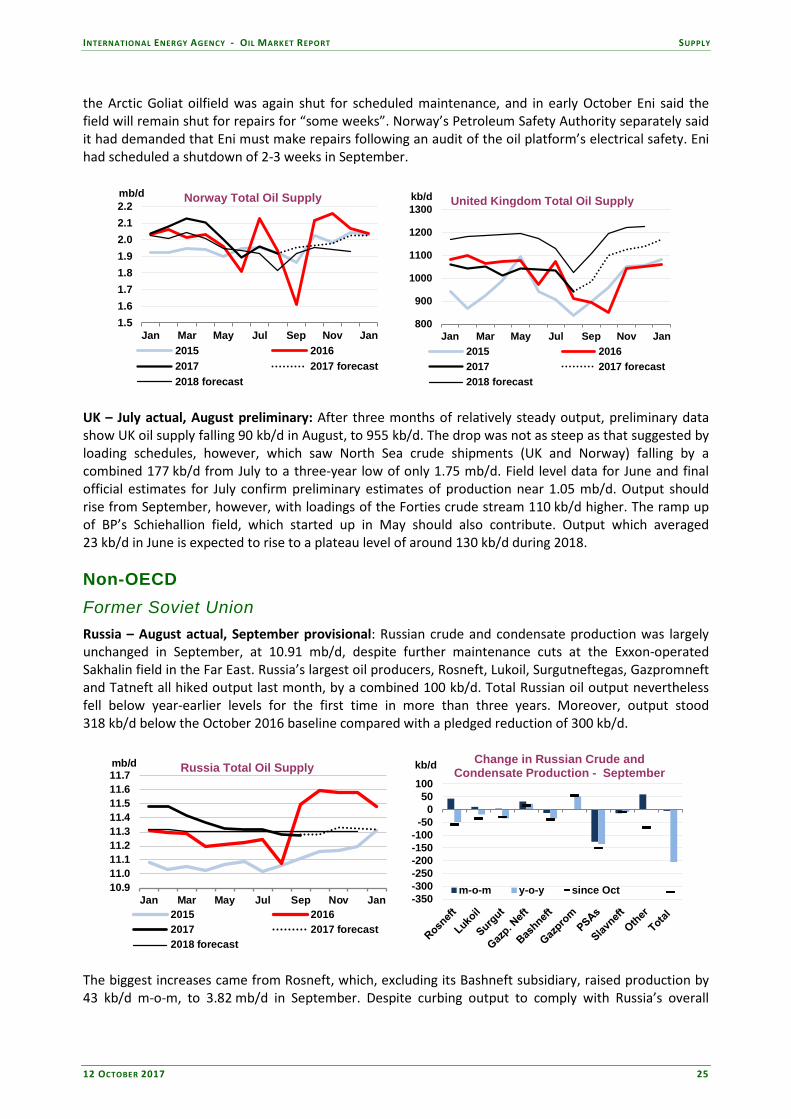
Despite the disruption to production in the Gulf of Mexico and lower Texas caused by Hurricane Harvey, US oil output is estimated 590 kb/d above a year earlier in September. Well completions at US shale oil fields have picked up from the low levels seen at the start of the year, so that even though new rig additions have stalled, output continues its upward trend. After hitting a low of 8.6 mb/d in September 2016, US crude oil production had already gained 685 kb/d by July, the latest month for which consolidated production data is available. Natural gas liquids production increased by an additional 150 kb/d. Total US output is forecast to expand by 470 kb/d on average in 2017 and 1.1 mb/d during 2018, to 14.1 mb/d. Russian crude oil production held largely steady in September, just above 10.9 mb/d, as maintenance from the Exxon-operated Sakhalin field offset increases from Rosneft, Gazpromneft and other producers. After posting year-on-year gains of 150 kb/d on average over the first eight months of the year, Russian oil output fell below year earlier levels last month for the first time in more than three years. Azeri production was also kept in check for a second consecutive month, with lower output from the Shah Deniz gas and condensate field offsetting slightly higher volumes from the Azeri-Chirag-Deepwater

INTERNATIONAL ENERGY AGENCY - OIL MARKET REPORT SUPPLY
12 OCTOBER 2017 21
Gunashli (AGC) complex, which had seen sharply lower volumes in August. While September production data was not yet available for Kazakhstan at the time of writing, downwardly revised loading schedules suggest Kashagan output inched only marginally higher.
2016 1Q17 2Q17 3Q17 4Q17 2017 1Q18 2Q18 3Q18 4Q18 2018
Americas 19.5 20.0 19.8 19.9 20.4 20.0 21.0 20.9 21.3 21.7 21.2Europe 3.5 3.7 3.5 3.4 3.6 3.6 3.7 3.7 3.5 3.6 3.6Asia Oceania 0.4 0.4 0.4 0.4 0.4 0.4 0.4 0.4 0.4 0.5 0.4Total OECD 23.4 24.0 23.7 23.8 24.4 24.0 25.1 25.0 25.2 25.8 25.3Former USSR 14.2 14.5 14.4 14.3 14.4 14.4 14.5 14.5 14.4 14.4 14.5Europe 0.1 0.1 0.1 0.1 0.1 0.1 0.1 0.1 0.1 0.1 0.1China 4.0 3.9 3.9 3.8 3.8 3.9 3.8 3.7 3.7 3.7 3.7Other Asia 3.6 3.5 3.5 3.5 3.4 3.5 3.4 3.4 3.3 3.3 3.4Latin America 4.5 4.6 4.5 4.6 4.7 4.6 4.6 4.7 4.8 4.9 4.8Middle East 1.3 1.2 1.2 1.2 1.2 1.2 1.2 1.2 1.3 1.3 1.2Africa 1.7 1.7 1.7 1.8 1.7 1.7 1.8 1.8 1.8 1.8 1.8Total Non-OECD 29.4 29.5 29.3 29.3 29.4 29.4 29.5 29.5 29.4 29.5 29.5Processing Gains 2.3 2.3 2.3 2.3 2.3 2.3 2.3 2.3 2.3 2.3 2.3Global Biofuels 2.3 1.9 2.5 2.8 2.5 2.4 2.1 2.6 3.0 2.6 2.5Total Non-OPEC 57.4 57.7 57.8 58.1 58.6 58.1 59.0 59.4 59.8 60.2 59.6Annual Chg (mb/d) -0.7 0.0 1.0 0.9 0.7 0.7 1.3 1.6 1.7 1.6 1.5Changes from last OMR (mb/d) 0.0 -0.1 0.0 -0.1 -0.1 -0.1 0.0 0.0 -0.1 0.0 0.0
Non-OPEC Supply(million barrels per day)
Maintenance also continued to constrain North Sea oil supplies, although loadings suggest output recovered somewhat by September. Brazilian production likely rebounded, while production in Ghana and Congo saw additional gains as new fields continue to ramp-up. August estimates for non-OPEC as a whole were revised down by 220 kb/d since last month’s Report, most notably due to weaker than expected production in Brazil and China as well as for global biofuels. Adherence to agreed output reductions from non-OPEC’s 10 participating countries held largely steady at around 125% in September, as both Russian and Azeri production was disrupted by maintenance and as Mexican supplies slipped further. Mexican production had already fallen by 195 kb/d below the October 2016 baseline by August and Hurricane Harvey likely caused output to slip further as Pemex advanced maintenance of its biggest field, Ku-Maloob-Zaap. Compliance for the group as a whole has averaged 75% so far this year.
Country IEA August Oil Output
IEA September Oil Output2
IEA Supply Baseline3 Agreed Cut Actual Cut3 August
ComplianceSeptember Compliance
2017 Average Compliance
Azerbaijan 739 734 815 -35 -81 215% 231% 117%Kazakhstan 1,772 1,807 1,805 -20 3 162% -13% N/AMexico 2,205 2,164 2,400 -100 -236 195% 236% 113%Oman 976 977 1,020 -45 -43 97% 95% 96%Russia 11,284 11,279 11,597 -300 -318 104% 106% 78%Others1 1,225 1,243 1,253 -46 -9 59% 20% -2%
Total 18,201 18,203 18,888 -546 -685 126% 125% 75%1 Bahrain, Brunei, Malaysia, Sudan and South Sudan
2 September total oil supply, based on market intellience sources and tanker tracking data. Azerbaijan and Russia based on preliminary country statistics.
3 Based on IEA October total supply estimates. Kazkahstan November estimate.
Non-OPEC Supply Reduction Commitments thousand barrels per day (kb/d)

SUPPLY INTERNATIONAL ENERGY AGENCY - OIL MARKET REPORT
22 12 OCTOBER 2017
OECD North America US – July Alaska actual, others estimated: US crude and condensate production rose 140 kb/d in July, to 9.24 mb/d. Crude oil output stood 555 kb/d above a year earlier and at its highest level since November 2015. Gains were driven by the Gulf of Mexico, which rebounded by a sharp 127 kb/d from a month earlier, when tropical storm Cindy had curbed output. Lower 48 onshore production also inched higher, led by Texas (+21 kb/d), North Dakota (+14 kb/d) and Oklahoma (+3 kb/d), while Alaskan supplies, fell by a further 40 kb/d m-o-m as maintenance intensified. NGL production was steady at around 3.75 mb/d, increasing 150 kb/d y-o-y.
12.0
12.5
13.0
13.5
14.0
14.5
15.0
Jan Mar May Jul Sep Nov Jan
mb/d United States Total Oil Supply
2015 20162017 2017 forecast2018 forecast
-1.5-1.0-0.50.00.51.01.52.0
1Q14 1Q15 1Q16 1Q17 1Q18
mb/d US Total Oil Supply - Yearly Change
Alaska California TexasGulf of Mexico NGLs North DakotaOther Total
US oil output likely fell in August and September, as Hurricane Harvey, which made landfall in Texas on 26 August, disrupted both offshore and onshore output. As much as 430 kb/d of offshore production was shut in at the peak, but with no major damage reported, installations were quickly brought back on line. Flooding and staff evacuations also shut in crude oil production in the Eagle Ford shale play in lower Texas, but onshore output is also estimated to have resumed relatively swiftly. In its latest Drilling Productivity Report (DPR), the Energy Information Administration (EIA) revised lower its Eagle Ford productivity and production estimates due to Hurricane Harvey The revision also impacted the Permian region, but to a lesser degree. Output from the plays covered in the report, were nevertheless seen rising by an average of 100 kb/d per month from July through October. On 7 October, tropical storm Nate, the fourth major storm to hit the US in less than two months, made landfall in Mississippi as a Category 1 Hurricane. Nate forced the closure of as much as 92% of Gulf of Mexico’s oil production, or 1.6 mb/d, and 77% of the area’s natural gas output at peak. As the storm passed with little damage reported, by 10 October the amount of shut-in oil production had been reduced to 1.02 mb/d (58.5%) according to the US Bureau of Safety and Environmental Enforcement (BSEE). While the precautionary shut-ins were nearly three times as large as those caused by Harvey, total US production is estimated to have risen overall as onshore output was not affected. After five weeks of flat or falling oil rig counts, by the end of September, US drillers added 6 rigs back to service. In the week ending 29 September, 750 rigs were operating, a 75% increase from a year earlier and 434 rigs more than at the low point reached in May last year. Moreover, the number of well completions are picking up. According to Rystad Energy, the number of horizontal US tight oil wells completed in the US during has risen above 800 per month since August, compared with around 400 at the start of the year. Earlier this year, completions had significantly lagged the number of wells spudded, causing the number of drilled but uncompleted wells to surge to record highs. Rystad put this number at around 5 000 in August, while the DPR estimated a backlog of more than 7 000 wells. US oil production is forecast to increase 470 kb/d in 2017 and 1.1 mb/d during 2018, of which 350 kb/d and 820 kb/d is crude oil, respectively.

INTERNATIONAL ENERGY AGENCY - OIL MARKET REPORT SUPPLY
12 OCTOBER 2017 23
-120-100-80-60-40-20
020406080
Jan 16 Jul 16 Jan 17 Jul 17
Baker Hughes US Oil Rig CountRolling four-week change
0.0
2.0
4.0
6.0
8.0
0.00.51.01.52.02.53.0
Jan-10 Jan-12 Jan-14 Jan-16
mb/dmb/d Oil ProductionSelected US Shale Plays
Bakken Eagle FordNiobrara Permian RegionTotal (RHS) Source: EIA Drilling Productivity Report
Canada – June actual: Canada’s total oil supply rose by nearly 90 kb/d in June, as synthetic crude oil production from Alberta recovered from maintenance. At just shy of 4.6 mb/d, total Canadian oil output stood a hefty 730 kb/d above a year earlier, when wildfires had impacted oil sands operations. Based on preliminary data for Alberta and offshore Newfoundland, production rose a further 220 kb/d in July. Albertan oil sands output, including synthetic crude oil, increased 200 kb/d m-o-m, to 2.7 mb/d. Offshore output declined by nearly 20 kb/d, however, providing a small offset. In August, Suncor started maintenance at its Terra Nova Floating Production, Storage and Offloading (FPSO) facility, reducing output to almost zero. According to news reports, the planned turnaround is expected to last eleven weeks. Earlier in the year, Husky Energy was reported to be planning maintenance at its offshore White Rose project during 3Q17, although this outage has not yet been confirmed. Husky Energy announced earlier this year that it is proceeding with its $2.2 billion West White Rose project in offshore Newfoundland and Labrador. First oil is expected in 2022 and the project could achieve a gross peak production rate of about 75 kb/d by 2025. The company continues to offset natural reservoir declines through infill and development well drilling at the White Rose field and satellite extensions. An infill well was completed at North Amethyst in February 2017, while an additional development well is planned at South White Rose with first oil expected in 4Q17. Onshore, Canadian Natural Resources started 45 days of planned maintenance at its 190 kb/d Horizon oil sands project in mid-September. A fire at the facility in September might delay the planned restart.
3.253.503.754.004.254.504.755.005.25
Jan Mar May Jul Sep Nov Jan
mb/d Canada Total Oil Supply
2015 20162017 2017 forecast2018 forecast
0.0
0.5
1.0
1.5
2.0
2.5
3.0
1Q13 1Q14 1Q15 1Q16 1Q17 1Q18
mb/d Canadian Oil Sands Output
Synthetic Crude In Situ Bitumen TransCanada announced on 5 October that it had abandoned its C$15.7 billion ($12.52 billion) Energy East pipeline project citing "changed circumstances", taking a fourth-quarter C$1 billion after-tax non-cash charge. The cancellation of the project comes less than a year after the government rejected Enbridge’s Northern Gateway export pipeline, and is a further setback for the country’s oil industry. New project sanctioning had already taken a hit following the drop in global crude prices and export capacity constraints provide additional risk to new developments going forward. The vast majority of Canadian

SUPPLY INTERNATIONAL ENERGY AGENCY - OIL MARKET REPORT
24 12 OCTOBER 2017
crude exports go to the United States, and Energy East would have shipped 1.1 mb/d to the Canadian east coast ports for loading onto tankers and shipment to markets in Europe and Asia. Mexico - August actual: Mexico’s total oil production was confirmed at just over 2.2 mb/d in August, of which 1.93 mb/d was crude oil. Crude and condensate production dropped 56 kb/d from a month earlier, with lower output from the offshore Ixtal field accounting for most of the decline. Total output, including NGLs, was 268 kb/d below the previous year and 195 kb/d lower than in October 2016. Mexico had pledged to cut oil production by 100 kb/d. While no new data were available for September 2017 at the time of writing, output is estimated to have dropped further as Pemex advanced maintenance at its Ku-Maloob-Zaap system due to the arrival of Hurricane Harvey. For the year as a whole, Mexican oil production is expected to decline by 205 kb/d and by 135 kb/d in 2018 to 2.13 mb/d.
2.02.12.22.32.42.52.62.72.8
Jan Mar May Jul Sep Nov Jan
mb/d Mexico Total Oil Supply
2015 20162017 2017 forecast2018 forecast
-300
-200
-100
0
100
Jan-14 Jan-15 Jan-16 Jan-17
kb/d Mexican Crude Oil Output by AreaAnnual change
Cantarell Ku-Maloob-ZaapSE Offshore S OnshoreN Onshore Total Crude
While all of Mexico’s major oil fields are in decline, it is onshore production that is declining most sharply. It accounts for slightly less than 20% of national output and is currently declining at around 20% per annum. As such, onshore output in August stood 80 kb/d below a year earlier. In comparison, observed decline rates for the country as a whole are trending around 8%. Ku-Maloob Zaap is the only production system not currently in decline. In early October, Pemex secured a partner to increase oil production from mature onshore fields in southern Mexico. Egyptian oil company Cheiron Holdings Ltd, part of the Pico Group, won a contract to join forces with Pemex in developing the Cárdenas and Mora fields in the southern state of Tabasco, while Germany’s DEA Deutsche Erdoel made the highest offer for the Ogarrio field, also in Tabasco. An auction for two offshore fields received no bids.
North Sea After hitting a three-year low of only 715 kb/d in August as seasonal maintenance curbed supplies, scheduled loadings of North Sea crudes that underpin the dated Brent benchmark rose in September and October. Output of Brent, Forties, Ekofisk and Oseberg (BFOE) is scheduled to average 870 kb/d in October, up from 793 kb/d in September. Scheduled loadings are expected to drop again by 70 kb/d in November, with Oseberg crude particularly affected. Norway – July actual, August provisional: Norwegian oil output dropped by 40 kb/d in August, to 1.92 mb/d, as seasonal maintenance curbed production at a number of fields. Final July output levels were revised lower by 47 kb/d since last month’s Report, but nevertheless showed a m-o-m increase of 65 kb/d. Statoil’s Gina Krog field that started up on 30 June, contributed 17 kb/d in July. Output was 171 kb/d lower than a year earlier in July and 17 kb/d below the previous year in August. In September,
600
700
800
900
1,000
1,100
Jan-15 Sep-15 May-16 Jan-17 Sep-17
BFOE Loadings & Production
Loadings BFOE Crude*Source: Reuters / IEA
kb/d
INTERNATIONAL ENERGY AGENCY - OIL MARKET REPORT SUPPLY
12 OCTOBER 2017 25
the Arctic Goliat oilfield was again shut for scheduled maintenance, and in early October Eni said the field will remain shut for repairs for “some weeks”. Norway’s Petroleum Safety Authority separately said it had demanded that Eni must make repairs following an audit of the oil platform’s electrical safety. Eni had scheduled a shutdown of 2-3 weeks in September.
1.51.61.71.81.92.02.12.2
Jan Mar May Jul Sep Nov Jan
mb/d Norway Total Oil Supply
2015 20162017 2017 forecast2018 forecast
800
900
1000
1100
1200
1300
Jan Mar May Jul Sep Nov Jan
kb/d United Kingdom Total Oil Supply
2015 20162017 2017 forecast2018 forecast
UK – July actual, August preliminary: After three months of relatively steady output, preliminary data show UK oil supply falling 90 kb/d in August, to 955 kb/d. The drop was not as steep as that suggested by loading schedules, however, which saw North Sea crude shipments (UK and Norway) falling by a combined 177 kb/d from July to a three-year low of only 1.75 mb/d. Field level data for June and final official estimates for July confirm preliminary estimates of production near 1.05 mb/d. Output should rise from September, however, with loadings of the Forties crude stream 110 kb/d higher. The ramp up of BP’s Schiehallion field, which started up in May should also contribute. Output which averaged 23 kb/d in June is expected to rise to a plateau level of around 130 kb/d during 2018. Non-OECD Former Soviet Union Russia – August actual, September provisional: Russian crude and condensate production was largely unchanged in September, at 10.91 mb/d, despite further maintenance cuts at the Exxon-operated Sakhalin field in the Far East. Russia’s largest oil producers, Rosneft, Lukoil, Surgutneftegas, Gazpromneft and Tatneft all hiked output last month, by a combined 100 kb/d. Total Russian oil output nevertheless fell below year-earlier levels for the first time in more than three years. Moreover, output stood 318 kb/d below the October 2016 baseline compared with a pledged reduction of 300 kb/d.
10.911.011.111.211.311.411.511.611.7
Jan Mar May Jul Sep Nov Jan
mb/d Russia Total Oil Supply
2015 20162017 2017 forecast2018 forecast
-350-300-250-200-150-100-50
050
100
kb/d Change in Russian Crude and Condensate Production - September
m-o-m y-o-y since Oct
The biggest increases came from Rosneft, which, excluding its Bashneft subsidiary, raised production by 43 kb/d m-o-m, to 3.82 mb/d in September. Despite curbing output to comply with Russia’s overall

SUPPLY INTERNATIONAL ENERGY AGENCY - OIL MARKET REPORT
26 12 OCTOBER 2017
pledge to reduce supplies, Rosneft has put increased efforts into managing brownfield decline through intensified development drilling activity, the commissioning of new wells and increased use of horizontal wells with multistage fracturing. During 2Q17, the company increased the number of meters drilled by 33% from a year earlier, to 3.2 million meters, and raised the number of new wells commissioned to 742, a 10% increase from a year earlier, while lifting the share of horizontal wells in the total. The greatest beneficiary of the increased drilling has undoubtedly been Rosneft’s Yuganskneftegaz subsidiary, which is also its biggest producer. Output at the Yugansk field reached nearly 1.4 mb/d in September, a gain of more than 90 kb/d, or 7%, from a year earlier and its highest level since the 1980s. With output slipping at Vankor (-45 kb/d) and Rosneft’s Far East Shelf fields (-45 kb/d) due to decline and outages, total company oil output stood 49 kb/d below a year earlier and 59 kb/d lower than its October 2016 production.
200
250
300
350
400
450
500
1200
1250
1300
1350
1400
1450
Jan-11 Jan-13 Jan-15 Jan-17
kb/dkb/d Output at Key Rosneft Oil Fields
Yugansk Vankor (RHS)
0
200
400
600
800
0500
100015002000250030003500
1Q15 3Q15 1Q16 3Q16 1Q17
Rosneft Drilling Indicators
Development drilling footage (000 meters)New wells commissioned (RHS)
Lukoil’s production rose by 10 kb/d m-o-m, while Surgutneftegaz, Gazpromneft and Tatneft raised output by 4 kb/d, 32 kb/d and 10 kb/d, respectively. Flows from PSA operators dropped 126 kb/d m-o-m to 198 kb/d, as Sakhalin 1 production fell to only 45 kb/d, from more than 230 kb/d produced in July. Azerbaijan – August actual, September preliminary: Azeri oil supply dropped by 57 kb/d in August, on lower output from the BP-operated ACG complex and as condensate production from the Shah Deniz gas field fell. Preliminary data released by the ministry show production largely unchanged in September as a rebound in condensate output offset further declines at ACG. At 734 kb/d, Azerbaijan’s total oil production was 81 kb/d lower than in October 2016, compared with an agreed cut of 35 kb/d. Output is expected to rebound in October as scheduled work is concluded.
0.7
0.8
0.8
0.9
0.9
Jan Mar May Jul Sep Nov Jan
mb/d Azerbaijan Total Oil Supply
2015 20162017 2017 forecast2018 forecast
1.2
1.4
1.6
1.8
2.0
2.2
Jan Mar May Jul Sep Nov Jan
mb/d Kazakhstan Total Oil Supply
2015 20162017 2017 forecast2018 forecast
Kazakhstan – August actual: Kazakhstan total oil production fell by nearly 80 kb/d in August, to 1.77 mb/d, largely in line with expectations, as output from Tengiz was constrained by maintenance. Estimated September output levels have been revised lower, however, as preliminary loading schedules showing a sharp increase of Kashagan shipments were cut and as works continued at the Tengiz and

INTERNATIONAL ENERGY AGENCY - OIL MARKET REPORT SUPPLY
12 OCTOBER 2017 27
Karachaganak fields. Kashagan loadings via the Caspian Pipeline Consortium pipeline, first pencilled in at 270 kb/d for September, were later revised down to only 175 kb/d. Preliminary October schedules showed planned shipments of around 215 kb/d. According to Kazakh officials, the field should produce roughly 270 kb/d during 4Q17 and 260-300 kb/d in 2018, significantly lower than the North Caspian Operating Company’s target to reach the 370 kb/d plateau production by the end of the year. While we have slightly lowered our forecast for the remainder of the year, and recognise the risk to 2018 output, for now we maintain our forecast of average output at around 350 kb/d next year. Historical supply data for Kazakhstan starting from 1994 has been revised higher by an average of around 30 kb/d following an update to the conversion factors used for official production data, reported in metric tons, into barrels and a reassessment of NGL production historically. Field specific conversion factors are now applied to Tengiz (7.94), Karachaganak (7.85), Kashagan (7.7) while the remainder of the country’s output (roughly 43% of national output) is still converted using a factor of 7.3 barrels per metric ton. Including condensate production from Karachaganak, the current weighted average conversion factor for Kazakhstan’s oil output is estimated at around 7.63 barrels/metric ton. In all, we forecast Kazakhstan’s oil production to rise by 180 kb/d and 130 kb/d during 2017 and 2018, respectively, to average 1.97 mb/d next year. Asia China – August actual: Chinese crude and condensate production plunged to a new low in August, of roughly 3.7 mb/d. CNOOC was forced to shut in four fields (Lufeng 3-1, Lufeng 13-2, Lufeng 13-2B and Lufeng 7-2) in the Pearl River Mouth basin in the eastern part of the South China Sea during August due to a leak at the Nanhai Shengkai FPSO. Following an update to historical statistics, based on provincial data reported by the National Bureau of Statistics and ongoing revisions to the conversion factors used for countries publishing data in metric tons, historical Chinese crude production estimates have been revised down by roughly 50 kb/d back to 1994. Chinese oil supplies are generally relatively heavy in grade, with gravity for key fields ranging from 24.2°API for Shengli to 31.93°API for Daqing. Based on the field and regional specific gravity estimates, current Chinese crude production are converted by an average of around 7.2 barrels/metric ton.
3.4
3.6
3.8
4.0
4.2
4.4
Jan Mar May Jul Sep Nov Jan
mb/d China Crude Oil Production
2015 20162017 2017 forecast2018 forecast
620640660680700720740760
Jan Mar May Jul Sep Nov Jan
kb/d Malaysia Total Oil Supply
2015 20162017 2017 forecast2018 forecast
Elsewhere in Asia, Malaysian crude oil production rebounded in August, to 680 kb/d or 50 kb/d more than a year earlier. Including NGLs and nonconventional supplies, Malaysian supply was 730 kb/d. Despite pledging to cut production by 20 kb/d from an October 2016 baseline, data published by the Central Bank show production increased by more than 40 kb/d from October through August. Production has been supported by the start-up of Shell’s 60 kb/d Malikai project off the coast of Sabah last December. According to ConocoPhillips, which holds a 35% non-operating interest, drilling operations for the second batch at Malikai wells began in June, following the shutdown of the field for maintenance work during 2Q17. Vietnamese oil output held steady in September, at around 260 kb/d. Output was

SUPPLY INTERNATIONAL ENERGY AGENCY - OIL MARKET REPORT
28 12 OCTOBER 2017
nevertheless, 29 kb/d lower than a year ago, a drop of nearly 10%. In Thailand, meanwhile, the shutdown of onshore oil and gas production by a number of operators following a ruling by the Supreme Administrative Court regarding the use of designated agricultural land for other activities, had less of an impact than previously thought. July crude oil output was 24 kb/d higher than our estimate, at 237 kb/d, 8.3% below a year earlier. NGLs supplies were steady at around 200 kb/d. Indian oil production dropped by 18 kb/d to 852 kb/d, in August, largely unchanged from a year earlier. Latin America Brazil – August actual: Brazilian oil supply slipped another 45 kb/d in August, as field maintenance curbed output for a second consecutive month. While production from the Jubarte, Baleia Azul and Baleia Franca fields rebounded by a combined 90 kb/d from a month earlier when maintenance had curbed output, production at Lula dropped by 114 kb/d m-o-m. Petrobras announced the decline was due to scheduled shutdowns of the Cidade de Marica and Cidade de Itaguaí FPSOs. Supply from the Marlim, Marlim Leste and Marlim Sul fields also slipped by a combined 25 kb/d, after having posted a strong month in July. At 2.7 mb/d, total Brazilian oil supply fell below year earlier levels for the first time in sixteen months. Over the first seven months of this year, supplies stood 240 kb/d higher than in the comparable period of 2016. In late September, ExxonMobil partnered with Petrobras, and dominated awards in Brazil’s 14th upstream licensing round by paying record signature bonuses. But the fact that only 37 blocks out of the 287 on offer found takers, might suggest that other large oil firms are waiting for the sub-salt blocks that will come up for auction later this month. Exxon and Petrobras submitted joint bids totalling R3.6 bn ($1.4 bn) for six Campos Basin blocks, considered to have sub-salt potential. The fields are governed by a simple concession model contract, not the production sharing terms that apply to confirmed sub-salt acreage. Murphy Oil, CNOOC, Repsol, Karoon Gas as well as local QGEP were amongst the other companies winning awards. Twelve companies, including Exxon, Shell, Statoil, Total, Repsol, Petronas and Galp have prequalified for the two pre-salt rounds due to take place on 27 October. Colombia – August actual: After recording average output declines of 12% during 2016, Colombian oil supply seems to have stabilised around 860 kb/d. In August, production was marginally higher than a month earlier and roughly 30 kb/d above a year earlier. Colombian oil producers have increased spending this year and the number of rigs drilling for oil had reached 24 by August, compared with only two rigs at the low point in April 2016.
750800850900950
100010501100
Jan Mar May Jul Sep Nov Jan
kb/d Colombia Total Oil Supply
2015 20162017 2017 forecast2018 forecast
0
10
20
30
40
50
-200-150-100-50
050
100
Jan-14 Jan-15 Jan-16 Jan-17
kb/dColombian Annual Output Change
vs Number of Rigs
Y-O-Y Change Rigs (RHS)
Source: IEA, Baker Hughes
2.2
2.4
2.6
2.8
3.0
3.2
3.4
Jan Mar May Jul Sep Nov Jan
mb/d Brazil Total Oil Supply
2015 20162017 2017 forecast2018 forecast

INTERNATIONAL ENERGY AGENCY - OIL MARKET REPORT STOCKS
12 OCTOBER 2017 29
STOCKS Summary • OECD commercial stocks decreased 14.2 mb in August to 3 015 mb and continued to fall against the
five-year average on higher-than-expected demand. July stocks were revised 13.1 mb higher. • Hurricane Harvey led to a partial reversal of the trends seen in previous months in the US, with an
increase in crude stocks and a large oil product draw, particularly for diesel. The crude stock build was not as much as implied by the loss of refining capacity following the storm, as trade quickly adapted.
• Preliminary data for September show oil stocks drawing everywhere, from Europe to Fujairah,
Japan, Singapore, the US and floating storage. • Global oil stocks are likely to have drawn in 3Q17 for only the second time since 2014, as reductions
in floating storage and the OECD outweighed net builds in China. China’s crude imports have fallen every month since June and the implied net build for September was relatively small at 100 kb/d.
900950
1,0001,0501,1001,1501,2001,2501,300
Jan Mar May Jul Sep Nov Jan
mb OECD Crude Oil Stocks
Range 2012-2016 Avg 2012-20162016 2017
1,250
1,300
1,350
1,400
1,450
1,500
1,550
1,600
Jan Mar May Jul Sep Nov Jan
mb OECD Total Products Stocks
Range 2012-2016 Avg 2012-20162016 2017
Global Overview
OECD commercial oil stocks stood at 3 015 mb at the end of August, down 14.2 mb from July. While stocks remained above the symbolic 3 000 mb mark, they fell for the fourth straight month against the five-year average, to a surplus of 170 mb. Overall non-OECD stocks – accounting for floating storage, oil in transit, Chinese commercial inventories, Fujairah and Singapore – also reduced in August, with only Singapore reporting a monthly build. Preliminary data for September show oil stocks falling everywhere, from Europe (-11.8 mb) to Fujairah (-2.3 mb), Japan (-5.5 mb), Singapore (-6.3 mb), the US (-15 mb) and floating storage (-16.7 mb). Hurricane Harvey boosted US crude stocks and curbed product inventories, however, the increase in crude stockpiles would have been much larger if trade had not adapted so quickly. US crude imports dropped, whereas crude exports increased throughout the month, reaching a new record of 2 mb/d in the week ended 29 September. It is also noticeable that China’s crude imports have fallen in the last few months, implying a much lower net build than in 2Q17. Overall, we estimate that global oil stocks are likely to have decreased in 3Q17 for only the second time since oil prices crashed in the middle of 2014 (See Did global oil stocks draw in 3Q17?).
mb mb/d
Americas Commercial -3.3 -0.1
Asia Oceania Commercial 2.1 0.1
Europe Commercial -13.0 -0.4
Government Stocks -0.2 0.0
Total OECD -14.4 -0.5
Floating Storage -19.1 -0.6
Oil in Transit -11.5 -0.4
Fujairah (FEDCom/S&P Global Platts) -1.7 -0.1
Singapore (International Enterprise) 1.5 0.0
China Commercial Stocks (OGP) -9.1 -0.3
Total -54.2 -1.7
Aug17 v Jul17 Stock Estimate
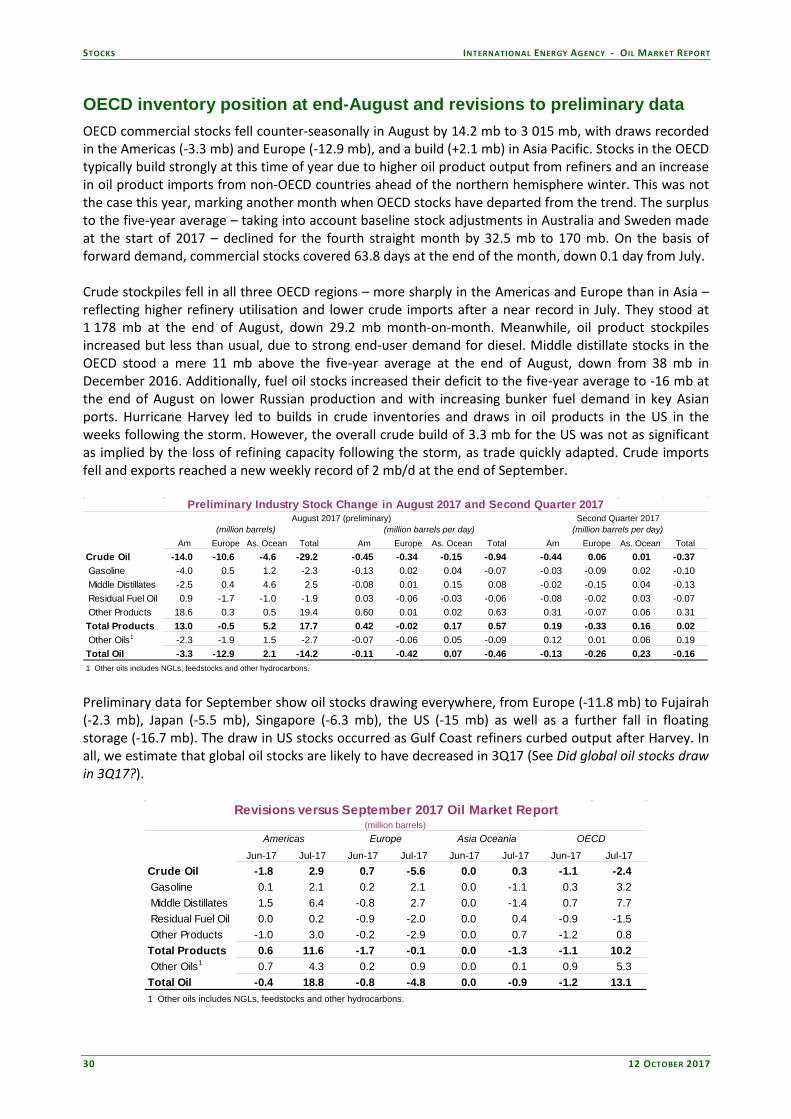
STOCKS INTERNATIONAL ENERGY AGENCY - OIL MARKET REPORT
30 12 OCTOBER 2017
OECD inventory position at end-August and revisions to preliminary data OECD commercial stocks fell counter-seasonally in August by 14.2 mb to 3 015 mb, with draws recorded in the Americas (-3.3 mb) and Europe (-12.9 mb), and a build (+2.1 mb) in Asia Pacific. Stocks in the OECD typically build strongly at this time of year due to higher oil product output from refiners and an increase in oil product imports from non-OECD countries ahead of the northern hemisphere winter. This was not the case this year, marking another month when OECD stocks have departed from the trend. The surplus to the five-year average – taking into account baseline stock adjustments in Australia and Sweden made at the start of 2017 – declined for the fourth straight month by 32.5 mb to 170 mb. On the basis of forward demand, commercial stocks covered 63.8 days at the end of the month, down 0.1 day from July. Crude stockpiles fell in all three OECD regions – more sharply in the Americas and Europe than in Asia – reflecting higher refinery utilisation and lower crude imports after a near record in July. They stood at 1 178 mb at the end of August, down 29.2 mb month-on-month. Meanwhile, oil product stockpiles increased but less than usual, due to strong end-user demand for diesel. Middle distillate stocks in the OECD stood a mere 11 mb above the five-year average at the end of August, down from 38 mb in December 2016. Additionally, fuel oil stocks increased their deficit to the five-year average to -16 mb at the end of August on lower Russian production and with increasing bunker fuel demand in key Asian ports. Hurricane Harvey led to builds in crude inventories and draws in oil products in the US in the weeks following the storm. However, the overall crude build of 3.3 mb for the US was not as significant as implied by the loss of refining capacity following the storm, as trade quickly adapted. Crude imports fell and exports reached a new weekly record of 2 mb/d at the end of September.
Am Europe As. Ocean Total Am Europe As. Ocean Total Am Europe As. Ocean TotalCrude Oil -14.0 -10.6 -4.6 -29.2 -0.45 -0.34 -0.15 -0.94 -0.44 0.06 0.01 -0.37 Gasoline -4.0 0.5 1.2 -2.3 -0.13 0.02 0.04 -0.07 -0.03 -0.09 0.02 -0.10 Middle Distillates -2.5 0.4 4.6 2.5 -0.08 0.01 0.15 0.08 -0.02 -0.15 0.04 -0.13 Residual Fuel Oil 0.9 -1.7 -1.0 -1.9 0.03 -0.06 -0.03 -0.06 -0.08 -0.02 0.03 -0.07 Other Products 18.6 0.3 0.5 19.4 0.60 0.01 0.02 0.63 0.31 -0.07 0.06 0.31 Total Products 13.0 -0.5 5.2 17.7 0.42 -0.02 0.17 0.57 0.19 -0.33 0.16 0.02 Other Oils1 -2.3 -1.9 1.5 -2.7 -0.07 -0.06 0.05 -0.09 0.12 0.01 0.06 0.19 Total Oil -3.3 -12.9 2.1 -14.2 -0.11 -0.42 0.07 -0.46 -0.13 -0.26 0.23 -0.16 1 Other oils includes NGLs, feedstocks and other hydrocarbons.
(million barrels) (million barrels per day) (million barrels per day)
Preliminary Industry Stock Change in August 2017 and Second Quarter 2017August 2017 (preliminary) Second Quarter 2017
Preliminary data for September show oil stocks drawing everywhere, from Europe (-11.8 mb) to Fujairah (-2.3 mb), Japan (-5.5 mb), Singapore (-6.3 mb), the US (-15 mb) as well as a further fall in floating storage (-16.7 mb). The draw in US stocks occurred as Gulf Coast refiners curbed output after Harvey. In all, we estimate that global oil stocks are likely to have decreased in 3Q17 (See Did global oil stocks draw in 3Q17?).
(million barrels)Americas Europe Asia Oceania OECD
Jun-17 Jul-17 Jun-17 Jul-17 Jun-17 Jul-17 Jun-17 Jul-17Crude Oil -1.8 2.9 0.7 -5.6 0.0 0.3 -1.1 -2.4 Gasoline 0.1 2.1 0.2 2.1 0.0 -1.1 0.3 3.2 Middle Distillates 1.5 6.4 -0.8 2.7 0.0 -1.4 0.7 7.7 Residual Fuel Oil 0.0 0.2 -0.9 -2.0 0.0 0.4 -0.9 -1.5 Other Products -1.0 3.0 -0.2 -2.9 0.0 0.7 -1.2 0.8 Total Products 0.6 11.6 -1.7 -0.1 0.0 -1.3 -1.1 10.2 Other Oils1 0.7 4.3 0.2 0.9 0.0 0.1 0.9 5.3 Total Oil -0.4 18.8 -0.8 -4.8 0.0 -0.9 -1.2 13.1 1 Other oils includes NGLs, feedstocks and other hydrocarbons.
Revisions versus September 2017 Oil Market Report
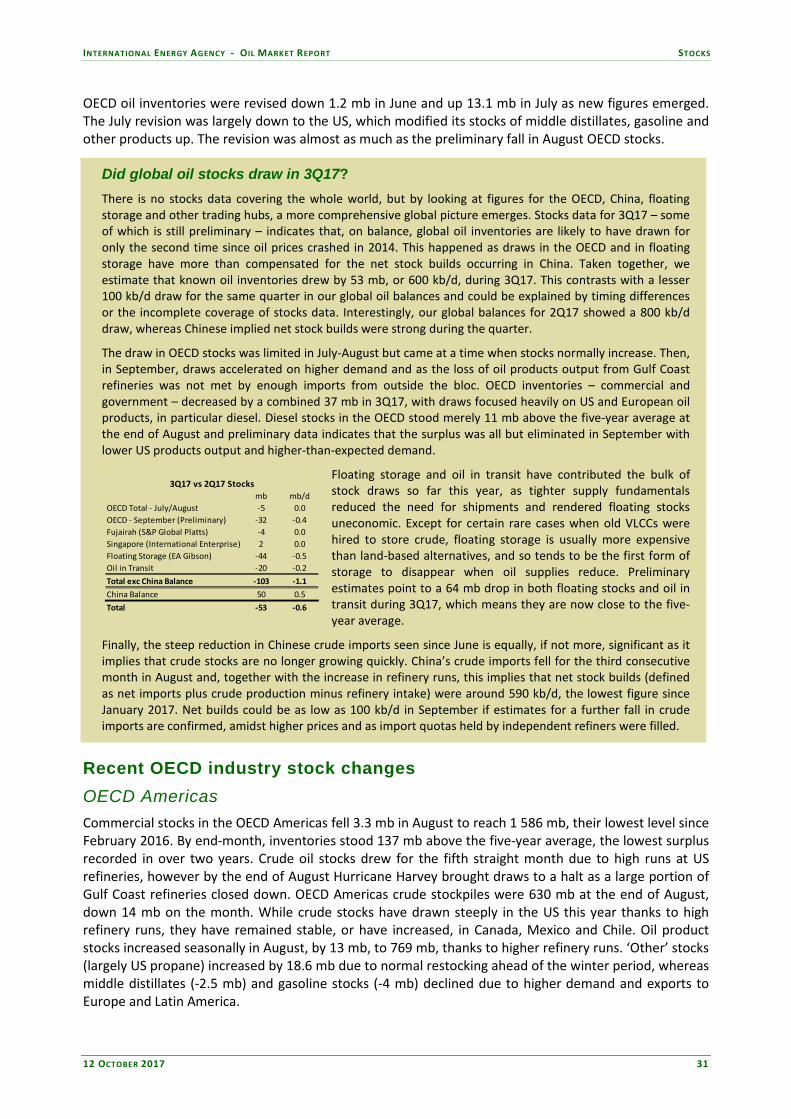
INTERNATIONAL ENERGY AGENCY - OIL MARKET REPORT STOCKS
12 OCTOBER 2017 31
OECD oil inventories were revised down 1.2 mb in June and up 13.1 mb in July as new figures emerged. The July revision was largely down to the US, which modified its stocks of middle distillates, gasoline and other products up. The revision was almost as much as the preliminary fall in August OECD stocks.
Did global oil stocks draw in 3Q17? There is no stocks data covering the whole world, but by looking at figures for the OECD, China, floating storage and other trading hubs, a more comprehensive global picture emerges. Stocks data for 3Q17 – some of which is still preliminary – indicates that, on balance, global oil inventories are likely to have drawn for only the second time since oil prices crashed in 2014. This happened as draws in the OECD and in floating storage have more than compensated for the net stock builds occurring in China. Taken together, we estimate that known oil inventories drew by 53 mb, or 600 kb/d, during 3Q17. This contrasts with a lesser 100 kb/d draw for the same quarter in our global oil balances and could be explained by timing differences or the incomplete coverage of stocks data. Interestingly, our global balances for 2Q17 showed a 800 kb/d draw, whereas Chinese implied net stock builds were strong during the quarter.
The draw in OECD stocks was limited in July-August but came at a time when stocks normally increase. Then, in September, draws accelerated on higher demand and as the loss of oil products output from Gulf Coast refineries was not met by enough imports from outside the bloc. OECD inventories – commercial and government – decreased by a combined 37 mb in 3Q17, with draws focused heavily on US and European oil products, in particular diesel. Diesel stocks in the OECD stood merely 11 mb above the five-year average at the end of August and preliminary data indicates that the surplus was all but eliminated in September with lower US products output and higher-than-expected demand.
Floating storage and oil in transit have contributed the bulk of stock draws so far this year, as tighter supply fundamentals reduced the need for shipments and rendered floating stocks uneconomic. Except for certain rare cases when old VLCCs were hired to store crude, floating storage is usually more expensive than land-based alternatives, and so tends to be the first form of storage to disappear when oil supplies reduce. Preliminary estimates point to a 64 mb drop in both floating stocks and oil in transit during 3Q17, which means they are now close to the five-year average.
Finally, the steep reduction in Chinese crude imports seen since June is equally, if not more, significant as it implies that crude stocks are no longer growing quickly. China’s crude imports fell for the third consecutive month in August and, together with the increase in refinery runs, this implies that net stock builds (defined as net imports plus crude production minus refinery intake) were around 590 kb/d, the lowest figure since January 2017. Net builds could be as low as 100 kb/d in September if estimates for a further fall in crude imports are confirmed, amidst higher prices and as import quotas held by independent refiners were filled.
Recent OECD industry stock changes OECD Americas Commercial stocks in the OECD Americas fell 3.3 mb in August to reach 1 586 mb, their lowest level since February 2016. By end-month, inventories stood 137 mb above the five-year average, the lowest surplus recorded in over two years. Crude oil stocks drew for the fifth straight month due to high runs at US refineries, however by the end of August Hurricane Harvey brought draws to a halt as a large portion of Gulf Coast refineries closed down. OECD Americas crude stockpiles were 630 mb at the end of August, down 14 mb on the month. While crude stocks have drawn steeply in the US this year thanks to high refinery runs, they have remained stable, or have increased, in Canada, Mexico and Chile. Oil product stocks increased seasonally in August, by 13 mb, to 769 mb, thanks to higher refinery runs. ‘Other’ stocks (largely US propane) increased by 18.6 mb due to normal restocking ahead of the winter period, whereas middle distillates (-2.5 mb) and gasoline stocks (-4 mb) declined due to higher demand and exports to Europe and Latin America.
mb mb/dOECD Total - July/August -5 0.0OECD - September (Preliminary) -32 -0.4Fujairah (S&P Global Platts) -4 0.0Singapore (International Enterprise) 2 0.0Floating Storage (EA Gibson) -44 -0.5Oil in Transit -20 -0.2
Total exc China Balance -103 -1.1
China Balance 50 0.5
Total -53 -0.6
3Q17 vs 2Q17 Stocks

STOCKS INTERNATIONAL ENERGY AGENCY - OIL MARKET REPORT
32 12 OCTOBER 2017
425
475
525
575
625
675
725
Jan Mar May Jul Sep Nov Jan
mb OECD Americas Crude Oil Stocks
Range 2012-2016 Avg 2012-20162016 2017
175185195205215225235245255
Jan Mar May Jul Sep Nov Jan
mb OECD Americas Middle Distillates Stocks
Range 2012-2016 Avg 2012-20162016 2017
Preliminary data from the US Energy Information Administration (EIA) for September show a partial reversal of the trends seen in recent months, with crude stocks building and oil products drawing due to Hurricane Harvey. Crude stocks went up 3.3 mb between the end of August and 29 September, with builds seen in the Gulf Coast (PADD 3), where the storm was active, and the Mid-Continent (PADD 2), which feeds crude by pipeline to the Gulf Coast. In the other PADDs, crude stocks were either unchanged or down during the month, partly as a result of refiners increasing runs in those regions to capture improved oil product margins. The overall crude build of 3.3 mb for the US was not as significant as implied by the loss of refining capacity in the weeks that followed the storm, as trade quickly adapted. US crude prices fell in relation to other international crude benchmarks (Brent and Dubai) in late August, helping to stem the flow of imports and incentivising exports. Imports averaged 7.1 mb/d during September, down from 8 mb/d in August, whereas exports increased by 600 kb/d on average to 1.3 mb/d in September. Exports reached a weekly record of 1.98 mb/d in the week ending 29 September. By the end of September, crude stocks had started drawing once again on the back of higher refining activity and exports. The Midwest region remains a key exception, as crude stocks have built since July, reflecting the steady increase in US and Canadian production and the inability to export all of it. This is the main reason behind the widening of the price spread between Brent and Dubai crudes and WTI.
100110120130140150160170180
Jan Apr Jul Oct
mb US Weekly Total Distillate Stocks
Range 2012-2016 5-yr Average2016 2017
Source: EIA
2030405060708090
100110120
Jan Apr Jul Oct
mb US Weekly Propane Stocks
Range 2012-2016 5-yr Average2016 2017
Source: EIA
Oil product stocks fell by a steep 18.3 mb in September, with draws seen for middle distillates (-12.5 mb), gasoline (-8.3 mb) and even propane (-1 mb), which normally builds until well into October. Stocks of fuel oil and unfinished oil rose. As for crude, the closure of refineries in the aftermath of Hurricane Harvey had a large impact on product stocks, but this was partly offset by trade flows. European refiners stepped up exports of gasoline in early September and these started to reach US shores during the month. Gasoline stocks subsequently increased in the week ending 29 September. Middle distillate stocks fell below the five-year average as refineries produced less diesel after the hurricane and as exports remained relatively high. Propane stocks continued to build through to mid-September, but they drew later in the month on high exports. Demand for LPG for crop-drying was limited due to warm and dry weather in the Midwest.
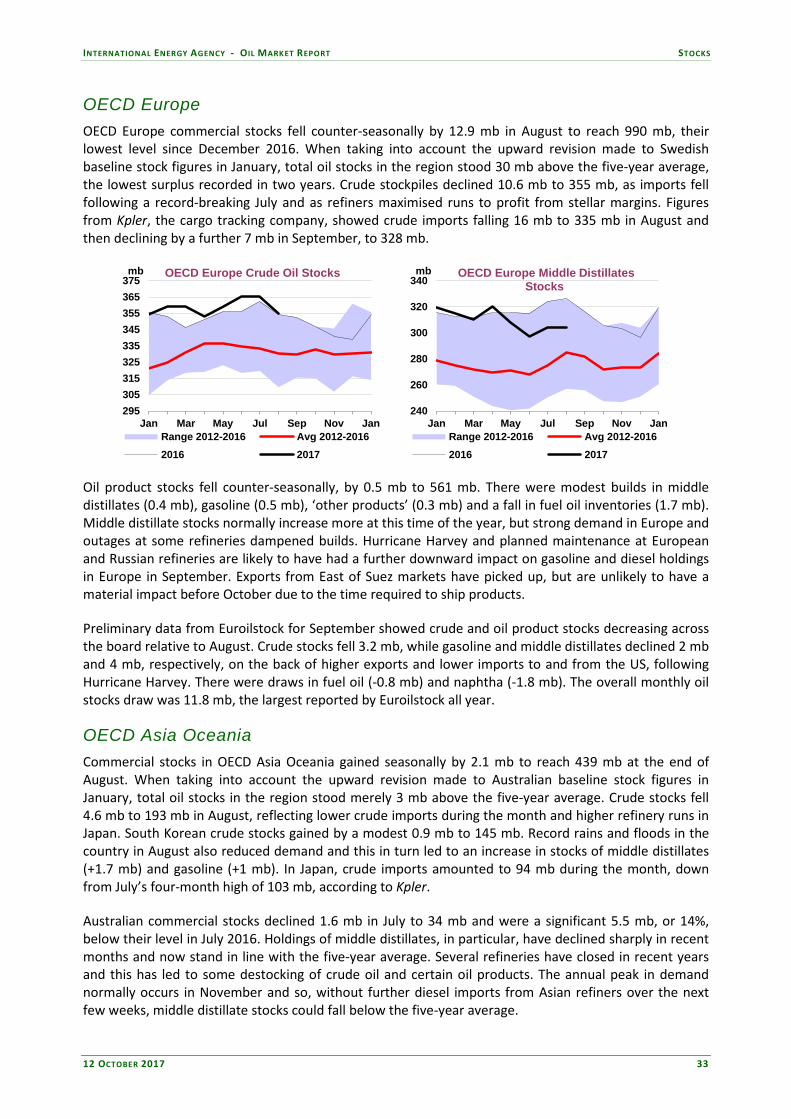
INTERNATIONAL ENERGY AGENCY - OIL MARKET REPORT STOCKS
12 OCTOBER 2017 33
OECD Europe OECD Europe commercial stocks fell counter-seasonally by 12.9 mb in August to reach 990 mb, their lowest level since December 2016. When taking into account the upward revision made to Swedish baseline stock figures in January, total oil stocks in the region stood 30 mb above the five-year average, the lowest surplus recorded in two years. Crude stockpiles declined 10.6 mb to 355 mb, as imports fell following a record-breaking July and as refiners maximised runs to profit from stellar margins. Figures from Kpler, the cargo tracking company, showed crude imports falling 16 mb to 335 mb in August and then declining by a further 7 mb in September, to 328 mb.
295305315325335345355365375
Jan Mar May Jul Sep Nov Jan
mb OECD Europe Crude Oil Stocks
Range 2012-2016 Avg 2012-20162016 2017
240
260
280
300
320
340
Jan Mar May Jul Sep Nov Jan
mb OECD Europe Middle Distillates Stocks
Range 2012-2016 Avg 2012-20162016 2017
Oil product stocks fell counter-seasonally, by 0.5 mb to 561 mb. There were modest builds in middle distillates (0.4 mb), gasoline (0.5 mb), ‘other products’ (0.3 mb) and a fall in fuel oil inventories (1.7 mb). Middle distillate stocks normally increase more at this time of the year, but strong demand in Europe and outages at some refineries dampened builds. Hurricane Harvey and planned maintenance at European and Russian refineries are likely to have had a further downward impact on gasoline and diesel holdings in Europe in September. Exports from East of Suez markets have picked up, but are unlikely to have a material impact before October due to the time required to ship products. Preliminary data from Euroilstock for September showed crude and oil product stocks decreasing across the board relative to August. Crude stocks fell 3.2 mb, while gasoline and middle distillates declined 2 mb and 4 mb, respectively, on the back of higher exports and lower imports to and from the US, following Hurricane Harvey. There were draws in fuel oil (-0.8 mb) and naphtha (-1.8 mb). The overall monthly oil stocks draw was 11.8 mb, the largest reported by Euroilstock all year.
OECD Asia Oceania Commercial stocks in OECD Asia Oceania gained seasonally by 2.1 mb to reach 439 mb at the end of August. When taking into account the upward revision made to Australian baseline stock figures in January, total oil stocks in the region stood merely 3 mb above the five-year average. Crude stocks fell 4.6 mb to 193 mb in August, reflecting lower crude imports during the month and higher refinery runs in Japan. South Korean crude stocks gained by a modest 0.9 mb to 145 mb. Record rains and floods in the country in August also reduced demand and this in turn led to an increase in stocks of middle distillates (+1.7 mb) and gasoline (+1 mb). In Japan, crude imports amounted to 94 mb during the month, down from July’s four-month high of 103 mb, according to Kpler. Australian commercial stocks declined 1.6 mb in July to 34 mb and were a significant 5.5 mb, or 14%, below their level in July 2016. Holdings of middle distillates, in particular, have declined sharply in recent months and now stand in line with the five-year average. Several refineries have closed in recent years and this has led to some destocking of crude oil and certain oil products. The annual peak in demand normally occurs in November and so, without further diesel imports from Asian refiners over the next few weeks, middle distillate stocks could fall below the five-year average.

STOCKS INTERNATIONAL ENERGY AGENCY - OIL MARKET REPORT
34 12 OCTOBER 2017
150
160
170
180
190
200
210
Jan Mar May Jul Sep Nov Jan
mb OECD Asia Oceania Crude Oil Stocks
Range 2012-2016 Avg 2012-20162016 2017
6
7
8
9
10
11
12
13
Jan Mar May Jul Sep Nov Jan
mb Australia Middle Distillates Stocks
Range 2012-2016 Avg 2012-20162016 2017
Preliminary weekly data from the Petroleum Association of Japan (PAJ) show total oil stocks falling by a steep 5.5 mb in September with draws in both crude and oil products. Crude imports fell further and refineries reduced runs, helping to explain the draw. Crude stockpiles were down 1.9 mb on the month to their lowest level since March. Stocks of unfinished products (-1.3 mb), fuel oil (-1.2 mb), gasoil and diesel (-0.9 mb), naphtha (-0.5 mb) and jet fuel (-0.2 mb) also declined, whereas gasoline (-0.1 mb) and kerosene stocks (0.4 mb) built. Kerosene stocks have gained in line with seasonal patterns in recent months ahead of the winter, however they remain below 2016’s level as well as the five-year average metric, reflecting lower refinery output following a programme of rationalisation. Stocks of certain other key products, such as gasoline, diesel, gasoil and naphtha also stand below the average.
50
60
70
80
90
Jan Apr Jul Oct
mb/d Japan Weekly Product Stocks
Range 2012-16 5-yr Average2016 2017
Source: PAJ
5
10
15
20
25
Jan Mar May Jul Sep Nov
mb Japan Weekly Kerosene Stocks
Range 2012-16 5-yr Average2016 2017
Source: PAJ
Other stock developments In the 23 non-OECD countries that have submitted figures to JODI for the month of July, total oil stocks built by a modest 1.7 mb relative to June. There were builds recorded in Thailand (4.4 mb), India (3.6 mb) and Nigeria (2.4 mb). In Thailand and India, the builds were likely due to lower demand for crude from refineries and lower oil products consumption during the monsoon season, whereas in Nigeria higher gasoline imports were the main explanation. There were draws reported in several OPEC countries, including Saudi Arabia (1.6 mb), Algeria (1.6 mb), Qatar (1.5 mb) and Iraq (1.4 mb), as well as in Brazil (2.6 mb). Crude stocks in several OPEC countries have fallen this year due to lower production as part of the agreement to limit output. Overall, stocks in these 23 countries have fallen 63.6 mb between July 2016 and July 2017, with the bulk of draws concentrated on crude and NGLs (38.8 mb) and the rest in oil products (24.7 mb). Oil held in floating storage fell in July (8.1 mb), August (19.1 mb) and September (16.7 mb). At 37 mb at the end of September, according to EA Gibson, short-term term floating storage reached its lowest level since December 2014. Other figures available from Kpler showed a similar drop in September. Demand from refineries increased during the period and oil field maintenance curbed supply, progressively

INTERNATIONAL ENERGY AGENCY - OIL MARKET REPORT STOCKS
12 OCTOBER 2017 35
reducing the need for such stocks. Floating storage volumes are now below the five-year average metric. Oil in transit volumes also continued to fall in September, estimates available from Kpler and Vortexa showed, by between 34-82 mb.
-40-30-20-10
01020
Jan-17 Mar-17 May-17 Jul-17
Crude Stocks vs Dec 2016 level
Saudi Arabia QatarAlgeria IraqAngola Nigeria
Source: JODI
0
20
40
60
80
100
120
Jan Mar May Jul Sep Nov Jan
mb Global Short-Term Crude Floating Storage
Range 2012-16 Average 2012-162016 2017
Source: EA Gibson, IEA estimates
Data from China Oil, Gas and Petrochemicals (China OGP) indicate that commercial oil stocks fell 9.1 mb in August on the month, the second straight monthly fall, to their lowest since December 2016. Crude stocks fell 7.6 mb on higher refinery utilisation, whereas oil product stocks were relatively stable. Gasoline and diesel demand increased seasonally with higher traffic and more manufacturing activity. However, crude imports fell for the third consecutive month in August and, together with the increase in refinery runs, this implies that net stock builds (defined as net imports plus crude production minus refinery intake) were around 590 kb/d during the month, the lowest figure since January 2017. Net builds could be as low as 100 kb/d in September if estimates for a further fall in crude imports during September are confirmed, implying that China has reduced the pace of its stockpiling in parallel with the higher oil price. Oil inventories in Fujairah fell in September by 2.3 mb to 17.3 mb, their lowest level (on a monthly basis) since FEDCom and S&P Global Platts started publishing the data at the start of the year. There were falls across all major product categories, including light, middle and heavy distillates. Oil product stocks have fallen in the last few months since the outset of the diplomatic crisis between Qatar and neighbouring countries, which temporarily disrupted shipping traffic. Singaporean stocks also fell in September after spending July-August at elevated levels. Oil product inventories were down 6.3 mb on the month to 45 mb, with falls recorded in light, middle distillates and residues. Higher shipping traffic, which has continued to increase in the Straits of Malacca this year, is partly to blame. Oil product stocks in Singapore are back down below last year’s level, but they remain above the five-year average.

STOCKS INTERNATIONAL ENERGY AGENCY - OIL MARKET REPORT
36 12 OCTOBER 2017
1 Days of forw ard demand are based on average demand over the next three months
Days1 Million Barrels
Regional OECD End-of-Month Industry Stocks(in days of forward demand and million barrels of total oil)
56
58
60
62
64
66
68
Jan Mar May Jul Sep Nov Jan
Days OECD Total Oil
Range 2012-2016 Avg 2012-2016
2016 2017
525456586062646668
Jan Mar May Jul Sep Nov Jan
Days Americas
Range 2012-2016 Avg 2012-2016
2016 2017
626466687072747678
Jan Mar May Jul Sep Nov Jan
Days Europe
Range 2012-2016 Avg 2012-2016
2016 2017
424446485052545658
Jan Mar May Jul Sep Nov Jan
Days Asia Oceania
Range 2012-2016 Avg 2012-2016
2016 2017
1,250
1,350
1,450
1,550
1,650
1,750
Jan Mar May Jul Sep Nov Jan
mb Americas
Range 2012-2016 Avg 2012-2016
2016 2017
850
900
950
1,000
1,050
Jan Mar May Jul Sep Nov Jan
mb Europe
Range 2012-2016 Avg 2012-20162016 2017
380
400
420
440
460
Jan Mar May Jul Sep Nov Jan
mb Asia Oceania
Range 2012-2016 Avg 2012-20162016 2017
2,500 2,600 2,700 2,800 2,900 3,000 3,100 3,200
Jan Mar May Jul Sep Nov Jan
mb OECD Total Oil
Range 2012-2016 Avg 2012-20162016 2017

INTERNATIONAL ENERGY AGENCY - OIL MARKET REPORT PRICES
12 OCTOBER 2017 37
PRICES Summary • Benchmark crude prices rose by $2-4/bbl in September versus August, marking the third straight
month of gains. Higher oil product demand and political tensions in the Middle East contributed. • Money managers increased net long positions in crude futures to a near record at the end of
September, reflecting stronger optimism about oil prices. Net long positions in global diesel futures skyrocketed following Hurricane Harvey.
• Oil product markets were buoyant throughout the month. Middle distillate prices increased almost
twice as fast as crude, reflecting lower refinery throughputs and higher demand.
4042444648505254565860
Apr 17 Jun 17 Aug 17 Oct 17
$/bblCrude Futures
Front Month Close
NYMEX WTI ICE Brent
Source: ICE, NYMEX
05
101520253035404550
Apr 17 Jun 17 Aug 17 Oct 17
$/bbl NYMEX Front Month Cracks
ULSD RBOB
Source: NYMEX
Market overview Outright oil prices gained in September for the third straight month on the back of strong demand for oil products in the northern hemisphere. Brent futures even briefly reached their highest since July 2015. They had come off by the time of writing but remained some $9-10/bbl higher than before OPEC agreed to cut its production at the end of November 2016. The price rise reflects rising optimism on the part of oil traders, who built net long positions to nearly a record during the month – and would certainly have reached it without Hurricane Harvey, which disrupted the US refining infrastructure and curbed crude demand. Oil product markets remained buoyant in September following Harvey and also due to strong underlying demand globally, while refinery maintenance in Europe and Asia also contributed. Middle distillates were the strongest part of the barrel, increasing almost twice as quickly as crude during the month, with naphtha and gasoline behind. Futures markets Crude futures in September moved up to their highest level since July 2015, reflecting strong demand for diesel in the northern hemisphere, a slower pace of production gains in US light tight oil basins and political tensions in Iraq following Kurdistan’s decision to organise a referendum on independence. Front-month Brent futures were trading at $57/bbl at the time of writing, up from $52.38/bbl at the end of August. The Brent price went as high as $59.02/bbl on 25 September, before easing in the final days of the month and in early October. In parallel, money managers continued to build net long positions in Brent and WTI crude futures, which reached 785 mb on 26 September, their highest level since April, and only 87 mb below their historical peak, data from exchanges showed. Net long positions in WTI futures dropped in late August as Hurricane Harvey slashed crude demand from US refiners. They resumed their growth in September and were back to the pre-hurricane level at

PRICES INTERNATIONAL ENERGY AGENCY - OIL MARKET REPORT
38 12 OCTOBER 2017
the time of writing. Meanwhile, net long positions in Brent futures continued to rise through late August and September. They reached their highest level in several years on 26 September and stayed elevated in early October, highlighting rising optimism from traders about the outlook for oil prices. Net long positions held by money managers in diesel rose substantially in September both in Europe (ICE low sulphur gasoil futures) and North America (NYMEX diesel futures), and were at their highest level ever, in response to higher demand and lower output from Gulf Coast refiners. The ratio of long to short positions held by money managers in ICE gasoil futures was 18.6 at end-September, compared with a long-run average of just 3.6.
0
200
400
600
800
1,000
Mar-17 May-17 Jul-17
mb Money Managers' Net Long Positions in Crude Futures
Sources: CFTC, ICESources: CFTC, ICE
0
20
40
60
80
100
120
140
Mar-17 May-17 Jul-17
mb Money Managers' Net Long Positions in ICE Gasoil Futures
Source: ICE
The Month 1-Month 2 ICE Brent futures spread dipped briefly into contango at the start of September, but it quickly returned to backwardation after, a sign of tight crude supplies in Northwest Europe. It went to $0.75/bbl on 29 September, its highest level since June 2014, just before expiry of the November contract. As noted in last month’s Report, this is the first sustained period of backwardation in Brent futures since oil prices fell below $100/bbl in 2014. While lower output at North Sea oil fields supported the move into backwardation in August, and was still a factor in September and early October, higher demand for light sweet crudes from refiners helped boost prices in September. Longer-dated Brent spreads, which had remained relatively stable during July-August despite the tightening of the front futures spread, rose in September. Brent is now in backwardation all the way to the end of 2019.
Jul Aug Sep Sep-Aug % Week Commencing:Avg Chg Chg 04 Sep 11 Sep 18 Sep 25 Sep 02 Oct
NYMEXLight Sw eet Crude Oil 46.68 48.06 49.88 1.82 3.8 48.60 49.08 50.20 51.89 50.21RBOB 65.96 69.84 69.85 0.01 0.0 70.15 69.12 69.64 69.83 66.12ULSD 64.11 68.51 75.21 6.70 9.8 74.12 74.16 75.52 77.21 74.10ULSD ($/mmbtu) 11.31 12.08 13.27 1.18 9.8 13.07 13.08 13.32 13.62 13.07Henry Hub Natural Gas ($/mmbtu) 2.96 2.91 3.01 0.10 3.5 2.96 3.02 3.05 2.97 2.91
ICEBrent 49.15 51.87 55.51 3.64 7.0 53.64 54.87 56.04 58.06 56.11Gasoil 60.77 64.68 71.33 6.65 10.3 69.72 70.67 71.77 73.70 71.03
Prompt Month DifferentialsNYMEX WTI - ICE Brent -2.47 -3.81 -5.63 -1.82 -5.04 -5.79 -5.84 -6.17 -5.90NYMEX ULSD - WTI 17.43 20.45 25.33 4.88 25.52 25.08 25.32 25.32 23.89NYMEX RBOB - WTI 19.28 21.78 19.97 -1.81 21.55 20.04 19.44 17.94 15.91NYMEX 3-2-1 Crack (RBOB) 18.66 21.34 21.76 0.42 22.87 21.72 21.40 20.40 18.57NYMEX ULSD - Natural Gas ($/mmbtu) 8.35 9.18 10.26 1.08 10.11 10.06 10.27 10.65 10.16ICE Gasoil - ICE Brent 11.62 12.81 15.82 3.01 16.08 15.80 15.73 15.64 14.92
Source: ICE, NYMEX.
Prompt Month Oil Futures Prices(monthly and weekly averages, $/bbl)

INTERNATIONAL ENERGY AGENCY - OIL MARKET REPORT PRICES
12 OCTOBER 2017 39
The Brent-WTI futures spread, which widened considerably in August thanks to lower North Sea production, increased further in September with lower crude demand by US refiners in the aftermath of Hurricane Harvey. It was $5.36/bbl at the time of writing, up from $4.90/bbl at the end of August. Higher US crude exports and narrower NYMEX WTI price spreads indicated that it was unlikely to gain further in the short-term. The Brent-Dubai Exchange of Futures for Physical (EFP) spread stayed below $2/bbl for most of the month, but is generally up from the lows reached in June as global refiners increased their demand of light sweet crude in response to higher diesel and gasoline prices. The relative increase in price for Brent versus Dubai crude has rendered the most expensive exports from the Atlantic Basin to Asia uneconomic, even if the arbitrage window remains open for several crude grades. At the time of writing, the EFP was trading at $2.23/bbl. In oil products, the Month 1-Month 2 ICE low sulphur gasoil futures curve moved firmly into backwardation following a reduction in refinery runs in the US Gulf Coast linked to hurricane Harvey, a region that typically exports large amounts of diesel to Europe, and import demand from Latin America, traditionally satisfied by the Gulf Coast. The upcoming closure of some European refineries for seasonal maintenance work helped to support the spread. It reached as high as $1.01/bbl on 21 September and was trading at $0.64/bbl at the time of writing, up from $0.20/bbl at the end of August. It is the first period of sustained backwardation in European diesel markets since March 2015. In outright terms, European diesel futures traded in September at their highest since July 2015. NYMEX diesel futures also increased after hurricane Harvey and maintained most of their gains during September, even if the Month 1-Month 2 spread fell later in the month. The Month 1-Month 2 NYMEX Reformulated Gasoline Blendstock for Oxygen Blending (RBOB) spread dropped sharply in early September following the passage of Hurricane Harvey and eased progressively through the month. US Gulf Coast infrastructure suffered little damage from the hurricane and European refiners were able to compensate for the temporary supply shortfall by sending gasoline to the US and Latin America, explaining the price fall. At $0.68/bbl at the time of writing, the Month 1-Month 2 spread was the same as a year ago. Spot crude oil prices Global crude prices gained in September for the third straight month with strong demand from refiners and lower production in some regions. Light sweet grades from the North Sea, the Caucasus and West Africa increased faster than sour grades for the second month in a row. WTI lagged significantly behind other global crudes, but most US grades gained on a differentials basis. North Sea crude prices continued the uptrend started in August and were amongst the best performing grades globally in September. North Sea Dated averaged $56.07/bbl, up $4.44/bbl on the month. Lower output from North Sea oil fields and high refinery runs linked to stellar margins for diesel and gasoline combined to tighten the light sweet crude market. On top of this, regular cargo exports to Asia, made more profitable since the start of 2017 by the tightening of the spread between crudes from the Atlantic Basin and the Middle East, picked up in September and are likely to increase further in October. Contracts for differences, which track the relationship between physical cargo prices and forward contracts, increased substantially in the second half of September. CFDs for prompt delivery traded at one point at the widest premium to week 6 since 2014, but they declined in the last days of September. The Forties differential to North Sea Dated also increased to as high as $1.08/bbl in late September and rose against medium sour grades delivered in Northwest Europe, such as Urals. Other North Sea crude grades also gained. By early October, however, North Sea grades fell sharply. West African crude prices rose in parallel with Brent and other light sweet grades from the Atlantic Basin. Steady demand from European and Asian refiners and lower expected loadings in Nigeria during November helped boost prices. In the second half of the month, sales from storage in South Africa
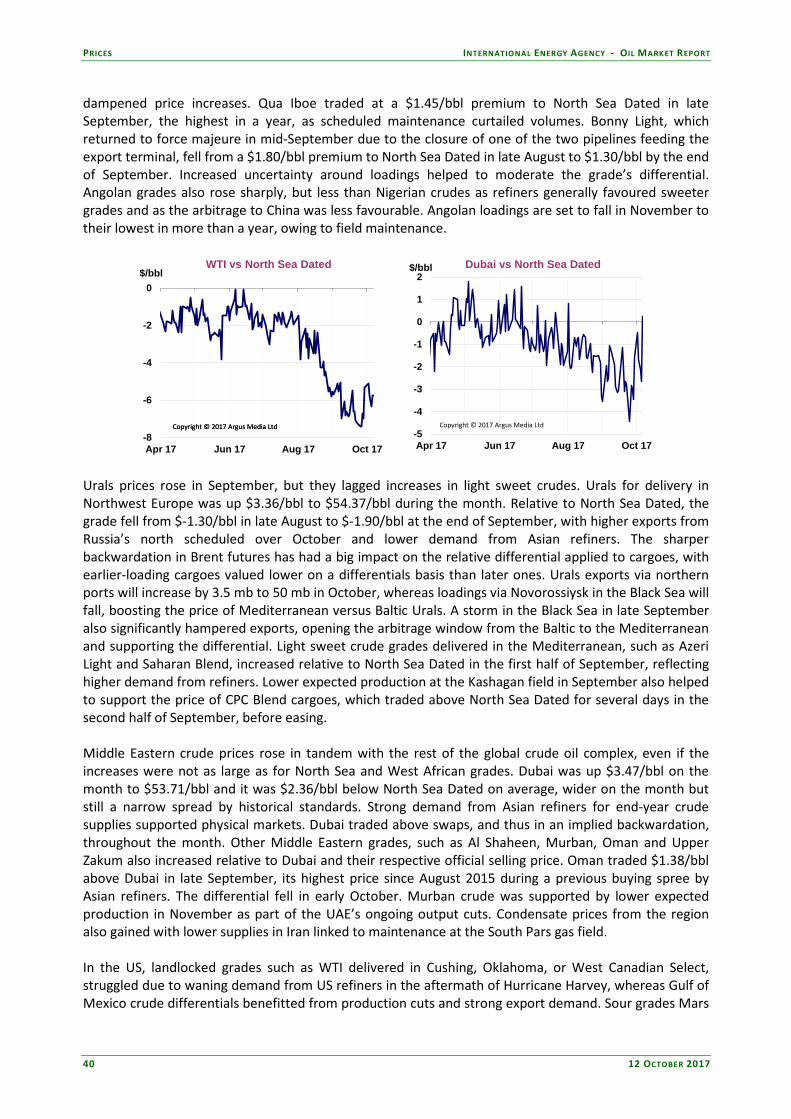
PRICES INTERNATIONAL ENERGY AGENCY - OIL MARKET REPORT
40 12 OCTOBER 2017
dampened price increases. Qua Iboe traded at a $1.45/bbl premium to North Sea Dated in late September, the highest in a year, as scheduled maintenance curtailed volumes. Bonny Light, which returned to force majeure in mid-September due to the closure of one of the two pipelines feeding the export terminal, fell from a $1.80/bbl premium to North Sea Dated in late August to $1.30/bbl by the end of September. Increased uncertainty around loadings helped to moderate the grade’s differential. Angolan grades also rose sharply, but less than Nigerian crudes as refiners generally favoured sweeter grades and as the arbitrage to China was less favourable. Angolan loadings are set to fall in November to their lowest in more than a year, owing to field maintenance.
-8
-6
-4
-2
0
Apr 17 Jun 17 Aug 17 Oct 17
$/bblWTI vs North Sea Dated
Copyright © 2017 Argus Media LtdCopyright © 2017 Argus Media Ltd
-5
-4
-3
-2
-1
0
1
2
Apr 17 Jun 17 Aug 17 Oct 17
$/bbl Dubai vs North Sea Dated
Copyright © 2017 Argus Media Ltd
Urals prices rose in September, but they lagged increases in light sweet crudes. Urals for delivery in Northwest Europe was up $3.36/bbl to $54.37/bbl during the month. Relative to North Sea Dated, the grade fell from $-1.30/bbl in late August to $-1.90/bbl at the end of September, with higher exports from Russia’s north scheduled over October and lower demand from Asian refiners. The sharper backwardation in Brent futures has had a big impact on the relative differential applied to cargoes, with earlier-loading cargoes valued lower on a differentials basis than later ones. Urals exports via northern ports will increase by 3.5 mb to 50 mb in October, whereas loadings via Novorossiysk in the Black Sea will fall, boosting the price of Mediterranean versus Baltic Urals. A storm in the Black Sea in late September also significantly hampered exports, opening the arbitrage window from the Baltic to the Mediterranean and supporting the differential. Light sweet crude grades delivered in the Mediterranean, such as Azeri Light and Saharan Blend, increased relative to North Sea Dated in the first half of September, reflecting higher demand from refiners. Lower expected production at the Kashagan field in September also helped to support the price of CPC Blend cargoes, which traded above North Sea Dated for several days in the second half of September, before easing. Middle Eastern crude prices rose in tandem with the rest of the global crude oil complex, even if the increases were not as large as for North Sea and West African grades. Dubai was up $3.47/bbl on the month to $53.71/bbl and it was $2.36/bbl below North Sea Dated on average, wider on the month but still a narrow spread by historical standards. Strong demand from Asian refiners for end-year crude supplies supported physical markets. Dubai traded above swaps, and thus in an implied backwardation, throughout the month. Other Middle Eastern grades, such as Al Shaheen, Murban, Oman and Upper Zakum also increased relative to Dubai and their respective official selling price. Oman traded $1.38/bbl above Dubai in late September, its highest price since August 2015 during a previous buying spree by Asian refiners. The differential fell in early October. Murban crude was supported by lower expected production in November as part of the UAE’s ongoing output cuts. Condensate prices from the region also gained with lower supplies in Iran linked to maintenance at the South Pars gas field. In the US, landlocked grades such as WTI delivered in Cushing, Oklahoma, or West Canadian Select, struggled due to waning demand from US refiners in the aftermath of Hurricane Harvey, whereas Gulf of Mexico crude differentials benefitted from production cuts and strong export demand. Sour grades Mars

INTERNATIONAL ENERGY AGENCY - OIL MARKET REPORT PRICES
12 OCTOBER 2017 41
and Poseidon gained $3.68/bbl and $3.55/bbl on the month, respectively. An outage at the Thunder Horse offshore platform in mid-September pushed sour differentials even higher. The widening of the price difference between Brent and WTI crudes, which started in early August, continued after Harvey hit the Texas coastline and throughout September. This was a major driver for US crude differentials, which mostly rose as a result. Bakken crude hit a premium over WTI of $3.75/bbl on 14 September, the result of strong demand from PADD 1 and PADD 2 refiners looking to compensate for Gulf Coast shutdowns and higher synthetic crude prices following a fire at an oil sands project in northern Alberta. Bakken differentials eased in late September before strengthening once again in early October. Hurricane Nate caused a short-lived shutdown of a large portion of US Gulf of Mexico production in early October and this supported US crude differentials.
Spot product prices Global oil product prices continued to rise at a faster pace than crude oil in September. Hurricane Harvey impacted oil product supply well into September, while refinery maintenance in Europe and Asia also contributed. Middle distillates were the strongest part of the barrel, with gasoline a close second. Diesel, gasoil and jet fuel prices rose almost twice as fast as crude oil in September, buoyed by strong demand as well as planned and unplanned refinery outages. This marked the third straight month of gains relative to crude. The US Gulf Coast is the world’s prime exporter of diesel and was hampered throughout September following the closure of refineries. Other factors also played their part in diesel’s strength, including planned refinery turnarounds in Europe and Asia and colder-than-normal temperatures in parts of Europe and North America. This led to some unusual trade movements. European refiners sent an estimated 4.5 mb of diesel to Argentina, Brazil and Cuba, partly offsetting lower export flows from the US Gulf Coast. The US was said to have exported only 3.7 mb of diesel to Europe during September, equivalent to the minimum volume guaranteed under long-term contracts. In compensation, refiners situated in the Far East, India and the Middle East sent large quantities of diesel and jet fuel to the US West Coast – where stocks had fallen sharply – as well as to Europe. The price of diesel barges in Rotterdam gained $6.64/bbl to $71.33/bbl, while in Singapore 500 ppm gasoil cargoes were up $4.98/bbl to $68.49/bbl. Diesel refining margins hit their highest level in two years, before receding in late September. Stock draws pushed physical diesel markets into sharper backwardation. By early October, US diesel exports to Europe and Latin America ramped up but were still below capacity.
Spot crude oil prices and differentials
Table Unavailable Available in the subscription version.
To subscribe, visit: www.iea.org/oilmarketreport/subscription

PRICES INTERNATIONAL ENERGY AGENCY - OIL MARKET REPORT
42 12 OCTOBER 2017
Gasoline prices reacted sharply higher in late August and kept their premium to pre-hurricane levels until the middle of September, before easing considerably in line with the switch to the cheaper winter specification in Europe and North America. Rotterdam premium unleaded gasoline barges gained $4.40/bbl on the month to reach $70.04/bbl, while US Gulf unleaded gasoline pipeline prices rose $1.75/bbl to $72.51/bbl. The price spread between US high and low-octane gasoline widened significantly after the hurricane, as Gulf Coast refiners gave priority to basic grades. By the middle of September, however, octane spreads had returned to previous levels. European refiners sent large amounts of gasoline to the US East Coast in the first half of September, although the arbitrage window progressively closed thereafter. It was replaced by import demand from Brazil and Mexico – which were hit hard by the temporary shutdown of US exports – and robust demand from the Middle East and West Africa. Up to 5.5 mb of European reformate, an octane enhancer, also departed for China. Singapore gasoline prices were supported by the hurricane and a subsequent increase in demand from Mexico, a relatively rare arbitrage, but the price increase in Asia was less than elsewhere and in line with crude.
8
12
16
20
24
Apr 17 Jun 17 Aug 17 Oct 17
$/bblDiesel Fuel
Cracks to Benchmark Crudes
NWE ULSD USGC ULSDMed ULSD SP Gasoil 0.05%
SS
Copyright © 2017 Argus Media Ltd
-5
-3
-1
1
3
Apr 17 Jun 17 Aug 17 Oct 17
$/bblNaphtha
Cracks to Benchmark Crudes
NWE SP Med ME Gulf
Copyright © 2017 Argus Media Ltd
Naphtha prices followed gasoline higher and even surpassed it in Asia, home to the largest petrochemical production cluster, reflecting tight supplies of condensate in the Middle East and strong demand from crackers. Singapore naphtha cargo prices were up $4.62/bbl to $55.20/bbl on average in September. Maintenance at Iran’s South Pars field curbed condensate supply, which yields particularly large amounts of naphtha, thus boosting the price. Low stocks, linked to relatively low cargo arrivals in Asia in recent months, and higher LPG prices following the passage of Hurricane Harvey and ahead of the winter season in the northern hemisphere incentivised demand from petrochemical manufacturers. Asian and European physical naphtha markets were both trading in backwardation by the end of the month, reflecting strong market fundamentals. Fuel oil prices matched increases in crude during September, but generally lagged behind other oil products. That being said, fuel oil strengthened progressively through the month as increased demand reduced stocks in the key storage hubs of Rotterdam and Singapore. The Asian market, in particular, rose in the second half of September after it had spent several weeks in the doldrums. Month 1 380 centistoke fuel oil cargo swaps traded at a steep $0.47/bbl premium to Month 2 in late September, the highest differential recorded since February, before easing in early October. Cargo arrivals into Asia are likely to fall in October and November as the fuel oil arbitrage from Europe to Asia remained shut until the middle of September, and as poor weather in the Caribbean hampered exports. Meanwhile, bunker fuel demand in Singapore was higher year-on-year and dry bulk shipping indices strengthened, pointing to higher shipping traffic. In Europe, outright fuel oil prices increased in line with crude while physical cargoes traded at a stable differential to swaps. Global fuel oil prices were buoyed in late 2016 by OPEC’s decision to cut output of its mainly sour crudes and, as a result, global fuel oil stockpiles have followed a downward trend.

INTERNATIONAL ENERGY AGENCY - OIL MARKET REPORT PRICES
12 OCTOBER 2017 43
Freight Freight for VLCCs on the Middle East Gulf (MEG) to Asia route averaged $0.83/bbl in September, up a little from August but near historical lows. The rate rose in late September and early October with higher demand for crude exports to Asian refineries. VLCC rates have fallen to their lowest level ever this year due to a combination of factors, including lower OPEC crude exports and the building of new ships. Suezmax rates on the West Africa to Northwest Europe route rose $0.12/bbl to $1.06/bbl as European refineries increased crude imports amid stellar margins for diesel and gasoline. Baltic Aframax rates also gained sharply with higher refinery demand, rising from $0.59/bbl in August to $0.78/bbl in September. Aframax rates in the Caribbean were supported in the first half of September by weather delays. Clean product freight on the UK Continent-US Atlantic Coast route stayed elevated in the first half of September due to strong exports of gasoline from Europe to the East Coast, following hurricane Harvey. By end-September, the rate was $1.61/bbl, down from the peak of $3.22/bbl reached at the end of August, but was still higher than before the hurricane. Rates in the US Gulf suffered from the steep fall in oil product exports from the region. East of Suez, the Long Range MEG-Japan rate stayed unchanged, even if stronger naphtha imports in Asia pushed it higher in late September. Medium Range tanker rates firmed with higher shipments to Australia and Latin America.
Spot product prices
Table Unavailable Available in the subscription version.
To subscribe, visit: www.iea.org/oilmarketreport/subscription

REFINING INTERNATIONAL ENERGY AGENCY - OIL MARKET REPORT
44 12 OCTOBER 2017
REFINING Summary • Our estimate for 3Q17 refining throughput has been revised up by 0.4 mb/d to 80.8 mb/d, on higher
European and OECD Asia crude runs. Year-on-year (y-o-y) growth reaches 0.7 mb/d. • Our forecast for 4Q17 sees global refinery intake edging up 0.1 mb/d quarter-on-quarter (q-o-q), to
80.9 mb/d, up 0.9 mb/d y-o-y. From September to December, global refining throughput is expected to increase by 2.9 mb/d.
• The global increase in refining margins caused by Hurricane Harvey has largely vanished, but
margins remain at comfortable levels. Global refined product markets look balanced in 4Q17, after draws in 2Q17 and 3Q17.
• Our first forecast for January 2018 implies 1.2 mb/d y-o-y growth, with large gains in non-OECD, although throughput declines by 0.4 mb/d from December levels to just under 82 mb/d.
Global refinery overview Strong preliminary throughput data for OECD Europe and Asia in August, as well as a slightly faster than expected recovery in the US in September, pushed the estimate for 3Q17 global throughput higher, partly offsetting our Harvey-related downgrade in last month’s Report. For 3Q17, throughput is now estimated at 80.8 mb/d, a historical record, which, however, is expected to be broken in 4Q17, albeit by a small margin of 0.1 mb/d. The upwardly revised 3Q17 throughput is still not sufficient to stem refined product stock draws globally. On the other hand, a 0.2 mb/d downward revision to 4Q17 demand growth means that refined product markets on aggregate are balanced through year-end. For the year as a whole, 2017 will see throughput grow by 0.9 mb/d, well below the estimated growth in refined products demand, estimated at about 1.4 mb/d.
Global Refinery Crude Throughput1(million barrels per day)
2016 2Q17 Aug 17 Sep 17 3Q17 Oct 17 Nov 17 Dec 17 4Q17 2017 Jan 18
Americas 18.9 20.0 19.6 17.8 19.1 18.3 19.5 19.7 19.2 19.3 19.3 Europe 11.9 12.0 12.6 12.5 12.5 12.2 12.4 12.5 12.4 12.2 12.3 Asia Oceania 6.9 6.6 7.2 6.9 7.0 6.5 7.0 7.4 7.0 7.0 7.4 Total OECD 37.8 38.6 39.4 37.1 38.7 37.1 38.9 39.5 38.5 38.5 39.0
FSU 6.8 6.7 6.9 6.7 6.9 6.8 7.0 7.0 6.9 6.8 7.0 Non-OECD Europe 0.5 0.5 0.5 0.5 0.5 0.5 0.5 0.5 0.5 0.5 0.5 China 10.8 11.0 11.1 11.3 11.0 11.3 11.2 11.3 11.3 11.1 11.3 Other Asia 10.4 10.3 10.4 10.5 10.4 10.5 10.5 10.6 10.5 10.4 10.6 Latin America 4.2 3.8 3.8 3.8 3.8 3.9 3.9 4.0 3.9 3.9 4.0 Middle East 7.2 7.3 7.4 7.4 7.4 7.3 7.3 7.3 7.3 7.3 7.4 Africa 2.0 2.0 2.1 2.0 2.0 1.9 1.9 2.1 2.0 2.0 2.0 Total Non-OECD 41.9 41.6 42.1 42.2 42.1 42.2 42.3 42.7 42.4 42.1 42.9
Total 79.7 80.2 81.6 79.4 80.8 79.3 81.3 82.3 80.9 80.5 81.9 Year-on-year change 0.5 1.5 1.0 0.6 0.7 0.9 1.2 0.6 0.9 0.9 1.2
1 Preliminary and estimated runs based on capacity, know n outages, economic runcuts and global demand forecast
7072747678808284
Jan Mar May Jul Sep Nov Jan
mb/d Global RefiningCrude Throughput
Range 10-16 Average 10-162016 20172017 est 2018 est

INTERNATIONAL ENERGY AGENCY - OIL MARKET REPORT REFINING
12 OCTOBER 2017 45
Global crude oil and refined product balances Our global oil balance has changed slightly from the previous Report, following updates to historical data and revisions to supply and demand forecasts. Markets were balanced in 1Q17, while the rest of the year sees inventories declining. For 2017 as a whole, global oil stocks are expected to draw by 0.3 mb/d on average. Moreover, for the first time since 2013, there could be no visible builds in any of the quarters.
Global crude oil balances
Looking at crude oil and refined product markets separately reveals the nuances that are otherwise hidden behind headline oil balances. After a small build in 1Q17, global crude oil balances show draws in 2Q17 and 3Q17, at an average rate of 0.5 mb/d. Moreover, net of implied Chinese crude oil stockbuilds, the rest of the world has seen an average crude oil stock draw of 1.1 mb/d since the start of the year. Year-to-date OECD crude oil stock change, including preliminary data for August-September, has amounted to about 0.3 mb/d of draws. Changes in volumes in floating storage and oil in transit (which are mostly crude oil), account for another 0.4 mb/d decline (see Stocks). The remainder, a 0.3 mb/d draw, likely comes from non-OECD countries excluding China.
In 4Q17, our forecast of crude oil demand (refinery throughput plus direct use of crude oil) and supply (crude oil and condensate supply for non-OPEC, with OPEC crude production assumed flat from September levels) imply a small build of 0.3 mb/d. We do not forecast Chinese stockbuilding.
The outlook for 2018 is quite interesting. Modelling global refinery throughput at a level to meet refined product demand on aggregate, and, with OPEC crude oil output assumed, for the purposes of this exercise, at 32.7 mb/d throughout the year, the crude oil market looks balanced on average. Obviously, the possibility of seasonal builds and draws is not excluded, given the normal swings in crude oil demand. However, the point is that, assuming a balanced refined products market, crude oil markets are also balanced with OPEC production at 32.7 mb/d in 2018. If China continues to build crude oil stocks, the required volumes would have to come from stockholdings elsewhere, as it has been the case so far this year.
The main reason behind a tighter crude oil balance presented in this month’s report is our upgrade to the 3Q17 refinery throughput estimate, following stronger than expected August performance in Europe and OECD Asia and lower crude oil output.
.
Crude Oil and Refined Product Balances(million barrels per day)
2015 1Q16 2Q16 3Q16 4Q16 2016 1Q17 2Q17 3Q17 4Q17 2017World total demand 94.8 95.4 95.6 96.7 96.8 96.1 96.6 97.8 97.9 98.5 97.7 World total supply 96.6 96.7 96.1 97.0 98.2 97.0 96.7 97.0 97.8 98.2 97.4
World balance1 1.7 1.3 0.5 0.3 1.4 0.9 0.0 -0.8 -0.1 -0.3 -0.3 Refined product demand 80.8 81.3 81.6 82.6 81.6 81.8 82.1 83.6 83.4 83.2 83.1 Refined product supply 81.4 82.1 81.0 82.4 82.3 82.0 82.5 82.5 83.1 83.2 82.8
Refined product balance 0.6 0.9 -0.5 -0.3 0.7 0.2 0.4 -1.1 -0.3 0.0 -0.2 MemoOECD refined product actual stock change 2 0.3 0.4 -0.3 0.0 -0.1 0.0 0.0 -0.3 0.2 Non-OECD refined product implied stock change 0.4 0.5 -0.2 -0.2 0.7 0.2 0.4 -0.8 -0.5 Crude oil demand 80.6 81.0 80.3 81.6 81.3 81.1 81.4 81.7 82.4 82.2 81.9 Crude and condensate supply1 81.6 82.0 80.6 81.4 82.9 81.7 81.6 81.3 81.8 82.5 81.8
Crude oil balance 1.0 1.0 0.3 -0.2 1.7 0.7 0.2 -0.4 -0.6 0.3 -0.1 MemoOECD crude oil actual stock change 2 0.4 0.1 -0.1 -0.6 -0.2 -0.2 0.5 -0.8 -0.7 Non-OECD crude oil implied stock change 0.6 0.9 0.4 0.3 1.9 0.9 -0.2 0.3 0.1 China crude oil balance 0.3 0.4 0.6 0.7 0.2 0.5 0.8 1.2 0.5 Floating storage/oil in transit 2 0.3 0.2 0.3 -0.2 0.2 0.1 -0.3 -0.3 -0.7 Other Non-OECD crude oil stock change 0.0 0.3 -0.5 -0.2 1.5 0.3 -0.7 -0.5 0.4
Non-refined product (LPG) stock change 0.1 -0.6 0.7 0.7 -0.9 0.0 -0.6 0.7 0.7 1 4Q17 OPEC crude oil output assumed flat from September levels2 Includes preliminary numbers for August and September 2017
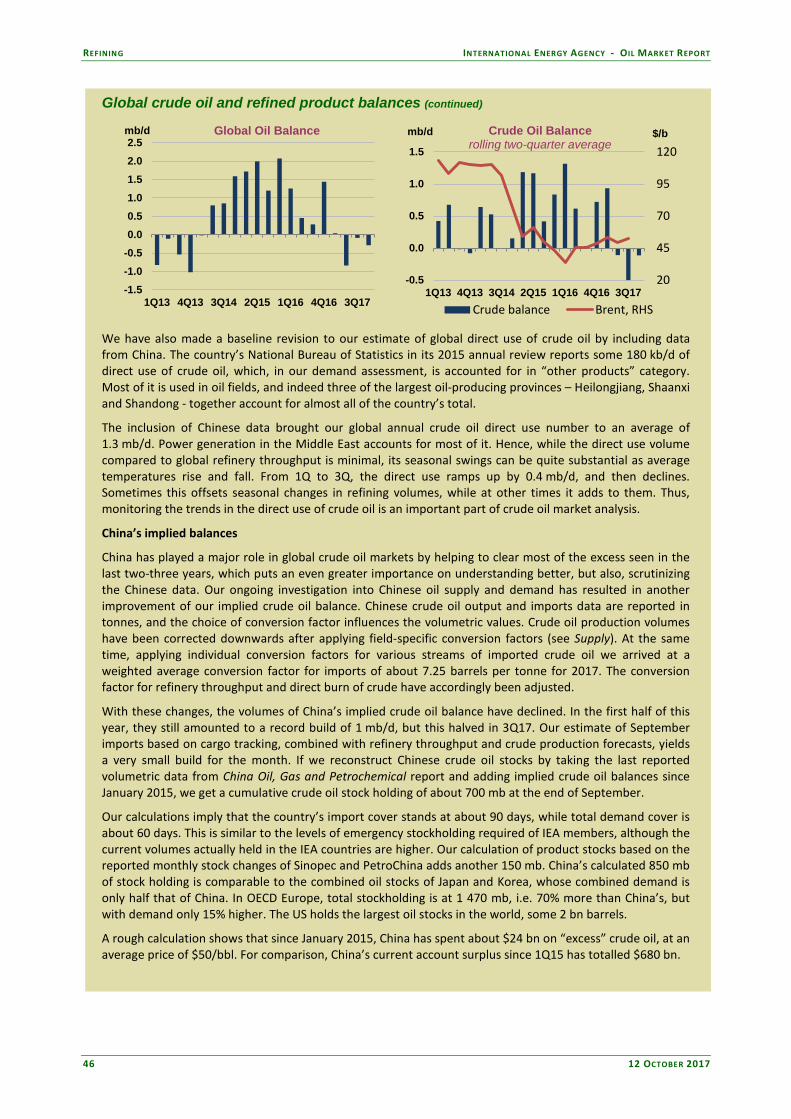
REFINING INTERNATIONAL ENERGY AGENCY - OIL MARKET REPORT
46 12 OCTOBER 2017
Global crude oil and refined product balances (continued)
-1.5-1.0-0.50.00.51.01.52.02.5
1Q13 4Q13 3Q14 2Q15 1Q16 4Q16 3Q17
mb/d Global Oil Balance
20
45
70
95
120
-0.5
0.0
0.5
1.0
1.5
1Q13 4Q13 3Q14 2Q15 1Q16 4Q16 3Q17
$/bmb/d Crude Oil Balancerolling two-quarter average
Crude balance Brent, RHS
We have also made a baseline revision to our estimate of global direct use of crude oil by including data from China. The country’s National Bureau of Statistics in its 2015 annual review reports some 180 kb/d of direct use of crude oil, which, in our demand assessment, is accounted for in “other products” category. Most of it is used in oil fields, and indeed three of the largest oil-producing provinces – Heilongjiang, Shaanxi and Shandong - together account for almost all of the country’s total.
The inclusion of Chinese data brought our global annual crude oil direct use number to an average of 1.3 mb/d. Power generation in the Middle East accounts for most of it. Hence, while the direct use volume compared to global refinery throughput is minimal, its seasonal swings can be quite substantial as average temperatures rise and fall. From 1Q to 3Q, the direct use ramps up by 0.4 mb/d, and then declines. Sometimes this offsets seasonal changes in refining volumes, while at other times it adds to them. Thus, monitoring the trends in the direct use of crude oil is an important part of crude oil market analysis.
China’s implied balances
China has played a major role in global crude oil markets by helping to clear most of the excess seen in the last two-three years, which puts an even greater importance on understanding better, but also, scrutinizing the Chinese data. Our ongoing investigation into Chinese oil supply and demand has resulted in another improvement of our implied crude oil balance. Chinese crude oil output and imports data are reported in tonnes, and the choice of conversion factor influences the volumetric values. Crude oil production volumes have been corrected downwards after applying field-specific conversion factors (see Supply). At the same time, applying individual conversion factors for various streams of imported crude oil we arrived at a weighted average conversion factor for imports of about 7.25 barrels per tonne for 2017. The conversion factor for refinery throughput and direct burn of crude have accordingly been adjusted.
With these changes, the volumes of China’s implied crude oil balance have declined. In the first half of this year, they still amounted to a record build of 1 mb/d, but this halved in 3Q17. Our estimate of September imports based on cargo tracking, combined with refinery throughput and crude production forecasts, yields a very small build for the month. If we reconstruct Chinese crude oil stocks by taking the last reported volumetric data from China Oil, Gas and Petrochemical report and adding implied crude oil balances since January 2015, we get a cumulative crude oil stock holding of about 700 mb at the end of September.
Our calculations imply that the country’s import cover stands at about 90 days, while total demand cover is about 60 days. This is similar to the levels of emergency stockholding required of IEA members, although the current volumes actually held in the IEA countries are higher. Our calculation of product stocks based on the reported monthly stock changes of Sinopec and PetroChina adds another 150 mb. China’s calculated 850 mb of stock holding is comparable to the combined oil stocks of Japan and Korea, whose combined demand is only half that of China. In OECD Europe, total stockholding is at 1 470 mb, i.e. 70% more than China’s, but with demand only 15% higher. The US holds the largest oil stocks in the world, some 2 bn barrels.
A rough calculation shows that since January 2015, China has spent about $24 bn on “excess” crude oil, at an average price of $50/bbl. For comparison, China’s current account surplus since 1Q15 has totalled $680 bn.

INTERNATIONAL ENERGY AGENCY - OIL MARKET REPORT REFINING
12 OCTOBER 2017 47
Global crude oil and refined product balances (continued)
The availability of hard currency is definitely not an issue, but could China be nearing full storage capacity? Various sources put country’s total storage capacity between 800 – 1 000 mb, although it is not clear whether underground sites are included. News reports in early 2016 mentioned 130 mb of total underground storage capacity in five sites under construction, all of which were expected to start operations by mid-2017.
-1.0
-0.5
0.0
0.5
1.0
1.5
Jan 15 Jul 15 Jan 16 Jul 16 Jan 17 Jul 17
mb/d Chinese implied crude balance
-
200
400
600
800
-
20
40
60
80
100
Jan 15 Jul 15 Jan 16 Jul 16 Jan 17 Jul 17
mb
hd
days China's implied crude stocks
Stocks (RHS) days of demand coverdays of import cover
If we use the upper limit of the range of Chinese storage capacity estimates, some 150 mb could still be available. If filling continues at a rate similar to 2017’s year-to-date average, it would take another six months to reach full capacity. Thus, the sharp slowdown seen in August-September may yet prove temporary.
Global refined product markets
We reconstructed global refined product inventories using IEA data for OECD stocks and JODI data for non-OECD stocks as of end-2012 (as since then the number of reporting countries has decreased), and then added our implied quarterly stock changes. We estimate global refined product stocks at about 2 billion barrels, or about 24 days of forward demand cover. Two thirds of these are in OECD countries. After large draws in 2Q17, global refined product inventories saw a moderate decline in 3Q17, which, however, is counterseasonal. In 4Q17, the market is expected to be almost balanced.
-1.5
-1.0
-0.5
0.0
0.5
1.0
1Q13 4Q13 3Q14 2Q15 1Q16 4Q16 3Q17
mb/d Refined Product Balance
15
20
25
30
0.0
0.5
1.0
1.5
2.0
2.5
1Q13 1Q14 1Q15 1Q16 1Q17
daysbn b Global refined product stocks and days of cover
modelled global product stocksdays of demand cover (RHS)
The role of non-refined products
We have already specified, our breakdown of global balances into refined products and crude oil balances does not include a small proportion of the global oil market – the non-refinery NGLs, with LPG being the largest component. The US, Japan and Korea are big users of heating propane, which has a strong seasonality pattern: stock build in summer and draws in winter. If we assume that this year LPG quarterly stock builds follow the pattern of last three years, then 2Q-3Q would have seen builds of about 0.6 mb/d, with 1Q and 4Q drawing about as much. This helps to explain the gap between the headline global oil demand balance in our Table 1 on one hand, and the sum of crude oil and refined product balances on the other hand.
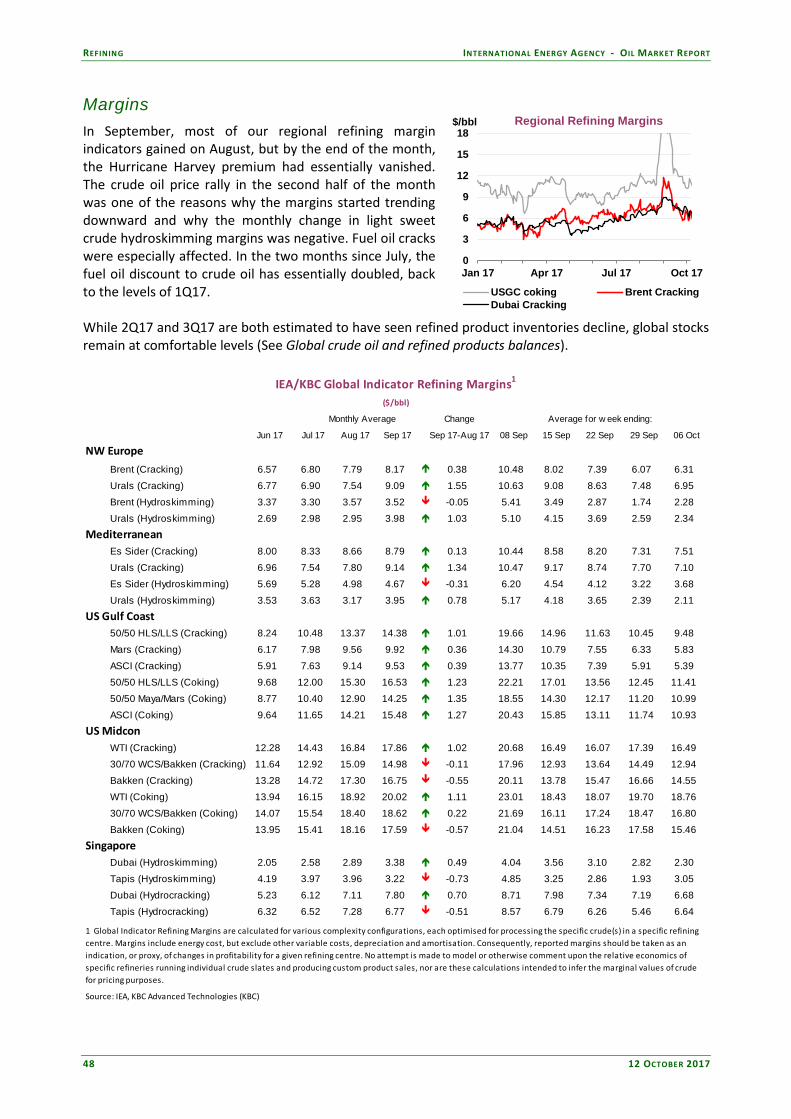
REFINING INTERNATIONAL ENERGY AGENCY - OIL MARKET REPORT
48 12 OCTOBER 2017
Margins In September, most of our regional refining margin indicators gained on August, but by the end of the month, the Hurricane Harvey premium had essentially vanished. The crude oil price rally in the second half of the month was one of the reasons why the margins started trending downward and why the monthly change in light sweet crude hydroskimming margins was negative. Fuel oil cracks were especially affected. In the two months since July, the fuel oil discount to crude oil has essentially doubled, back to the levels of 1Q17. While 2Q17 and 3Q17 are both estimated to have seen refined product inventories decline, global stocks remain at comfortable levels (See Global crude oil and refined products balances).
IEA/KBC Global Indicator Refining Margins1
($/bbl)
Monthly Average Change Average for w eek ending:
Jun 17 Jul 17 Aug 17 Sep 17 Sep 17-Aug 17 08 Sep 15 Sep 22 Sep 29 Sep 06 Oct
NW Europe
Brent (Cracking) 6.57 6.80 7.79 8.17 0.38 10.48 8.02 7.39 6.07 6.31
Urals (Cracking) 6.77 6.90 7.54 9.09 1.55 10.63 9.08 8.63 7.48 6.95
Brent (Hydroskimming) 3.37 3.30 3.57 3.52 -0.05 5.41 3.49 2.87 1.74 2.28
Urals (Hydroskimming) 2.69 2.98 2.95 3.98 1.03 5.10 4.15 3.69 2.59 2.34
MediterraneanEs Sider (Cracking) 8.00 8.33 8.66 8.79 0.13 10.44 8.58 8.20 7.31 7.51
Urals (Cracking) 6.96 7.54 7.80 9.14 1.34 10.47 9.17 8.74 7.70 7.10
Es Sider (Hydroskimming) 5.69 5.28 4.98 4.67 -0.31 6.20 4.54 4.12 3.22 3.68
Urals (Hydroskimming) 3.53 3.63 3.17 3.95 0.78 5.17 4.18 3.65 2.39 2.11
US Gulf Coast50/50 HLS/LLS (Cracking) 8.24 10.48 13.37 14.38 1.01 19.66 14.96 11.63 10.45 9.48
Mars (Cracking) 6.17 7.98 9.56 9.92 0.36 14.30 10.79 7.55 6.33 5.83
ASCI (Cracking) 5.91 7.63 9.14 9.53 0.39 13.77 10.35 7.39 5.91 5.39
50/50 HLS/LLS (Coking) 9.68 12.00 15.30 16.53 1.23 22.21 17.01 13.56 12.45 11.41
50/50 Maya/Mars (Coking) 8.77 10.40 12.90 14.25 1.35 18.55 14.30 12.17 11.20 10.99
ASCI (Coking) 9.64 11.65 14.21 15.48 1.27 20.43 15.85 13.11 11.74 10.93
US MidconWTI (Cracking) 12.28 14.43 16.84 17.86 1.02 20.68 16.49 16.07 17.39 16.49
30/70 WCS/Bakken (Cracking) 11.64 12.92 15.09 14.98 -0.11 17.96 12.93 13.64 14.49 12.94
Bakken (Cracking) 13.28 14.72 17.30 16.75 -0.55 20.11 13.78 15.47 16.66 14.55
WTI (Coking) 13.94 16.15 18.92 20.02 1.11 23.01 18.43 18.07 19.70 18.76
30/70 WCS/Bakken (Coking) 14.07 15.54 18.40 18.62 0.22 21.69 16.11 17.24 18.47 16.80
Bakken (Coking) 13.95 15.41 18.16 17.59 -0.57 21.04 14.51 16.23 17.58 15.46
SingaporeDubai (Hydroskimming) 2.05 2.58 2.89 3.38 0.49 4.04 3.56 3.10 2.82 2.30
Tapis (Hydroskimming) 4.19 3.97 3.96 3.22 -0.73 4.85 3.25 2.86 1.93 3.05
Dubai (Hydrocracking) 5.23 6.12 7.11 7.80 0.70 8.71 7.98 7.34 7.19 6.68
Tapis (Hydrocracking) 6.32 6.52 7.28 6.77 -0.51 8.57 6.79 6.26 5.46 6.64
1 Global Indicator Refining Margins are calculated for various complexity configurations, each optimised for processing the specific crude(s) in a specific refining centre. Margins include energy cost, but exclude other variable costs, depreciation and amortisation. Consequently, reported margins should be taken as an indication, or proxy, of changes in profitability for a given refining centre. No attempt is made to model or otherwise comment upon the relative economics of specific refineries running individual crude slates and producing custom product sales, nor are these calculations intended to infer the marginal values of crude for pricing purposes.
Source: IEA, KBC Advanced Technologies (KBC)
0
3
6
9
12
15
18
Jan 17 Apr 17 Jul 17 Oct 17
$/bbl Regional Refining Margins
USGC coking Brent CrackingDubai Cracking

INTERNATIONAL ENERGY AGENCY - OIL MARKET REPORT REFINING
12 OCTOBER 2017 49
OECD refinery throughput OECD July refinery throughput was finalised 0.3 mb/d higher from the preliminary data, and August preliminary numbers revealed a much stronger than expected performance in Europe and Asia. The estimate for September US runs, based on weekly data, also implied a somewhat faster post-Harvey recovery. With this, 3Q17 OECD refining intake is revised up by 0.6 mb/d to 38.7 mb/d, the highest rate since 2008. The 4Q17 forecast is revised up by 0.3 mb/d, with runs seasonally declining by 0.2 mb/d. For 2017 as a whole, OECD refiners are expected to register 0.7 mb/d y-o-y growth for crude runs. In January 2018, refining throughput is expected to increase by 0.3 mb/d y-o-y, while seasonally declining from December.
Refinery Crude Throughput and Utilisation in OECD Countries(million barrels per day)
Change from Utilisation rate1
Mar 17 Apr 17 May 17 Jun 17 Jul 17 Aug 17 Jul 17 Aug 16 Aug 17 Aug 16
US2 16.03 16.97 17.21 17.21 17.32 16.88 -0.44 0.29 93% 92%Canada 1.77 1.68 1.77 1.81 1.78 1.83 0.06 0.08 95% 91%Chile 0.18 0.16 0.19 0.20 0.18 0.17 -0.01 0.00 76% 75%Mexico 0.98 0.98 0.94 0.81 0.67 0.75 0.08 -0.10 45% 51%
OECD Americas3 18.96 19.78 20.10 20.02 19.94 19.63 -0.31 0.27 89% 89%
France 1.05 1.15 1.11 1.16 1.19 1.23 0.04 0.01 99% 87%Germany 1.84 1.95 1.74 1.77 1.89 1.90 0.01 -0.10 94% 99%Italy 1.31 1.33 1.29 1.41 1.48 1.51 0.03 0.10 86% 80%Netherlands 1.13 1.19 1.13 1.03 1.06 0.92 -0.14 -0.18 71% 85%Spain 1.28 1.36 1.25 1.23 1.39 1.43 0.03 0.10 100% 93%United Kingdom 1.09 1.12 1.08 1.13 1.09 1.12 0.03 0.00 89% 81%Other OECD Europe 4.22 4.05 4.24 4.30 4.45 4.47 0.02 0.19 92% 88%
OECD Europe 11.92 12.14 11.83 12.03 12.55 12.57 0.03 0.12 91% 88%
Japan 3.21 3.18 2.91 2.76 3.15 3.31 0.15 0.08 96% 87%South Korea 3.03 2.88 2.95 2.79 3.10 3.11 0.01 0.22 98% 94%Other Asia Oceania 0.64 0.78 0.81 0.80 0.81 0.81 0.00 0.04 93% 89%
OECD Asia Oceania 6.88 6.84 6.67 6.35 7.06 7.22 0.16 0.34 96% 90%OECD Total 37.77 38.76 38.61 38.40 39.55 39.42 -0.13 0.73 91% 89%
1 Expressed as a percentage, based on crude throughput and current operable refining capacity2 US503 OECD Americas includes Chile and OECD Asia Oceania includes Israel. OECD Europe includes Slovenia and Estonia, though neither country has a refinery Hurricane Harvey caused August and September refinery throughput in the US to fall from the monthly average rates of above 17 mb/d. We expect runs to recover to these levels in November-December. Planned maintenance in October, and a smaller impact from precautionary shutdowns in Louisiana for Hurricane Nate, are expected to weigh on October refinery intake. In 4Q17, y-o-y growth, interrupted by Harvey, resumes, with runs up 460 kb/d. January runs are expected to decline from December levels, but will still be 400 kb/d higher y-o-y.
32
34
36
38
40
Jan Mar May Jul Sep Nov Jan
mb/d OECD TotalCrude Throughput
Range 10-16 Average 10-162016 20172017 est 2018 est

REFINING INTERNATIONAL ENERGY AGENCY - OIL MARKET REPORT
50 12 OCTOBER 2017
13
14
15
16
17
18
Jan Mar May Jul Sep Nov Jan
mb/d US Crude Throughput
Range 10-16 Average 10-162016 20172017 est 2018
0.4
0.6
0.8
1.0
1.2
1.4
Jan Mar May Jul Sep Nov Jan
mb/d Mexico Crude Throughput
Range 10-16 Average 10-162016 20172017 est 2018
In Mexico, a small recovery in August, and then a shutdown of the country’s largest refinery, Salina Cruz, at the end of the month caused a zigzag pattern in refining throughput. In September, intake is estimated to have hit a new low, with runs under 600 kb/d. The restart of Salina Cruz, originally slated for end-September, is now delayed until well into October. The refinery is located in an area that was recently stricken by an earthquake, but facilities were reported to be undamaged. The start of the eventual recovery of Mexican throughput is pushed back yet again to the last months of the year. For 2017 as a whole, throughput is forecast to decline by 120 kb/d, making it the fourth consecutive year of declining activity.
10.010.511.011.512.012.513.013.5
Jan Mar May Jul Sep Nov Jan
mb/d OECD Europe Crude Throughput
Range 10-16 Average 10-162016 20172017 est 2018 est
1.0
1.2
1.4
1.6
1.8
2.0
Jan Mar May Jul Sep Nov Jan
mb/d Italy Crude Throughput
Range 10-16 Average 10-162016 20172017 est 2018
Preliminary numbers for August refinery intake in OECD Europe came in much stronger than expected, mostly thanks to unusually high throughput in France and Italy. French refiners in particular ran flat out, with utilisation rates at 99%. Italy not only reached the highest throughput in five years, at 1.5 mb/d, in August, but its July throughput was also finalised some 150 kb/d higher, to just under 1.5 mb/d. After 3Q17’s 260 kb/d y-o-y increase, 4Q17 runs in OECD Europe are expected almost flat y-o-y, seasonally declining by 170 kb/d. January 2018 runs are forecast at 12.3 mb/d, also flat y-o-y. OECD Asia too, had a very strong month in August, with runs reaching 7.2 mb/d, a level more typical of peak winter demand. South Korean refiners did not pause for refinery maintenance as much as expected. Regional throughput is however, expected to decline in September-October for maintenance before picking up again in November. In 4Q17, throughput is forecast to be flat y-o-y, but runs in January 2018 are expected to decline by 60 kb/d y-o-y.

INTERNATIONAL ENERGY AGENCY - OIL MARKET REPORT REFINING
12 OCTOBER 2017 51
5.5
6.0
6.5
7.0
7.5
Jan Mar May Jul Sep Nov Jan
mb/d OECD Asia OceaniaCrude Throughput
Range 10-16 Average 10-162016 20172016 est 2018 est
2.02.22.42.62.83.03.23.4
Jan Mar May Jul Sep Nov Jan
mb/d South Korea Crude Throughput
Range 10-16 Average 10-162016 20172017 est 2018
Non-OECD refinery throughput June and July estimates for non-OECD throughput have been revised up by 0.1 mb/d on the basis of fresh data. Our forecast for 3Q17 however, is lowered by 0.2 mb/d, to 42.1 mb/d, as August and September throughput estimates are revised down in the FSU and the Middle East due to new maintenance programmes. For 4Q17, our forecast is also downgraded by 0.2 mb/d following a downward revision to demand. With these revisions, total non-OECD throughput is expected to edge up by 0.2 mb/d in 2017 as a whole. In January 2018, y-o-y growth is expected at 0.9 mb/d, with non-OECD taking over the leading role again.
34
36
38
40
42
44
Jan Mar May Jul Sep Nov Jan
mb/d Non-OECD Total Crude Throughput
Range 10-16 Average 10-162016 20172017 est 2018 est …..
3032343638404244
1Q04
1Q05
1Q06
1Q07
1Q08
1Q09
1Q10
1Q11
1Q12
1Q13
1Q14
1Q15
1Q16
1Q17
mb/d OECD vs. Non-OECD Crude Runs
OECD Non-OECD We have made important changes to our assessment of China’s refining throughput. First, we have lowered the conversion factor applied to the crude throughput data reported by the National Bureau of Statistics (NBS) (See Global crude oil and refined product balances). We now calculate the weighted average conversion factors of local crude oil output and imports on a monthly basis and apply it to refinery throughput. This has brought the volumetric throughput down by about 100 kb/d. Second, we now apply an assumption of unreported runs. As we discussed in the August Report, we believe some 100 kb/d throughput is not included in the official statistics, although this number likely varies from month to month. We think one of the main reasons for underreporting is technical. It appears that NBS does not always capture the first months of operations at new units. For example, Petrochina’s Anning refinery, according to various sources, started commercial operations in August, but the host province’s (Yunnan) refinery throughput data was still reported as zero. It is our understanding that historical revisions are not made; hence, the uncaptured throughput is “lost” to the statistics. With this, our August refining throughput number has turned out some 90 kb/d lower than our forecast. For the remainder of the year though the forecast has been revised up by an average 50 kb/d. 2017 throughput is forecast to increase by 370 kb/d. In January, runs are expected to stay flat from December, and only 40 kb/d up year-on-year.

REFINING INTERNATIONAL ENERGY AGENCY - OIL MARKET REPORT
52 12 OCTOBER 2017
7
8
9
10
11
12
Jan Mar May Jul Sep Nov Jan
mb/d ChinaCrude Throughput
Range 10-16 Average 10-162016 20172017 est 2018 est
8.0
8.5
9.0
9.5
10.0
10.5
11.0
Jan Mar May Jul Sep Nov Jan
mb/d Other Asia Crude Throughput
Range 10-16 Average 10-162016 20172017 est 2018
Indian throughput edged up by a small 40 kb/d in August from July levels. Our forecast for 3Q17 and 4Q17 is revised down by about 40 kb/d. This means that for 2017, the y-o-y change is almost flat, with runs up by only 30 kb/d. Chinese Taipei and Thailand reported stronger runs in August. The prospects of growth in this region in the next few months are rather subdued until the new refinery in Vietnam, the Nghi Son facility, enters commercial operation at some point during 1Q18.
5.5
6.0
6.5
7.0
7.5
Jan Mar May Jul Sep Nov Jan
mb/d FSUCrude Throughput
Range 10-16 Average 10-162016 20172017 est 2018 est
5.5
6.0
6.5
7.0
7.5
8.0
Jan Mar May Jul Sep Nov Jan
mb/d Middle EastCrude Throughput
Range 10-16 Average 10-162016 20172017 est 2018 est
Russian September preliminary data came in 100 kb/d lower, and we revised our 4Q17 forecast down by 70 kb/d on new maintenance information. Our 3Q17 estimate for Belarus has been revised down by 90 kb/d due to a major maintenance programme in August. After two consecutive years of annual declines, FSU throughput is expected to stabilise this year. The Middle East saw some historical revisions this month as Iran published missing data for May and June, with runs stronger than previously reported by 40 kb/d and 60 kb/d respectively. Iraq’s July actual number was lower by 60 kb/d, while Saudi Arabia’s was higher by 40 kb/d. Overall, our 3Q17 estimate for Middle East throughput is revised down by 80 kb/d to 7.4 mb/d. Throughput in 4Q17 is forecast to decline by some 100 kb/d, most of which is due to a planned maintenance in Saudi Arabia. For the year as a whole, Middle East throughput is estimated to be up by 90 kb/d on 2016, the lowest growth rate in four years. In Latin America, throughput continues to recover month-on-month. Brazil’s refining intake likely bottomed out in July, with August runs already back above 1.7 mb/d. Throughput is expected to continue growing, although we do not forecast it to reach the 1.8 mb/d level this year, and for the year as a whole, it still means a decline of 130 kb/d. There is no fresh news on Venezuela, and we continue to assume very low utilisation rates with throughput under 500 kb/d. This year the region as a whole is expected to see the strongest annual decline in runs since the closure of Aruba’s refinery in 2012, with throughput down some 340 kb/d y-o-y.

INTERNATIONAL ENERGY AGENCY - OIL MARKET REPORT REFINING
12 OCTOBER 2017 53
3.5
4.0
4.5
5.0
5.5
Jan Mar May Jul Sep Nov Jan
mb/d Latin AmericaCrude Throughput
Range 10-16 Average 10-162016 20172017 est 2018 est
1.6
1.8
2.0
2.2
2.4
2.6
Jan Mar May Jul Sep Nov Jan
mb/d AfricaCrude Throughput
Range 10-16 Average 10-162016 20172017 est 2018 est
Nigerian throughput continued trending lower, falling to just under 50 kb/d in July, its lowest level this year. Chevron’s South African refinery, along with other downstream assets in the country, was announced as a takeover target for commodities trading firm Glencore. The near-term outlook for the continent’s refining industry, however, remains largely uninspiring, with most of the countries continuing to rely on imported products.

TABLES INTERNATIONAL ENERGY AGENCY - OIL MARKET REPORT
54 12 OCTOBER 2017
TABLES Table 1: World Oil Supply And Demand 2014 2015 1Q16 2Q16 3Q16 4Q16 2016 1Q17 2Q17 3Q17 4Q17 2017 1Q18 2Q18 3Q18 4Q18 2018
OECD DEMANDAmericas 24.2 24.6 24.6 24.5 25.1 24.8 24.7 24.5 25.0 25.0 25.2 24.9 24.6 25.1 25.3 25.1 25.0Europe 13.5 13.8 13.6 13.9 14.4 14.2 14.0 13.9 14.2 14.6 14.3 14.3 13.8 14.3 14.7 14.4 14.3Asia Oceania 8.1 8.1 8.6 7.7 7.8 8.4 8.1 8.6 7.8 7.8 8.3 8.1 8.4 7.6 7.7 8.2 8.0
Total OECD 45.8 46.4 46.8 46.1 47.3 47.4 46.9 46.9 47.0 47.4 47.7 47.3 46.9 46.9 47.7 47.7 47.3
NON-OECD DEMANDFSU 4.6 4.5 4.6 4.6 4.9 4.9 4.8 4.6 4.8 5.0 4.9 4.8 4.7 4.8 5.1 5.0 4.9Europe 0.7 0.7 0.7 0.7 0.7 0.7 0.7 0.7 0.7 0.7 0.7 0.7 0.7 0.7 0.7 0.8 0.7China 10.8 11.6 11.8 12.1 11.6 11.9 11.9 12.5 12.7 12.1 12.3 12.4 12.8 12.9 12.5 12.7 12.7Other Asia 11.8 12.4 13.0 13.0 12.7 13.0 12.9 13.2 13.4 13.0 13.7 13.3 13.8 14.0 13.6 14.2 13.9Americas 6.9 6.7 6.5 6.6 6.7 6.5 6.6 6.4 6.6 6.7 6.6 6.6 6.5 6.7 6.8 6.7 6.7Middle East 8.4 8.4 7.9 8.4 8.7 8.1 8.3 7.9 8.4 8.8 8.3 8.4 8.1 8.6 8.9 8.4 8.5Africa 3.9 4.1 4.2 4.2 4.0 4.1 4.1 4.4 4.2 4.1 4.2 4.2 4.4 4.3 4.2 4.4 4.3
Total Non-OECD 47.1 48.4 48.6 49.5 49.4 49.4 49.2 49.7 50.8 50.5 50.8 50.4 51.0 52.2 51.8 52.2 51.8
Total Demand1 92.9 94.8 95.4 95.6 96.7 96.8 96.1 96.6 97.8 97.9 98.5 97.7 97.9 99.1 99.5 99.9 99.1
OECD SUPPLYAmericas4 19.1 20.0 19.9 19.0 19.3 19.7 19.5 20.0 19.8 19.9 20.4 20.0 21.0 20.9 21.3 21.7 21.2Europe 3.3 3.5 3.6 3.4 3.3 3.6 3.5 3.7 3.5 3.4 3.6 3.6 3.7 3.7 3.5 3.6 3.6Asia Oceania 0.5 0.5 0.4 0.4 0.4 0.4 0.4 0.4 0.4 0.4 0.4 0.4 0.4 0.4 0.4 0.5 0.4
Total OECD 22.9 23.9 24.0 22.9 23.1 23.7 23.4 24.0 23.7 23.8 24.4 24.0 25.1 25.0 25.2 25.8 25.3
NON-OECD SUPPLYFSU 13.9 14.1 14.3 14.1 14.0 14.6 14.2 14.5 14.4 14.3 14.4 14.4 14.5 14.5 14.4 14.4 14.5Europe 0.1 0.1 0.1 0.1 0.1 0.1 0.1 0.1 0.1 0.1 0.1 0.1 0.1 0.1 0.1 0.1 0.1China 4.2 4.3 4.1 4.0 3.9 3.9 4.0 3.9 3.9 3.8 3.8 3.9 3.8 3.7 3.7 3.7 3.7Other Asia2 3.5 3.6 3.7 3.6 3.5 3.5 3.6 3.5 3.5 3.5 3.4 3.5 3.4 3.4 3.3 3.3 3.4Americas2,4 4.4 4.6 4.3 4.4 4.6 4.6 4.5 4.6 4.5 4.6 4.7 4.6 4.6 4.7 4.8 4.9 4.8Middle East 1.3 1.3 1.3 1.3 1.3 1.3 1.3 1.2 1.2 1.2 1.2 1.2 1.2 1.2 1.3 1.3 1.2Africa2 1.8 1.8 1.7 1.6 1.7 1.7 1.7 1.7 1.7 1.8 1.7 1.7 1.8 1.8 1.8 1.8 1.8
Total Non-OECD 29.3 29.7 29.5 29.1 29.1 29.7 29.4 29.5 29.3 29.3 29.4 29.4 29.5 29.5 29.4 29.5 29.5
Processing gains3 2.2 2.2 2.3 2.3 2.3 2.3 2.3 2.3 2.3 2.3 2.3 2.3 2.3 2.3 2.3 2.3 2.3
Global Biofuels 2.2 2.3 1.9 2.5 2.7 2.3 2.3 1.9 2.5 2.8 2.5 2.4 2.1 2.6 3.0 2.6 2.5
Total Non-OPEC Supply 56.6 58.1 57.7 56.7 57.2 57.9 57.4 57.7 57.8 58.1 58.6 58.1 59.0 59.4 59.8 60.2 59.6
OPECCrude 30.7 31.8 32.3 32.5 32.9 33.4 32.8 32.1 32.3 32.7NGLs 6.4 6.6 6.7 6.8 6.9 6.9 6.8 6.9 6.9 6.9 6.9 6.9 7.0 7.1 7.0 7.0 7.0Total OPEC 37.1 38.4 39.0 39.3 39.8 40.3 39.6 38.9 39.2 39.7
Total Supply4 93.7 96.6 96.7 96.1 97.0 98.2 97.0 96.7 97.0 97.8
STOCK CHANGES AND MISCELLANEOUSReported OECDIndustry 0.4 0.8 0.3 0.4 0.1 -0.9 0.0 0.3 -0.2Government 0.0 0.0 0.1 0.0 0.0 0.0 0.0 0.0 -0.1
Total 0.4 0.8 0.4 0.4 0.1 -0.9 0.0 0.3 -0.3Floating storage/Oil in transit 0.0 0.3 0.2 0.3 -0.2 0.2 0.1 -0.3 -0.3Miscellaneous to balance5 0.4 0.7 0.6 -0.3 0.4 2.1 0.7 0.0 -0.2
Total Stock Ch. & Misc 0.8 1.7 1.3 0.5 0.3 1.4 0.9 0.0 -0.8 -0.1
Memo items:Call on OPEC crude + Stock ch.6 29.9 30.1 31.1 32.1 32.6 32.0 31.9 32.0 33.1 32.8 33.0 32.7 31.9 32.7 32.6 32.7 32.51 Measured as deliveries from refineries and primary stocks, comprises inland deliveries, international marine bunkers, refinery fuel, crude for direct burning, oil from non-conventional sources and other sources of supply. Includes Biofuels.2 Other Asia includes Indonesia throughout. Latin America excludes Ecuador throughout. Africa excludes Angola, Gabon and Equatorial Guinea throughout. 3 Net volumetric gains and losses in the refining process and marine transportation losses.4 Comprises crude oil, condensates, NGLs, oil from non-conventional sources and other sources of supply.5 Includes changes in non-reported stocks in OECD and non-OECD areas.6 Equals the arithmetic difference between total demand minus total non-OPEC supply minus OPEC NGLs.
Table 1WORLD OIL SUPPLY AND DEMAND
(million barrels per day)

INTERNATIONAL ENERGY AGENCY - OIL MARKET REPORT TABLES
12 OCTOBER 2017 55
Table 1a: World Oil Supply And Demand: Changes From Last Month’s Table 1 2014 2015 1Q16 2Q16 3Q16 4Q16 2016 1Q17 2Q17 3Q17 4Q17 2017 1Q18 2Q18 3Q18 4Q18 2018
OECD DEMANDAmericas - - 0.1 0.1 - - 0.1 - - - - - - - - - -Europe - - - - - - - - - - - - - - - - -Asia Oceania - - - - - - - - - - - - - - -0.1 -0.1 -0.1
Total OECD - - 0.1 0.1 - - 0.1 - - - -0.1 - - - - -0.1 -
NON-OECD DEMANDFSU - - - - - - - - - - - - - - - - -Europe - - - - - - - - - - - - - - - - -China - - - - - - - - - 0.1 - - - - 0.1 - -Other Asia - - - - - - - - - - - - - - - - -Americas - - - - -0.1 -0.1 -0.1 - -0.1 - -0.1 - - - - - -Middle East - - - - - - - 0.1 - - -0.1 - 0.1 0.1 - - -Africa - - - - - - - - - - - - - - - - -
Total Non-OECD - - - - - -0.1 - 0.1 -0.1 0.1 -0.1 - 0.1 0.1 0.1 - 0.1Total Demand - - 0.1 - - -0.1 - 0.1 -0.1 0.1 -0.2 - - 0.1 0.1 -0.1 -
OECD SUPPLYAmericas - - - - - - - - - - - - - - - - -Europe - - - - - - - - - - - - - - - - -Asia Oceania - - - - - - - - - - - - - - - - -
Total OECD - - - - - - - - - - - - 0.1 0.1 - - -
NON-OECD SUPPLYFSU - - - - - - - - - - - - - - - - -Europe - - - - - - - - - - - - - - - - -China - -0.1 - -0.1 -0.1 -0.1 -0.1 -0.1 -0.1 -0.1 -0.1 -0.1 -0.1 -0.1 -0.1 -0.1 -0.1Other Asia - - - - - - - - - - - - - - - - -Americas - - - - - - - - - -0.1 - - - - - - -Middle East - - - - - - - - - - - - - - - - -Africa - - - - - - - - - - - - - - - - -
Total Non-OECD - - - - - - - - - -0.1 -0.1 -0.1 -0.1 -0.1 -0.1 -0.1 -0.1Processing gains - - - - - - - - - - - - - - - - -
Global Biofuels - - - - - - - -0.1 - - - - - - - - -
Total Non-OPEC Supply - -0.1 - - - -0.1 - -0.1 - -0.1 -0.1 -0.1 - - -0.1 - -
OPECCrude - - - - - - - - -NGLs - - - - - - - - - - -0.1 - - - - - -Total OPEC - - - - - - - - -Total Supply - -0.1 - - - -0.1 - -0.1 -
STOCK CHANGES AND MISCELLANEOUSREPORTED OECDIndustry - - - - - -0.1 - - -Government - - - - - - - - -
Total - - - - - -0.1 - - -Floating storage/Oil in transit - - - - - - - - -Miscellaneous to balance - -0.1 -0.1 -0.1 - 0.1 - -0.2 0.1
Total Stock Ch. & Misc - -0.1 -0.1 -0.1 - - - -0.2 0.1
Memo items:Call on OPEC crude + Stock ch. - 0.1 0.1 0.1 - - - 0.2 -0.1 0.2 - 0.1 - 0.1 0.2 -0.1 -When submitting their monthly oil statistics, OECD Member countries periodically update data for prior periods. Similar updates to non-OECD data can occur.
Table 1aWORLD OIL SUPPLY AND DEMAND: CHANGES FROM LAST MONTH'S TABLE 1
(million barrels per day)

TABLES INTERNATIONAL ENERGY AGENCY - OIL MARKET REPORT
56 12 OCTOBER 2017
Table 2: Summary of Global Oil Demand 2015 1Q16 2Q16 3Q16 4Q16 2016 1Q17 2Q17 3Q17 4Q17 2017 1Q18 2Q18 3Q18 4Q18 2018
Demand (mb/d)Americas 24.55 24.59 24.47 25.05 24.85 24.74 24.47 24.97 24.97 25.17 24.90 24.63 25.06 25.33 25.14 25.04Europe 13.83 13.61 13.92 14.44 14.19 14.05 13.89 14.25 14.58 14.29 14.25 13.82 14.30 14.71 14.37 14.30Asia Oceania 8.06 8.57 7.70 7.84 8.38 8.12 8.56 7.76 7.83 8.28 8.11 8.43 7.57 7.68 8.20 7.97Total OECD 46.44 46.78 46.10 47.34 47.42 46.91 46.92 46.97 47.39 47.75 47.26 46.88 46.94 47.72 47.72 47.32Asia 23.96 24.83 25.09 24.36 24.94 24.80 25.70 26.11 25.12 26.00 25.73 26.55 26.95 26.05 26.98 26.63Middle East 8.37 7.86 8.39 8.68 8.09 8.26 7.91 8.45 8.79 8.26 8.35 8.12 8.63 8.93 8.39 8.52Americas 6.71 6.46 6.58 6.66 6.54 6.56 6.45 6.57 6.68 6.60 6.58 6.52 6.69 6.81 6.72 6.68FSU 4.55 4.59 4.56 4.92 4.93 4.75 4.59 4.76 5.02 4.93 4.83 4.67 4.81 5.06 5.01 4.89Africa 4.09 4.19 4.17 4.02 4.14 4.13 4.36 4.22 4.12 4.23 4.23 4.45 4.34 4.19 4.36 4.33Europe 0.69 0.69 0.72 0.72 0.71 0.71 0.70 0.74 0.73 0.74 0.73 0.72 0.75 0.75 0.76 0.74Total Non-OECD 48.37 48.63 49.52 49.36 49.36 49.22 49.70 50.84 50.47 50.77 50.45 51.02 52.18 51.79 52.21 51.80World 94.81 95.40 95.62 96.70 96.78 96.13 96.63 97.81 97.85 98.51 97.71 97.90 99.12 99.50 99.93 99.12
of which: US50 19.53 19.54 19.50 19.94 19.77 19.69 19.49 20.01 19.90 20.05 19.87 19.64 20.07 20.23 20.03 20.00Europe 5* 8.13 8.09 8.14 8.34 8.21 8.19 8.24 8.28 8.37 8.26 8.29 8.12 8.25 8.43 8.29 8.27
China 11.56 11.81 12.08 11.64 11.94 11.87 12.51 12.66 12.11 12.35 12.41 12.78 12.92 12.49 12.73 12.73Japan 4.12 4.44 3.70 3.79 4.18 4.03 4.33 3.64 3.69 4.02 3.92 4.20 3.41 3.54 3.93 3.77India 4.24 4.65 4.60 4.39 4.55 4.55 4.60 4.73 4.42 4.80 4.64 4.90 5.04 4.74 5.14 4.96
Russia 3.41 3.52 3.41 3.75 3.69 3.59 3.48 3.58 3.82 3.70 3.65 3.54 3.63 3.85 3.79 3.70Brazil 3.18 3.02 3.07 3.13 3.07 3.07 3.01 3.05 3.16 3.11 3.08 3.05 3.13 3.23 3.18 3.15
Saudi Arabia 3.42 3.02 3.39 3.53 3.11 3.26 2.88 3.35 3.58 3.14 3.24 3.01 3.43 3.59 3.18 3.30Canada 2.37 2.33 2.32 2.46 2.40 2.38 2.35 2.34 2.49 2.41 2.40 2.35 2.37 2.50 2.42 2.41
Korea 2.47 2.66 2.55 2.60 2.72 2.63 2.69 2.56 2.62 2.72 2.65 2.69 2.58 2.59 2.72 2.65Mexico 2.01 2.05 2.02 2.01 2.03 2.03 1.96 1.98 1.94 2.05 1.98 1.96 1.97 1.95 2.03 1.98
Iran 1.84 1.84 1.82 1.79 1.82 1.82 1.84 1.82 1.79 1.81 1.82 1.84 1.87 1.83 1.84 1.84Total 66.27 66.98 66.60 67.37 67.48 67.11 67.38 68.00 67.89 68.43 67.93 68.07 68.68 68.97 69.26 68.75
% of World 69.9% 70.2% 69.7% 69.7% 69.7% 69.8% 69.7% 69.5% 69.4% 69.5% 69.5% 69.5% 69.3% 69.3% 69.3% 69.4%
Annual Change (% per annum)Americas 1.6 0.7 0.5 0.4 1.5 0.8 -0.5 2.0 -0.3 1.3 0.6 0.6 0.4 1.4 -0.1 0.6Europe 2.2 0.7 1.9 1.1 2.6 1.5 2.0 2.3 1.0 0.7 1.5 -0.5 0.4 0.8 0.6 0.3Asia Oceania 0.1 -1.3 1.1 1.2 2.1 0.8 -0.1 0.8 -0.1 -1.2 -0.2 -1.5 -2.4 -1.9 -1.0 -1.7Total OECD 1.5 0.3 1.0 0.8 1.9 1.0 0.3 1.9 0.1 0.7 0.7 -0.1 -0.1 0.7 -0.1 0.1Asia 5.9 6.1 3.8 1.5 2.9 3.5 3.5 4.1 3.2 4.2 3.7 3.3 3.2 3.7 3.8 3.5Middle East -0.6 1.0 -1.5 -1.7 -3.0 -1.4 0.6 0.6 1.3 2.1 1.2 2.6 2.2 1.5 1.6 2.0Americas -2.1 -2.5 -2.3 -1.7 -2.6 -2.3 -0.3 -0.1 0.3 0.9 0.2 1.2 1.9 1.8 1.8 1.7FSU -1.9 7.7 -0.1 4.3 6.2 4.4 0.1 4.3 1.9 0.2 1.6 1.7 1.2 0.9 1.5 1.4Africa 4.0 2.1 2.2 0.1 -0.5 0.9 4.1 1.1 2.4 2.1 2.4 2.0 2.9 1.8 3.0 2.4Europe 3.9 4.2 5.9 2.9 2.0 3.7 1.5 2.0 1.7 3.6 2.2 1.9 1.5 2.0 2.9 1.9Total Non-OECD 2.6 3.8 1.6 0.7 1.2 1.7 2.2 2.7 2.2 2.8 2.5 2.6 2.6 2.6 2.9 2.7World 2.1 2.1 1.3 0.7 1.5 1.4 1.3 2.3 1.2 1.8 1.6 1.3 1.3 1.7 1.4 1.4Annual Change (mb/d)Americas 0.39 0.18 0.11 0.11 0.36 0.19 -0.12 0.49 -0.08 0.32 0.16 0.15 0.10 0.36 -0.03 0.14Europe 0.29 0.09 0.26 0.16 0.35 0.21 0.27 0.32 0.14 0.10 0.21 -0.07 0.05 0.12 0.08 0.05Asia Oceania 0.01 -0.11 0.09 0.09 0.17 0.06 -0.01 0.06 -0.01 -0.10 -0.02 -0.13 -0.18 -0.15 -0.08 -0.14Total OECD 0.69 0.16 0.46 0.37 0.89 0.47 0.15 0.87 0.05 0.32 0.35 -0.04 -0.04 0.33 -0.03 0.06Asia 1.33 1.42 0.92 0.36 0.71 0.85 0.86 1.02 0.77 1.06 0.93 0.85 0.84 0.93 0.98 0.90Middle East -0.05 0.08 -0.13 -0.15 -0.25 -0.11 0.05 0.05 0.11 0.17 0.10 0.21 0.19 0.13 0.13 0.16Americas -0.14 -0.16 -0.15 -0.11 -0.17 -0.15 -0.02 -0.01 0.02 0.06 0.01 0.07 0.12 0.12 0.12 0.11FSU -0.09 0.33 0.00 0.20 0.29 0.20 0.00 0.20 0.09 0.01 0.08 0.08 0.06 0.05 0.08 0.07Africa 0.16 0.09 0.09 0.01 -0.02 0.04 0.17 0.05 0.10 0.09 0.10 0.09 0.12 0.08 0.12 0.10Europe 0.03 0.03 0.04 0.02 0.01 0.03 0.01 0.01 0.01 0.03 0.02 0.01 0.01 0.01 0.02 0.01Total Non-OECD 1.23 1.78 0.76 0.32 0.57 0.85 1.08 1.32 1.10 1.40 1.23 1.31 1.35 1.32 1.45 1.36World 1.92 1.94 1.22 0.69 1.45 1.32 1.22 2.19 1.15 1.73 1.58 1.27 1.31 1.65 1.42 1.41Revisions to Oil Demand from Last Month's Report (mb/d)Americas 0.00 0.09 0.07 0.03 0.01 0.05 0.00 -0.01 0.00 -0.01 -0.01 -0.01 0.01 0.01 -0.01 0.00Europe 0.00 -0.01 0.00 0.00 0.00 0.00 0.00 0.00 0.03 0.00 0.01 0.00 0.01 0.02 0.00 0.01Asia Oceania 0.00 0.00 0.00 0.00 0.00 0.00 0.00 0.00 -0.02 -0.04 -0.02 -0.04 -0.04 -0.08 -0.06 -0.06Total OECD 0.00 0.09 0.07 0.03 0.01 0.05 0.00 -0.02 0.00 -0.05 -0.02 -0.05 -0.01 -0.05 -0.07 -0.05Asia 0.00 0.01 0.01 0.02 0.00 0.01 0.02 -0.02 0.09 0.00 0.02 0.04 0.05 0.16 0.05 0.07Middle East 0.00 0.00 0.00 -0.01 0.00 0.00 0.09 0.04 0.05 -0.06 0.03 0.06 0.05 -0.01 -0.05 0.01Americas 0.01 -0.04 -0.04 -0.06 -0.07 -0.05 -0.03 -0.05 -0.05 -0.06 -0.05 -0.02 -0.01 -0.02 -0.03 -0.02FSU 0.00 0.00 0.00 0.00 0.00 0.00 0.01 -0.01 -0.01 -0.02 -0.01 0.00 0.00 -0.03 0.00 -0.01Africa 0.00 0.00 0.00 0.00 0.00 0.00 0.02 -0.02 0.02 0.00 0.00 0.00 0.01 0.01 0.00 0.00Europe 0.00 0.00 0.00 0.00 0.00 0.00 0.01 0.00 -0.01 0.00 0.00 0.00 0.00 0.00 0.00 0.00Total Non-OECD 0.01 -0.03 -0.03 -0.04 -0.07 -0.04 0.12 -0.07 0.09 -0.15 0.00 0.07 0.10 0.11 -0.03 0.06World 0.01 0.05 0.04 -0.01 -0.06 0.01 0.11 -0.08 0.09 -0.20 -0.02 0.02 0.08 0.06 -0.10 0.02Revisions to Oil Demand Growth from Last Month's Report (mb/d)World 0.00 0.01 0.01 -0.02 -0.04 -0.01 0.06 -0.12 0.10 -0.14 -0.03 -0.09 0.17 -0.02 0.10 0.04* France, Germany, Italy, Spain and UK
Table 2SUMMARY OF GLOBAL OIL DEMAND
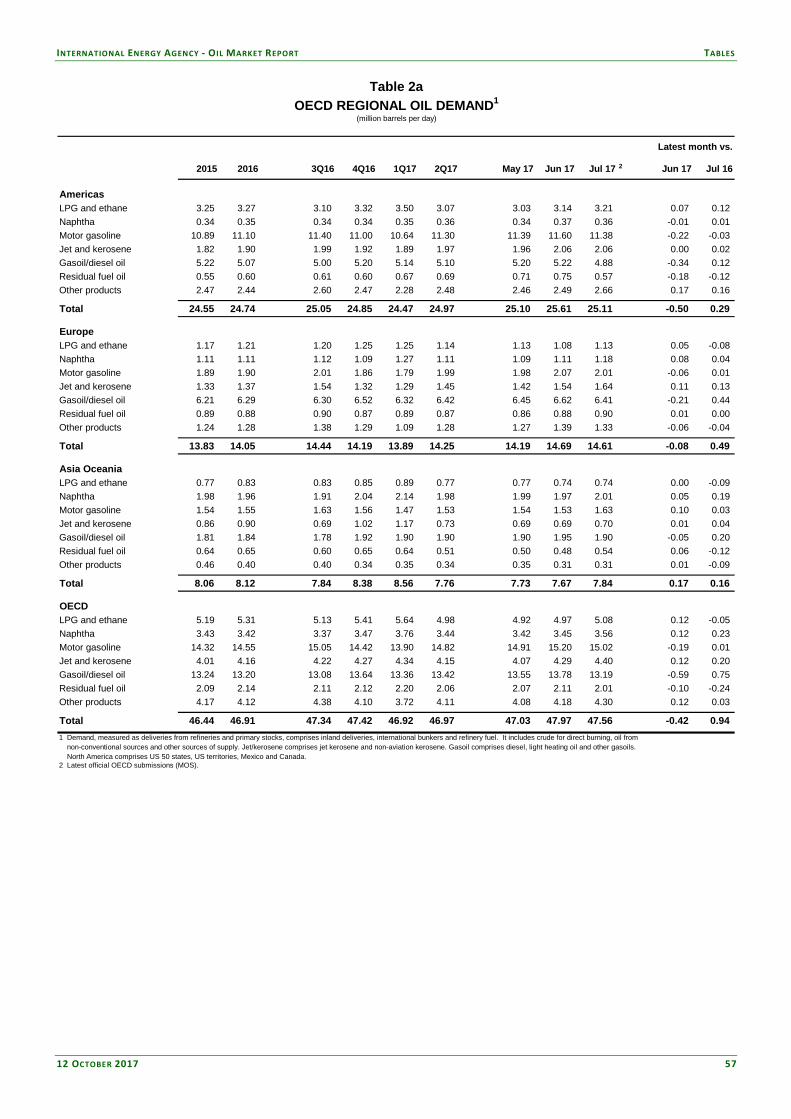
INTERNATIONAL ENERGY AGENCY - OIL MARKET REPORT TABLES
12 OCTOBER 2017 57
Table 2a: OECD Regional Oil Demand
2015 2016 3Q16 4Q16 1Q17 2Q17 May 17 Jun 17 Jul 17 2 Jun 17 Jul 16
AmericasLPG and ethane 3.25 3.27 3.10 3.32 3.50 3.07 3.03 3.14 3.21 0.07 0.12 Naphtha 0.34 0.35 0.34 0.34 0.35 0.36 0.34 0.37 0.36 -0.01 0.01 Motor gasoline 10.89 11.10 11.40 11.00 10.64 11.30 11.39 11.60 11.38 -0.22 -0.03 Jet and kerosene 1.82 1.90 1.99 1.92 1.89 1.97 1.96 2.06 2.06 0.00 0.02 Gasoil/diesel oil 5.22 5.07 5.00 5.20 5.14 5.10 5.20 5.22 4.88 -0.34 0.12 Residual fuel oil 0.55 0.60 0.61 0.60 0.67 0.69 0.71 0.75 0.57 -0.18 -0.12 Other products 2.47 2.44 2.60 2.47 2.28 2.48 2.46 2.49 2.66 0.17 0.16
Total 24.55 24.74 25.05 24.85 24.47 24.97 25.10 25.61 25.11 -0.50 0.29
EuropeLPG and ethane 1.17 1.21 1.20 1.25 1.25 1.14 1.13 1.08 1.13 0.05 -0.08 Naphtha 1.11 1.11 1.12 1.09 1.27 1.11 1.09 1.11 1.18 0.08 0.04 Motor gasoline 1.89 1.90 2.01 1.86 1.79 1.99 1.98 2.07 2.01 -0.06 0.01 Jet and kerosene 1.33 1.37 1.54 1.32 1.29 1.45 1.42 1.54 1.64 0.11 0.13 Gasoil/diesel oil 6.21 6.29 6.30 6.52 6.32 6.42 6.45 6.62 6.41 -0.21 0.44 Residual fuel oil 0.89 0.88 0.90 0.87 0.89 0.87 0.86 0.88 0.90 0.01 0.00 Other products 1.24 1.28 1.38 1.29 1.09 1.28 1.27 1.39 1.33 -0.06 -0.04
Total 13.83 14.05 14.44 14.19 13.89 14.25 14.19 14.69 14.61 -0.08 0.49
Asia OceaniaLPG and ethane 0.77 0.83 0.83 0.85 0.89 0.77 0.77 0.74 0.74 0.00 -0.09 Naphtha 1.98 1.96 1.91 2.04 2.14 1.98 1.99 1.97 2.01 0.05 0.19 Motor gasoline 1.54 1.55 1.63 1.56 1.47 1.53 1.54 1.53 1.63 0.10 0.03 Jet and kerosene 0.86 0.90 0.69 1.02 1.17 0.73 0.69 0.69 0.70 0.01 0.04 Gasoil/diesel oil 1.81 1.84 1.78 1.92 1.90 1.90 1.90 1.95 1.90 -0.05 0.20 Residual fuel oil 0.64 0.65 0.60 0.65 0.64 0.51 0.50 0.48 0.54 0.06 -0.12 Other products 0.46 0.40 0.40 0.34 0.35 0.34 0.35 0.31 0.31 0.01 -0.09
Total 8.06 8.12 7.84 8.38 8.56 7.76 7.73 7.67 7.84 0.17 0.16
OECDLPG and ethane 5.19 5.31 5.13 5.41 5.64 4.98 4.92 4.97 5.08 0.12 -0.05 Naphtha 3.43 3.42 3.37 3.47 3.76 3.44 3.42 3.45 3.56 0.12 0.23 Motor gasoline 14.32 14.55 15.05 14.42 13.90 14.82 14.91 15.20 15.02 -0.19 0.01 Jet and kerosene 4.01 4.16 4.22 4.27 4.34 4.15 4.07 4.29 4.40 0.12 0.20 Gasoil/diesel oil 13.24 13.20 13.08 13.64 13.36 13.42 13.55 13.78 13.19 -0.59 0.75 Residual fuel oil 2.09 2.14 2.11 2.12 2.20 2.06 2.07 2.11 2.01 -0.10 -0.24 Other products 4.17 4.12 4.38 4.10 3.72 4.11 4.08 4.18 4.30 0.12 0.03
Total 46.44 46.91 47.34 47.42 46.92 46.97 47.03 47.97 47.56 -0.42 0.94 1 Demand, measured as deliveries from refineries and primary stocks, comprises inland deliveries, international bunkers and refinery fuel. It includes crude for direct burning, oil from non-conventional sources and other sources of supply. Jet/kerosene comprises jet kerosene and non-aviation kerosene. Gasoil comprises diesel, light heating oil and other gasoils. North America comprises US 50 states, US territories, Mexico and Canada. 2 Latest official OECD submissions (MOS).
Latest month vs.
Table 2aOECD REGIONAL OIL DEMAND1
(million barrels per day)

TABLES INTERNATIONAL ENERGY AGENCY - OIL MARKET REPORT
58 12 OCTOBER 2017
Table 2b: Oil Demand in Selected OECD Countries
2015 2016 3Q16 4Q16 1Q17 2Q17 May 17 Jun 17 Jul 17 2 Jun 17 Jul 16
United States3
LPG and ethane 2.45 2.47 2.32 2.51 2.69 2.36 2.29 2.42 2.45 0.03 0.10 Naphtha 0.22 0.22 0.21 0.22 0.24 0.24 0.24 0.25 0.22 -0.03 0.00 Motor gasoline 9.18 9.32 9.58 9.20 8.95 9.54 9.59 9.77 9.57 -0.19 0.00 Jet and kerosene 1.55 1.62 1.70 1.65 1.61 1.69 1.67 1.76 1.73 -0.04 0.00 Gasoil/diesel oil 4.00 3.88 3.80 3.99 3.95 3.91 3.97 3.97 3.71 -0.26 0.11 Residual fuel oil 0.26 0.33 0.33 0.32 0.37 0.37 0.37 0.42 0.27 -0.15 -0.15 Other products 1.87 1.86 1.99 1.88 1.69 1.91 1.89 1.91 2.07 0.16 0.19
Total 19.53 19.69 19.94 19.77 19.49 20.01 20.02 20.49 20.02 -0.47 0.24 JapanLPG and ethane 0.44 0.44 0.43 0.44 0.50 0.40 0.40 0.37 0.37 0.00 -0.07 Naphtha 0.79 0.76 0.71 0.80 0.83 0.75 0.74 0.73 0.70 -0.03 0.01 Motor gasoline 0.89 0.90 0.96 0.90 0.82 0.87 0.87 0.87 0.95 0.08 0.00 Jet and kerosene 0.49 0.50 0.32 0.59 0.73 0.36 0.33 0.32 0.31 -0.01 0.01 Diesel 0.43 0.43 0.43 0.45 0.43 0.41 0.39 0.42 0.43 0.01 0.00 Other gasoil 0.34 0.35 0.30 0.37 0.39 0.32 0.31 0.33 0.31 -0.02 0.01 Residual fuel oil 0.37 0.34 0.32 0.34 0.33 0.27 0.24 0.24 0.28 0.04 -0.06 Other products 0.37 0.31 0.31 0.30 0.30 0.27 0.27 0.25 0.28 0.03 -0.04
Total 4.12 4.03 3.79 4.18 4.33 3.64 3.55 3.52 3.64 0.11 -0.14 GermanyLPG and ethane 0.10 0.10 0.10 0.09 0.11 0.10 0.11 0.08 0.09 0.01 -0.01 Naphtha 0.39 0.38 0.39 0.39 0.44 0.36 0.36 0.32 0.40 0.07 -0.04 Motor gasoline 0.42 0.42 0.44 0.42 0.41 0.45 0.45 0.46 0.43 -0.03 0.00 Jet and kerosene 0.18 0.20 0.23 0.20 0.20 0.21 0.19 0.22 0.23 0.01 0.00 Diesel 0.74 0.76 0.80 0.76 0.75 0.78 0.78 0.81 0.78 -0.02 -0.01 Other gasoil 0.36 0.36 0.27 0.39 0.39 0.36 0.39 0.36 0.35 -0.01 0.13 Residual fuel oil 0.11 0.09 0.09 0.10 0.10 0.07 0.05 0.07 0.08 0.01 0.00 Other products 0.06 0.10 0.11 0.10 0.08 0.11 0.11 0.11 0.12 0.01 0.02
Total 2.37 2.41 2.42 2.44 2.49 2.44 2.45 2.43 2.48 0.05 0.08 ItalyLPG and ethane 0.11 0.11 0.10 0.12 0.13 0.10 0.10 0.09 0.10 0.00 0.01 Naphtha 0.08 0.09 0.09 0.08 0.11 0.11 0.10 0.13 0.12 -0.01 0.03 Motor gasoline 0.18 0.18 0.19 0.17 0.16 0.18 0.17 0.20 0.19 -0.01 -0.01 Jet and kerosene 0.09 0.10 0.11 0.09 0.08 0.11 0.11 0.13 0.13 0.00 0.01 Diesel 0.47 0.46 0.47 0.45 0.45 0.47 0.48 0.50 0.48 -0.02 0.00 Other gasoil 0.09 0.09 0.10 0.10 0.08 0.08 0.08 0.09 0.09 -0.01 -0.01 Residual fuel oil 0.08 0.06 0.07 0.06 0.07 0.06 0.06 0.07 0.08 0.01 0.02 Other products 0.18 0.16 0.16 0.18 0.15 0.16 0.16 0.16 0.17 0.00 0.00
Total 1.27 1.25 1.29 1.24 1.23 1.28 1.28 1.37 1.35 -0.02 0.04 FranceLPG and ethane 0.13 0.12 0.11 0.12 0.14 0.10 0.10 0.09 0.09 0.00 -0.02 Naphtha 0.12 0.10 0.11 0.07 0.12 0.10 0.10 0.10 0.11 0.01 0.00 Motor gasoline 0.16 0.17 0.19 0.17 0.16 0.19 0.19 0.20 0.19 -0.01 0.00 Jet and kerosene 0.15 0.15 0.17 0.14 0.15 0.16 0.16 0.17 0.19 0.02 0.02 Diesel 0.71 0.70 0.72 0.71 0.71 0.73 0.73 0.75 0.72 -0.03 0.01 Other gasoil 0.26 0.25 0.24 0.28 0.28 0.21 0.20 0.21 0.23 0.02 0.02 Residual fuel oil 0.04 0.04 0.04 0.05 0.06 0.05 0.06 0.05 0.06 0.01 0.01 Other products 0.12 0.12 0.13 0.10 0.09 0.14 0.13 0.17 0.13 -0.04 0.00
Total 1.69 1.66 1.71 1.63 1.72 1.68 1.67 1.75 1.73 -0.02 0.05 United KingdomLPG and ethane 0.14 0.16 0.16 0.16 0.16 0.14 0.13 0.15 0.13 -0.02 -0.04 Naphtha 0.03 0.03 0.03 0.03 0.03 0.04 0.04 0.04 0.04 0.00 0.01 Motor gasoline 0.29 0.29 0.29 0.29 0.28 0.30 0.29 0.30 0.29 -0.01 0.01 Jet and kerosene 0.31 0.31 0.32 0.31 0.32 0.31 0.30 0.31 0.33 0.02 0.04 Diesel 0.50 0.52 0.51 0.53 0.49 0.53 0.49 0.53 0.52 -0.01 0.01 Other gasoil 0.13 0.13 0.15 0.12 0.12 0.14 0.13 0.14 0.13 -0.01 0.00 Residual fuel oil 0.03 0.03 0.03 0.03 0.03 0.02 0.02 0.03 0.03 0.00 0.00 Other products 0.11 0.11 0.11 0.11 0.11 0.12 0.11 0.12 0.12 0.00 0.00
Total 1.55 1.59 1.60 1.58 1.53 1.59 1.52 1.63 1.59 -0.04 0.04 CanadaLPG and ethane 0.35 0.37 0.36 0.39 0.39 0.32 0.36 0.32 0.37 0.04 0.04 Naphtha 0.09 0.10 0.10 0.10 0.09 0.09 0.07 0.10 0.11 0.01 0.00 Motor gasoline 0.81 0.85 0.88 0.84 0.80 0.86 0.87 0.90 0.90 0.00 0.00 Jet and kerosene 0.13 0.14 0.15 0.13 0.13 0.14 0.14 0.14 0.18 0.03 0.02 Diesel 0.31 0.30 0.30 0.29 0.30 0.29 0.29 0.29 0.28 -0.01 -0.02 Other gasoil 0.26 0.24 0.26 0.27 0.26 0.26 0.28 0.30 0.28 -0.02 0.08 Residual fuel oil 0.05 0.04 0.04 0.04 0.05 0.06 0.08 0.06 0.04 -0.03 0.00 Other products 0.36 0.34 0.36 0.35 0.33 0.32 0.32 0.33 0.38 0.05 -0.01
Total 2.37 2.38 2.46 2.40 2.35 2.34 2.41 2.45 2.52 0.08 0.12 1 Demand, measured as deliveries from refineries and primary stocks, comprises inland deliveries, international bunkers and refinery fuel. It includes crude for direct burning, oil from non-conventional sources and other sources of supply. Jet/kerosene comprises jet kerosene and non-aviation kerosene. Gasoil comprises diesel, light heating oil and other gasoils. 2 Latest official OECD submissions (MOS).3 US figures exclude US territories.
Latest month vs.
Table 2bOIL DEMAND IN SELECTED OECD COUNTRIES1
(million barrels per day)

INTERNATIONAL ENERGY AGENCY - OIL MARKET REPORT TABLES
12 OCTOBER 2017 59
Table 3: World Oil Production 2016 2017 2018 2Q17 3Q17 4Q17 1Q18 2Q18 Jul 17 Aug 17 Sep 17
OPECCrude Oil Saudi Arabia 10.42 9.97 9.98 10.03 9.96 9.94 Iran 3.55 3.77 3.83 3.81 3.84 3.84 Iraq 4.42 4.50 4.50 4.50 4.49 4.52 UAE 3.05 2.93 2.93 2.94 2.93 2.93 Kuwait 2.88 2.71 2.70 2.70 2.70 2.71 Neutral Zone 0.00 0.00 0.00 0.00 0.00 0.00 Qatar 0.65 0.62 0.61 0.61 0.61 0.61 Angola 1.71 1.64 1.67 1.67 1.68 1.66 Nigeria 1.47 1.49 1.65 1.64 1.66 1.66 Libya 0.39 0.71 0.94 1.01 0.88 0.92 Algeria 1.11 1.06 1.06 1.07 1.06 1.06 Equatorial Guinea 0.14 0.12 0.13 0.13 0.12 0.13 Ecuador 0.55 0.53 0.54 0.54 0.54 0.54 Venezuela 2.24 2.05 1.99 2.03 1.99 1.94 Gabon 0.23 0.20 0.20 0.22 0.18 0.19
Total Crude Oil 32.80 32.31 32.73 32.90 32.64 32.65 Total NGLs1 6.81 6.91 7.04 6.90 6.94 6.92 7.02 7.07 6.94 6.94 6.94
Total OPEC2 39.61 39.22 39.67 39.84 39.58 39.59 NON-OPEC2,3
OECDAmericas 19.48 20.01 21.23 19.80 19.91 20.39 20.99 20.94 20.25 19.87 19.60 United States 12.53 13.01 14.12 13.00 12.92 13.41 13.82 14.10 13.16 12.84 12.74 Mexico 2.47 2.26 2.13 2.31 2.22 2.19 2.16 2.14 2.28 2.20 2.16 Canada 4.47 4.74 4.98 4.48 4.77 4.79 5.00 4.70 4.80 4.82 4.69 Chile 0.01 0.00 0.00 0.00 0.00 0.00 0.00 0.00 0.00 0.00 0.00 Europe 3.52 3.55 3.62 3.49 3.43 3.63 3.72 3.66 3.48 3.37 3.46 UK 1.03 1.06 1.18 1.04 1.00 1.14 1.20 1.20 1.05 0.95 1.00 Norway 1.99 2.00 1.95 2.00 1.94 1.99 2.02 1.96 1.96 1.92 1.95 Others 0.49 0.49 0.48 0.45 0.49 0.50 0.49 0.49 0.47 0.50 0.50 Asia Oceania 0.43 0.41 0.43 0.40 0.42 0.42 0.42 0.43 0.42 0.42 0.42 Australia 0.35 0.33 0.36 0.32 0.34 0.35 0.35 0.35 0.34 0.34 0.34 Others 0.08 0.07 0.07 0.08 0.08 0.07 0.07 0.07 0.08 0.08 0.07
Total OECD 23.42 23.97 25.29 23.69 23.76 24.44 25.13 25.03 24.14 23.66 23.47 NON-OECDFormer USSR 14.24 14.37 14.45 14.35 14.26 14.41 14.50 14.49 14.36 14.19 14.21 Russia 11.34 11.35 11.30 11.34 11.29 11.31 11.31 11.30 11.32 11.28 11.28 Others 2.90 3.02 3.15 3.02 2.96 3.10 3.19 3.19 3.04 2.91 2.93 Asia2 7.57 7.35 7.07 7.37 7.32 7.25 7.18 7.10 7.36 7.28 7.30 China 3.99 3.86 3.71 3.91 3.84 3.80 3.75 3.73 3.87 3.80 3.84 Malaysia 0.71 0.71 0.70 0.69 0.72 0.72 0.71 0.70 0.70 0.73 0.73 India 0.85 0.85 0.83 0.85 0.85 0.84 0.85 0.83 0.87 0.85 0.84 Indonesia 0.88 0.85 0.80 0.85 0.84 0.83 0.82 0.81 0.84 0.84 0.84 Others 1.15 1.07 1.03 1.07 1.06 1.05 1.05 1.04 1.08 1.06 1.06 Europe 0.14 0.13 0.12 0.13 0.13 0.13 0.13 0.13 0.13 0.13 0.13 Americas2 4.49 4.58 4.76 4.54 4.56 4.66 4.64 4.71 4.55 4.52 4.61 Brazil 2.61 2.77 2.97 2.74 2.75 2.85 2.84 2.92 2.74 2.70 2.81 Argentina 0.61 0.58 0.58 0.56 0.58 0.58 0.58 0.58 0.58 0.58 0.58 Colombia 0.88 0.86 0.84 0.86 0.86 0.86 0.85 0.85 0.86 0.86 0.86 Others 0.38 0.37 0.36 0.37 0.37 0.37 0.37 0.36 0.38 0.38 0.36 Middle East2,4 1.26 1.24 1.25 1.24 1.23 1.23 1.23 1.24 1.24 1.23 1.23 Oman 1.01 0.98 0.99 0.98 0.98 0.98 0.98 0.98 0.97 0.98 0.98 Syria 0.03 0.02 0.02 0.02 0.02 0.02 0.02 0.02 0.02 0.02 0.02 Yemen 0.02 0.03 0.02 0.03 0.03 0.03 0.02 0.02 0.03 0.03 0.03 Others 0.20 0.21 0.22 0.22 0.21 0.20 0.21 0.22 0.22 0.20 0.20 Africa 1.66 1.71 1.80 1.68 1.76 1.73 1.82 1.81 1.75 1.75 1.78 Egypt 0.67 0.63 0.61 0.64 0.63 0.63 0.62 0.61 0.63 0.63 0.63 Others 1.00 1.08 1.19 1.05 1.13 1.10 1.20 1.19 1.12 1.12 1.15
Total Non-OECD 29.36 29.37 29.46 29.33 29.26 29.41 29.49 29.47 29.40 29.10 29.27 Processing gains5 2.27 2.29 2.32 2.29 2.29 2.29 2.32 2.32 2.29 2.29 2.29 Global Biofuels 2.34 2.41 2.54 2.45 2.78 2.47 2.06 2.55 2.78 2.73 2.84 TOTAL NON-OPEC 57.38 58.05 59.60 57.76 58.10 58.60 59.00 59.37 58.61 57.79 57.87 TOTAL SUPPLY 96.99 96.98 97.77 98.46 97.37 97.46 1 Includes condensates reported by OPEC countries, oil from non-conventional sources, e.g. Venezuelan Orimulsion (but not Orinoco extra-heavy oil), and non-oil inputs to Saudi Arabian MTBE.2 Latin America excludes Ecuador throughout. Africa excludes Angola, Gabon and Equatorial Guinea throughout. Asia includes Indonesia throughout.3 Comprises crude oil, condensates, NGLs and oil from non-conventional sources4 Includes small amounts of production from Jordan and Bahrain.5 Net volumetric gains and losses in refining and marine transportation losses.
Table 3WORLD OIL PRODUCTION
(million barrels per day)

TABLES INTERNATIONAL ENERGY AGENCY - OIL MARKET REPORT
60 12 OCTOBER 2017
Table 4: OECD Industry Stocks and Quarterly Stock Changes
RECENT MONTHLY STOCKS2 PRIOR YEARS' STOCKS2 STOCK CHANGESin Million Barrels in Million Barrels in mb/d
Apr2017 May2017 Jun2017 Jul2017 Aug2017* Aug2014 Aug2015 Aug2016 3Q2016 4Q2016 1Q2017 2Q2017
OECD AmericasCrude 676.2 670.6 656.3 643.8 629.8 481.7 582.6 642.0 -0.31 0.24 0.56 -0.44 Motor Gasoline 275.9 275.1 268.7 262.9 258.9 245.4 249.6 262.6 -0.15 0.11 0.02 -0.03 Middle Distillate 233.2 230.3 224.4 222.2 219.7 198.6 228.4 234.7 0.18 0.01 -0.13 -0.02 Residual Fuel Oil 46.8 45.9 41.1 39.9 40.7 46.0 45.1 46.8 -0.02 0.03 0.00 -0.08 Total Products3 752.4 761.9 753.2 756.2 769.2 716.6 761.4 801.3 0.31 -0.29 -0.43 0.19
Total4 1607.8 1619.4 1595.3 1589.5 1586.2 1374.6 1535.0 1638.1 0.11 -0.24 0.10 -0.13
OECD EuropeCrude 353.4 359.3 365.4 365.7 355.1 312.0 343.2 354.6 -0.04 -0.15 0.18 0.06 Motor Gasoline 99.8 94.5 92.2 90.6 91.1 88.6 85.3 92.6 -0.07 0.09 0.02 -0.09 Middle Distillate 320.9 308.4 297.5 304.3 304.8 268.5 300.0 326.3 0.01 -0.22 0.06 -0.15 Residual Fuel Oil 64.9 63.7 64.7 63.0 61.3 67.7 71.6 71.2 -0.05 -0.01 -0.03 -0.02 Total Products3 598.6 572.1 557.7 561.8 561.3 520.2 554.9 589.3 -0.15 -0.11 0.16 -0.33
Total4 1026.2 1005.5 995.5 1002.8 989.9 903.6 966.4 1013.3 -0.15 -0.27 0.33 -0.26
OECD Asia OceaniaCrude 193.4 198.4 189.7 197.4 192.7 180.3 204.7 187.5 -0.01 -0.11 -0.03 0.01 Motor Gasoline 24.4 26.2 25.1 22.8 24.0 22.6 23.6 24.3 -0.03 0.00 -0.01 0.02 Middle Distillate 66.1 66.6 63.3 64.1 68.6 69.4 70.2 75.7 0.07 -0.11 -0.05 0.04 Residual Fuel Oil 18.8 20.6 20.9 21.6 20.6 24.3 21.2 19.8 0.00 -0.02 0.01 0.03 Total Products3 165.1 169.5 169.7 175.6 180.8 179.8 178.3 192.5 0.13 -0.27 -0.08 0.16
Total4 420.3 432.4 424.1 436.9 439.0 431.1 449.1 442.1 0.13 -0.39 -0.13 0.23
Total OECDCrude 1223.0 1228.3 1211.4 1206.8 1177.6 974.1 1130.5 1184.1 -0.36 -0.01 0.71 -0.37 Motor Gasoline 400.1 395.7 386.0 376.3 374.1 356.5 358.6 379.4 -0.25 0.20 0.03 -0.10 Middle Distillate 620.2 605.3 585.2 590.6 593.0 536.5 598.6 636.7 0.27 -0.32 -0.12 -0.13 Residual Fuel Oil 130.5 130.2 126.8 124.5 122.6 137.9 137.9 137.8 -0.06 0.01 -0.02 -0.07 Total Products3 1516.1 1503.6 1480.6 1493.6 1511.3 1416.6 1494.5 1583.1 0.29 -0.66 -0.35 0.02
Total4 3054.3 3057.3 3014.9 3029.2 3015.0 2709.2 2950.5 3093.5 0.09 -0.90 0.31 -0.16
RECENT MONTHLY STOCKS2 PRIOR YEARS' STOCKS2 STOCK CHANGESin Million Barrels in Million Barrels in mb/d
Apr2017 May2017 Jun2017 Jul2017 Aug2017* Aug2014 Aug2015 Aug2016 3Q2016 4Q2016 1Q2017 2Q2017
OECD AmericasCrude 688.8 684.5 679.2 678.9 678.6 691.0 695.1 695.1 0.00 0.00 -0.04 -0.14 Products 2.0 2.0 2.0 2.0 2.0 1.5 2.0 2.0 0.00 0.00 0.00 0.00
OECD EuropeCrude 206.1 206.2 208.4 208.3 208.5 208.4 207.1 205.9 0.01 -0.01 0.00 0.03 Products 275.7 273.0 272.2 268.5 268.2 259.3 257.0 269.6 0.03 0.05 0.02 -0.03
OECD Asia OceaniaCrude 385.1 385.0 385.0 385.0 385.0 387.6 383.3 385.4 0.00 -0.01 0.00 0.01 Products 38.0 38.0 38.0 38.0 38.0 31.0 33.7 35.9 0.00 0.01 0.01 0.00
Total OECDCrude 1280.0 1275.7 1272.6 1272.2 1272.1 1287.1 1285.5 1286.4 0.01 -0.02 -0.04 -0.09 Products 315.6 313.0 312.2 308.4 308.1 291.8 292.6 307.5 0.03 0.06 0.03 -0.03
Total4 1598.1 1592.6 1588.5 1583.9 1583.8 1583.1 1582.2 1596.2 0.04 0.04 0.00 -0.12 * estimated1 Stocks are primary national territory stocks on land (excluding utility stocks and including pipeline and entrepot stocks where known) and include stocks held by industry to meet IEA, EU and national emergency reserve commitments and are subject to government control in emergencies. 2 Closing stock levels.3 Total products includes gasoline, middle distillates, fuel oil and other products. 4 Total includes NGLs, refinery feedstocks, additives/oxygenates and other hydrocarbons. 5 Includes government-owned stocks and stock holding organisation stocks held for emergency purposes.
Table 4OECD INDUSTRY STOCKS1 AND QUARTERLY STOCK CHANGES
OECD GOVERNMENT-CONTROLLED STOCKS5 AND QUARTERLY STOCK CHANGES

INTERNATIONAL ENERGY AGENCY - OIL MARKET REPORT TABLES
12 OCTOBER 2017 61
Table 5: Total Stocks on Land in OECD Countries
('millions of barrels' and 'days')
3
Stock Days Fwd2 Stock Days Fwd Stock Days Fwd Stock Days Fwd Stock Days FwdLevel Demand Level Demand Level Demand Level Demand Level Demand
OECD AmericasCanada 175.2 71 184.8 77 183.3 78 184.9 79 182.7 -Chile 10.7 32 12.2 37 11.2 33 11.9 35 11.2 -Mexico 48.8 24 45.7 23 47.3 24 47.5 24 49.2 -United States4 2051.4 103 2053.2 104 2031.6 104 2034.5 102 2011.2 -Total4 2308.2 92 2318.0 93 2295.5 94 2301.0 92 2276.4 92OECD Asia OceaniaAustralia 38.2 35 36.7 33 33.9 30 33.3 28 35.4 -Israel - - - - - - - - - -Japan 573.5 151 586.6 140 562.5 130 546.3 150 566.3 -Korea 238.0 92 239.3 88 230.3 86 237.8 93 236.4 -New Zealand 9.2 57 8.7 50 8.9 48 8.2 48 9.0 -Total 859.0 110 871.3 104 835.6 98 825.6 106 847.1 109OECD Europe5
Austria 22.5 81 21.6 81 22.8 88 24.3 94 21.8 -Belgium 52.4 81 50.5 74 47.4 72 45.5 72 44.2 -Czech Republic 22.8 123 22.9 111 21.9 117 22.5 102 21.4 -Denmark 30.7 187 29.7 187 30.5 201 27.2 169 27.3 -Estonia 2.6 84 2.4 81 2.4 72 2.6 94 2.7 -Finland 45.4 219 44.9 219 42.3 220 44.8 224 43.4 -France 167.5 98 166.9 102 162.2 94 167.7 100 165.4 -Germany 288.2 119 285.0 117 285.4 115 280.7 115 277.1 -Greece 32.6 102 30.8 99 33.9 115 35.1 118 32.4 -Hungary 22.7 137 23.6 148 24.5 151 24.3 144 25.2 -Ireland 12.3 84 11.7 74 11.8 78 12.8 86 12.1 -Italy 120.9 94 127.4 102 124.3 101 134.4 105 133.7 -Latvia 3.9 90 4.4 118 2.4 69 2.4 58 3.3 -Luxembourg 0.8 15 0.7 12 0.7 12 0.7 12 0.7 -Netherlands 159.6 158 154.2 158 152.6 155 154.7 157 154.5 -Norway 26.5 116 23.2 96 22.9 113 22.9 107 22.0 -Poland 65.4 106 68.4 113 67.4 116 69.8 110 69.5 -Portugal 24.9 100 23.2 101 21.9 98 26.5 110 24.0 -Slovak Republic 12.4 134 11.3 138 12.1 147 12.8 151 13.0 -Slovenia 4.7 86 4.4 81 4.5 96 4.9 94 5.1 -Spain 135.9 103 139.4 107 129.0 101 136.5 106 128.7 -Sweden 33.3 101 35.7 109 33.5 107 51.5 159 52.3 -Switzerland 35.8 166 36.5 156 35.2 158 35.5 162 34.5 -Turkey 78.0 76 76.5 81 79.1 100 81.4 83 84.0 -United Kingdom 82.4 51 78.1 49 82.3 54 81.2 51 81.7 -Total 1484.1 103 1473.5 104 1452.9 105 1502.8 105 1479.8 106Total OECD 4651.3 98 4662.8 98 4584.1 98 4629.4 99 4603.3 99DAYS OF IEA Net Imports6 - 202 - 202 - 200 - 203 - 1971 Total Stocks are industry and government-controlled stocks (see breakdown in table below). Stocks are primary national territory stocks on land (excluding utility stocks and including pipeline and entrepot stocks where known) they include stocks held by industry to meet IEA, EU and national emergency reserves commitments and are subject to government control in emergencies.2 Note that days of forward demand represent the stock level divided by the forward quarter average daily demand and is very different from the days of net imports used for the calculation of IEA Emergency Reserves.3 End June 2017 forward demand figures are IEA Secretariat forecasts. 4 US figures exclude US territories. Total includes US territories.5 Data not available for Iceland.6 Reflects stock levels and prior calendar year's net imports adjusted according to IEA emergency reserve definitions (see www.iea.org/netimports.asp). Net exporting IEA countries are excluded.
TOTAL OECD STOCKS
CLOSING STOCKS Total Industry Total Industry
2Q2014 4232 1581 2651 92 34 583Q2014 4300 1580 2719 93 34 594Q2014 4288 1582 2706 92 34 581Q2015 4377 1584 2792 96 35 612Q2015 4467 1587 2880 95 34 613Q2015 4538 1581 2957 98 34 644Q2015 4577 1588 2989 98 34 641Q2016 4615 1595 3020 100 35 662Q2016 4651 1592 3059 98 34 653Q2016 4663 1596 3067 98 34 654Q2016 4584 1600 2984 98 34 641Q2017 4629 1600 3030 99 34 652Q2017 4603 1588 3015 99 34 651 Includes government-owned stocks and stock holding organisation stocks held for emergency purposes.2 Days of forward demand calculated using actual demand except in 2Q2017 (when latest forecasts are used).
Table 5TOTAL STOCKS ON LAND IN OECD COUNTRIES1
controlledDays of Fwd. Demand 2
End June 2017End September 2016 End June 2016 End December 2016 End March 2017
Millions of Barrels
Government1
controlledGovernment1

TABLES INTERNATIONAL ENERGY AGENCY - OIL MARKET REPORT
62 12 OCTOBER 2017
Table 6: IEA Member Country Destinations of Selected Crude Streams
2014 2015 2016 3Q16 4Q16 1Q17 2Q17 May 17 Jun 17 Jul 17 Jul 16 change
Saudi Light & Extra LightAmericas 0.65 0.63 0.69 0.69 0.62 0.70 0.74 0.86 0.71 0.57 0.88 -0.31Europe 0.84 0.78 0.79 0.78 0.87 0.64 0.78 0.75 0.74 0.70 0.72 -0.03Asia Oceania 1.17 1.25 1.40 1.22 1.56 1.65 1.49 1.48 1.27 1.66 1.18 0.48
Saudi MediumAmericas 0.36 0.37 0.44 0.44 0.48 0.43 0.35 0.30 0.31 0.31 0.41 -0.09Europe 0.03 0.03 0.01 0.03 0.01 0.01 0.00 - - - 0.02 -Asia Oceania 0.45 0.44 0.41 0.42 0.34 0.33 0.33 0.31 0.35 0.37 0.42 -0.05
Canada HeavyAmericas 1.71 1.90 2.04 2.12 2.07 2.31 2.25 2.22 2.28 2.15 2.07 0.07Europe 0.00 0.01 0.01 0.02 0.01 0.01 - - - 0.04 - -Asia Oceania 0.00 - - - - - - - - - - -
Iraqi Basrah Light2
Americas 0.35 0.17 0.42 0.47 0.55 0.53 0.67 0.65 0.63 0.63 0.43 0.20Europe 0.50 0.72 0.81 0.90 0.67 0.76 0.84 0.86 0.87 0.73 0.87 -0.14Asia Oceania 0.24 0.41 0.46 0.44 0.41 0.42 0.39 0.29 0.46 0.52 0.41 0.12
Kuwait BlendAmericas 0.27 0.13 0.14 0.18 0.14 0.19 0.18 0.23 0.30 0.13 0.26 -0.14Europe 0.09 0.13 0.19 0.22 0.26 0.20 0.22 0.21 0.22 0.27 0.18 0.10Asia Oceania 0.62 0.65 0.66 0.68 0.60 0.71 0.68 0.75 0.61 0.67 0.71 -0.04
Iranian LightAmericas - - - - - - - - - - - -Europe 0.10 0.09 0.21 0.33 0.24 0.38 0.25 0.26 0.21 0.22 0.40 -0.18Asia Oceania 0.01 0.01 0.01 0.01 0.01 0.01 0.00 0.01 0.01 0.01 - -
Iranian Heavy3
Americas - - - - - - - - - - - -Europe 0.01 0.02 0.21 0.27 0.38 0.41 0.52 0.45 0.71 0.68 0.24 0.44Asia Oceania 0.28 0.27 0.52 0.58 0.59 0.73 0.43 0.42 0.44 0.52 0.55 -0.03
BFOEAmericas 0.01 0.01 0.02 0.02 0.03 0.02 0.01 0.04 0.00 0.02 0.02 0.00Europe 0.56 0.49 0.44 0.48 0.42 0.39 0.41 0.37 0.47 0.49 0.40 0.08Asia Oceania 0.07 0.06 0.05 - 0.08 0.09 0.06 - 0.14 0.10 - -
KazakhstanAmericas 0.01 0.00 0.01 0.02 - - - - - - - -Europe 0.64 0.64 0.70 0.70 0.62 0.76 0.78 0.70 0.76 0.69 0.89 -0.20Asia Oceania 0.02 0.06 0.03 0.01 0.04 0.05 0.09 0.08 0.07 0.07 - -
Venezuelan 22 API and heavierAmericas 0.64 0.67 0.63 0.65 0.66 0.52 0.61 0.53 0.61 0.42 0.75 -0.33Europe 0.08 0.09 0.05 0.04 0.05 0.06 0.04 0.02 0.05 0.01 0.04 -0.03Asia Oceania - - - - - - - - - - - -
Mexican MayaAmericas 0.66 0.50 0.53 0.52 0.53 0.54 0.63 0.67 0.68 0.61 0.56 0.05Europe 0.14 0.15 0.17 0.17 0.20 0.20 0.18 0.18 0.12 0.20 0.18 0.01Asia Oceania - 0.01 0.05 0.06 0.07 0.06 0.07 0.04 0.06 0.06 0.10 -0.03
Russian UralsAmericas - - - - - - - - - - - -Europe 1.58 1.61 1.72 1.73 1.77 1.64 1.57 1.50 1.65 1.73 1.75 -0.02Asia Oceania - - - - - - 0.02 - 0.02 0.03 - -
Cabinda and Other AngolaNorth America 0.04 0.06 0.16 0.20 0.13 0.04 - - - 0.16 0.28 -0.13Europe 0.33 0.42 0.27 0.43 0.16 0.09 0.07 0.03 0.10 0.16 0.49 -0.34Pacific 0.01 0.02 0.01 - - - 0.01 0.03 - 0.03 - -
Nigerian Light4
Americas 0.00 0.02 0.07 0.08 0.07 0.02 0.04 0.13 - 0.13 0.06 0.06Europe 0.55 0.57 0.39 0.33 0.31 0.36 0.46 0.49 0.41 0.38 0.44 -0.06Asia Oceania 0.02 - 0.01 0.01 0.03 0.02 0.03 0.06 0.03 0.03 - -
Libya Light and MediumAmericas - - - - - - - - - 0.10 - -Europe 0.31 0.22 0.20 0.17 0.30 0.41 0.37 0.41 0.43 0.60 0.22 0.38Asia Oceania 0.02 0.01 0.02 0.03 0.01 0.04 0.04 0.06 0.04 - - -1 Data based on monthly submissions from IEA countries to the crude oil import register (in '000 bbl), subject to availability. May differ from Table 8 of the Report. IEA Americas includes United States and Canada. IEA Europe includes all countries in OECD Europe except Estonia, Hungary, Slovenia and Latvia. IEA Asia Oceania includes Australia, New Zealand, Korea and Japan.2 Iraqi Total minus Kirkuk.3 Iranian Total minus Iranian Light.4 33° API and lighter (e.g., Bonny Light, Escravos, Qua Iboe and Oso Condensate).
Table 6IEA MEMBER COUNTRY DESTINATIONS OF SELECTED CRUDE STREAMS1
(million barrels per day)
Year Earlier

INTERNATIONAL ENERGY AGENCY - OIL MARKET REPORT TABLES
12 OCTOBER 2017 63
Table 7: Regional OECD Imports 2014 2015 2016 3Q16 4Q16 1Q17 2Q17 May 17 Jun 17 Jul 17 Jul 16 % change
Crude Oil Americas 4201 4026 4542 4867 4288 4558 4664 4637 4725 4400 5062 -13%Europe 8679 9505 9253 9647 9566 9462 9606 9642 9697 9974 10096 -1%Asia Oceania 6366 6573 6669 6599 6664 7006 6450 6745 5934 7026 6408 10%
Total OECD 19246 20103 20464 21112 20518 21026 20719 21024 20356 21400 21566 -1%
LPGAmericas 12 10 20 23 18 23 16 25 11 11 31 -65%Europe 433 418 444 469 468 499 417 465 399 437 514 -15%Asia Oceania 531 518 566 547 551 603 586 558 584 549 620 -12%
Total OECD 975 947 1030 1039 1036 1126 1020 1048 995 996 1165 -14%
NaphthaAmericas 20 14 10 4 18 19 19 22 14 12 6 87%Europe 352 345 348 388 354 392 365 396 340 308 359 -14%Asia Oceania 952 950 905 945 893 980 976 967 983 944 959 -2%
Total OECD 1324 1309 1263 1337 1265 1391 1361 1384 1337 1264 1324 -5%
Gasoline3
Americas 665 670 735 918 689 575 890 972 873 759 953 -20%Europe 117 105 100 41 209 150 131 165 165 188 -38 naAsia Oceania 75 93 84 72 107 119 97 104 102 66 81 -18%
Total OECD 857 868 919 1031 1004 844 1118 1241 1140 1013 997 2%
Jet & KeroseneAmericas 100 141 169 180 190 148 144 121 121 134 200 -33%Europe 455 445 502 569 466 460 475 510 502 577 545 6%Asia Oceania 60 66 74 49 89 112 68 66 53 58 52 11%
Total OECD 615 651 745 797 746 719 687 697 677 769 797 -3%
Gasoil/DieselAmericas 95 76 67 84 84 81 37 43 43 49 55 -11%Europe 1043 1161 1339 1277 1275 1390 1351 1421 1352 1457 1293 13%Asia Oceania 152 158 195 166 219 204 206 189 192 195 160 22%
Total OECD 1291 1395 1600 1528 1579 1675 1593 1654 1587 1701 1507 13%
Heavy Fuel OilAmericas 132 116 149 158 147 141 103 98 133 165 180 -8%Europe 596 537 469 460 416 261 296 195 464 264 444 -41%Asia Oceania 200 173 153 155 123 145 180 189 167 118 182 -36%
Total OECD 928 826 770 774 687 546 580 482 764 546 806 -32%
Other ProductsAmericas 671 675 652 663 605 705 694 687 785 638 721 -11%Europe 692 701 770 743 775 1111 975 1014 757 843 655 29%Asia Oceania 399 343 344 351 320 301 244 265 242 184 376 -51%
Total OECD 1762 1719 1766 1757 1701 2117 1913 1967 1784 1665 1751 -5%
Total ProductsAmericas 1695 1702 1802 2031 1751 1692 1903 1968 1980 1768 2146 -18%Europe 3687 3712 3973 3947 3963 4263 4011 4167 3980 4074 3772 8%Asia Oceania 2369 2301 2321 2285 2303 2464 2357 2338 2323 2114 2430 -13%
Total OECD 7751 7715 8095 8263 8017 8419 8271 8472 8283 7955 8347 -5%
Total OilAmericas 5896 5728 6344 6898 6039 6250 6567 6605 6705 6168 7208 -14%Europe 12366 13216 13226 13593 13528 13725 13617 13808 13678 14048 13867 1%Asia Oceania 8735 8874 8990 8884 8967 9471 8807 9083 8257 9140 8838 3%
Total OECD 26997 27818 28559 29376 28534 29445 28990 29496 28640 29355 29913 -2%1 Based on Monthly Oil Questionnaire data submitted by OECD countries in tonnes and converted to barrels. 2 Excludes intra-regional trade.3 Includes additives.
Year Earlier
Table 7REGIONAL OECD IMPORTS1,2
(thousand barrels per day)

©© OOEECCDD//IIEEAA 22001177.. AAllll RRiigghhttss RReesseerrvveedd
Without prejudice to the terms and conditions on the IEA website at www.iea.org/t&c/termsandconditions/ (the Terms), which also apply to this Oil Market Report (OMR) and its related publications, the Executive Director and the Secretariat of the IEA are responsible for the publication of the OMR. Although some of the data are supplied by IEA Member-country governments, largely on the basis of information they in turn receive from oil companies, neither these governments nor these oil companies necessarily share the Secretariat’s views or conclusions as expressed in the OMR. The OMR is prepared for general circulation and is distributed for general information only. Neither the information nor any opinion expressed in the OMR constitutes an offer, or an invitation to make an offer, to buy or sell any securities or any options, futures or other derivatives related to such securities.
As set out in the Terms, the OECD/IEA owns the copyright in this OMR. However, in relation to the edition of OMR made available to Subscribers (as defined in the Terms), all Argus information is sourced as Copyright © 2017 Argus Media Limited and is published here with the permission of Argus. The spot crude and product price assessments are based on daily Argus prices, converted when appropriate to USD per barrel according to the Argus specification of products. Argus Media Limited reserves all rights in relation to all Argus information. Any reproduction of Argus information requires the express prior written permission of Argus. Argus shall not be liable to any party for any inaccuracy, error or omission contained or provided in Argus information contained in this OMR or for any loss, or damage, whether or not due to reliance placed by that party on information in this OMR.

Editor
Neil Atkinson +33 (0)1 40 57 65 90
[email protected] Demand
Christophe Barret +33 (0)1 40 57 65 16
Non-OPEC Supply
Toril Bosoni +33 (0)1 40 57 67 18 [email protected]
OPEC Supply Peg Mackey
+33 (0)1 40 57 65 81 [email protected]
Refining Kristine Petrosyan
+33 (0)1 40 57 66 05 [email protected]
Stocks and Prices Olivier Lejeune
+33 (0)1 40 57 67 58 [email protected]
Research Assistant Anne Kloss
+33 (0)1 40 57 67 28 [email protected]
Analyst Yujiao Ma
+33 (0)1 40 57 67 78 [email protected]
Analyst Jose Alfredo Peral
+33 (0)1 40 57 65 03 [email protected]
Statistics Nestor Abraham
+33 (0)1 40 57 65 48 [email protected]
Statistics Pierre Monferrand
+33 (0)1 40 57 66 67 [email protected]
Editorial Assistant Deven Mooneesawmy
+33 (0)1 40 57 65 03 [email protected]
Media Enquiries
IEA Press Office
+33 (0)1 40 57 65 54 [email protected]
Subscription and Delivery Enquiries Oil Market Report Subscriptions International Energy Agency BP 586-75726 PARIS Cedex 15, France +33 (0)1 40 57 67 12 [email protected] www.iea.org/publications/oilmarketreport/ +33 (0)1 40 57 66 90
User’s Guide and Glossary to the IEA Oil Market Report For information on the data sources, definitions, technical terms and general approach used in preparing the Oil Market Report (OMR), Market Report Series_Oil and Annual Statistical Supplement (current issue of the Statistical Supplement dated 11 August 2017), readers are referred to the Users’ Guide at www.oilmarketreport.org/glossary.asp. It should be noted that the spot crude and product price assessments are based on daily Argus prices, converted when appropriate to US$ per barrel according to the Argus specification of products (Copyright © 2017 Argus Media Limited - all rights reserved).
Next Issue: 14 November 2017