oil companies and sustainability: more than just an...
TRANSCRIPT

! 1
Oil Companies and Sustainability: More than Just an Image?
Author: Dana Schweitzer Adviser: Irv Salmeen Reader: Bobbi Low
_____________________________________________________________
Abstract
This paper analyzes whether the three largest oil companies (BP, ExxonMobil, and Royal Dutch Shell) are backing up their increasingly “green” rhetoric by moving their businesses in a direction that promotes sustainability. Word count analysis from company annual reports, operational data, lobbying expenditures, and public company statements are used to explain what each company is saying and doing. The analysis suggests that despite minor differences in what each company says and does, which may be a result of different historical origins and the necessity to create different brands in a competitive industry, each company appears remarkably similar. To understand how oil companies can come to resemble one another, I consider external pressures such as government regulations, media coverage, advocacy campaigns, participation in trade associations, and uncertainty surrounding the role of new technologies. Particular attention is paid to how a singular disaster in one company can impact the entire industry. The conclusions address whether the observed behavior of the companies will result in more sustainable oil companies in the future, and whether we should expect them to act more green given the nature of their operations and constraints of the industry.

! 2
Introduction
Words and phrases like green, sustainable, renewable, and environmentally
conscious may have clear meanings in certain contexts, but in others, their meanings and
implications are complex. Companies in the oil industry have been including this type of
language more frequently in their vision statements, descriptions of their operations, and
marketing materials. Does this use of “green” buzzwords mean the companies are
becoming more sustainable?
It seems like a paradox to try to describe a company that relies on the extraction
of nonrenewable resources as green. Although oil companies have become interested in
newer alternative sources of energy, oil and natural gas remain the foundation of most
large, international oil companies. The finite availability of crude oil has long been
recognized (although exact estimates of how finite these reserves are vary greatly), but
the growing focus on sustainability and greenness in the oil industry is a fairly recent
trend (USGS, 2000). As we will see, it is not always clear what “sustainable” and
“green” mean for the business of an oil company.
The concept of sustainability has been defined as “meeting the needs of the
present without compromising the ability of the future generations to meet their needs”
(World Commission on Environment and Development, 1987). Oil companies do not
often distinguish between their use of the phrases green, sustainable, environmentally
conscious in a uniform way, but I will set forth distinctions here. For oil companies, the
concept of sustainability as defined above is most appropriately used when evaluating
their business strategy. For the purposes of this paper, sustainability of a business

! 3
concerns the degree to which they not only reduce negative impacts on the natural
environment through their operations, but also invest in business practices that promote
policies to make wide-reaching progress toward sustainable development. The
operations of oil companies will also be examined for their impact on the surrounding
environment. To distinguish from the above definition of sustainability, I will refer to
environmentally conscious operations as green operations. Green operations are not
necessarily sustainable in the long run, but minimizing the negative impact of operational
processes is still environmentally conscious.
The Questions
My main question is what are oil companies (specifically BP, ExxonMobil, and
Royal Dutch Shell) saying about sustainability issues and what are they doing in terms of
sustainable business decisions? The main question of what oil companies say and do
divides further into two parts. For this part we must compare the operations and products
within each company and between companies. Company operations deal with energy
usage necessary for operating refineries, emissions, and waste. The other subdivision is
concerned with the sustainability of the products, which are oil, natural gas, and possible
alternatives to fossil fuels. While the operations of oil companies may be green
(minimizing emissions and waste), the companies are not necessarily sustainable in their
product and business decisions, as they are asserting. Response to environmental
disasters also relates to the sustainability of a business. I will examine the three largest
private sector, international oil companies; each is publicly traded so much information is
available. I chose these oil companies because their immense size and scope are of great
consequence worldwide.

! 4
The Messages
Companies shape what they say about themselves and create a public image in
marketing campaigns. With choice language, they frame a message to be received by
consumers. These images and language may or may not reflect what the companies
actually do. Separating what they say from what they do requires analysis of data that
reflect company actions. Their public statements are also a reflection of what they do and
a close read is necessary to discern what is encompassed in the message. Recent
campaigns by oil companies have focused on the aspects of their business that are not oil
extraction and refining, such as research and development, renewable energy products,
and community involvement. Many oil companies, including the three examined here,
have been accused of “greenwashing” in their marketing campaigns (Pulver, 2007). Jay
Westerveld, a New York environmentalist, coined greenwashing in a 1986 essay,
referring to deceptive use of marketing where companies disingenuously spin their
products and policies as environmentally friendly (Sullivan, 2009). In order to counter
negative perceptions of Big Oil, these companies are focusing more and more on the
environmentally conscious aspects of their strategies. I will examine whether the
companies’ investments and behavior are signaling a real shift in the business or whether
they are merely paying lip service to a general emerging awareness of sustainability
issues.
Oil companies and renewable energy sources!
Part of oil companies’ strategies to make their business more sustainable is to
invest in renewable energy sources. Renewable energy is energy generated from natural
! 5
sources such as sunlight, wind, rain, tides, and geothermal heat, which are naturally
replenished (Renewable Energy Policy Network Global Status Report, 2009). While the
production and use of these energy sources minimize adverse impacts on the
environment, significant barriers exist to oil companies becoming serious players in
renewable energy. Currently, renewable energy sources could not provide enough energy
for even a small fraction of the energy demand (Renewable Energy Policy Network
Global Status Report, 2009). Additionally, oil companies’ investments in these sources
would not prove profitable in the short or medium term because of large sunk costs in
current methods of operation. Overall, oil companies have been making increasing
investments, both in amount of money and diversity of portfolio, in renewable energy
sources. However, the implications of these investments are unclear.
Overview of the oil industry
We need to understand the essential structure of the oil business to understand
what oil companies are saying and doing. The oil industry is divided broadly into three
parts: upstream, midstream, and downstream. The upstream comprises exploration and
production. The midstream is the distribution system, consisting of tankers and pipelines
that carry crude oil to refineries. The downstream includes refining, marketing, and retail
distribution, through gasoline stations and convenience stores. Companies that operate
upstream and downstream activities, such as the companies examined in this paper, are
considered integrated (Yergin, 2008). Although state-controlled national oil and gas
companies account for around three-quarters of the world’s oil production, private sector
companies rank in the top 10 among the world’s oil companies, and rank in the top 10 of
all corporations (Yergin, 2008).

! 6
Companies with different historical roots
In seeking to understand what the oil companies are saying and doing, we cannot
generalize from one company’s data to the entire industry. Even though the fundamental
business of each oil company is essentially the same, their perspectives on sustainability
issues may in part be shaped by their different historical origins. Each company
originated in a different country and has a long history of mergers, acquisitions, and other
transformations. These differences likely shape the corporate structure, values, and
sustainability strategies of each company. For example, although the company that is
now referred to as ExxonMobil has undergone many transformations in the past 100
years, most recently a merger between Exxon and Mobil in 1999, it is a direct descendant
of John D. Rockefeller’s Standard Oil company, founded in 1870 (Yergin, 2008).
ExxonMobil is the only supermajor oil company in the world whose historical roots trace
back to the United States of America (Yergin, 2008). BP has also undergone many
transformations in the past century, beginning with historical roots in the United
Kingdom, where its global headquarters still reside in the City of Westminster, London,
UK (Yergin, 2008). The BP we know today is the result of a 2000 merger of British
Petroleum, Amoco and Arco. Royal Dutch Shell’s historical roots trace back to
companies originating in Great Britain and the Netherlands: the Royal Dutch Petroleum
Company (founded in 1890 in the Netherlands), and “Shell” Trading and Transport
Company (founded in Great Britain in 1897) (Yergin, 2008). Currently, Royal Dutch
Shell headquarters are in The Hague, the Netherlands.

! 7
Materials and Methods
Data Collection
I am exploring the question of what are oil companies saying versus doing
regarding issues of sustainability and greenness. The data for this analysis came from the
companies’ annual reports and from other public data, cited below as they arise. To
answer the question of what oil companies are saying I gathered quantitative data from
summary annual reports and sustainability reports. I analyzed the sustainability-related
words the companies used in the text of what they said about themselves. For this
purpose, I defined categories of sustainability-related words and calculated the rate at
which each word-group occurred in the companies’ annual reports from 2000-2008 (See
Appendix 3). The definition of these word categories is described below. I did the word
analysis by copying text and pasting it into a Microsoft Word document, used the
Microsoft Word word-count feature, and tabulated the data with Microsoft Excel. The
underlying assumption of this analysis is that the relative frequency of the sustainability-
related words that the companies use to describe themselves reflects the importance they
attach to the concepts embodied in the words. The important point of comparison was
the relative frequency of words within each company’s reports, not the comparison of
word rates across companies. I stripped the reports of prepositions, articles, and
connecting words to get a better read of the prevalence of sustainability-related words in
relation to the rest of the substance of the reports. Some adjustments were needed to
make sure the studied words were used in a relevant context to answer the question. For
example, “responsibility” has many meanings so the word was only counted in contexts
where it referred to environmental responsibility. I selected word categories that were

! 8
representative of sustainability issues. The words were relevant to oil companies, but
rates for the same words could also be analyzed to measure sustainability in another
industry. See appendix 1 for the breakdown of word categories measured. Data were also
collected from the companies’ marketing literature as a measure of what they are saying,
under the assumption that what they say to the public is a reflection of their core
corporate message.
To answer the question of what are the companies doing, I determined different
metrics to measure the greenness of operations versus the sustainability of the business.
The metrics for which I gathered data on greenness of operations include emissions of
carbon dioxide (CO2), sulfur dioxide (SO2), and various oxides of nitrogen (NOx). In
recognition that the absolute amount of emissions is directly related to the size of the
company, data were normalized to account for differences in company size. For
example, millions of tons of CO2 emissions were divided by the total barrels of oil
equivalent produced (BOE) for each year.
I used annual reports and publicly available literature to gather data to measure
what the companies are doing with respect to a sustainable product. I gathered
information on how much money each company has been investing in the alternative
energy sector of their business and what type of renewable energy they are investing in.
Oil companies do not report these expenditures in a standardized way, so data are
presented as they are reported. I also gathered information on how much each company
spent on lobbying expenditures over time as a measure of their efforts to affect policy
decisions. I gathered these data on expenditures under the assumption that where
corporations invest their earnings is a reflection of their present and future business
! 9
strategy. I also gathered qualitative data on ExxonMobil’s response to an environmental
accident, the Exxon Valdez oil spill. These results are presented for ExxonMobil as a
representation of the impact that an environmental accident, and most importantly a
company’s response, can have on the entire oil industry. Other oil companies have
experienced accidents and have responded in their own way, although these disasters and
responses are not examined here. All of these accidents have impacted public perception
of the oil industry.
Results
The results are presented graphically below. The first set of results focus on the
question of what each company is saying. These data are captured in word frequencies,
meaning the rate at which each word occurs as a proportion of the total words counted in
the annual report. The vertical axis for each of the environmental language graphs
represents this rate as a proportion of the whole report. Following data on what each
company is saying I present data on what each company has actually done.
What each company has been saying with respect to green operations and
sustainability of product
Environmental language in Annual Reports

! 10
!
(Data from entire BP annual reports, 2000-2008)
Figure 1.1
Stacking the rates gives a sense for the overall presence over time of these eight word
groups together. The trend of selected word presence for BP is relatively flat from 2000-
2004. In 2005, the cumulative presence of selected words increases, and again maintains
a fairly consistent level through 2008. Prior to 2005, BP talks about “oil” more than
“energy” and in 2005, energy and oil occur with about the same frequency. The most
visible change over time is the increase in the presence of words directly relating to
climate change beginning in 2005. This change corresponds with an increase in words
relating to new technologies and pollution, which remain prominent to the present. It is
interesting to note that the single word “profit” occurs at a much greater frequency than
almost any groups of words until 2008, when the word profit almost disappears. In 2008,
“pollution” outnumbers all other selected words.

! 11
(Data from entire ExxonMobil annual reports, 2003-2008)
Figure 1.2
The trends in the presence of selected language for ExxonMobil are not consistent over
time. The most noticeable trend for ExxonMobil from 2003-2008 is the infrequency of
the word “profit” as compared to sustainability-related words. The word “oil” is
mentioned at least double that of other select words, except in 2006 and 2008. In 2006,
the presence of all of the sustainability-related words dropped dramatically. “Energy” is
scarcely mentioned until 2005, when its presence becomes relatively equal to that of the
word “oil.” The frequency of climate change related words increases sharply in 2005 and
2008; this departure from the usual trend requires explanation. The word groups
referring to “new technologies” and “pollution” alternate in their prevalence from year to
year, which is notable.

! 12
!
(Data from entire Royal Dutch Shell annual reports, 2003-2008)
Figure 1.3
Figure 1.3 demonstrates a relatively constant trend in selected word rates from Royal
Dutch Shell’s annual reports each year, except for the year 2004. The sharp increase in
the percentage of sustainability-related words in 2004 coincided with the publication of
Shell’s first sustainability report. In 2004, the mention of “energy” exceeded the mention
of “oil” for the only time in the six years. Each year, Royal Dutch Shell mentions the
single word “oil” as much, if not more, than all of the sustainability-related words
combined. Shell mentions the word “profit” much less from year to year than most of the
other words. “Pollution,” “new technologies,” and “climate change” are present at fairly
constant rates from year to year.

! 13
Alternative energy strategies
Here I present information from company websites and publications regarding
their commitments to renewable energy investment. This information is not readily
presented in a quantitative way, but the statements capture the companies’ positions.
BP recently released a statement highlighting the company’s commitment to
growing a focused portfolio of low-carbon businesses comprised of US onshore wind
power, biofuels, solar power and carbon capture and sequestration (“Strategy
Presentation,” 2010). Their reasoning for investing in alternative energy sources is as
follows: “Our diverse energy portfolio reflects the world’s need to source energy from
many different substances, regions and technologies and is underpinned by our resource
base, which is biased to conventional hydrocarbons” (“Strategy Presentation,” 2010). BP
comments on the role of public policy in the future of alternative energy: “Investments in
energy are long-term in nature. We believe that if policy-makers provide appropriate
frameworks and businesses make the necessary investments, our industry will be able to
provide the diverse and affordable energy needed by consumers in the future” (“Strategy
Presentation,” 2010). !
ExxonMobil takes a different approach to describing their non-oil business,
mainly focusing on breakthrough technologies that will “make more energy supplies
available to keep pace with a rapidly rising global energy demand, while also reducing
the environmental footprint of energy development” (“Climate Change,” 2010). They
emphasize how technology is important both for managing greenhouse gas emissions and
gathering oil and gas resources located in challenging environments. ExxonMobil
! 14
projects that oil, gas, and coal will meet close to 80% of global energy demand through
2030 (“The Outlook for Energy,” 2010). The same projections have wind, solar and
biofuels growing at the fastest rate for all fuel sources, at an annual rate of 9.3%. These
projections are at the heart of their communications strategy to “reduce greenhouse gas
emissions in our operations and support research into technology breakthroughs.” (“The
Outlook for Energy,” 2010).
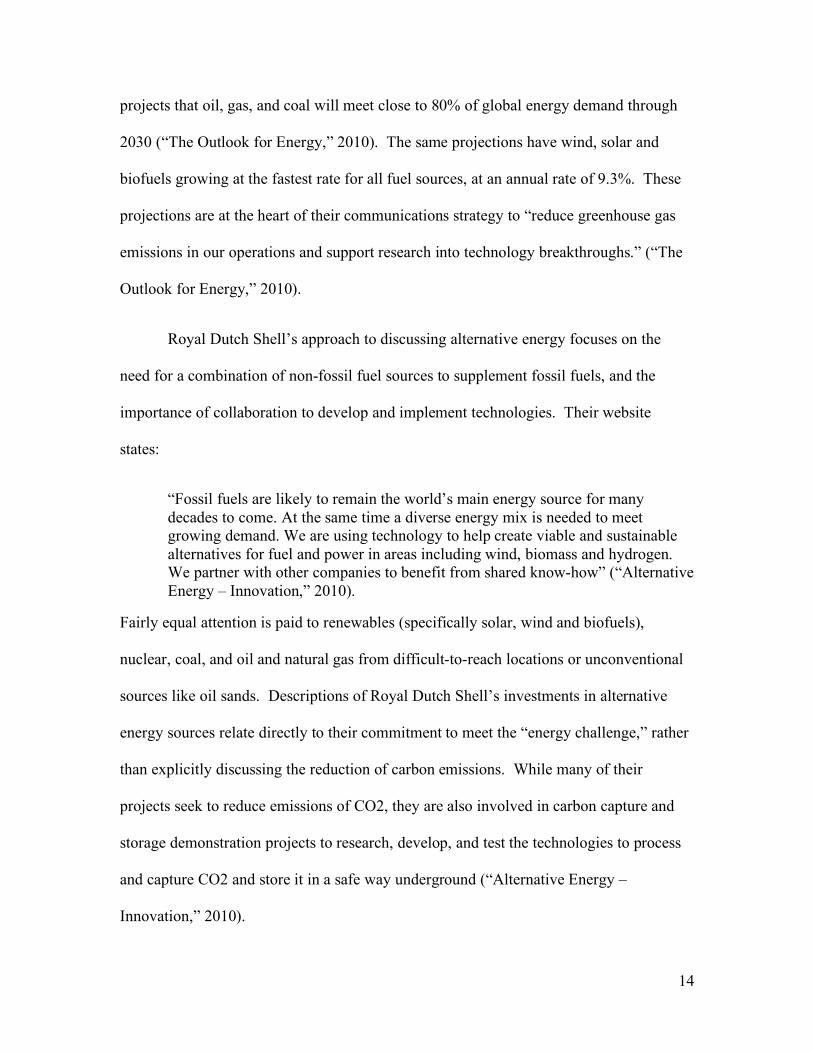
Royal Dutch Shell’s approach to discussing alternative energy focuses on the
need for a combination of non-fossil fuel sources to supplement fossil fuels, and the
importance of collaboration to develop and implement technologies. Their website
states:
“Fossil fuels are likely to remain the world’s main energy source for many decades to come. At the same time a diverse energy mix is needed to meet growing demand. We are using technology to help create viable and sustainable alternatives for fuel and power in areas including wind, biomass and hydrogen. We partner with other companies to benefit from shared know-how” (“Alternative Energy – Innovation,” 2010).
Fairly equal attention is paid to renewables (specifically solar, wind and biofuels),
nuclear, coal, and oil and natural gas from difficult-to-reach locations or unconventional
sources like oil sands. Descriptions of Royal Dutch Shell’s investments in alternative
energy sources relate directly to their commitment to meet the “energy challenge,” rather
than explicitly discussing the reduction of carbon emissions. While many of their
projects seek to reduce emissions of CO2, they are also involved in carbon capture and
storage demonstration projects to research, develop, and test the technologies to process
and capture CO2 and store it in a safe way underground (“Alternative Energy –
Innovation,” 2010).
! 15
What each company has been doing
I now present data that show what the companies are actually doing with respect
to green operations and sustainability of product and business. I have selected two
metrics for measuring greenness of operations: production and emissions. Data for all
operational data come from the following sources unless otherwise noted: “Air
Emissions” – Exxon, “Environmental HSE Charting Tools” – BP, “Interactive
Environmental Data Charts” – Shell Global. The metrics for sustainability of product and
business are investment in renewable energy sources and spending on lobbying. Sources
for those data will be cited as they arise.
Greenness of Operations
! 16
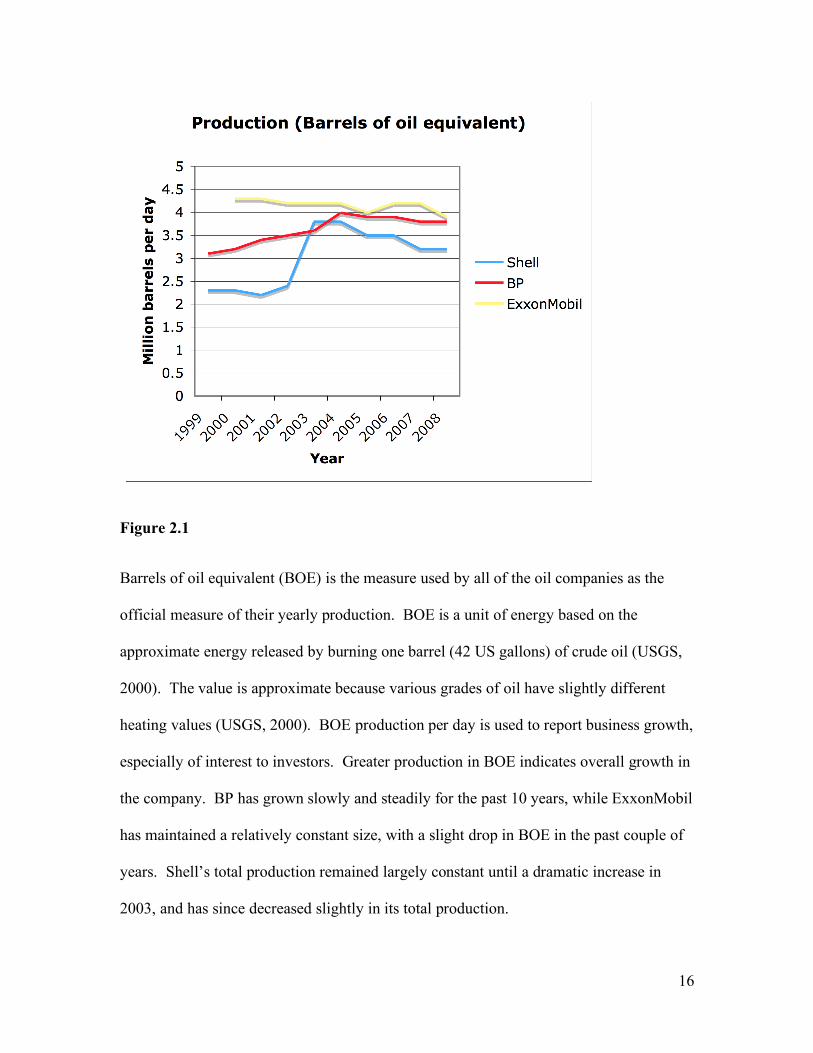
Figure 2.1
Barrels of oil equivalent (BOE) is the measure used by all of the oil companies as the
official measure of their yearly production. BOE is a unit of energy based on the
approximate energy released by burning one barrel (42 US gallons) of crude oil (USGS,
2000). The value is approximate because various grades of oil have slightly different
heating values (USGS, 2000). BOE production per day is used to report business growth,
especially of interest to investors. Greater production in BOE indicates overall growth in
the company. BP has grown slowly and steadily for the past 10 years, while ExxonMobil
has maintained a relatively constant size, with a slight drop in BOE in the past couple of
years. Shell’s total production remained largely constant until a dramatic increase in
2003, and has since decreased slightly in its total production.

! 17
Figure 2.2 and 2.3 are for data that all three companies report and that have relatively
standard measures.
!
Figure 2.2
The emissions represented in this figure come from company operations. The majority of
company operations relevant to reporting include the running of distillation operations
and other aspects of the refining process. We see that each company has taken measures
to reduce CO2 equivalent emissions each year. Data preceding 2005 were not available
for ExxonMobil, but the graph shows that in the past 4 years, ExxonMobil’s emissions
have been significantly greater than Shell or BP. The trend for Royal Dutch Shell is the
most unusual, and calls for an explanation.
! 18
!
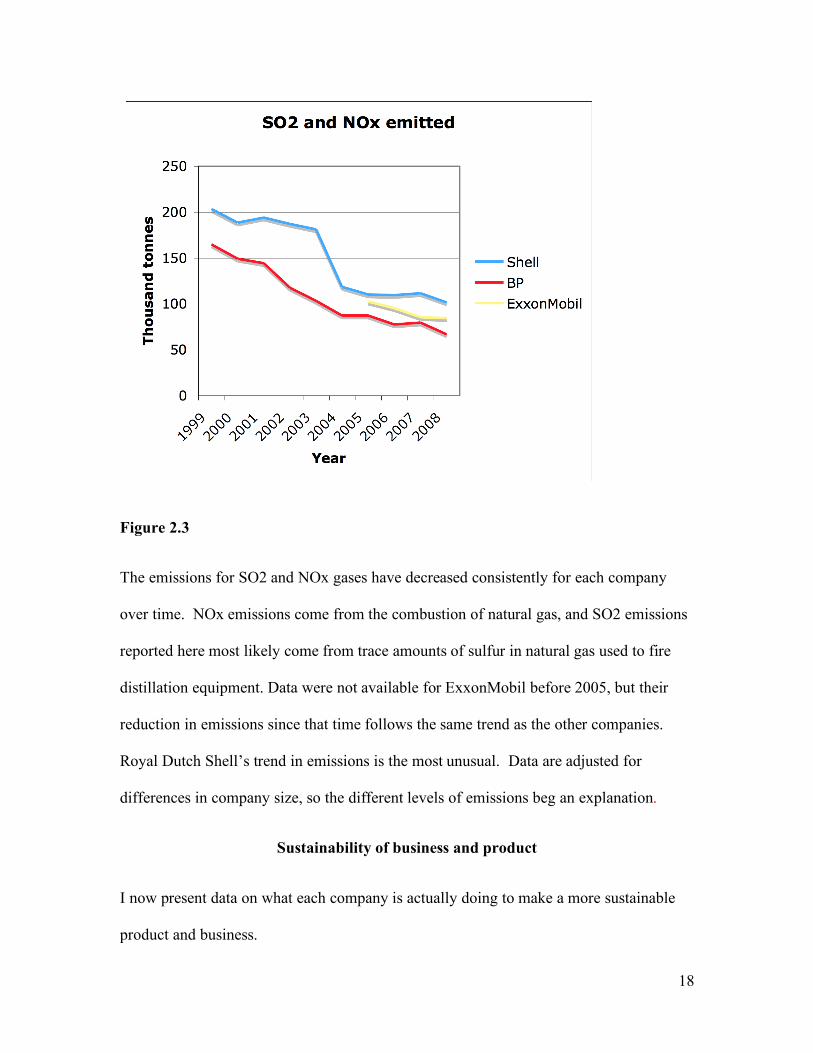
Figure 2.3
The emissions for SO2 and NOx gases have decreased consistently for each company
over time. NOx emissions come from the combustion of natural gas, and SO2 emissions
reported here most likely come from trace amounts of sulfur in natural gas used to fire
distillation equipment. Data were not available for ExxonMobil before 2005, but their
reduction in emissions since that time follows the same trend as the other companies.
Royal Dutch Shell’s trend in emissions is the most unusual. Data are adjusted for
differences in company size, so the different levels of emissions beg an explanation.
Sustainability of business and product
I now present data on what each company is actually doing to make a more sustainable
product and business.

! 19
Investments in Renewable Energy
The data on how companies are investing in renewable energy sources are not reported in
a uniform way for each company. I present both qualitative and quantitative data to
capture how each company is investing to make a more sustainable business. While
expenditures are not reported in an easily comparable way, they nonetheless paint an
important picture of the new investments by these oil companies. I also include data on
oil companies’ earnings in relation to other industries. These data are relevant when
considering the scale at which the companies are investing in technologies that are not a
part of their core, profitable business.
BP:
BP invested $1.3 billion in their portfolio of low-carbon businesses in 2008, with a
cumulative total of more than $4 billion in investment since 2006. BP does not describe
how much of the investments are for research and implementation of new technologies,
versus the purchase of already existing companies that may or may not be making
successful investments in renewable energy sources. (Data from BP annual report, 2009)
ExxonMobil:
ExxonMobil reported that in 2008, their worldwide environmental expenditures totaled
about $5.2 billion. This included $2.5 billion in capital expenditure and about $2.7
billion in operating expense. Fines and settlements paid in 2008 represented about one-
quarter of one percent of their total environmental expenditures. The company is also
investing more than $100 million in a test facility to develop carbon capture and storage
technology. (Data from: “Regulatory and Compliance Expenditures,” 2010)

! 20
Royal Dutch Shell:
Shell’s scenarios for a “New Energy Future” highlight the need for many renewable
energy sources. They report investing in wind projects and biofuels. They are working
on advanced biofuels from sources such as straw and algae. They are also investing in
testing technologies to capture CO2 and store it underground. Shell’s available financial
data is labeled as “research and development expenditures.” Following is a chart of Royal
Dutch Shell’s research and development expenditures from 2004-2008. (Data from
Royal Dutch Shell annual report, 2008).
Figure 3.1
This chart demonstrates Royal Dutch Shell’s increasing investments in research and
development, which is not defined more specifically in the report.

! 21
Figure 3.2
This chart demonstrates how the oil and natural gas industry reported less earnings in
2009 than the average of all manufacturing industries (“Industry Earnings,” 2010).
Compared to other industries, the percentage profit of oil companies is not outrageous.
They generate a lot of money from a large amount of sales, but they also have high costs
that off-set earnings.
Lobbying Efforts of Each Company
Companies in the oil and gas industry comprise the sixth highest industry in terms of
money spent on lobbying in the United States each year, ranking below the
pharmaceutical, insurance, electric utilities, computers, and business associations
industries (“Lobbying Top Spenders,” 2010). While each of the companies examined in

! 22
this paper has spent tens of millions of lobbying dollars in the past 10 years, ExxonMobil
is the ninth highest spender in the United States in the past 10 years (“Lobbying Spending
Database-Exxon Mobil,” 2009). Other top 10 highest spenders include the US Chamber
of Commerce, American Medical Association, and General Electric (“Lobbying Top
Spenders,” 2010). Royal Dutch Shell has spent significantly less than BP and
ExxonMobil in the past 10 years, with each company spending an increasing amount of
money since 2006. BP and ExxonMobil also tend to contribute significantly more to
Republicans than to Democrats (data not available for Royal Dutch Shell). I offer
possible implications of these spending patterns in the discussion.

! 23
!
Data from “Lobbying Spending Database – BP,” 2010.
Figure 4.1
Since 1999, BP’s annual lobbying spending remained steady until increasing dramatically
in 2008. Over the past 20 years, BP has consistently contributed more money to
Republicans than Democrats. The disparity was largest from 1996-2000. Overall
contributions to Democrats and Republicans spiked in that period, which is an interesting
trend. After that time, contributions to Democrats and Republicans were lesser overall.

! 24
!
!
Data from “Lobbying Spending Database – Exxon Mobil,” 2010.
Figure 4.2
ExxonMobil has consistently spent more money on annual lobbying than both BP and
Royal Dutch Shell. From 1999-2005, ExxonMobil’s trend in lobbying expenditures was
relatively flat. Spending increased greatly in 2006, and the trend has continued to
increase. In 2008 and 2009, ExxonMobil’s spending spiked, which is noteworthy. The
gap between ExxonMobil’s expenditures to Republicans over Democrats is consistently
large. ExxonMobil has never paid more money to Democrats than Republicans.

! 25
!
Data from “Lobbying Spending Database – Royal Dutch Shell,” 2010.
Figure 4.3
Royal Dutch Shell’s lobbying expenditures were almost non-existent from 2004-2006.
They increased dramatically in 2007, and continued to increase. Data were not available
for pre-2004 expenditures or for spending to Republicans and Democrats.
Discussion
What each company is saying with respect to greenness of operations and
sustainability of business
I will begin with a discussion of the word analysis from the annual reports. The
importance of what each company is saying is in the trends rather than the absolute
values. The relative word frequencies in annual reports must be analyzed delicately.
While this analysis operates under the assumption that the relative frequency of word
prevalence is directly related to the importance that companies place in the concepts
behind the words, I recognize that some anomalies may have resulted from a repetitive

! 26
writing style of different authors in certain years, and there is no direct way to correct for
this.
Analysis of word rates in annual reports for each company
BP
While selected words amounted to a small overall presence as a proportion of
annual reports for each company, important trends point to the similarities and
differences among companies’ marketing language. John Browne, former CEO of BP,
announced in 1997 that BP would support international greenhouse gas regulation before
any other supermajor followed suit (Pulver, 2007). Since the 1990s, BP has also built an
increasingly diverse energy portfolio, which corresponds to their high mention of
“energy” compared to “oil” (www.bp.com). While BP demonstrated leadership in
publicly acknowledging sustainability and climate change-related issues, this does not
prove that they have been moving their entire business in a more environmentally friendly
direction. The presence of words explicitly referencing climate change and pollution
further demonstrates BP’s awareness of the emerging issues, but not necessarily their
adopting a course of action. However, the presence of the words does not tell us whether
they are concerned with the environmental problems associated with the words or aware
that they should be mentioning them to paint a green image. BP’s consistently high
mention of “profit” demonstrates that while sustainability issues may seem increasingly
important to BP, the importance of their financial accountability to shareholders drives
business. BP was the first of the three companies to publish an Environmental Report in
! 27
1998. It is unclear whether this had a measurable effect on the content of the summary
annual reports, but the long time publication of a document dedicated to environmental
and sustainability issues reflects the value BP has consistently placed on making this type
of information publicly available.
Royal Dutch Shell
Royal Dutch Shell made minimal mention of sustainability-related language in its
annual reports until 2004. The increase in words relating to climate change, new
technology, and pollution coincided with the first publication of their Sustainability
Report. This dramatic increase in focus on sustainability and environmental issues
indicates an intentional shift in the company’s marketing strategy. In 2005, both BP and
ExxonMobil demonstrated sharp rises in the presence of sustainability-related language,
perhaps in response to the preceding shift by Royal Dutch Shell. Explanations for these
shifts in the mid-2000s are beyond the scope of this paper, but may correspond to market
pressures or opportunities, pending government regulation, stakeholder pressure, or
change in company leadership. The steady presence of “pollution,” “new technologies,”
and “climate change” related words in Royal Dutch Shell annual reports corresponds with
their relatively unchanging stance on environmental issues in the past 10 years. Their
consistent mention of “oil” over “energy” also reflects their commitment to focus the
majority of their business on oil and natural gas, while still investing in alternative
sources of energy.
ExxonMobil
The core of ExxonMobil’s message regarding greenness and sustainable business
on its website and other materials centers on technology investment. The low mention of

! 28
“new technologies” in annual reports does not reflect this focus. ExxonMobil has also
been subject to intense criticism about its past stands refuting science supporting climate
change and resisting investments in renewable energy sources
(Greenpeace/”ExxonSecrets”). Comparing its word rate trends to those of BP and Royal
Dutch Shell, the different stance ExxonMobil took on climate change is not evident.
ExxonMobil mentions “energy” at comparable frequency to “oil” after 2004. This trend
in language is similar to that of the other companies, and may represent a shift in rhetoric
priorities. ExxonMobil mentions “profit” at consistently low rates, which would indicate
that they take for granted, without explicitly saying so, that earnings drive the business.
Despite minor differences in language trends in annual reports, we do not see as
much overall difference between companies as we might expect. These three companies
are competitors in the same industry, yet they shape their annual report language much in
the same way, and perhaps in response to one another. In order to determine how closely
related what companies say is to what they do, we will now turn to the website as a
source of marketing. Companies use their websites to describe their alternative energy
strategies, which were presented as a measure of what they are saying.
While each company explains its specific investments in alternatives to fossil fuel
sources, their own perspectives on the emerging role of sustainability have distinct tones.
The content of each of their self-described sustainability strategies is remarkably similar,
and the difference in tone contributes to the distinct brand of each company. While each
company operates in over 100 countries, one of their larger markets is the United States,
and federal and state policy and regulations are accordingly important to business
strategy. Each company makes public statements regarding the role of policy in the

! 29
future of alternative energy, and each places great importance on the role of future policy.
This is not surprising considering the active lobbying efforts of each company each year.
While their language is vague when discussing specific aspects of issues, publicly
available information detailing monetary investments is a more powerful indicator of true
interests than public statements.
What each company has been doing
Greenness of Operations
I focus next on what each company is doing. I do not attempt to analyze the
absolute values of the operational data, or describe the global climate change implications
of a certain amount of CO2 emissions. Rather, the trends for each company are
important for drawing conclusions within the scope of this paper. We see from the
figures that each of the three companies exhibits trends in decreasing emissions while
increasing production. Yet another class of data, not presented here, are measures that the
companies determine themselves and do not fully define, potentially in an attempt to
produce environmentally friendly-looking figures. Examples include “external
perception of environmental performance” and “environmental expenditures”
(ExxonMobil and Royal Dutch Shell sustainability reports, 2008).
While the majority of CO2 emissions from oil result from the burning of fuel in
motor vehicles, each company does not report the emissions from their consumers’
behaviors. Providing means for consumers to reduce their carbon footprint fall under the
scope of sustainable business, and oil companies choose instead to report CO2 emissions
from their operations. Laws require them to report operational emissions, while they are

! 30
not required to encourage customers to use less fuel or more fuel-efficient vehicles
(“Greenhouse Gas,” 2010). Although Royal Dutch Shell’s trend is not as consistent as
BP and ExxonMobil’s, each company reduces their emissions of CO2, NOx, and SO2
over time. While this is beneficial to the environment, improving the efficiency of their
operations is not only advantageous to the company’s image, but also benefits them
financially. Improving each stage of the production process will benefit the company
financially and ensure adherence to present and possibly even future regulations.
Sustainability of product and business
I focus next on what each company is doing with respect to investing in a
sustainable product and business strategy. Data are hard to compare, but I will examine
what I have presented. A question that arises is whether oil companies are investing in
renewable sources of energy on a large enough scale to ensure sustainable development.
This is difficult to answer because oil companies’ investments in alternative energy
sources may seem a drop in the bucket compared to their overall business, but they may
be significant enough to spur growth in the relatively new renewable energy industry. An
additional question is whether it is reasonable for the oil companies to increase these
investments when this strategy may disrupt their current business model. The oil
companies’ increasing BOE production is a pattern we would expect to see for a
company operating to produce a profit and stay in business. The profit of big oil
companies is often discussed as a way to assert the “obscene” or “irresponsible”
operation of Big Oil (Mouawad, 2010). However, profits of big oil companies do not
appear far out of the normal range for manufacturing industries when compared to return
on sales, as presented in the results section. The oil industry operates on a massive scale,

! 31
leading not only to high revenue, but also high costs for the companies. The oil
companies may need to make significantly higher investments in renewable energy
sources to truly make their businesses more sustainable, but that does not mean their
current investments are entirely irresponsible.
The implications of lobbying expenditures presented earlier are difficult to
determine. It is notable that the amount of spending of each company differs
significantly from one another over time. This may be related to the different sizes of
each company, different policy interests, or other factors. The different historical origins
of each company may also contribute to different overall spending behavior and interest
in policy decisions. European-based companies may have a different philosophy for
lobbying in the United States government than do US-based companies. Overall, each
company consistently contributed more to Republicans than Democrats. This could
indicate that their business interests are more aligned with Republican candidates, and
they want to help them elections. However, these funds could be used for different
purposes than campaign fundraisings, so definite conclusions regarding the implications
of lobbying expenditures are beyond the scope of this paper.
This discussion has focused on what the companies are saying and doing, and the
associated implications for sustainability issues. I now turn to a discussion of external
factors that may acutely impact what companies say and do.
Organizational theory: an institutional framework
In the analysis of the original question, what are oil companies saying and doing, I
expected to discover differences to help understand the place of oil-producers in the

! 32
energy economy. Instead, each company looks remarkably similar. Why is this, and
should this be surprising? An established body of organizational theory offers a
framework to understand this observation and to suggest that these similarities may not
be so surprising. The fundamental resemblance of the companies’ core business
contributes to similarities in operational data, marketing materials, and annual reports.
Results that demonstrate a gap between what each company says and does also reveal a
surprising similarity among the companies. To frame the analysis of the questions, I will
draw on literature on institutional theory and learning organizations, which is a subset of
a larger topic of organizational theory. Powell and DiMaggio defined a theory of “new
institutionalism,” focusing on cognitive, social and organizational phenomena to explain
how organizations come to resemble one another (DiMaggio and Powell, 1983). This
institutional theory describes three processes by which organizations become increasingly
similar: coercive, mimetic, and normative isomorphism. (DiMaggio and Powell, 1983).
Organizational theory serves as a working observational framework that describes
similarities among oil companies, rather than serving as a means to prove causal links.
Company behavior and coercive pressures
Coercive isomorphism shapes oil companies to become more similar, resulting
from formal and informal pressures by other organizations (DiMaggio and Powell, 1983).
Examples of coercive pressures include media channels, government regulations, and
non-profit or advocacy campaigns. A picture of the media landscape that surrounds oil
companies reveals fairly uniform coverage for each oil company (see Appendix 2). The
tone of the media toward oil companies is most often negative, or skeptical at best. For
example, Anne Mulkern published a piece in the New York Times titled “Oil Companies’

! 33
Message is They’re Not Just About Oil.” In it she explores how oil companies have
expanded their brand, but includes quotes that argue the presence of a disconnect between
green messages in marketing and the actual plans of oil companies to invest significantly
in renewables (Mulkern, 2009). As we have seen from the data, the specific language
used to craft an image will be different between companies – distinct brands require
carefully crafted language – but the overall message has the same ring. Companies do
not make a strong effort to stand out from the group in the media, because drawing less
attention may have the greatest benefit.
Advocacy campaigns also represent a coercive pressure. They address issues in a
direct and visible way. If successful, they force a company to reconsider its priorities on
an issue, or at the very least provoke some response from the company. The most
aggressive campaigns have attacked ExxonMobil for both its response to the Valdez oil
spill in Alaska, and its statements in the early 2000s regarding climate change
(Greenpeace/ExxonSecrets, 2010). In both cases, Greenpeace and other groups singled
ExxonMobil out for actions that were unique to the company. The existence of websites
such as www.exxonsecrets.org and www.exxposeexxon.com have singled ExxonMobil
out from others, including BP and Royal Dutch Shell, and may have led to their change in
approach to speaking about climate change issues. Many media channels, including non-
profit funded sources, publish environmental or corporate responsibility rankings each
year. While each ranking is based on different measures, the presence of a company on
these lists may improve its reputation and inspire trust in the brand. The presence of one
competitor on a list especially increases the pressure on other companies to gain
recognition (“Our Performance Data,” Royal Dutch Shell). While we may not expect to

! 34
see oil companies high on an external ranking of the world’s most environmentally
responsible companies, their increasingly similar behaviors may be part of an effort to
gain positive recognition for what they are saying and doing.
Company behaviors and normative pressures
Normative isomorphism explains how the existence of professional and trade
associations define normative rules for an industry and shape companies within the
industry (DiMaggio and Powell, 1983). The organizational similarities of ExxonMobil,
Royal Dutch Shell, and BP facilitate participation in trade groups, namely the American
Petroleum Institute (API). This participation facilitates information sharing, and creates a
convergence of an industry perspective on sustainability-related topics. Each of these
companies attends API conferences, draws language from API reports, and engages in
similar lobbying efforts (API Reports, 2010). In exchange, each company benefits from
shared information and a certain buffering that comes with membership in a powerful
trade organization. While each company’s distinct historical roots accounts for subtle
differences in governance, the hierarchical structure of each company has converged
more and more over time. Davis, Yoo, and Baker examined the interconnectedness of
boards, finding that the corporate elite is a small world, and highly resilient over time.
The interconnectedness of corporate boards within an industry affects information flow,
and has important consequences for strategies adopted by organizations (Davis et al,
2003). These organizational patterns do not necessarily cause similarities among oil
companies, but they provide a context for the circumstances under which similarities
develop.
Company behaviors and mimetic pressures

! 35
Organizations tend to imitate other successful organizations when they are faced
with uncertainty or ambiguity (DiMaggio, Powell, 1983). Climate change and issues of
sustainability present great uncertainty for oil companies. They are still trying to
understand emerging technologies and determine their strategies in a rapidly changing
world. In order to move their company in a green direction, in the face of a great
paradox, they may turn to other company’s strategies in shaping their own. Peter Voser,
CEO of Royal Dutch Shell commented recently: “one thing is certain in the race for a
cleaner energy system: nothing is going to be certain for quite a long time” (Ball, 2010).
The data have shown that despite differences in the amount and type of investments in
alternative energy sources by oil companies, each company’s strategy is much more
similar now than it was even a few years ago. Although each competes for a profitable
space in the market, in part by shaping a unique brand, the overall attitude towards
sustainability for each company is remarkably similar.
How do organizations learn from singular events?
In an industry where three large companies look and act increasingly similar, one
critical incident could have a great impact not only on one company, but also on others in
the industry. I will now examine one such incident from decades ago that still has
implications worldwide. Isolated, special incidents may play a significant role in shaping
the direction of a company (Levitt and March, 1988). The operations of oil companies
involve a substantial amount of risk, to environmental and personal safety, as well as to
the business. While taking risk is unavoidable, a certain level of risk assessment and
mitigation is essential for the long-term success of an oil company. A certain level of
error in managing risk is unavoidable, and may be accepted in the industry and by the

! 36
public. However, when an accident or disaster occurs, the company’s response, both
public and private, is arguably as important or more important than the preemptive
measures taken to avoid the blunder. March, et al defined a subset of organizational
learning literature to explain how organizations learn from examples of one or fewer. In
the piece “Learning from samples of one or fewer”, March et al explain how strongly
positive or negative experiences can produce lasting change in an organization.
Organizations focus intensively on critical incidents, which are all critical because of
their place in the course of history, place in the development of belief, and metaphorical
power (March et al, 1991).
The most critical incident in ExxonMobil’s recent history was the 1989 Exxon
Valdez oil spill in Prince William Sound, Alaska. The Exxon Valdez vessel spilled 10.8
million gallons of Prudhoe Bay crude oil into the sea, with the oil eventually covering
1,300 square miles of ocean (US NOAA, 1992). For context, big spills account for 37
million gallons of oil put into the oceans each year, while dumping of oil down drains by
people accounts for a staggering 363 million gallons per year (Mukasa, 2010). Although
the spill ranks low in terms of volume of oil spilled, it is considered one of the most
devastating human-caused environmental disasters to occur at sea (Schmitt, 1989). For
example, a 1989 article in the New York Times quoted a Judge who compared the
damage caused by the Valdez oil spill to the damage caused by the dropping of the
atomic bomb in Hiroshima, Japan (Schmitt, 1989). The region was a habitat for salmon,
sea otters, seals, seabirds. Present and future generations of these animals were harmed,
as was the local economy. The tarnish on ExxonMobil’s reputation from the Valdez spill
is arguably still present today. Hundreds if not thousands of lawsuits have been filed in
! 37
response to the spill, and cases have been drawn out over many years. The Federal Oil
Pollution Act of 1990 was enacted in response to the spill, and other oil companies have
directly and indirectly addressed in the incident to set themselves apart (BP and Royal
Dutch Shell sustainability reports). The incident is studied in schools, and written about
by academics and professionals, who comment on the scope of the disaster not only for
the natural environment and local population, but also for the company. Exxon’s
response is more remembered and criticized than the incident itself.
What did Exxon say about the spill?
Media coverage ignited immediately following the spill, covering all aspects of
the environmental, social, and economic damage. Initially, Exxon’s CEO was skeptical
of the media, refusing to be interviewed (Dionne, 1989). This has been interpreted as a
haughty disregard for public concern, and only the start to Exxon’s public relations
disaster (Baker, 2010). After two weeks of ignoring questions about when clean up
efforts would start, Exxon publicly blamed state and federal officials for the delays in
containing the spill. When asked how Exxon intended to pay the massive cleanup costs,
one Exxon executive responded by saying it would raise gas prices to pay for the incident
(Dionne, 1989). These attempts to evade responsibility and defer blame angered
consumers. An Exxon executive agreed to an interview more than two weeks after the
spill, but was unprepared to answer questions about clean up efforts, defensive, and made
the company’s approach to handling the cleanup seem insincere and inadequate (Baker,
2010).
! 38
Over time, ExxonMobil’s tone has changed when publicly addressing the Valdez oil spill.
In 2004, ExxonMobil Vice President for Public Affairs Kenneth Cohen said:
“ExxonMobil has been a good corporate citizen in Alaska for more than 30 years. We have been a major contributor to Alaska’s economy, to community programs, to education, and the arts. ExxonMobil employees in Alaska, as individuals, have volunteered and worked hard to make their Alaskan communities better places in which to live” (Cohen, 2004).
While this statement does not resemble an apology that many believe to still be owed, the
tone of ExxonMobil surrounding more recent and smaller incidents is milder than the
defensive reaction to Valdez. The harm ExxonMobil’s reputation suffered from the spill
also impacted other oil companies. Legislation and other social and political
repercussions have most likely influenced every oil company’s strategy. The Valdez oil
spill has been used to support arguments to restrict drilling in Alaska and other
environmentally sensitive areas (Dionne, 1989). ExxonMobil’s strategy to change its
perspective on renewable energy investment in response to public criticism may be
related to lessons it learned following the Valdez incident. While other companies have
accidents in their histories, and have responded in their own ways, I chose to focus solely
on the Valdez incident to demonstrate how the entire industry is affected by one incident.
Conclusion
To accuse these companies of greenwashing based on the data presented would be
an oversimplification. However, the oil companies do portray images about their
business that are not entirely representative of what the companies do. Oil companies
have crafted marketing materials to persuade the public that they are more than petroleum
businesses. The extent of their investments in renewable energy sources and policies
promoting sustainable development suggest otherwise. While the companies are by no

! 39
means identical, I group them together in these conclusions because of the demonstrated
similarities among these three oil companies in what they say and do. The convergence
of the messages that the companies send to industry, government, consumers, and the
general public make the messages even more powerful.
We can assume that oil companies will continue to spend vast sums of money on
lobbying, likely not in support of policies that would require that they change their core
business in the short term. These corporations must continue to produce growth and
profit, neither of which is likely attained by increasing investment in renewable energy
beyond their current rate. However, all hope for a greener energy future is not lost. The
rhetorical capital spent promoting renewable energy investment may in fact encourage
green consumer behavior and spur outside investment in renewable energy technologies.
The adoption of new legislation could impact the long-term behaviors and investments of
oil companies, although specific suggestions for legislations are beyond the scope of this
paper. Inertia should be expected for large corporations in such a complex industry, but
we may yet see sustainable future change in the long term.

! 40
Author’s Note
In seeking to answer the questions posed in this paper, many more have arisen, which is a
testament to the complexity of this industry and its related issues. I have come to
understand that many factors are at play when considering the behavior of a company,
more than can be explored within the scope of this paper. While I have limited my
analysis to the aspects that I think are most relevant, I hope that the thought-provoking
nature of these questions results in further research.
Acknowledgements
First and foremost I would like to thank Irv Salmeen and Bobbi Low for acting as
invaluable guides and mentors throughout this project. Special thanks also to the Honors
Cohort of 2010 for their support and camaraderie. Endless thanks to my family and
friends for offering abounding love and support through this entire process. I would also
like to thank faculty and staff of the Program in the Environment and Organizational
Studies for challenging and inspiring me to complete a thesis, and providing help along
the way.
References
"Air Emissions." Exxon Mobil Corporation. 2010. Web. Jan. 2010. <http://www.exxonmobil.com/Corporate/energy_impact_air.aspx>.
"Alternative Energy - Innovation." The Shell Global Homepage - Global. 2010. Web. Feb. 2010. <http://www.shell.com/home/content/innovation/alternative_energy/>.
American Petroleum yearly reports, downloaded from www.api.org

! 41
Baker, Mallen. "CSR Case Studies in Crisis Management - Exxon Valdez."Web. Feb. 2010. <http://www.mallenbaker.net/csr/crisis03.html>.
Ball, Jeffrey. "Spoils Will Go to Those Who Exploit the Uncertainty the Best." Wall Street Journal. 08 Mar. 2010. Web. Mar. 2010.
BP Summary Annual Reports for the years 2000-2008, downloaded from www.bp.com
"BP: Summary | OpenSecrets." OpenSecrets.org: Money in Politics -- See Who's Giving & Who's Getting. 2010. Web. Feb. 2010. <http://www.opensecrets.org/orgs/summary.php?id=D000000091&lname=BP>.
"Climate Change." Exxon Mobil Corporation. 2010. Web. Feb. 2010. <http://www.exxonmobil.com/Corporate/energy_climate_views.aspx>.
Cohen, Kenneth P. "Since the Oil Spill: Letter to the Editor." New York Times. 30 Jan. 2004. Web. Dec. 2009. <http://www.nytimes.com/2004/02/03/opinion/l-since-the-oil-spill-214140.html>.
"Controlled Freeze Zone." Exxon Mobil Corporation. 2010. Web. Jan. 2010. <http://www.exxonmobil.com/Corporate/energy_climate_ops_cfz.aspx>.
Davis, Gerald F., Yoo, Mina, Baker, Wayne E. “The Small World of the American Corporate Elite, 1982-2001” Strategic Organization 1(3) (2003): 301-326.
De Geus, Arie P. “Planning as Learning” Harvard Business Review. March-April 1988: 3-6.
DiMaggio, Paul J., Powell, Walter W. “The Iron Cage Revisited: Institutional Isomorphism and Collective Rationality in Organizational Fields” American Sociological Review 48(2) (1983): 147-160.
Dionne, E. J. "Political Memo; Big Oil Spill Leaves Its Mark on Politics of Environment." New York Times. 3 Apr. 1989. Web. Dec. 2009. <http://www.nytimes.com/1989/04/03/us/political-memo-big-oil-spill-leaves-its-mark-on-politics-of-environment.html>.
"Environmental | HSE Charting Tools | BP." BP Global | BP. 2010. Web. Feb. 2010. <http://www.bp.com/extendedsectiongenericarticle.do?categoryId=9027879&contentId=7050788>.
"Environmental Data." Royal Dutch Shell Plc Sustainability Report 2008. 2010. Web. Jan. 2010. <http://sustainabilityreport.shell.com/2008/measuringourperformance/environmentaldata.html>.
"Exxon Mobil: Summary | OpenSecrets." OpenSecrets.org: Money in Politics -- See Who's Giving & Who's Getting. 2010. Web. Feb. 2010. <http://www.opensecrets.org/orgs/summary.php?id=D000000129&lname=Exxon+Mobil>.

! 42
"ExxonSecrets | Greenpeace USA." Greenpeace | Greenpeace USA. 2010. Web. Feb. 2010. <http://www.greenpeace.org/usa/campaigns/global-warming-and-energy/exxon-secrets>.
ExxonMobil Summary Annual Reports for the years 2003-2008, downloaded from www.exxonmobil.com
"Greenhouse Gas Reporting Rule | Regulatory Initiatives | Climate Change | U.S. EPA." US Environmental Protection Agency. 2010. Web. Mar. 2010. <http://www.epa.gov/climatechange/emissions/ghgrulemaking.html>.
"Industry Earnings." Exxon Mobil Corporation. 2010. Web. Feb. 2010. <http://www.exxonmobil.com/Corporate/energy_issues_earnings.aspx>.
"Interactive Environmental Data Charts - Environment & Society." The Shell Global
Homepage - Global. 2010. Web. Feb. 2010. <http://www.shell.com/home/content/environment_society/performance/environmental/environmental_data_table/>.
Levitt, Barbara, March, James G. “Organizational Learning” Annual Review of Sociology 14 (1988): 319-340.
"Lobbying Spending Database | OpenSecrets." OpenSecrets.org: Money in Politics -- See Who's Giving & Who's Getting. 2010. Web. Feb. 2010. <http://www.opensecrets.org/lobby/top.php?indexType=s>.
"Lobbying Spending Database-BP, 2005 | OpenSecrets." OpenSecrets.org: Money in Politics -- See Who's Giving & Who's Getting. 2010. Web. Feb. 2010. <http://www.opensecrets.org/lobby/clientsum.php?lname=BP&year=2005>.
"Lobbying Spending Database-Exxon Mobil, 2009 | OpenSecrets." OpenSecrets.org: Money in Politics -- See Who's Giving & Who's Getting. 2010. Web. Feb. 2010. <http://www.opensecrets.org/lobby/clientsum.php?lname=Exxon+Mobil&year=2009>.
"Lobbying Spending Database-Royal Dutch Shell, 2009 | OpenSecrets." OpenSecrets.org: Money in Politics -- See Who's Giving & Who's Getting. 2010. Web. Feb. 2010. <http://www.opensecrets.org/lobby/clientsum.php?lname=Royal+Dutch+Shell&year=2009>.
"Lobbying Spending Database-Top Spending Industries." OpenSecrets.org: Money in Politics -- See Who's Giving & Who's Getting. 2010. Web. Feb. 2010. <http://www.opensecrets.org/lobby/top.php?indexType=i>.
March, James G., Sproell, Lee S., Tamuz, Michal. “Learning from Samples of One or Fewer” Organization Science 2(1) (1991): 1-13.
Mouawad, Jad. "Exxon Grew as Oil Industry Contracted." New York Times. 01 Feb. 2010. Web. Mar. 2010.

! 43
<http://www.nytimes.com/2010/02/02/business/02oil.html?scp=3&sq=oil%20companies&st=cse>.
Mukasa, Sam. Graph of all sources of spilled oil. Lecture slides.
Mulkern, Anne C. "Oil Companies' Message Is They're Not Just about Oil." New York Times. 23 Dec. 2009. Web. 23 Dec. 2009. <http://www.nytimes.com/gwire/2009/12/23/23greenwire-oil-companies-message-is-theyre-not-just-about-50251.html?scp=1&sq=oil%20companies%27%20message%20is%20they%27re%20not%20just%20about%20oil&st=cse>.
NOAA, United States. Hazardous Materials Response and Assessment Division. Oil Spill Case Histories 1967-1991: Summaries of Significant U.S. and International Spills. Seattle, Washington, 1992.
"Our Performance Data - Environment & Society." The Shell Global Homepage - Global. 2010. Web. Mar. 2010. <http://www.shell.com/home/content/environment_society/performance/dir_our_performance.html>.
Powell, Walter W. “Neither Market nor Hierarchy: Network forms of Organization” Research in Organizational Behavior 12 (1990): 295-336.
Pulver, Simone. “Making Sense of Corporate Environmentalism: An Environmental Contestation Approach to Analyzing the Causes and Consequences of the Climate Change Policy Split in the Oil Industry” Organization Environment 20(44) (2007): 44-83.
"Regulatory and Compliance Expenditures." Exxon Mobil Corporation. 2010. Web. Jan. 2010. <http://www.exxonmobil.com/Corporate/energy_impact_regulatory.aspx>.
Renewable Energy Policy Network for the 21st Century. Renewables: Global Status Report 2009 Update. Paris, France, 2009.
Royal Dutch Shell Annual Reports for the years 2003-2008, downloaded from www.shell.com
Schmitt, Eric. "Tanker Captain Surrenders; Judge Sets $1 Million Bail." New York Times. 6 Apr. 1989. Web. Feb. 2010. <http://www.nytimes.com/1989/04/06/us/tanker-captain-surrenders-judge-sets-1-million-bail.html>.
"Spill Prevention." Exxon Mobil Corporation. 2010. Web. Jan. 2010. <http://www.exxonmobil.com/Corporate/energy_impact_spill.aspx>.
"Strategy Presentation 2010 | Press Release." BP Global | BP. 02 Mar. 2010. Web. 15 Mar. 2010. <http://www.bp.com/genericarticle.do?categoryId=2012968&contentId=7059787>.
Sullivan, John. "'Greenwashing' Gets His Goat - Environmental Activist Coined Famous Term." Recordonline.com - Times Herald-Record - Recordonline.com. 2009. Web. Apr.

! 44
2010. <http://www.recordonline.com/apps/pbcs.dll/article?AID=/20090801/NEWS/908010329/-1/NEWS56>.
"The Energy Challenge - About Shell." The Shell Global Homepage - Global. 2010. Web. Mar. 2010. <http://www.shell.com/home/content/aboutshell/energy_challenge/>.
"The Outlook for Energy: A View to 2030." Exxon Mobil Corporation. 2010. Web. Feb. 2010. <http://www.exxonmobil.com/Corporate/energy_o_view.aspx>.
USGS Central Region Energy Resources Team. U.S. Geological Survey World Petroleum
Assessment 2000. Publication. 2000. Web. Mar. 2010. <http://pubs.usgs.gov/dds/dds-060/ESpt1.html>.
The World Commission on Environment and Development. Our Common Future. Oxford: Oxford UP, 1987.
Yergin, Daniel. The Prize: The Epic Quest for Oil, Money and Power. New York: Free, 2008.
Appendices
Appendix 1: Breakdown of words measured in annual report word counts:
“Pollution” category includes the following words:
- Greenhouse - Emissions - Clean - Conserve
“New technologies” includes:
- Renewable - Research - Alternative
“Climate change” includes:
- Safety - Responsibility - Global Warming - Climate Change - Accountability - Sustainability
Each in their own category:!“Environmental” – demonstrates companies’ attention paid to very broad environmental topics!“Oil vs. Energy” – what they see their business as, do they use “oil” less because it is a potentially harmful word?!

! 45
“Profit” – they are each corporations that must report to their shareholders and earn profits – how much of a focus do they put on these profits?
Appendix 2: Media Coverage
Select sources criticizing entire oil industry:
Associated Press. "Senators Vent on Oil Company Executives." FoxNews.com. 09 Nov. 2005. Web. Dec. 2009. <http://www.foxnews.com/story/0,2933,175023,00.html>.
Cauchon, Dennis. "Candidates Disagree on Oil Companies' Tax Rate." USA Today. 15 Oct. 2008. Web. Dec. 2009. <http://www.usatoday.com/news/politics/election2008/2008-10-14-candidates-oil-companies-taxes_N.htm>.
Walt, Vivienne. "What Oil Companies Will Get in Iraq." Time. In Partnership with CNN, 19 June 2008. Web. Dec. 2009. <http://www.time.com/time/world/article/0,8599,1816599,00.html>.
"Big Oil Groups Implicated in Oil-for-food Scandal." Wall Street Journal Digital
Network. 28 Oct. 2005. Web. Dec. 2009. <http://www.marketwatch.com/story/big-oil-groups-implicated-in-oil-for-food-scandal>.
Mulkern, Anne C. "Oil Companies' Message Is They're Not Just about Oil." New York
Times. 23 Dec. 2009. Web. 23 Dec. 2009. <http://www.nytimes.com/gwire/2009/12/23/23greenwire-oil-companies-message-is-theyre-not-just-about-50251.html?scp=1&sq=oil%20companies%27%20message%20is%20they%27re%20not%20just%20about%20oil&st=cse>.
Associated Press. "Senate Committee Demands Oil Companies' Tax Records." USA
Today. 26 Apr. 2006. Web. Dec. 2009. <http://www.usatoday.com/news/washington/2006-04-26-oil-taxes_x.htm>.
"Motorists' Misery Is Oil Companies' Ecstacy." Telegraph. 06 June 2004. Web. Dec. 2009. <http://www.telegraph.co.uk/finance/2887256/Motorists-misery-is-oil-companies-ecstasy.html>.
Appendix 3
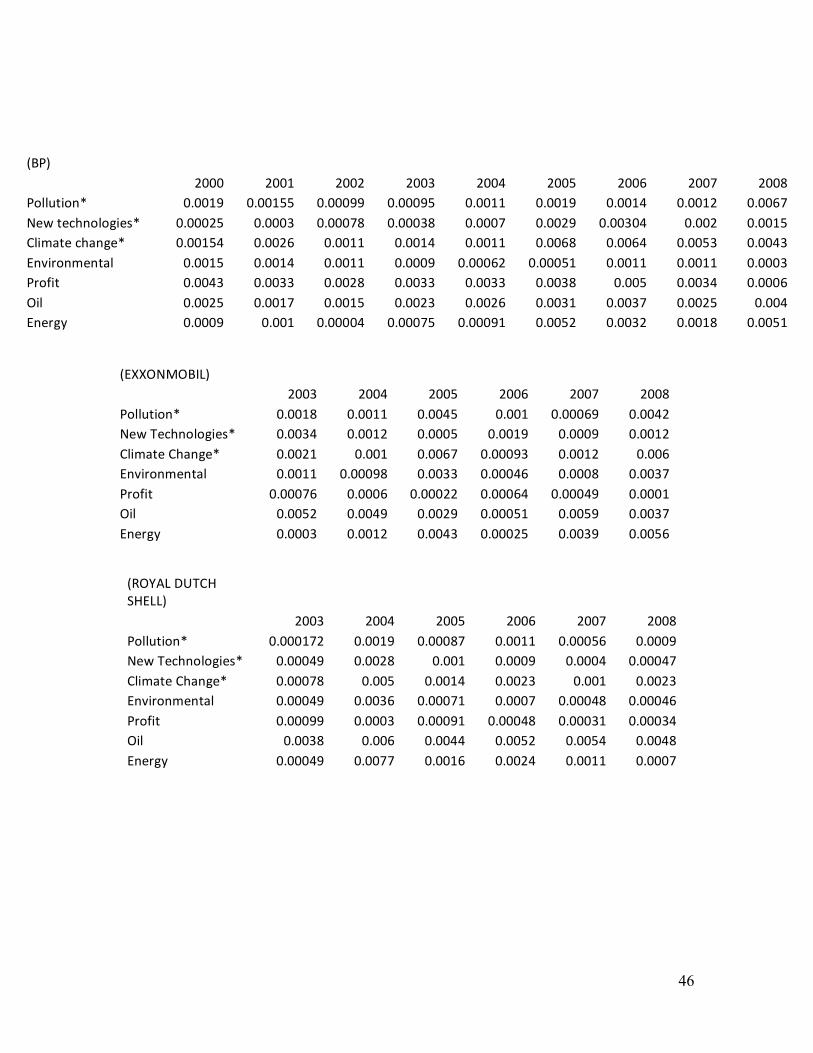
! 46
"#$$%&'%()*+! ! ! ! ! ! !
! ,--.! ,--/! ,--0! ,--1! ,--2! ,--3!
45667895:;! -<--=3! -<--==! -<--/0! -<--=! -<---1>! -<--/,!
&?@!A?BC:565D9?E;! -<--./! -<--=,! -<---0! -<--=>! -<--->! -<--=,!
F69GH8?!FCH:D?;! -<--,=! -<--=! -<--12! -<--->.! -<--=,! -<--1!
#:I9J5:G?:8H6! -<--==! -<--->3! -<--..! -<---/1! -<---3! -<--.2!
4J5K98! -<---21! -<---1! -<---,,! -<---1/! -<---/>! -<---=!
%96! -<--0,! -<--/>! -<--,>! -<---0=! -<--0>! -<--.2!
#:?JDL! -<---.! -<--=,! -<--/.! -<---,0! -<--.>! -<--01!
"M%NO*!PQAFR!
SR#**+! ! ! ! ! ! !
! ,--.! ,--/! ,--0! ,--1! ,--2! ,--3!
45667895:;! -<---=2,! -<--=>! -<---32! -<--==! -<---01! -<--->!
&?@!A?BC:565D9?E;! -<---/>! -<--,3! -<--=! -<--->! -<---/! -<---/2!
F69GH8?!FCH:D?;! -<---23! -<--0! -<--=/! -<--,.! -<--=! -<--,.!
#:I9J5:G?:8H6! -<---/>! -<--.1! -<---2=! -<---2! -<---/3! -<---/1!
4J5K98! -<--->>! -<---.! -<--->=! -<---/3! -<---.=! -<---./!
%96! -<--.3! -<--1! -<--//! -<--0,! -<--0/! -<--/3!
#:?JDL! -<---/>! -<--22! -<--=1! -<--,/! -<--==! -<---2!
"(4+! ! ! ! ! ! ! ! ! !
! ,---! ,--=! ,--,! ,--.! ,--/! ,--0! ,--1! ,--2! ,--3!
45667895:;! -<--=>! -<--=00! -<--->>! -<--->0! -<--==! -<--=>! -<--=/! -<--=,! -<--12!
&?@!8?BC:565D9?E;! -<---,0! -<---.! -<---23! -<---.3! -<---2! -<--,>! -<--.-/! -<--,! -<--=0!
F69GH8?!BCH:D?;! -<--=0/! -<--,1! -<--==! -<--=/! -<--==! -<--13! -<--1/! -<--0.! -<--/.!
#:I9J5:G?:8H6! -<--=0! -<--=/! -<--==! -<--->! -<---1,! -<---0=! -<--==! -<--==! -<---.!
4J5K98! -<--/.! -<--..! -<--,3! -<--..! -<--..! -<--.3! -<--0! -<--./! -<---1!
%96! -<--,0! -<--=2! -<--=0! -<--,.! -<--,1! -<--.=! -<--.2! -<--,0! -<--/!
#:?JDL! -<--->! -<--=! -<----/! -<---20! -<--->=! -<--0,! -<--.,! -<--=3! -<--0=!