oil and the global economy rogoff november 11
TRANSCRIPT

November 11, 2005
Oil and the Global Economy
by Kenneth Rogoff, Harvard University♦
♦ Prepared for International Energy Forum Secretariat meeting of Ministers and Oil Company Presidents, Riyadh, Saturday, November 19, 2005. The author is grateful to Martin Sommer and Mark Allen for help on oil data, and to E. Dvir for helpful discussions and research assistance.

1
I. Introduction
There is now broad consensus that oil price fluctuations no longer impact global
economic growth quite as much as they did twenty-five to thirty years ago. More
efficient use of energy resources, deeper financial markets, more flexible labor markets,
and above all, better global monetary policy, have all helped to mitigate the costs of oil
price volatility.1 Nevertheless, it would be very wrong to conclude that oil has completely
lost its sting. On the contrary, mainstream empirical estimates still suggest that oil price
increases since 2003 have cumulatively lowered global output by at least 1.5% to date, or
about a 750 billion dollars. And it is certainly not possible to rule out much larger price
shocks in the future.
If oil prices still bite, how can it be that global growth remains so strong? Indeed,
the International Monetary Fund (September 2005) is projecting global expansions of
4.3% ---above trend -- in both 2005 and 2006, albeit with risks tilted to the downside.
Even with oil prices having fallen the past few months, they are still more than double
levels of early 2003. Perhaps the biggest single mitigating factor is that the most recent
round of oil price volatility has taken place against an extraordinary backdrop of strong
global growth and low generalized macroeconomic volatility. Strong global performance,
along with anticipation of the continued emergence of Asia, has indeed been a major
driver of the past two years’ price increases.
1 For important research by official organizations on the role of oil in the global economy, the classic reference is IMF (2000), and subsequent discussions in the International Monetary Fund’s World Economic outlook, including especially April 2004, chapter 4. See also the International Energy Agency (May 2004). The intense debate over the role of oil in the academic literature can be gleaned from the Hamilton (2005), Bernanke, Gertler and Watson (2004), Hamilton and Herrera (2004), and Barsky and Killian (2002). (An important early paper in this literature is Hamilton, 1983, who first drew attention to the fact that oil might have been a major factor in post World War II US recessions even prior to 1970.) For a longer historical perspective on the role of oil in the world economy, the classic reference is Yergin (1991).
2
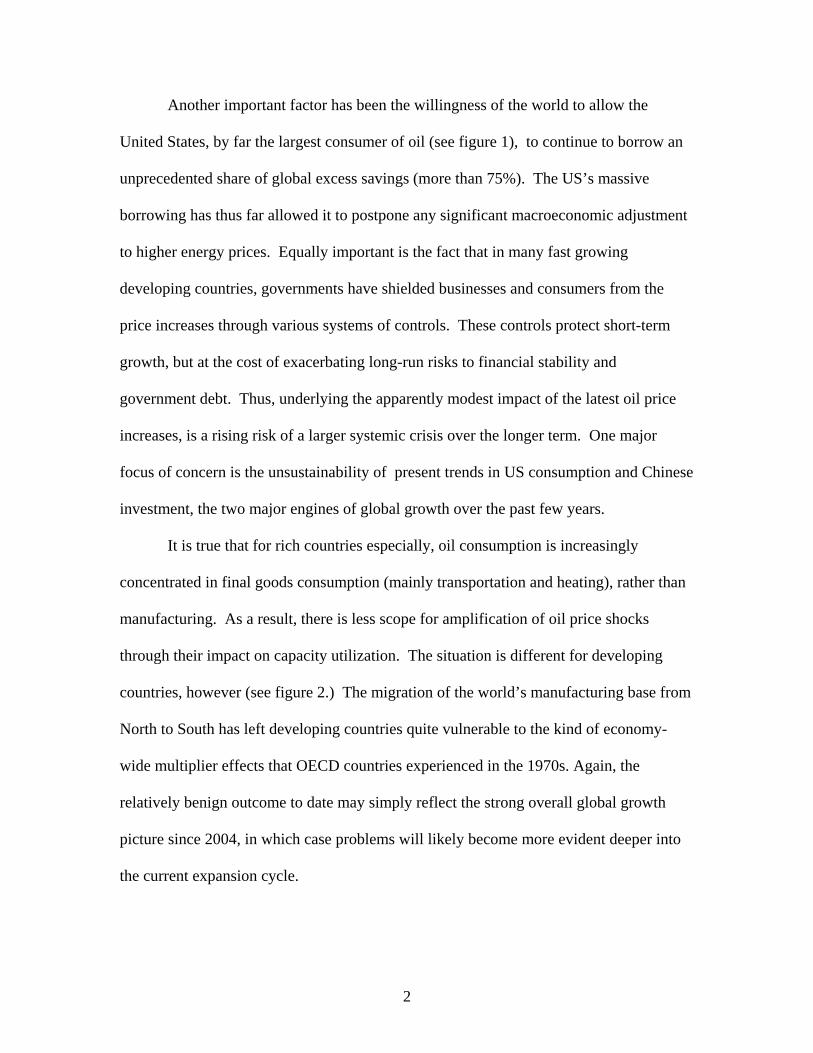
Another important factor has been the willingness of the world to allow the
United States, by far the largest consumer of oil (see figure 1), to continue to borrow an
unprecedented share of global excess savings (more than 75%). The US’s massive
borrowing has thus far allowed it to postpone any significant macroeconomic adjustment
to higher energy prices. Equally important is the fact that in many fast growing
developing countries, governments have shielded businesses and consumers from the
price increases through various systems of controls. These controls protect short-term
growth, but at the cost of exacerbating long-run risks to financial stability and
government debt. Thus, underlying the apparently modest impact of the latest oil price
increases, is a rising risk of a larger systemic crisis over the longer term. One major
focus of concern is the unsustainability of present trends in US consumption and Chinese
investment, the two major engines of global growth over the past few years.
It is true that for rich countries especially, oil consumption is increasingly
concentrated in final goods consumption (mainly transportation and heating), rather than
manufacturing. As a result, there is less scope for amplification of oil price shocks
through their impact on capacity utilization. The situation is different for developing
countries, however (see figure 2.) The migration of the world’s manufacturing base from
North to South has left developing countries quite vulnerable to the kind of economy-
wide multiplier effects that OECD countries experienced in the 1970s. Again, the
relatively benign outcome to date may simply reflect the strong overall global growth
picture since 2004, in which case problems will likely become more evident deeper into
the current expansion cycle.

3
High monetary credibility has meant that central banks have been able to restrain
from sharp interest rates so far, despite rising headline inflation. However, over the
longer term, particularly in regions like Europe where unions are still strong and markets
are less flexible, central banks may need to raise interest rates to prevent second round
inflation effects from becoming ingrained in expectations.
Aside from the effects of short term volatility, longer-term cycles in oil
production and prices also remain a very real concern, especially for producers (see
figure 3). Even with the ongoing deepening of longer term futures and forward markets,
their ability to hedge significant quantities of production more than one to two years out
is still extremely limited. Because of the large fixed costs and long lead times involved
in oil extraction projects, the industry has an acute tendency to become enmeshed in
“cobweb cycles” of collective over and under-investment, leading in turn to price cycles.
Today’s high prices, for example, reflect the effects of the industry’s underinvestment
during the low-price 1990s. Five to ten years from now, however, the oil market may
well be on the reverse side of the cycle, with prices again collapsing, despite the strong
long-term upward pressures due to growth in India, China and other emerging markets..
Indeed, as consuming nations become better adapted to deal with oil price
volatility, the locus of risks has increasingly become concentrated in producing nations,
both due to limitations in global financial systems and due to their own economic and
policy rigidities. Helping producers manage volatility and better diversify economic risks
is perhaps the single greatest problem posed by oil for the world economy today.
Solutions range from mechanisms for allowing foreign firms to bear more the of the long-
term production and price risk, to enhancing global markets for bearing nationwide

4
economic risk, to improved macroeconomic policy. For example, there is a strong case
to be made that more flexible exchange rate regimes, comparable to those of the
“commodity currencies” like Canada and South Africa, would help oil producing
economies diversify their economies by better shielding non-energy production from
shocks.
This paper will review the evidence, trying to give some flavor of the enormous
churn in the policy and academic debate on the role of oil prices in the macroeconomy.
Section II reviews the canonical evidence on past oil price shocks which underlies the
large impact estimates which characterized the literature until recently. Section III give a
brief survey of various heroic attempts to rationalize the outsized effects oil seemed to
have in the past. A disarmingly simple challenge to this entire literature is the fact that
with oil constituting only a relatively small share of global GDP (roughly 4%), it is not so
easy to explain why oil supply interruptions of 5-10% should have the dramatic effect
that simple correlations of oil and output suggest. We sketch a number of theories that
highlight factors such as the difficulty in reallocating resources after a shock, the
potential effect of oil price uncertainty on investment, and the effect of oil-induced
income redistribution on global aggregate demand.
Section IV looks at whether monetary policy may have once played a major role
in propagating and amplifying oil price shocks, along with a number of other factors that
may have changed over the thirty years, including the deepening of global financial
markets.
Section V then surveys various official estimates of oil price shocks – generally
based on large-scale macroeconomic models, and compares them with estimates from the

5
academic literature – generally based on either small-scale economic models or pure
statistical models. Although the range of estimates is very wide, more recent studies
appear to have coalesced a consensus estimate that a 10% increase in oil prices lowers
United States growth by .10 to .15% after one to one and half years.
Section VI looks at policy issues and Section VII concludes.
II. Oil and the economy: canonical evidence
Table 1 gives what many take as primae facie evidence that major cuts in oil production
lead to recessions in the United States. Considering that normal trend real income growth
for the United States was between 2.5 and 3.5 percent over this period, and that output
falls in each oil shock episodes, one can see why simple correlations of oil and output
show a dramatic effect. As the table indicates, the price shocks that occurred in these
episodes do not seem demand driven. Rather, the causality appears to run from
exogenous geo-political events leading to a reduction in oil production, then to a United
States recession. Straightforward statistical attempts to corroborate the importance of oil
prices seem to support the important role of oil prices as a leading indicator of economic
activity, as well. 2
On occasion, dollar exchange rate volatility implies that oil prices move in
sharply different directions when measured in different currencies, but as Figure 6
2 A simple regression of US output y on lagged oil prices, o, seems to indicate the oil prices have strong predictive power for output, even after one controls for past values of output.
1 2 3 4 1 2 3 4(0.18) (0.09) (0.09) (0.09) (0.09) (0.026) (0.026) (0.026) (0.027)1.14 0.20 0.05 0.10 0.19 0.004 0.027 0.034 0.065t t t t t t t t ty y y y y o o o o− − − − − − − −= + + − − − − − −
(Taken from Hamilton, 2005, standard errors in parentheses.) This relatively standard test, while “crude” is not easily overturned by more sophisticated methods.

6
illustrates, oil price volatility swamps exchange rate movements, so the major oil shocks
have generally been truly global. Thus, as figure 7 illustrates, each of these episodes
(with the exception of 1978) also produced a global recession.
In addition to oil’s seemingly decisive impact in post-war recessions, oil prices
also seem to be highly correlated with fluctuations in productivity growth in the United
States, as Table 2 illustrates.3 During “normal” periods, with the real price of oil around
$20 per barrel in 2000 dollars, US productivity growth in manufacturing averaged
between 1.18 and 1.99 percent per annum. During the period 1974-1985, however, when
oil prices averaged over $43 per barrel (in real price adjusted terms), productivity growth
was only 0.31% per annum. 4
Given this apparently compelling evidence on the effects of oil price shocks,
economists over the past 25 years have devoted considerable energy to trying to
understand why the effects seem to be so dramatic. The bottom line, as we shall see in the
next section, is that it is harder than one might think to explain why oil should matter as
much as it seems to.
III. If oil is such a small share of income, how can it have an outsized impact?
The pure statistical relationship between oil and growth is striking, but trying to
rationalize the magnitude of the effects is very difficult. The core problem is oil
3 (The measure of productivity used in the table controls for growth in capital per worker, so it is somewhat lower than conventional productivity measures that only look at raw output per worker, but the point would be the same with either measure.) 4 Recently, of course, despite soaring oil prices, US productivity growth has remained exceptionally strong, with 3rd quarter 2005 labor productivity exceeding 4% and recent trend in excess of 2.5%

7
consumption only accounts for roughly 4% of US output, in value terms. Assuming a
competitive market, therefore, the direct impact of a ten percent reduction in oil
consumption is only about 0.4% reduction of US GDP. (Of course, overall energy
consumption is larger, see Figure 5, but not by enough to change the basic puzzle.)
In principle, oil price shocks can lead to pauses in production by making portions
of the existing capital stock obsolete, temporarily idling both capital and workers in
energy intensive industries. Finn (2000) shows that in principle, this obsolescence effect
could explain a strikingly large effect for oil, so that a 1% increase in energy prices leads
to a 2.5% drop in output after 6 quarters.5 Her analysis, though, does not answer puzzles
such as why the 1986 collapse in oil prices down to $10 per barrel, did not produce a
corresponding boom. Also, other researchers have investigated the effects of oil prices
on the secondary market for capital goods, and on the rental market, and one does not
observe the sharp price drop-offs after oil price spikes that the model would predict.6
Moreover, if obsolescence were so important, it is surprising that there does not seem to
be any relationship between the energy intensity of various industries, and the way in
which sectoral output and employment responded after the oil shocks of the 1970s.7 A
similarly large impact estimate was produced by Rotemberg and Woodford (1997), who
argue that in economies with high degrees of monopoly in product markets, oil shocks
could set off large shifts in price markups that could in turn lead to booms and recessions.
Their model is quite elegant, though it is not at all clear one observes the large markup
volatility their transmission mechanism requires.
5 See also Hamilton (1988). 6 See Hulten, Robertson and Wykoff (1989). 7 See Bohi (1991) and the related discussion in Barsky and Killian (2004).

8
Another possible explanation comes from the drop in global aggregate demand
the world experiences if oil producers do not spend their higher income nearly in
proportion to the fall in non-oil consumption in oil importing countries. There is
doubtless some effect here, but in general wealth transfer effects such as this are simply
not large enough to explain the magnitude of GDP shifts illustrated in table 1.8 In part,
when an oil shock proves long lasting (and the most recent one is projected to at least
partially reflect longer term price trends, see figure 9.) oil exporting countries do spend a
significant portion of the increased revenue, 75 cents on the dollar after three years by
historical norms. More importantly, recycling of the oil funds back into consuming
countries allows typically allows consumers to smooth out the effects, at least in the
aggregate. As we have already noted, the current oil shock has compounded global
current account imbalances, with the oil exporting countries, for the moment, constituting
the largest pool of current account surpluses (see figure 10.), with concommitment longer
term concerns about the sustainability of US consumption growth (see figure 11).
In an elegant and influential paper, Ben Bernanke (1983) showed that oil price
spikes might lead to a high degree of subsequent uncertainty that causes firms to hold up
their investment projects, thereby leading to a dip in overall output. In theory, this effect
could be important, though there is not yet much corroborating empirical evidence. 9
Also, the investment pause model would seem to predict that oil dips would also lead to
pauses in investment (because they, too, generate price uncertainty), but this is not at all
obvious from the data.
8 See Obstfeld and Rogoff (1996). 9 As Barsky and Killian (2004) argue, evidence on car sales and consumer durables consumption – both of which should be impeded by oil price uncertainty – do not respond in any obvious way in periods of dramatic oil price uncertainty.

9
Finally, a factor that does not receive much attention in the literature, but should,
is the role of financial markets. Oil price shocks, and the concomitant policy uncertainty,
account for a significant fraction of overall macroeconomic volatility faced by many
countries. Table 3 estimates the effect on growth of a ½% decrease in macroeconomic
volatility (which averaged a bit over 4% across the countries listed in the table). The fall
in volatility has only a modest impact on annual growth for countries with highly
developed financial systems (measured, by convention, as private credit to GDP.)
However, for countries with very limited financial development, the effect can be quite
dramatic, implying higher annual growth of .3% per year, a very significant impact when
cumulated over a long period.10
IV. Was Monetary Policy the Culprit in 1970s and early 1980s Oil Episodes?
Another line of attack is to argue that the real culprit in the oil price debacles of
the 1970s and early 1980s was monetary policy. With the breakup of the Bretton Woods
system of fixed exchange rates in the early 1970s, and the massive monetary expansion
by the United States Federal Reserve in 1971 and 1972, the monetary authorities of the
world were ill-positioned to deal with a destabilization of inflation expectations set off by
the post 1973-74 oil price shock. Indeed, even absent the oil price shock, the United
States was already experiencing enormous inflation pressures and the central bank would
have been forced to tighten in any case. In the event, the necessary tightening was almost
10 Table 3 is calculated by extrapolating regression estimates from Aghion, P., Angeletos, G.-M., Banerjee, A., and Manova, K. (2005). In line with a growing body of related research, these authors find that countries with weak financial systems have more difficulty dealing with macroeconomic volatility of any type.

10
certainly exacerbated by the oil price shock, and the dramatic post 1972 election rise in
interest rates chilled the economy. Thus monetary policy played a major role in the
1973-74 recession, with monetary problems long predating the oil price increase, and
even arguably contributing to it (by pushing the pre-OPEC prices farther out of line with
market determined levels.)11
The idea that monetary policy might have been at least as responsible as oil
shocks for causing the recessions illustrated in Table 1 was first argued by Hooker (1996)
and Bernanke, Gertler and Watson (1997). Using a statistical analysis of interest rates,
oil and commodity prices, output and inflation, Bernanke et al argued that once one
controls for monetary policy shocks, the effects of oil price shocks are minor and even
statistically insignificant. Later, Hamilton and Herrera (2004) showed that these extreme
results are sensitive to how much time is allowed for oil shocks to work their way into the
output, restoring the importance of oil. In subsequent paper, Bernanke et. al re-estimated
their results, allowing for longer lags, to conclude that oil and monetary shocks appear to
be of roughly equal importance. Leduc and Sills (2004) corroborate this finding using
quite a different approach. At present, researchers appear to be reaching a tentative
consensus on this balanced viewpoint.
Figure 8 shows the dramatic trend decline in output volatility for the United States
and the world as a whole, especially since 1985. As Table 4 shows, while this
11 Given many anomalies in the magnitude and timing of price hikes across the different episodes, there is a strong case that demand shocks also played a role of some of the shocks in Table 1. For example, the 7.2 percent global production cut following the outbreak of the Iran-Iraq war in 1980 is of a similar order of magnitude to the 8.8 percent production cut following the invasion of Kuwait in 1990, yet the price spike in 1980 was much larger, suggesting diverse factors may have been act work. See Barksy and Killian (2002).

11
phenomenon has been most pronounced for the industrialized countries, it also holds
across emerging markets and other, less financially integrated, developing countries.
Why has overall macroeconomic volatility been declining, and what are the
implications for the vulnerability of the world today to oil price shocks? It is difficult to
sort out the answers quantitatively, but one can name a few factors. First, monetary
policy is vastly more stable today than it was thirty years ago, or even fifteen years ago.
Innovations such as greater central bank independence, transparency, and an increased
emphasis on stabilizing inflation have all played a role. So, too, has the fact that by
promoting flexibility and competitiveness, globalization has made the political economy
of maintaining low inflation easier than it was at the time of the first major oil shocks.
Table 5 (updated from Rogoff, 2003) illustrates the stunning world-wide drop in inflation
that has taken place in recent years. While there is some debate, a central estimate is that
improved monetary policy may account for about 15-25% of the reduction in volatility.12
A second factor is the ongoing deepening of financial markets, at both the domestic and
international level. Deeper financial markets allow risk to be spread more efficiently
around the economy to those who are best able to absorb the risk. This in turn lowers
overall volatility. A third factor is that the volatility of other shocks may simply have
been less over this period, though this proposition is difficult to test.
In addition to changing the political economy of monetary policy, globalization-
driven increased flexibility in price flexibility and competitiveness, have also forced both
firms and workers to react more rapidly to dislocations and shocks. The process is
particularly dramatic in the United States, but is seen to some extent across the globe.
Even Europe has become more flexible, albeit at a slower pace than has occurred in the 12 See Stock and Watson (2003)

12
United States. Inter-alia, this greater flexibility in the face of disturbances implies that oil
shocks, too, have less effect.
Last, but not least, in addition to becoming less oil intensive, oil consumption has
increasingly been concentrated in the transportation industry. This reduces the scope for
oil price shocks to have large knock on effects by idling plants and equipment. The more
oil is concentrated in final demand, the less the scope for the kind of magnified effects
that are necessary if oil is to have an outsized effect on the economy.
V. Estimates of the Effects of oil price shocks
Given the foregoing discussion of the difficulties of sorting out demand from supply
shocks, money shocks from oil shocks, etc, it is clearly both conceptually and practically
difficult to measure the effects on global output of oil price shocks with any great
precision. The 2003 International Monetary Fund World Economic Outlook, drawing on
a 2000 analysis conducted using the IMF’s original multi-country model, estimates that
$5 barrel increase in the price of oil lowers global output by 0.3% the following year for
the world as a whole.13 Across regions, the effects is slightly larger for Asia and Europe
than for the United States. With Brazil being largely energy independent and Mexico an
exporter, the effects on Latin America are relatively minor (less than 0.1% of GDP), but
for emerging Europe and Africa, the effects are twice as large (roughly 0.6% of GDP.)
More recent estimates by the IMF (World Economic Outlook September 2005)
contains more up to date simulations, taking into account the global decline in oil
13 As we have already noted, many other studies find even larger effects e.g. Jones, Leiby and Paik (2004) who find effects roughly twice as large, or Rotemberg and Woodford (1997) and Finn (2000), which find an even larger impact.

13
intensity of GDP (now 38% lower than in the 1970s), better monetary policy, and the fact
that the most recent shocks seems to be largely consumption driven, finds a somewhat
smaller effect. The newer IMF estimate is that a demand driven shock that raises oil
prices by 10% (e.g., from $50 per barrel to $55 per barrel) would lower global output by
only 0.10 to .15%. 14 In any event, even the new somewhat lower IMF parameters
suggest that global output is 1.0% to 1.5% lower than it would otherwise have been (500
to 750 billion dollars) due to the rise in oil prices since 2003. Presumably, had the rise in
prices occurred due mainly to a true supply shock (rather than just higher demand), the
estimates would be somewhat higher.
Another important set of official estimates is offered by the International Energy
Agency (May 2004), based on simulations using the OECD’s in-house large scale global
macroeconomic model. In these simulations, a rise of $10 per barrel (from a $25
baseline to $35) causes global output to fall by 0.4% after one year, roughly half way
between the older and newer IMF estimates. The impact on transition and oil importing
countries is found to be much larger. The effects on China and India to be two or more
times that for the world as a whole, whereas the effects on highly indebted poor countries
– many of whom face heavy import bills – is four times as large.15
Given the different assumptions and calibrations across the various studies on the
empirical effects of oil prices, it is a bit difficult to translate the various results into a
14 It is not entirely clear how to compare this estimate to the earlier one, since the notion of a “demand driven” oil shock is not entirely well defined (there is clearly a big difference between the case where oil is merely acting as an automatic stabilizer to macroeconomic activity – rising when activity is strong, falling when it is weak – and the case where oil supply shocks are determined by supply side factors. 15 It should be noted that both the IMF and the OECD estimates, while representing best available technique, are based on somewhat outmoded macroeconomic models that face many difficulties in trying to assess the importance of the many diverse factors affecting oil shock transmission, including the role of monopoly power, expectations, and systematic monetary policy. The IMF’s newer “GEM” model (a “new open economy model along the lines of Obstfeld and Rogoff (1996) offers the prospect of much improved estimates in the future after it is fully extended to incorporate oil.

14
common denominator for comparison. We nevertheless attempt to do this in Table 6,
which extrapolates the results of various academic and official calibrations to explore the
impact of a 10% rise oil prices on U.S. output. The range, as we can see, is quite
substantial though the more recent studies appear to be coalescing around a consensus of
-.10 to -.15 percent after four to six quarters. The tremendous uncertainty surrounding
this consensus is highlighted by the fact that important academic papers contain estimates
ranging from one tenth to twenty times as large. Despite the uncertainty over estimates,
there is broad agreement that there has been a substantial structural change in how the
world economy responds to oil shocks, especially since the mid-1980s.16 (Updating the
data from Bernanke et al to 2005 (the later paper has data through 2001) lowers further
the estimated effects of oil on output regardless of monetary policy reaction, but
preserves the main result that monetary policy accounts for at least half the effects of oil
shocks.)
Table 6 focuses on the United States because that is the common denominator for
most studies. To look more broadly at how oil shocks affect various regions around the
globe, Table 7 (drawn from IMF, March 2005) looks at how oil shocks affect various
major regions. In principle, the United States, with its extremely high oil dependence, is
particularly vulnerable, although, as we have already alluded, cascading global
imbalances may be temporarily covering up this effect.
VI. Longer Term Volatility and Policy Issues
16 The fact that oil shocks seem to affect the world very differently before and after 1984 was first emphasized by Hooker (1996) and Bernanke et al (1997).

15
Journalistic discussions of the oil market often describe price volatility as a result of
the “tight correspondence between demand and supply.” Of course, such a
correspondence, in itself, makes oil little different from any other good whose price is
determined in a market. What is notable about oil, and more generally about energy
consumption, is that it is typically much more expensive for both consumers and
producers to adjust in the short run to high prices than in the long run. In the short run,
consumers cannot just scrap oil inefficient cars, or move to more energy efficient homes.
Producers, in turn, face five to ten year lags in discovering and opening new oil fields.
Thus, markets are “tight” in the sense that neither demand nor supply is very sensitive to
price, implying that very large price movements are needed to clear relatively small
short-term imbalances between demand and supply.
Over the longer run, however, there is enormous scope not only for substituting to
other sources of energy, but reducing energy dependence more generally. Indeed, modern
industrial societies, steeped in individual automobile culture, have barely scrapped the
surface of possible social conventions (e.g., car sharing), that might economize on scarce
energy resources. Over longer periods, consumers can adjust, societies can adapt, and the
likely effects of higher oil prices are likely relatively manageable, more in line with the
size of oil and energy products in GDP. This share may rise over time due to trend price
changes, but overall, higher trend oil prices are not likely to induce dramatic changes in
standards of living across reasonable projections (e.g., if prices rise to $86 in coming
decades as projected by the IEA, 2005.)
In contrast, the costs of longer term oil price uncertainty are extremely
problematic for countries that depend heavily on oil production. These countries are not

16
only highly vulnerable to short run fluctuations in their revenues, but to longer run
fluctuations that result from investment cycles in the oil industry. Given the long lead
times in investing in new oil discovery and production, and the large capital expenditures
involved, it is not surprising that one sees large long term swing in oil prices resulting
from over and underinvestment. It would be extremely desirable for oil producing
countries to have access to means of diversifying their risks, either via sharing production
costs and revenues, or by having access to much deeper oil futures markets where risk
can be offloaded. The problem of helping oil producers better diversify risk has to be one
of the major policy challenges posed today by volatile oil prices.
As oil producing countries develop, it is also important for more countries to
adopt more flexible monetary policies and wean themselves of fixed exchange rates.
Commodity exporters such as Canada, New Zealand, Australia and South Africa
typically allow their exchange rates to move sharply in response to price changes for their
major commodity exports, thereby helping to stabilize internal prices of nontraded goods
industries, and overall output. (see figures 12a to 12d) Over time, oil exporting countries
would similarly be able to better insulate the rest of their economies by allowing
significantly more exchange rate flexibility, thereby promoting diversification and
avoiding the high frequency of deflation that otherwise will occur.17 The fact that oil
contracts are typically priced in dollars does little to overturn this general principle (most
commodity exporters set a significant share of total export prices in dollars also.)
For consuming countries, aside from the environmental effects of oil (a very
important issue but beyond the scope of this paper), the main approach to dealing with oil
price volatility has to be to continue to enhance flexibility. It should be noted however, 17 See Reinhart and Rogoff, 2004.

17
that the poorest countries, mainly due to weak financial markets, have the most to gain
from efforts to stabilize oil prices (e.g., from a 5 million barrel per day buffer for
production, as recommended by the IMF, 2004. ) Better access to loan market can also
help in principle, though the long history of debt crises, and the failure of recycling to
emerging markets in the 1970s, suggests caution in taking this approach too far.
VII. Conclusions
A number of factors make the majority of oil consuming countries less vulnerable
to oil price shocks than they were a couple decades ago. These include greater energy
efficiency, a greater concentration of oil consumption in final demand, better anchored
monetary policy, deeper financial markets, and more flexible labor markets. All in all,
consensus estimates suggest that the effects of oil price shocks on the economy are
probably less than half of what they appeared to be in the 1970s and early 1980s. That
said, despite appearances to the contrary, the effects are still quite sizable. Given the
potential for very large oil price shocks in the future, one can expect that oil price shocks
(and more generally energy price shocks) will play a large role in many future recessions.
The apparently benign effects of the most recent oil shock almost certainly reflect the
strong global economic backdrop in which they occurred (indeed, growth would have
been even stronger if more elastic oil supply had permitted smaller price increases.)
More alarmingly, it is likely that some of the problems oil might normally cause are
being covered up by increasingly unsustainable global imbalances, with concommitment
increasing long-term risks.

18
Regardless of the effects on the global economy, both short and long-term oil
price volatility remains a huge problem for producing countries. Some of the short-term
volatility can be alleviated by a larger buffer stock of oil supplies, though only to a rather
limited extent. Perhaps some of the long term volatility could be reduced by greater
transparency in the industry, though long-term cycles of over and under-investment are
likely to remain a long-term characteristic of the industry. The most promising vehicle
for reducing the impact of oil shocks on producers would be improving risk sharing
mechanisms in production and in financial markets. Greater flexibility in exchange rates,
as is practiced in some of the countries that have been relatively more successful in
dealing with commodity export price volatility, would also help better cushion non-oil
production.
All in all, whereas oil price volatility is more easily handled today than during the
1970s, it is likely to remain a major issue for businesspeople, consumers, and
policymakers for decades to come.

19
References Aghion, P., Angeletos, G-M., Banerjee, A. and Manova, K., 2005. “Volatility and Growth:
Credit Constraints and Productivity-Enhancing Investment.” Harvard University mimeo. Barksy, Robert, and Lutz Killian, 2002. “Do We Really Know that Oil Caused the Great
Stagflation? A Monetary Alternative,” in Ben S. Bernanke and Kenneth Rogoff (eds.) NBER Macroeconomics Annual 2001, Cambridge, MA (MIT Press).
Barksy, Robert and Lutz Killian, “Oil and the Macroeconomy Since the 1970s,” Journal of Economic Perspectives 18:4, pp. 115-134.
Bernanke, Ben S., 1983, “Irreversibility, Uncertainty, and Cyclical Investment,” Quarterly
Journal of Economics, February, 98:1, pp. 85-106 Bernanke, Ben S., Mark Gertler and Mark W. Watson. 1997. “Systematic Monetary Policy and
Effects of Oil Price Shocks,” Brookings Papers on Economic Activity, 1, pp. 91-148. Bernanke, Ben S., Mark Gertler and Mark W. Watson. 2004. “Oil Shocks and Aggregate
Macroeconomic Behavior: The Role of Monetary Policy. A Reply,” Journal of Money, Credit and Banking, 36:2 , pp 287-292.
Bruno, Michael, and Jeffrey D. Sachs. 1985. Economics of Worldwide Stagflation. Cambridge,
MA (Harvard University Press). Chinn, Yu-chen and Kenneth Rogoff, “Commodity Currencies, Journal of International
Economics 60 (February 2003), 133-160. Finn, Mary G. .2000. “Perfect Competition and the Effects of Energy Price Increases on
Economic Activity,” Journal of Money, Credit and Banking 32, pp. 400-416. Hamilton, James. 1983. “Oil and the Macroeconomy since World War II.” Journal of Political
Economy 91, pp. 228-248. Hamilton, James. 1988. “A Neoclassical Model of Unemployment and the Business Cycle.”
Journal of Political Economy, June, 96:3, pp. 593-617. Hamilton, James, 2005. “Oil and the Macroeconomy,” forthcoming in Palgrave Dictionary of
Economics, Steven J. Durauf (ed.) Hamilton, James, and Ana Maria Herrera. 2004. “Oil Shocks and Aggregate Macroeconomic
Behavior: The Role of Monetary Policy,” Journal of Money, Credit and Banking, 36, pp. 265-286.

20
Hooker, Mark. A. “What Happened to the Oil Price-Macroeconomy Relationship?” Journal of Monetary Economics 38, pp. 195-213.
Hulten, Charles R., James W. Robertson and Frank C. Wykoff. 1989. “Energy Obsolescence
and the Productivity Slowdown,” in Technology and Capital Formation, Dale W Jorgenson and Ralph Landau (eds.), Cambridge, MA (MIT Press).
International Monetary Fund, “Impact of Higher Oil Prices on the Global Economy,” IMF
Research Department, December 2000 (SM/00/275). International Monetary Fund, “Oil Market Developments and Issues,” March 1, 2005. International Monetary Fund, World Economic Outlook, April 2004, “Will the Oil Market
Continue to Be Tight,.” (main author Martin Sommer), Washington 2004. International Monetary Fund, World Economic Outlook, September 2005, Washington 2005. International Energy Agency. 2004. “Analysis of the Impact of High Oil Prices on the Global
Economy.” Paris. May. Jones, Donald W., Paul N. Leiby, and Inja K. Paik. 2004. “Oil Shocks and the Macroeconomy:
What has been Learned since 1996?” Energy Journal 25:2, pp. 1-32. Keane, Michael P. and Eswar S. Prasad. 1996. “The Employment and Wage Effects of Oil Price
Changes: A Sectoral Analysis,” Review of Economics and Statistics, 78:3, pp. 389-400. Kim, In-Moo, and Prakash Loungani. 1992. “The Role of Energy Shocks in Real Business Cycle
Models,” Journal of Monetary Economics 29:2, pp. 173-189. Lane, Philip R. and Gian Maria Milesi-Ferretti, “The External Wealth of Nations: Measures of
Foreign Assets and Liabilities for Industrial and Developing Nations,” Journal of International Economics 55 (December 2001), pp. 263-94
Leduc, Sylvain and Keith Sill. 2004. “A Quantitative Analysis of Oil Price Shocks, Systematic
Monetary Policy, and Economic Downturns,” Journal of Monetary Economics 51, pp. 781-808.
Loungani, Prakash. 1986. “Oil Shocks and the Dispersion Hypothesis,” Review of Economics
and Statistics 58, pp. 536-539. Obstfeld, Maurice, and Kenneth Rogoff, 1996, Foundations of International Macroeconomics,
Cambridge: MIT Press. Obstfeld, Maurice and Kenneth Rogoff, “Global Current Account Imbalances and Exchange
Rate Adjustments,” in William Brainard and George Perry (eds.), Brookings Papers on Economic Activity 1:67-146, 2005.

21
Olson, Mancur. 1988. “The Productivity Slowdown, the Oil Shocks, and the Real Cycle.”
Journal of Economic Perspectives, Fall 2:4, pp. 43-69. Prasad, Eswar, Kenneth Rogoff, Shang-Jin Wei and Ayhan Kose, The Effects of Financial
Globalization on Developing Countries: Some Empirical Evidence, International Monetary Fund Occasional Paper 220, 2003
Reinhart, Carmen and Kenneth Rogoff. 2004. "The Modern History of Exchange Rate
Arrangements: A Reinterpretation," Quarterly Journal of Economics 119(1):1-48, February.
Rogoff, “Globalization and Global Disinflation,” in Federal Reserve Bank of Kansas City,
Monetary Policy and Uncertainty: Adapting to a Changing Economy, 2004. Rotemberg, Julio J. and Michael Woodford. 1996. “Imperfect Competition and the Effects of
Energy Price Increases on Economic Activity.” Journal of Money, Credit and Banking, Part I, November, 28:4, 550-77.
Yergin, Daniel. 1991. The Prize: The Epic Quest for Oil, Money and Power. New York, Simon
and Schuster.

Table 1
Exogenous disruptions in world petroleum supply Date Event Drop in world production Drop in U.S. real GDP
Nov. 1956 Nov. 1973 Nov. 1978 Oct. 1980 Aug. 1990
Suez Crisis
Arab–Israeli War
Iranian Revolution
Iran–Iraq War
Persian Gulf War
10.1%
7.8%
8.9%
7.2%
8.8%
–2.5%
–3.2%
–0.6%
–0.5%
–0.1%
Source: Hamilton (2003), Barsky and Killian (2003) Table 2 Growth in Total Factor Productivity and the Real Price of Oil Imports 1950–1959 1960–1973 1974–1985 1986-2001 Real price of oil TFP growth (percent)
20.47 1.99
17.72 1.18
43.42 0.31
20.82 1.34
Source: from Barsky and Killian (2003). The productivity series is annual multifactor productivity in the private manufacturing sector. The oil price index has been deflated by the U.S. GDP deflator and expressed in 2000 dollars.

Table 4: Average Volatility of Income Growth
4.597.569.647.25Other developingeconomies
4.785.455.435.44Emerging Markets
1.912.542.992.73Industrial countries
1990s1980s1970s1960-99
Source: Prasad, E, Rogoff, K., Wei, S. and A. Khose (IMF 2003)

8.66.629.630.422.518.6Middle East6.07.717.2232.6185.982.4Latin America
11.416.166.8383.91.42.8CIS and Mongolia5.214.436.584.531.620.8
Central and eastern Europe
3.92.77.310.511.59.0Asia7.710.620.639.817.916.8Africa
5.96.313.153.248.031.4Developing countries
2.21.92.03.83.98.7Industrial economies
3.63.88.430.415.514.1World
200500-0495-9990-9485-8980-84
Table 5: Inflation is sharply down everywhere: World CPI Inflation (Updated from Rogoff (2003), using WEO data base)

Table 6: Effects of a 10% Oil Price Shock on Uoutput* Kenneth Rogoff Study Lag Change (in %) IMF (2000) 1 year –.15
IMF (2005) a. Temporary increase b. Sustained increase
1 year 1 year
–.10 –.15 to –.2
IEA (2004) 1 year –.10 Bernanke et al.** (1997) –.01 Bernanke et al.** (2004) 2 years –.12 Rotemberg-Woodford (1997), and Finn (2000)
5 to 7 quarters -2.5

Table 7: Global impact on real GDP growth of a rise in oil prices from $45 to $80 in 2005*
United States Euro Area Japan United Kingdom All Industrial Countries
Africa Developing Asia Western Hemisphere
–0.8 –0.6 –0.7 –0.4 –0.6 –0.8 –0.8 –0.8 –0.8
Source: IMF (2005) * The table illustrates results for the IMF’s base case of a temporary price rise. If risk is seen as persistent, estimates would average 0.3 to 0.5% lower.

Kenneth Rogoff
Fig 1 : Oil Consumption by Countries and Regions, End 2004
China9%
Japan6%
CIS4%
Rest of the World33%
OECD Europe20%
United States25%
India3%

Kenneth Rogoff
Fig. 2: Consumption by ProductsTransport fuels,
non-OECD15%
Other products, non-OECD
23%
Other products, OECD29%
Transport fuels, OECD33%

Kenneth Rogoff
Fig. 3: Main Oil Producers, End 2004
United Arab Emirates
3%
Nigeria3%
Rest of the World28%
Venezuela3%
Mexico5%
Norway4%
Canada4%
China5%
Saudi Arabia13%
Iran5%
Kuwait3%
Russia11%
United States9%
Iraq3%

Kenneth Rogoff
Fig. 4: Proven Oil Reserves, End 2004
Saudi Arabia22%
Kuwait8%Iran
11%
Libya3%
United Arab Emirates
8%
Iraq10%
Venezuela7%
China1%
Rest of the World16%
Russia6%
United States3%
Canada1% Mexico
1%
Nigeria3%

Kenneth Rogoff
Fig. 5: Energy Consumption by Fuel, End-2004
0%10%20%30%40%50%60%70%80%90%
100%
World OECD Non-OECD
Hydro-electricNuclear Energy Coal Natural GasOil

Fig. 6: Real Oil Prices: $ and Major Non-$(Jan 1973 – Aug 2005, in 2005 dollars) Kenneth Rogoff
0102030405060708090
100
Jan-7
3Ja
n-75
Jan-7
7Ja
n-79
Jan-8
1Ja
n-83
Jan-8
5Ja
n-87
Jan-8
9Ja
n-91
Jan-9
3Ja
n-95
Jan-9
7Ja
n-99
Jan-0
1Ja
n-03
Jan-0
5
Real US Oil Prices Real Non-US Oil Prices

0
1
2
3
4
5
6
7
8
70 75 80 85 90 95 00 05
Fig 7: World GDP Growth 1970-2005 Kenneth Rogoff
(percent change from a year earlier)

-1
0
1
2
3
4
5
6
7
8
69 73 77 81 85 89 93 97 01 05
(percent change from a year earlier)
Fig. 8: GDP growth has become less volatile Kenneth Rogoff
World
G7

0
10
20
30
40
50
60
70
80
01 02 03 04 05 06 070
10
20
30
40
50
60
70
80
Fig. 9: Oil Price: Spot and Futures(Average of WTI and Brent Crude; U.S. dollars/barrel)
Spot

Source: Lane and Milessi Ferreti, 2005, updated from IMF WEO
data base
Fig. 10: Current Accounts: Major Regions, 1994-2006(as percent of global GDP)
-2
-1.5
-1
-0.5
0
0.5
1
1.5
1994 1996 1998 2000 2002 2004 2006Asia Europe Mideast+CIS Japan United States
United States
Europe
JapanAsia
Mideast+CIS

0.10
0.20
0.30
0.40
0.50
0.60
0.70
0.80
1999 2004 2009 2014 2019 2024 2029 2034
Fig. 11: Up the Debt Ladder?
(Net foreign debt to GDP)
Projected U.S. Net Foreign Debt: (Obstfeld and Rogoff, 2005)
Brazil 1980
U.S. 2004U.S. 1894
Mexico 1980
Norway 1977
Sweden 1994
Finland 1994
Australia 1996
Ireland 1983
Hypothetical U.S.Debt Trajectory
U.S. 2008
Argentina 2001

Chinn and Rogoff (2006)
Fig. 12a: South Africa: Real Exchange Rate and Commodity Prices
75
80
85
90
95
100
105
1985.01 1987.01 1989.01 1991.01 1993.01 1995.01 1997.01 1999.01 2001.01 2003.01 2005.0140
60
80
100
120
140
160
lnRER(USD/SAR) - Left Scaleln(CRB CommP) - Right Scaleln(Gold Prices) - Right Scale

Chinn and Rogoff (2006)
Fig 12b: Australia: Real Exchange Rate and Commodity Prices
85
87
89
91
93
95
97
99
101
103
105
1983.01 1985.01 1987.01 1989.01 1991.01 1993.01 1995.01 1997.01 1999.01 2001.01 2003.01 2005.0160
80
100
120
140
160
180
lnRER(USD/AUS) - Left Scaleln(CRB CommP) - Right Scale

Chinn and Rogoff (2006)
Fig 12c: Canada: Real Exchange Rate and Commodity Prices
84
86
88
90
92
94
96
98
100
102
104
1973 1975 1977 1979 1981 1983 1985 1987 1989 1991 1993 1995 1997 1999 2001 2003 20050
50
100
150
200
250
lnRER(USD/CAN) - Left Scale
ln(CRB CommP) - Right Scale

Chinn and Rogoff (2006)
Fig 12d: New Zealand: Real Ex. Rate and Commodity Prices
80
85
90
95
100
105
110
1983 1985 1987 1989 1991 1993 1995 1997 1999 2001 2003 20050
20
40
60
80
100
120
140
160
180
200
lnRER(USD/NZL) - Left Scale
ln(CRB CommP) - Right Scale
ln(RBNZ CommP) - Right Scale