oil and gas industry engagement on climate change · 2020-04-17 · oil and gas industry engagement...
TRANSCRIPT

A Report of the CSIS ENERGY AND NATIONAL SECURITY PROGRAM
Oil and Gas Industry Engagement on Climate ChangeDrivers, Actions, and Path Forward
O C T O B E R 2 0 1 9
AUTHOR Stephen Naimoli Sarah Ladislaw

Oil and Gas Industry Engagement on Climate ChangeDrivers, Actions, and Path Forward
AUTHORS
Stephen Naimoli Sarah Ladislaw
OCTOBER 2019
A Report of the CSIS Energy and National Security Program

Oil and Gas Industry Engagement on Climate Change: Drivers, Actions, and Path Forward | II
About CSIS
Established in Washington, D.C., over 50 years ago, the Center for Strategic and International Studies (CSIS) is a bipartisan, nonprofit policy research organization dedicated to providing strategic in sights and policy solutions to help decisionmakers chart a course toward a better world.
In late 2015, Thomas J. Pritzker was named chairman of the CSIS Board of Trustees. Mr. Pritzker succeeded former U.S. senator Sam Nunn (D-GA), who chaired the CSIS Board of Trustees from 1999 to 2015. CSIS is led by John J. Hamre, who has served as president and chief executive officer since 2000.
Founded in 1962 by David M. Abshire and Admiral Arleigh Burke, CSIS is one of the world’s preeminent international policy in stitutions focused on defense and security; regional study; and transnational challenges ranging from energy and trade to global development and economic integration. For eight consecutive years, CSIS has been named the world’s number one think tank for defense and national security by the University of Pennsylvania’s “Go To Think Tank Index.”
The Center’s over 220 full-time staff and large network of affiliated schol ars conduct research and analysis and develop policy initiatives that look to the future and anticipate change. CSIS is regularly called upon by Congress, the executive branch, the media, and others to explain the day’s events and offer bipartisan recommendations to improve U.S. strategy.
CSIS does not take specific policy positions; accordingly, all views expressed herein should be understood to be solely those of the author(s).
© 2019 by the Center for Strategic and International Studies. All rights reserved
Acknowledgments
The authors would like to thank the workshop participants for their insight and feedback. This report was made possible by the generous support of JPMorgan Chase & Co.
Center for Strategic & International Studies1616 Rhode Island Avenue, NWWashington, D.C. 20036202-887-0200 | www.csis.org

Stephen Naimoli & Sarah Ladislaw | III
Contents
Introduction 1
Major Factors Driving Oil and Gas Company Climate Strategy Development 4
Policy and Regulation 4
Competition from Renewables 6
Investor Pressure 8
Company Climate Engagement Strategies 11
Oil and Gas Emissions in Context 13
Perspectives on Company Action 17
Equity Investor Perspective 17
Environmental Investor Perspective 18
Evaluation of Trends and Categories 20
Categories of Action 24
Contributions to the Energy Transition Challenge 25
Perception of Oil and Gas Company Investments 27
Opportunities for Further Action 29
Electric Vehicle Charging 29
Electrification 30
Hydrogen 30
Direct Air Capture 31
Carbon Capture, Use, and Sequestration 31
Offshore Wind 32
Conclusions 33
About the Authors 34

Stephen Naimoli & Sarah Ladislaw | 1
Introduction
The most important strategic issue facing the energy industry today is climate change. As the earth’s average temperature continues to rise with the accumulation of greenhouse gases (GHGs) in the atmosphere, the stable functioning of earth’s natural systems adjusts to the new, high-carbon reality and society begins to witness the effects of an altered natural environment and its impact on our lives and livelihoods. Left unmanaged, the impacts of climate change threaten the operation of the energy system in multiple ways. Increasing drought will make water scarcer, decreasing the resources available for hydropower generation and for cooling in thermal power generation.1 Increasing temperatures will decrease the technical efficiency of thermal and solar power generation and will drive cooling demands that could further stress power grids. Stressed power grids will not only hurt residential and commercial customers but will also affect the supply of power to oil and gas operations that rely on grid power. Sea level rise and increasingly frequent extreme weather events such as wildfires, hail, and flooding will damage physical infrastructure and inhibit operations all along the energy supply chain.2 The Gulf of Mexico, where 44 percent of U.S. oil refining capacity is located, could see four feet of sea level rise between now and 2100—flooding the likes of which could severely hamper refining operations.3 Flooding and melting permafrost also threaten the integrity of transmission infrastructure like pipelines.4 Increased temperatures will also affect operations in the Arctic, and indeed are already interfering with land transportation routes for oil and gas companies operating in the region.5
1. Intergovernmental Panel on Climate Change, Climate Change 2014: Impacts, Adaptation, and Vulnerability. Part A: Global and Sectoral Aspects. Contribution of Working Group II to the Fifth Assessment Report of the Intergovernmental Panel on Climate Change, eds. C.B. Field, V.R. Barros, D.J. Dokken et al. (New York, NY: Cambridge University Press, 2014), https://www.ipcc.ch/site/assets/uploads/2018/02/WGIIAR5-PartA_FINAL.pdf.2. Craig Zamuda et al., “Energy Supply, Delivery, and Demand,” in Impacts, Risks, and Adaptation in the United States: Fourth National Climate Assessment, Volume II, eds. D.R. Reidmiller, C.W. Avery, D.R. Easterling et al. (Wash-ington, DC: U.S. Global Change Research Program, 2018), 174–201, doi: 10.7930/NCA4.2018.CH4.3. Council on Foreign Relations, “Climate Risk Impacts on the Energy System,” June 14, 2019, https://www.cfr.org/report/climate-risk-impacts-energy-system.4. Matthew Brown, “Exxon Agrees to $1 Million Penalty for 2011 Yellowstone River Oil Spill,” Billings Gazette, Associated Press, April 26, 2019, https://billingsgazette.com/news/local/exxon-agrees-to-million-penalty-for-yel-lowstone-river-oil-spill/article_16709b8d-03f7-59f3-80c7-b5453ad0755a.html.5. Dipka Bhambhani, “Energy Companies Could Feel the Effects of Climate Change on Their The [sic] Bottom Line,” Forbes, October 25, 2018, https://www.forbes.com/sites/dipkabhambhani/2018/10/25/energy-companies-feel-the-effects-of-climate-change-where-it-hurts-the-bottom-line.

Oil and Gas Industry Engagement on Climate Change: Drivers, Actions, and Path Forward | 2
Measures to address climate change, namely policies and investments designed to reduce the flow of greenhouse gases into the atmosphere to reach a stable equilibrium, also impact the energy industry. These policies, by design, limit the amount of carbon dioxide-emitting energy resources that companies can use—of which oil and natural gas are two; the other major source is coal. By mid-century, estimates are that society must reduce the flow of GHGs into the earth’s atmosphere by 80 percent and then quickly decline to zero shortly thereafter to avoid the most catastrophic effects of climate change. This is a monumental challenge in scale alone given that a large portion of the capital stock that would contribute emissions between now and 2050 has already been built. According to International Energy Agency (IEA) estimates, getting the world on a pathway to address climate change by 2040 would only require 15 percent more investment than a scenario based on today’s policies, but the mix of those investments would be drastically different (see Figure 1 below). Both demand for and investment in oil and natural gas decline in this outlook, but the fuels remain in use well into the second half of the century, particularly in the case of oil use for petrochemicals and natural gas with carbon capture, use, and sequestration (CCUS) in multiple sectors.
Figure 1: Investment to Achieve 2040 Climate Goals
Source: International Energy Agency, World Energy Outlook 2018 (Paris: OECD/IEA, 2018).
Today, it is broadly recognized that the trend towards lower-carbon fuels is growing in momentum and likely to force the oil and gas industry to change or lose market share. However, according a 2019 UN Intergovernmental Panel on Climate Change report, global emissions today are not on track with where they should be to avoid dramatic damages from climate change.6 Whether and how society shifts from inadequate action today to something more commensurate with the pace and scale of the challenge is still unknown, but as pressure mounts to take further action, those operating in the energy sector will be expected to reduce emissions or face backlash from the public and policymakers.
6. Intergovernmental Panel on Climate Change, “Summary for Policymakers” in Global Warming of 1.5°C: An IPCC Special Report on the Impacts of Global Warming of 1.5°C above Pre-Industrial Levels and Related Global Greenhouse Gas Emission Pathways, in the Context of Strengthening the Global Response to the Threat of Climate Change, Sustain-able Development, and Efforts to Eradicate Poverty, eds. V. Masson-Delmotte, P. Zhai, H.-O. Pörtner et al. (Geneva: IPCC, 2019), https://www.ipcc.ch/site/assets/uploads/sites/2/2019/05/SR15_SPM_version_report_LR.pdf.

Stephen Naimoli & Sarah Ladislaw | 3
The oil and gas industry is made up of a broad and diverse set of companies that are responsible for producing 81 percent of today’s energy supplies.7 They differ in size, governance, theater of operation, function within the supply chain, and value proposition. For example, today approximately 90 percent of global oil and gas reserves are held by state-owned oil companies.8 In the United States, 46 percent of oil production comes from integrated oil majors, while the rest comes from independent and small oil and gas companies that most people have never heard of.9 The vast majority of investment in the industry takes place in the exploration and production phases of development. However, none of that product would be put to productive use were it not for the midstream and downstream players that invest in pipelines and refineries that turn the raw materials into useful products like gasoline, diesel fuel, jet fuel, and material for plastics and other petrochemicals that society consumes.
Throughout its history, the oil and gas industry has adjusted to the emergence of new competitive pressures that shaped the production and consumption environment for the fuels and services it provides. Whether by moving to deepwater oil and gas developments, upgrading heavier crudes like oil sands, producing tight oil, or incorporating biofuels into the liquid fuel distribution mix, the industry has made adjustments to survive.
Relative to the past, today’s challenges are formidable. From the shift of global demand growth to new countries, to the emergence of new supply sources like tight oil and shale gas, to the competition from new technologies, to ever-present geopolitical conflict and uncertainty, the oil and gas industry is in a constant period of change and reassessment.
Over the long term, the type of low-carbon future envisioned to combat climate change will fundamentally reshape the global energy system and producers of oil and gas will have to adjust to an entirely new competitive reality and, indeed, existence. And yet, how to get from the world of today where investors and society at large still demand record levels of oil and gas for consumption to a world of tomorrow where the energy system provides the same level of service while meeting the growing energy needs of a developing global population with a diminished GHG contribution remains difficult to navigate for oil and gas companies and policymakers alike. While modeling exercises can inform decisions on policy design, technological change, and the contribution of various fuels, the transition in reality will likely not be as smooth.
Despite all this uncertainty, more and more oil and gas companies are devising strategies to deal with climate change. Not all strategies are the same and not all companies have one. One frequently asked question regarding these strategies is whether oil and gas companies will continue to exist and even thrive in a low-carbon world. We do not attempt to answer this question through our analysis, although we agree that it is one that many oil and gas companies trying to transition to become more general “energy companies” are working very hard to answer. Instead, this report, based on research
7. International Energy Agency, World Energy Balances 2018 (Paris: OECD/IEA, 2018), https://webstore.iea.org/world-energy-balances-2018.8. Silvana Tordo, Brandon S. Tracy, and Noora Arfaa, National Oil Companies and Value Creation (Washington, DC: World Bank, 2011), https://siteresources.worldbank.org/INTOGMC/Resources/9780821388310.pdf.9. “Who Are America’s Independent Producers?” Independent Petroleum Association of America, https://www.ipaa.org/independent-producers/.

Oil and Gas Industry Engagement on Climate Change: Drivers, Actions, and Path Forward | 4
and a workshop held at CSIS in February 2019 with industry, investors, academics, and environmental groups, attempts to explore how oil and gas companies are taking action to address climate change, how these actions fit with the overall needs of the energy transition, and whether there is more companies can do to contribute to the solution set of this problem.
Major Factors Driving Oil and Gas Company Climate Strategy DevelopmentOil and gas companies have a variety of reasons to take action on climate change, including the proliferation of climate-related policies and regulation, competition from low-carbon energy resources, pressure from investors, and changing societal attitudes and preferences. Each factor has a different impact on a given company’s business activities, and some are more urgent than others, but taken together, they warrant greater attention from the industry as a whole because they will only increase. This section will address how policies and regulations, market competition, and pressure from investors drive climate strategy development. Changing societal attitudes and preferences influence development through each of those drivers, and thus their effect is not discussed independently.
POLICY AND REGULATIONGovernment policies designed to reduce greenhouse gas emissions have proliferated over the past few decades. As the threat of climate change grows, governments around the world face mounting pressure to take dramatic action and have begun setting targets for emissions reductions and instituting a range of policies to deal with the problem. Policies already in use to meet a government target include:
▪ Carbon Pricing Mechanisms: According to the World Bank’s Carbon Pricing Dashboard, there are 57 carbon pricing programs implemented or planned around the world, covering 46 countries and 28 subnational jurisdictions as of April 2019 (see Figure 2 below for the geographic distribution of policies).10 In 2020, this will mean that about 20 percent of global GHG emissions will be covered by carbon pricing schemes. This has grown from only two countries in 1990, when Finland and Poland implemented the world’s first carbon taxes, covering less than 0.1 percent of the world’s GHG emissions. While most carbon pricing mechanisms exist at the regional or national levels, carbon pricing mechanisms have been considered for sectors that cross national boundaries like the aviation sector. Certain subnational groupings, such as U.S. states and Canadian provinces, have also sought to coordinate (and eventually link) carbon pricing programs across borders.
10. “Carbon Pricing Dashboard,” World Bank, 2019, https://carbonpricingdashboard.worldbank.org/.

Stephen Naimoli & Sarah Ladislaw | 5
Figure 2: Carbon Pricing Policies, 2019
Source: “Carbon Pricing Dashboard,” World Bank, 2019, https://carbonpricingdashboard.worldbank.org/.
▪ Mandates and Regulations: Governments enact various policies and regulations to make climate-friendly decisions like boosting the share of renewable energy through renewable energy portfolio standards, improving energy efficiency through standard-setting, reducing emissions through a variety of emissions intensive performance standards, providing subsidies for low-emitting resources and technologies, and mandating the purchase of renewable or high-efficiency energy resources. As shown in Figure 3, 41 countries had policies to boost renewables in the power sector in 2004.11 In 2017, that grew to 128. In the transport sector, the number of countries with similar policies grew from 9 countries to 70 over the same period, and in the heating and cooling sector, it grew from 3 countries to 24 countries. These policies ranged from setting ambitious goals and framework targets to enabling regulatory environments.
11. Renewable Energy Policy Network for the 21st Century, Renewables 2018 Global Status Report (Paris: REN21 Secretariat, 2018), http://www.ren21.net/gsr_2018_full_report_en.

Oil and Gas Industry Engagement on Climate Change: Drivers, Actions, and Path Forward | 6
Figure 3: Proliferation of Renewable Energy Policies, 2004–2017
Source: Renewable Energy Policy Network for the 21st Century, Renewables 2018 Global Status Report (Paris: REN21 Secretariat, 2018), http://www.ren21.net/gsr_2018_full_report_en.
In general, oil and gas companies are concerned about these policies affecting their businesses because, by design, taxes and mandates for low-carbon energy resources should reduce demand for their products, and subsidies can increase demand for alternatives.
COMPETITION FROM RENEWABLESThe second driver of climate strategies at oil and gas companies is the economic competitiveness of renewable and low emissions energy resources. Clean energy technologies, particularly power generation technologies such as wind and solar, have experienced rapid cost declines in the past few years. As shown in Figure 4, the global weighted average levelized cost of electricity (LCOE) for solar photovoltaics (PV) fell from 37 cents per kilowatt-hour (kWh) in 2010 to 8.5 cents per kWh in 2018—a 77 percent decrease.12 Onshore wind fell 34 percent from 8.5 cents per kWh to 5.6 cents per kWh and offshore wind fell 21 percent from 16 cents per kWh to 12.7 cents per kWh. For context, the LCOE for fossil fuel-powered generation in 2017 ranged from 5 to 17 cents per kWh.
12. International Renewable Energy Agency, Renewable Power Generation Costs in 2018 (Abu Dhabi: IRENA, 2019), https://irena.org/publications/2019/May/Renewable-power-generation-costs-in-2018.
0
20
40
60
80
100
120
140
2004 2006 2008 2010 2012 2014 2016 2018
Power Regulations Transport Regulations Heating and Cooling Regulations

Stephen Naimoli & Sarah Ladislaw | 7
Figure 4: Selected Renewable Energy Technology Cost Trends, 2010–2018
Data source: International Renewable Energy Agency, Renewable Power Generation Costs in 2018 (Abu Dhabi: IRENA, 2019), https://irena.org/publications/2019/May/Renewable-power-generation-costs-in-2018.
According to the latest estimates from BloombergNEF, a firm that tracks the progress of clean energy technologies, solar and wind power generation options are increasingly more cost competitive than new and even some existing coal- and natural gas-fired generation in more and more parts of the world. As shown in Figure 5, an increasing number of renewable energy technologies are competitive with conventional fossil fuel generation in the United States. In fact, the penetration of intermittent renewable energy resources is becoming so high that it is raising questions about how to increase grid flexibility to incorporate these resources at even higher levels.
Figure 5: Levelized Cost of Electricity for Technologies by Category in the United States, 2019
Source: BloombergNEF.
At the same time, the electrification of more economic sectors is expected to accelerate: the IEA expects electricity demand will make up 40 percent of the increase in total final energy consumption between 2017 and 2040.13 Most deep decarbonization scenarios (modeling
13. International Energy Agency, World Energy Outlook 2018.
Fossil fuel cost range
$0.370
$0.085
$0.159 $0.126
$0.084
$0.055 $ -
$0.050
$0.100
$0.150
$0.200
$0.250
$0.300
$0.350
$0.400
2010 2018
Wei
ghte
d Av
erag
e LC
OE
($/k
Wh)
Solar PV O�shore wind Onshore wind
Oil and Gas Industry Engagement on Climate Change: Drivers, Actions, and Path Forward | 8
exercises used to inform emissions reduction strategies) include a three-step process of decarbonizing the economy: (1) decarbonizing the power sector, (2) using low-carbon electricity in other parts of the economy (like transport, industry, and heating—though there are alternative solutions for some of these hard-to-decarbonize sectors), and (3) massive improvements in efficiency. While full electrification of the transportation sector will take time, will be much harder to achieve in heavy-duty transport, and will not in and of itself lead to a collapse in oil demand, it can address a significant source of GHG emissions, and thus has become a policy objective in many locations around the world. Transportation contributes 14 percent of anthropogenic GHG emissions worldwide as of 201014 and emerged as the largest source of emissions in the United States in 2017.15 Transport electrification is also an important strategic opportunity for auto manufacturers and utilities, both of which see an electrified transportation sector as a future growth market.
These two factors combine to raise the profile of alternatives to oil and gas companies’ products. Oil and natural gas are, however, forecast to play a significant role in the economy for decades to come, even in 2-degree or 1.5-degree warming scenarios. Take, for instance, the International Energy Agency’s Sustainable Development Scenario (SDS): the SDS assumes GHG emissions will decline to half of today’s level and reach net-zero by 2070, then models the least-cost pathway to achieving these emissions reductions. In this scenario, renewables and nuclear supply 39 percent of primary energy demand, but oil still contributes 23 percent and natural gas makes up 25 percent (compared to 32 percent and 22 percent, respectively, in 2017). The remainder comes from coal (12 percent) and solid biomass (1 percent).16
That being said, the model-estimated least-cost pathways to reducing emissions may not actually be how this transition occurs. Regardless of the likelihood that oil and gas will maintain a share of energy consumption in decades to come, market competition for alternatives to natural gas in power generation or liquid fuels in transport has created pressure on the industry to adapt to a changing market. Oil and gas companies are therefore seeking to hedge their bets by buying into the burgeoning clean energy market and heading off challenges to their products without abandoning their core businesses.
INVESTOR PRESSUREFinally, publicly traded oil and gas companies face investor pressures. Environmental, Social, and Governance (ESG) is gaining prominence in investment decisions, most notably among major institutional investors. Activist groups have long pushed shareholder resolutions at oil and gas companies, but lately major investors like Blackrock, State Street, Vanguard, and the Church of England have joined them.17 As shown in Figure
14. Intergovernmental Panel on Climate Change, Climate Change 2014: Mitigation of Climate Change. Contribution of Working Group III to the Fifth Assessment Report of the Intergovernmental Panel on Climate Change, eds. O. Eden-hofer, R. Pichs-Madruga, Y. Sokona et al. (New York, NY: Cambridge University Press, 2014), https://www.ipcc.ch/site/assets/uploads/2018/02/ipcc_wg3_ar5_full.pdf.15. U.S. Environmental Protection Agency, “Sources of Greenhouse Gas Emissions,” https://www.epa.gov/ghgem-issions/sources-greenhouse-gas-emissions.16. International Energy Agency, World Energy Outlook 2018.17. Charles McGrath, “More Asset Managers Voting for Shareholder Climate-Change Proposals,” Pensions & Invest-ments, April 8, 2019, https://www.pionline.com/article/20190408/INTERACTIVE/190409848/more-asset-man-agers-voting-for-shareholder-climate-change-proposals; “Church of England Files Shareholder Resolutions at BP and Shell on Climate Change,” Reuters, December 4, 2014, https://uk.reuters.com/article/britain-climat-echange-church/church-of-england-files-shareholder-resolutions-at-bp-and-shell-on-climate-change-idUKL3N-0TO5CM20141204.

Stephen Naimoli & Sarah Ladislaw | 9
6, 182 shareholder resolutions concerning climate change were introduced at oil and gas companies from 2015 to 2018. Of these, 48 asked for political activity disclosures, 47 related to carbon asset risk, 44 related to methane emissions or hydraulic fracturing risks, 31 concerned sustainability oversight and management, and 12 requested setting GHG reduction goals.18
Figure 6: Climate-Related Shareholder Resolutions at Oil and Gas Companies, 2015–2018
Source: “Engagement Tracker,” CERES, 2019, http://engagements.ceres.org.
These resolutions were introduced at companies such as Anadarko, Chevron, ConocoPhillips, ExxonMobil, Noble Energy, and Valero. While many did not make it to a vote, and most of those that did failed, shareholder resolutions are clearly pushing companies to take more action. Of the 182 resolutions, 59 did not make it to a vote, and of those, 47 were withdrawn by the shareholders because of a commitment from the company or an ongoing dialogue. In one notable case of shareholder pressure, in 2018 and 2019, after pressure from climate-minded investors, BP, Equinor, and Shell announced they would set new emissions reduction targets, ensure that investments align with the Paris Agreement, and link executive pay to emissions targets.19 Shareholder resolutions are not going away: investors filed more than two dozen climate-related resolutions with oil and gas companies for 2019.
When looking at the data from the past few years, a few patterns emerge. Many shareholders will put forward the same resolution repeatedly until it passes—climate risk reports and sustainability reports being chief among these. Resolutions are more likely to pass or get commitments if they ask for reports on things like climate risks, strategies, or sustainability disclosures rather than making specific demands like linking executive
18. “Engagement Tracker,” CERES, 2019, http://engagements.ceres.org.19. “Engagement Tracker,” CERES; Nerijus Adomaitis and Simon Jessop, “Oil Firm Equinor Agrees Climate Change Targets with Investors,” Reuters, April 24, 2019, https://www.reuters.com/article/us-equinor-carbon/oil-firm-equinor-agrees-climate-change-targets-with-investors-idUSKCN1S01ZR.
48
47
44
31
12
Political activity
Carbon asset risk
Methane emissions/hydraulic fracturing risks
Sustainability oversight and management
GHG management
0 10 20 30 40 50 60

Oil and Gas Industry Engagement on Climate Change: Drivers, Actions, and Path Forward | 10
pay to sustainability metrics, increasing dividends, or adopting GHG targets. One notable exception is that no resolutions asking for reports on political activity have passed in this time period (although a few have secured commitments). Many shareholders want disclosure of methane emissions and reduction targets, but these resolutions rarely pass. About half of the requests for methane emissions disclosures or targets were withdrawn with a commitment from their companies and only two passed outright.
According to many companies and investors, these resolutions, along with voluntary reporting programs like the Financial Stability Board’s Task Force on Climate-related Risk Disclosure, are meant not only to garner greater attention to the issue of climate change but also to open a dialogue between investors and companies about risk mitigation and climate strategy. Rather than there being any one “right answer” to the question of how a company is prepared to deal with climate change, there is an overarching desire to make sure that companies are properly stewarding the long-term value of the company by, as one company put it, “performing today and preparing for tomorrow.”
These drivers—policy and regulation, competition from renewables, and investor pressure—interact with and often reinforce one another. For example, policy can help to drive technology deployment, which can drive down cost, which can increase investor interest. When combined with the growing societal concern over climate change, the reinforcing interaction of these drivers leads to a vision of the future where the risk of inaction is much greater than it is today. The cumulative impact of these factors on the oil and gas industry has heretofore not led to an entirely transformed industry, but instead one in which the strategic importance of preparing for a low-carbon future, the risks of climate change policies, and increasingly the impacts of climate change on the sector more broadly are taken much more seriously.

Stephen Naimoli & Sarah Ladislaw | 11
Company Climate Engagement Strategies
Oil and gas companies are not all subject to these pressures in the same way, and not all oil and gas companies take the same approach to dealing with climate change. We have identified five general categories of oil and gas companies when it comes to their climate strategies. While there is overlap between certain categories, this categorization offers a framework for understanding the heterogeneous nature of the industry.
▪ Strategy Leaders - The first category includes companies that are engaging in creating and executing a broad strategy to move from being an oil and gas company today to being an energy services company tomorrow. These companies are seeking to reduce their operational emissions, invest in technology development, set emissions reduction goals, and diversify their supply into renewable energy. They may be prioritizing one or two individual technologies, but they tend to spread their bets over many categories. They also tend to be companies motivated by the idea that the energy system is transforming in a way that will challenge the oil and gas industry at a fundamental level. These tend to be the companies taking the most ambitious steps to investigate new business opportunities.
▪ Technology Investors - The second category of company is investing in R&D and supporting regulatory constructs that encourage development of those technologies but has not yet developed a comprehensive climate strategy. These companies have shown some commitment to climate investments but are more hesitant to dive into broad strategies to transform their companies or to experiment a great deal with new business models. Oftentimes, these companies hold the view that neither the policy environment nor the technologies are yet at a state of maturity to achieve scale or provide adequate returns for the oil and gas industry. This can also be said of the Strategy Leaders in some cases, but Strategy Leaders see taking more aggressive actions to transform their business as providing some competitive benefit, whereas the Technology Investors group seeks only to stay on top of learning about the evolution of certain technology applications.
▪ State-Owned Enterprises - The third category is the state-owned enterprise—a large and diverse set of companies. It is also important to note that state-owned

Oil and Gas Industry Engagement on Climate Change: Drivers, Actions, and Path Forward | 12
enterprises and the governments than run them own the vast majority of world oil and natural gas reserves and are, for the most part, not subject to investor pressure. Instead, these companies are driven by the priorities of their owner governments and, to some extent, business strategies. The countries in which these companies are located frequently have separate state-owned entities dedicated to renewable energy development, so to the extent that state-owned oil and gas companies are addressing GHG emissions, it is largely through reducing their operational emissions. There are some notable exceptions, however. For a deeper analysis of state-owned enterprise climate strategies, see our joint publication with the Payne Institute.20
▪ Limited Resources Firms - The fourth category is composed of financially constrained, limited resource companies. These include small producers, pipeline companies, service companies, and some natural gas companies. They may be genuinely committed to reducing GHG emissions, but given their revenues, resource bases, or place in the supply chain, they have less capacity for change. Despite the limited purview of these companies, over the course of this research, we found that more and more of these companies are in the early stages of developing climate change strategies to satisfy growing investor interest. Most of these strategies focused on more conventional ESG and emissions reduction measures.
▪ Sideliners - The final category is companies not actively engaged in developing a climate change strategy or spending much time talking about the energy transition. These are companies that do not see a strategic reason to engage in actions to address GHG emissions and often operate against a much shorter economic time horizon. Many of these companies are small, onshore producers.
The diversity of entities within the oil and gas industry is important to keep in mind as the vast majority of attention and pressure to take action on climate change is focused on a relatively small but influential number of companies. In general, this fact illustrates why public policy is an important driver of emissions reduction behavior in changing the motivations and actions of a broader array of actors across the industry.
20. Ensieh Shojaeddini, Stephen Naimoli, Sarah Ladislaw, and Morgan Bazilian, “Oil and Gas Company Strategies Regarding the Energy Transition,” Progress in Energy 1 (July 2019): 1–19, https://doi.org/10.1088/2516-1083/ab2503.

Stephen Naimoli & Sarah Ladislaw | 13
Oil and Gas Emissions in Context
First, it is important to set some context for how much the companies discussed in this report directly contribute to the climate crisis. Our research focused primarily on the activities of seven major international oil companies (IOCs) between January 2017 and May 2019: BP, Chevron, Eni, Equinor, ExxonMobil, Royal Dutch Shell, and Total. As shown in Figure 7, world GHG emissions were approximately 55 gigatons of CO2-equivalent (CO2e) in 2014.21 About 34 percent of that is non-energy-related, and another 34 percent come from coal combustion. Emissions from oil and gas make up the remaining 32 percent of world emissions. The use of oil and gas by consumers and industries other than the oil and gas industry contributes 22 percent of world emissions. Oil and gas production by producers other than the seven IOCs we studied makes up about 9 percent of world emissions, and production by the IOCs emits about 1 percent.22
Figure 7: Breakdown of Global GHG Emissions
Data source: International Energy Agency, CO2 Emissions from Fuel Combustion 2018 (Paris: OECD/IEA, 2018); Interna-tional Energy Agency, World Energy Outlook 2018 (Paris: OECD/IEA, 2018); CSIS research from company reports.
21. International Energy Agency, CO2 Emissions from Fuel Combustion 2018 (Paris: OECD/IEA, 2018).22. International Energy Agency, World Energy Outlook 2018.
55,442.1 18,987
18,618
4,764
437 0.0
10,000.0
20,000.0
30,000.0
40,000.0
50,000.0
60,000.0
World Non-Energy-Related
Coal Combustion
O&G Combustion(non-industry)
Other O&GProducers
IOCs
GHG
Emis
sion
s (m
illio
n to
ns o
f CO
2-eq
uiva
lent
)
12,637

Oil and Gas Industry Engagement on Climate Change: Drivers, Actions, and Path Forward | 14
The seven IOCs we studied also do not make up a majority of the oil and gas market. In 2017, the world produced 152.1 million barrels of oil-equivalent per day, 92.6 of which were oil and 59.5 of which were gas.23 The seven IOCs contributed approximately 13 percent of this production. Similarly, these companies do not emit the majority of GHG emissions from oil and gas operations. Oil and gas operations emitted approximately 5.2 billion tons of CO2e in 2016.24 According to the data reported by the seven IOCs, their operational emissions account for 8 percent of that total.
Although these companies do not have an outsized impact on world GHG emissions, they are major international corporations and they have the potential to drive change in the industry. In addition, we chose these companies because they are among the major oil and gas producers most engaged in the energy transition in some way, whether it is with a broad strategy and clear vision or more cautious, targeted investments.
Many companies have set goals to address these direct, operational emissions, also called Scope 1 emissions, often through methane management and increasing efficiency. However, Scope 1 emissions are a small part of the problem. Indirect emissions, ranging from embedded emissions in the supply chain to the use and end-of-life processing of sold products, also called Scope 3 emissions, make up a much greater portion of emissions. Scope 2 emissions, which are emissions from imported heat and electricity, are negligible in the industry compared to Scope 1 and 3 emissions.
The distribution of Scope 1, 2, and 3 emissions is not dramatically different between oil and gas and other industries. According to the World Resources Institute, Scope 3 emissions constitute more than 70 percent of many businesses’ GHG emissions.25 Take the pharmaceutical and tech industries, for example. As shown in Figure 8, Eni’s Scope 3 emissions are about 85 percent of the company’s total—representative of the average breakdown in the industry.26 Italian pharmaceutical company Sanofi’s Scope 3 emissions are quite similar, at about 91 percent,27 and tech giant Apple reports that Scope 3 emissions make up more than 99 percent of its emissions.28
23. BP, BP Statistical Review of World Energy 2018 (London: BP, June 2018), https://www.bp.com/content/dam/bp/business-sites/en/global/corporate/pdfs/energy-economics/statistical-review/bp-stats-review-2018-full-report.pdf.24. International Energy Agency, World Energy Outlook 2018.25. Christian Aldridge, “You, Too, Can Master Value Chain Emissions,” Greenhouse Gas Protocol, April 4, 2016, https://ghgprotocol.org/blog/you-too-can-master-value-chain-emissions.26. Eni, “Eni SpA - Climate Change 2017,” CDP, 2018.27. Sanofi, “SANOFI - Climate Change 2017,” CDP, 2018.28. Apple Inc., “Apple Inc. - Climate Change 2017,” CDP, 2018.

Stephen Naimoli & Sarah Ladislaw | 15
Figure 8: GHG Emissions by Company, 2016
Source: Eni, “Eni SpA - Climate Change 2017”; Sanofi, “SANOFI - Climate Change 2017”; Apple Inc., “Apple Inc. - Climate Change 2017.”
However, not all Scope 3 emissions are created equal. The sources of these Scope 3 emissions pose a unique problem for the oil and gas industry. As shown in Figure 9, about 92 percent of Eni’s Scope 3 emissions come from the “use of sold products” category.29 Less than 1 percent of the company’s Scope 3 emissions come from the “purchase of goods and services” category, which measures the emissions that come from the manufacturing of the inputs to their products. By contrast, the Scope 3 emissions of Sanofi look quite different. About 10 percent of Sanofi’s Scope 3 emissions come from the “use of sold products,” while 54 percent come from the “purchase of goods and services.”30 Apple shows a fairly similar profile to Sanofi—17 percent come from the “use of sold products” and 77 percent come from the “purchase of goods and services.”31
29. Eni, “Eni SpA - Climate Change 2017.”30. Sanofi, “SANOFI - Climate Change 2017.”31. Apple Inc., “Apple Inc. - Climate Change 2017.”
Scope 1: 14.37%Scope 1: 4.43% Scope 1: 0.12%
Scope 2: 0.25% Scope 2: 4.92%
Scope 2: 0.14%
Scope 3: 85.39% Scope 3: 90.66% Scope 3: 99.74%
0%
10%
20%
30%
40%
50%
60%
70%
80%
90%
100%
Eni Sanofi Apple
% o
f Com
pany
's G
HG E
mis
sion
s
GHG Emissions by Company, 2016

Oil and Gas Industry Engagement on Climate Change: Drivers, Actions, and Path Forward | 16
Figure 9: Scope 3 Emissions by Category, 2016
Source: Eni, “Eni SpA - Climate Change 2017”; Sanofi, “SANOFI - Climate Change 2017”; Apple Inc., “Apple Inc. - Climate Change 2017.”
What this distinction means is that although most of these companies’ emissions are indirect emissions from somewhere in their value chain, the strategies to address them differ. In pharmaceuticals or technology, reducing Scope 3 emissions from the purchase of goods and services requires companies to convince their suppliers to reduce their emissions or change their suppliers. In the oil and gas industry, reducing Scope 3 emissions from the use of sold products requires the companies themselves to reduce the carbon intensity of the products they sell or convince their customers to use less of their product. There are a number of different ways oil and gas companies can address this problem, but one that many have identified as part of a climate strategy is investing in renewable or lower-emission energy resources to sell to customers. Another example is to invest money from surcharges on consumers of gasoline and diesel in nature-based carbon sinks like reforestation projects or mangrove ecosystems to offset the emissions impact of driving. Reduction of Scope 3 emissions is the most important in terms of overall emissions impact and the most difficult area to address for the oil and gas industry.
Purchaseof goods
and services:54%
Purchaseof goods
and services:77%
0%
10%
20%
30%
40%
50%
60%
70%
80%
90%
100%
Eni Sanofi Apple
Use ofsold products:
92%
Other: 8%
Other: 46%
Other: 23%

Stephen Naimoli & Sarah Ladislaw | 17
Perspectives on Company Action
There are many ways to contextualize and interpret the different ways in which oil and gas companies are looking for value in new business areas and branching out into clean energy. We explore a few ways to consider oil and gas company climate activities before carrying out an analysis of our own.
Equity Investor PerspectiveFirst, the equity investment community by and large evaluates the climate strategies of different companies in the context of their overall competitiveness. For example, JPMorgan’s equity research team used three metrics relevant to the investor community to evaluate European oil and gas companies.32 The first category weighs each company’s carbon footprint against its non-oil net asset value exposure. The second category evaluates each company’s upstream flaring intensity. The third category estimates each company’s portfolio change to 2025 in terms of its anticipated oil/gas split and non-oil and gas spending. Equinor performs well across all categories, earning the top spot in their aggregate ranking, and Repsol and Shell receive high marks as well.
Goldman Sachs conducted a similar analysis, which not only evaluated oil and gas company strategies but also suggested types of actions that companies can take to address scope 1, 2, and 3 emissions. This analysis also suggested that a “successful” climate strategy for a company, and for the sector, means reducing emissions at a rate that is on track with 2-degree target modeling estimates. The report also suggests that the largest oil and gas companies can expect greater returns from their traditional business segments as consolidation occurs, offsetting lower returns from renewable energy investments. These analyses are useful beyond the market observations they provide because they offer insight into how the financial community is starting to consider these factors alongside more conventional performance metrics.
Many investor analyses focus on the shifting role of natural gas in oil and gas company portfolios both as a normal part of their evaluation but also as part of companies’ climate strategies. Indeed, natural gas plays an important role in the transition strategies of many companies for many reasons. First, in the near- to medium-term, the relatively lower carbon intensity of natural gas consumption compared to oil is a way to reduce
32. JPMorgan Europe Equity Research, Global Energy Analyzer - Big Oil Trilemma (JPMorgan Chase & Co, 2018).
Oil and Gas Industry Engagement on Climate Change: Drivers, Actions, and Path Forward | 18
their overall emissions profiles. Second, natural gas used for power generation serves as a concrete link between the company and the electric power sector, similar to how gas is used in the petrochemical sector. Third, to the extent that natural gas can displace coal use in the power sector, help balance renewables on the grid, or serve as a source of hydrogen, it can play a role in a low-carbon transition strategy. To the extent that companies view natural gas as a part of a long-term transition strategy in a world of deep decarbonization, methane emissions management strategies and CCUS become increasingly important.
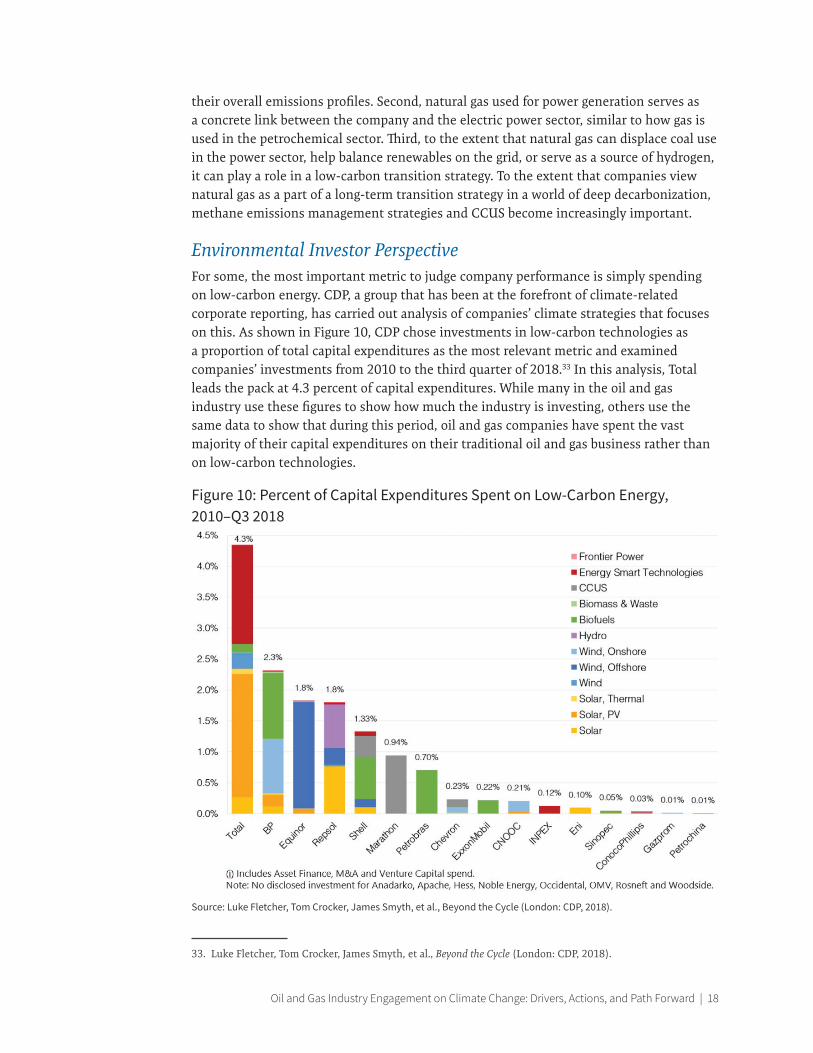
Environmental Investor PerspectiveFor some, the most important metric to judge company performance is simply spending on low-carbon energy. CDP, a group that has been at the forefront of climate-related corporate reporting, has carried out analysis of companies’ climate strategies that focuses on this. As shown in Figure 10, CDP chose investments in low-carbon technologies as a proportion of total capital expenditures as the most relevant metric and examined companies’ investments from 2010 to the third quarter of 2018.33 In this analysis, Total leads the pack at 4.3 percent of capital expenditures. While many in the oil and gas industry use these figures to show how much the industry is investing, others use the same data to show that during this period, oil and gas companies have spent the vast majority of their capital expenditures on their traditional oil and gas business rather than on low-carbon technologies.
Figure 10: Percent of Capital Expenditures Spent on Low-Carbon Energy, 2010–Q3 2018
Source: Luke Fletcher, Tom Crocker, James Smyth, et al., Beyond the Cycle (London: CDP, 2018).
33. Luke Fletcher, Tom Crocker, James Smyth, et al., Beyond the Cycle (London: CDP, 2018).

Stephen Naimoli & Sarah Ladislaw | 19
As noted in the analyses put forth by the equity investors, the carbon intensity of a company’s portfolio and investments also matters. Some environmental and mainstream investors have chosen to no longer invest in certain categories of fossil fuels—namely coal, oil sands, and tight oil. While the total number of investors taking this position is small and they usually do not have material positions in those industry segments to begin with, these types of activities are often considered alongside the low-carbon investments companies make.
Many companies suggest that capital allocation to low-carbon investments will grow as the returns on investments do. Companies and investors do not have the same views on the value proposition of these investments today or their prospective value going forward, which explains some of the difference in approach. For example, some view the returns on low-carbon energy projects as too low, while others see the risk-to-return ratio as carrying positive benefits for their portfolios. In addition, some companies see the returns on their low-carbon business as growing quite rapidly, which supplements the increased commercial opportunities a more distributed electric power system potentially affords to make low-carbon investment look more attractive. Other companies do not share these views and need to see more evidence that the business models and value propositions will evolve along these lines.

Oil and Gas Industry Engagement on Climate Change: Drivers, Actions, and Path Forward | 20
Evaluation of Trends and Categories
Both of these perspectives are useful but fail to illuminate, in our view, the most important questions about oil and gas company engagement on climate change. If the purpose of taking action on climate change is to reduce emissions, one very key part of how oil and gas companies are spending money is whether or not those expenditures contribute in material ways to other climate solutions (in addition to achieving their own emissions reductions). Our approach to this question involved first seeking patterns in the major oil and gas company climate-related investments.
Table 1: Existing & Proposed Assets, 2018 (excluding R&D)BP Chevron Eni Equinor ExxonMobil Shell Total
ManufacturingSolar
Energy storage
Deployment
Wind
Solar
Other (Biomass, Geothermal, Hydropower, Hydrogen)
CCS
Grid-connected storage
Electricity Retail
Electricity sales (renewables)
On-site generation
Other services (e.g., demand response)
Transportation
Public EV charging
Private EV charging
Alternative fuels
Source: CSIS research from company reports, websites, press releases, and news articles.
Table 1 shows the companies’ existing and proposed asset expenditures across various sectors and technologies. In this case, spending includes venture capital investments but excludes research and development (which is not publicly reported). This does not represent the size or monetary value of investments, which is not always publicly disclosed—particularly in the venture capital category—but it does show the areas in which companies have existing or planned future projects. There are some clear linkages between these investment categories and core competencies of oil and gas companies.

Stephen Naimoli & Sarah Ladislaw | 21
CCUS, a technology with a clear benefit to the oil and gas industry, is a popular destination for funds. Public charging infrastructure for electric vehicles (EV) is also prevalent, given that it is a part of the value chain in which companies have expertise and, in some cases, can be integrated into existing fueling stations. Most of the companies have invested in some kind of clean energy generation but investing in manufacturing and electricity retail have not emerged as larger industry trends. All of the companies are engaged in at least two places in this chart, but BP, Equinor, Shell, and Total have spread investments across a majority of categories, while Chevron, Eni, and ExxonMobil have so far chosen to focus their investments in a narrower range of technologies. In addition, one category not included in this analysis in which oil and gas companies have invested in recent months is direct air capture (DAC). Chevron announced an investment in DAC company Carbon Engineering in January 2019.34
Also of interest is the geographic distribution of investments, as investments in high-income countries are much more common than those in low-income countries. As shown in Figure 11, the IOCs are developing clean energy projects across six continents. So far, they have generally been concentrated in the United States and Europe, but development is spreading to Africa, East Asia, and South America. North America, specifically the United States, is a popular destination for onshore wind projects, where IOCs own 18 projects. Europe has traditionally been the destination for offshore wind farms, with 11 operational or in development, but the United States has begun offshore wind leasing off its northeastern coast, and Equinor and Shell have moved in to propose projects. IOCs have generally been less eager to build solar projects but have begun to build in sunny regions such as northern and southern Africa, Brazil, and the UAE. Most biofuels and biopower development from IOCs has been in Brazil, making use of their sugarcane resources, but Eni has begun converting some of its refineries in Italy to create biofuels. There are three major operational CCUS projects supported by IOCs (one in Canada and two in Europe) with at least two more full-scale projects in development in Europe and one in Australia.
34. Geoffrey Morgan, “Chevron, Occidental Buy Stake in Carbon Capturing Firm Backed by Bill Gates and Murray Edwards,” Financial Post, January 9, 2019, https://business.financialpost.com/commodities/energy/chevron-occi-dental-buy-stake-in-carbon-capturing-firm-backed-by-bill-gates-and-murray-edwards.

Oil and Gas Industry Engagement on Climate Change: Drivers, Actions, and Path Forward | 22
Figure 11: Geographic Distribution of Directly-Owned Projects, 1H 2019
Source: CSIS research from company reports, websites, press releases, and news articles.
One of the ways in which oil and gas company strategies differ is in how they choose to spend their money—not just on what technologies, but on what kinds of assets. There are many different ways to invest. From publicly disclosed data as of May 2019, the seven IOCs we studied owned at least a partial interest in 40 operational projects and 23 companies (see Table 2 below). This definition of projects includes large-scale projects the IOCs own directly (rather than utilities or developers they have acquired). Companies are those that have been acquired or started as joint ventures. Projects include solar arrays, wind farms, biofuel refineries, and CCUS projects. BP has developed the most projects, a majority of which are onshore wind farms in the United States. Companies include project developers, alternative vehicle fueling or charging networks, energy technology manufacturers, and biofuel companies. Most of the IOCs choose to own more projects than companies, but Total’s acquisition strategy has given them more companies than directly-owned projects for now, including solar manufacturing, utility, and clean energy project development companies. We recognize that this information may not be entirely complete or conclusive but believe it usefully illustrates the different ways in which oil and gas companies invest in clean energy or climate-related investments. It is important to note that this analysis does not account for the size of projects. Some companies may build numerous small projects or take small shares in projects while others may build a few large projects.
Table 2: Projects & Companies, 1H 2019BP Chevron Eni Equinor Exxon Shell Total
Projects 14 8 2 5 2 9 6
Companies 4 0 0 1 0 6 8
Source: CSIS research from company reports, websites, press releases, and news articles.
Wind
Bio
Solar
CCS
Powered by Bing© GeoNames, HERE, MSFT, Microso�, Navinfo, Thinkware Extract, Wikipedia
Country Project
Algeria
Australia
Brazil
Canada
Chile
Germany
Ghana
Italy
Japan
The Netherlands
Norway
Poland
South Africa
U.A.E.
U.K.
U.S.
1 solar
1 CCS
3 bio, 2 solar
1 CCS
1 solar
1 wind
1 solar
1 solar, 2 bio
1 solar
3 wind
3 CCS, 1 wind
3 wind
1 solar
1 solar
4 wind
20 wind, 5 solar

Stephen Naimoli & Sarah Ladislaw | 23
Another useful way to look at this data is to review how it has evolved over time, since it reveals investment trends within individual companies as well as across the industry. A timeline of oil and gas company involvement in clean energy can be seen in Figure 12 below.
Many oil and gas companies choose to develop, own, and operate a portfolio of clean energy projects. Oil and gas companies began developing clean energy projects in the early 1990s, but development picked up in the early to mid-2000s. Among the IOCs, Chevron was an early actor in buying clean energy projects. The company began operating geothermal fields in Indonesia in the mid-1980s and built or acquired geothermal power plants there in the mid-1990s.35 The company ultimately sold its geothermal assets in 2016 and, although it has built a 16.5 megawatt (MW) wind farm and some kW-scale solar farms in the United States, it has been less eager than most of its peers to build projects since the 1990s.36 BP, on the other hand, stands out for its flurry of U.S. onshore wind projects that came online in the late 2000s.
Figure 12: Oil and Gas-Owned Clean Energy Projects and Companies, 1994-1H 2019
* Does not include Chevron’s five currently owned joint venture solar projects due to a lack of public data on individual projects.
Source: CSIS research from company reports, websites, press releases, and news articles.
35. Hillary Brenhouse, “Indonesia Seeks to Tap Its Huge Geothermal Reserves,” New York Times, July 26, 2010, https://www.nytimes.com/2010/07/27/business/global/27iht-renindo.html; “Chevron Expands Geothermal Operations in Indonesia,” Chevron, August 13, 2007, https://www.chevron.com/stories/chevron-expands-geo-thermal-operations-in-indonesia.36. “Chevron Announces Sale of Geothermal Operations,” Chevron, December 23, 2016, https://www.chevron.com/stories/chevron-announces-sale-of-geothermal-operations.
02468
1012141618
1994
1995
1996
1997
1998
1999
2000
2001
2002
2003
2004
2005
2006
2007
2008
2009
2010
2011
2012
2013
2014
2015
2016
2017
2018
1H 2
019
O&G Clean Energy Projects, 1994-1H 2019
BP Chevron Eni Equinor ExxonMobil Shell Total
# of
pro
ject
s
0123456789
10
1994
1995
1996
1997
1998
1999
2000
2001
2002
2003
2004
2005
2006
2007
2008
2009
2010
2011
2012
2013
2014
2015
2016
2017
2018
1H 2
019
O&G Clean Energy Company M&A, 1994-1H 2019
BP Chevron Eni Equinor ExxonMobil Shell Total
# of
com
pani
es
Oil and Gas Industry Engagement on Climate Change: Drivers, Actions, and Path Forward | 24
While project development is more common than company acquisition, certain IOCs have shown a clear interest in purchasing companies, typically outside their core competencies, most notably in the electric power sector. BP entered the solar manufacturing space in the early 1980s, but the trend of acquiring clean energy companies has mostly been a recent one, with some action in the late 2000s and a significant uptick beginning in 2015. BP started the recent trend in 2009 by forming a joint venture with DuPont to create biofuels developer Butamax. Total began a streak of acquisitions in 2010 with biofuels developer Amyris, followed by solar panel manufacturer SunPower in 2011, and has acquired six companies since then, ranging from battery manufacturer Saft to utility Direct Energie and alternative vehicle fueling company PitPoint. Shell also began an aggressive acquisition strategy in 2017 by acquiring EV charging company NewMotion and utility MP2 Energy and has followed up with seven more since, including three companies just in the first half of 2019.
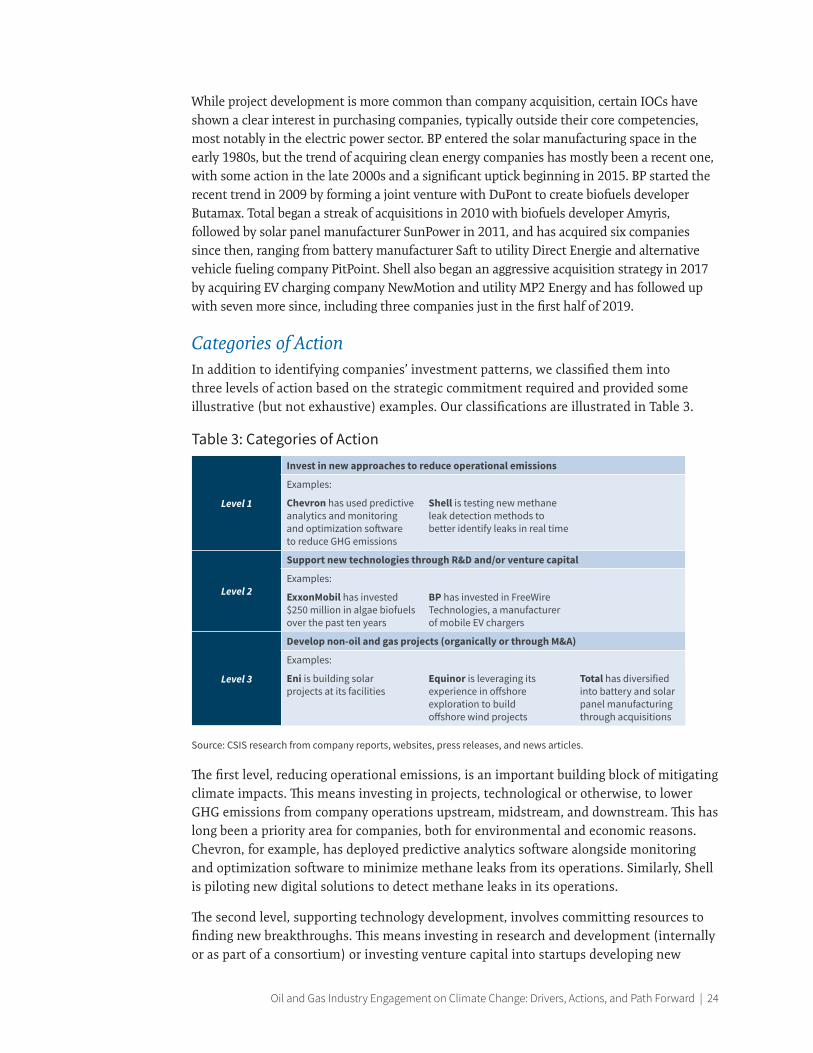
Categories of ActionIn addition to identifying companies’ investment patterns, we classified them into three levels of action based on the strategic commitment required and provided some illustrative (but not exhaustive) examples. Our classifications are illustrated in Table 3.
Table 3: Categories of Action
Level 1
Invest in new approaches to reduce operational emissions
Examples:
Chevron has used predictive analytics and monitoring and optimization software to reduce GHG emissions
Shell is testing new methane leak detection methods to better identify leaks in real time
Level 2
Support new technologies through R&D and/or venture capital
Examples:
ExxonMobil has invested $250 million in algae biofuels over the past ten years
BP has invested in FreeWire Technologies, a manufacturer of mobile EV chargers
Level 3
Develop non-oil and gas projects (organically or through M&A)
Examples:
Eni is building solar projects at its facilities
Equinor is leveraging its experience in offshore exploration to build offshore wind projects
Total has diversified into battery and solar panel manufacturing through acquisitions
Source: CSIS research from company reports, websites, press releases, and news articles.
The first level, reducing operational emissions, is an important building block of mitigating climate impacts. This means investing in projects, technological or otherwise, to lower GHG emissions from company operations upstream, midstream, and downstream. This has long been a priority area for companies, both for environmental and economic reasons. Chevron, for example, has deployed predictive analytics software alongside monitoring and optimization software to minimize methane leaks from its operations. Similarly, Shell is piloting new digital solutions to detect methane leaks in its operations.
The second level, supporting technology development, involves committing resources to finding new breakthroughs. This means investing in research and development (internally or as part of a consortium) or investing venture capital into startups developing new

Stephen Naimoli & Sarah Ladislaw | 25
technologies that lower emissions (either from oil and gas operations or by developing new clean energy technologies). Many companies invest in in-house research and development while also partnering with academic and private sector entities to carry out joint research. For example, ExxonMobil has long supported the development of biofuels from algae-based feedstocks, spending $250 million in just the last decade both on in-house research and in partnership with Synthetic Genomics, the Colorado School of Mines, and Michigan State University.37 BP, through its venture arm, has invested in mobile EV charger company FreeWire Technologies to support the development of innovative new products.
The third and most ambitious level is expanding beyond core oil and gas operations. This means adding new business areas—often, this involves building solar or wind projects, but it may also mean involvement in manufacturing non-oil and gas energy technologies. This represents the most ambitious level of commitment in our estimation because it seeks to actively engage in a business venture outside the core business model of the oil and gas industry and is therefore furthest along on the path to developing an “energy company” platform if it is successful. Companies can choose to develop and own assets or acquire companies that have already established themselves in their technology areas. Equinor has translated its experience in offshore exploration to building offshore wind power—both anchored and, notably, floating wind turbines. Total has aggressively taken the acquisition route, expanding into areas like solar with its purchase of manufacturer SunPower in 2011 and of battery manufacturer Saft in 2016.
It is important to note that these categories are not mutually exclusive, but rather build on each other in different ways. For example, Eni has begun a project to build 250 MW of solar projects at many of its facilities. This involves investing in areas outside of the company’s core business by building solar power, but because the projects will power operations at some of Eni’s oil and gas production facilities, it will also serve to lower the company’s operational emissions.
Contributions to the Energy Transition ChallengeAnother important way to look at this activity is to ask what role companies play in the larger challenge of achieving a low-carbon energy transition. Examining their investments individually is intellectually interesting but situating them in the context of the larger goal to decarbonize the energy system helps illuminate their strategic importance. The IEA runs an initiative called Tracking Clean Energy Progress (TCEP) that evaluates 39 technologies or sectors against targets they need to achieve to meet the 2-degree target. Categories relevant to the oil and gas industry’s investments include wind power, solar PV, transport biofuels, CCUS, and battery energy storage. The IOCs have been investing in a variety of these 39 technologies and sectors, in particular in several areas the IEA has identified as needing more progress.
One of the most popular low-carbon technologies for the IOCs is wind power. Most of the seven IOCs own equity stakes in onshore and/or offshore wind power projects. Equinor,
37. “Advanced Biofuels and Algae Research: Targeting the Technical Capability to Produce 10,000 Barrels per Day by 2025,” ExxonMobil, September 17, 2018, https://corporate.exxonmobil.com/en/Research-and-innovation/Ad-vanced-biofuels/Advanced-biofuels-and-algae-research.
Oil and Gas Industry Engagement on Climate Change: Drivers, Actions, and Path Forward | 26
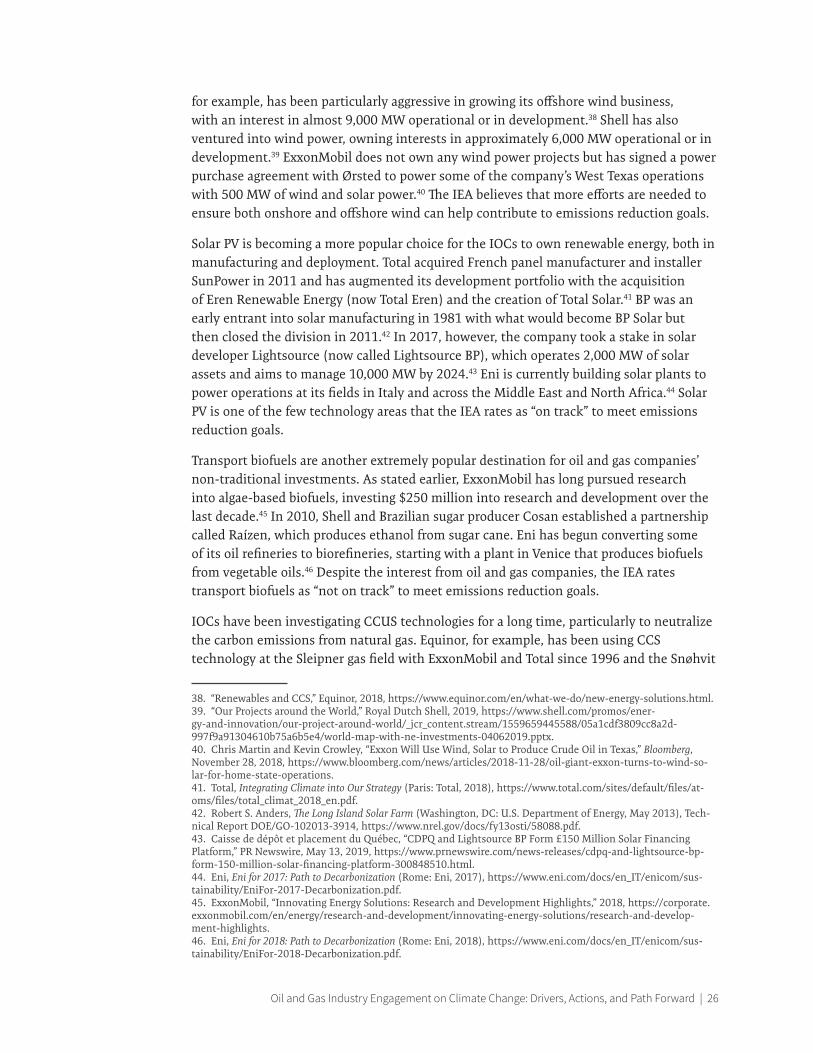
for example, has been particularly aggressive in growing its offshore wind business, with an interest in almost 9,000 MW operational or in development.38 Shell has also ventured into wind power, owning interests in approximately 6,000 MW operational or in development.39 ExxonMobil does not own any wind power projects but has signed a power purchase agreement with Ørsted to power some of the company’s West Texas operations with 500 MW of wind and solar power.40 The IEA believes that more efforts are needed to ensure both onshore and offshore wind can help contribute to emissions reduction goals.
Solar PV is becoming a more popular choice for the IOCs to own renewable energy, both in manufacturing and deployment. Total acquired French panel manufacturer and installer SunPower in 2011 and has augmented its development portfolio with the acquisition of Eren Renewable Energy (now Total Eren) and the creation of Total Solar.41 BP was an early entrant into solar manufacturing in 1981 with what would become BP Solar but then closed the division in 2011.42 In 2017, however, the company took a stake in solar developer Lightsource (now called Lightsource BP), which operates 2,000 MW of solar assets and aims to manage 10,000 MW by 2024.43 Eni is currently building solar plants to power operations at its fields in Italy and across the Middle East and North Africa.44 Solar PV is one of the few technology areas that the IEA rates as “on track” to meet emissions reduction goals.
Transport biofuels are another extremely popular destination for oil and gas companies’ non-traditional investments. As stated earlier, ExxonMobil has long pursued research into algae-based biofuels, investing $250 million into research and development over the last decade.45 In 2010, Shell and Brazilian sugar producer Cosan established a partnership called Raízen, which produces ethanol from sugar cane. Eni has begun converting some of its oil refineries to biorefineries, starting with a plant in Venice that produces biofuels from vegetable oils.46 Despite the interest from oil and gas companies, the IEA rates transport biofuels as “not on track” to meet emissions reduction goals.
IOCs have been investigating CCUS technologies for a long time, particularly to neutralize the carbon emissions from natural gas. Equinor, for example, has been using CCS technology at the Sleipner gas field with ExxonMobil and Total since 1996 and the Snøhvit
38. “Renewables and CCS,” Equinor, 2018, https://www.equinor.com/en/what-we-do/new-energy-solutions.html.39. “Our Projects around the World,” Royal Dutch Shell, 2019, https://www.shell.com/promos/ener-gy-and-innovation/our-project-around-world/_jcr_content.stream/1559659445588/05a1cdf3809cc8a2d-997f9a91304610b75a6b5e4/world-map-with-ne-investments-04062019.pptx.40. Chris Martin and Kevin Crowley, “Exxon Will Use Wind, Solar to Produce Crude Oil in Texas,” Bloomberg, November 28, 2018, https://www.bloomberg.com/news/articles/2018-11-28/oil-giant-exxon-turns-to-wind-so-lar-for-home-state-operations.41. Total, Integrating Climate into Our Strategy (Paris: Total, 2018), https://www.total.com/sites/default/files/at-oms/files/total_climat_2018_en.pdf.42. Robert S. Anders, The Long Island Solar Farm (Washington, DC: U.S. Department of Energy, May 2013), Tech-nical Report DOE/GO-102013-3914, https://www.nrel.gov/docs/fy13osti/58088.pdf.43. Caisse de dépôt et placement du Québec, “CDPQ and Lightsource BP Form £150 Million Solar Financing Platform,” PR Newswire, May 13, 2019, https://www.prnewswire.com/news-releases/cdpq-and-lightsource-bp-form-150-million-solar-financing-platform-300848510.html.44. Eni, Eni for 2017: Path to Decarbonization (Rome: Eni, 2017), https://www.eni.com/docs/en_IT/enicom/sus-tainability/EniFor-2017-Decarbonization.pdf.45. ExxonMobil, “Innovating Energy Solutions: Research and Development Highlights,” 2018, https://corporate.exxonmobil.com/en/energy/research-and-development/innovating-energy-solutions/research-and-develop-ment-highlights.46. Eni, Eni for 2018: Path to Decarbonization (Rome: Eni, 2018), https://www.eni.com/docs/en_IT/enicom/sus-tainability/EniFor-2018-Decarbonization.pdf.
Stephen Naimoli & Sarah Ladislaw | 27
gas field with Total since 2008.47 Shell runs the Quest CCS project at an upgrader in Alberta, where Chevron is also a partner.48 BP has invested venture funding in C-Capture, a company that develops chemicals for CCS technology.49 More investment in this technology is needed, though—the IEA rates CCS as “not on track” to meet emissions reduction goals.
Battery energy storage is a relatively new area for IOCs because it applies to a sector in which they have not traditionally participated: the electricity sector. As they attempt to shift from oil and gas companies to energy companies, they are seeing an opportunity in battery storage. Total acquired battery manufacturer Saft in 2016 and has also invested venture capital in Ionic Materials, which is developing a polymer to improve batteries.50 Both BP and Equinor have begun pilot projects to install battery storage at wind farms to store excess electricity and balance the supply of power.51 The IEA also rates battery storage as “on track” to meet emissions goals—one of the few categories that has moved up from “more efforts needed” since the 2018 edition of the tracker.
While these comparisons are anecdotal, it is important to regard technology investment from the oil and gas industry as part of a larger challenge to transform the global energy system to one that is compatible with a 2-degree or 1.5-degree future. As we will go on to explore, we think there is value in figuring out how to capitalize on oil and gas industry investments and interests to help advance key technology areas that are falling behind on the progress that needs to be made.
Perception of Oil and Gas Company InvestmentsAt our workshop, we also sought to understand how perceptions of the industry’s investments in reducing emissions compared with how companies reported their actions. In advance of the workshop, we surveyed participants on the IEA TCEP investment areas. We asked oil and gas companies to indicate whether they had invested in each area, which areas received the most money, and which areas were considered strategic priorities. We also asked non-industry participants (academics, environmental NGOs, and investors) to indicate their perceptions of the industry in each of those categories and compared their answers.
Industry and non-industry participants agreed on most categories. For example, industry and non-industry participants agreed that the industry had not invested in improving
47. Equinor, Sustainability Report (Oslo: Equinor, 2017), https://www.equinor.com/content/dam/statoil/docu-ments/sustainability-reports/statoil-sustainability-report-2017.pdf; MIT Carbon Capture and Sequestration Tech-nologies, “Sleipner Fact Sheet: Carbon Dioxide Capture and Storage Project,” 2016, https://sequestration.mit.edu/tools/projects/sleipner.html; MIT Carbon Capture and Sequestration Technologies, “Snohvit Fact Sheet: Carbon Dioxide Capture and Storage Project,” 2016, https://sequestration.mit.edu/tools/projects/snohvit.html.48. Royal Dutch Shell, Sustainability Report 2018 (The Hague: Royal Dutch Shell, 2019), https://reports.shell.com/sustainability-report/2018/.49. Michael Holder, “C-Capture Secures £3.5m Backing from BP, Drax and IP Group,” BusinessGreen, February 4, 2019, https://www.businessgreen.com/bg/news/3070385/c-capture-secures-gbp35m-backing-from-bp-drax-and-ip-group.50. Total, Integrating Climate into Our Strategy; Bate Felix, “Total Buys Stake in U.S. Battery Developer Ionic Ma-terials,” Reuters, April 18, 2018, https://www.reuters.com/article/us-total-batteries/total-buys-stake-in-u-s-bat-tery-developer-ionic-materials-idUSKBN1HP2B4.51. BP, “BP Launches Its First Battery Storage Project at U.S. Wind Farm,” April 10, 2018, https://www.bp.com/en_us/united-states/home/news/press-releases/bp-launches-its-first-battery-storage-project-at-us-wind-farm.html; Equinor, “Equinor Has Installed Batwind - the World’s First Battery for Offshore Wind,” June 27, 2018, https://www.equinor.com/en/news/26june2018-equinor-has-installed-batwind.html.

Oil and Gas Industry Engagement on Climate Change: Drivers, Actions, and Path Forward | 28
building envelopes or reducing emissions from iron and steel production and agreed that the industry had invested in solar PV and reducing emissions from chemical production. There were only two categories in which more than half of industry respondents said they had invested but less than half of non-industry respondents believed they had: improving the fuel economy of cars and vans and improving the fuel economy of trucks and buses.
Interestingly, there were several areas in which more than half of non-industry respondents believed companies had invested but less than half of industry respondents said they had. These included geothermal power, smart grids, reducing emissions from aviation and shipping, and renewable heat. This may mean that non-industry respondents were incorrect in believing that the industry had invested in these areas or it may simply mean that they were aware of companies that had invested but did not respond to our survey.
It is important to note that this evidence is not generalizable to a larger population; our sample size was too small and was not randomly selected. However, we still believe there is value in understanding the perceptions of highly-engaged observers and how they align with the reality of company investments.

Stephen Naimoli & Sarah Ladislaw | 29
Opportunities for Further Action
Our analysis shows that at least some parts of the oil and gas industry have a compelling set of reasons to develop climate change strategies and make investments in lower-carbon technologies and new energy business models. While there are many ways to analyze the investments these companies are making, we have chosen to highlight several areas where the activities of the oil and gas industry could bear fruit and where opportunities for further action exist. Before turning to each of the areas we explored in turn, it should be noted that each of these categories, along with the broader challenge of reducing emissions, requires the involvement of public policymakers. Several times during the course of this workshop, participants noted the need for greater policy action and clarity to bring about a transition to a lower-carbon energy system. We did not endeavor to address all of the climate- and clean energy-related policy issues that arose (including the need for things like carbon pricing or other environmental regulation), instead choosing to focus on several areas where public-private partnerships along with other investments could yield benefits. Below is a summary of each of these areas:
Electric Vehicle ChargingA recent forecast from BloombergNEF expects EVs will reach retail price parity with internal combustion engine vehicles by the mid-2020s, allowing EVs to make up 57 percent of passenger vehicle sales by 2040.52 Assuming this is accurate, EVs will soon become a significant business area for companies willing to enter the segment. Automakers are best equipped to build the vehicles themselves, but oil and gas companies can leverage their expertise in engineering, experience managing operational complexity, and significant capital to integrate EV charging into their portfolios. As mentioned already, many of the IOCs are already moving into this area by investing in EV charging networks and manufacturing, but at present the scale is relatively small. Industry participants argued that EVs still make up a very small part of sales today, and automakers are currently facing battery constraints that are driving up wait times. Still, they stated that EVs were the future and the industry should have a role in the segment.
52. BloombergNEF, Electric Vehicle Outlook 2019 (New York: BNEF, 2019), https://about.bnef.com/electric-vehi-cle-outlook/.

Oil and Gas Industry Engagement on Climate Change: Drivers, Actions, and Path Forward | 30
ElectrificationEliminating GHG emissions from the electricity sector will make a difference in combating climate change, but electricity is only part of the problem—in the United States, only 28 percent of emissions in 2017 came from the production of electricity.53 Electrifying other end uses like buildings, heating, or industrial processes, then, can provide an additional avenue to reduce GHGs. Stanford University undertook a project starting in 2015 that included electrifying its heating system, replacing on-site gas generation with grid power, and installing solar. This effort reduced the campus’s greenhouse gas emissions by 68 percent.54 One particularly attractive area for electrification is installing high-efficiency electric hot water heaters. The expected life of a water heater is 8 to 12 years55—a relatively short timeline compared to larger infrastructure—allowing for rapid replacement and decarbonization. For infrastructure with longer lifetimes, it is easier to build new electric infrastructure in developing economies than to retrofit or replace current infrastructure in OECD nations. Some industry participants were skeptical that there was a role for the oil and gas industry in electrification, but others felt that the industry was the only one that can achieve the scale necessary to help build out infrastructure at a global level. Others noted opportunities for electrification in the industry itself, such as converting diesel fracking equipment to field gas turbines, reducing emissions by 30 percent and saving money on fuel costs.
HydrogenHydrogen is frequently touted as a solution for electricity generation, heat, and long-term energy storage, and as an alternative to internal combustion engines, particularly for heavy-duty vehicles. Hydrogen is most often made through the reformation of methane but can also be produced by water electrolysis. Oil and gas companies are already making some investments in hydrogen, including an Equinor-Vattenfall-Gasunie partnership on hydrogen-powered electricity generation,56 a BP-Nouryon-Port of Rotterdam partnership on renewable hydrogen from water electrolysis,57 and a Shell-Toyota-Port of Los Angeles partnership on fuel cells for heavy-duty trucks.58 At present, hydrogen faces several problems: first, production from steam methane reforming still emits GHGs unless carbon capture technology is used, and adding it drives up the cost. Second, production from electrolysis is currently very expensive. Third, the round-trip efficiency of a fuel cell is currently only 35 percent, compared to 85 percent for a lithium-ion battery, so its attractiveness as a storage medium is low. Finally, electrolysis requires electricity, so producing zero-emission hydrogen would require even more electricity generation capacity. Industry participants indicated that hydrogen is more attractive as a late-century
53. U.S. Environmental Protection Agency, “Sources of Greenhouse Gas Emissions.”54. Vincent Xia, “Cities Can Follow Stanford’s Energy Makeover to Cut Emissions of Carbon Dioxide Affordably, New Study Finds,” Stanford, May 7, 2019, https://news.stanford.edu/2019/05/07/campus-energy-advanc-es-can-optimized-replicated/.55. Lowe’s, “When to Replace a Water Heater,” 2019, https://www.lowes.com/projects/repair-and-maintain/when-to-replace-a-water-heater/project.56. “Evaluating Conversion of Natural Gas to Hydrogen,” Equinor, July 7, 2017, https://www.equinor.com/en/news/evaluating-conversion-natural-gas-hydrogen.html.57. Jason Deign, “Oil Giant BP Joins Nouryon in Rotterdam Hydrogen Quest,” Greentech Media, April 15, 2019, https://www.greentechmedia.com/articles/read/oil-giant-bp-joins-nouryon-in-rotterdam-hydrogen-quest.58. Susan Carpenter, “Toyota, Kenworth and Shell Partner on Port of L.A. Fuel-Cell Project,” Trucks.com, Septem-ber 17, 2018, https://www.trucks.com/2018/09/17/toyota-kenworth-shell-partner-port-la-fuel-cell-project/.
Stephen Naimoli & Sarah Ladislaw | 31
solution rather than one for the 2019 to 2050 time frame. Several companies noted, however, that early stage demonstration projects are needed now to illustrate potential applications and work out the details of the proper regulatory, policy, and commercial environments to make some hydrogen applications succeed. As was also noted in a recent IEA report on hydrogen, these types of hydrogen systems demonstration projects will play an important role in advancing a viable future for low-carbon (so-called “green hydrogen”) hydrogen applications.59
Direct Air CaptureDirect air capture (DAC) has a clear utility to the oil and gas industry because it promises to remove GHGs from the atmosphere, including those that come from the industry’s operations and the use of their products. DAC technology is modular and scalable, and it does not need to be located on a power plant, so it can be built at storage sites and avoid transportation costs. DAC technology is in its infancy, but it has received some attention from the oil and gas industry. In 2019, for example, Chevron and Occidental Petroleum invested in the Canadian DAC company Carbon Engineering. DAC is another area where demonstration projects are needed now to deliver on the longer-term promise of the technology. Some participants suggested that this was another area where industry interest could help spawn greater support for those projects.
Carbon Capture, Use, and SequestrationIn addition to energy sources that do not emit carbon, mitigating climate change by or soon after mid-century requires large-scale carbon capture, use, and sequestration (CCUS). The IEA estimates that to meet climate goals, the world must sequester 2.3 gigatons of CO2 per year by 2040.60 Participants pointed out that the question of carbon capture is entirely separate from use and sequestration. Experts have argued that using captured CO2 for enhanced oil recovery (EOR)—currently the most economical use for captured CO2—can lead to fewer emissions compared to traditional exploration,61 but it is not primarily a sequestration strategy and there is not enough EOR opportunity to reduce emissions enough to meet climate targets. Participants also argued that effective monitoring techniques are required to verify that CO2 has been sequestered safely and remains sequestered over time. As mentioned previously in this report, the oil and gas industry is already testing CCUS technologies. In addition to individual company action, thirteen oil and gas companies—both IOCs and state-owned enterprises—participate in the Oil and Gas Climate Initiative (OGCI). OGCI is dedicated to pooling industry funds and knowledge to invest in, among others, CCUS technologies. As of July 2019, OGCI has invested in five CCUS companies.62 Ultimately, the field requires significantly more investment than current levels to reach the scale necessary to meet IEA goals for the technology to substantively contribute to keeping global warming below 1.5 to 2 degrees. In particular,
59. International Energy Agency, The Future of Hydrogen: Seizing Today’s Opportunities (Paris: IEA, 2019), https://webstore.iea.org/the-future-of-hydrogen.60. International Energy Agency, “What is CCUS?” https://www.iea.org/topics/carbon-capture-and-storage/.61. Deepika Nagabhushan and Kurt Waltzer, The Emission Reduction Benefits of Carbon Capture Utilization and Storage Using CO2 Enhanced Oil Recovery (Boston: Clean Air Task Force, 2018), http://www.catf.us/wp-content/uploads/2018/11/CATF_Factsheet_CO2_EOR_LifeCycleAnalysis.pdf.62. Oil and Gas Climate Initiative, “Our Portfolio,” 2018, https://oilandgasclimateinitiative.com/climate-invest-ments/#our-portfolio.

Oil and Gas Industry Engagement on Climate Change: Drivers, Actions, and Path Forward | 32
CCUS was viewed as an extremely important technology for any company that views natural gas as a long-term climate solution and therefore a critical area for further work.
Offshore WindOffshore wind poses an opportunity for oil and gas companies to leverage their expertise in offshore exploration. The quickly growing sector also poses a great opportunity to provide new electricity supply—BloombergNEF expects 115 GW of offshore wind by 2030.63 Offshore wind can perform at capacity factors close to baseload due to reliable wind resources offshore. As mentioned above, many oil and gas companies have already begun developing multi-GW pipelines of offshore wind projects. Most projects are supplying or will supply power to the grid onshore, but one notable idea is a floating wind project that Equinor is considering that would provide power directly to operations at two offshore oilfields.64 Currently, wind turbines cannot entirely replace gas at offshore oil and gas platforms because they cannot also generate heat, but they can cut GHG emissions from the power used at those platforms and reduce fuel costs. Offshore wind was one area where participants thought that the unique skill set of the industry was a potential competitive advantage.
63. BloombergNEF, “Global Offshore Wind Market Set to Grow Sixfold by 2030,” January 8, 2018, https://about.bnef.com/blog/global-offshore-wind-market-set-to-grow-sixfold-by-2030/.64. Nerijus Adomaitis, “Equinor Explores Floating Wind Turbines to Power North Sea Oilfields,” Reuters, August 28, 2018, https://www.reuters.com/article/us-equinor-windfarm/equinor-explores-floating-wind-turbines-to-power-north-sea-oilfields-idUSKCN1LD0HW.

Stephen Naimoli & Sarah Ladislaw | 33
Conclusions
There is increasing awareness of the need for all sectors to act on climate change—in the public sphere, among investors, and increasingly at oil and gas companies. Companies are working on how to advance technology solutions and new business areas to be part of the solution, but it remains to be seen how widespread these investments will be and how investors and the public will view them as climate change concerns continue to mount. There are many opportunities for a greater portion of the industry to advance climate change strategies and many reasons for greater portions of the industry to explore these options. There are also many opportunities to increase current investments and move into new areas to make substantive contributions to the development of technologies. To date, investment taken has been small relative to overall capital spending but has created a web of clean technology companies, universities, and businesses that rely on the oil and gas sector for important financial support. The main opportunities identified in this report are EV charging, electrification, hydrogen, DAC, CCUS, and offshore wind, but the IEA lists more than 30 other areas in which society needs to make more progress. The work being done in each of these areas can be expanded to have greater impact on the overall goal of deploying low-carbon emissions technology through additional spending, demonstration projects, and public-private partnerships or collaboration. Only through greater engagement and ongoing effort will these investments yield longer-term benefits. As stated in this analysis, there are a great many ways to view the drivers and outcomes of the evolving position of the oil and gas industry’s engagement on climate change. Given how behind the world is in addressing global climate change, it is worth considering how to take advantage of the new and emergent strategies of the oil and gas industry to consider how to help put their interest and efforts to good use in combating this challenge.

Oil and Gas Industry Engagement on Climate Change: Drivers, Actions, and Path Forward | 34
About the Authors
Stephen Naimoli is a research associate in the Energy and National Security Program at the Center for Strategic and International Studies (CSIS), focusing on the electricity sector and climate change. Prior to joining CSIS, he worked as a research and communications fellow at the International Council on Clean Transportation. He holds a B.A. from the University of Texas at Austin and an MPP from Oregon State University.
Sarah Ladislaw is the senior vice president and director of the Energy and National Security Program, where she leads CSIS’s work in energy policy, market, and technology analysis. Ladislaw is an expert in U.S. energy policy, global oil and natural gas markets, and climate change. She has authored numerous publications on the geopolitics of energy, energy security and climate change, low-carbon pathways, and a wide variety of issues on U.S. energy policy, regulation, and market dynamics. Her regional energy work includes publications on Chinese, European, African, and Western Hemisphere energy issues. She has spearheaded new work at CSIS on climate change, the electricity sector, and energy technology development.

COVER PHOTO DANIEL SANNUM LAUTEN/AFP/GETTY IMAGES
1616 Rhode Island Avenue NW Washington, DC 20036 202 887 0200 | www.csis.org