oil and gas division oil field cleanup … railroad commission of texas oil field cleanup program...
TRANSCRIPT
RAILROAD COMMISSION OF TEXAS
OIL AND GAS DIVISION
OIL FIELD CLEANUP PROGRAM ANNUAL REPORT - FISCAL YEAR 2008

-1-
RAILROAD COMMISSION OF TEXAS OIL FIELD CLEANUP PROGRAM
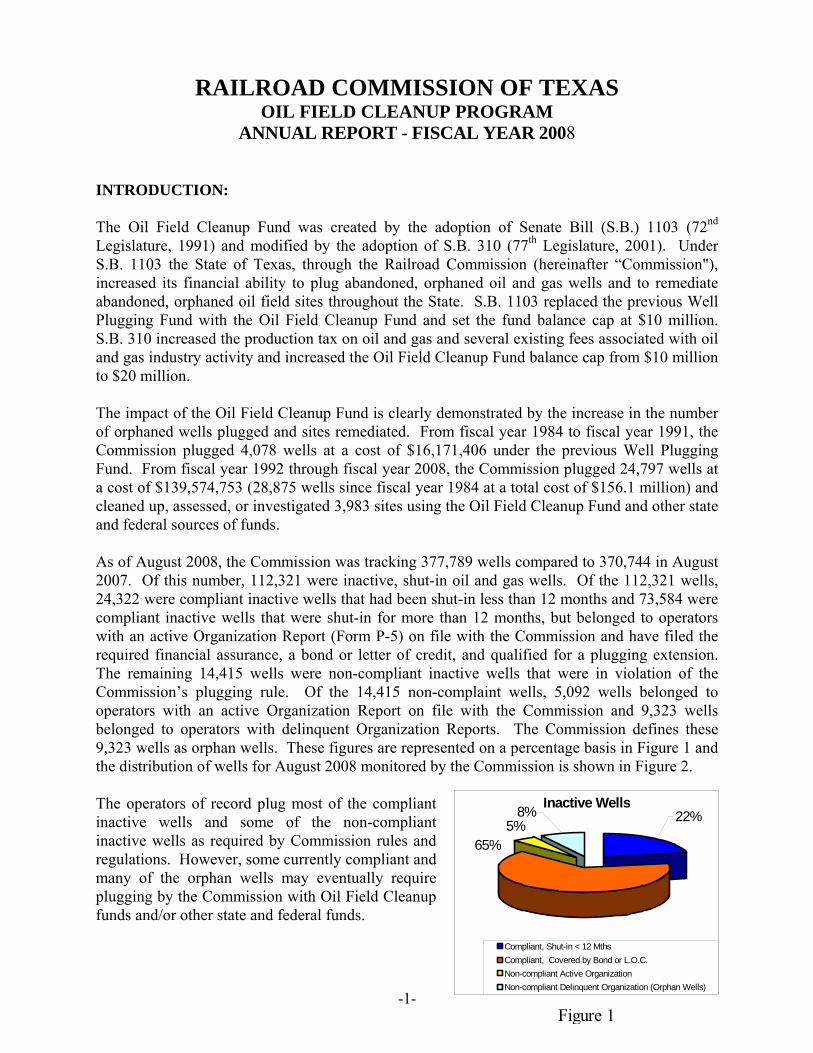
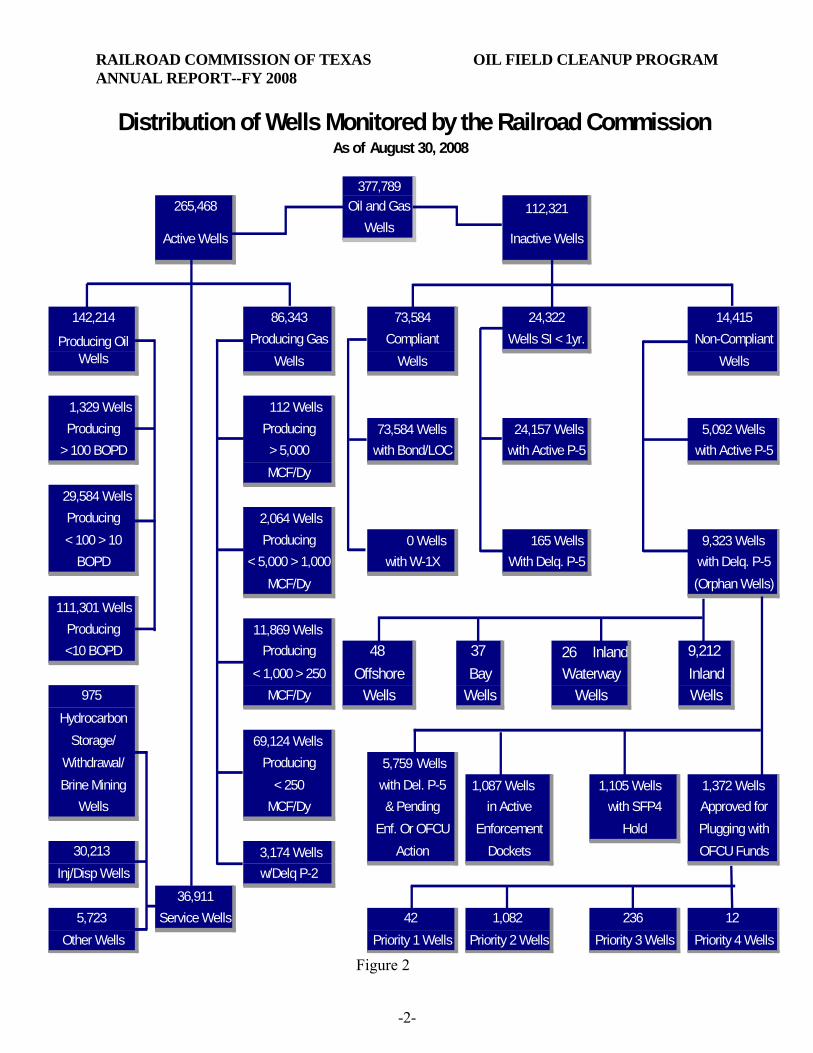
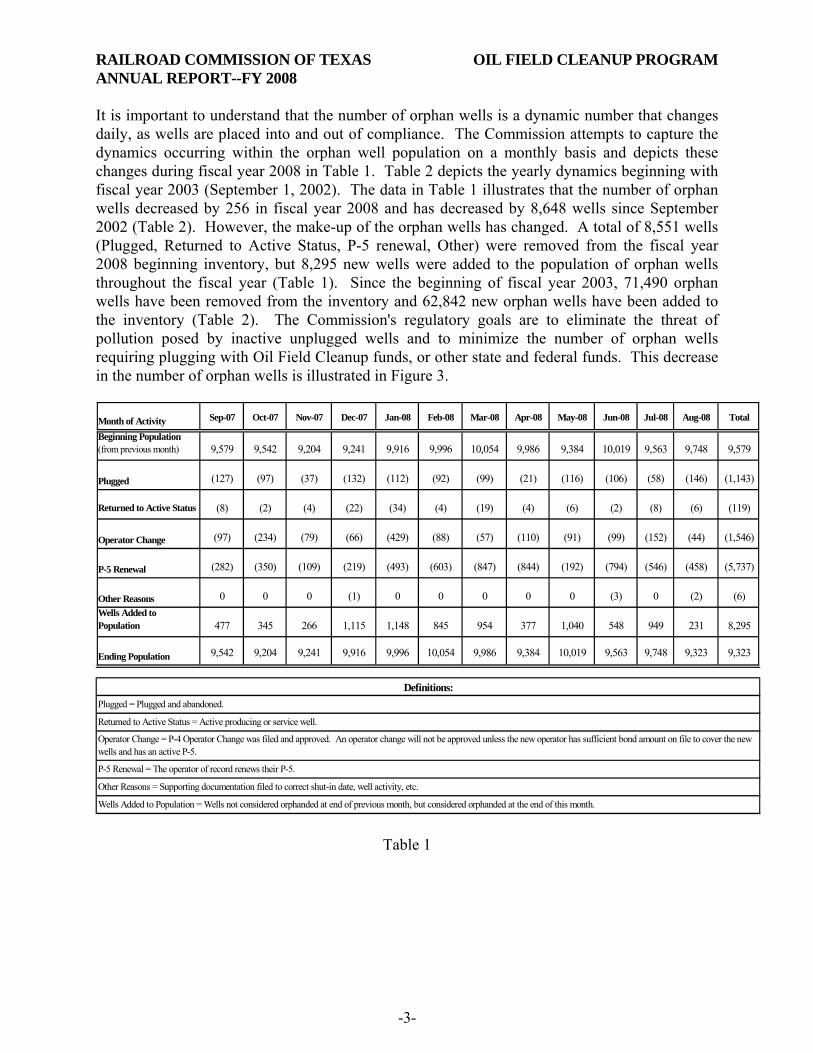
ANNUAL REPORT - FISCAL YEAR 2008 INTRODUCTION: The Oil Field Cleanup Fund was created by the adoption of Senate Bill (S.B.) 1103 (72nd Legislature, 1991) and modified by the adoption of S.B. 310 (77th Legislature, 2001). Under S.B. 1103 the State of Texas, through the Railroad Commission (hereinafter “Commission"), increased its financial ability to plug abandoned, orphaned oil and gas wells and to remediate abandoned, orphaned oil field sites throughout the State. S.B. 1103 replaced the previous Well Plugging Fund with the Oil Field Cleanup Fund and set the fund balance cap at $10 million. S.B. 310 increased the production tax on oil and gas and several existing fees associated with oil and gas industry activity and increased the Oil Field Cleanup Fund balance cap from $10 million to $20 million. The impact of the Oil Field Cleanup Fund is clearly demonstrated by the increase in the number of orphaned wells plugged and sites remediated. From fiscal year 1984 to fiscal year 1991, the Commission plugged 4,078 wells at a cost of $16,171,406 under the previous Well Plugging Fund. From fiscal year 1992 through fiscal year 2008, the Commission plugged 24,797 wells at a cost of $139,574,753 (28,875 wells since fiscal year 1984 at a total cost of $156.1 million) and cleaned up, assessed, or investigated 3,983 sites using the Oil Field Cleanup Fund and other state and federal sources of funds. As of August 2008, the Commission was tracking 377,789 wells compared to 370,744 in August 2007. Of this number, 112,321 were inactive, shut-in oil and gas wells. Of the 112,321 wells, 24,322 were compliant inactive wells that had been shut-in less than 12 months and 73,584 were compliant inactive wells that were shut-in for more than 12 months, but belonged to operators with an active Organization Report (Form P-5) on file with the Commission and have filed the required financial assurance, a bond or letter of credit, and qualified for a plugging extension. The remaining 14,415 wells were non-compliant inactive wells that were in violation of the Commission’s plugging rule. Of the 14,415 non-complaint wells, 5,092 wells belonged to operators with an active Organization Report on file with the Commission and 9,323 wells belonged to operators with delinquent Organization Reports. The Commission defines these 9,323 wells as orphan wells. These figures are represented on a percentage basis in Figure 1 and the distribution of wells for August 2008 monitored by the Commission is shown in Figure 2. The operators of record plug most of the compliant inactive wells and some of the non-compliant inactive wells as required by Commission rules and regulations. However, some currently compliant and many of the orphan wells may eventually require plugging by the Commission with Oil Field Cleanup funds and/or other state and federal funds.
Figure 1
Inactive Wells8% 22%5%
65%
Compliant, Shut-in < 12 MthsCompliant, Covered by Bond or L.O.C.Non-compliant Active OrganizationNon-compliant Delinquent Organization (Orphan Wells)
RAILROAD COMMISSION OF TEXAS OIL FIELD CLEANUP PROGRAM ANNUAL REPORT--FY 2008
-2-
As of
1,329 Wells 112 Wells73,584 Wells 24,157 Wells 5,092 Wells
29,584 Wells2,064 Wells
0 Wells 165 Wells 9,323 Wells
111,301 Wells11,869 Wells
26 Inland
69,124 Wells5,759 Wells
1,087 Wells 1,105 Wells 1,372 Wells
3,174 Wells
Active Wells
Distribution of Wells Monitored by the Railroad CommissionAugust 30, 2008
265,468377,789
112,321
86,343 73,584 24,322
Oil and Gas
Inactive WellsWells
14,415
Producing Oil Wells
Producing Gas Compliant Wells SI < 1yr. Non-CompliantWells Wells Wells
142,214
Producing Producing> 100 BOPD > 5,000 with Bond/LOC with Active P-5 with Active P-5
MCF/Dy
Producing< 100 > 10 Producing
BOPD < 5,000 > 1,000 with W-1X With Delq. P-5 with Delq. P-5MCF/Dy (Orphan Wells)
< 250
Producing<10 BOPD Producing
< 1,000 > 250
Hold& Pending
975 MCF/Dy
with Del. P-5
HydrocarbonStorage/
Withdrawal/ ProducingBrine Mining
Dockets
in Active
Inj/Disp Wells w/Delq P-230,213
Wells MCF/DyEnf. Or OFCU Enforcement
36,9115,723 Service Wells
Other Wells Priority 1 Wells42 1,082
Priority 2 Wells236
Priority 3 Wells12
Priority 4 Wells
Plugging withApproved for
Action
48
OFCU Funds
with SFP4
9,212Offshore
Wells
37InlandWells
BayWells
WaterwayWells
Figure 2
RAILROAD COMMISSION OF TEXAS OIL FIELD CLEANUP PROGRAM ANNUAL REPORT--FY 2008
-3-
It is important to understand that the number of orphan wells is a dynamic number that changes daily, as wells are placed into and out of compliance. The Commission attempts to capture the dynamics occurring within the orphan well population on a monthly basis and depicts these changes during fiscal year 2008 in Table 1. Table 2 depicts the yearly dynamics beginning with fiscal year 2003 (September 1, 2002). The data in Table 1 illustrates that the number of orphan wells decreased by 256 in fiscal year 2008 and has decreased by 8,648 wells since September 2002 (Table 2). However, the make-up of the orphan wells has changed. A total of 8,551 wells (Plugged, Returned to Active Status, P-5 renewal, Other) were removed from the fiscal year 2008 beginning inventory, but 8,295 new wells were added to the population of orphan wells throughout the fiscal year (Table 1). Since the beginning of fiscal year 2003, 71,490 orphan wells have been removed from the inventory and 62,842 new orphan wells have been added to the inventory (Table 2). The Commission's regulatory goals are to eliminate the threat of pollution posed by inactive unplugged wells and to minimize the number of orphan wells requiring plugging with Oil Field Cleanup funds, or other state and federal funds. This decrease in the number of orphan wells is illustrated in Figure 3. Month of Activity Sep-07 Oct-07 Nov-07 Dec-07 Jan-08 Feb-08 Mar-08 Apr-08 May-08 Jun-08 Jul-08 Aug-08 Total
Beginning Population (from previous month) 9,579 9,542 9,204 9,241 9,916 9,996 10,054 9,986 9,384 10,019 9,563 9,748 9,579
Plugged (127) (97) (37) (132) (112) (92) (99) (21) (116) (106) (58) (146) (1,143)
Returned to Active Status (8) (2) (4) (22) (34) (4) (19) (4) (6) (2) (8) (6) (119)
Operator Change (97) (234) (79) (66) (429) (88) (57) (110) (91) (99) (152) (44) (1,546)
P-5 Renewal (282) (350) (109) (219) (493) (603) (847) (844) (192) (794) (546) (458) (5,737)
Other Reasons 0 0 0 (1) 0 0 0 0 0 (3) 0 (2) (6)Wells Added to Population 477 345 266 1,115 1,148 845 954 377 1,040 548 949 231 8,295
Ending Population 9,542 9,204 9,241 9,916 9,996 10,054 9,986 9,384 10,019 9,563 9,748 9,323 9,323
P-5 Renewal = The operator of record renews their P-5.
Other Reasons = Supporting documentation filed to correct shut-in date, well activity, etc.
Wells Added to Population = Wells not considered orphanded at end of previous month, but considered orphanded at the end of this month.
Definitions:Plugged = Plugged and abandoned.
Returned to Active Status = Active producing or service well.
Operator Change = P-4 Operator Change was filed and approved. An operator change will not be approved unless the new operator has sufficient bond amount on file to cover the new wells and has an active P-5.
Table 1

RAILROAD COMMISSION OF TEXAS OIL FIELD CLEANUP PROGRAM ANNUAL REPORT--FY 2008
-4-
Month of Activity FY 2003 FY 2004 FY 2005 FY 2006 FY 2007 FY 2008 Total
Beginning Population (from previous FY) 17,971 16,770 15,305 14,208 11,287 9,579 17,971
Plugged (1,527) (1,726) (1,756) (1,877) (1,514) (1,143) (9,543)
Returned to Active Status (646) (160) (177) (196) (118) (119) (1,416)
Operator Change (3,110) (1,777) (2,506) (1,483) (1,361) (1,546) (11,783)
P-5 Renewal (8,581) (8,144) (6,907) (10,336) (8,697) (5,737) (48,402)
Other Reasons (281) (23) (19) (12) (5) (6) (346)Wells Added to Population 12,944 10,365 10,268 10,983 9,987 8,295 62,842
Ending Population 16,770 15,305 14,208 11,287 9,579 9,323 9,323
P-5 Renewal = The operator of record renews their P-5.
Other Reasons = Supporting documentation filed to correct shut-in date, well activity, etc.
Wells Added to Population = Wells not considered orphanded at end of previous FY, but considered orphanded at the end of this FY.
Definitions:Plugged = Plugged and abandoned.
Returned to Active Status = Active producing or service well.
Operator Change = P-4 Operator Change was filed and approved. An operator change will not be approved unless the new operator has sufficient bond amount on file to cover the new wells and has an active P-5.
Table 2
Orphan Wells
11,2879,579 9,323
16,770
15,30514,208
0
2,000
4,000
6,000
8,000
10,000
12,000
14,000
16,000
18,000
20,000
Nov02
Feb03
May03
Aug03
Nov03
Feb04
May04
Aug04
Nov04
Feb05
May05
Aug05
Nov05
Feb06
May06
Aug06
Nov06
Feb07
May07
Aug07
Feb08
Aug08
Trend Line
Figure 3

RAILROAD COMMISSION OF TEXAS OIL FIELD CLEANUP PROGRAM ANNUAL REPORT--FY 2008
-5-
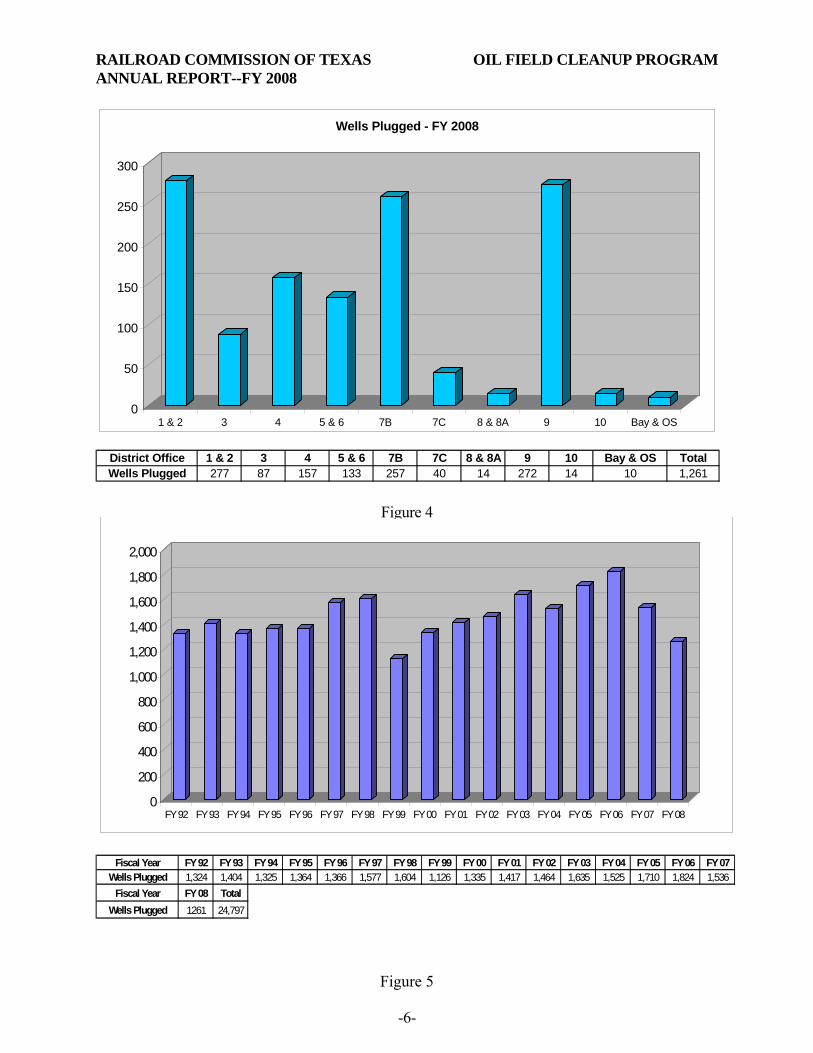
Revenue into the Oil Field Cleanup Fund is derived primarily from production taxes and permitting fees paid by the oil and gas industry; but significant revenue is also contributed from enforcement penalties, reimbursements, proceeds from the sale of equipment and hydrocarbons salvaged from well plugging and site remediation operations, and interest on fund balances. Additionally, the Commission seeks other funding sources from state and federal agencies to supplement the activities of the Oil Field Cleanup Program. Although the Oil Field Cleanup Fund finances the majority of the Oil Field Cleanup Program activities, the number of wells plugged and sites remediated contained in this report are inclusive of all sources of funds. The following information on the Oil Field Cleanup Program is reported annually as required by S.B. 1103 and amended by S.B. 310. I. NUMBER OF WELLS PLUGGED BY DISTRICT: In fiscal year 2008, the Commission plugged 1,261 wells with Oil Field Cleanup funds and other state and federal monies. The total number of wells plugged represents those wells that are physically plugged and invoiced by the plugging contractors through August 31, 2008. Figure 4 illustrates the numbers of wells plugged by district during fiscal year 2008 and Figure 5 shows the number of wells plugged by fiscal year since the inception of the current Oil Field Cleanup Program. During fiscal year 2008, the Commission’s well plugging expenditure of $14,736,187 was the second highest expenditure to date. In fiscal year 2007 the Commission set a well plugging expenditure record of $18.5 million. During fiscal year 2008 the Commission continued to focus on orphaned bay and offshore wells by plugging 10 offshore wells in the Gulf of Mexico at a cost of $1,931,365. The offshore wells plugged were located in the Gulf of Mexico adjacent to the Matagorda Island and High Island areas of the middle and upper Texas coast. The wells had an average depth of 4,973 feet and the plugging cost averaged $193,000 per well.
RAILROAD COMMISSION OF TEXAS OIL FIELD CLEANUP PROGRAM ANNUAL REPORT--FY 2008
-6-
District Office 1 & 2 3 4 5 & 6 7B 7C 8 & 8A 9 10 Bay & OS TotalWells Plugged 277 87 157 133 257 40 14 272 14 10 1,261
0
50
100
150
200
250
300
1 & 2 3 4 5 & 6 7B 7C 8 & 8A 9 10 Bay & OS
Wells Plugged - FY 2008
Figure 4
Fiscal Year FY 92 FY 93 FY 94 FY 95 FY 96 FY 97 FY 98 FY 99 FY 00 FY 01 FY 02 FY 03 FY 04 FY 05 FY 06 FY 07Wells Plugged 1,324 1,404 1,325 1,364 1,366 1,577 1,604 1,126 1,335 1,417 1,464 1,635 1,525 1,710 1,824 1,536
Fiscal Year FY 08 TotalWells Plugged 1261 24,797
0
200
400
600
800
1,000
1,200
1,400
1,600
1,800
2,000
FY 92 FY 93 FY 94 FY 95 FY 96 FY 97 FY 98 FY 99 FY 00 FY 01 FY 02 FY 03 FY 04 FY 05 FY 06 FY 07 FY 08
Figure 5
RAILROAD COMMISSION OF TEXAS OIL FIELD CLEANUP PROGRAM ANNUAL REPORT--FY 2008
-7-
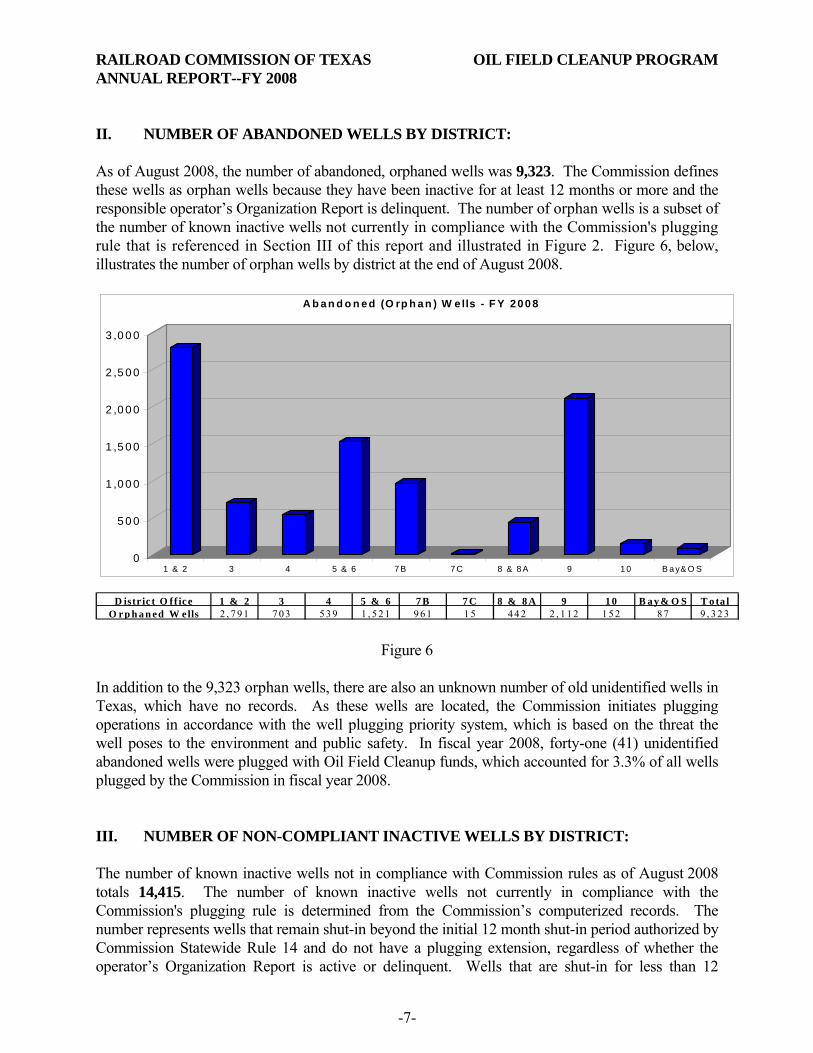
II. NUMBER OF ABANDONED WELLS BY DISTRICT: As of August 2008, the number of abandoned, orphaned wells was 9,323. The Commission defines these wells as orphan wells because they have been inactive for at least 12 months or more and the responsible operator’s Organization Report is delinquent. The number of orphan wells is a subset of the number of known inactive wells not currently in compliance with the Commission's plugging rule that is referenced in Section III of this report and illustrated in Figure 2. Figure 6, below, illustrates the number of orphan wells by district at the end of August 2008.
D istr ic t O ff ice 1 & 2 3 4 5 & 6 7 B 7 C 8 & 8 A 9 1 0 B a y & O S T o ta lO rp h a n ed W ells 2 , 7 9 1 7 0 3 5 3 9 1 , 5 2 1 9 6 1 1 5 4 4 2 2 , 1 1 2 1 5 2 8 7 9 , 3 2 3
0
5 0 0
1 ,0 0 0
1 ,5 0 0
2 ,0 0 0
2 ,5 0 0
3 ,0 0 0
1 & 2 3 4 5 & 6 7 B 7 C 8 & 8 A 9 1 0 B a y& O S
A b a n d o n ed (O rp h an ) W e lls - F Y 200 8
Figure 6
In addition to the 9,323 orphan wells, there are also an unknown number of old unidentified wells in Texas, which have no records. As these wells are located, the Commission initiates plugging operations in accordance with the well plugging priority system, which is based on the threat the well poses to the environment and public safety. In fiscal year 2008, forty-one (41) unidentified abandoned wells were plugged with Oil Field Cleanup funds, which accounted for 3.3% of all wells plugged by the Commission in fiscal year 2008. III. NUMBER OF NON-COMPLIANT INACTIVE WELLS BY DISTRICT: The number of known inactive wells not in compliance with Commission rules as of August 2008 totals 14,415. The number of known inactive wells not currently in compliance with the Commission's plugging rule is determined from the Commission’s computerized records. The number represents wells that remain shut-in beyond the initial 12 month shut-in period authorized by Commission Statewide Rule 14 and do not have a plugging extension, regardless of whether the operator’s Organization Report is active or delinquent. Wells that are shut-in for less than 12

RAILROAD COMMISSION OF TEXAS OIL FIELD CLEANUP PROGRAM ANNUAL REPORT--FY 2008
-8-
months are deemed compliant inactive wells. Wells may remain inactive beyond the initial 12-month period and are eligible for plugging extensions if the operator has sufficient financial assurance on file with the Commission, and the wells are in compliance with all other laws and Commission rules. Figure 7 shows the number of non-compliant wells by district at the end of August 2008. Figure 8 shows the number of non-compliant wells in August, at the end of each fiscal year since 1992. Like orphan wells (subset of the inactive non-compliant wells), the number of inactive non-compliant wells is a dynamic number that changes daily, as wells are placed into and out of compliance.
District Office 1 & 2 3 4 5 & 6 7B 7C 8 & 8A 9 10 Bay&OS TotalNon-Compliant Wells 3,464 975 878 2,028 1,865 144 1,137 3,326 488 110 14,415
0
500
1,000
1,500
2,000
2,500
3,000
3,500
1 & 2 3 4 5 & 6 7B 7C 8 & 8A 9 10 Bay&OS
Non-Compliant Wells - FY 2008
Figure 7
Fiscal Year FY 92 FY 93 FY 94 FY 95 FY 96 FY 97 FY 98 FY 99 FY 00 FY 01 FY 02 FY 03 FY 04 FY 05Non-Compliant Wells 21,000 19,003 18,720 22,034 27,583 23,492 22,903 25,672 25,707 24,165 24,449 24,202 22,119 20,665
Fiscal Year FY 06 FY 07 FY 08Non-Compliant Wells 17,498 16,293 14,415
0
5,000
10,000
15,000
20,000
25,000
30,000
FY 92 FY 93 FY 94 FY 95 FY 96 FY 97 FY 98 FY 99 FY 00 FY 01 FY 02 FY 03 FY 04 FY 05 FY 06 FY 07 FY 08
Non-Compliant Wells
RAILROAD COMMISSION OF TEXAS OIL FIELD CLEANUP PROGRAM ANNUAL REPORT--FY 2008
-9-
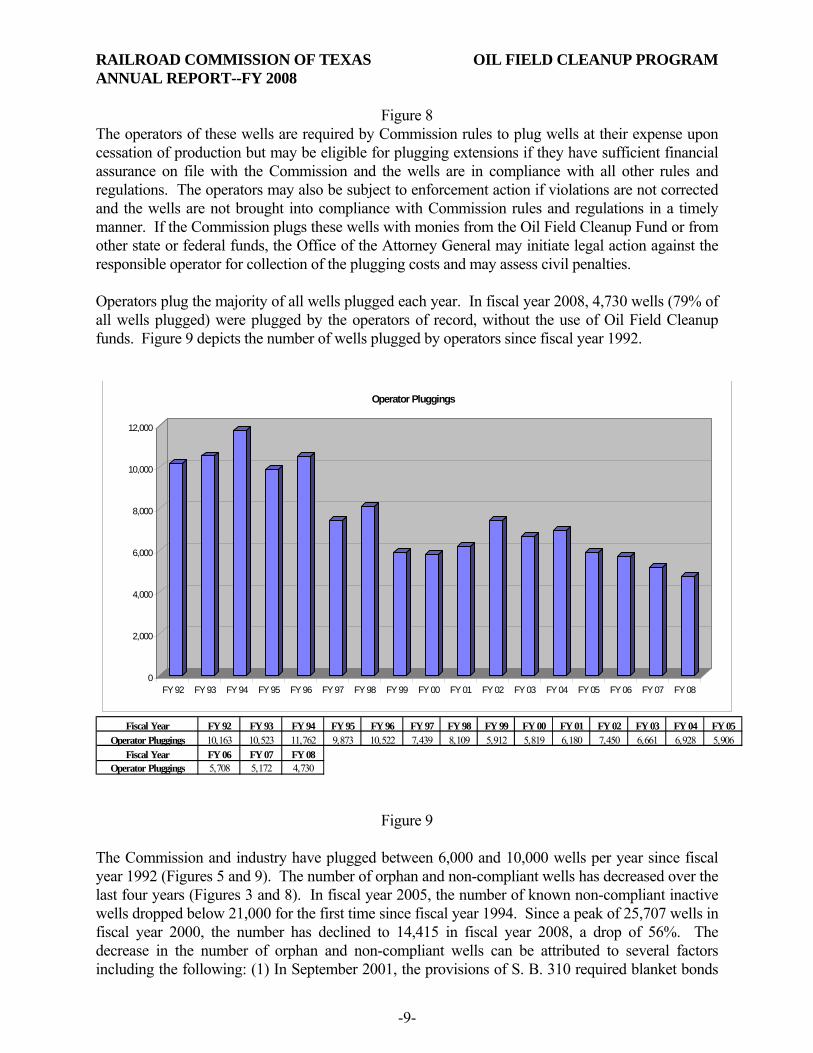
Figure 8 The operators of these wells are required by Commission rules to plug wells at their expense upon cessation of production but may be eligible for plugging extensions if they have sufficient financial assurance on file with the Commission and the wells are in compliance with all other rules and regulations. The operators may also be subject to enforcement action if violations are not corrected and the wells are not brought into compliance with Commission rules and regulations in a timely manner. If the Commission plugs these wells with monies from the Oil Field Cleanup Fund or from other state or federal funds, the Office of the Attorney General may initiate legal action against the responsible operator for collection of the plugging costs and may assess civil penalties. Operators plug the majority of all wells plugged each year. In fiscal year 2008, 4,730 wells (79% of all wells plugged) were plugged by the operators of record, without the use of Oil Field Cleanup funds. Figure 9 depicts the number of wells plugged by operators since fiscal year 1992.
Fiscal Year FY 92 FY 93 FY 94 FY 95 FY 96 FY 97 FY 98 FY 99 FY 00 FY 01 FY 02 FY 03 FY 04 FY 05Operator Pluggings 10,163 10,523 11,762 9,873 10,522 7,439 8,109 5,912 5,819 6,180 7,450 6,661 6,928 5,906
Fiscal Year FY 06 FY 07 FY 08Operator Pluggings 5,708 5,172 4,730
0
2,000
4,000
6,000
8,000
10,000
12,000
FY 92 FY 93 FY 94 FY 95 FY 96 FY 97 FY 98 FY 99 FY 00 FY 01 FY 02 FY 03 FY 04 FY 05 FY 06 FY 07 FY 08
Operator Pluggings
Figure 9 The Commission and industry have plugged between 6,000 and 10,000 wells per year since fiscal year 1992 (Figures 5 and 9). The number of orphan and non-compliant wells has decreased over the last four years (Figures 3 and 8). In fiscal year 2005, the number of known non-compliant inactive wells dropped below 21,000 for the first time since fiscal year 1994. Since a peak of 25,707 wells in fiscal year 2000, the number has declined to 14,415 in fiscal year 2008, a drop of 56%. The decrease in the number of orphan and non-compliant wells can be attributed to several factors including the following: (1) In September 2001, the provisions of S. B. 310 required blanket bonds
RAILROAD COMMISSION OF TEXAS OIL FIELD CLEANUP PROGRAM ANNUAL REPORT--FY 2008
-10-
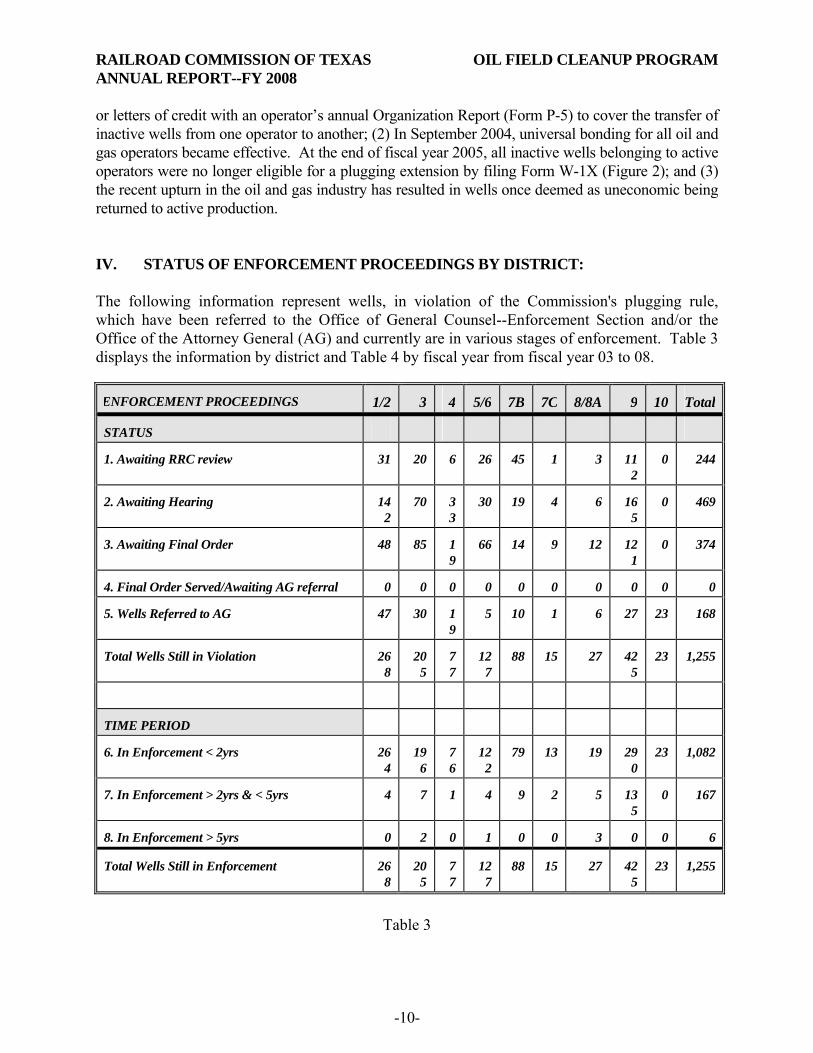
or letters of credit with an operator’s annual Organization Report (Form P-5) to cover the transfer of inactive wells from one operator to another; (2) In September 2004, universal bonding for all oil and gas operators became effective. At the end of fiscal year 2005, all inactive wells belonging to active operators were no longer eligible for a plugging extension by filing Form W-1X (Figure 2); and (3) the recent upturn in the oil and gas industry has resulted in wells once deemed as uneconomic being returned to active production. IV. STATUS OF ENFORCEMENT PROCEEDINGS BY DISTRICT: The following information represent wells, in violation of the Commission's plugging rule, which have been referred to the Office of General Counsel--Enforcement Section and/or the Office of the Attorney General (AG) and currently are in various stages of enforcement. Table 3 displays the information by district and Table 4 by fiscal year from fiscal year 03 to 08. ENFORCEMENT PROCEEDINGS 1/2 3 4 5/6 7B 7C 8/8A 9 10 Total
STATUS
1. Awaiting RRC review 31 20 6 26 45 1 3 112
0 244
2. Awaiting Hearing 142
70 33
30 19 4 6 165
0 469
3. Awaiting Final Order 48 85 19
66 14 9 12 121
0 374
4. Final Order Served/Awaiting AG referral 0 0 0 0 0 0 0 0 0 0
5. Wells Referred to AG 47 30 19
5 10 1 6 27 23 168
Total Wells Still in Violation 268
205
77
127
88 15 27 425
23 1,255
TIME PERIOD
6. In Enforcement < 2yrs 264
196
76
122
79 13 19 290
23 1,082
7. In Enforcement > 2yrs & < 5yrs 4 7 1 4 9 2 5 135
0 167
8. In Enforcement > 5yrs 0 2 0 1 0 0 3 0 0 6
Total Wells Still in Enforcement 268
205
77
127
88 15 27 425
23 1,255
Table 3

RAILROAD COMMISSION OF TEXAS OIL FIELD CLEANUP PROGRAM ANNUAL REPORT--FY 2008
-11-
ENFORCEMENT PROCEEDINGS FY 03 FY 04 FY 05 FY 06 FY 07 FY 08
STATUS
1. Awaiting RRC review 87 24 187 392 369 244
2. Awaiting Hearing 751 450 595 805 349 469
3. Awaiting Final Order 146 423 153 137 284 374
4. Final Order Served/Awaiting AG referral
0 0 0 0 0 0
5. Wells Referred to AG 739 716 542 281 398 168
Total Wells Still in Violation 1,723 1,613 1,477 1,615 1,400 1,255
TIME PERIOD
6. In Enforcement < 2yrs 1,628 1,501 1,390 1,444 1,257 1,082
7. In Enforcement > 2yrs & < 5yrs 89 107 87 171 143 167
8. In Enforcement > 5yrs 6 5 0 0 0 6
Total Wells Still in Enforcement 1,723 1,613 1,477 1,615 1,400 1,255
PENALTIES & REIMBURSEMENTS
9. Administrative Penalties Assessed by RRC
$2,121,811 $1,348,532 $1,355,905 $1,543,475 $2,331,640 $2,038,190
TOTAL PENALTIES AND REIM. PAID TO RRC & AG
$1,929,053 $1,894,618 $2,399,200 $2,588,211 $2,804,213 $5,323,074
Table 4
RAILROAD COMMISSION OF TEXAS OIL FIELD CLEANUP PROGRAM ANNUAL REPORT--FY 2008
-12-
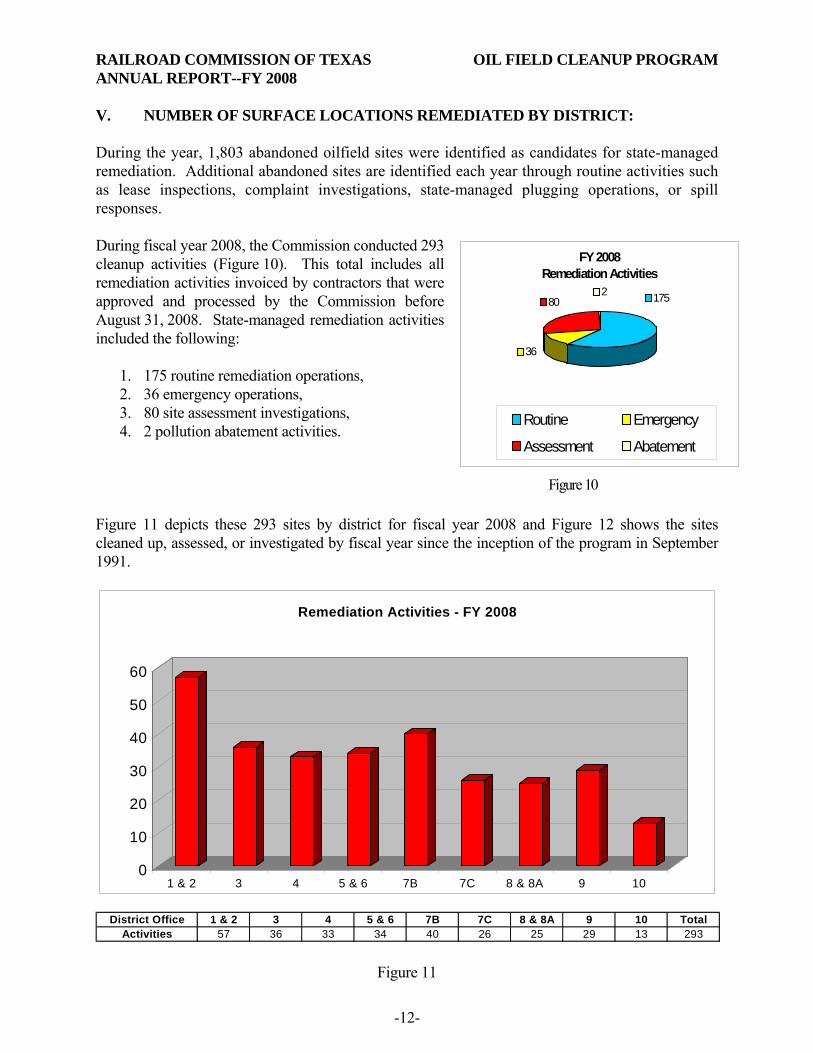
V. NUMBER OF SURFACE LOCATIONS REMEDIATED BY DISTRICT: During the year, 1,803 abandoned oilfield sites were identified as candidates for state-managed remediation. Additional abandoned sites are identified each year through routine activities such as lease inspections, complaint investigations, state-managed plugging operations, or spill responses. During fiscal year 2008, the Commission conducted 293 cleanup activities (Figure 10). This total includes all remediation activities invoiced by contractors that were approved and processed by the Commission before August 31, 2008. State-managed remediation activities included the following:
1. 175 routine remediation operations, 2. 36 emergency operations, 3. 80 site assessment investigations, 4. 2 pollution abatement activities.
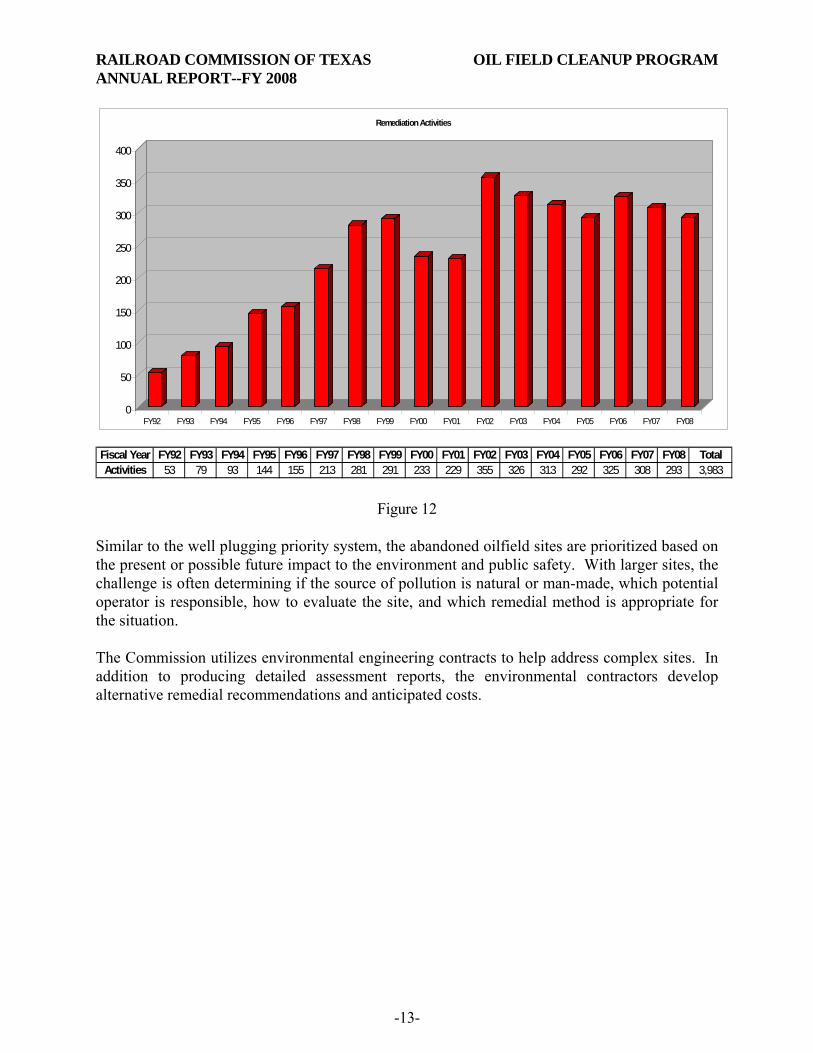
Figure 11 depicts these 293 sites by district for fiscal year 2008 and Figure 12 shows the sites cleaned up, assessed, or investigated by fiscal year since the inception of the program in September 1991.
District Office 1 & 2 3 4 5 & 6 7B 7C 8 & 8A 9 10 TotalActivities 57 36 33 34 40 26 25 29 13 293
0
10
20
30
40
50
60
1 & 2 3 4 5 & 6 7B 7C 8 & 8A 9 10
Remediation Activities - FY 2008
Figure 11
Figure 10
FY 2008Remediation Activities
175
36
280
Routine Emergency
Assessment Abatement
RAILROAD COMMISSION OF TEXAS OIL FIELD CLEANUP PROGRAM ANNUAL REPORT--FY 2008
-13-
Fiscal Year FY92 FY93 FY94 FY95 FY96 FY97 FY98 FY99 FY00 FY01 FY02 FY03 FY04 FY05 FY06 FY07 FY08 TotalActivities 53 79 93 144 155 213 281 291 233 229 355 326 313 292 325 308 293 3,983
0
50
100
150
200
250
300
350
400
FY92 FY93 FY94 FY95 FY96 FY97 FY98 FY99 FY00 FY01 FY02 FY03 FY04 FY05 FY06 FY07 FY08
Remediation Activities
Figure 12
Similar to the well plugging priority system, the abandoned oilfield sites are prioritized based on the present or possible future impact to the environment and public safety. With larger sites, the challenge is often determining if the source of pollution is natural or man-made, which potential operator is responsible, how to evaluate the site, and which remedial method is appropriate for the situation. The Commission utilizes environmental engineering contracts to help address complex sites. In addition to producing detailed assessment reports, the environmental contractors develop alternative remedial recommendations and anticipated costs.

RAILROAD COMMISSION OF TEXAS OIL FIELD CLEANUP PROGRAM ANNUAL REPORT--FY 2008
-14-
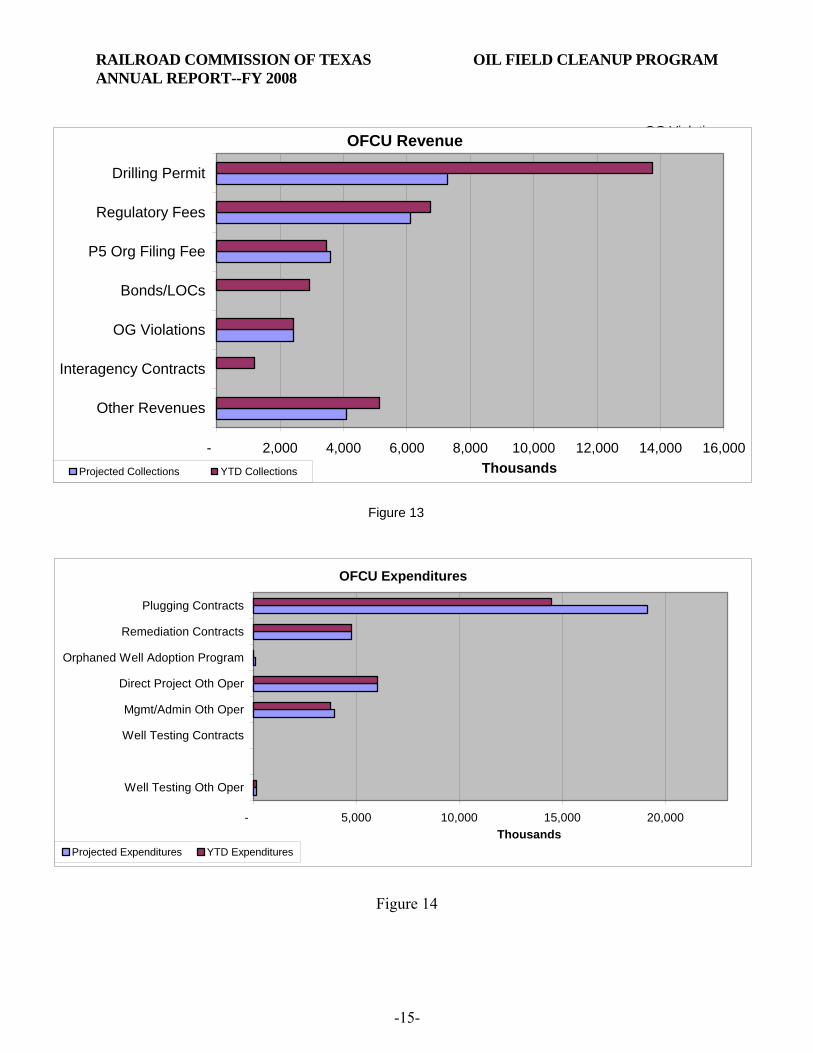
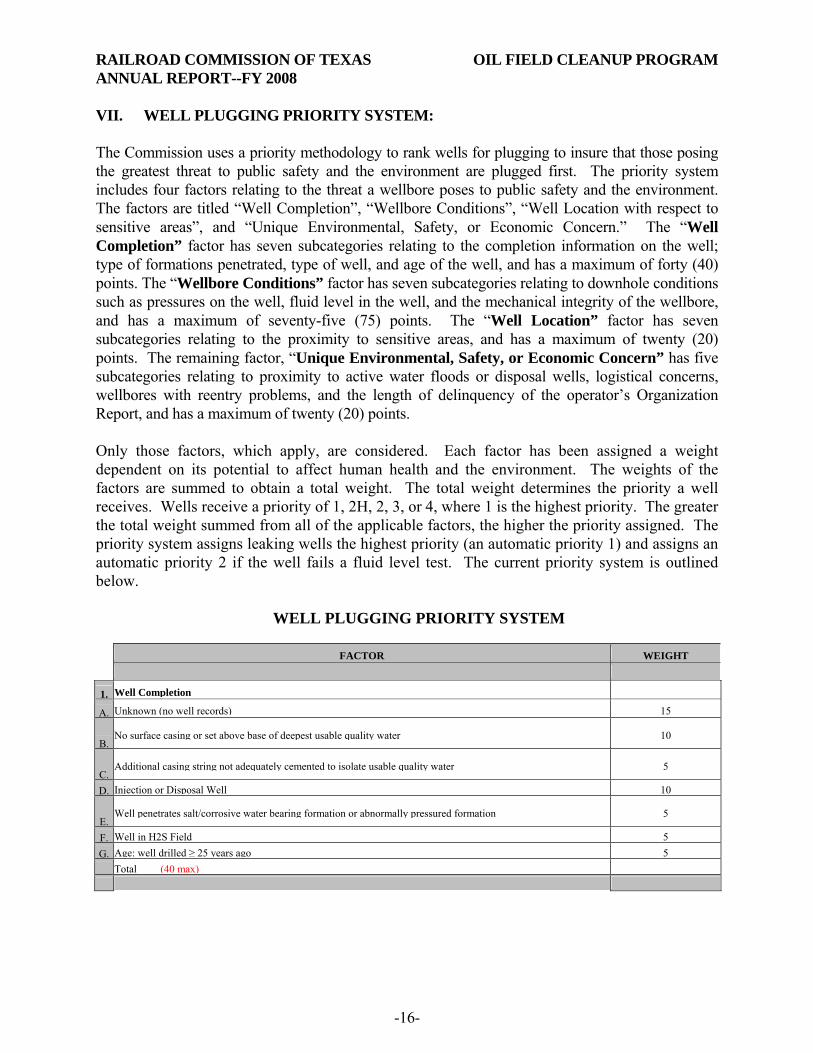
VI. OIL FIELD CLEANUP FUND EXPENDITURES: The Commission began fiscal year 2008 with a beginning fund balance in the Oil Field Cleanup Fund of $9,148,547 and ended with a fund balance of $13,036,472. Total revenues for the fiscal year were $35,608,836 and total expenditures were $29,262,718. Fiscal year 2008 Oil Field Cleanup Fund revenues and expenditures for well plugging operations, site remediation activities, and administration of the program are detailed in Table 5 and graphically displayed in Figures 13 and 14.
FY 2008 FY 2008 FY 2008 FY 2008Original Revised Actual % Collected/Budget Budget Rev/Exp Expended
Beginning Fund Balance, September 1 9,148,547$ 6,690,354$
Revenues:Oil & Gas Well Drilling Permit 7,291,000$ 13,756,343$ 188.68%Oil Field Cleanup Regulatory Fee on Oil and Gas 6,099,000 6,756,383 110.78%P5 Organization Filing Fee 3,590,000 3,461,620 96.42%Other Revenue 4,110,000 5,118,027 124.53%Sub-Total Revenue 21,090,000$ 29,092,374$ 137.94%
Oil and Gas Bond/Letter of Credits and Cash Deposits 2,407,259
Oil & Gas Administrative Penalties 2,915,815 Sub-Total Oil and Gas Violations 2,407,000 5,323,074 221.15%Interagency Contracts -$ 1,193,388$ Total Revenues 23,497,000$ 35,608,836$ 151.55%
Expenditures:Plugging & Remediation
Plugging Contracts 17,410,000$ 19,151,000$ 14,497,987$ 75.70%Orphaned Well Adoption Program - 100,000 39,187 39.19%Remediation Contracts 3,845,000 4,771,902 4,771,902 100.00%Direct Project Salary & Operating 5,906,751 6,019,218 6,019,218 100.00%Mgmt/Admin/Support Salary & Operating 3,582,085 3,925,519 3,774,486 96.15%
Sub-Total 30,743,835$ 33,967,638$ 29,102,780$ 85.68%Well Testing
Well Testing Contracts 10,000$ 10,000$ - 0.00%Direct Project Salary & Operating 151,190 158,780 159,938$ 100.73%
Sub-Total 161,190$ 168,780$ 159,938$ 94.76%
Total Expenditures 30,905,025$ 34,136,418$ 29,262,718$ 85.72%
Ending Fund Balance, August 31 1,740,522$ 13,036,472$
Full Time Equivalent Positions 134.30 128.30
11,100,082$ (480,883)$
10,619,199$ 2,986,140$
13,605,339$
Beginning Imprest Balance, September 1, 2007
FY 08 Net ActivityEnding Imprest Balance, August 31, 2008
AdjustmentAdjusted, Imprest Balance
Table 5
RAILROAD COMMISSION OF TEXAS OIL FIELD CLEANUP PROGRAM ANNUAL REPORT--FY 2008
-15-
OG ViolationsBonds/LOCsP5 Org Filing FeeRegulatory Fees
Drilling PermitTotal
Figure 13
OFCU Revenue
- 2,000 4,000 6,000 8,000 10,000 12,000 14,000 16,000
Other Revenues
Interagency Contracts
OG Violations
Bonds/LOCs
P5 Org Filing Fee
Regulatory Fees
Drilling Permit
ThousandsProjected Collections YTD Collections
OFCU Expenditures
- 5,000 10,000 15,000 20,000
Well Testing Oth Oper
Well Testing Contracts
Mgmt/Admin Oth Oper
Direct Project Oth Oper
Orphaned Well Adoption Program
Remediation Contracts
Plugging Contracts
ThousandsProjected Expenditures YTD Expenditures
Figure 14
RAILROAD COMMISSION OF TEXAS OIL FIELD CLEANUP PROGRAM ANNUAL REPORT--FY 2008
-16-
VII. WELL PLUGGING PRIORITY SYSTEM: The Commission uses a priority methodology to rank wells for plugging to insure that those posing the greatest threat to public safety and the environment are plugged first. The priority system includes four factors relating to the threat a wellbore poses to public safety and the environment. The factors are titled “Well Completion”, “Wellbore Conditions”, “Well Location with respect to sensitive areas”, and “Unique Environmental, Safety, or Economic Concern.” The “Well Completion” factor has seven subcategories relating to the completion information on the well; type of formations penetrated, type of well, and age of the well, and has a maximum of forty (40) points. The “Wellbore Conditions” factor has seven subcategories relating to downhole conditions such as pressures on the well, fluid level in the well, and the mechanical integrity of the wellbore, and has a maximum of seventy-five (75) points. The “Well Location” factor has seven subcategories relating to the proximity to sensitive areas, and has a maximum of twenty (20) points. The remaining factor, “Unique Environmental, Safety, or Economic Concern” has five subcategories relating to proximity to active water floods or disposal wells, logistical concerns, wellbores with reentry problems, and the length of delinquency of the operator’s Organization Report, and has a maximum of twenty (20) points. Only those factors, which apply, are considered. Each factor has been assigned a weight dependent on its potential to affect human health and the environment. The weights of the factors are summed to obtain a total weight. The total weight determines the priority a well receives. Wells receive a priority of 1, 2H, 2, 3, or 4, where 1 is the highest priority. The greater the total weight summed from all of the applicable factors, the higher the priority assigned. The priority system assigns leaking wells the highest priority (an automatic priority 1) and assigns an automatic priority 2 if the well fails a fluid level test. The current priority system is outlined below.
WELL PLUGGING PRIORITY SYSTEM
FACTOR WEIGHT
1. Well Completion
A. Unknown (no well records) 15
B. No surface casing or set above base of deepest usable quality water 10
C. Additional casing string not adequately cemented to isolate usable quality water 5
D. Injection or Disposal Well 10
E. Well penetrates salt/corrosive water bearing formation or abnormally pressured formation 5
F. Well in H2S Field 5 G. Age: well drilled ≥ 25 years ago 5 Total (40 max)

RAILROAD COMMISSION OF TEXAS OIL FIELD CLEANUP PROGRAM ANNUAL REPORT--FY 2008
-17-
2. Wellbore Conditions
A. Well is pressured up at the surface (tbg or Prod csg) 10 B. Bradenhead pressure exists * 5 Auto 2H if UQW not protected, and fluid at BH is not UQW
C. Measured fluid level:
D. Fluid level at or above the base of deepest usable quality water. 50
E. Fluid level less than 250’ below base of deepest usable quality water (na if 2D applies) 15
F. MIT failure 5
G. H-15 (MIT) never performed, or test greater than 5 years old (na if F applies) 3
H. Inadequate wellhead control/integrity 5 Total (75 max pts)
3. Well location with respect to sesitive areas
A. H2S well with Public area ROE ** Automatic Priority 2H
B. In Marine Environment 10
C. Within 100’ of river, lake, creek, or domestic use fresh water well (N/A if B applies) 5
D. Between 100’ and ¼ mile of river, lake, creek, or domestic use fresh water well (N/A if C applies) 3
E. Located within agricultural area 2 F. Well located in known sensitive wildlife area 3 G. Well located within city or town site limits 10 Total (20 max pts)
4. Unique environmental, Safety, or Economic Concern
A. Adjacent to Active water flood or disposal well at or above completion interval. 5
B. Logistics (poor roads, encroaching public, etc) 5 C. Well Contains Junk 5 D. P-5 Delinquent > 5 years 5 E. Other (attach explanation) 1-20 Total (20 max pts) Total Weight Priority
Priority 1 = Leaking Well (Based on Definition)
Priority 2H = Higher Risk well (Based on Definition and/or total weight > +75) Priority 2 = Total Weight 50 - 75 Priority 3 = Total Weight 25 - 49 Priority 4 = Total Weight < 25 * BH Pressure is sustained. ** 2H if public area could be impacted based on SWR 36 definition. Undetected/continuous leak possible.
RAILROAD COMMISSION OF TEXAS OIL FIELD CLEANUP PROGRAM ANNUAL REPORT--FY 2008
-18-
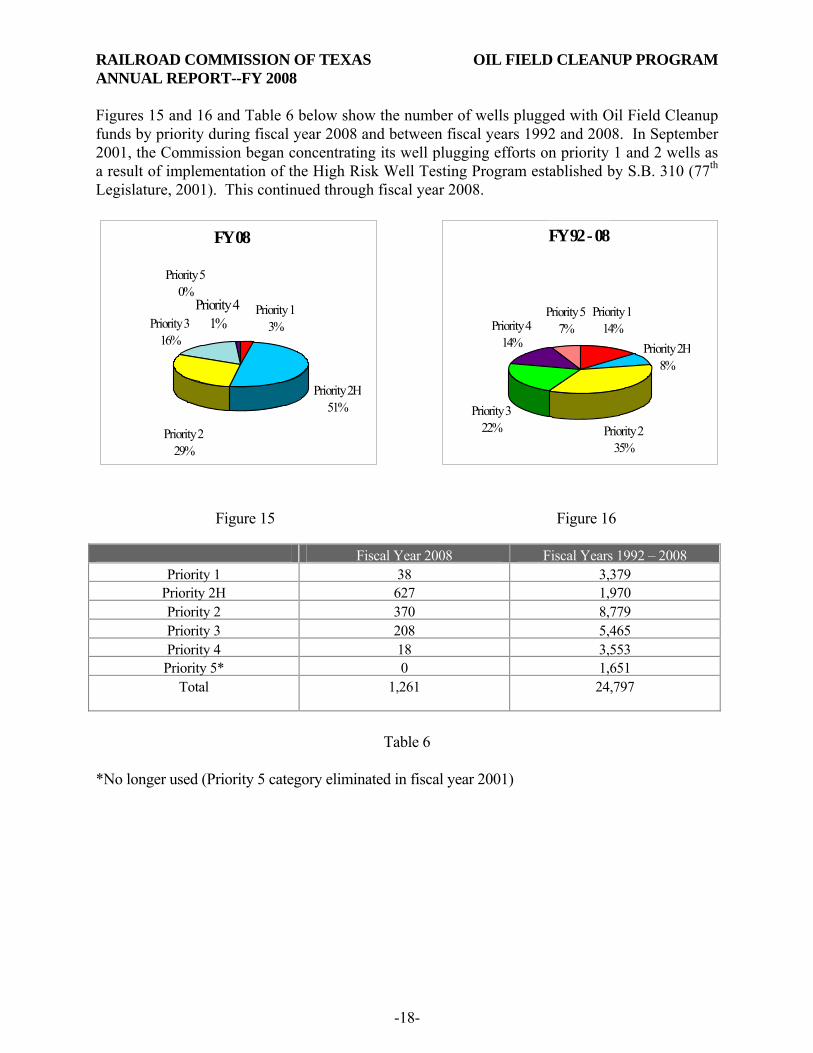
Figures 15 and 16 and Table 6 below show the number of wells plugged with Oil Field Cleanup funds by priority during fiscal year 2008 and between fiscal years 1992 and 2008. In September 2001, the Commission began concentrating its well plugging efforts on priority 1 and 2 wells as a result of implementation of the High Risk Well Testing Program established by S.B. 310 (77th Legislature, 2001). This continued through fiscal year 2008.
FY 08
Priority 50%
Priority 229%
Priority 2H51%
Priority 316%
Priority 13%
Priority 41%
FY 92 - 08
Priority 57%Priority 4
14%
Priority 114%
Priority 322%
Priority 2H8%
Priority 235%
Figure 15 Figure 16 Fiscal Year 2008 Fiscal Years 1992 – 2008
Priority 1 38 3,379 Priority 2H 627 1,970 Priority 2 370 8,779 Priority 3 208 5,465 Priority 4 18 3,553 Priority 5* 0 1,651
Total 1,261
24,797
Table 6
*No longer used (Priority 5 category eliminated in fiscal year 2001)
RAILROAD COMMISSION OF TEXAS OIL FIELD CLEANUP PROGRAM ANNUAL REPORT--FY 2008
-19-
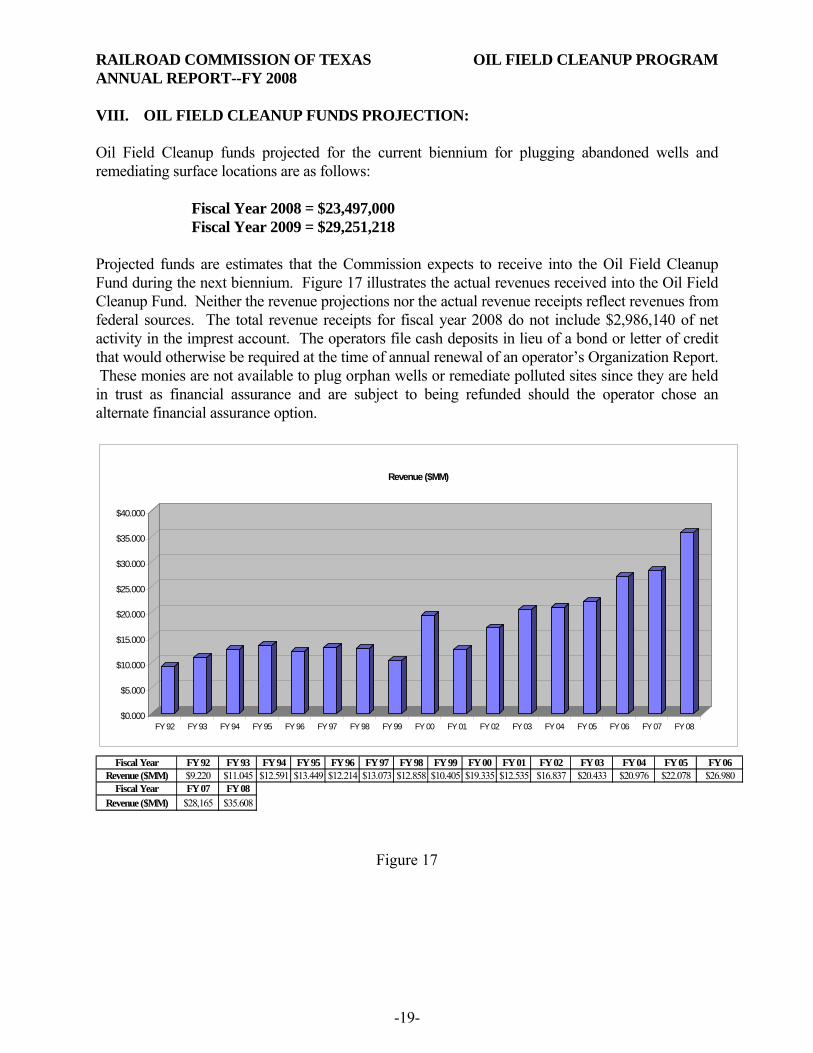
VIII. OIL FIELD CLEANUP FUNDS PROJECTION: Oil Field Cleanup funds projected for the current biennium for plugging abandoned wells and remediating surface locations are as follows: Fiscal Year 2008 = $23,497,000 Fiscal Year 2009 = $29,251,218 Projected funds are estimates that the Commission expects to receive into the Oil Field Cleanup Fund during the next biennium. Figure 17 illustrates the actual revenues received into the Oil Field Cleanup Fund. Neither the revenue projections nor the actual revenue receipts reflect revenues from federal sources. The total revenue receipts for fiscal year 2008 do not include $2,986,140 of net activity in the imprest account. The operators file cash deposits in lieu of a bond or letter of credit that would otherwise be required at the time of annual renewal of an operator’s Organization Report. These monies are not available to plug orphan wells or remediate polluted sites since they are held in trust as financial assurance and are subject to being refunded should the operator chose an alternate financial assurance option.
Fiscal Year FY 92 FY 93 FY 94 FY 95 FY 96 FY 97 FY 98 FY 99 FY 00 FY 01 FY 02 FY 03 FY 04 FY 05 FY 06Revenue ($MM) $9.220 $11.045 $12.591 $13.449 $12.214 $13.073 $12.858 $10.405 $19.335 $12.535 $16.837 $20.433 $20.976 $22.078 $26.980
Fiscal Year FY 07 FY 08Revenue ($MM) $28,165 $35.608
$0.000
$5.000
$10.000
$15.000
$20.000
$25.000
$30.000
$35.000
$40.000
FY 92 FY 93 FY 94 FY 95 FY 96 FY 97 FY 98 FY 99 FY 00 FY 01 FY 02 FY 03 FY 04 FY 05 FY 06 FY 07 FY 08
Revenue ($MM)
Figure 17

RAILROAD COMMISSION OF TEXAS OIL FIELD CLEANUP PROGRAM ANNUAL REPORT--FY 2008
-20-
IX. STATUS OF SALVAGE OPERATIONS: The Commission continues to benefit from the sale of salvageable equipment and hydrocarbons recovered from wells/leases plugged and sites remediated with Oil Field Cleanup funds. In fiscal year 2008, the Commission derived $1,433,501 from the sale of salvageable equipment and hydrocarbons on 334 salvage operations and deposited these proceeds in the Oil Field Cleanup Fund. The record for the sale of salvage was set in fiscal year 2006 with proceeds of $1,637,051. House Bill (H.B.) 2705 (73rd Legislature, 1993), which became effective January 1, 1994, streamlined the requirements and facilitated the process by which the Commission is able to sell salvageable equipment and hydrocarbons from wells plugged or sites remediated with Oil Field Cleanup funds. While the bill eased the requirements to sell salvage, it continued to provide due process protection for interested or affected parties. Potential claimants of salvage proceeds have an indefinite period of time in which to file a claim against the Oil Field Cleanup Fund for the proceeds from the sale of salvageable equipment and/or hydrocarbons. Additionally, H.B. 2613 (78th Legislature, 2003) clearly established the Commission’s ability to also sell stored hydrocarbons from abandoned sites remediated by the Commission. Since the inception of the salvage program, the proceeds from the sale of salvageable equipment and hydrocarbons have totaled $12,349,061 from 3,106 salvage operations. Figure 18 illustrates the salvage proceeds from the sale of equipment and hydrocarbons from fiscal year 1994 to the present.
Fiscal Year FY 94 FY 95 FY 96 FY 97 FY 98 FY 99 FY 00 FY 01 FY 02 FY 03 FY 04 FY 05 FY 06 FY 07Salvage Proceeds $256,126 $612,987 $729,736 $980,176 $1,163,021 $328,781 $595,758 $874,604 $595,615 $355,074 $764,853 $988,496 $1,637,051 $1,033,282Operations 63 208 285 249 344 136 182 164 197 103 207 184 253 197Fiscal Year FY 08 TotalSalvage Proceeds $1,433,501 $12,349,061Operations 334 3,106
$0
$200,000
$400,000
$600,000
$800,000
$1,000,000
$1,200,000
$1,400,000
$1,600,000
$1,800,000
FY 94 FY 95 FY 96 FY 97 FY 98 FY 99 FY 00 FY 01 FY 02 FY 03 FY 04 FY 05 FY 06 FY 07 FY 08
Figure 18
RAILROAD COMMISSION OF TEXAS OIL FIELD CLEANUP PROGRAM ANNUAL REPORT--FY 2008
-21-
X. NUMBER OF SITES REMEDIATED UNDER THE VOLUNTARY CLEANUP PROGRAM BY DISTRICT:
Senate Bill 310, 77th Legislature (2001), amended Texas Natural Resources Code, Chapter 91, by adding new Subchapter O, specifically authorizing the Commission to establish a Voluntary Cleanup Program (VCP) that is self-funded through the collection of application and oversight fees and that these fees be deposited to the Oil Field Cleanup Fund. Railroad Commission rules regarding the VCP were adopted in June 2002 (16 TAC, Chapter 4, Subchapter D). The purpose of the VCP is to provide an incentive to lenders, developers, owners, and operators to remediate soil and water environmentally impacted by activities over which the Commission exercises jurisdiction by removing the liability to the lenders, developers, owners, and operators who did not cause or contribute to contamination. In return for the release of liability, the State offsets oversight costs through the collection of fees, reduces the need for state-managed cleanup activities, and expedites the return of contaminated properties into productive use. S.B. 310 structured the VCP in a sequential fashion: 1) an application (with application fee of $1,000) and acceptance process, 2) agreement execution process, 3) cleanup with Commission oversight process, and finally 4) issuance of a VCP Certificate of Completion. The Commission oversight includes review of work plans and reports to ensure the protection of human health and the environment. In fiscal year 2008 there were 7 new VCP applications. As of August 31, 2008, there were 33 active VCP sites. Since program inception in the summer of FY02, 31 sites have been cleaned up and certificates of completion issued XI. OPERATOR CLEANUP PROGRAM: Another important function of the Commission’s Oil Field Cleanup Program is the management of the Operator Cleanup Program (OCP). Operator cleanups are complex assessment and remediation activities conducted by a responsible operator, usually at environmentally sensitive sites. The program ensures that pollution outside of SWR 91 non-sensitive area oil spill cleanup requirements and beyond routine SWR 8 cleanups and closures are addressed promptly and adequately. Oversight of OCP activities is usually by staff in Austin headquarters and District Office (DO) staff. The majority of the projects are long-term remediation projects that require specialized skills to review and manage. Importantly, environmental cleanups in this program are funded by the responsible operator. As a result, prompt review and action by the Commission may keep some of these projects from becoming state-managed projects that would need Oil Field Cleanup funds to complete the clean up. While these projects do not impose actual assessment of cleanup costs to the Oil Field Cleanup Fund, they do require considerable staff resources of employees who are paid out of the fund. Mergers, divestitures and acquisitions of oil field properties, which routinely involve environmental assessments for asset valuation, have also contributed to the increasing number of projects for the Operator Cleanup Program. It is not uncommon for operators to discover
RAILROAD COMMISSION OF TEXAS OIL FIELD CLEANUP PROGRAM ANNUAL REPORT--FY 2008
-22-
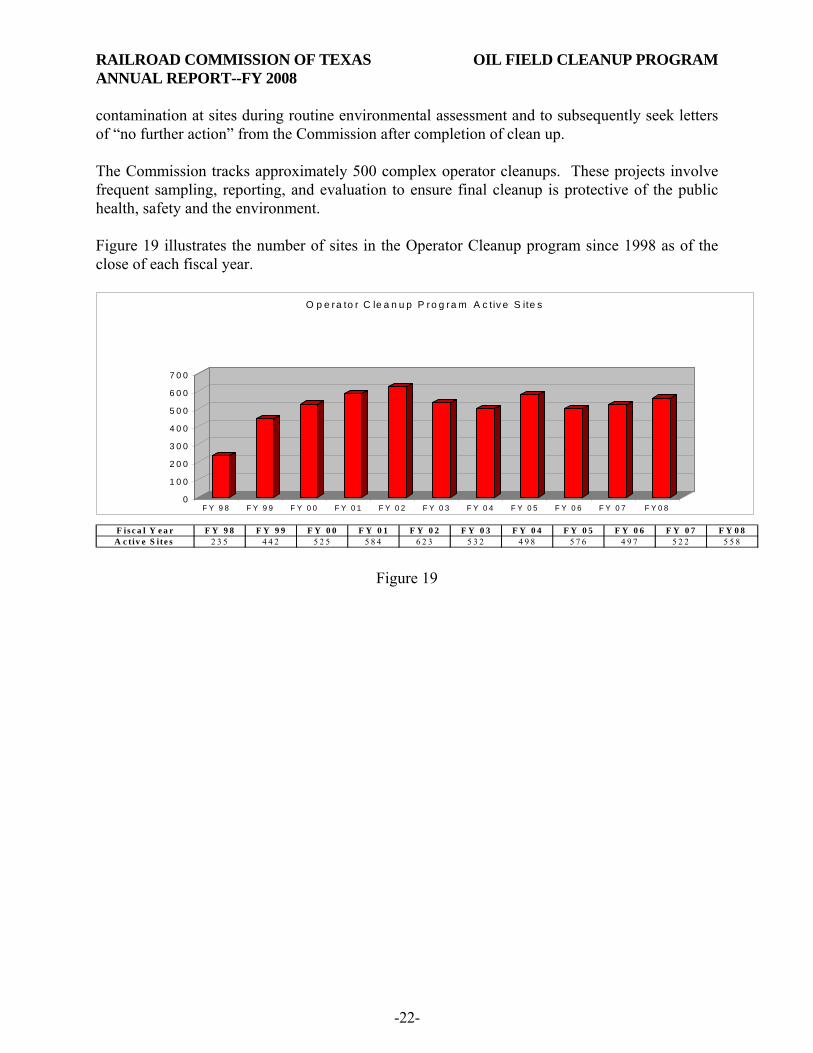
contamination at sites during routine environmental assessment and to subsequently seek letters of “no further action” from the Commission after completion of clean up. The Commission tracks approximately 500 complex operator cleanups. These projects involve frequent sampling, reporting, and evaluation to ensure final cleanup is protective of the public health, safety and the environment. Figure 19 illustrates the number of sites in the Operator Cleanup program since 1998 as of the close of each fiscal year.
F is c a l Y e a r F Y 9 8 F Y 9 9 F Y 0 0 F Y 0 1 F Y 0 2 F Y 0 3 F Y 0 4 F Y 0 5 F Y 0 6 F Y 0 7 F Y 0 8A c t iv e S ite s 2 3 5 4 4 2 5 2 5 5 8 4 6 2 3 5 3 2 4 9 8 5 7 6 4 9 7 5 2 2 5 5 8
0
1 0 0
2 0 0
3 0 0
4 0 0
5 0 0
6 0 0
7 0 0
F Y 9 8 F Y 9 9 F Y 0 0 F Y 0 1 F Y 0 2 F Y 0 3 F Y 0 4 F Y 0 5 F Y 0 6 F Y 0 7 F Y 0 8
O p e ra to r C le a n u p P ro g ra m A c tiv e S ite s
Figure 19