ohio statewide freight study - ohio department of ... · 1.1 stakeholder insight summary ... 2.1.4...
TRANSCRIPT
ACCESS OHIO 2040
FINAL REPORT
November 2013
Ohio Statewide Freight Study
Prepared for:
Prepared by:

ACCESS OHIO 2040
Table of Contents
Executive Summary .................................................................................................................................. I What are the Major Freight Trends for Ohio? ..................................................................................... I How will Ohio Freight Move in the Future? ...................................................................................... III How does Ohio compare to other states?......................................................................................... IV What Challenges Should Ohio be Aware of and Address? .................................................................. V What are the Most Promising Freight Strategies for Ohio? ............................................................... VI
1. Introduction ................................................................................................................................... 1-1 1.1 Stakeholder Insight Summary ............................................................................................... 1-1
2. Ohio’s Freight System..................................................................................................................... 2-1 2.1.1 Rail ........................................................................................................................... 2-1 2.1.2 Maritime .................................................................................................................. 2-1 2.1.3 Highways and Trucking ............................................................................................. 2-2 2.1.4 Air Cargo .................................................................................................................. 2-2 2.1.5 Intermodal Container Facilities ................................................................................. 2-3
2.2 Economic Trends and Freight Flows ...................................................................................... 2-4 2.3 Future Needs ........................................................................................................................ 2-8
2.3.1 Problem Areas .......................................................................................................... 2-9
3. Case Studies in Statewide Freight Planning ..................................................................................... 3-1 3.1 MAP-21 Freight Plan Requirements ...................................................................................... 3-1 3.2 Case Studies ......................................................................................................................... 3-1 3.3 Implications for Freight Planning in Ohio: Best Practices ....................................................... 3-3
4. Ohio Freight Strategy Development ............................................................................................... 4-1 4.1 Truck Strategy Evaluation ..................................................................................................... 4-1
4.1.1 Developing a Roadway Freight Network ................................................................... 4-1 4.1.2 Capital Investments in Trucking Bottlenecks ............................................................. 4-4 4.1.3 Operational Improvements and ITS on the Regional System ..................................... 4-6 4.1.4 Addressing Labor Shortage for Truck Drivers ............................................................ 4-9 4.1.5 Developing Truck Parking through Public-Private Partnerships ............................... 4-11 4.1.6 Liquid Natural Gas (LNG) Fuel ................................................................................. 4-13 4.1.7 Increasing Truck Weight Limits ............................................................................... 4-15 4.1.8 Truck Speed Limits ................................................................................................. 4-17 4.1.9 Long Combination Vehicle Pilot Program ................................................................ 4-20
4.2 Ohio Railroad Strategy ........................................................................................................ 4-24 4.2.1 New Markets – Shale Oil and Gas ........................................................................... 4-24 4.2.2 Leverage Ohio’s Rail Intermodal Network ............................................................... 4-25 4.2.3 Bring Railroad Infrastructure to 286,000 Pound Standard ....................................... 4-27
4.3 Ohio Air-Cargo Strategy ...................................................................................................... 4-27
2 Table of Contents
ACCESS OHIO 2040
4.4 Lake Erie Port Strategies ..................................................................................................... 4-29 4.4.1 Dredging ................................................................................................................ 4-29 4.4.2 New Market Opportunities ..................................................................................... 4-32 4.4.3 Container Service on Lake Erie ............................................................................... 4-35 4.4.4 Other Opportunities ............................................................................................... 4-36
4.5 Ohio River Terminal Strategies ............................................................................................ 4-36 4.5.1 Factors Governing Ohio Promotion of Barge Terminal Development ...................... 4-36 4.5.2 Construction and Maintenance of “Last Mile” Road and Rail Connections .............. 4-37 4.5.3 Designating Ohio Barge Terminals as Part of Oversize/Overweight Load Routes ..... 4-37 4.5.4 Participation in the Federal Marine Highway Program ............................................ 4-38 4.5.5 Advocacy for Adequate Federal Lock and Dam Funding .......................................... 4-38 4.5.6 Publicly-Sponsored Marketing and Logistics Campaigns ......................................... 4-39
5. Conclusions and Implementation ................................................................................................... 5-1 5.1 Developing State Freight Plan in Compliance with MAP-21 ................................................... 5-1 5.2 Freight Planning in the Context of the State Transportation Plan, Access Ohio ...................... 5-2
5.2.1 Creation and Verification of the Roadway Freight Network ...................................... 5-2 5.2.2 Ongoing Freight Planning Activities .......................................................................... 5-2
5.3 Freight Investments and Strategy Implementation................................................................ 5-3
List of Figures
Figure ES-1-1: Ohio Freight Flows by Mode (2007) ................................................................................... I Figure ES-1-2: Ohio Freight Flows by Origin-Destination .......................................................................... II Figure ES-1-3: Modal Freight Forecast .................................................................................................... IV Figure 2-1: Ohio Rail Intermodal Facilities ............................................................................................. 2-4 Figure 2-2: Ohio Freight Flows by Mode and Origin/Destination ........................................................... 2-5 Figure 2-3: 2040 Ohio Freight Forecast by Mode................................................................................... 2-6 Figure 2-4: Through vs. Ohio-based Truck Volumes, 2012 Annual ......................................................... 2-7 Figure 2-5: County-Level Truck Generation ........................................................................................... 2-8 Figure 2-6: Total Truck Flows, 2012 (Light Shading) vs. 2040 (Dark Shading)......................................... 2-9 Figure 2-7: Ohio-based Automotive (Left) and Chemical Traffic (Right) with Highway Bottlenecks ...... 2-11 Figure 4-1: Ohio Roadway Freight Network .......................................................................................... 4-3 Figure 4-2: Truck Bottlenecks on the Ohio Roadway System ................................................................. 4-5 Figure 4-3: US 250 Fitchville Full Closure, Local View ............................................................................ 4-7 Figure 4-4: US 250 Fitchville Full Closure, Wide Angle View .................................................................. 4-7 Figure 4-5: US 68 Kenton Full Closure, Local View ................................................................................. 4-8 Figure 4-6: US 68 Kenton Full Closure, Wide Angle View ....................................................................... 4-8 Figure 4-7: Natural Gas Fuel Stations in Ohio ...................................................................................... 4-14 Figure 4-8: Long Combination Vehicle Types ....................................................................................... 4-20 Figure 4-9: States Allowing Long Combination Vehicles ...................................................................... 4-21
Table of Contents 3
ACCESS OHIO 2040
Figure 4-10: Pilot LCV Route – I-75 from I-80/90 (Ohio Turnpike) to Findlay ........................................ 4-23 Figure 4-11: Market Areas of NS Intermodal Terminals and CSX Terminals Serving Ohio ..................... 4-25 Figure 4-12: Average Costs of Dredging Authorized Harbors and Navigation Channels Nationwide (2012 Dollars) ..................................................................................................................................... 4-31 Figure 4-13: Historical and Projected Proppant Demand as of July 2012 ............................................. 4-34
List of Tables
Table 4-1: Annual Truck Volumes in Ohio at 80,000-lb and 90,000-lb Weight Limits ........................... 4-16 Table 4-2: Traffic Effect of Increased Rural Speed Limits: 2010 ............................................................ 4-18 Table 4-3: Traffic Effect of Increased Rural Speed Limits: 2040 ............................................................ 4-19 Table 4-4: Trailer Types, Size and Weight ............................................................................................ 4-20 Table 4-5: Ohio Rail Lines Unable to Handle 286,000 lb. Railcars ......................................................... 4-27 Table 4-6: USACE Contracted Dredging Costs and Volumes at Ohio’s Lake Erie Ports, 1997-2011 (Excludes Costs of Confined Disposal Facilities) ................................................................................... 4-30

4 Table of Contents
ACCESS OHIO 2040
Table of Abbreviations
AASHTO Association of State Highway and Transportation Officials
ATA American Trucking Association
ATRI American Transportation Research Institute
CDF Confined Disposal Facilities
CDL Commercial Drivers License
CNG Compressed natural gas
CSA Compliance, Safety, and Accountability
DOT Department of Transportation
EIA Energy Information Administration
FAA Federal Aviation Administration
FHWA Federal Highway Administration
FTZ Foreign Trade Zones
HOS Hours of Service
ISTEA Intermodal Surface Transportation Efficiency Act
ITS Information systems
LCV Long combination vehicles
LNG Liquid Natural Gas
LRTP Long Range Transportation Plan
MPO Metropolitan planning organization
NHS National Highway System
NS Norfolk Southern
ODOT Ohio Department of Transportation
ORDC Ohio Rail Development Commission
SMART Sponsorship, Maintenance, Advertising and Revenue Targeted
TRAC Transportation Review Advisory Council
USAR U.S. Army Reserve
USACE U.S. Army Corps of Engineers
USDOT U.S. Department of Transportation
ACCESS OHIO 2040
EXECUTIVE SUMMARY The Ohio Department of Transportation (ODOT) initiated a statewide freight study to understand, in the greatest detail possible, how Ohio’s freight infrastructure is being utilized. Two general purposes of the study were 1) to plan and prioritize future strategic investments in Ohio’s freight infrastructure; and 2) to guide future economic development activities to make the most efficient use of the existing freight infrastructure. Outputs of the freight study will help inform and guide the state transportation plan.
What are the Major Freight Trends for Ohio?
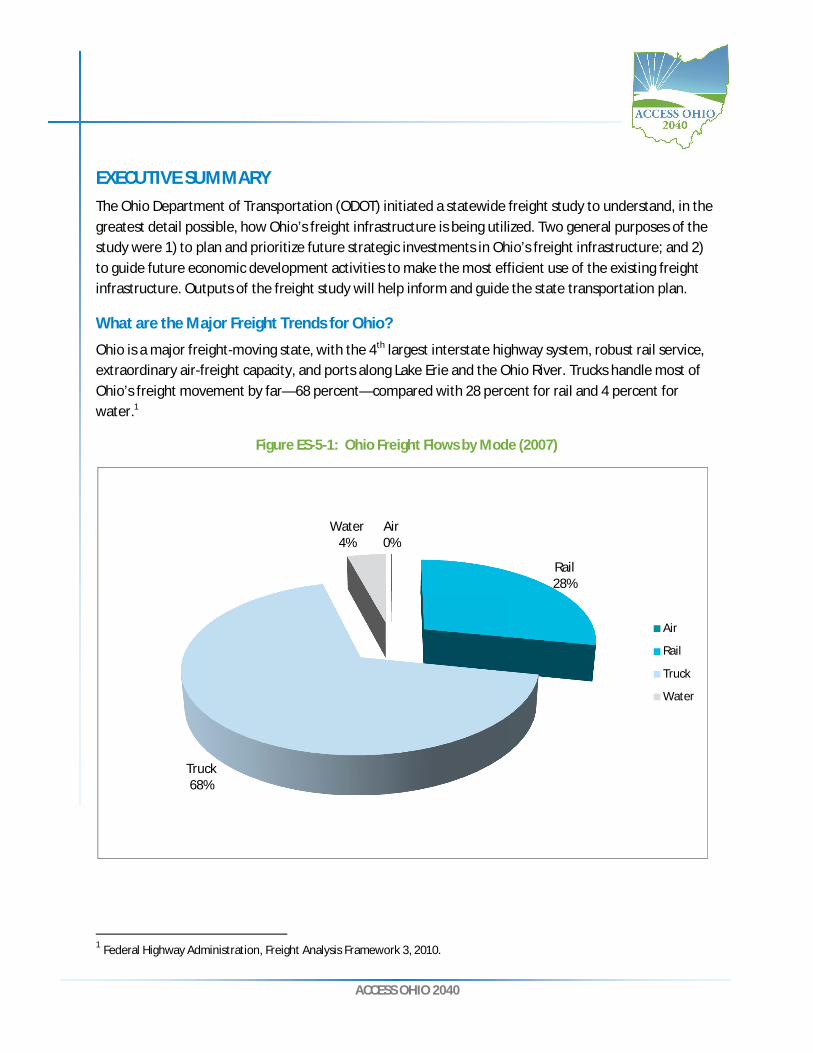
Ohio is a major freight-moving state, with the 4th largest interstate highway system, robust rail service, extraordinary air-freight capacity, and ports along Lake Erie and the Ohio River. Trucks handle most of Ohio’s freight movement by far—68 percent—compared with 28 percent for rail and 4 percent for water.1
Figure ES-5-1: Ohio Freight Flows by Mode (2007)
1 Federal Highway Administration, Freight Analysis Framework 3, 2010.
Air0%
Rail28%
Truck68%
Water4%
Air
Rail
Truck
Water
II Executive Summary
ACCESS OHIO 2040
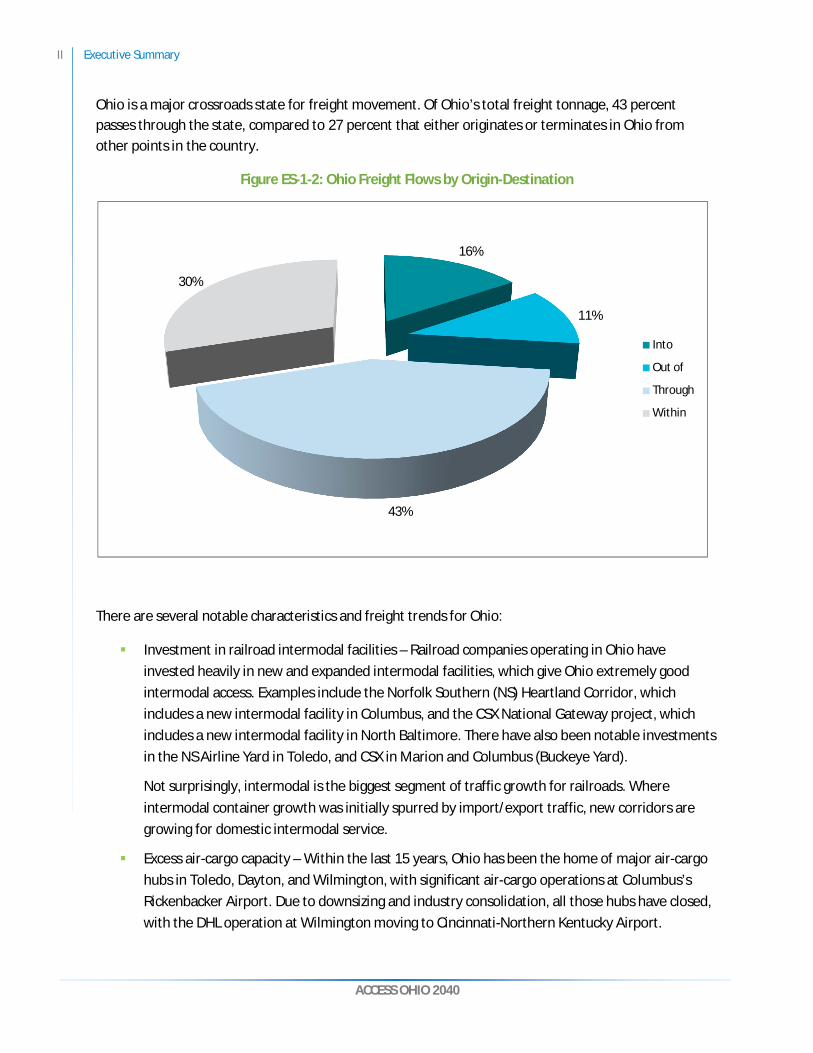
Ohio is a major crossroads state for freight movement. Of Ohio’s total freight tonnage, 43 percent passes through the state, compared to 27 percent that either originates or terminates in Ohio from other points in the country.
Figure ES-1-2: Ohio Freight Flows by Origin-Destination
There are several notable characteristics and freight trends for Ohio:
Investment in railroad intermodal facilities – Railroad companies operating in Ohio have invested heavily in new and expanded intermodal facilities, which give Ohio extremely good intermodal access. Examples include the Norfolk Southern (NS) Heartland Corridor, which includes a new intermodal facility in Columbus, and the CSX National Gateway project, which includes a new intermodal facility in North Baltimore. There have also been notable investments in the NS Airline Yard in Toledo, and CSX in Marion and Columbus (Buckeye Yard).
Not surprisingly, intermodal is the biggest segment of traffic growth for railroads. Where intermodal container growth was initially spurred by import/export traffic, new corridors are growing for domestic intermodal service.
Excess air-cargo capacity – Within the last 15 years, Ohio has been the home of major air-cargo hubs in Toledo, Dayton, and Wilmington, with significant air-cargo operations at Columbus’s Rickenbacker Airport. Due to downsizing and industry consolidation, all those hubs have closed, with the DHL operation at Wilmington moving to Cincinnati-Northern Kentucky Airport.
16%
11%
43%
30%
Into
Out of
Through
Within
Executive Summary III
ACCESS OHIO 2040
The decline in air-cargo business generally related to changes in customer requirements, as overnight shipping decreased in importance. This cargo generally shifted to parcel carriers such as FedEx and UPS, offering two- or three-day service by truck.
Trucks continue to dominate the market for Ohio freight movement – Trucks are price competitive with railroads for intermediate distance freight hauls and are essential for the delivery of retail/consumer goods.
While water ports are a unique freight asset for Ohio, both the Lake Erie and Ohio River ports face competitive challenges:
Ohio River barge operators face stiff competition from railroads, which are very price and service-competitive. The inland waterway system also suffers from inadequate investment in lock and dam infrastructure.
Like barge operators on the river, Ohio Lake Erie ports face significant competition from railroads. In addition, coastal ports have established supply chain links that move the majority of Ohio’s international trade. Some factors work against Ohio ports in capturing this trade, including the size of the St. Lawrence Seaway (the Seaway), which limits trade to smaller ocean going vessels, and the shutdown of the Seaway in the winter.
How will Ohio Freight Move in the Future?
The freight study used the Freight Analysis Framework (FAF3)—a federal database—to analyze and forecast current and future Ohio freight flows. FAF3 uses a variety of data sources to estimate freight flows, including regional economic activity and railroad waybill samples to name a few. Regional economic forecasts are the basis for estimating changes in freight mode in the future. Trucking is forecast to increase about 67 percent by 2040, while other modes will remain relatively flat (Figure ES-1-3).

IV Executive Summary
ACCESS OHIO 2040
Figure ES-1-3: Modal Freight Forecast
There are some notable trends behind the numbers:
The precipitous increase in trucking relates to the continual evolution of Ohio into a more service-based economy with less reliance on manufacturing.
Railroads experience some healthy growth in some markets, especially intermodal. But regional economic models predict a decrease in the shipment of Appalachian coal, which offsets other gains and makes net traffic growth essentially flat. The decline in coal has a similar predicted effect on net water tonnage.
How does Ohio compare to other states?
The freight study compared Ohio to other states both in terms of modal share and customers’ perceptions of the Ohio freight system. The key observations follow:
Most states do not have as many “through” movements; Ohio is unusual in major interstate through routes such as I-70, I-75, and I-80/90, and several major railroad trunk lines.
0
200,000
400,000
600,000
800,000
1,000,000
1,200,000
1,400,000
1,600,000
1,800,000
Air Rail Truck Water
Thou
sand
Ton
s
Ohio Freight Flows by Mode, by Volume
2007
2040
Executive Summary V
ACCESS OHIO 2040
Queries of the Supply Chain Consortium, a proprietary database, indicate that shippers view the Ohio highway system favorably. Compared to other states, Ohio highways are very well maintained and relatively free of congestion.
Railroad service is exceptionally good, with coverage by the two largest Class I railroads in the eastern U.S. (CSX and NS).
Ohio has a large number of railroad intermodal facilities, providing most shippers with reasonable access to both CSX and NS.
Even so, some customers, especially in Northwest Ohio, express frustration in regard to the unavailability of empty intermodal containers for local loading.
Ohio’s freight system is exceedingly intermodal, lacking only direct ocean access. Air-cargo facilities, though now underutilized, can still be instrumental to logistics-based economic activity. The rail and highway systems are robust, and the state has access to low-cost barge and lake transportation.
With its inland location, Ohio lacks an ocean port and the benefits such facilities accrue to regional economies. Whereas many states are served by a main major ocean port, Ohio has relatively equal access and good surface connections to a number of ocean gateways—New York/New Jersey, Baltimore, Maryland, and Norfolk, Virginia, on the east; Los Angeles/Long Beach and Oakland, California, and Seattle, Washington, on the west; and New Orleans, Louisiana, on the Gulf.
What Challenges Should Ohio be Aware of and Address?
There are several notable challenges relating to the freight system, which Ohio policymakers should be aware of and should address to the extent that state influence can have an impact:
There is declining productivity in the trucking sector, which is caused by a shortage of truck drivers, increase in fuel prices, and federal regulations. In response, shippers and trucking companies might seek ways to increase productivity—notably through heavier truck weights. Policymakers should understand the “big picture” issues that are driving such initiatives.
While the interstate highway system represents the “trunk” lines for trucking, shippers and carriers emphasize the importance of Ohio’s regional (U.S. and state route) system for mobility and access to major customers.
Manufacturing is returning to America, and Ohioans have the “DNA in our bones” to capitalize on it, as Governor Kasich said to the World Economic Forum early in 2013.2 Supply chain logistics are a major part of how manufacturers compete, and their performance standards continue to tighten. Trucking is the workhorse of logistics in Ohio and almost everywhere, which means that the already strong roadway system of the state needs to remain a top performer on the global
2 “Kasich Talks Manufacturing at World Economic Forum”, The Columbus Dispatch, 1/24/13.
VI Executive Summary
ACCESS OHIO 2040
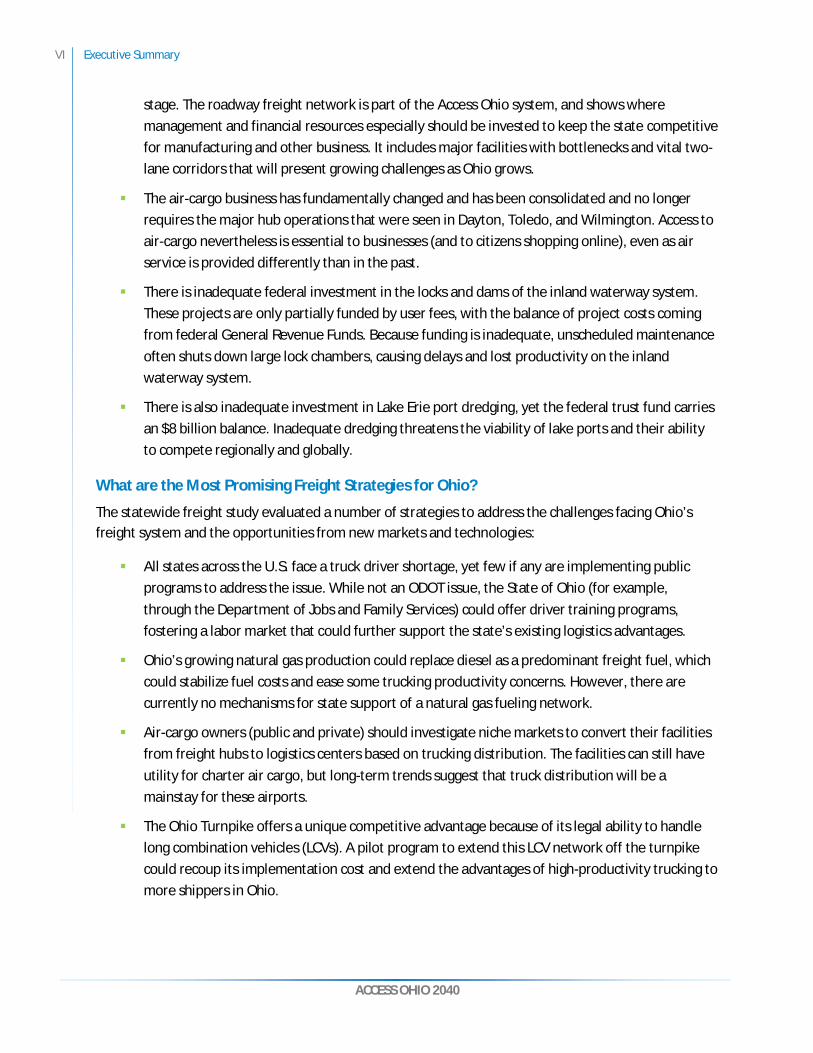
stage. The roadway freight network is part of the Access Ohio system, and shows where management and financial resources especially should be invested to keep the state competitive for manufacturing and other business. It includes major facilities with bottlenecks and vital two-lane corridors that will present growing challenges as Ohio grows.
The air-cargo business has fundamentally changed and has been consolidated and no longer requires the major hub operations that were seen in Dayton, Toledo, and Wilmington. Access to air-cargo nevertheless is essential to businesses (and to citizens shopping online), even as air service is provided differently than in the past.
There is inadequate federal investment in the locks and dams of the inland waterway system. These projects are only partially funded by user fees, with the balance of project costs coming from federal General Revenue Funds. Because funding is inadequate, unscheduled maintenance often shuts down large lock chambers, causing delays and lost productivity on the inland waterway system.
There is also inadequate investment in Lake Erie port dredging, yet the federal trust fund carries an $8 billion balance. Inadequate dredging threatens the viability of lake ports and their ability to compete regionally and globally.
What are the Most Promising Freight Strategies for Ohio?
The statewide freight study evaluated a number of strategies to address the challenges facing Ohio’s freight system and the opportunities from new markets and technologies:
All states across the U.S. face a truck driver shortage, yet few if any are implementing public programs to address the issue. While not an ODOT issue, the State of Ohio (for example, through the Department of Jobs and Family Services) could offer driver training programs, fostering a labor market that could further support the state’s existing logistics advantages.
Ohio’s growing natural gas production could replace diesel as a predominant freight fuel, which could stabilize fuel costs and ease some trucking productivity concerns. However, there are currently no mechanisms for state support of a natural gas fueling network.
Air-cargo owners (public and private) should investigate niche markets to convert their facilities from freight hubs to logistics centers based on trucking distribution. The facilities can still have utility for charter air cargo, but long-term trends suggest that truck distribution will be a mainstay for these airports.
The Ohio Turnpike offers a unique competitive advantage because of its legal ability to handle long combination vehicles (LCVs). A pilot program to extend this LCV network off the turnpike could recoup its implementation cost and extend the advantages of high-productivity trucking to more shippers in Ohio.

Executive Summary VII
ACCESS OHIO 2040
Ohio’s burgeoning intermodal railroad infrastructure is another unique competitive advantage. This intermodal system can benefit Ohio shippers if rail companies expand domestic intermodal service—this however is an issue over which state policymakers have little control.
State transportation officials should evaluate the cost and benefit of improving local rail lines to a 286,000-pound capacity, so that communities located on short-line railroads can continue to receive cost-effective rail services.
Ohio’s Lake Erie ports have excess capacity and inadequate investment in dredging. Ohio transportation officials could initiate discussions with federal officials to concentrate maintenance spending at the state’s busiest ports, with a long-term vision to convert low volume ports to other uses.

ACCESS OHIO 2040
1. INTRODUCTION Freight transportation is vital to the daily life of the people of Ohio and the prosperity of the state. Freight and logistics activity accounts for well over 100,000 Ohio jobs and appears in every county, but that is just a part of its importance. Virtually every item that Ohio citizens own or use was carried to them by the freight system—from the food on the table and the electronics around the house, to the seed in the garden and the fuel in the car. The Ohio companies where they work similarly rely on freight. For many businesses, logistics are essential to how they compete—in service to markets and in costs to customers. This is not true just for industry and agriculture. Distribution methods are a key strategy in consumer retail whether in stores or online. Ohio hospitals depend on freight carriage not only for timely supplies of everything from medicine to bed linen, but for keeping their costs down and their facilities free for patients instead of inventory storage. All of these aspects add up to a system as essential to Ohioans as the clothes on their backs, and as the foreign-origin tags on many clothes reveal, the system supports Ohio locally and globally.
Ohio freight also is a mainstay for the entire country. The state ranks generally sixth in the nation for its volume of freight shipped in or out, measured by tonnage or value of goods.3 Traffic shipped through Ohio or between Ohio and other markets accounted for 70 percent of the state’s tonnage and 87 percent of its freight value in 2007, and the through traffic alone represented 43 percent of tons and 58 percent of value. These figures demonstrate the significance of the state in the nation’s commerce, both for the contribution of Ohio-based shipping and the volume borne for other states (as others bear Ohio’s).
The quality of the transportation system over which this traffic travels is reported as strong by freight users contacted for this study, and an asset for attracting and retaining business. Its powerful array of multimodal options is beneficial for many types of companies and the varied needs that many of them have: waterborne shipping by lakes and river, competitive air service including major facilities at Cincinnati and Columbus, and rail service from four Class I carriers and 31 others operating over 5,300 miles of track—the most per square mile in the country. With no top-10 metropolitan areas, Ohio freight congestion is not as punishing as in other major states. While the roadway system is not without challenges and will face more with growth, shippers and motor carriers alike view Ohio as a good place for their operations. These are substantial advantages for the state to maintain and utilize.
1.1 Stakeholder Insight Summary
Freight stakeholder insights were obtained from regional performance benchmarks maintained by the Tompkins Supply Chain Consortium and interviews with airports and water port authorities, trucking
3 FHWA Freight Analysis Framework, 2010. Ohio outbound traffic ranked 8th by tonnage but 6th by value, and inbound traffic ranked 6th by both measures.
1-2 Section 1 Introduction
ACCESS OHIO 2040
companies, and original equipment manufacturers in the automotive industry operating in Ohio. Primary findings were these:
Continued inventory minimization – Competitive supply chains run on the least possible inventory, and those that already maintain low levels continually look for ways to cut it further. The consequence is that delivery service requirements are high and sensitivity to disruption substantial.
Growing concern for supply chain risk – Low inventories mean no buffers, and breakdowns spread rapidly through the supply chain. Weather events, infrastructure failures, and lack of recovery options affect performance and, in turn, affect facility location decisions.
Continued reconsideration of networks – Supply chain networks are not optimized and changes of design and location are ongoing. Distribution facilities are regionalizing; sourcing and production locations are shifting.
Dependency on trucking – Trucking captures two-thirds of supply chain expenditures—first because of its quality of service, flexibility and responsiveness, and second because supplier locations favor it.
Necessity of air freight – This is a corollary to low inventory policy. Air is not the go-to mode for most products and supply chains try to minimize it. Instead, it serves as the fail-safe system.
Rail intermodal growth – Mode shifts in favor of rail intermodal are increasing if not prevailing because of improving quality and accessibility of service, and favorable costs. Automotive companies that have traditionally avoided rail are giving it more (although modest) consideration.
Quality of Ohio location – The availability of suppliers within an overnight drive of facilities, good and less congested roadways, and Ohio’s multimodal options and skilled labor force make Ohio a favorable place to be;—these are qualities that must be maintained.
Dependency on Ohio regional network – Automotive manufacturers report that many plants and suppliers are not located on interstates. Interstates are critical, but the regional network of U.S. and state roadways is a primary system, and its conditions are vital.
Usage of intelligent transportation systems (ITS) for logistics management – Companies actively manage their supply networks and look for events that affect it. Real-time information fed directly into their management systems can make this process more effective.
“Few supply chain companies have been compelled to make network adjustments for Ohio deficiencies, and the cost of adjustments was largely negligible.”
– Tompkins Supply Chain Consortium
Section 1 Introduction 1-3
ACCESS OHIO 2040
Significance of truck driver shortage – This is not a typical state concern, but companies stress that the lack of qualified truck drivers is worsening, costs them money, and puts their operations at risk.
Emergence of the natural gas market as an alternative to diesel fuel – The lower cost of natural gas, along with growth in production and eventually in distribution, make this a trend companies are watching and Ohio equipment manufacturers can capitalize upon.

ACCESS OHIO 2040
2. OHIO’S FREIGHT SYSTEM Ohio is a crossroads state with a mature, intermodal transportation system. Some elements of the freight system are aging and in need of investment, there is overcapacity of some modes, and significant new investments in intermodal rail hubs. The following sections profile the major freight modes in Ohio.
2.1.1 Rail The Ohio freight rail network is a mature system consisting of the major North American carriers (CSX, NS, and CN), as well as significant regional carriers and short-line railroads. Ohio was a bellwether for national rail trends, as Class I railroads abandoned significant miles of rail lines in the 1970s and 1980s, or sold some unprofitable branch lines to short-line carriers.
Even though Ohio has lost thousands of rail miles over the years, the system is carrying record amounts of tonnage on few miles. In terms of financial health and infrastructure, Ohio rail infrastructure is in excellent condition, with adequate investment, efficient switching terminals, good operating speeds, and significant investments in new intermodal facilities. In support of double-stack container operations, CSX and NS have invested a significant amount of private and public funds to raise tunnels and bridges to increase intermodal container train productivity.
In terms of infrastructure conditions, Ohio rail carriers operate over a “legacy” system that was largely designed in the late 1800s, with significant urban development and road growth since. Thus, rail lines through central business districts are often constrained by capacity, curvature, and grade crossings with other railroads—for example, in Cincinnati (Mill Creek Valley), Toledo (Vickers Crossing), and Columbus (Scioto Tower)—to name a few. It is usually quite cost-prohibitive to eliminate these chokepoints.
Beyond the large rail companies, short-line carriers vary in their capital structure and their ability to maintain a system of good repair, which results in some deficient short-line railroads. Also, smaller railroads have a more difficult time upgrading their rail and bridges to accommodate today’s standard 286,000 pound railcars, which can affect the viability of their operations.
2.1.2 Maritime Through the Great Lakes and the Ohio River, Ohio has access to two of the nation’s largest inland waterway systems as well as the Gulf of Mexico and the North Atlantic Ocean. Great Lakes traffic is dominated by bulk cargo shipment, with some international trade of general cargo (primarily steel) via the St. Lawrence Seaway (the Seaway). The state is home to eight ports on Lake Erie. Three ports (Toledo, Cleveland, and Ashtabula) stand out in terms of their capabilities and cargo volume, while the others have moved considerably less in recent years. The Port of Toledo, including seven miles on the Maumee River, supports a large, general cargo dock and terminals that handle grain, coal, petroleum products, and iron ore. The Port of Cleveland includes general cargo facilities and terminals for limestone, gravel, salt, cement, iron ore, and petroleum products. The Port of Ashtabula includes the

2-2 Section 2 Ohio’s Freight System
ACCESS OHIO 2040
outer harbor and 1.7 miles of the Ashtabula River, a general cargo facility, and an NS Railroad terminal for coal, limestone, and iron ore. It has by far the greatest storage capacity for bulk commodities in Ohio. Ports in Sandusky, Huron, Lorain, Fairport Harbor, and Conneaut operate at different levels of facility development but primarily handle only bulk shipments of coal, limestone, iron ore, cement, stone, and salt.
On the Ohio River, commercial navigation is made possible through a series of locks and dams that raise and lower barges on this corridor and that connect Cairo, Illinois, to Pittsburgh, Pennsylvania. These facilities are maintained by the U.S. Army Corps of Engineers (USACE). Slow speeds and low supply chain visibility limit the viability of this mode to bulk commodities such as coal, iron ore, and stone, or agricultural staples. Barge terminals are clustered in three principal regions along the Ohio River: Cincinnati, Portsmouth-Marietta, and the West Virginia Panhandle. Like Lake Erie ports, Ohio River terminals predominantly handle bulk cargo like coal, aggregate, iron ore, and chemical products. Some Ohio terminals can handle general cargo such as steel products, and the river is important for handling shipments of large products such as industrial machinery.
2.1.3 Highways and Trucking ODOT owns and maintains 49,000 miles of paved roadway and 15,000 bridges. Freight is carried over these rights-of-way by trucks in private fleets, for-hire truckloads, less-than-full truckloads, and other specialized trucking services. The trucking mode is the most vital part of the state’s freight system, handling 97 percent of Ohio’s freight value.4 Trucks dominate freight carriage because they can reach every shipper and be flexible in terms of shipment size and schedule.
Trucks make up about 13 percent of the traffic on the state highway system (all state, U.S., and interstate routes) and 18 percent of traffic on the subset of Ohio’s interstate highways. Average daily truck traffic on Ohio interstate routes is about 10,500, and approached 15,000 on the heaviest truck routes: I-75 and I-70. Five-axle, semi-tractor trailers comprise 80 percent of the truck traffic on rural interstate highways, while urban truck traffic has a higher percentage of two- and three-axle vehicles like panel and dump trucks.
As a “crossroads” state, fully 34 percent of Ohio truck traffic is “overhead,” passing non-stop through the state. Another 41 percent of Ohio truck traffic is “internal,” originating and terminating in the state. The Ohio Turnpike (I-80/90) exemplifies an overhead truck route, with 69 percent of truck trips originating and terminating outside the state.
2.1.4 Air Cargo Ohio was once home to the most air-cargo hubs of any state in the nation, but drastic changes in the industry have caused all but one to close (DHL still operates at the Cincinnati-Northern Kentucky Airport). The air-cargo business has shifted in three significant ways: (1) more shipments have shifted to trucks because of cost; (2) more air cargo is carried via passenger aircraft; and (3) FedEx and UPS have emerged as a near duopoly in expedited parcel shipments (with their primary hubs in Memphis and
4 FHWA FAF 3
Section 2 Ohio’s Freight System 2-3
ACCESS OHIO 2040
Louisville, respectively). Consequently, air-cargo hubs in Dayton, Wilmington, and Toledo have closed, and the Rickenbacker Airport was never able to retain an air-cargo carrier hub.
The Ohio Freight Study evaluated the capacity and condition of air-freight facilities at Wilmington, Toledo, Rickenbacker (Columbus), and Cincinnati-Northern Kentucky Airports. These facilities are in relatively good condition, with Wilmington and Cincinnati-Northern Kentucky facilities virtually new. In lieu of attracting new air-cargo hubs, which is increasingly unlikely, major investment should be toward converting these air-cargo operations to new uses.
Although air-hub operations may not be likely for these airports, there is still potential for substantial logistics operations, and with that potential, a need to improve connecting road networks. This is certainly the case at Rickenbacker Airport, where the state and local governments are funding a major road connector; recent improvements have been made at Cincinnati-Northern Kentucky Airport; and similar road improvements may be necessary to support the conversion of air-hub operations in Toledo.
2.1.5 Intermodal Container Facilities The major Ohio infrastructure development in the past 10 years has been the upswing in volume and investment in railroad container intermodal facilities. Ohio hosts 13 intermodal facilities in nine metropolitan areas, which is second only to Illinois in the number of statewide facilities. Figure 2-1 displays the principal facilities (of the two not shown, one is specialized and the other has been mothballed). Rail carriers, with the assistance of some public subsidies, have invested heavily in creating terminals bridging the modal capabilities of roadways, rail, and marine cargo. NS Railroad, with assistance from public grants, made major investments in the Rickenbacker Intermodal facility and double-stack clearance projects from Chicago, through Ohio to Norfolk, Virginia.
CSX opened the Northwest Ohio Integrated Logistics Center in North Baltimore in 2011. This facility is operationally focused to bypass Chicago in order to distribute intermodal freight east of the Mississippi via a hub and spoke arrangement. CSX is also currently expanding the Buckeye Yard in Columbus to double operating capacity to 300,000 containers per year.
2-4 Section 2 Ohio’s Freight System
ACCESS OHIO 2040
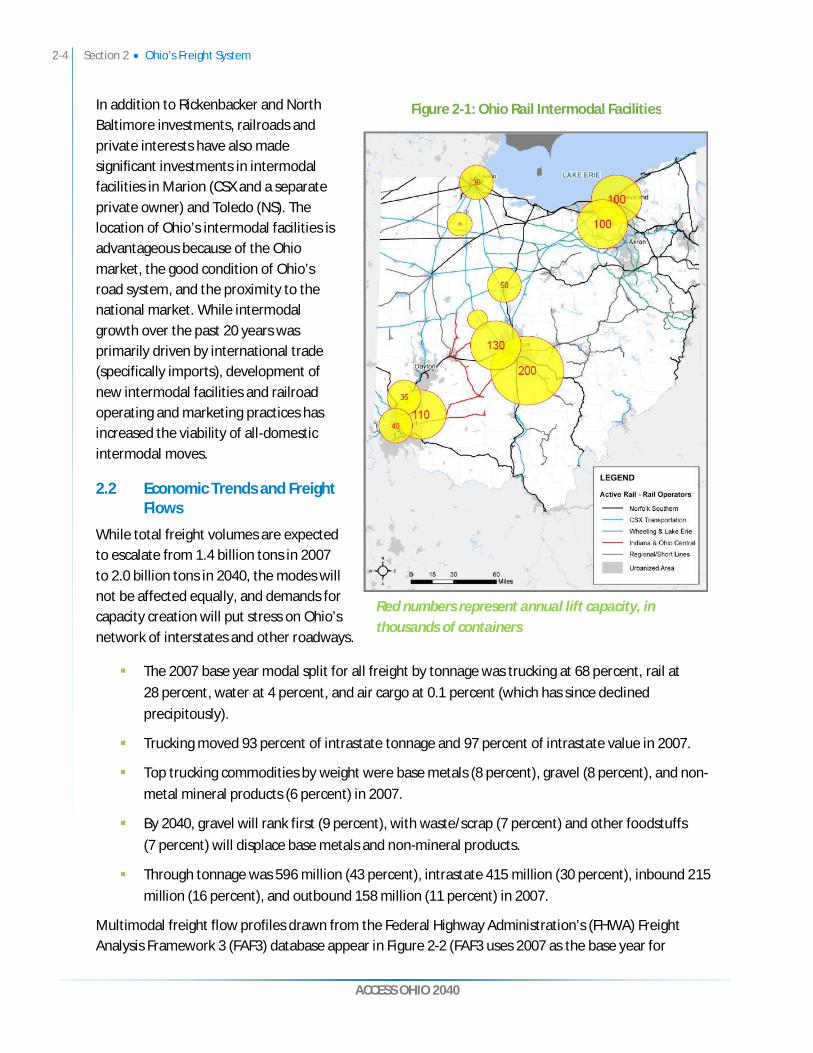
In addition to Rickenbacker and North Baltimore investments, railroads and private interests have also made significant investments in intermodal facilities in Marion (CSX and a separate private owner) and Toledo (NS). The location of Ohio’s intermodal facilities is advantageous because of the Ohio market, the good condition of Ohio’s road system, and the proximity to the national market. While intermodal growth over the past 20 years was primarily driven by international trade (specifically imports), development of new intermodal facilities and railroad operating and marketing practices has increased the viability of all-domestic intermodal moves.
2.2 Economic Trends and Freight Flows
While total freight volumes are expected to escalate from 1.4 billion tons in 2007 to 2.0 billion tons in 2040, the modes will not be affected equally, and demands for capacity creation will put stress on Ohio’s network of interstates and other roadways.
The 2007 base year modal split for all freight by tonnage was trucking at 68 percent, rail at 28 percent, water at 4 percent, and air cargo at 0.1 percent (which has since declined precipitously).
Trucking moved 93 percent of intrastate tonnage and 97 percent of intrastate value in 2007.
Top trucking commodities by weight were base metals (8 percent), gravel (8 percent), and non-metal mineral products (6 percent) in 2007.
By 2040, gravel will rank first (9 percent), with waste/scrap (7 percent) and other foodstuffs (7 percent) will displace base metals and non-mineral products.
Through tonnage was 596 million (43 percent), intrastate 415 million (30 percent), inbound 215 million (16 percent), and outbound 158 million (11 percent) in 2007.
Multimodal freight flow profiles drawn from the Federal Highway Administration’s (FHWA) Freight Analysis Framework 3 (FAF3) database appear in Figure 2-2 (FAF3 uses 2007 as the base year for
Figure 2-1: Ohio Rail Intermodal Facilities
Red numbers represent annual lift capacity, in thousands of containers
Section 2 Ohio’s Freight System 2-5
ACCESS OHIO 2040
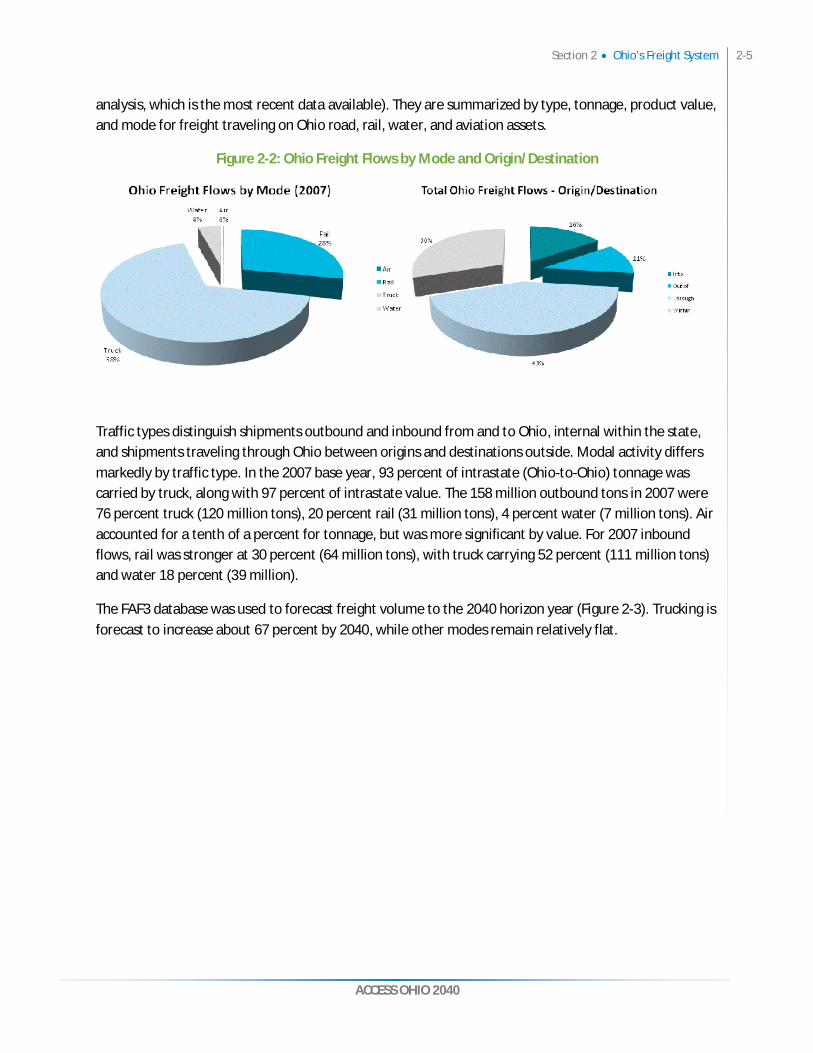
analysis, which is the most recent data available). They are summarized by type, tonnage, product value, and mode for freight traveling on Ohio road, rail, water, and aviation assets.
Figure 2-2: Ohio Freight Flows by Mode and Origin/Destination
Traffic types distinguish shipments outbound and inbound from and to Ohio, internal within the state, and shipments traveling through Ohio between origins and destinations outside. Modal activity differs markedly by traffic type. In the 2007 base year, 93 percent of intrastate (Ohio-to-Ohio) tonnage was carried by truck, along with 97 percent of intrastate value. The 158 million outbound tons in 2007 were 76 percent truck (120 million tons), 20 percent rail (31 million tons), 4 percent water (7 million tons). Air accounted for a tenth of a percent for tonnage, but was more significant by value. For 2007 inbound flows, rail was stronger at 30 percent (64 million tons), with truck carrying 52 percent (111 million tons) and water 18 percent (39 million).
The FAF3 database was used to forecast freight volume to the 2040 horizon year (Figure 2-3). Trucking is forecast to increase about 67 percent by 2040, while other modes remain relatively flat.
2-6 Section 2 Ohio’s Freight System
ACCESS OHIO 2040
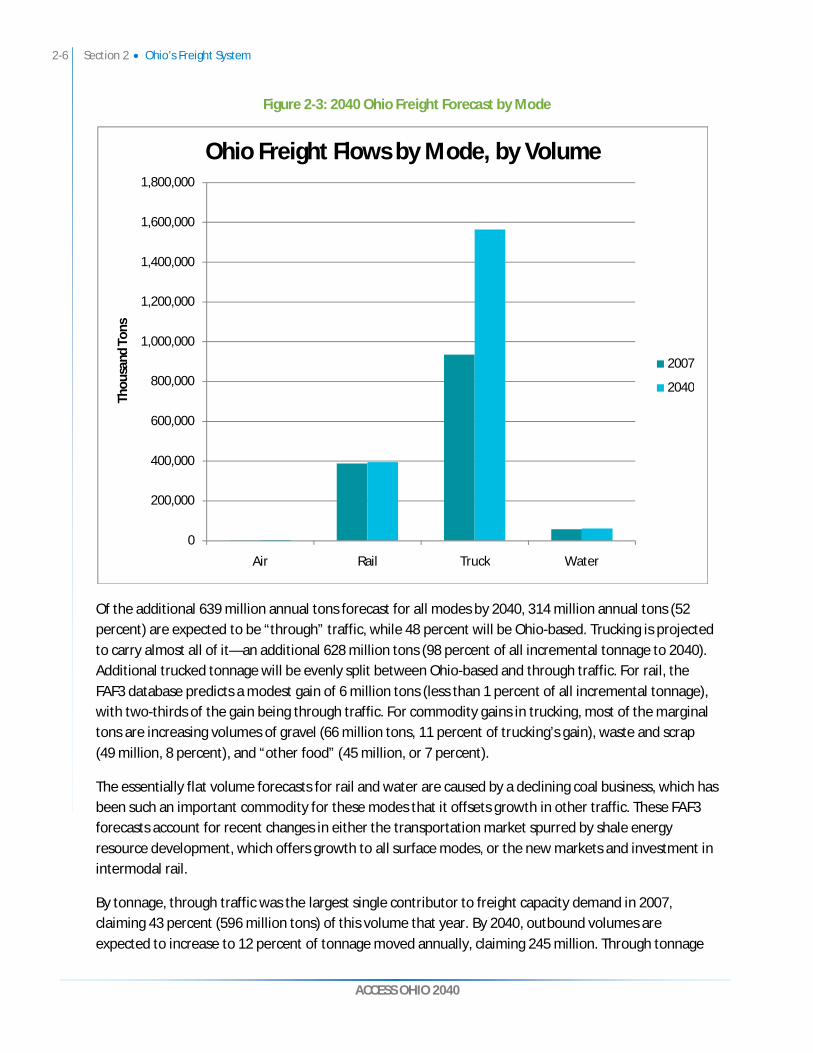
Figure 2-3: 2040 Ohio Freight Forecast by Mode
Of the additional 639 million annual tons forecast for all modes by 2040, 314 million annual tons (52 percent) are expected to be “through” traffic, while 48 percent will be Ohio-based. Trucking is projected to carry almost all of it—an additional 628 million tons (98 percent of all incremental tonnage to 2040). Additional trucked tonnage will be evenly split between Ohio-based and through traffic. For rail, the FAF3 database predicts a modest gain of 6 million tons (less than 1 percent of all incremental tonnage), with two-thirds of the gain being through traffic. For commodity gains in trucking, most of the marginal tons are increasing volumes of gravel (66 million tons, 11 percent of trucking’s gain), waste and scrap (49 million, 8 percent), and “other food” (45 million, or 7 percent).
The essentially flat volume forecasts for rail and water are caused by a declining coal business, which has been such an important commodity for these modes that it offsets growth in other traffic. These FAF3 forecasts account for recent changes in either the transportation market spurred by shale energy resource development, which offers growth to all surface modes, or the new markets and investment in intermodal rail.
By tonnage, through traffic was the largest single contributor to freight capacity demand in 2007, claiming 43 percent (596 million tons) of this volume that year. By 2040, outbound volumes are expected to increase to 12 percent of tonnage moved annually, claiming 245 million. Through tonnage
0
200,000
400,000
600,000
800,000
1,000,000
1,200,000
1,400,000
1,600,000
1,800,000
Air Rail Truck Water
Thou
sand
Ton
s
Ohio Freight Flows by Mode, by Volume
2007
2040
Section 2 Ohio’s Freight System 2-7
ACCESS OHIO 2040
will increase to 45 percent of tonnage moved that year (910 million), while inbound and intrastate totals decline slightly in approaching 2040, according to FAF3 estimates that predate the development of the Marcellus and Utica Shale plays. Differences in traffic type correspond to divergent usage of the highway freight system in Ohio.
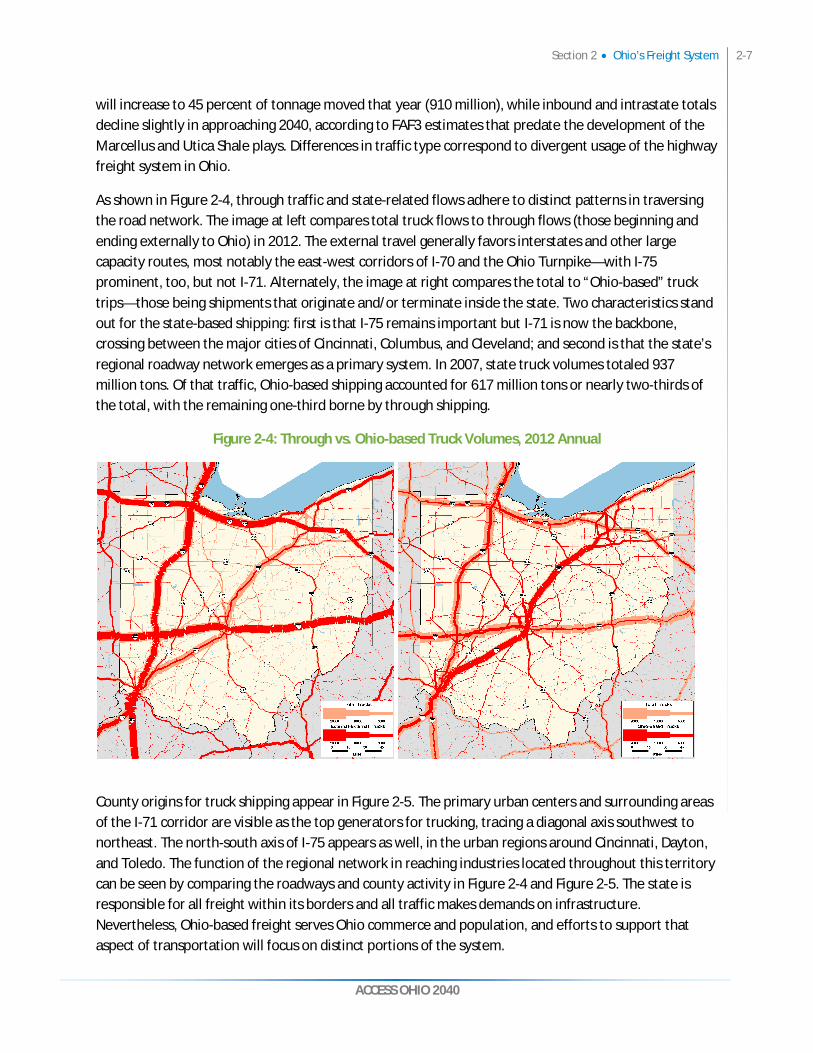
As shown in Figure 2-4, through traffic and state-related flows adhere to distinct patterns in traversing the road network. The image at left compares total truck flows to through flows (those beginning and ending externally to Ohio) in 2012. The external travel generally favors interstates and other large capacity routes, most notably the east-west corridors of I-70 and the Ohio Turnpike—with I-75 prominent, too, but not I-71. Alternately, the image at right compares the total to “Ohio-based” truck trips—those being shipments that originate and/or terminate inside the state. Two characteristics stand out for the state-based shipping: first is that I-75 remains important but I-71 is now the backbone, crossing between the major cities of Cincinnati, Columbus, and Cleveland; and second is that the state’s regional roadway network emerges as a primary system. In 2007, state truck volumes totaled 937 million tons. Of that traffic, Ohio-based shipping accounted for 617 million tons or nearly two-thirds of the total, with the remaining one-third borne by through shipping.
Figure 2-4: Through vs. Ohio-based Truck Volumes, 2012 Annual
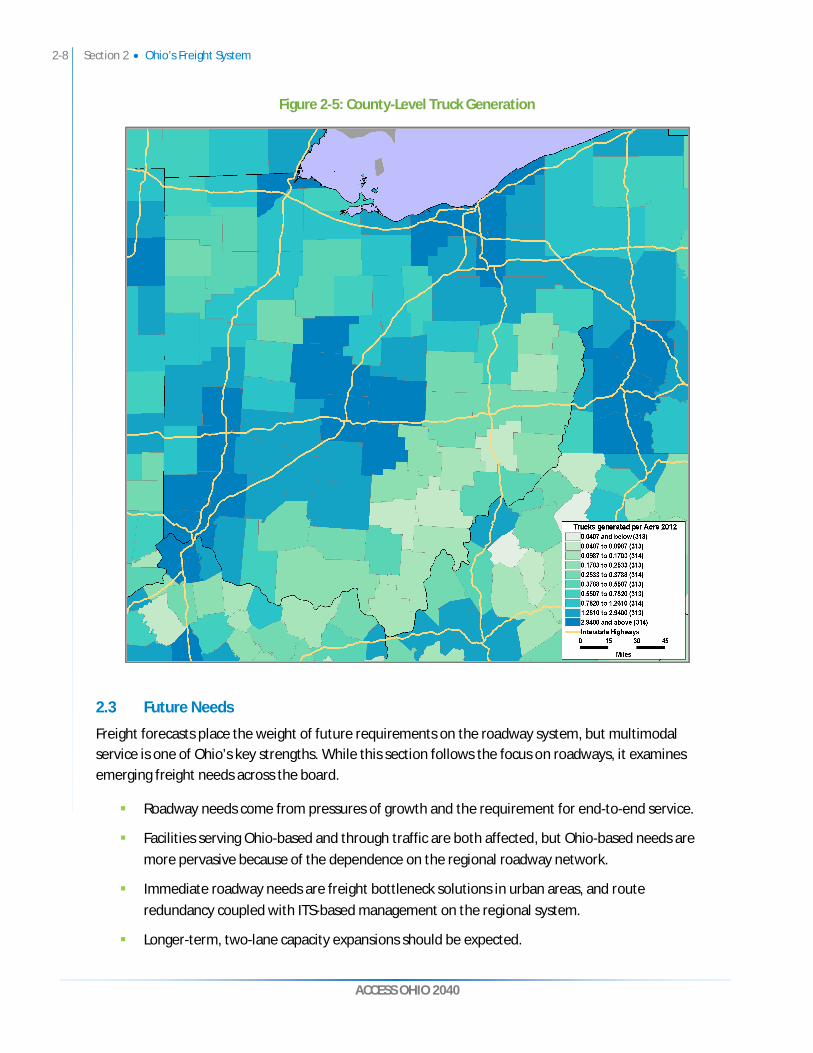
County origins for truck shipping appear in Figure 2-5. The primary urban centers and surrounding areas of the I-71 corridor are visible as the top generators for trucking, tracing a diagonal axis southwest to northeast. The north-south axis of I-75 appears as well, in the urban regions around Cincinnati, Dayton, and Toledo. The function of the regional network in reaching industries located throughout this territory can be seen by comparing the roadways and county activity in Figure 2-4 and Figure 2-5. The state is responsible for all freight within its borders and all traffic makes demands on infrastructure. Nevertheless, Ohio-based freight serves Ohio commerce and population, and efforts to support that aspect of transportation will focus on distinct portions of the system.
2-8 Section 2 Ohio’s Freight System
ACCESS OHIO 2040
Figure 2-5: County-Level Truck Generation
2.3 Future Needs
Freight forecasts place the weight of future requirements on the roadway system, but multimodal service is one of Ohio’s key strengths. While this section follows the focus on roadways, it examines emerging freight needs across the board.
Roadway needs come from pressures of growth and the requirement for end-to-end service.
Facilities serving Ohio-based and through traffic are both affected, but Ohio-based needs are more pervasive because of the dependence on the regional roadway network.
Immediate roadway needs are freight bottleneck solutions in urban areas, and route redundancy coupled with ITS-based management on the regional system.
Longer-term, two-lane capacity expansions should be expected.

Section 2 Ohio’s Freight System 2-9
ACCESS OHIO 2040
Rail bottlenecks are present, but solutions mostly fall to the private sector.
Rail needs are arising in the shale oil territory in Southeast Ohio, and systematic implementation of 286,000 pound track capability remains desirable.
Dredging for Lake Erie ports and lock and dam upgrades on the Ohio River are the main requirements on a waterway system that otherwise has adequate capacity.
Because of market shifts, air cargo requirements are mostly limited to efficient facility access.
2.3.1 Problem Areas A strong freight network is crucial to retaining and attracting businesses and jobs, because network performance shapes the logistics performance that Ohio businesses use to compete. There are two pillars to competitive performance. The first is fast, reliable, productive freight service for which the risks of disruption are managed and the pressures of growth on the network are addressed. The location of those pressures appear on Figure 2-6 as dark colored 2040 total truck volumes surrounding the lighter colored volumes of today. The evident pattern is that pressure will pervade the system, with heavy growth from both through and Ohio-based traffic, and capacity needs will be broad-based.
The second pillar is freight service end-to-end—from pick-up at shippers’ doors to delivery to the receivers’ doors—because the premise of freight shipment is that buyer’s receive the goods. It is no more satisfactory (or effective) for a network to perform well only part of the way than for an online purchase to be delivered 30 miles instead of to someone’s home: the job is not finished and no one is happy. This means that the Ohio regional roadway network that connects to its towns and businesses and the urban network that cuts through to industrial parks and commercial zones are as much a part of competitive freight performance as the interstates. Moreover, this is the part of the system that provides service mainly to the Ohio-based traffic.
Figure 2-6: Total Truck Flows, 2012 (Light Shading) vs. 2040 (Dark Shading)
2-10 Section 2 Ohio’s Freight System
ACCESS OHIO 2040
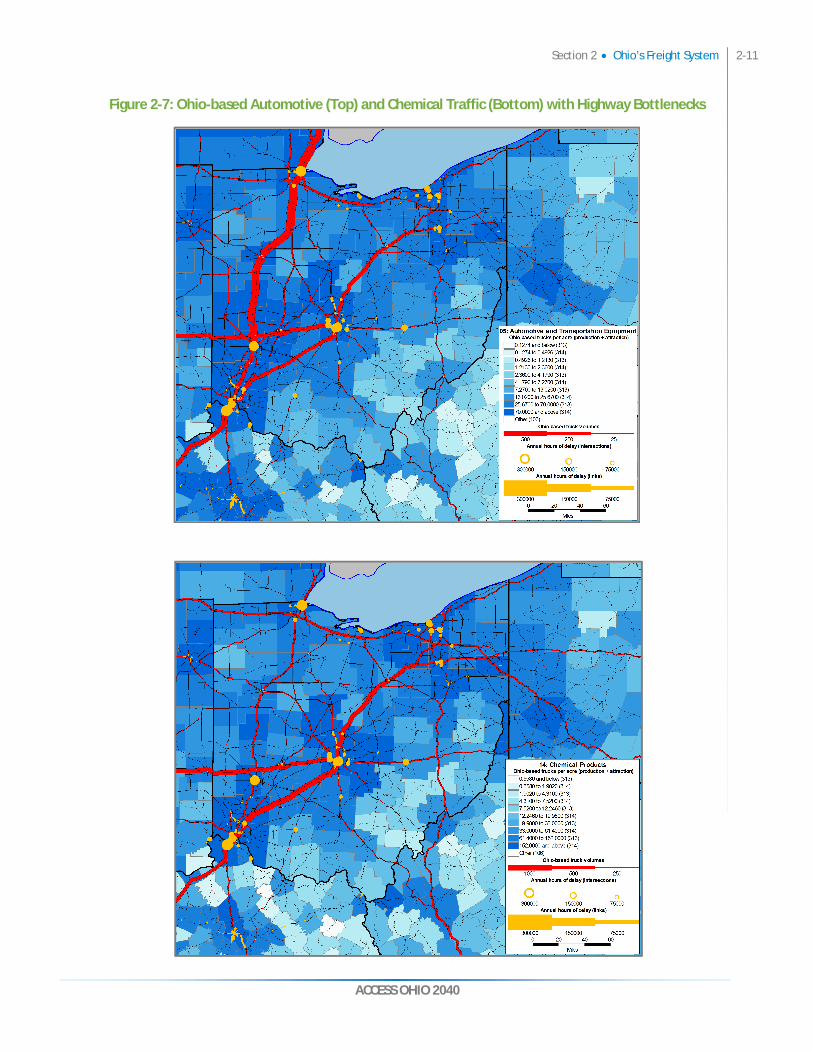
Figure 2-7 illustrates the challenges for the Ohio-based freight system. For automotive and chemical products—two industries targeted for development by Jobs Ohio—the maps show the amount of truck shipping picked up and delivered by county, the roadway volumes for Ohio-based shipping, and freight bottlenecks on the roadways. Three things stand out. First, the industries rely on different sections of the network, implying that support to these industries will require attention to different parts of the system. Second, both industries use the regional road network extensively, allowing them to ship from and serve customers in counties throughout much of the state. Third, the freight bottlenecks delaying service today are chiefly in the urban areas surrounding the I-71 and I-75 corridors. The implications for performance needs are a) that the urban networks require most of the immediate improvements (and projects at some bottlenecks are underway), and b) that service insurance on the regional system is more about intermittent disruption than chronic delay. The immediate regional solutions are route alternatives and ITS for roadway and logistics management. Nevertheless, as the effects of forecast growth and successful development take hold, the few bottlenecks on the regional network promise to proliferate. Longer term, there will be capacity needs on the system outside the cities.
Section 2 Ohio’s Freight System 2-11
ACCESS OHIO 2040
Figure 2-7: Ohio-based Automotive (Top) and Chemical Traffic (Bottom) with Highway Bottlenecks
2-12 Section 2 Ohio’s Freight System
ACCESS OHIO 2040
Other needs affecting truck performance range from rest areas to support productive compliance with tightened safety regulations, to shortages of qualified drivers, to fueling stations to exploit the growth in natural gas alternatives to diesel. Rail system needs include a series of choke points mainly on the Class I railways, which fall to the private-sector owners to address. Intermodal traffic should continue to expand, especially on corridors where railroads have been making investments; this affords modest highway relief but creates rising demand on roads accessing intermodal facilities. Completing track upgrade to the 286,000-pound industry weight standard is an important need on the short-line networks that feed the larger system, so that statewide rail operates seamlessly. Development of shale petroleum production in Southeast Ohio poses an increasing challenge and rail opportunity. Railroads are well suited to handle the great volumes of heavy bulk materials required for drilling, and have successfully carried raw products from other shale formations. However, the southeast part of the state lacks the rail corridor density that ensures service and has a high proportion of inactive rail lines. Private development of new rail services can help this Ohio industry grow with less new demand on local roads.
Marine facilities on Lake Erie operate at less than capacity. Even so, maintaining clear navigational channels through dredging—and the associated disposal of dredge material—is essential for ports to function. Dredging on the lakes is a federal responsibility for which funding is chronically undersupplied, and even the highest volume facilities have unmet needs. On the Ohio River, its terminals are mostly single user, with no capacity problems or growth impediments for markets where they are competitive. The challenge is on the river itself, whose capacity is capped by the slow operation and size limitations of an aging lock and dam infrastructure. There are nine structures on the Ohio-adjacent section of the river alone, while the federal Inland Waterways Trust Fund allows improvements to just two or three per year anywhere in the nation. With the stress placed by drought and floods on Mississippi River channels, Ohio River needs may be kept waiting.
The problems facing the air-cargo industry are largely economic and industry-wide. The top air-freight carriers continue to replace airplanes with high service truck networks wherever possible. Regional air hubs are consolidating in larger markets like Chicago and Detroit, with Ohio facilities facing reduced demand. The state’s more active cargo airports in Cincinnati and Columbus face challenges mainly from rising roadway congestion, affecting the truck feeder services that connect air cargo to customers on the ground. On-airport facility conditions are adequate, with decreased parking availability the greatest concern.
ACCESS OHIO 2040
3. CASE STUDIES IN STATEWIDE FREIGHT PLANNING One element of the Ohio statewide freight study was to examine best practices in freight planning from other states. Since initiating this study, a new federal transportation bill (MAP-21) was passed, which mandates that each state have a freight plan. By completing this statewide freight study, ODOT is well on its way to developing a MAP-21 compliant freight plan.
3.1 MAP-21 Freight Plan Requirements
The required components of MAP-21 compliant freight-planning documents are:
Freight system trends, needs, and issues
Freight policies, strategies, and performance measures to guide transportation investment
How the plan will improve the ability of the state to meet the national freight goals
Consideration of innovative technologies/operational strategies (such as ITS) that improve freight safety and efficiency
Description of improvements to reduce or impede freight deterioration on heavy vehicle routes
Inventory of facilities with freight mobility issues such as bottlenecks, and description of the strategies to address those issues
The following national freight goals are defined by the National Freight Policy (23 USC 167):
Improving the contribution of the freight transportation system to economic efficiency, productivity, and competitiveness
Reducing congestion on the freight transportation system
Improving the safety, security, and resilience of the freight transportation system
Improving the state of good repair of the freight transportation system
Using advanced technology, performance management, innovation, competition, and accountability in operating and maintaining the freight transportation system
Reducing adverse environmental and community impacts of the freight transportation system
3.2 Case Studies
In the past decade, freight plans nationwide have progressed from basic descriptive analyses of commodity flows and asset inventories to fully multimodal documents linking freight movement’s economic relationships with demographic changes, macroeconomic trends, and land use policies. The statewide freight study team evaluated freight plans from Maryland, Virginia, Minnesota, Indiana, and
3-2 Section 3 Case Studies in Statewide Freight Planning
ACCESS OHIO 2040
Michigan. The first two were included based on an informal recommendation from American Association of State Highway and Transportation Officials (AASHTO) as better examples of state freight plans, and the latter three as peer states for Ohio. The most outstanding or notable features of each state’s plan include the following:
Maryland
Includes specific projects and estimated construction/rehabilitation costs
The first state to incorporate analysis of land use policies into freight strategy
Key performance measures include travel time in freight-intensive corridors, expenses per mile for the trucking industry, and congestion cost/delay time at freight bottleneck areas.
Virginia
Articulates the connection between short-term project implementation and long-term strategy
Uses macroeconomic trends to shape policy and make funding decisions pertaining to capacity preservation and expansion.
Minnesota
Modal issues are addressed thematically.
Rail preservation was a key focal point in a state that moved a disproportionate volume of dry bulk tonnage.
Indiana
Most comprehensive platform for comparative evaluation of projects.
Identifies process by which projects are prioritized for advancement within Indiana Department of Transportation structure.
Michigan
One of a series of white papers produced as background to the new 2035 State Long Range Transportation Plan (LRTP), the Michigan Freight Profile supplies treatment of freight issues and strategies that the LRTP does not.
While freight volumes and values decreased substantially, the department of transportation recognizes its role in facilitating solutions to capacity limitations for users in-state, while participating in regional coordination efforts to affect policy changes that benefit the regional goods movement system.
Section 3 Case Studies in Statewide Freight Planning 3-3
ACCESS OHIO 2040
3.3 Implications for Freight Planning in Ohio: Best Practices
As freight planning continues toward greater degrees of sophistication and integration in larger statewide planning processes, MAP-21 should be read as a codification of what has already become best practice in statewide freight planning.
For the past decade, two of the legislation’s requirements—that plans outline freight system trends, needs, and issues, and that plans feature a description of improvements to reduce or impede freight deterioration—had long been basic elements of a freight plan. Minnesota’s plan is an example of this limited scope, in that the policy frameworks in its Statewide Freight Plan promote general ambitions rather than tools to quantitatively evaluate, compare, and prioritize freight infrastructure expenditures. In place of plans targeting discrete facilities, its strategies address topics such as stakeholder outreach and increased connectivity for state-owned systems of freight movement.
However, one substantial component of MAP-21 freight-planning compliance that may be new to some states is the requirement that performance deficiencies in specific facilities must be identified in tandem with strategies to improve, accompanied by an assessment of how these projects advance the aims of the state’s LRTP. The observation that the utility of a freight plan increases to the degree that its authors have engaged the detailed implications of its aims, strategies, and policy outcomes upon specific freight facilities is reinforced with a comparison of the freight plans reviewed here. Compelling arguments for investing in freight facilities deliver more insight than broad mission statements to increase access to markets, and were able to link specific mitigation strategies to near-term goals with opportunities for action in the future should funding allow. Virginia’s Multimodal Freight Study represents a best practice in explaining how short-term actions advance the state’s system toward its long-term goals. The project inventory of the Indiana plan is also noteworthy, though the Virginia study is more thorough in aligning individual freight asset expenditures with larger statewide strategy.
The most basic statewide freight plans addressed demographic and economic trends and their implications for freight consumption and origination in their states. Other plans broadened their analyses beyond the states’ borders to include the effects of technological advancements in freight-moving equipment, investments taking place in internationally impactful freight facilities (such as the Suez and Panama Canals and the Ports of Los Angeles and Long Beach), and industrial changes to systems of manufacturing and distribution. However, less common were freight plans that fully allowed these macro-level trends to not only preface their planning but to shape it. In anticipating global changes and preempting their impacts, the Virginia study is the most successful in presenting a palette of options that address capacity constraints the modes are expected to face in their forecast years.
MAP-21 mandates that plans include an inventory of facilities with freight mobility issues and description of the strategies to address those issues, while also describing freight policies, strategies, and performance measures to guide transportation investment. Notions of comparative effectiveness were included thematically in the earliest freight plans reviewed (Minnesota), in which the idea was popular with freight stakeholders consulted in interviews and outreach efforts. The most detailed description of a comparative effectiveness framework is found in the Indiana Multimodal Freight and Mobility Plan, which demonstrates the process through which forecast benefits are quantified,
3-4 Section 3 Case Studies in Statewide Freight Planning
ACCESS OHIO 2040
converted to comparable units in multiple platforms (including the State Travel Demand Model), monetized, annualized, and then gauged for their economic impacts in proprietary economic modeling software. The Virginia study also evaluates projects through multiple processes: highway model analysis, monetized transportation benefit analysis, and monetized economic benefit analysis.
However, the Indiana Department of Transportation’s (DOT) experience in comparative project evaluation does provide one caveat. Despite the evaluation framework’s comprehensive design, full calculation of all benefit categories for most projects was halted as transportation planners were unable to accurately supply data substantiating the economic development and jobs-creation impacts of the projects that they sought to rank. Additionally, the scoring process advantaged projects accommodating high traffic volumes and congestion on the interstate highway system, to which Indiana DOT planners then appended an additional priority rating to achieve a qualitatively informed balance. A lesson derived from this comprehensive approach is that evaluation platforms must be built upon data demands that are sustainable.
After prioritization and selection, project implementation and recurring planning activities should also promote concrete “next steps” for DOT and metropolitan planning organization (MPO) officials. Maryland’s Statewide Freight Plan included a step of delegating responsibility for project components to distinct process owners who would oversee the review and adoption of prioritized projects, identify funding, raise awareness, form institutional support through outreach, and maintain continuous dialogue with an expanded stakeholder group while planning. (The Freight Advisory Committee assists in this capacity in some states.)
Finally, many of the plans sought to further identify and leverage opportunities for multi-state freight corridor planning and preservation. The Midwest America Freight Coalition in which Ohio participates is an example of a method to foster this, as are the state’s efforts to share planning considerations with its neighbors. Another practical opportunity for this to occur is presented in capacity preservation for Ohio River freight facilities, since the river both defines state boundaries and DOT accountability and responsibility.
ACCESS OHIO 2040
4. OHIO FREIGHT STRATEGY DEVELOPMENT Based on the analysis of freight trends, system deficiencies, and emerging opportunities, the following strategies were developed and evaluated to estimate their impact on the Ohio freight system. They are presented based on mode.
4.1 Truck Strategy Development
There were a number of policies considered for the improvement of truck mobility and efficiency. Some of the policies, such as an increase in truck weight and increase in truck speed limits, were legislative proposals made in 2013. These and other strategies were evaluated, though not necessarily recommended:
Identifying a strategic roadway freight network, which would qualify for higher federal share of capital improvement funding
Operations strategies for a strategic roadway freight network
Public options to address the persistent truck driver shortage
Addressing truck parking issues through public-private partnerships
Developing a liquid natural gas (LNG) fuel network for commercial vehicles
Increasing truck weights
Increasing truck speed limits
Testing expansion of the routes for long combination vehicles (LCV)
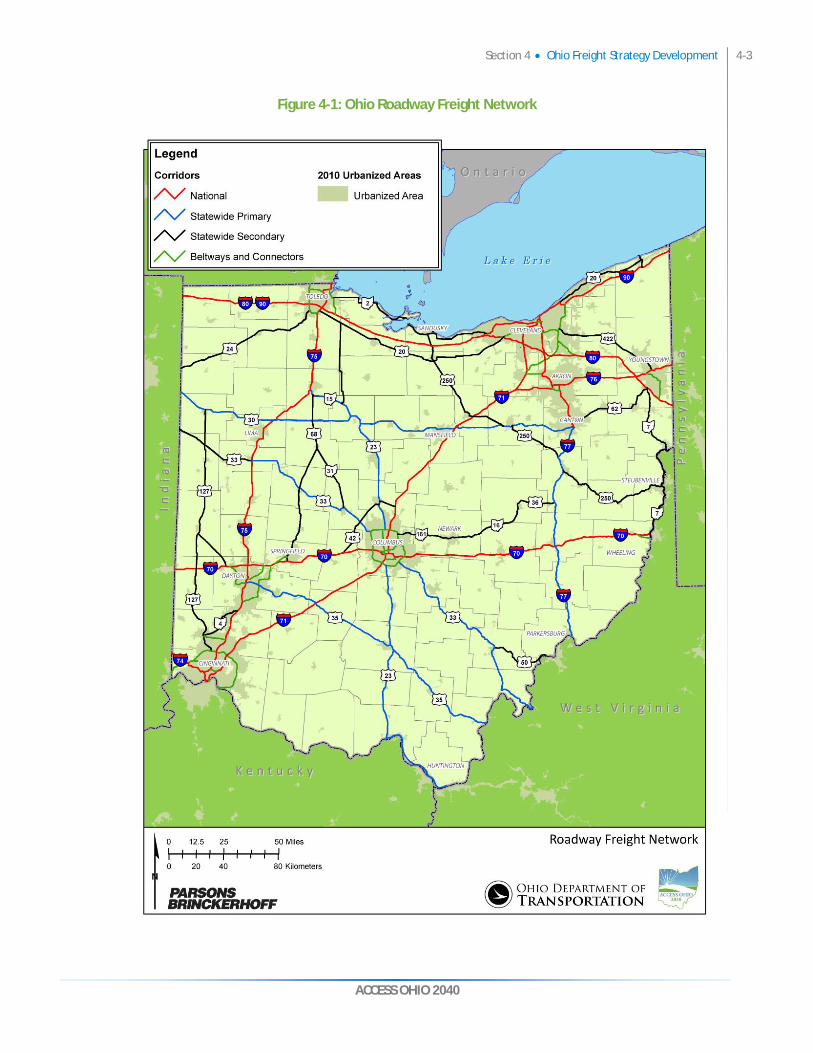
4.1.1 Developing a Roadway Freight Network The roadway freight network of Ohio (Figure 4-1) captures the main system for truck travel across the state within the overarching Access Ohio system. The interstate highways are the freight network’s backbone, and all of them are included because trucking makes heavy use of interstates everywhere in Ohio. Regional roadways form the rest of the network, penetrating the economic geography of the state and reaching Ohio’s production, distribution, and population centers.
This network is designed to meet Ohio’s needs. The facilities it includes were developed according to a number of considerations:
Patterns of freight traffic, and the location of industry and consumers
Requirements of Ohio-based and through truck traffic
4-2 Section 4 Ohio Freight Strategy Development
ACCESS OHIO 2040
Access to other freight modes
Connectivity between roadways and to outside markets
Observed truck volumes
Alternative routes, to ensure service in case of congestion or disruption
The result is a broadly balanced and robust network for roadway freight. It serves the commerce and communities of Ohio well, and helps the state to invest its management and financial resources where they can have the most effect on freight travel.
Section 4 Ohio Freight Strategy Development 4-3
ACCESS OHIO 2040
Figure 4-1: Ohio Roadway Freight Network
4-4 Section 4 Ohio Freight Strategy Development
ACCESS OHIO 2040
4.1.2 Capital Investments in Trucking Bottlenecks Highway bottlenecks affecting truck movements were identified in Ohio and neighboring states by the Mid-America Freight Coalition in 2009, using data from 2006, and have been illustrated earlier in this report. The Ohio roadway freight network had over 150 bottlenecks, falling into three types:
Interchanges, between freeways or between freeways and major arterials;
Lane drops; and,
Signalized intersections.
As the map below portrays, nearly all freight bottlenecks lie in urbanized areas, and most of them affect national corridors, beltways and connectors. Lane drops and interchange constraints are the most common types, and occur together about half the time. Trucks are tied up for millions of hours each year in these locations, imposing many times that in dollar costs to truck lines and businesses. Of course, highway bottlenecks affect all traffic - passenger vehicles as well as freight - so the value of correcting them usually is much greater, and all the more so in population centers.
Ohio DOT already has been addressing some of the worst truck bottleneck delays identified here, through its improvements on I-75 and the interstates around Columbus. However, federal MAP-21 legislation offers an opportunity to build on this effort. Where federal participation is usually 80 percent of the total project cost, projects treating freight mobility constraints can be eligible under MAP-21 for federal matching dollars at 90 to 95 percent, allowing Ohio’s capital budget for transportation to be stretched further.
Taking three factors together - the MAP-21 freight match, the importance of freight mobility to the Ohio economy and its prospects for growth, and the correlation of freight bottlenecks with urbanized areas where passenger vehicle traffic is heavy – makes a strong case for a concerted capital program to reduce bottlenecks on the roadway freight network.

Section 4 Ohio Freight Strategy Development 4-5
ACCESS OHIO 2040
Figure 4-2: Truck Bottlenecks on the Ohio Roadway System
4-6 Section 4 Ohio Freight Strategy Development
ACCESS OHIO 2040
The bottleneck map tells another story for the regional roadways - the non-interstate primary and secondary statewide corridors. Unsurprisingly, the pinch points on these facilities are signalized intersections and are located in urbanized areas; yet outside of Ohio’s top metropolitan regions, the number of bottlenecks is few, representing fewer than twenty percent of the state total. Some should also be targets of the capital improvement program, especially in the major population centers, and as Ohio grows, bottlenecks can be expected to proliferate on the regional system. Nevertheless, the conditions on this system are different, with congestion much less likely to be prolonged and chronic, and operational solutions more likely to be effective. Intermittent disruptions can be the source of the more serious mobility risks, as is explored next.
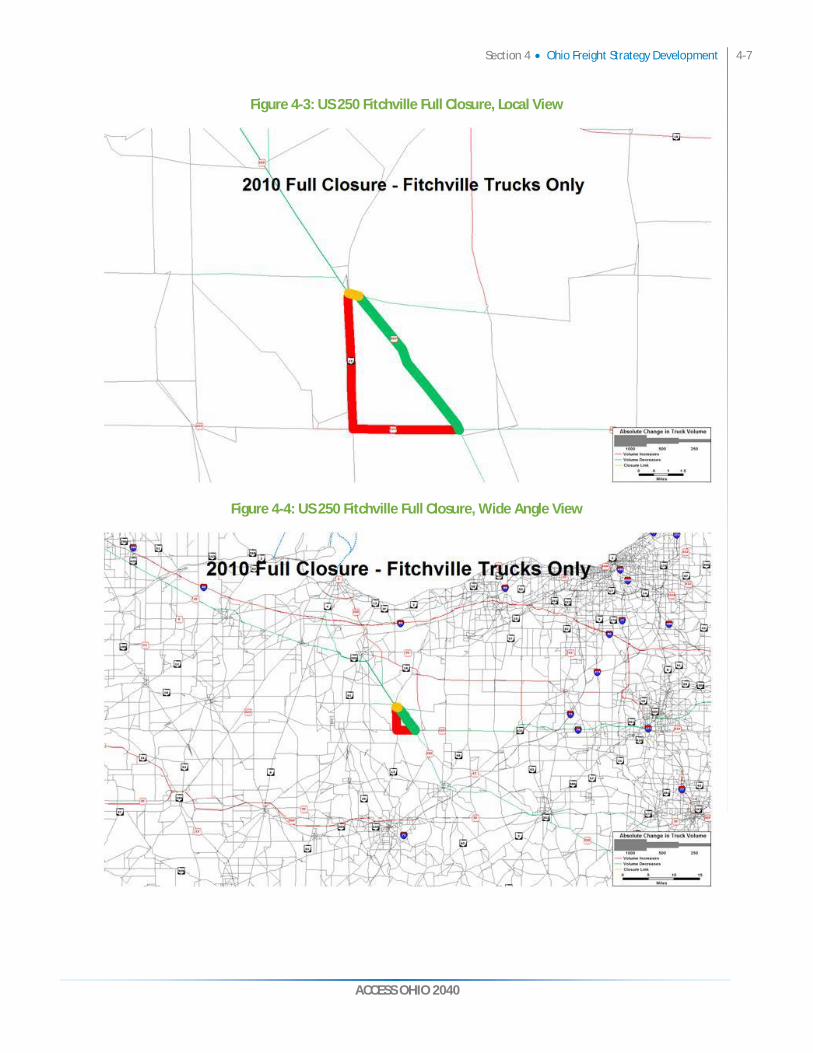
4.1.3 Operational Improvements and ITS on the Regional System The regional roadways of the Ohio freight network reach all around the state, and include many two-lane facilities in areas where good alternative truck routes may be lacking. To examine the repercussions of disruption on the regional system, the Ohio freight study tested road closures for a pair of two-lane routes on the roadway freight system:
US 250, with closure at Fitchville east of SR 13
US 68, with closure south of Kenton
Disruption could have any number of causes: weather events, accidents, public gatherings, and construction are examples. Closures were tested with the ODOT statewide model for base year 2010, using two variations:
Partial closure, removing half the capacity in each direction and causing a fifteen-minute delay to all traffic;
Full closure, removing all capacity in both directions and preventing all traffic from getting through on the route.
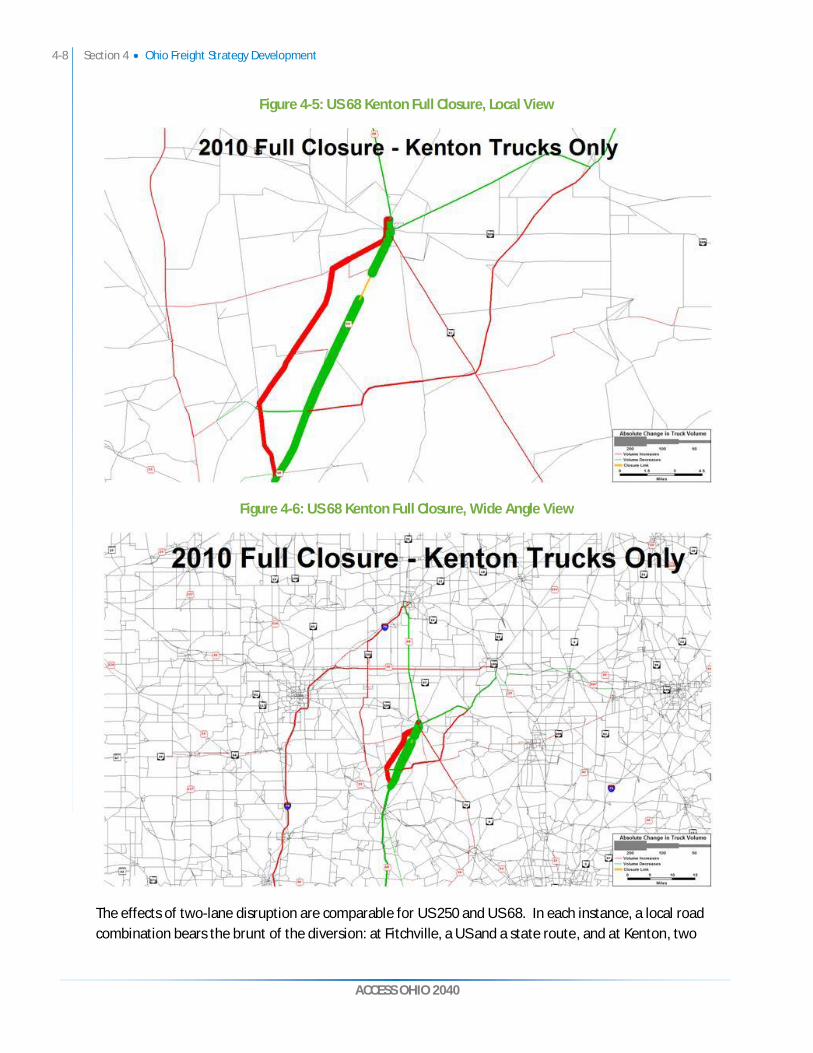
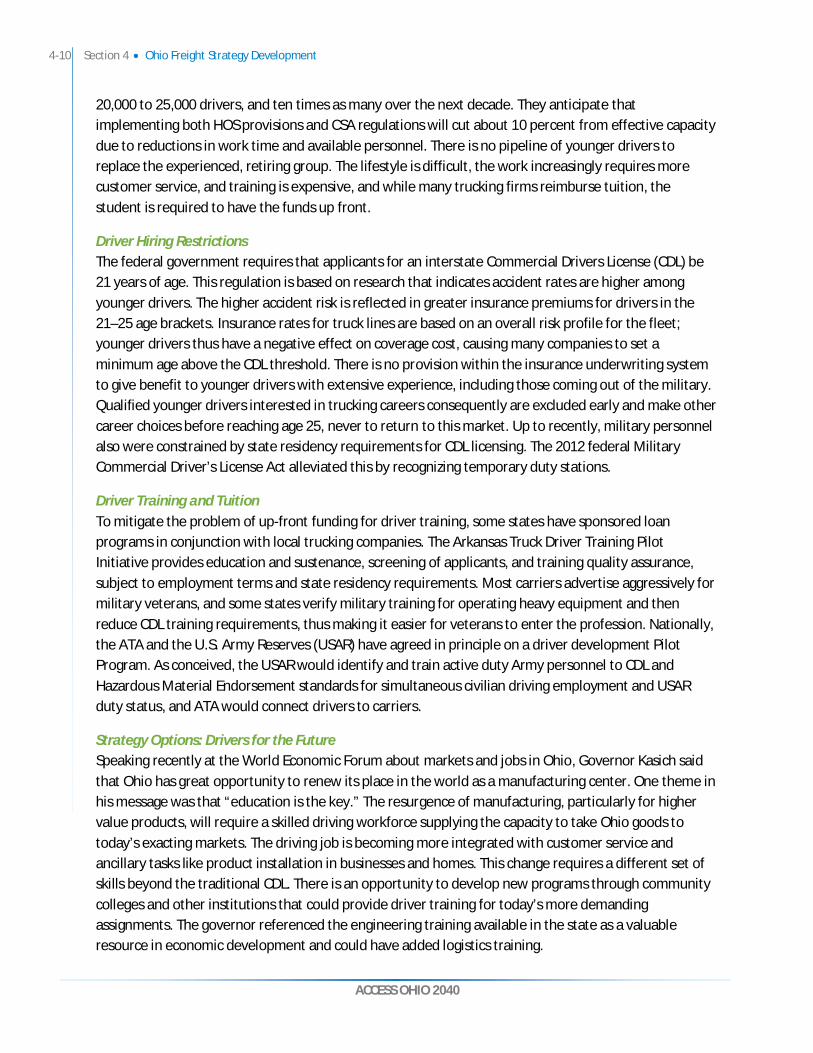
In each case, closure persists for an entire day, but vehicles are assumed to receive sufficient information to anticipate it, and seek other travel routes. The results for trucks are displayed in the following series of maps. The closures affect passenger activity as well, and the model allows re-routing to ramify: traffic pushed from one road to another pushes that road’s traffic in turn. The maps show the point of closure in yellow, roads with traffic decreases in green, and roads with increases in red. The width of lines corresponds to volume, and changes are depicted only when they affect more than five trucks; however, scales are different, and US 250 volumes are higher. For simplicity, just the full closure results are presented below, but with two views: the local area surrounding the disruption point, and a wide angle capturing repercussions on the larger network. The partial closures proved quite similar to the full, in terms of the roadways affected in both views.
Section 4 Ohio Freight Strategy Development 4-7
ACCESS OHIO 2040
Figure 4-3: US 250 Fitchville Full Closure, Local View
Figure 4-4: US 250 Fitchville Full Closure, Wide Angle View
4-8 Section 4 Ohio Freight Strategy Development
ACCESS OHIO 2040
Figure 4-5: US 68 Kenton Full Closure, Local View
Figure 4-6: US 68 Kenton Full Closure, Wide Angle View
The effects of two-lane disruption are comparable for US 250 and US 68. In each instance, a local road combination bears the brunt of the diversion: at Fitchville, a US and a state route, and at Kenton, two

Section 4 Ohio Freight Strategy Development 4-9
ACCESS OHIO 2040
state routes and a county road. Diversions also fan out to nearby facilities, affecting county roads in both cases. Moving further away in the wide views, diversions from US 250 and connecting routes occur for scores of miles in both directions, and traffic rises on other routes as distant as SR 2 and US 30. Kenton diversions from US 68 run the length of the route as far as the map displays, while trucks are moved onto other facilities westward past I-75 and eastward towards Mansfield. In short, the repercussions of two-lane disruptions are extensive, increasing truck miles of travel through circuitous routes of great variety, and adding truck volume to facilities that are part of the roadway freight network and to others that are not, among them county roads and bridges that are not designed for statewide freight demand.
The solution to this kind of mobility risk is to manage it. Operational preparations can be made in such forms as preferred alternative routing with signaling that can be changed to keep traffic moving, and cooperation between the state and local officials on planned reaction to freight network incidents. Information systems are a crucial aspect of this. First, they allow operating instructions to be relayed to appropriate authorities, and proactive route recommendations to be relayed to truck fleets and their customers. Second, deployment of ITS technology across the regional network makes disruptions rapidly visible and triggers the operational response. This response encompasses the actions of authorities and adapting by fleets, and also adjustments by supply chain companies whose factory production or store deliveries may be interrupted. Implementation of this strategy requires prioritization of the regional freight network for operational improvements and ITS installation, and should include methods for data feeds into the logistics management systems of freight carriers, manufacturers, and distributors.
4.1.4 Addressing Labor Shortage for Truck Drivers A primary concern for businesses in Ohio and throughout the country is the availability of adequate capacity for surface freight transportation. This is particularly true for the trucking industry, where the shortage of qualified drivers has persisted despite sluggish economic conditions. Capacity in the trucking sector is already tight and demand could quickly outpace availability as the economy improves. While local and regional driving jobs are more desirable and the risk is highest for longer-haul activities, no segment is immune. The drain on capacity is coming from multiple sources:
Aging driver population (average U.S. truck driver age is 50)
Inability to recruit and hire new drivers
Attrition due to economic pressure and the anticipated effects of the new Compliance, Safety, and Accountability Program (CSA) of the Federal Motor Carrier Safety Association
Reduced productive time due to new Hours of Service (HOS) regulations
Loss of capacity utilization from congestion and adequate parking facilities for driver rest
Driver Shortage The American Trucking Association (ATA) recently asserted that 90 percent of U.S. truck lines cannot find enough drivers who will meet federal standards, creating a shortfall now in the truckload sector of
4-10 Section 4 Ohio Freight Strategy Development
ACCESS OHIO 2040
20,000 to 25,000 drivers, and ten times as many over the next decade. They anticipate that implementing both HOS provisions and CSA regulations will cut about 10 percent from effective capacity due to reductions in work time and available personnel. There is no pipeline of younger drivers to replace the experienced, retiring group. The lifestyle is difficult, the work increasingly requires more customer service, and training is expensive, and while many trucking firms reimburse tuition, the student is required to have the funds up front.
Driver Hiring Restrictions The federal government requires that applicants for an interstate Commercial Drivers License (CDL) be 21 years of age. This regulation is based on research that indicates accident rates are higher among younger drivers. The higher accident risk is reflected in greater insurance premiums for drivers in the 21–25 age brackets. Insurance rates for truck lines are based on an overall risk profile for the fleet; younger drivers thus have a negative effect on coverage cost, causing many companies to set a minimum age above the CDL threshold. There is no provision within the insurance underwriting system to give benefit to younger drivers with extensive experience, including those coming out of the military. Qualified younger drivers interested in trucking careers consequently are excluded early and make other career choices before reaching age 25, never to return to this market. Up to recently, military personnel also were constrained by state residency requirements for CDL licensing. The 2012 federal Military Commercial Driver’s License Act alleviated this by recognizing temporary duty stations.
Driver Training and Tuition To mitigate the problem of up-front funding for driver training, some states have sponsored loan programs in conjunction with local trucking companies. The Arkansas Truck Driver Training Pilot Initiative provides education and sustenance, screening of applicants, and training quality assurance, subject to employment terms and state residency requirements. Most carriers advertise aggressively for military veterans, and some states verify military training for operating heavy equipment and then reduce CDL training requirements, thus making it easier for veterans to enter the profession. Nationally, the ATA and the U.S. Army Reserves (USAR) have agreed in principle on a driver development Pilot Program. As conceived, the USAR would identify and train active duty Army personnel to CDL and Hazardous Material Endorsement standards for simultaneous civilian driving employment and USAR duty status, and ATA would connect drivers to carriers.
Strategy Options: Drivers for the Future Speaking recently at the World Economic Forum about markets and jobs in Ohio, Governor Kasich said that Ohio has great opportunity to renew its place in the world as a manufacturing center. One theme in his message was that “education is the key.” The resurgence of manufacturing, particularly for higher value products, will require a skilled driving workforce supplying the capacity to take Ohio goods to today’s exacting markets. The driving job is becoming more integrated with customer service and ancillary tasks like product installation in businesses and homes. This change requires a different set of skills beyond the traditional CDL. There is an opportunity to develop new programs through community colleges and other institutions that could provide driver training for today’s more demanding assignments. The governor referenced the engineering training available in the state as a valuable resource in economic development and could have added logistics training.
Section 4 Ohio Freight Strategy Development 4-11
ACCESS OHIO 2040
While it would be difficult for the state to affect insurance rates nationwide, there is potential for insurance rates for intrastate drivers to be subsidized in some way that would allow younger people with good driving records to choose a trucking career. Coupled with an enhanced CDL program and placing special emphasis on unemployed, honorably discharged veterans, a state agency like the Department of Jobs and Family Services might make the case to state insurers that young drivers prequalified in this way would form a better risk group than others in their age bracket. A regional coalition (particularly one involving Michigan) could add leverage in negotiating with insurers, and could be beneficial by opening a larger pool of potential employees to operate over a broader region, inclusive of the areas important to the automotive industry. Strong trucking capacity would offer a material advantage to businesses in the region, whether located here now or deciding where to expand.
4.1.5 Developing Truck Parking through Public-Private Partnerships This section considers the impact of privatization on the service provision of truck parking and rest areas, and their policy import.
Commercial Vehicle Parking The American Transportation Research Institute (ATRI) indicates that insufficient access to parking for rest breaks ranked number eight on the list of the top ten trucking industry concerns in 2012. The organization completed a short survey of 242 drivers and 93 carriers, revealing that the two most common concerns related to lack of parking were driver fatigue management and the ability to comply with tightening HOS regulations. These concerns were echoed in the carrier interviews done in conjunction with this study. The issues of safety and compliance are critical to the industry as a whole and were consistently repeated as linked to the availability of parking in the interviews. A less obvious aspect is the effect that the parking shortage has on equipment and driver utilization. In order to secure parking to complete the requisite break time, drivers often have to stop short of their full complement of driving hours, reducing their effective utilization. This contributes to the capacity concerns the industry is facing due to the decreasing population of qualified drivers, a topic discussed previously. Thus, the availability of adequate commercial vehicle parking is a safety, compliance, and productivity concern.
Ohio Rest Area Commercialization Efforts Over time, states have become interested in expanding public and private cooperation in the provision of parking to leverage investment dollars and improve services. One potential solution that could create more truck parking is the public-private partnership model.
ODOT spends almost $50 million annually to maintain all 104 rest areas in Ohio. Rest area maintenance costs include paying gas, water, electric and sewage bills, as well as mowing grass, resurfacing parking lots, improving buildings and paying for janitorial and housekeeping services.
Ohio has considered converting non-interstate rest areas into privately run service plazas, where motorists could buy fuel, food, and other things in one stop. In 2012, ODOT launched the Sponsorship, Maintenance, Advertising and Revenue Targeted (SMART) program to permit advertising and sponsorship opportunities at interstate rest areas and welcome centers throughout Ohio. The idea being
4-12 Section 4 Ohio Freight Strategy Development
ACCESS OHIO 2040
that money saved or generated by these initiatives could be put directly into the agency’s capital budget to speed up the construction of ODOT’s major new transportation projects.
In mid-2012, the state proposed converting five of the state’s 59 non-interstate rest areas to service centers similar to what currently exists on the Ohio Turnpike. The five included two on U.S. Route 50 in Athens County, two on U.S. Route 33 in Hocking County and one on U.S. Route 23 in Pickaway County. While there was strong interest expressed prior to the release of the request for proposals, there were no bids offered.
Developing Truck Parking through Public-Private Partnerships While Ohio has had uneven success in commercializing existing rest areas, a strategy focused on truck parking and facilities could be more fruitful. There are a number of considerations to address with this strategy:
Federal prohibition on commercialized rest areas: Federal law prohibits commercialization (such as long-term concessions) of rest area facilities located on the interstate highway system. This prohibition motivated Ohio to explore public-private partnerships for rest areas off the interstate highway system. Similarly, in creating public-private partnership opportunities for truck parking, locations will either need to be on U.S. or state system routes.
Business volume: It is possible that Ohio did not receive bids for its rest area partnership opportunities because the routes had low traffic volumes relative to other routes in the state. The optimum routes for commercial truck parking facilities would be near the I-70, I-71 and I-75 corridors.
Other location considerations: A number of truck stops and rest area facilities serve as “staging areas” for trucks scheduled to make deliveries in urban areas. Truck parking areas can be located at urban fringe locations to take advantage of land availability and cost.
Service offerings: Where other states have commercialized rest area facilities (on toll roads not governed by federal law), the key revenue stream is fuel sales. Fuel sales were not contemplated in Ohio’s rest area partnership offering. An obvious synergy would be an offering of compressed natural gas (CNG) or LNG fueling stations, which would stimulate that market. Natural gas fueling stations are also eligible for federal Congestion Mitigation and Air Quality funding, providing a potential source of capital funding for truck parking facilities.
Technology-based Options The University of Minnesota is leading a project that is testing a Truck Parking Availability System aimed at using technology—in this case, a network of cameras tied by wireless networks into a central database—to more effectively manage public truck-parking slots along the highway. Several other states are investigating similar ideas, including reservations systems. The developing systems are designed to get information to drivers and fleet managers via websites, cellphone apps, and strategically placed variable messaging signs. The technology-based ideas have wide support in the trucking industry; however, the reservation fees do not. Reservation systems present opportunities, but there are hurdles
Section 4 Ohio Freight Strategy Development 4-13
ACCESS OHIO 2040
to planning a schedule to match the rest area location with the trip plan and not affect the utilization of equipment and drivers.
4.1.6 Liquid Natural Gas (LNG) Fuel As a result of changes in the oil and gas market, the trucking industry is now seriously considering the widespread adoption of natural gas. The price of natural gas has fallen by half since 2007 as vast amounts of natural gas in shale rock formations have been unlocked. Meanwhile, diesel prices have continued to rise. With 3.2 million tractor-trailers on U.S. roads using nearly 25 billion gallons of diesel fuel annually, and natural gas up to $2 cheaper per gallon than diesel, it is clear that the trucking industry stands to save billions of dollars by switching to natural gas. Analysts expect up to 20,000 natural gas vehicles will be sold annually within the next few years, using the fuel in CNG or LNG forms. Trucks running on CNG have an operating range of 300-400 miles, and LNG reaches 500-600 miles. These distances correspond generally to the workday ranges of regional and long-haul fleets, implying that different fuel forms may suit local versus interstate trucking. To facilitate the adoption of natural gas, trucking companies are collaborating with natural gas distributors and clean energy advocates to solve the “chicken and egg” issue of deciding which comes first: natural gas trucks or refueling stations. Each requires a significant investment that cannot be recouped without the other.
Benefits The biggest benefit of using natural gas is that it costs significantly less than diesel fuel and is expected to do so for the foreseeable future. This is advantageous to Ohio shippers, to freight carriers, and ultimately to Ohio consumers. Reserves in the Ohio shale fields, coupled with the ability of the state’s truck (and automobile) manufacturers to produce vehicles fueled by it, makes natural gas a signally Ohio resource for the transportation sector. In addition, natural gas fuel reduces greenhouse gas emissions up to 30 percent in light-duty vehicles and 23 percent in medium- to heavy-duty vehicles, provided methane release is controlled. Emissions of criteria air pollutants also are lower—notably carbon monoxide, nitrogen dioxide, and particulate matter—because natural gas burns cleaner than diesel or gasoline. This is significant for Ohio’s non-attainment areas, especially those situated on major routes for trucks passing through the state, such as I-80/I-90 as it traverses the Cleveland region.
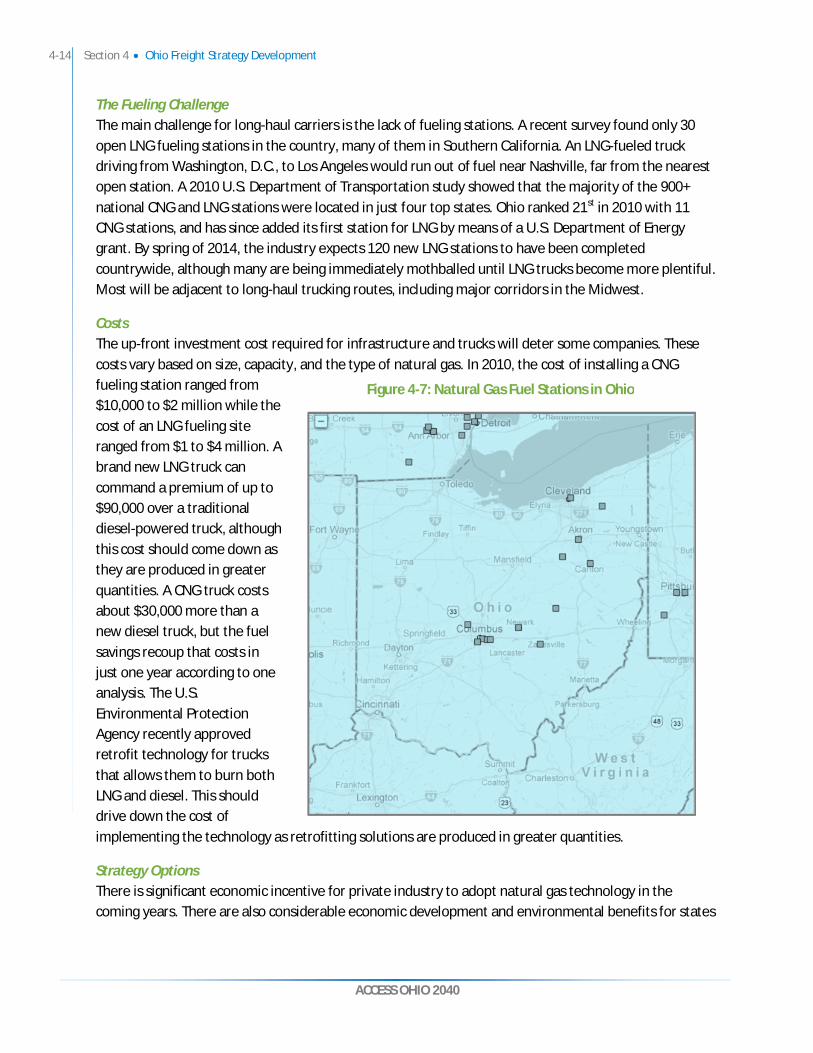
4-14 Section 4 Ohio Freight Strategy Development
ACCESS OHIO 2040
The Fueling Challenge The main challenge for long-haul carriers is the lack of fueling stations. A recent survey found only 30 open LNG fueling stations in the country, many of them in Southern California. An LNG-fueled truck driving from Washington, D.C., to Los Angeles would run out of fuel near Nashville, far from the nearest open station. A 2010 U.S. Department of Transportation study showed that the majority of the 900+ national CNG and LNG stations were located in just four top states. Ohio ranked 21st in 2010 with 11 CNG stations, and has since added its first station for LNG by means of a U.S. Department of Energy grant. By spring of 2014, the industry expects 120 new LNG stations to have been completed countrywide, although many are being immediately mothballed until LNG trucks become more plentiful. Most will be adjacent to long-haul trucking routes, including major corridors in the Midwest.
Costs The up-front investment cost required for infrastructure and trucks will deter some companies. These costs vary based on size, capacity, and the type of natural gas. In 2010, the cost of installing a CNG fueling station ranged from $10,000 to $2 million while the cost of an LNG fueling site ranged from $1 to $4 million. A brand new LNG truck can command a premium of up to $90,000 over a traditional diesel-powered truck, although this cost should come down as they are produced in greater quantities. A CNG truck costs about $30,000 more than a new diesel truck, but the fuel savings recoup that costs in just one year according to one analysis. The U.S. Environmental Protection Agency recently approved retrofit technology for trucks that allows them to burn both LNG and diesel. This should drive down the cost of implementing the technology as retrofitting solutions are produced in greater quantities.
Strategy Options There is significant economic incentive for private industry to adopt natural gas technology in the coming years. There are also considerable economic development and environmental benefits for states
Figure 4-7: Natural Gas Fuel Stations in Ohio
Section 4 Ohio Freight Strategy Development 4-15
ACCESS OHIO 2040
that lead the way in the conversion from traditional fuel sources to natural gas. Three strategies for the Ohio state government to support this conversion are:
Increasing the number of fueling stations
Expanding the number of LNG stations in non-attainment areas
Converting fleets from traditional to natural gas sources
Although the development of fueling stations is a private activity, it can be facilitated through regulatory and legislative actions that remove restrictions on the number or location of fueling stations. MAP-21 legislation provides a national framework that states can follow in promoting the growth of fueling stations. LNG is the standard most likely to be adopted by long-haul trucking due to its greater operating range. Long-haul truck traffic constitutes much of the through traffic in the state along the turnpike, I-70, and I-75. The through traffic traverses several metropolitan areas in air quality non-attainment status. Fueling stations should ideally be located along these through routes to encourage LNG vehicles. CNG vehicles are more likely to be regionalized and those fueling stations should be focused more on their areas of use.
Thus far, national proponents of natural gas adoption have focused on major interstates. Highways in Ohio also serve interstate longer-haul traffic—U.S. Routes 250, 24, and 30 are examples—and the regional system overall is vital for Ohio-based traffic. Many of Ohio’s industries, particularly agriculture and automotive manufacturing, are supported by regional sources and vendors operating in a fairly localized network. For large-scale adoption to take hold in the state, penetration into the economic geography of Ohio through the regional network is required. Such facilities as U.S. Routes 23, 30, and 33, and state Route 2 could be candidates for fueling points, coupled with coverage in metropolitan areas that is deeper (greater Cleveland and Columbus) or entirely new (the I-75 cities of Cincinnati, Dayton, and Toledo). A critical mass dynamic might be expected as fleets decide whether natural gas is a niche or a mainstream play, and steps the state may take to facilitate fuel availability can help propel that decision.
Lastly, the state should support fleet conversions because of the possibility of having equipment and fuel provided by Ohio-based manufacturers. This provides added incentive in terms of economic development (jobs and wages) and environmental quality. Support for fueling locations and fleet conversions can come in the form of policy, rebates and tax incentives, as well as access to land and support for public-private partnership in these ventures. Programs under MAP-21 legislation support both fuel stations and fleet conversion initiatives. The Public Utilities Commission of Ohio has been investigating the establishment of a revolving loan fund for natural gas vehicles, including fleet conversions. In addition to loans and tax incentives, providing land for fueling stations has been promoted. The state can also encourage technology changes by converting state and public utility fleets.
4.1.7 Increasing Truck Weight Limits A 2013 proposal in the Ohio General Assembly called for an increase in truck weights to 90,000 pounds (from 80,000 pounds), for trucks traveling on the Ohio state highway system (trucks using the interstate highway system would still be subject to federal laws and regulations, which remain at 80,000 pounds).
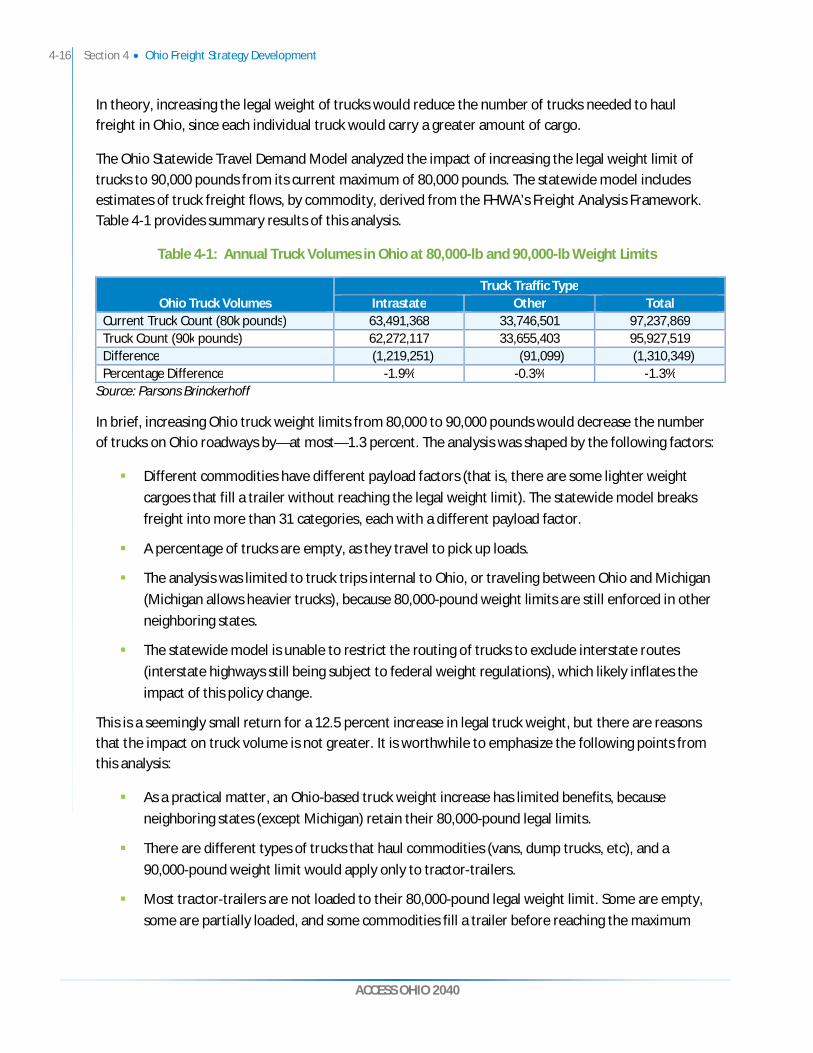
4-16 Section 4 Ohio Freight Strategy Development
ACCESS OHIO 2040
In theory, increasing the legal weight of trucks would reduce the number of trucks needed to haul freight in Ohio, since each individual truck would carry a greater amount of cargo.
The Ohio Statewide Travel Demand Model analyzed the impact of increasing the legal weight limit of trucks to 90,000 pounds from its current maximum of 80,000 pounds. The statewide model includes estimates of truck freight flows, by commodity, derived from the FHWA’s Freight Analysis Framework. Table 4-1 provides summary results of this analysis.
Table 4-1: Annual Truck Volumes in Ohio at 80,000-lb and 90,000-lb Weight Limits
Ohio Truck Volumes Truck Traffic Type
Intrastate Other Total Current Truck Count (80k pounds) 63,491,368 33,746,501 97,237,869 Truck Count (90k pounds) 62,272,117 33,655,403 95,927,519 Difference (1,219,251) (91,099) (1,310,349) Percentage Difference -1.9% -0.3% -1.3%
Source: Parsons Brinckerhoff
In brief, increasing Ohio truck weight limits from 80,000 to 90,000 pounds would decrease the number of trucks on Ohio roadways by—at most—1.3 percent. The analysis was shaped by the following factors:
Different commodities have different payload factors (that is, there are some lighter weight cargoes that fill a trailer without reaching the legal weight limit). The statewide model breaks freight into more than 31 categories, each with a different payload factor.
A percentage of trucks are empty, as they travel to pick up loads.
The analysis was limited to truck trips internal to Ohio, or traveling between Ohio and Michigan (Michigan allows heavier trucks), because 80,000-pound weight limits are still enforced in other neighboring states.
The statewide model is unable to restrict the routing of trucks to exclude interstate routes (interstate highways still being subject to federal weight regulations), which likely inflates the impact of this policy change.
This is a seemingly small return for a 12.5 percent increase in legal truck weight, but there are reasons that the impact on truck volume is not greater. It is worthwhile to emphasize the following points from this analysis:
As a practical matter, an Ohio-based truck weight increase has limited benefits, because neighboring states (except Michigan) retain their 80,000-pound legal limits.
There are different types of trucks that haul commodities (vans, dump trucks, etc), and a 90,000-pound weight limit would apply only to tractor-trailers.
Most tractor-trailers are not loaded to their 80,000-pound legal weight limit. Some are empty, some are partially loaded, and some commodities fill a trailer before reaching the maximum
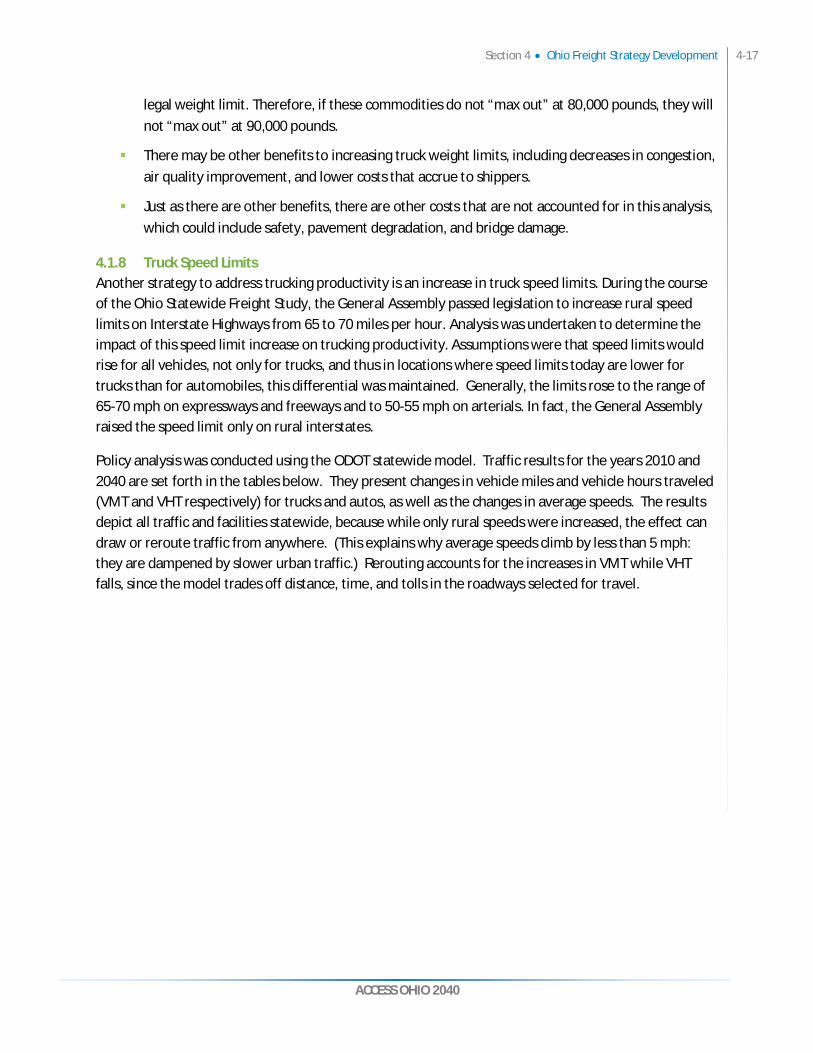
Section 4 Ohio Freight Strategy Development 4-17
ACCESS OHIO 2040
legal weight limit. Therefore, if these commodities do not “max out” at 80,000 pounds, they will not “max out” at 90,000 pounds.
There may be other benefits to increasing truck weight limits, including decreases in congestion, air quality improvement, and lower costs that accrue to shippers.
Just as there are other benefits, there are other costs that are not accounted for in this analysis, which could include safety, pavement degradation, and bridge damage.
4.1.8 Truck Speed Limits Another strategy to address trucking productivity is an increase in truck speed limits. During the course of the Ohio Statewide Freight Study, the General Assembly passed legislation to increase rural speed limits on Interstate Highways from 65 to 70 miles per hour. Analysis was undertaken to determine the impact of this speed limit increase on trucking productivity. Assumptions were that speed limits would rise for all vehicles, not only for trucks, and thus in locations where speed limits today are lower for trucks than for automobiles, this differential was maintained. Generally, the limits rose to the range of 65-70 mph on expressways and freeways and to 50-55 mph on arterials. In fact, the General Assembly raised the speed limit only on rural interstates.
Policy analysis was conducted using the ODOT statewide model. Traffic results for the years 2010 and 2040 are set forth in the tables below. They present changes in vehicle miles and vehicle hours traveled (VMT and VHT respectively) for trucks and autos, as well as the changes in average speeds. The results depict all traffic and facilities statewide, because while only rural speeds were increased, the effect can draw or reroute traffic from anywhere. (This explains why average speeds climb by less than 5 mph: they are dampened by slower urban traffic.) Rerouting accounts for the increases in VMT while VHT falls, since the model trades off distance, time, and tolls in the roadways selected for travel.
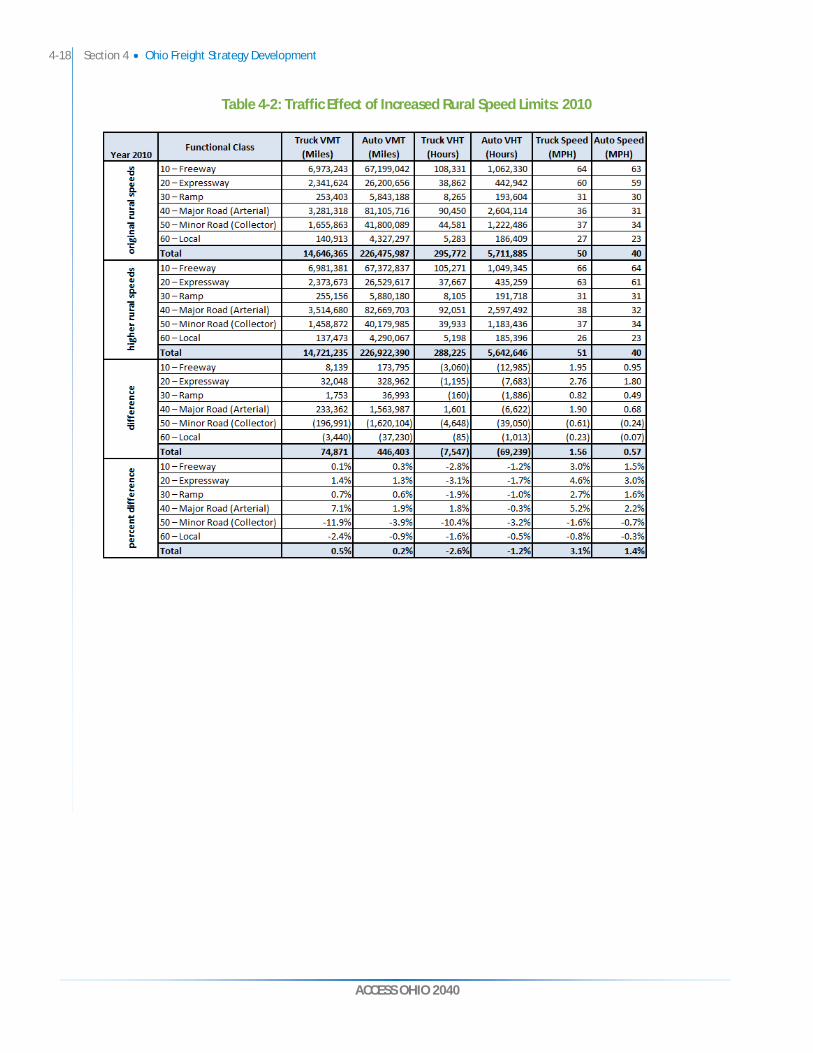
4-18 Section 4 Ohio Freight Strategy Development
ACCESS OHIO 2040
Table 4-2: Traffic Effect of Increased Rural Speed Limits: 2010

Section 4 Ohio Freight Strategy Development 4-19
ACCESS OHIO 2040
Table 4-3: Traffic Effect of Increased Rural Speed Limits: 2040
The traffic results are favorable in themselves: truck hours drop statewide by about two and a half percent, and truck speeds improve by about three percent. Trucks divert from collectors chiefly onto arterials, and to a lesser extent (but more so in 2040) onto expressways and freeways. These are the routes where speeds have been raised, of course, yet they are also better facilities for truck travel and this can be viewed as a desirable outcome. The shifts in auto traffic broadly follow the same pattern, although the percent changes are smaller even while the magnitude is bigger. In proportional terms, higher rural speed limits are particularly good for truck traffic.
While this policy analysis does not exactly mimic the speed limits adopted by the General Assembly, it does provide an indication of the benefits from raising truck speeds: the trucking industry will recognize a few percentage points of increased productivity, as measured by truck hours of travel.
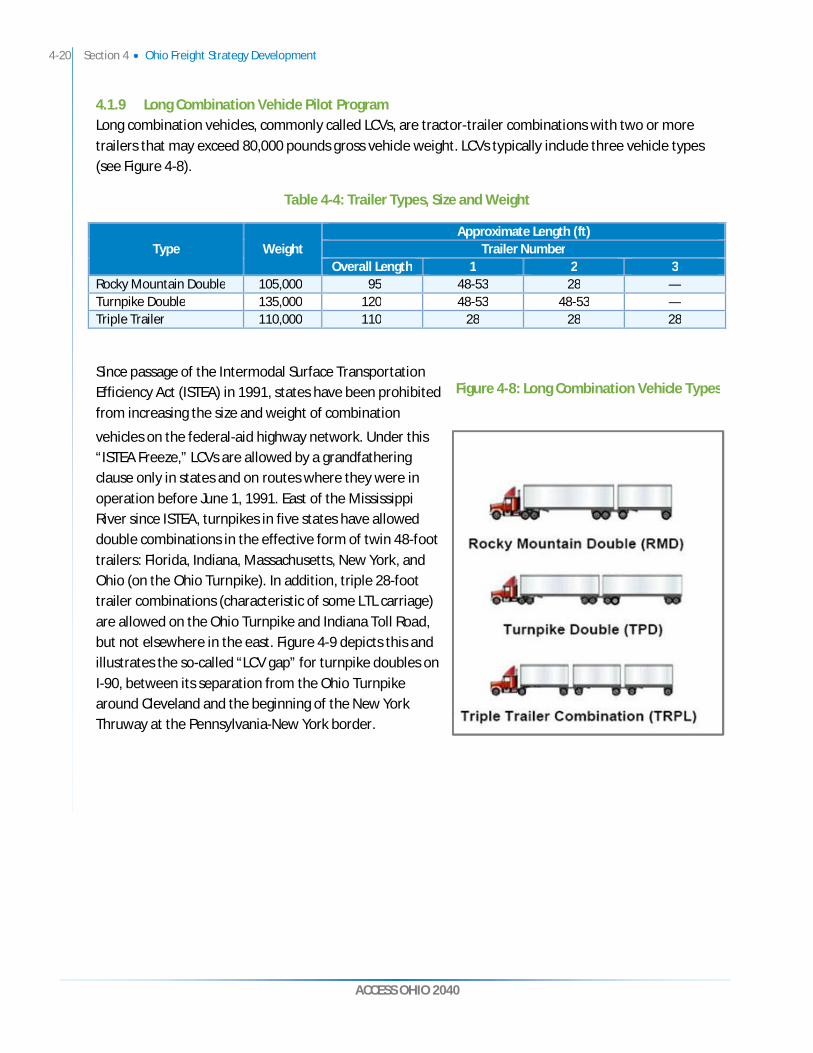
4-20 Section 4 Ohio Freight Strategy Development
ACCESS OHIO 2040
4.1.9 Long Combination Vehicle Pilot Program Long combination vehicles, commonly called LCVs, are tractor-trailer combinations with two or more trailers that may exceed 80,000 pounds gross vehicle weight. LCVs typically include three vehicle types (see Figure 4-8).
Table 4-4: Trailer Types, Size and Weight
Type Weight Approximate Length (ft)
Trailer Number Overall Length 1 2 3
Rocky Mountain Double 105,000 95 48-53 28 — Turnpike Double 135,000 120 48-53 48-53 — Triple Trailer 110,000 110 28 28 28
Since passage of the Intermodal Surface Transportation Efficiency Act (ISTEA) in 1991, states have been prohibited from increasing the size and weight of combination
vehicles on the federal-aid highway network. Under this “ISTEA Freeze,” LCVs are allowed by a grandfathering clause only in states and on routes where they were in operation before June 1, 1991. East of the Mississippi River since ISTEA, turnpikes in five states have allowed double combinations in the effective form of twin 48-foot trailers: Florida, Indiana, Massachusetts, New York, and Ohio (on the Ohio Turnpike). In addition, triple 28-foot trailer combinations (characteristic of some LTL carriage) are allowed on the Ohio Turnpike and Indiana Toll Road, but not elsewhere in the east. Figure 4-9 depicts this and illustrates the so-called “LCV gap” for turnpike doubles on I-90, between its separation from the Ohio Turnpike around Cleveland and the beginning of the New York Thruway at the Pennsylvania-New York border.
Figure 4-8: Long Combination Vehicle Types

Section 4 Ohio Freight Strategy Development 4-21
ACCESS OHIO 2040
Figure 4-9: States Allowing Long Combination Vehicles
LCV Pilot Program in Concept To address concerns about trucking productivity and congestion, the Ohio Freight Study evaluated (on a pilot basis) the potential benefits of implementing and expanding the LCV network in Ohio. The concept has the following attributes:
The allowance of LCVs on the Ohio Turnpike provides a competitive logistics advantage for Ohio businesses.
Expanding LCV routes on select corridors can be tightly regulated.
An LCV pilot could be administered by the Ohio Turnpike Commission, which operates a closed system for LCVs, and tracks each LCV through an electronic toll collection system.
Any expansion of the LCV network, even on a pilot basis, would require FHWA authorization, perhaps with congressional enabling language.
LCVs improve productivity by increasing cargo-carrying capacity per tractor and driver, which results in fewer truck trips, lower cost, and fewer driven miles. In Ohio where two 48-foot trailers are allowed, the gain over one 53-foot trailer is a 55 percent improvement in the interior trailer volume and the difference between 68,000 pounds and 40-43,000 pounds in weight. The heavier weights are more likely to require a different, more expensive tractor so the greater potential lies with freight that will cube out—fill the trailer volume—before it weighs out.
Legend: States that allow long combination vehicles are shaded green; triple-trailer routes in Indiana, Massachusetts, New York and Ohio are shown in red.

4-22 Section 4 Ohio Freight Strategy Development
ACCESS OHIO 2040
Pilot Corridors Pilot corridors for LCV expansion would be based on routes off the turnpike, which have significant truck traffic and logistics potential. Criteria would include:
Interchange with the Ohio Turnpike
Interstate or limited access facility
Significant truck traffic and/or truck congestion
Air quality non-attainment
Connection to ports and other intermodal facilities
Corridor that is supportive of logistics industry (warehouses and distribution centers)
The following three potential pilot corridors have emerged from the previous discussion:
I-71 south from the Ohio Turnpike to approximately Mansfield, offering multiple lanes to where the important freight routes of U.S. Route 30 and U.S. Route 250 connect. A variation could add a branch with I-271, although this section is limited to two lanes in each direction. The I-71 option responds well to air quality and congestion relief needs and serves Ohio industry and consumers.
I-90 east from the Ohio Turnpike to the Pennsylvania line. Variations could add a branch on I-271, or substitute I-271 for the section of I-90 through Cleveland.
I-75 south of the Ohio Turnpike to Findlay, offering multiple lanes to where the important freight routes of U.S. Route 68 and the state Route 15 connection to U.S. Route 23 branch off. This corridor has good supportive logistics infrastructure, and would serve automotive industry traffic.
A fourth option would be to allow twin 53-foot trailers on the turnpike; this could be proposed on its own or combined with the others.

Section 4 Ohio Freight Strategy Development 4-23
ACCESS OHIO 2040
The I-75 corridor provides a good “sketch-level” overview of an LCV pilot program and its benefits and costs. The route is shown in Figure 4-10, which highlights the major intermodal and distribution centers in the corridor: CSX North Baltimore Intermodal; Home Depot Distribution Center; Whirlpool; Ball Metal Beverage; Kohl’s; Best Buy; Lowe’s; and Hercules Tire.
This route is currently programmed for widening to six lanes south of I-475. The LCV pilot concept is to extend the LCV route from the turnpike, restricting LCVs to the right lane of I-75; the LCVs route would be an extension of the Ohio Turnpike and LCVs would be charged to use this route as far south as Findlay. Toll collection from LCVs would be via all-electronic toll readers installed on a truss over the roadway. The toll equipment could be installed as part of an I-75 widening project. Based on traffic on the Ohio Turnpike, LCVs on this portion of I-75 would generate more than $500,000 in revenue annually, which would cover the capital cost of toll collection infrastructure in fewer than two years and would provide ongoing revenue for road maintenance.
Figure 4-10: Pilot LCV Route – I-75 from I-80/90 (Ohio Turnpike) to Findlay

4-24 Section 4 Ohio Freight Strategy Development
ACCESS OHIO 2040
4.2 Ohio Railroad Strategy
The most dramatic development in the demand for rail service relates to changes in energy markets, particularly the impact of shale oil and gas development. Intermodal will continue to be the fastest growing component of the railroad industry, as well as holding out the highest opportunity for modal diversion from truck to rail. Ohio is the site of significant public investment in rail intermodal. In addition, Ohio’s rail network will not be able to meet the needs of the future if significant portions are kept in a poor state of repair and are allowed to become increasingly obsolete. These include segments that are unable to accommodate the industry standard of 286,000-pound gross weight railcars. Addressing this full set of issues will help to ensure that Ohio’s rail system meets its needs in future decades. The railroad strategy options focused on:
Rail service to new markets
Leveraging the intermodal transportation to reduce highway congestion
Leveraging intermodal terminals for economic development
Improving deficient rail lines, so that all Ohio railroad assets are productive as possible
4.2.1 New Markets – Shale Oil and Gas New demands will shift the location and needs for rail infrastructure. One of the most significant potential “game changers” for rail in Ohio is the growth of shale energy developments in the Marcellus and Utica fields. The volume of recoverable natural gas in the Marcellus Shale deposit could make it the second largest in the world. The Utica formation is deeper in the ground but has more economic potential for the state, notably because it could be a “liquid play” where crude oil and wet gas are recovered along with natural gas. Wet gas contains useful byproducts that are used in a variety of consumer goods, and creates lower-cost feedstock for the Ohio chemical industry.
Rail in Ohio can play a number of roles in regard to shale oil and gas:
Shale well development – A well typically requires 30 rail carloads of inbound materials and can produce more than 20 carloads of outbound materials. Well development is expected to generate increasing demand for rail over the next 10 years.
Ohio as a supplier of steel – Steel remains one of Ohio’s largest manufacturing industries. Shale oil and gas exploration has prompted some Ohio steel plants to expand production for markets in Ohio and more distant locations; rail service could be a low-cost option for the latter.
Ongoing transportation of oil, gas, and byproducts – Rail will compete with trucking and pipeline transportation for movements of natural gas, oil, and byproducts. Most dry natural gas will be shipped by pipeline, but rail will have a larger role for natural gas liquids and crude oil.
Some rail improvements have already been proposed to address the needs of shale oil and gas developments.
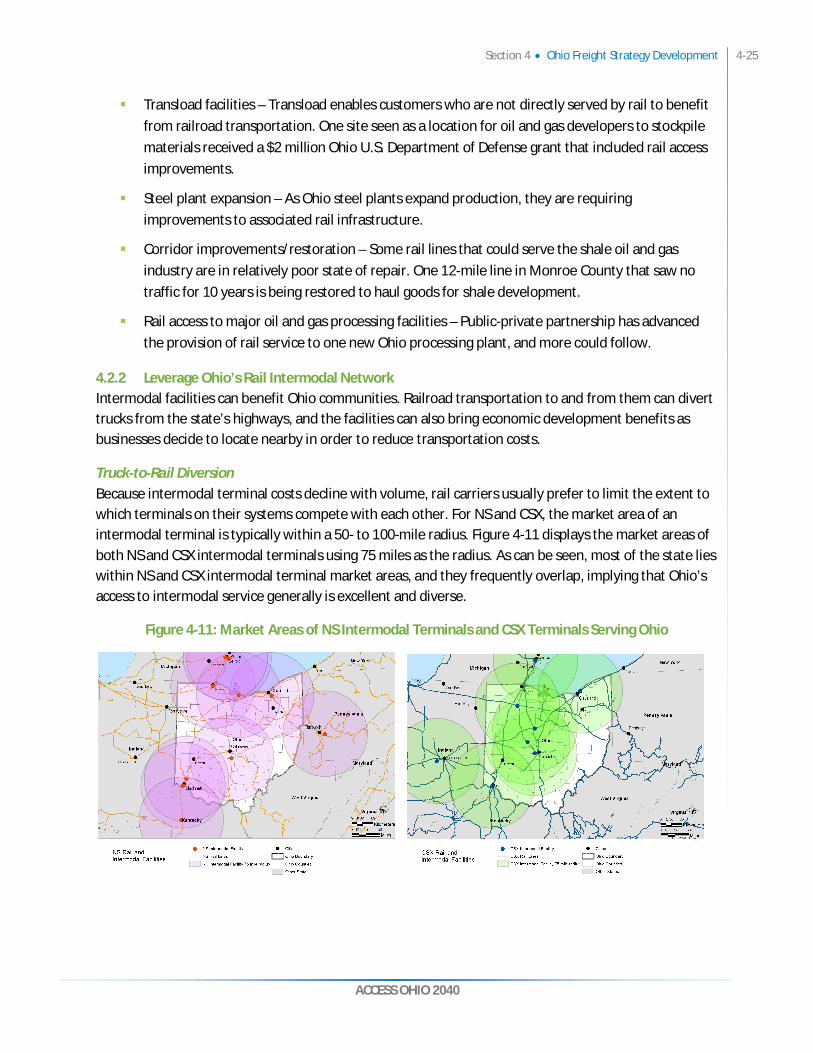
Section 4 Ohio Freight Strategy Development 4-25
ACCESS OHIO 2040
Transload facilities – Transload enables customers who are not directly served by rail to benefit from railroad transportation. One site seen as a location for oil and gas developers to stockpile materials received a $2 million Ohio U.S. Department of Defense grant that included rail access improvements.
Steel plant expansion – As Ohio steel plants expand production, they are requiring improvements to associated rail infrastructure.
Corridor improvements/restoration – Some rail lines that could serve the shale oil and gas industry are in relatively poor state of repair. One 12-mile line in Monroe County that saw no traffic for 10 years is being restored to haul goods for shale development.
Rail access to major oil and gas processing facilities – Public-private partnership has advanced the provision of rail service to one new Ohio processing plant, and more could follow.
4.2.2 Leverage Ohio’s Rail Intermodal Network Intermodal facilities can benefit Ohio communities. Railroad transportation to and from them can divert trucks from the state’s highways, and the facilities can also bring economic development benefits as businesses decide to locate nearby in order to reduce transportation costs.
Truck-to-Rail Diversion Because intermodal terminal costs decline with volume, rail carriers usually prefer to limit the extent to which terminals on their systems compete with each other. For NS and CSX, the market area of an intermodal terminal is typically within a 50- to 100-mile radius. Figure 4-11 displays the market areas of both NS and CSX intermodal terminals using 75 miles as the radius. As can be seen, most of the state lies within NS and CSX intermodal terminal market areas, and they frequently overlap, implying that Ohio’s access to intermodal service generally is excellent and diverse.
Figure 4-11: Market Areas of NS Intermodal Terminals and CSX Terminals Serving Ohio
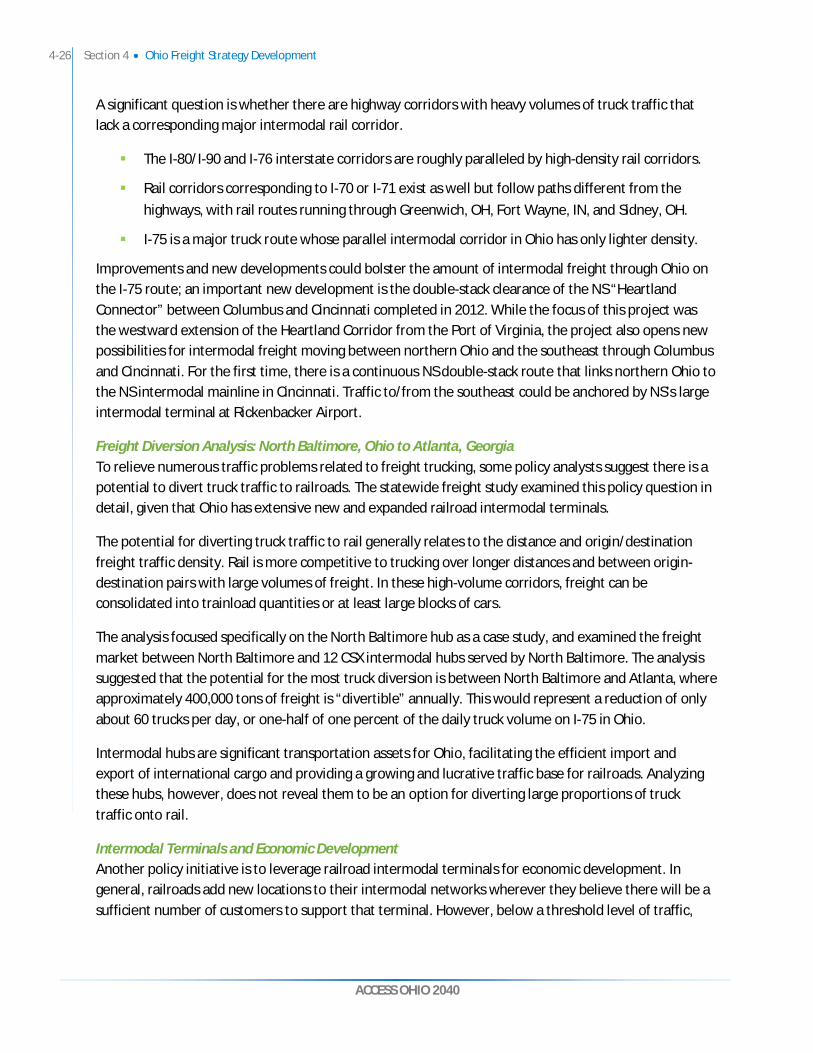
4-26 Section 4 Ohio Freight Strategy Development
ACCESS OHIO 2040
A significant question is whether there are highway corridors with heavy volumes of truck traffic that lack a corresponding major intermodal rail corridor.
The I-80/I-90 and I-76 interstate corridors are roughly paralleled by high-density rail corridors.
Rail corridors corresponding to I-70 or I-71 exist as well but follow paths different from the highways, with rail routes running through Greenwich, OH, Fort Wayne, IN, and Sidney, OH.
I-75 is a major truck route whose parallel intermodal corridor in Ohio has only lighter density.
Improvements and new developments could bolster the amount of intermodal freight through Ohio on the I-75 route; an important new development is the double-stack clearance of the NS “Heartland Connector” between Columbus and Cincinnati completed in 2012. While the focus of this project was the westward extension of the Heartland Corridor from the Port of Virginia, the project also opens new possibilities for intermodal freight moving between northern Ohio and the southeast through Columbus and Cincinnati. For the first time, there is a continuous NS double-stack route that links northern Ohio to the NS intermodal mainline in Cincinnati. Traffic to/from the southeast could be anchored by NS’s large intermodal terminal at Rickenbacker Airport.
Freight Diversion Analysis: North Baltimore, Ohio to Atlanta, Georgia To relieve numerous traffic problems related to freight trucking, some policy analysts suggest there is a potential to divert truck traffic to railroads. The statewide freight study examined this policy question in detail, given that Ohio has extensive new and expanded railroad intermodal terminals.
The potential for diverting truck traffic to rail generally relates to the distance and origin/destination freight traffic density. Rail is more competitive to trucking over longer distances and between origin-destination pairs with large volumes of freight. In these high-volume corridors, freight can be consolidated into trainload quantities or at least large blocks of cars.
The analysis focused specifically on the North Baltimore hub as a case study, and examined the freight market between North Baltimore and 12 CSX intermodal hubs served by North Baltimore. The analysis suggested that the potential for the most truck diversion is between North Baltimore and Atlanta, where approximately 400,000 tons of freight is “divertible” annually. This would represent a reduction of only about 60 trucks per day, or one-half of one percent of the daily truck volume on I-75 in Ohio.
Intermodal hubs are significant transportation assets for Ohio, facilitating the efficient import and export of international cargo and providing a growing and lucrative traffic base for railroads. Analyzing these hubs, however, does not reveal them to be an option for diverting large proportions of truck traffic onto rail.
Intermodal Terminals and Economic Development Another policy initiative is to leverage railroad intermodal terminals for economic development. In general, railroads add new locations to their intermodal networks wherever they believe there will be a sufficient number of customers to support that terminal. However, below a threshold level of traffic,
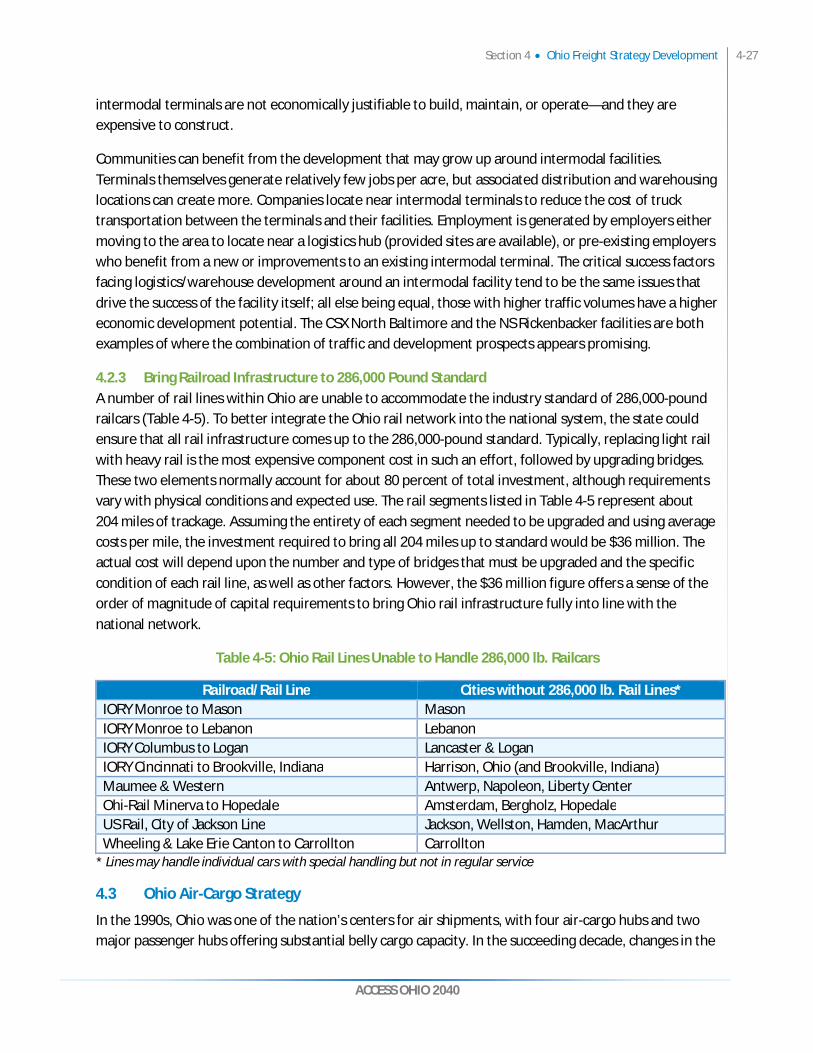
Section 4 Ohio Freight Strategy Development 4-27
ACCESS OHIO 2040
intermodal terminals are not economically justifiable to build, maintain, or operate—and they are expensive to construct.
Communities can benefit from the development that may grow up around intermodal facilities. Terminals themselves generate relatively few jobs per acre, but associated distribution and warehousing locations can create more. Companies locate near intermodal terminals to reduce the cost of truck transportation between the terminals and their facilities. Employment is generated by employers either moving to the area to locate near a logistics hub (provided sites are available), or pre-existing employers who benefit from a new or improvements to an existing intermodal terminal. The critical success factors facing logistics/warehouse development around an intermodal facility tend to be the same issues that drive the success of the facility itself; all else being equal, those with higher traffic volumes have a higher economic development potential. The CSX North Baltimore and the NS Rickenbacker facilities are both examples of where the combination of traffic and development prospects appears promising.
4.2.3 Bring Railroad Infrastructure to 286,000 Pound Standard A number of rail lines within Ohio are unable to accommodate the industry standard of 286,000-pound railcars (Table 4-5). To better integrate the Ohio rail network into the national system, the state could ensure that all rail infrastructure comes up to the 286,000-pound standard. Typically, replacing light rail with heavy rail is the most expensive component cost in such an effort, followed by upgrading bridges. These two elements normally account for about 80 percent of total investment, although requirements vary with physical conditions and expected use. The rail segments listed in Table 4-5 represent about 204 miles of trackage. Assuming the entirety of each segment needed to be upgraded and using average costs per mile, the investment required to bring all 204 miles up to standard would be $36 million. The actual cost will depend upon the number and type of bridges that must be upgraded and the specific condition of each rail line, as well as other factors. However, the $36 million figure offers a sense of the order of magnitude of capital requirements to bring Ohio rail infrastructure fully into line with the national network.
Table 4-5: Ohio Rail Lines Unable to Handle 286,000 lb. Railcars
Railroad/Rail Line Cities without 286,000 lb. Rail Lines* IORY Monroe to Mason Mason IORY Monroe to Lebanon Lebanon IORY Columbus to Logan Lancaster & Logan IORY Cincinnati to Brookville, Indiana Harrison, Ohio (and Brookville, Indiana) Maumee & Western Antwerp, Napoleon, Liberty Center Ohi-Rail Minerva to Hopedale Amsterdam, Bergholz, Hopedale US Rail, City of Jackson Line Jackson, Wellston, Hamden, MacArthur Wheeling & Lake Erie Canton to Carrollton Carrollton
* Lines may handle individual cars with special handling but not in regular service
4.3 Ohio Air-Cargo Strategy
In the 1990s, Ohio was one of the nation’s centers for air shipments, with four air-cargo hubs and two major passenger hubs offering substantial belly cargo capacity. In the succeeding decade, changes in the
4-28 Section 4 Ohio Freight Strategy Development
ACCESS OHIO 2040
aviation environment adversely affected all of them. Today, it is unlikely that any state has more unutilized air-cargo capacity than Ohio. Vacant facilities in Toledo, Wilmington, and Dayton total nearly 3,000,000 square feet. They are geared for freighter operations that no longer exist domestically, and are not attractive to international carriers because of competitive disadvantages.
The statewide freight study focused on the four cargo airports serving Ohio—Rickenbacker, Toledo, Wilmington, and Cincinnati-Northern Kentucky (CVG):
Rickenbacker Rickenbacker largely depends on its substantial real estate operations for maintaining its financial position. The existing properties and those proposed for future development are intended to support manufacturing and logistics-oriented businesses, with the primary targets being firms that ship by air. In the absence of high-volume passenger activity and given the available road and aeronautical infrastructure, this appears to be the most appropriate strategy for Rickenbacker to pursue. There are essentially no carriers in the industry to attract for a freighter-hubbing operation, and passenger growth will be focused on Columbus.
Toledo Toledo’s cargo business was built almost entirely on the now discontinued operations of BAX Global, Inc. There are limited passenger flights and those that operate are smaller gauge with little or no cargo capacity. The BAX facility is in stable use by a trucking and logistics operation, the substantial capacity of the building can easily be recaptured for air freight, and the airport infrastructure is in good condition. The major issue is the proximity of Detroit and Chicago—both of which draw potential business from Toledo on both the passenger and cargo sides.
Wilmington Wilmington recently completed a comprehensive land use planning effort driven by its potential for real estate development. The Wilmington Air Park has vast amounts of air cargo facilities and infrastructure available, and undeveloped property around the aeronautical areas presents additional options. Unlike the other airports, there is no commercial service at Wilmington, which makes it more difficult to develop synergies, and because the Air Park had been privately owned, it is not Federal Aviation Administration (FAA) certified and cannot access FAA funding.
Cincinnati-Northern Kentucky The size of its commercial operation and the presence of DHL give CVG the strongest prospects for cargo growth. Despite a reduced Delta Airlines presence, the airport still generates belly cargo. FedEx has become increasingly active at CVG and is exploring expansion options. The international freight carrier Southern Air moved its company headquarters to CVG, although it is unclear if this will boost operations. However, this carrier moves cargo for DHL, and it is DHL and its apparent commitment to CVG that should provide the strongest attraction for activities and supporting businesses.
Despite the efficiencies in the new DHL facility, additional business could require further expansion, and the company has a north option parcel available if needed. This will require both airside and landside capacity that the airport has planned for and can provide. The DHL operation has stimulated discussion
Section 4 Ohio Freight Strategy Development 4-29
ACCESS OHIO 2040
regarding logistics parks in the area. While they do not need to be on-airport, quick and reliable access will be important in formulating not only development decisions but also decisions to relocate in a park whose purpose will be to house activities focused on air logistics.
4.3.1 ODOT Strategies to Support Air Cargo Despite the difficult market that air-cargo operations face, there are logical strategies these airports can pursue to attract air cargo, jobs and economic development to Ohio.
It is important for state policymakers to recognize that the air cargo hub business model is no longer viable in today’s logistics industry. The industry is now dominated by UPS and FedEx, and all other air cargo firms have left the industry. If there are funding requests for airport improvements that relate to the attraction of an air cargo firm, they should be met with skepticism.
Air freight is truck freight. Therefore road improvement projects around airports are equally important to air freight as airport improvements are. This is notable, since most of ODOT’s funding is directed toward road programs.
While the air cargo hub-and-spoke system has largely disappeared, the aviation system still carries expedited cargo shipments in the belly of passenger aircraft. Therefore, state policymakers should consider the access and mobility needs of freight to passenger airports.
Ohio air cargo facilities will most likely convert to serve niche markets that require charter air service, and/or trucking and warehouse operations.
It is likely that air cargo conversions will require economic development funding for feasibility studies or building retrofits, which aren’t generally eligible for ODOT funding. However ODOT can partner with Jobs Ohio, MPOs, and local economic development agencies to cooperatively plan infrastructure, business feasibility, and implementation for air cargo facility conversions.
4.4 Lake Erie Port Strategies
Ohio’s Lake Erie ports were a catalyst to the state’s industrial development. While many ports are still active, they face withering competition from railroads and coastal ports, while Ohio’s heavy industrial base has declined. The Lake Erie port strategies seek to rebalance port capacity while identifying new cargoes for business growth.
4.4.1 Dredging Harbor and channel dredging is fundamental to the viability of Ohio’s Lake Erie ports. But as with other programs, allocation of federal funding has been inadequate to meet dredging needs. Between FY 2005 and FY 2011, Ohio port facilities required $107.2 million in dredging by design, as specified by congressional authorization. However, only $46.3 million was allocated to dredging these facilities, due to inadequate resources available for federally funded harbor maintenance activities nationwide.
Advocating More Federal Funding for Harbor Maintenance Dredging Federal harbor dredging is authorized by the Water Resources Development Act of 2013, which created the Harbor Maintenance Trust Fund. The fund takes in $1.8 billion through an “ad valorem” tax on
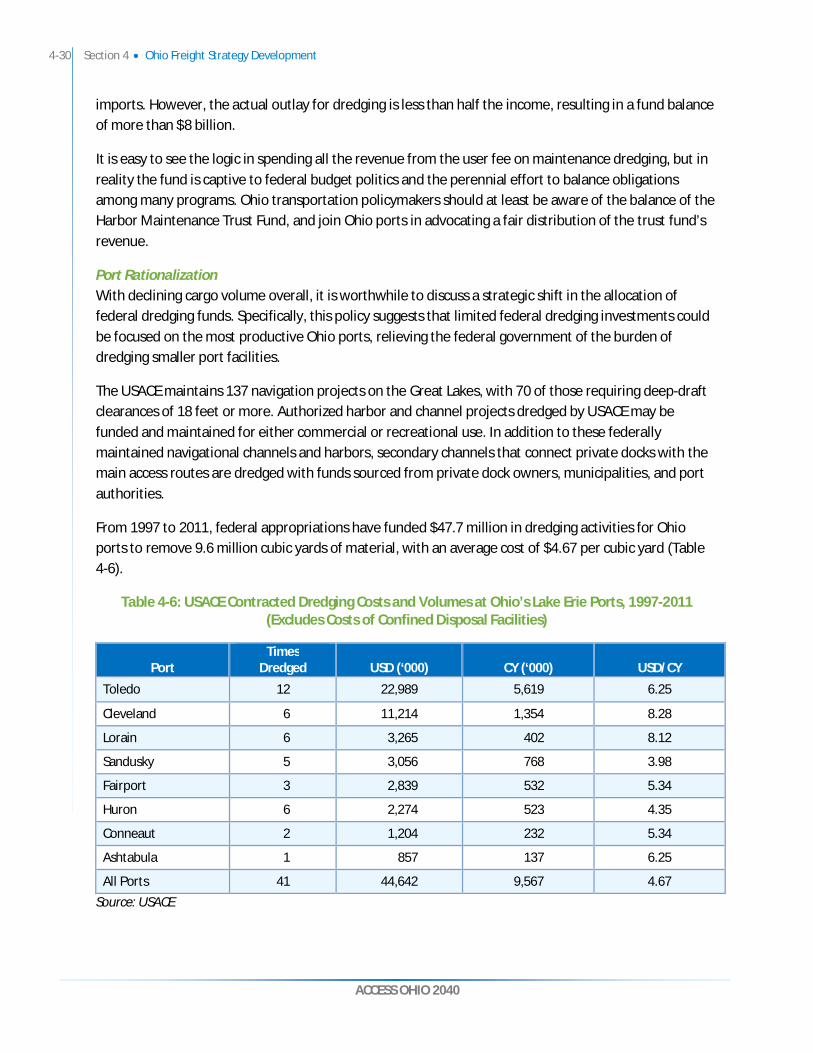
4-30 Section 4 Ohio Freight Strategy Development
ACCESS OHIO 2040
imports. However, the actual outlay for dredging is less than half the income, resulting in a fund balance of more than $8 billion.
It is easy to see the logic in spending all the revenue from the user fee on maintenance dredging, but in reality the fund is captive to federal budget politics and the perennial effort to balance obligations among many programs. Ohio transportation policymakers should at least be aware of the balance of the Harbor Maintenance Trust Fund, and join Ohio ports in advocating a fair distribution of the trust fund’s revenue.
Port Rationalization With declining cargo volume overall, it is worthwhile to discuss a strategic shift in the allocation of federal dredging funds. Specifically, this policy suggests that limited federal dredging investments could be focused on the most productive Ohio ports, relieving the federal government of the burden of dredging smaller port facilities.
The USACE maintains 137 navigation projects on the Great Lakes, with 70 of those requiring deep-draft clearances of 18 feet or more. Authorized harbor and channel projects dredged by USACE may be funded and maintained for either commercial or recreational use. In addition to these federally maintained navigational channels and harbors, secondary channels that connect private docks with the main access routes are dredged with funds sourced from private dock owners, municipalities, and port authorities.
From 1997 to 2011, federal appropriations have funded $47.7 million in dredging activities for Ohio ports to remove 9.6 million cubic yards of material, with an average cost of $4.67 per cubic yard (Table 4-6).
Table 4-6: USACE Contracted Dredging Costs and Volumes at Ohio’s Lake Erie Ports, 1997-2011 (Excludes Costs of Confined Disposal Facilities)
Port Times
Dredged USD (‘000) CY (‘000) USD/CY
Toledo 12 22,989 5,619 6.25
Cleveland 6 11,214 1,354 8.28
Lorain 6 3,265 402 8.12
Sandusky 5 3,056 768 3.98
Fairport 3 2,839 532 5.34
Huron 6 2,274 523 4.35
Conneaut 2 1,204 232 5.34
Ashtabula 1 857 137 6.25
All Ports 41 44,642 9,567 4.67 Source: USACE
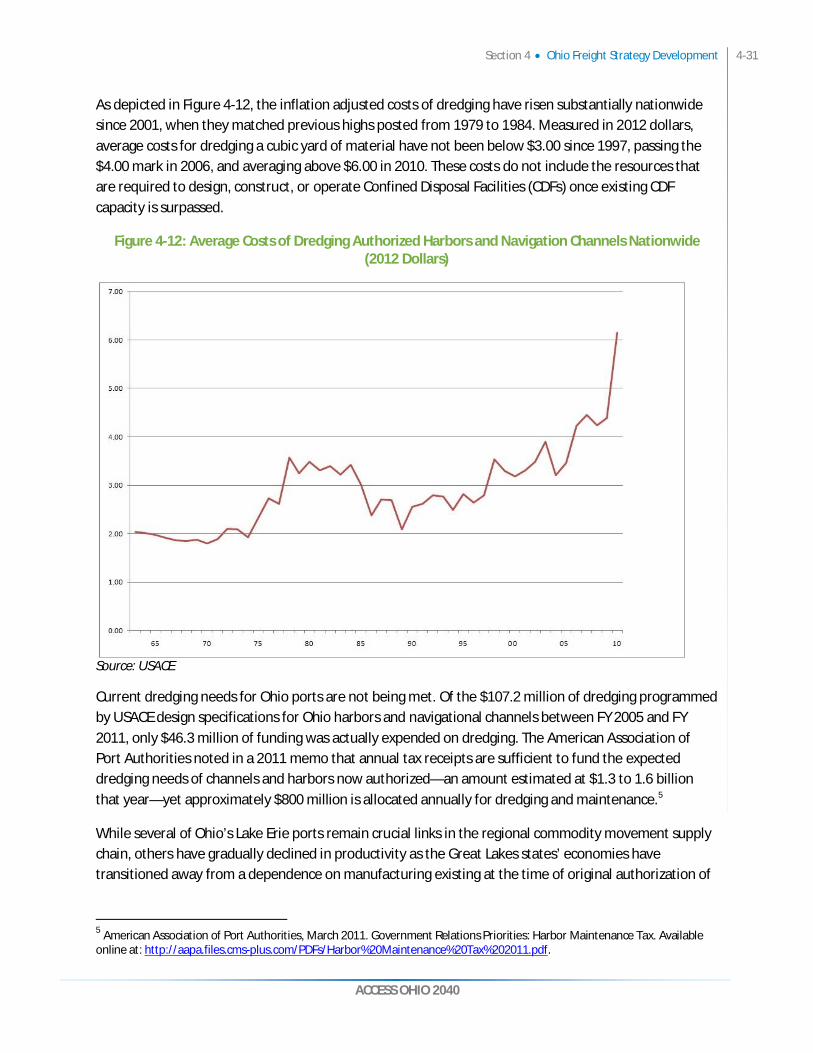
Section 4 Ohio Freight Strategy Development 4-31
ACCESS OHIO 2040
As depicted in Figure 4-12, the inflation adjusted costs of dredging have risen substantially nationwide since 2001, when they matched previous highs posted from 1979 to 1984. Measured in 2012 dollars, average costs for dredging a cubic yard of material have not been below $3.00 since 1997, passing the $4.00 mark in 2006, and averaging above $6.00 in 2010. These costs do not include the resources that are required to design, construct, or operate Confined Disposal Facilities (CDFs) once existing CDF capacity is surpassed.
Figure 4-12: Average Costs of Dredging Authorized Harbors and Navigation Channels Nationwide (2012 Dollars)
Source: USACE
Current dredging needs for Ohio ports are not being met. Of the $107.2 million of dredging programmed by USACE design specifications for Ohio harbors and navigational channels between FY 2005 and FY 2011, only $46.3 million of funding was actually expended on dredging. The American Association of Port Authorities noted in a 2011 memo that annual tax receipts are sufficient to fund the expected dredging needs of channels and harbors now authorized—an amount estimated at $1.3 to 1.6 billion that year—yet approximately $800 million is allocated annually for dredging and maintenance.5
While several of Ohio’s Lake Erie ports remain crucial links in the regional commodity movement supply chain, others have gradually declined in productivity as the Great Lakes states’ economies have transitioned away from a dependence on manufacturing existing at the time of original authorization of
5 American Association of Port Authorities, March 2011. Government Relations Priorities: Harbor Maintenance Tax. Available online at: http://aapa.files.cms-plus.com/PDFs/Harbor%20Maintenance%20Tax%202011.pdf.

4-32 Section 4 Ohio Freight Strategy Development
ACCESS OHIO 2040
these federally supported facilities. As a result, the busier Ohio ports leverage more cargo per dollar of federal investment.
Demonstrating this point, Toledo spends 37 cents on dredging and disposal for every ton of cargo moved at its port, while Cleveland spends 30 cents. Additionally, disparities in the frequency of vessel calls highlight differences in the cost of service provision at the ports. Cleveland and Toledo were allocated approximately $1,800 and $3,100 for dredging and disposal per vessel movement recorded from 2006 to 2010, while other ports spent between $3,400 and $2,800 per vessel movement in those years.
These and other investment/productivity comparisons demonstrate that there are considerable economies of scale achieved when handling freight at higher volume ports. In summary, the analysis suggests that federal dredging investments gain the most benefit in Cleveland, Toledo, and Ashtabula, while dredging activities at other ports provide less return. While it is straightforward to analyze and suggest a rationalization of federal dredging resources, as a practical matter, such a policy implementation would require the following actions:
ODOT has no formal policymaking authority for dredging, so there would need to be official entrees to broker discussions with the USACE.
As harbor maintenance is authorized by Congress, a shift of dredging resources could require federal legislation.
Displacement of business and industry is a key concern. State policymakers could aid program implementation by providing incentives (e.g., grant and loan programs, state tax abatement) for the relocation of industry to the more viable port cities.
Related to the point above, certain Ohio ports are served exclusively by one railroad company, and the closure of a small port could close a railroad’s access to lake port markets. Thus, a rationalization strategy should include negotiation with railroads to maintain fair access to the remaining Ohio ports.
Preserving Confined Disposal Facility Capacity Another dredging concern is the disposal of contaminated materials. Contaminated dredging materials must be placed in CDFs, which are costly to build and maintain. By contrast, “clean” dredging material can be dumped in the open lake. If federal dredge investments were focused on fewer lake ports, the life of existing CDFs could be extended many more years.
4.4.2 New Market Opportunities As with any business, Ohio ports are constantly searching for new markets to sustain or expand cargo flow through their docks, and ultimately to enhance local economic activity. This section examines the most promising opportunities.
Section 4 Ohio Freight Strategy Development 4-33
ACCESS OHIO 2040
Marcellus and Utica Shale Energy exploration and extraction activities now centered upon the Marcellus and Utica Shale formations—beneath the eastern third of Ohio and western half of Pennsylvania—could reactivate components of those state’s freight movement systems that have long been underused. In areas in which these types of extraction activities have progressed, such as Oklahoma and elsewhere, frac sand and other industrial components and products have revitalized barge transportation and short-line rail.
As in Oklahoma, the Ohio ports may assist in a rail-based strategy to create a “rolling pipeline” in Ohio when environmental permitting for traditional pipeline routes cannot move as fast as market demand for extracted energy supplies. In the past, the Toledo-Lucas County Port Authority has pursued USDOT funding through competitive grant opportunities to support the design and construction of facilities of this type, but has not yet been successful in securing project funding. Even so, crude oil by rail has been growing—in part because of its network flexibility—and rail-water combinations can be a lower-cost alternative to some markets. The market as a whole is relatively new and fluid, and could yet justify this kind of development.
As North American crude production climbs, ports can be intermodal connections in other ways as well. Two refineries near Toledo are now served by pipelines running from dock to the refinery site, delivering “slugs” of crude as they arrive at the port. At present, pipeline permitting and construction opportunities are limited as new sites develop, due to land acquisition requirements and the timetable of the necessary environmental reviews, but timely support and market evolution could bring about more activity.
Silica Movements So-called frac sand, a material distinguished by its size, shape, strength, and purity that make it ideal for use in the hydraulic fracturing process, has been promoted as a burgeoning supply chain that offers revenue opportunities for Ohio ports. This sand is used to prop the fissures
Energy Market Considerations
It is beneficial for Ohio ports to examine how they may benefit from new economic activity related to energy extraction, but care should be taken to understand the nature of the market driving extraction and exploration, and to be aware of its risks. The success of Ohio ports as nodes in a new energy supply chain on the Great Lakes is contingent upon how successfully they can divert cargos such as silica that are now traveling by truck from nearby states, such as Wisconsin and Minnesota.
Additionally, it should be remembered that low-cost energy could revitalize many heavy industrial and manufacturing sectors that have experienced regional decline in past years—namely aluminum, paper, iron, steel, and petrochemical industries—as energy inputs represent a large portion of these firms operating expenses. Transportation planners responsible managing port and rail infrastructure in Ohio should continue outreach efforts with key firms and leaders in these industries to serve their needs as the market evolves.
The potential for large-scale movements of LNG on the Great Lakes and St. Lawrence Seaway is extremely limited due to the standard economies of scale achieved through the use of large vessels that would not fit in the existing system of locks. Additionally, such a trade flow on the Seaway would be contingent on a number of economic and regulatory factors that define whether natural gas can or will be exported through any port at all.
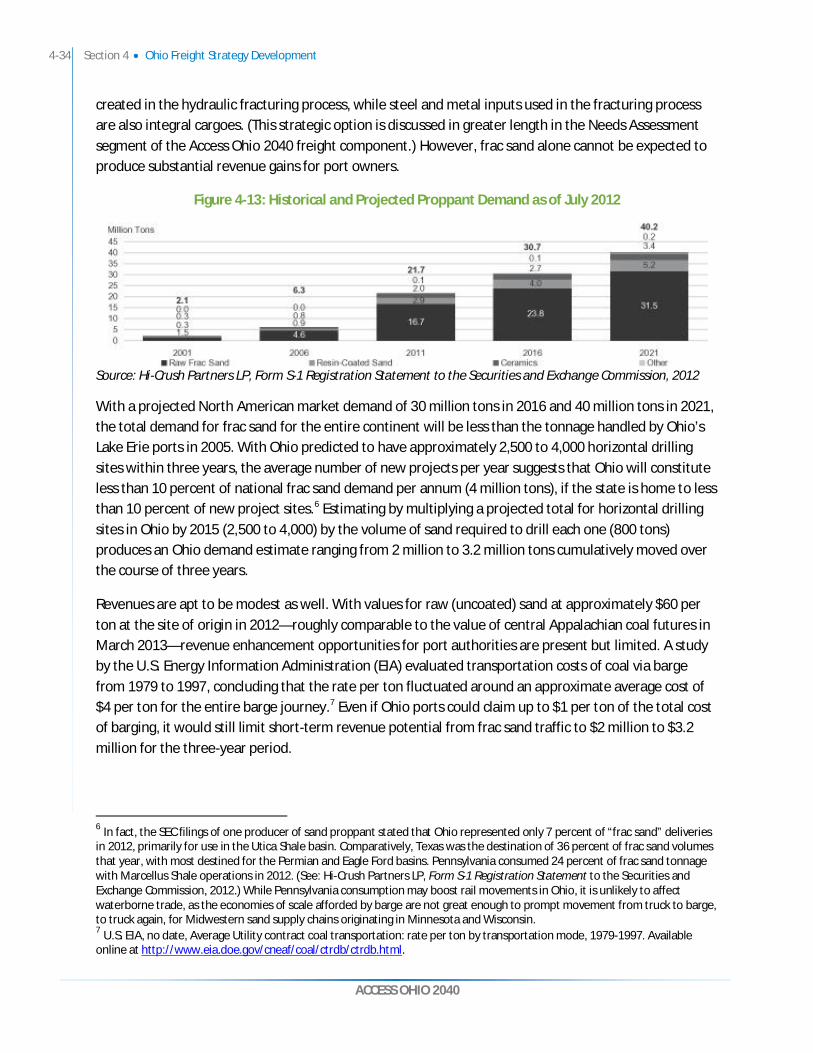
4-34 Section 4 Ohio Freight Strategy Development
ACCESS OHIO 2040
created in the hydraulic fracturing process, while steel and metal inputs used in the fracturing process are also integral cargoes. (This strategic option is discussed in greater length in the Needs Assessment segment of the Access Ohio 2040 freight component.) However, frac sand alone cannot be expected to produce substantial revenue gains for port owners.
Figure 4-13: Historical and Projected Proppant Demand as of July 2012
Source: Hi-Crush Partners LP, Form S-1 Registration Statement to the Securities and Exchange Commission, 2012
With a projected North American market demand of 30 million tons in 2016 and 40 million tons in 2021, the total demand for frac sand for the entire continent will be less than the tonnage handled by Ohio’s Lake Erie ports in 2005. With Ohio predicted to have approximately 2,500 to 4,000 horizontal drilling sites within three years, the average number of new projects per year suggests that Ohio will constitute less than 10 percent of national frac sand demand per annum (4 million tons), if the state is home to less than 10 percent of new project sites.6 Estimating by multiplying a projected total for horizontal drilling sites in Ohio by 2015 (2,500 to 4,000) by the volume of sand required to drill each one (800 tons) produces an Ohio demand estimate ranging from 2 million to 3.2 million tons cumulatively moved over the course of three years.
Revenues are apt to be modest as well. With values for raw (uncoated) sand at approximately $60 per ton at the site of origin in 2012—roughly comparable to the value of central Appalachian coal futures in March 2013—revenue enhancement opportunities for port authorities are present but limited. A study by the U.S. Energy Information Administration (EIA) evaluated transportation costs of coal via barge from 1979 to 1997, concluding that the rate per ton fluctuated around an approximate average cost of $4 per ton for the entire barge journey.7 Even if Ohio ports could claim up to $1 per ton of the total cost of barging, it would still limit short-term revenue potential from frac sand traffic to $2 million to $3.2 million for the three-year period.
6 In fact, the SEC filings of one producer of sand proppant stated that Ohio represented only 7 percent of “frac sand” deliveries in 2012, primarily for use in the Utica Shale basin. Comparatively, Texas was the destination of 36 percent of frac sand volumes that year, with most destined for the Permian and Eagle Ford basins. Pennsylvania consumed 24 percent of frac sand tonnage with Marcellus Shale operations in 2012. (See: Hi-Crush Partners LP, Form S-1 Registration Statement to the Securities and Exchange Commission, 2012.) While Pennsylvania consumption may boost rail movements in Ohio, it is unlikely to affect waterborne trade, as the economies of scale afforded by barge are not great enough to prompt movement from truck to barge, to truck again, for Midwestern sand supply chains originating in Minnesota and Wisconsin. 7 U.S. EIA, no date, Average Utility contract coal transportation: rate per ton by transportation mode, 1979-1997. Available online at http://www.eia.doe.gov/cneaf/coal/ctrdb/ctrdb.html.

Section 4 Ohio Freight Strategy Development 4-35
ACCESS OHIO 2040
Finally, given vertical consolidation trends in the energy industry, whereby drillers are acquiring input suppliers (including frac sand mining pits), it is likely that these firms would want to construct private terminals for the unloading of sand at the ports should they decide that waterborne movements are economical. Accordingly, some of the revenue potential for port authorities in this scenario would be found in lease negotiations with prospective terminal operators, rather than cargo handling for the sand itself.
Project Cargoes So-called “project cargoes” are a good, if uneven, source of business for Lake Erie ports. Examples include component parts for wind turbines, of which there were several shiploads through Cleveland and Toledo in 2009 – 2012. Wind activity has declined with the expiration of federal tax credits, but the niche market demonstrates the utility of Ohio ports in handling oversized industrial equipment, such as large machinery, factory presses, and other specialized equipment. To capitalize on this market, Ohio ports should maintain relationships with manufacturers and heavy haulers in the region; an understanding of heavy haul routes, especially the “last mile” of the route through urban areas; and a relationship with ODOT Office of Permits for over-dimensional loads.
4.4.3 Container Service on Lake Erie Increasing containerization of metals, bulk scrap, and agricultural staples—which are key markets for Ohio ports—has renewed interest in container service on the Great Lakes. The implications of the Jones Act in terms of vessel construction and crew have made container service uneconomic for nearly all American markets, aside from those entirely dependent upon Jones Act carriers (Hawaii, Guam, Puerto Rico, etc.). Subsidized container-on-barge service based in Canada has also failed to recover the costs of operating. The seasonal nature of the Seaway as a facility, with little or no winter service, would also hinder planned operations. Additionally, the ports would face a challenge in changing their relationship with freight forwarders in the region by offering this new service.
Apart from containerized bulk, goods that travel in intermodal containers generally have a high value-to-weight ratio and are sensitive to delay and supply chain disruption. While waterborne carriage in the Midwest has been improving in terms of reliability and minimization of delays, service via river barge or
Jones Act Basics
A 1920 federal law known as the Jones Act requires that all cargo transported by water between U.S. ports, be carried on U.S. flagships, built in the U.S., owned by U.S. citizens, with a crew of U.S. citizens.
The purpose of the Jones Act was to support the U.S. maritime industry, especially to ensure capacity in times of war. Advocates of the Jones Act include the Lake Carriers Association, whose boats carry bulk cargo between U.S. Great Lakes ports.
The Jones Act limits some port business. Due to high domestic costs, most shipbuilding has moved from the U.S. to Asia and other lower-cost manufacturing areas. This and other factors limit the supply of U.S.-built flagships. Consequently, where a market might exist to ship cargo between Ohio and other Great Lakes ports, U.S. flagships may not be available to provide the service economically, and foreign-owned vessels cannot do so under federal law.
4-36 Section 4 Ohio Freight Strategy Development
ACCESS OHIO 2040
lake vessel is generally too slow when compared to trucking or even intermodal rail. Though a truck trip from Cincinnati to Wheeling, West Virginia, requires 3.5 hours via the interstate, the same journey by barge would require 35 to 38 hours. This represents a ten-fold increase in inventory costs for shippers, which is likely untenable for movers of containerized goods.
4.4.4 Other Opportunities Ohio is home to several Foreign Trade Zones (FTZs) that formerly provided some measure of support for industrial activities taking place within them. However, as the State of Ohio does not now impose an inventory tax—and one of the primary attractions of the FTZ concept was the ability to delay the tax’s collection until strategically beneficial to the zone’s commercial users—user demand for the FTZs has declined. These sites could serve as inland ports in the months for which the Seaway is not navigable or for the duration of the year.
Further considerations in pursuing these opportunities are also appropriate. First, the ports are aware that pursuing a revenue base built of project cargoes is a labor-intensive way to derive spot revenue streams of various scales. Nevertheless, the “reshoring” of manufacturing to the United States should be a spur to this kind of business, so the prospects for traffic should be continuing and growing if also intermittent. Additionally, the prominent role that private terminals play in some Ohio ports limits the revenue gain potential that is possible through increased marketing activity and cargo attraction for primary users. As of 2013, federal set-aside programs for U.S. ports mandating aid-in-kind food donations to low-income nations also face an uncertain future as shifting policy priorities have now begun to favor purchasing such aid in the countries of destination to develop agricultural economies abroad.
4.5 Ohio River Terminal Strategies
Ohio River barge terminals have unique strategic concerns, which affect how much state policies and programs can influence their development. This section outlines progressive strategies for Ohio to promote river barge terminal development.
4.5.1 Factors Governing Ohio Promotion of Barge Terminal Development Before discussing various strategic alternatives, it is helpful to review the institutional context that governs and, in some cases, limits Ohio’s influence over the development of Ohio River terminals:
Federal Lock and Dam Infrastructure: The largest public roles in the inland waterway system are the USACE’s responsibility for lock and dam construction and maintenance and the U.S. Coast Guard’s role in river navigational aids. These are federal responsibilities with congressional appropriations, and state governments generally have no role in the finance or administration of these activities.
Predominance of Single-use Barge Terminals: Most Ohio River barge terminals serve a single customer or business such as coal-fired electric-generating stations. There are rarely any public opportunities to fund or promote this infrastructure.
Section 4 Ohio Freight Strategy Development 4-37
ACCESS OHIO 2040
Private Enterprises: Most Ohio River terminals are organized as private corporations, rather than under the governance of a public port authority. Therefore, there are perils to providing public aid to one private terminal, which might be a detriment to another.
Border Issues: A barge terminal can serve a relatively large market area—25 to 100 miles would not be uncommon. Ohio markets could be adequately served by barge terminals in Kentucky, West Virginia, or Pennsylvania without the need to expend public resources to support terminals located in Ohio. Conversely, a market could be best served by a terminal in a bordering state, but Ohio would be constitutionally prohibited from providing any public aid to its development.
Within the policy context outlined above, there are still a number of strategies that Ohio can pursue to support Ohio River barge transportation.
4.5.2 Construction and Maintenance of “Last Mile” Road and Rail Connections Federal transportation legislation such as ISTEA and its successors recognized the importance of designating strategic routes in a “post-Interstate” era, first through the designation of the National Highway System (NHS), then through the designation of “NHS Connectors” to intermodal facilities such as river terminals. Ohio has developed and updated its list of NHS intermodal connectors and can strengthen these linkages in the following ways:
Survey Ohio River terminals about the capacity and safety of their intermodal road and rail connections. Such a survey would serve as part of a MAP-21 mandated performance monitoring system.
In concert with the above survey, use ODOT congestion and safety management systems to monitor road capacity and safety concerns.
Program funding to address capacity and safety deficiencies in intermodal connector roads, including ODOT District allocation, safety, major/new, and MPO-allocated programs.
Partner with the Ohio Rail Development Commission to address capacity and safety issues associated with inadequate railroad infrastructure.
4.5.3 Designating Ohio Barge Terminals as Part of Oversize/Overweight Load Routes In the Needs Analysis portion of the Ohio Freight Study, it was established that there has been an increase in oversized loads originating from Ohio manufacturers. Water routes offer both capacity and cost advantages to moving oversize loads, but each move seems to be routed on an ad hoc basis, with the identification of routes and river (or lake) terminals a novel activity each time. Strategies that could help Ohio manufacturers move oversized loads more efficiently include:
Identify all Ohio River terminals with the capability (lift capacity) to handle oversize/overweight loads. This inventory is fairly small, and by identifying all such terminals, there would be no favoritism of one over another.

4-38 Section 4 Ohio Freight Strategy Development
ACCESS OHIO 2040
Identify routes from the state highway system to those terminals, which could accommodate weight, overhead clearance, and turn radii.
Maintain and publish this list through appropriate venues, such as ODOT’s truck permits website.
Conduct and evaluate the efficacy of annual, semi-annual, or quarterly partnering sessions between ODOT Office of Permits, river and lake heavy-lift terminals, and trucking/rigging companies involved in the routing and carriage of oversize/overweight loads.
4.5.4 Participation in the Federal Marine Highway Program The America’s Marine Highway Program was established by Congress in 2007 to expand marine highway services throughout the U.S. and integrate inland and coastal waterways more fully into the nation’s freight network. Both the Ohio River and Great Lakes systems are part of America’s marine highway system, and ODOT is an active participant of the program. The program does not currently offer funding for infrastructure improvements or integration, but the potential exists in future authorizations of the federal water legislation. ODOT’s participation helps maintain the visibility of Midwest freight issues, as well as coordinate federal resources for important projects, such as lock and dam maintenance, as discussed below.
4.5.5 Advocacy for Adequate Federal Lock and Dam Funding A recent assessment of the inland waterway system found that 47 percent of inland waterway locks and dams were functionally obsolete—a number forecast to grow to 80 percent by 2020. The current $0.20 per diesel-gallon inland waterway user fee covers half the cost of lock and dam maintenance, with the other half coming from congressional appropriations.
Lock and dam maintenance on the inland waterway system is funded by the Inland Waterways Trust Fund, which is authorized under the Water Resources Development Act. This trust fund is inadequate to meet the demands of lock and dam maintenance on the system. The trust fund has a user-fee aspect since inland waterway tow companies pay a modest per-gallon tax on diesel fuel. Last year, that tax brought in $80 million, compared to federal spending of $800 million to maintain the system—the difference between revenue and spending is made up from the General Fund. Ohio transportation policymakers should be aware of two contradictory problems:
Inadequate investment in inland waterway infrastructure threatens the viability of the system and the industries that depend on it.
Inland water operators oppose increasing their user fees, arguing that the cost increase would threaten the viability of their business, which competes primarily with railroads. At the same time, the barge industry relies on transfers from the General Fund, which is under ever-increasing pressure from other obligations.
Even if lock and dam maintenance is not the statutory authority of ODOT, Ohio has a clear interest in federal efforts to keep the system in a state of good repair. Focusing on objective measures of system conditions and promoting best practices in asset management has proven to be an effective and
Section 4 Ohio Freight Strategy Development 4-39
ACCESS OHIO 2040
apolitical way to advocate for infrastructure improvements. ODOT can assume this role individually or by participating in the America’s Marine Highway Program or other venues.
4.5.6 Publicly-Sponsored Marketing and Logistics Campaigns As a final example of the industry lacking a “voice,” Ohio River terminal operators expressed in interviews that a general lack of attention to the inland waterway industry extends to shippers as well as public policymakers. There are two reasons that barge transportation does not have a higher profile:
The vast majority of barge terminals are an extension of a utility, mine, or manufacturing facility, so there is no need to market to external “customers.”
Individually, the public-use barge terminals do not have the resources or will not realize an effective return on large-scale marketing efforts.
The implication is that Ohio’s public-use barge terminals could benefit from a collective marketing effort to tell the story of Ohio’s inland waterway capabilities to a wide audience. There are smaller-scale efforts underway to pursue such a campaign. The Columbiana County Port Authority has effectively marketed the capabilities of its terminals, and the Port of Greater Cincinnati Development Authority is taking steps to provide similar services for its area terminals.
A larger-scale marketing campaign could raise the profile of the Ohio River barge industry and its capability to serve Ohio businesses and attract industry from other states. Potential tactics to fulfill this strategy include:
Cooperative partnering arrangements with the State of Ohio, such as through the Ohio Council of Port Authorities
Seed money for marketing strategy and materials, via grants from local, Ohio or federal agencies
Development of electronic and printed material to convey the breadth and depth of Ohio River shipping capabilities through Ohio terminals
Presence at national and global trade events and forums

ACCESS OHIO 2040
5. CONCLUSIONS AND IMPLEMENTATION Within state departments of transportation, there is a growing awareness of freight transportation planning as a subset of broader transportation planning obligations. Freight planning is now institutionalized in federal law, with MAP-21 encouraging each state to develop a freight plan, which in turn requires review and approval by the FHWA. ODOT has a firm foundation for freight planning as in-house expertise has developed since at least the 1970s:
In 1979, the General Assembly appropriated funding for property acquisition on behalf of the Columbiana County Port Authority, which was administered by the Ohio Department of Transportation. This action led to the development of staff in ODOT’s planning offices, who understood and tracked water-transportation developments.
From 1983 to 1990, ODOT established work units for rail, aviation, and water transportation, which were organizationally on par with ODOT’s highway division. ODOT administered modest grant programs for its respective modes.
In the early 1990s, these work units were absorbed into ODOT’s planning operations with the exception of rail, which was reformed as the Ohio Rail Development Commission (ORDC), an independent entity within ODOT.
In the 2000s, although ODOT did not recognize a formal freight program, the agency sponsored significant work in researching freight trends and forecasts, publishing Freight Impacts on Ohio’s Highway System and sponsoring research on railroad freight bottlenecks. At the same time, the ORDC has continued its program to monitor rail freight trends and assist railroads with capital investments.
In 2009, ODOT used federal economic stimulus funds to make significant investments in freight infrastructure, including the CSX National Gateway, Ohio River barge access roads, and a mobile harbor crane for the Port of Toledo.
With this history and track record, ODOT’s staff understands freight planning and programs. The agency is well positioned to carry out planning activities and implement strategies and programs emerging from this study. Specific actions and activities follow.
5.1 Developing State Freight Plan in Compliance with MAP-21
ODOT initiated its statewide freight study before passage of the MAP-21 federal transportation bill. MAP-21 encourages each state to have a freight plan, with a few provisions that were not contemplated in the scope of the freight study. MAP-21 freight plan requirements include analysis of the following:
Freight system trends, needs, and issues
5-2 Section 5 Conclusions and Implementation
ACCESS OHIO 2040
Freight policies, strategies, and performance measures to guide transportation investment
How the plan will improve the ability of the state to meet the national freight goals
Consideration of innovative technologies/operational strategies (such as ITS) that improve freight safety and efficiency
Description of improvements to reduce or impede freight deterioration on heavy vehicle routes
Inventory of facilities with freight mobility issues such as bottlenecks, and description of the strategies to address those issues
By and large, the statewide freight study addresses most of the requirements of MAP-21. An addendum to this study will enable ODOT to provide a compliant freight plan.
5.2 Freight Planning in the Context of the State Transportation Plan, Access Ohio
This statewide freight study and subsequent plan are integral to Access Ohio, ODOT’s long-range state transportation plan. While the work has developed in parallel, the freight rail plan and Access Ohio teams have interfaced at several critical junctures in the planning process, resulting in a seamless work product.
5.2.1 Creation and Verification of the Roadway Freight Network The most important interface in coordination with Access Ohio was designation of the roadway freight network (Figure 4-1). This freight network was developed independently of Access Ohio road hierarchies, with the outputs of the parallel planning efforts compared and verified.
The roadway freight network will have practical applications to ODOT. Under MAP-21, projects on the freight network will be eligible for a higher percentage federal match, which will allow ODOT to conserve its state funds (which are devoted to federal-aid match, operations and maintenance).
5.2.2 Ongoing Freight Planning Activities What is freight planning? It is a fair question and important for ODOT to understand as an institution. First and foremost is having staff resources who understand the basic concepts of freight markets, the actions and motivations of private companies engaged in freight transportation, and the dynamic factors that influence them.
ODOT has a good foundation for freight planning with a veteran planner overseeing freight activities for the department, strong leadership in its truck permitting operation, and the ORDC staff who are experts in freight rail trends and freight transportation in general.
While it is not necessary to have a formal freight-planning office (though ODOT has in the past and other states do), it is important to recognize the function of freight planning within ODOT’s organization. Specific activities, which ODOT is doing and should continue, include the following:
Having a point person to understand statewide and national freight issues. This person would of course advise executive staff on contemporary freight issues that may arise. Just as importantly,
Section 5 Conclusions and Implementation 5-3
ACCESS OHIO 2040
this position has to understand when freight investments are unwise or unviable, and advise accordingly.
Attending freight-related meetings on behalf of ODOT, such as the Ohio Port Authority Council, meetings of the ORDC, and annual freight conferences.
Meeting with constituents regarding requests for state investments in freight infrastructure.
Interfacing with the Travel Demand Modeling work unit to develop the statewide travel demand model and use it to analyze emerging trends or issues as has been done with the shale gas industry and the Panama Canal analysis.
Possible enhancements include creating a formal freight advisory committee (made up of private and public participants) to advise the department on freight trends and policies. Such committees were suggested by MAP-21 and might serve a purpose similar to members of the ORDC, which meet regularly to review staff-level activities and investment decisions. As planning at the state and federal levels sharpen their focus on performance, the perspectives of freight users will be helpful in determining the performance that matters most, and most supports the link between transportation results and economic competitiveness. The freight world is highly changeable—no one was talking about a natural gas boom or re-shored manufacturing even five years ago—and a freight committee can help the state stay on top of the opportunities as well as the challenges that change brings.
In addition, ODOT should encourage the development of freight knowledge with more of the state’s planning staff and have a structure that encourages continuity of program knowledge, independent of any one individual.
5.3 Freight Investments and Strategy Implementation
There are a number of strategies suggested by this freight study, which creates a weighty agenda for ODOT to implement. Examples include creating natural gas fuel stations; promoting expanded truck parking; consolidating federal port investments; upgrading to 286,000 pound rail; and creating pilot programs for LCV expansion. It is most likely that ODOT will pursue only a subset of all strategies. Regardless, ODOT’s freight program can take the following actions to advance these strategies.
Meet with ODOT executive management to determine the specific strategic initiatives to advance on a short-, medium- and long-term basis. In lieu of executive direction, freight staff will need to prioritize strategies.
Identify the partnerships required for implementation. Two examples are:
Natural gas distribution: Partnering with state MPOs can help sponsor and fund (via federal Congestion Mitigation Air Quality funding) natural gas fueling stations, as has been done in Central Ohio.
Interface with the Ohio Jobs and Family Service Department to investigate impediments to the employment of new truck drivers.
5-4 Section 5 Conclusions and Implementation
ACCESS OHIO 2040
Another major issue is the identification and programming of specific freight investments. Freight investments are encouraged by MAP-21, but ODOT’s capital investments are governed by a semi-autonomous oversight body—the Transportation Review Advisory Council (TRAC). The TRAC has already been briefed on the statewide freight study and has a working knowledge of the importance of freight infrastructure investments.
The roadway freight network creates a route structure upon which projects can become eligible for a higher federal-aid share.
TRAC publishes criteria for project selection, which is currently under redevelopment, offering a good opportunity to revamp freight project selection criteria.
Part of MAP-21 compliance will involve demonstrating the importance of ODOT’s current investment portfolio to the freight system, as a good percentage of ODOT’s projects address current freight bottlenecks.
These issues will be addressed in the development of the Statewide Freight Plan.