ohio historic preservation tax credit economic impact study
TRANSCRIPT

Cleveland State University Cleveland State University
EngagedScholarship@CSU EngagedScholarship@CSU
Urban Publications Maxine Goodman Levin College of Urban Affairs
10-2015
Ohio Historic Preservation Tax Credit Economic Impact Study Ohio Historic Preservation Tax Credit Economic Impact Study
Iryna Lendel Cleveland State University, [email protected]
Candi Clouse Cleveland State University, [email protected]
Ellen Cyran Cleveland State University, [email protected]
Tatyana Guzman Cleveland State University, [email protected]
Merissa Piazza Cleveland State University, [email protected]
See next page for additional authors
Follow this and additional works at: https://engagedscholarship.csuohio.edu/urban_facpub
Part of the Urban Studies and Planning Commons
How does access to this work benefit you? Let us know! How does access to this work benefit you? Let us know!
Repository Citation Repository Citation Lendel, Iryna; Clouse, Candi; Cyran, Ellen; Guzman, Tatyana; Piazza, Merissa; Ryberg Webster, Stephanie; Post, Charlie; and Kalynchuk, Kenneth, "Ohio Historic Preservation Tax Credit Economic Impact Study" (2015). Urban Publications. 0 1 2 3 1334. https://engagedscholarship.csuohio.edu/urban_facpub/1334
This Report is brought to you for free and open access by the Maxine Goodman Levin College of Urban Affairs at EngagedScholarship@CSU. It has been accepted for inclusion in Urban Publications by an authorized administrator of EngagedScholarship@CSU. For more information, please contact [email protected].

Authors Authors Iryna Lendel, Candi Clouse, Ellen Cyran, Tatyana Guzman, Merissa Piazza, Stephanie Ryberg Webster, Charlie Post, and Kenneth Kalynchuk
This report is available at EngagedScholarship@CSU: https://engagedscholarship.csuohio.edu/urban_facpub/1334

2121 Euclid Avenue Cleveland, Ohio
44115
http://urban.csuohio.edu
OHIO HISTORIC
PRESERVATION
TAX CREDIT
ECONOMIC
IMPACT STUDY
Prepared for:
Ohio Development Services Agency
October 2015
December 30, 2014
Center for
Economic
Development

Prepared for:
Ohio Development Services Agency
Prepared by:
Center for Economic Development
Maxine Goodman Levin College of Urban Affairs
Cleveland State University
October 2015


Table of Contents Executive Summary ....................................................................................................................................... 1
1. Introduction ............................................................................................................................................ 11
2. Methodology ........................................................................................................................................... 11
3. Descriptive Analysis of the Ohio Historic Preservation Tax Credit Program ........................................... 15
4. Economic Contribution of the OHPTC Program to Employment, Population, and Property Values of
Preserved Buildings and Surrounding Areas ............................................................................................... 22
5. The Ohio Historic Preservation Tax Credit in Action: Case Studies from around the State ................... 38
6. Financial Analysis: Property Tax Impacts and Cost-Benefit Analysis ...................................................... 78
7. Economic Impact of OHPTC Projects ...................................................................................................... 92
Appendix A: Literature References ........................................................................................................... 103
Appendix B: Survey Questionnaire ........................................................................................................... 104
Appendix C: Real Estate Property Data ..................................................................................................... 109
Appendix D: About the Study Team .......................................................................................................... 112

List of Figures
Figure 1. Ohio Historic Preservation Tax Credit Approved Projects ........................................................... 16
Figure 2. OHPTC Projects by County ........................................................................................................... 17
Figure 3. Construction and Operational Jobs Created by OHPTC Projects ................................................. 18
Figure 4. Estimated Operational Employment by Building Use .................................................................. 19
Figure 5. Projected 2015 Operational Employment by Type of Building Usage ......................................... 19
Figure 6. Space Created in Renovated Buildings, Square Feet ................................................................... 20
Figure 7. Survey Answers to a Question If the Project Would Have Moved Forward without the
OHPTC…… .................................................................................................................................................... 21
Figure 8. Location of Residential and Non-Residential Projects within Census Tracts 1077.01 and
1078.02 in Cleveland ................................................................................................................................... 31
Figure 9. Location of Residential and Non-Residential Projects in Cincinnati ............................................ 32
Figure 10. Map of Ohio Showing Case Study Locations .............................................................................. 40
Figure 11. The Cleveland Trust Complex, with the Rotunda in the foreground ......................................... 49
Figure 12. Interior of Heinen's grocery store in the Rotunda .................................................................... 50
Figure 13. Old Ohio School for the Deaf/Cristo Rey Columbus High School .............................................. 55
Figure 14. Entrance to Cristo Rey................................................................................................................ 56
Figure 15. Interior hallway at Cristo Rey ..................................................................................................... 56
Figure 16. Horizon House ............................................................................................................................ 59
Figure 17. Entrance to Horizon House ........................................................................................................ 60
Figure 18. John T. Wilson Homestead......................................................................................................... 64
Figure 19. John T. Wilson Homestead, including some of the grounds ...................................................... 64
Figure 20. Goodyear Hall, with the gymnasium in the foreground ............................................................ 69
Figure 21. Goodyear Hall's E. Market Street facade, with the Ohio Savings & Trust Bank ........................ 70
Figure 22. Goodyear Hall's gymnasium, under renovation ........................................................................ 70
Figure 23. Goodyear Hall's Ballroom, Restored as a Community Room and Rental Space ........................ 71
Figure 24. Illuminated Goodyear sign atop Goodyear hall ......................................................................... 71
Figure 25. The Kress Building before demolition (courtesy of the Youngstown Area CIC) ........................ 75
Figure 26. W. Federal Street, with a chain link fence along the parking lot where the Kress building
stood.. ......................................................................................................................................................... 75
Figure 27. The sunken parking lot on the site of former Kress building, view from W. Federal Street ..... 76
Figure 28. Pre-Rehabilitation Descriptions ................................................................................................. 77
Figure 29. Frequencies of Post-Rehabilitation Descriptions ....................................................................... 77
Figure 30. Compliance costs (Based on the survey results) ........................................................................ 86
Figure 31. Federal and state applications submitted and awarded between 2000 and 2015 ................... 87
Figure 32. Average compliance costs for OHPTC projects .......................................................................... 88
Figure 33. Top 10 Industries in Terms of Employment Direct and Indirect Impact .................................... 95
Figure 34. Labor Income, Value Added, and Output Impact by Effect, 2015 (2015$) ................................ 96
Figure 35. Top 10 Industries in Terms of Average Annual Employment Direct and Indirect Impact, 2008-
2015 ............................................................................................................................................................ 98
Figure 36. Labor Income, Value Added, and Output Impact by Effect, 2008-2015 (2015$) ...................... 99
Figure 37. Average Annual Employment for Construction, 2008-2020 .................................................... 100
List of Tables
Table 1. OHPTC Projects Cost over Time (nominal $) ................................................................................. 16
Table 2. Status of OHPTC Approved Projects, 2014 .................................................................................... 17
Table 3. Dynamics of Business Establishments in the OHPTC Project Buildings, 2008-2014 ..................... 25
Table 4. Dynamics of Employment in the OHPTC Project Buildings, 2008-2014 ........................................ 26
Table 5. Dynamics of Wages in the OHPTC Project Buildings, 2008-2014 .................................................. 27
Table 6. Employment in Buildings Located within 500 feet of Project Buildings ....................................... 28
Table 7. Changes in Population by Census Tract ........................................................................................ 31
Table 8. Changes in Housing Units by Tract, ACS Data ............................................................................... 33
Table 9. Housing Unit Census Tract, USPS .................................................................................................. 34
Table 10. Counties and Number of Projects Included in Analysis .............................................................. 35
Table 11. Taxable Property Valuation Before and After OHPTC Projects ................................................... 36
Table 12. All Property Valuations (including Exempt) Before and After OHPTC Projects .......................... 37
Table 13. Property Taxes Before and After Completion of OHPTC Projects ............................................... 37
Table 14. Case Study Summary ................................................................................................................... 40
Table 15. Case Study Selection by End Land Use (excluding the unfunded Kress Building) ....................... 41
Table 16. Summary of Interviews ............................................................................................................... 41
Table 17. Costs-Benefits Estimates for OHPTC Projects from Government Perspective at Discount Rates
2.8 and 2.05 ................................................................................................................................................ 90
Table 18. Costs-Benefits Estimates for OHPTC Projects from Government Perspective at Discount Rates
2.4 and 3.22 ................................................................................................................................................ 91
Table 19. OHPTC Project Details ................................................................................................................. 93
Table 20. Additional Direct & Indirect Operations Impact, 2015 (In 2015 USD$) ...................................... 94
Table 21. Direct and Indirect Economic Impact of Construction, 2008-2015 ............................................. 97
Table 22. Direct and Indirect Economic Impact of Construction by Year, 2008-2015 ................................ 97
Table 23. Direct and Indirect Economic Impact of Construction, 2008-2015 ............................................. 98
Table 24. Direct and Indirect Economic Impact of Construction, 2016-2020 ........................................... 100
Table 25. Operations Direct and Indirect Impact per Employee and per Dollar spent on OHPTC Program,
2014 .......................................................................................................................................................... 101
Table 26. Construction Direct and Indirect Impact per Employee and per Dollar spent on OHPTC
Program, 2008-2015 ................................................................................................................................. 101


Ohio Historic Preservation Tax Credit Economic Impact Study
Center for Economic Development, Cleveland State University Page 1
Executive Summary
In the sunset of the 1990s and beginning of the Millennium, historic designation of properties has become
an important tool increasingly used to preserve cultural heritage, revive central-city neighborhoods, and
stimulate community economic development. Many academic studies illustrated that historic
preservation has a positive impact on property values (Zahirovic-Herbert and Chatterjee, 2010;
Leicheanko et al., 1999; Clark and Herrin, 1997; Schaeffer and Millerick, 1991).1 Since 2005, historic
preservation became part of the sustainable growth concept emphasizing property values, the reuse of
historic buildings, integration of culture and multi-functional landscapes, and environmental stewardship.
There is a scarcity of literature measuring direct economic benefits of historic designation outside of
impact studies based on multiplier effect or research assessing community values of historic properties
rehabilitation. Bowtz and Ibenholt (2009), Doyle (2010), Gleaser (2011), Mason (2008) and Snowball
(2008) outlined the relationships between historic preservation and economic development; these
studies inspired the research design for this study.
The Ohio Historic Preservation Tax Credit (OHPTC) Program is administered by Ohio’s Development
Services Agency to leverage the private redevelopment of historic buildings. The program provides a tax
credit for the rehabilitation expenses incurred by owners of historically significant buildings located across
the state. The tax credits subsidize up to 25% of qualified rehabilitation expenditures for historic
rehabilitation projects, capped at $5 million per project (Figure I). Tax credits are awarded bi-annually in
June and December. The credits are leveraged to supplement pre-existing financing, which can include
private sources as well as the 20% Federal Historic Preservation Tax Credit. The state has a $60 million
limit on its tax credit awards per fiscal year. In 2014, the state of Ohio extended the tax credit program
by approving the catalytic project award, which provides up to $25 million in total tax credits (over 5 years)
for especially large and impactful projects. One catalytic award may be approved each two-year state
fiscal biennium, which is subject to the $60 million program cap.
Figure I. Ohio Historic Preservation Tax Credit Approved Projects
1 See detailed references for the literature in Appendix A.
0
10
20
30
40
50
60
70
$-
$200
$400
$600
$800
$1,000
$1,200
2007 2008 2009 2010 2011 2012 2013 2014
Mill
ion
OHPTC Amount Total Project Cost Annual Number of Projects
Ohio Historic Preservation Tax Credit Economic Impact Study
Center for Economic Development, Cleveland State University Page 2
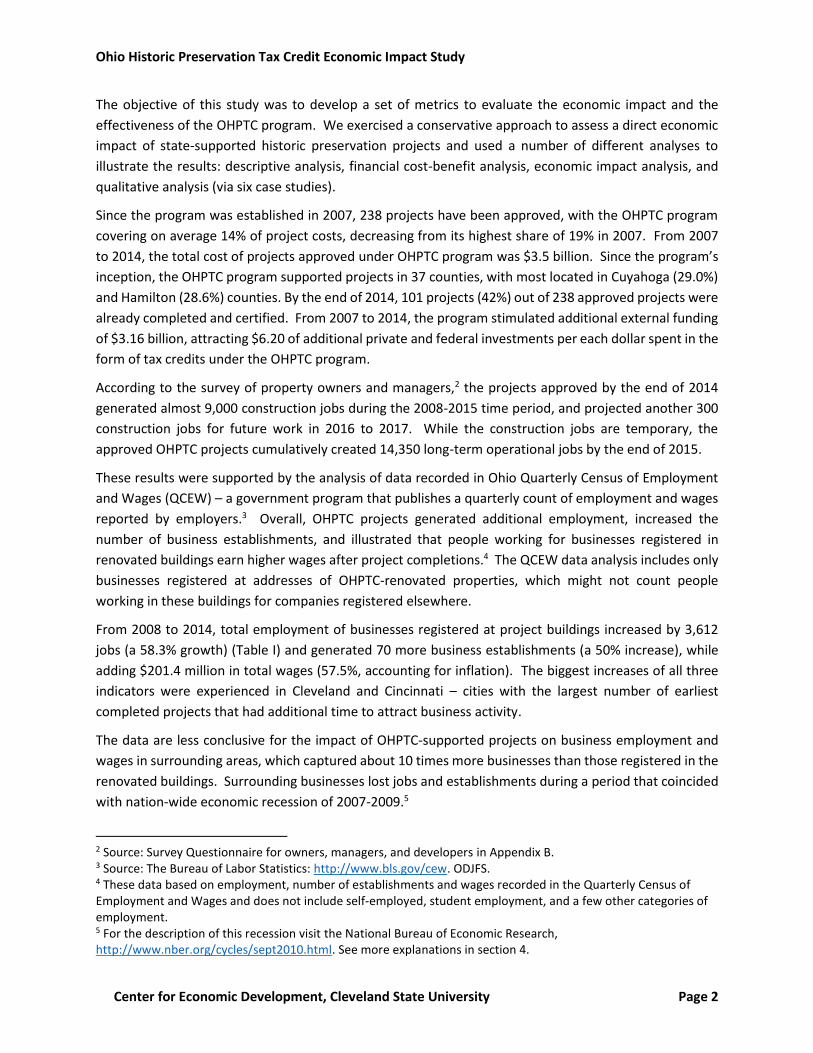
The objective of this study was to develop a set of metrics to evaluate the economic impact and the
effectiveness of the OHPTC program. We exercised a conservative approach to assess a direct economic
impact of state-supported historic preservation projects and used a number of different analyses to
illustrate the results: descriptive analysis, financial cost-benefit analysis, economic impact analysis, and
qualitative analysis (via six case studies).
Since the program was established in 2007, 238 projects have been approved, with the OHPTC program
covering on average 14% of project costs, decreasing from its highest share of 19% in 2007. From 2007
to 2014, the total cost of projects approved under OHPTC program was $3.5 billion. Since the program’s
inception, the OHPTC program supported projects in 37 counties, with most located in Cuyahoga (29.0%)
and Hamilton (28.6%) counties. By the end of 2014, 101 projects (42%) out of 238 approved projects were
already completed and certified. From 2007 to 2014, the program stimulated additional external funding
of $3.16 billion, attracting $6.20 of additional private and federal investments per each dollar spent in the
form of tax credits under the OHPTC program.
According to the survey of property owners and managers,2 the projects approved by the end of 2014
generated almost 9,000 construction jobs during the 2008-2015 time period, and projected another 300
construction jobs for future work in 2016 to 2017. While the construction jobs are temporary, the
approved OHPTC projects cumulatively created 14,350 long-term operational jobs by the end of 2015.
These results were supported by the analysis of data recorded in Ohio Quarterly Census of Employment
and Wages (QCEW) – a government program that publishes a quarterly count of employment and wages
reported by employers.3 Overall, OHPTC projects generated additional employment, increased the
number of business establishments, and illustrated that people working for businesses registered in
renovated buildings earn higher wages after project completions.4 The QCEW data analysis includes only
businesses registered at addresses of OHPTC-renovated properties, which might not count people
working in these buildings for companies registered elsewhere.
From 2008 to 2014, total employment of businesses registered at project buildings increased by 3,612
jobs (a 58.3% growth) (Table I) and generated 70 more business establishments (a 50% increase), while
adding $201.4 million in total wages (57.5%, accounting for inflation). The biggest increases of all three
indicators were experienced in Cleveland and Cincinnati – cities with the largest number of earliest
completed projects that had additional time to attract business activity.
The data are less conclusive for the impact of OHPTC-supported projects on business employment and
wages in surrounding areas, which captured about 10 times more businesses than those registered in the
renovated buildings. Surrounding businesses lost jobs and establishments during a period that coincided
with nation-wide economic recession of 2007-2009.5
2 Source: Survey Questionnaire for owners, managers, and developers in Appendix B. 3 Source: The Bureau of Labor Statistics: http://www.bls.gov/cew. ODJFS. 4 These data based on employment, number of establishments and wages recorded in the Quarterly Census of Employment and Wages and does not include self-employed, student employment, and a few other categories of employment. 5 For the description of this recession visit the National Bureau of Economic Research, http://www.nber.org/cycles/sept2010.html. See more explanations in section 4.

Ohio Historic Preservation Tax Credit Economic Impact Study
Center for Economic Development, Cleveland State University Page 3
Table I. Dynamics of Employment in Businesses Registered at the OHPTC Project Buildings, 2008-2014
Category of
Employment Geography
Employment Change Percent
Change
2008 2014 2008-2014 2008-2014
Retained Cincinnati 74 151 78 51.3%
Retained Cleveland 2,061 3,293 1,231 37.4%
Retained Columbus/Akron/Youngstown 275 291 16 5.6%
Retained Other areas 173 179 6 3.2%
Retained All areas 2,583 3,914 1,331 34.0%
"New" All areas 2,281
Total All areas 2,583 6,194 3,612 58.3%
Source: Quarterly Census of Employment and Wages (QCEW).
Two census tracts in downtown Cleveland show the most reliable statistics on population gains in
proximity to OHPTC projects. These tracts are in downtown Cleveland where a few new-build residential
construction projects and a number of non-residential projects occurred between 2007 and 2013 (Figure
II). A total of 7 residential OHPTC projects were completed in these two tracts, adding a total of 531
residential units. These two tracts added a combined population of 1,888 residents between 2000 and
2010. The American Community Survey estimates showed an addition of 1,400 residents between 2006-
2010 and 2009-2013.
Cleveland has the earliest certified projects completed with OHPTC, and therefore allows the longest
interval between the time when projects were completed and when the population dynamics were
measured. Moreover, a number of downtown Cleveland projects were located within close proximity
of each other and perhaps created a scale effect where consumer confidence was gained due to updates
in multiple properties (both residential and non-residential). In Cleveland, tract 1077.01 added 709
residents between 2000 and 2010, and 381 (25%) between ACS periods, compared to the 332 units
added through six projects in the tract between 2009 and 2011. Tract 1078.02 added 1,179 residents
between 2000 and 2010, and 1,019 between ACS periods. The one tax credit project in the tract added
199 residential units between 2009 and 2011.

Ohio Historic Preservation Tax Credit Economic Impact Study
Center for Economic Development, Cleveland State University Page 4
Figure II. Location of Residential and Non-Residential Projects within Census Tracts 1077.01 and 1078.02
in Cleveland
Consistently with other research conducted at the national and state level, our results illustrated the
increase in the OHPTC-renovated property value and the values of surrounding properties. Our analysis
was based on the data collected from County Auditor and Treasurer Records on 71 projects certified for
completion before 2014.6 Research results on OHPTC properties illustrated that the taxable value of
project parcels increased by about $208 million overall, or 258%, while adjacent and radial parcels7
increased their values by 12% and 26%, accordingly (Table II).
6 The projects selected for this analysis were certified and completed by the end of 2014 to allow one full year (2014) for the assessment to be completed and recorded in the Auditor’s data. 7 Radial parcels are those not adjacent to the project parcel(s) but located within 150 feet based on the center of a parcel.
Ohio Historic Preservation Tax Credit Economic Impact Study
Center for Economic Development, Cleveland State University Page 5
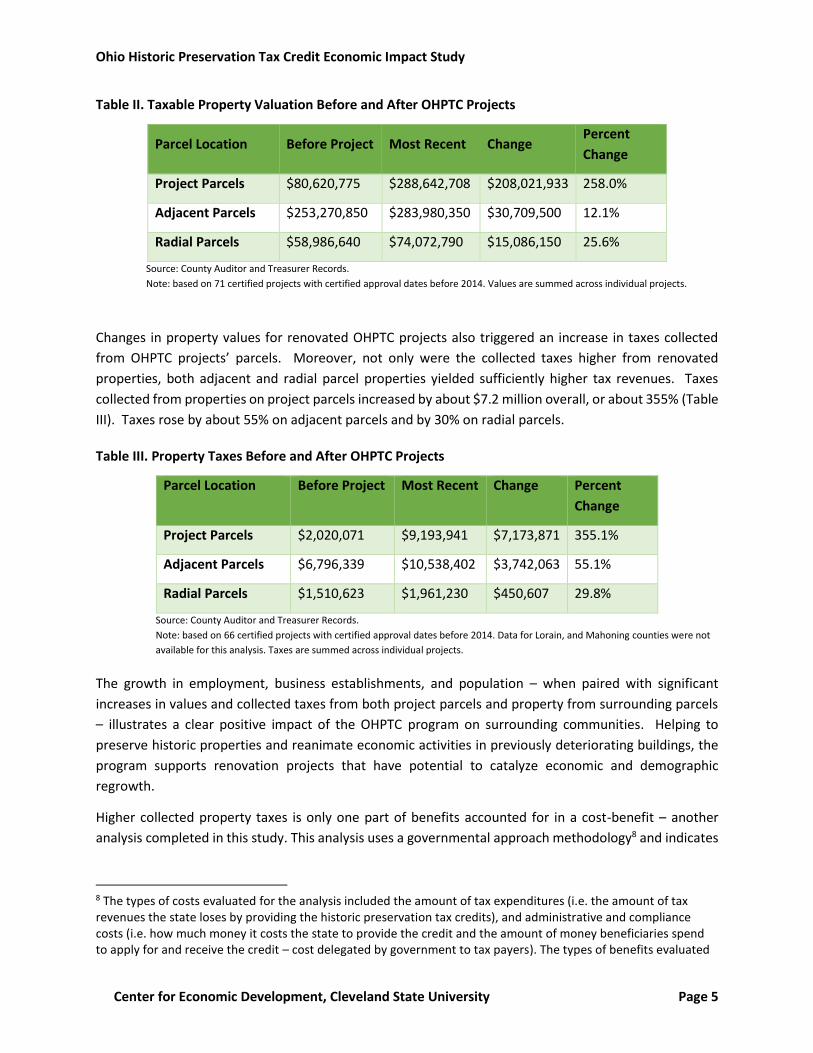
Table II. Taxable Property Valuation Before and After OHPTC Projects
Parcel Location Before Project Most Recent Change Percent
Change
Project Parcels $80,620,775 $288,642,708 $208,021,933 258.0%
Adjacent Parcels $253,270,850 $283,980,350 $30,709,500 12.1%
Radial Parcels $58,986,640 $74,072,790 $15,086,150 25.6%
Source: County Auditor and Treasurer Records.
Note: based on 71 certified projects with certified approval dates before 2014. Values are summed across individual projects.
Changes in property values for renovated OHPTC projects also triggered an increase in taxes collected
from OHPTC projects’ parcels. Moreover, not only were the collected taxes higher from renovated
properties, both adjacent and radial parcel properties yielded sufficiently higher tax revenues. Taxes
collected from properties on project parcels increased by about $7.2 million overall, or about 355% (Table
III). Taxes rose by about 55% on adjacent parcels and by 30% on radial parcels.
Table III. Property Taxes Before and After OHPTC Projects
Parcel Location Before Project Most Recent Change Percent
Change
Project Parcels $2,020,071 $9,193,941 $7,173,871 355.1%
Adjacent Parcels $6,796,339 $10,538,402 $3,742,063 55.1%
Radial Parcels $1,510,623 $1,961,230 $450,607 29.8%
Source: County Auditor and Treasurer Records.
Note: based on 66 certified projects with certified approval dates before 2014. Data for Lorain, and Mahoning counties were not
available for this analysis. Taxes are summed across individual projects.
The growth in employment, business establishments, and population – when paired with significant
increases in values and collected taxes from both project parcels and property from surrounding parcels
– illustrates a clear positive impact of the OHPTC program on surrounding communities. Helping to
preserve historic properties and reanimate economic activities in previously deteriorating buildings, the
program supports renovation projects that have potential to catalyze economic and demographic
regrowth.
Higher collected property taxes is only one part of benefits accounted for in a cost-benefit – another
analysis completed in this study. This analysis uses a governmental approach methodology8 and indicates
8 The types of costs evaluated for the analysis included the amount of tax expenditures (i.e. the amount of tax revenues the state loses by providing the historic preservation tax credits), and administrative and compliance costs (i.e. how much money it costs the state to provide the credit and the amount of money beneficiaries spend to apply for and receive the credit – cost delegated by government to tax payers). The types of benefits evaluated

Ohio Historic Preservation Tax Credit Economic Impact Study
Center for Economic Development, Cleveland State University Page 6
that starting in 2024, the OHPTC program should generate positive net benefits. The assessment shows
that the costs of providing the credit have so far outweighed the monetary benefits for the state and local
government. In general, the OHPTC program has generated approximately $90.3 million in benefits over
the eight years since its inception in 2007, while the combined costs of providing the credit over the same
time totaled approximately $201.1 million (including almost $28 million in compliance cost delegated by
government to taxpayers to collect necessary information for providing tax credits).
The project estimates yield a positive net-results sooner with a lower discount rate (2.05%) and later with
a higher discount rate (3.22%).9 The OHPTC program is, however, very young. While costs of providing
the credits were incurred even before the program officially commenced (in 2006-2007), the benefits
began to accumulate during construction phase and mainly after the first projects were completed (not
earlier than 2009). As more projects are completed, the benefits from the program have been shown to
grow at an increasing rate, while most costs have remained stable during the last three to five years.
Under the preferred analysis (2.80% discount rate), the benefits from the OHPTC projects are estimated
to be around $956.4 million (mostly from property tax collections) over the next 15 years, while the costs
will total approximately $486.3 million between 2016 and 2030. These changes will total an estimated
$470 million in net benefits over the next 15 years.
Since the governmental approach of the cost-benefit analysis does not account for benefits to the
communities and individuals, a multiplier-based economic impact modeling was used to project benefits
to a broader business community and individuals. The OHPTC projects completed by the end of 2014
created approximately 12,200 direct and indirect jobs as an employment in operations of businesses in
renovated properties and their suppliers (Table IV). Besides jobs in the real estate industry, the
employment created in the supply chain adds workers to such industries as hospitality and restaurant
services, maintenance and repair construction, services to buildings, investigation and security services,
landscape and horticultural services and many others.
Table IV. Additional Direct & Indirect Operations Impact, 2015 (In 2015 USD$)
Impact Type Employment Labor Income Value Added Output
Direct Effect 9,606 $977,859,720 $1,897,759,387 $1,522,258,124
Indirect Effect 2,608 $115,858,173 $199,752,881 $350,923,044
Direct + Indirect Effect 12,214 $1,093,717,893 $2,097,512,268 $1,873,181,168
Temporary construction jobs while estimated as an equivalent to annual employment created 3,244 of
average annual jobs during the 2008-2015 time period (Table V). Over the last three years, 2013-2015,
the annual estimated construction jobs were growing from 3,495 in 2013 to 3,693 in 2014 and 4,958 in
for the analysis include additional generated state and local tax revenues (including property, sales, and income tax revenues). 9 Discount rate is the rate used to discount future costs and benefits to their present value.
Ohio Historic Preservation Tax Credit Economic Impact Study
Center for Economic Development, Cleveland State University Page 7
2015. As a number of OHPTC projects would be growing, the annual employment in construction and
operations of renovated building will also increase.
Table V. Direct and Indirect Economic Impact of Construction, 2008-2015
Employment* Payroll Value Added Output
Direct Effect 1,911 $974,940,997 $993,265,361 $2,710,717,438
Indirect Effect 1,333 $462,006,346 $796,099,050 $1,495,086,005
Direct + Indirect Effect 3,244 $1,436,947,343 $1,789,364,411 $4,205,803,443
*Average annual employment
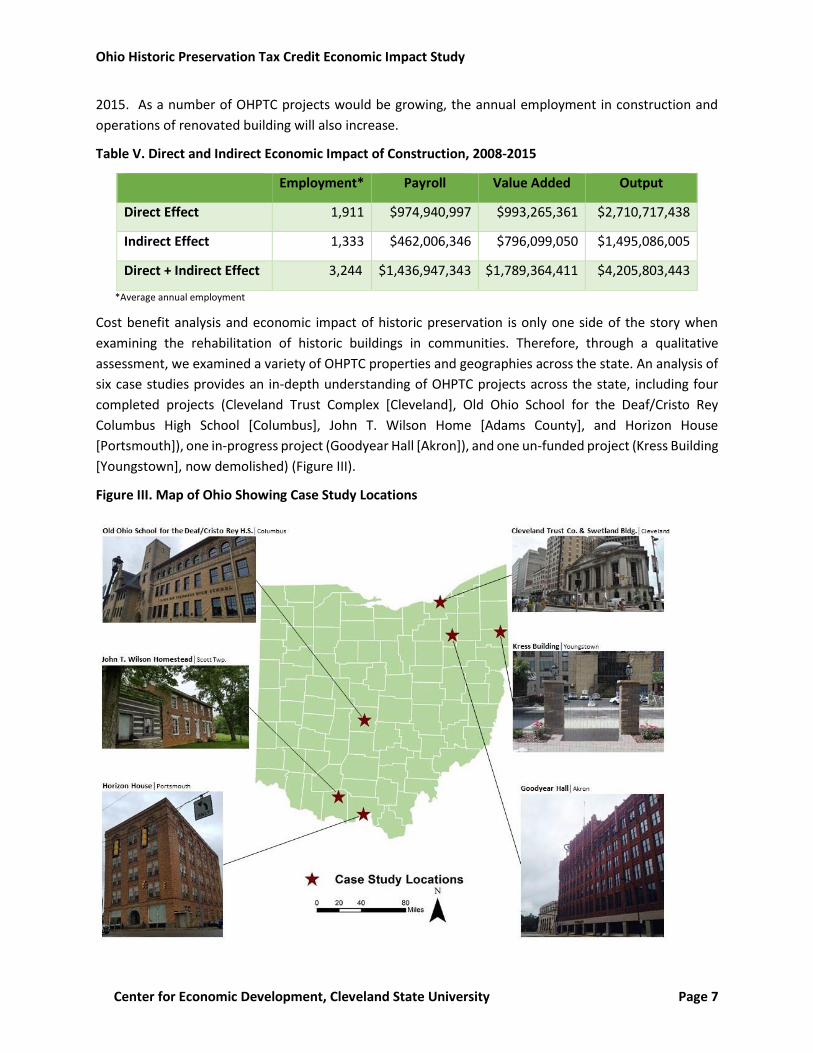
Cost benefit analysis and economic impact of historic preservation is only one side of the story when
examining the rehabilitation of historic buildings in communities. Therefore, through a qualitative
assessment, we examined a variety of OHPTC properties and geographies across the state. An analysis of
six case studies provides an in-depth understanding of OHPTC projects across the state, including four
completed projects (Cleveland Trust Complex [Cleveland], Old Ohio School for the Deaf/Cristo Rey
Columbus High School [Columbus], John T. Wilson Home [Adams County], and Horizon House
[Portsmouth]), one in-progress project (Goodyear Hall [Akron]), and one un-funded project (Kress Building
[Youngstown], now demolished) (Figure III).
Figure III. Map of Ohio Showing Case Study Locations

Ohio Historic Preservation Tax Credit Economic Impact Study
Center for Economic Development, Cleveland State University Page 8
These selected case studies and many other historic building rehabilitations are helping to advance Ohio’s
21st century economy by bringing much-needed mixed-use, hospitality, residential – including affordable
and senior housing – and institutional facilities to communities across the state (Table VI).
Table VI. Case Study Summary
Case Study City Size
General
Location
within Ohio
Total
Project
Cost
OHPTC
OHPTC
Funding
Round
Building Size
(sq. ft.)
Cleveland Trust Complex Large Northeast $230M $31M 1 555,714
Horizon House Small South $8.1M $1.5M 3 29,975
Old Ohio School for the Deaf Large Central $22.5M $3.89M 10 81,145
John T. Wilson Home Rural South $576,715 $61,756 1 2,800
Goodyear Hall Medium Northeast $36M $5M 10 292,000
Kress Building Medium Northeast n/a n/a 6 & 7
(denied)
n/a
(demolished)
Universally, the case studies show that the OHPTC is a critical component of project financing, with direct
economic and community benefits. For the Cleveland Trust Complex, a critical decision by the state to
award what amounted to a catalytic credit (before such a credit existed), pulled the project from the brink
of demolition. The resulting complex, including the upscale Metropolitan at the 9 hotel, the Heinen’s
Grocery Store in the Ameritrust Rotunda, and the residences at 1010 Euclid, has become a cornerstone of
ongoing revitalization along the city’s E. 9th Street corridor. The rehabilitation of the Old Ohio School for
the Deaf as Cristo Rey Columbus High School has multiple community benefits, from bringing high-school
students to downtown Columbus to reinvigorating a long-dormant property and catalyzing activity in an
area of town with other important community uses - including the Columbus Public Library. The adaptive
reuse of Goodyear Hall is anchoring the larger transformation of Akron’s East End, while smaller projects
such as the John T. Wilson Home in Adams County support tourism – a major economic driver in much of
Ohio. Portsmouth’s Horizon House has not only resulted in a high-quality, well-maintained property along
the city’s main street, but has also provided local senior residents with quality affordable housing in a
walkable location.
The case studies also illustrate that the OHPTC has intangible benefits that are difficult to quantify.
Interviewees from across the state articulated that it was important for the psyche of their community to
preserve these structures. In the words of Peter Goffstein (IRG, developer of Goodyear Hall): “Goodyear
is Akron’s history.” Brandon Kline (Geis Properties), developer of the Cleveland Trust Complex, expressed
a similar sentiment, arguing that one of the project’s greatest benefits was shifting perceptions about
downtown Cleveland’s real estate market through Geis’ success in “charging rents […] that everyone
thought were unreal,” with a 200-person waiting list. Across the board, it is clear that these buildings,
while useful economic engines, are also intricately intertwined with the identity, meaning and heritage of
the state’s neighborhoods, towns and cities.

Ohio Historic Preservation Tax Credit Economic Impact Study
Center for Economic Development, Cleveland State University Page 9
Perhaps more than any other, the Kress Building narrative illustrates the challenge of financing historic
preservation under difficult economic conditions and the potential results of not funding projects with
the OHPTC. In this case – after two unsuccessful applications for the competitive OHPTC – the building
was demolished, and the property is now a parking lot along downtown Youngstown’s main thoroughfare.
The general sentiment about the loss of the Kress building was one of resigned sadness, stemming from
the realities of overcoming weak market conditions and a bias against older urban centers in private sector
financing. Furthermore, Youngstown has lost a key piece of its downtown core, as demolition is
irreversible and permanent.
While developers and others have proposed possible improvements to the program, they also nearly
universally agree that the OHPTC is a well-run, transparent, and relatively easy-to-use program. It is
efficiently administered alongside the beneficial Federal Historic Preservation Tax Credit, streamlining the
process of using both credits in tandem.
The case studies show the importance of the OHPTC to project success, with the demolition of
Youngstown’s Kress building offering a poignant example of the alternative. While each of the cases has
tangible economic and community benefits, they also provide insight into the intangible benefits of
preserving community heritage, transforming deteriorating properties into productive community
amenities, and other psychological benefits not readily captured in economic models
The Ohio Historic Preservation Tax Credit program places the state of Ohio among front-runners in public
policy by investing in historic heritage. This investment also aids in achieving community and economic
development by stimulating additional private and federal investment to revitalize the states’ cities and
towns. The study confirmed that the OHPTC contributes to increased property values through building
renovation, and illustrated increased employment and higher wages of workers in companies located
within cites that received tax credits. Being very young (initiated in 2007) and accruing economic benefits
starting only from 2009, the OHPTC program should generate positive net benefits by 2024. A very
conservative analysis of costs and benefits indicates that over the next 15 years the program will generate
$470 million in net benefits (exceeding the costs of approximately $486.3 million with the benefits around
$956.4 million). Beyond the numbers, it is impossible to quantify all community and individual benefits
attributed to resuscitating historic properties. Nonetheless, many stakeholders emphasized that through
the OHPTC program, abandoned and deteriorating buildings were transformed into economic and
community anchors renewing the culture, history and economy of Ohio.

Ohio Historic Preservation Tax Credit Economic Impact Study
Center for Economic Development, Cleveland State University Page 10
Ohio Historic Preservation Tax Credit Economic Impact Study
Center for Economic Development, Cleveland State University Page 11
1. Introduction
This report summarizes results of the study assessing economic impact of the Ohio Historic Preservation
Tax Credit program. The study was conducted by researchers of the Center for Economic Development
and faculty of the College of Urban Affairs, Cleveland State University. The research was funded by the
Ohio Development Services Agency.
The study includes a number of analyses assessing different aspects of the OHPTC program. The
descriptive analyses illustrate characteristics of the projects funded by the OHPTC program and address
employment and population changes occurred in areas surrounding the properties completed before
2015 (most recent data available at the time of the study). This section also investigates property
valuations and taxes collected from the properties before and after renovation. The case study section
looks in depth at five completed projects that used OHPTC funding and one project which did not receive
the tax credit. This section provides a qualitative analysis of the impacts of OHPTC-funded projects on
their communities. The financial cost-benefit analysis evaluates the return on investment from the
projects at the local and state level and addresses prospective analysis until 2030. The final section
analyses the realized and expected economic impacts of these projects in terms of employment, payroll,
output, and value added.
2. Methodology
The objective of the study was to evaluate the economic impact and the effectiveness of the OHPTC
program. To achieve this objective, the study included descriptive analyses, qualitative analysis (via six
case studies), financial cost-benefit analysis, and economic impact analysis. The research team examined
data on the first 12 rounds of the OHPTC program (2007 to 2014) and used multiple secondary data
sources. Some of the secondary data sources include Quarterly Census for Employment and Wages
(QCEW), U.S. Census Bureau’s Decennial Surveys and American Community Surveys, county auditors’
property value and property tax data, and input-output modeling data from the IMPLAN system. The
research team also collected data solicited from OHPTC-property owners and developers via an online
survey. This section briefly outlines methodologies used in different components of the study; additional
methodological details are provided in the corresponding sections of this report.
Descriptive Analysis
The descriptive analysis conducted in this study was twofold. Firstly, the research team illustrated OHPTC
projects highlighting their different properties. Secondly, the research team analyzed the economic
contribution of the OHPTC program in terms of employment, population, taxes, and property value
growth by assessing these indicators in OHPTC-rehabilitated properties and their surrounding areas.
The description of OHPTC projects’ properties was based on the data provided by OHPTC on program
participants’ applications and highlighted the number of projects and the projects’ costs, distribution of
the projects across Ohio, and the status of the projects (through the end of 2014). Using data derived
from the survey of OHPTC property owners and developers (see below for methodology), the research
team estimated construction and operational employment projections for each OHPTC project from 2008

Ohio Historic Preservation Tax Credit Economic Impact Study
Center for Economic Development, Cleveland State University Page 12
to 2020. Based on provided responses, an algorithm was developed to impute construction and
operational data for properties where survey responses were missing or incomplete.
The economic contribution of the OHPTC program to employment, population, property taxes, and
property value growth was assessed by using pre- and post-intervention data of OHPTC properties.10 All
available data was utilized in this assessment for projects that completed OHPTC renovation, including
values of properties, property taxes, population, and employment in at least a year before renovation
started and a year after each project was completed. All data was assessed separately for OHPTC sites
and for areas surrounding the project sites. The property assessments and property tax data were
assembled based upon county assessors’ reports.
Quantitative Data
Quantitative data for this project was collected from five major sources: (1) OHPTC programmatic data,
(2) the QCEW database, (3) county auditors’ offices, (4) U.S. Census Bureau, and (5) the survey of OHPTC
properties owners and developers.
Initial data on the OHPTC projects and their characteristics was provided by the staff of the OHPTC
program, which included information received from the applicants for the historic tax credits and property
managers. For each project, detailed data was provided on the total cost of each project, the amount of
tax credits offered by the state to each approved project, project status, project address, building size,
type of a property, anticipated jobs created during construction, anticipated jobs created after
rehabilitation, and other characteristics of the project and the property.
Additional information was collected from the QCEW database. This includes data on employment and
wages of individuals at the establishment level who work at the OHPTC sites and those that are employed
in neighboring businesses. The third large grouping of data was assembled from individual county
auditors’ offices. Data on assessed value of properties, taxable and exempt value, and property taxes was
collected from these offices of each county where OHPTC properties were located. Demographic data on
population and income was collected from the U.S. Census Bureau’s Decennial Census and American
Community Surveys (ACS).
Lastly, the research team deployed a survey of OHPTC properties owners and developers to supplement
this data. The OHPTC survey questionnaire was designed to provide additional information beyond what
OHPTC program staff collected from the applications by their review of each tax credit property. The
survey of OHPTC properties owners and developers queried information on each OHPTC project, including
building use before and after construction, the length of construction, operating and construction budgets
before and after construction, and the usage of the tax credit. The OHPTC survey questionnaire was
created and developed by the Center with advisement from OHPTC program’s staff. For a copy of the
questionnaire, see Appendix B. The survey was Internet-based, deployed through the survey software
Qualtrics. The survey was conducted over a four-week period starting July 7, 2015, using a list of contacts
and email addresses obtained from OHPTC staff. Contacts were emailed on consecutive Tuesdays in order
10 Quasi-experimental design methodology.
Ohio Historic Preservation Tax Credit Economic Impact Study
Center for Economic Development, Cleveland State University Page 13
to encourage participation. To facilitate greater response rates, the Center also contacted potential
respondents via phone to encourage participation.
In all, there were 394 projects in the population surveyed for the study. For most OHPTC tax credit
projects, there were two contacts listed: one consisting of the developer, architect, or contractor and the
other consisting of the current operator of the property or property owner. The Center contacted both
individuals for all projects in the hopes of gathering the most comprehensive information and having the
highest response rates to the survey. If multiple respondents replied to the survey for one particular
property, the research staff selected one respondent who submitted the most complete survey response
to use for that property. Therefore, each OHPTC property only had one respondent counted, eliminating
duplicate responses.
In addition, not all of the 394 OHPTC projects had unique contacts since many developers, architects, or
contractors have made a business model out of conducting historic renovations. In all, there were 246
unique individuals contacted to take the OHPTC survey. There is not a one-to-one ratio of OHPTC projects
to individuals participating in the survey; some properties were renovated by the same developers who
provided multiple answers to the survey. In the end, 89 individuals responded to the survey and 108
surveys were usable for the final analysis.
It is important to note that all quantitative data has some limitations. For example, U.S. Census Bureau
ACS data are estimates based upon survey responses and had margin of errors with all counts. Readers
should be properly informed about the margin of errors in relation to measured values when examining
this data. Another example of data limitations is that QCEW presents early assessments of employment
on OHPTC sites for businesses. Since the process of renting renovated properties to business tenants
might take some time, not all employment may be presented in QCEW data, especially for recently
completed OHPTC projects. In addition, the researchers attempted to locate businesses based on their
name via web information and addresses to include in the analysis. The QCEW database does not include
self-employed individuals, and therefore presents a conservative count of employment.
Case Studies and Qualitative Data
The qualitative data was obtained from three sources: focus groups, interviews, and information available
online or in printed documents about OHPTC projects and related properties.
Six focus groups were conducted to gather information for the case studies. Each group focused on one
of the case study themes, including completed projects (mix of affordable and market-rate residential,
commercial, mixed-use, and institutional projects from around the state), a project that is currently being
rehabilitated using the program, and one project that was denied funding for the program. The research
team also interviewed key people throughout the state on specific items related to the research project,
speaking with state employees about the program, checking details with awardees, confirming data, and
gathering further insights into how the OHPTC works in the state.
The case study section includes six cases to provide in-depth information of various project types in
various contexts representing the diverse geography of Ohio. The case studies complement the larger,
state-wide economic impact analysis and quantitative data. The six case studies included four completed
projects, one in-progress project, and one project that applied for, but was not granted, OHPTC support.

Ohio Historic Preservation Tax Credit Economic Impact Study
Center for Economic Development, Cleveland State University Page 14
Financial Cost-Benefit Analysis
To evaluate the overall effectiveness of the OHPTC program, the research team used a financial cost-
benefit analysis. This analysis provides a more complete picture of whether the OHPTC program pays for
itself based on generated state and local tax-revenues. Moreover, this section looks to answer the
question of whether issuing the tax credits for rehabilitating historic buildings is an effective use of state
resources. In this analysis, the research team estimated the net present value and internal rate of return
on government investment in the OHPTC program.
The cost-benefit analysis was conducted from the governmental perspective, and therefore is different
from traditional investor-centric cost-benefit analyses. The non-tax component of such analysis was
evaluated in the economic impact analysis. The analysis was concerned with estimating the tax
expenditures and additional tax revenues generated by completed projects.
The types of costs evaluated for the analysis included the amount of tax expenditures (i.e. the amount of
tax revenues the state loses by providing the historic preservation tax credits), and administrative and
compliance costs (i.e. how much money it costs the state to provide the credit and the amount of money
beneficiaries spend to apply for and receive the credit). Despite the fact that compliance costs are paid
by the developers, and current analysis considers only the benefits and costs incurred by government,
compliance costs should be included in such analysis; they, together with administrative costs, represent
total collection costs delegated by government to taxpayers to collect necessary information.
The types of benefits evaluated for the analysis include additional generated state and local tax revenues
(including property, sales, and income tax revenues). These were estimated as the difference between
the revenues received before and after the issuance of the tax credit. The benefits included tax revenues
from the projects themselves, as well as the additional tax revenues from nearby properties. All costs and
benefits associated with the credits were compared with the status quo (i.e. benefits and costs in the
absence of the projects). The potential costs and benefits of the projects under construction were
discounted to their present value. The costs and benefits of the completed construction projects were
adjusted for inflation for the period after the construction is complete and before present time. They
were discounted for the remaining years that add to the proposed 15-year total lifecycle of use. For
example, the benefits and costs of a project completed in January 2010 would be adjusted for inflation
until January 2015, and discounted to their present value until January 2025. The analysis was conducted
with alternative discount rates. The analysis also simulated potential variations in the benefit component
of the program (with potentially lower or higher tax revenues).
Economic Impact Analysis
The research team used two approaches to conduct the economic impact analysis. The first approach was
to collect data that signified the direct economic impact of the program and the projects it has leveraged
since the program’s awards. In doing so, researchers identified and recorded real programmatic impacts
using the survey data specific to each project (i.e., number of new employees in the building or
surrounding businesses since the project completion, the number of increased occupancies in the
renovated building, etc.).

Ohio Historic Preservation Tax Credit Economic Impact Study
Center for Economic Development, Cleveland State University Page 15
The second approach included an assessment of the economic impact using a multiplier-based model,
primarily to emphasize the indirect and induced effect of the projects. Based on data from the survey of
OHPTC properties owners and developers, the available OHPTC applications, and final reports submitted
to the state, an economic impact analysis was conducted on the OHPTC program. This analysis used
IMPLAN software and data reflection input-output relationships between industries in Ohio. Impact was
measured in terms of employment (number of jobs), labor income (household earnings), value added
(value of goods and services produced in the economy less intermediary goods and services), output
(value of goods and services produced in the economy), and taxes.
Three measures of economic impact (direct, indirect, and induced) are shown for each indicator. Direct
impact refers to the initial value of goods and services, including labor, associated with the program within
the state. These purchases are sometimes referred to as the first-round effect. Indirect impact measures
the value of labor, capital, and other inputs of production needed to produce the goods and services
required by the first round (second-round and additional-round effects). Induced impact measures the
change in spending by local households due to increased earnings by employees in local industries who
produce goods and services for all rounds of spending. Each measure of impact was categorized according
to these three components, and the direct and indirect effect were addressed together, while the induced
effect was discussed and reported separately.
3. Descriptive Analysis of the Ohio Historic Preservation Tax Credit
Program
The Ohio Historic Preservation Tax Credit (OHPTC) Program is administered by Ohio’s Development
Services Agency to leverage the private redevelopment of historic buildings. The program provides a tax
credit for the rehabilitation expenses incurred by owners of historically significant buildings located across
the state. Eligible applicants for the credits are required to be owners or qualified lessees of historic
buildings, as proven by registration under national, state, and/or local designating authorities. Upon
completion, the rehabilitation must be of acceptable and appropriate quality, must be certified by the
State Historic Preservation Office, and must meet certain standards set by the office of the Secretary of
the Interior in order to receive the credits.
The tax credits subsidize up to 25% of qualified rehabilitation expenditures for historic rehabilitation
projects, up to no more than $5 million (Figure 1). They are awarded bi-annually in June and December.
The credits are leveraged to supplement pre-existing financing, which can include private sources as well
as the 20% Federal Historic Preservation Tax Credit. The state has a $60 million limit on its tax credit
awards per year. In 2014, the State of Ohio extended the tax credit program by approving the catalytic
project award, which provides up to $25 million in total tax credits for especially large and impactful
projects.

Ohio Historic Preservation Tax Credit Economic Impact Study
Center for Economic Development, Cleveland State University Page 16
Figure 1. Ohio Historic Preservation Tax Credit Approved Projects
Since the program was established in 2007, 238 projects have been approved (Table 1), with the OHPTC
program covering on average 14% of project costs, decreasing from its highest share of 19% in 2007. The
total cost of projects approved under OHPTC program is $3.5 billion.
Table 1. OHPTC Projects Cost over Time (nominal $)
Year Annual Number of Projects
OHPTC Amount Total Cost of All Projects
2007 16 $50,721,390 $267,040,746
2008 42 $118,329,136 $719,430,862
2009 12 $17,097,327 $127,226,264
2010 10 $27,863,097 $215,380,235
2011 18 $27,230,143 $201,807,051
2012 35 $61,370,468 $438,577,741
2013 45 $79,551,985 $652,322,821
2014 60 $100,115,438 $873,562,564
Total 238 $482,278,984 $3,495,348,284
Since the program’s inception, OHPTC projects have been approved in 37 counties (Figure 2), with most
of the projects located in Cuyahoga (29.0%) and Hamilton (28.6%) counties; 101 projects (42%) out of 238
approved projects had already been completed and certified by the end of 2014 (Table 2). From 2007 to
2014, the program has stimulated additional external funding in the amount of $3.16 billion, creating an
attraction of $6.20 per each dollar invested in the form of tax credits under the OHPTC program. 11
11 This number is consistent for inflated costs of the tax credit and total cost of projects.
0
10
20
30
40
50
60
70
$-
$200
$400
$600
$800
$1,000
$1,200
2007 2008 2009 2010 2011 2012 2013 2014
Mill
ion
OHPTC Amount Total Project Cost Annual Number of Projects

Ohio Historic Preservation Tax Credit Economic Impact Study
Center for Economic Development, Cleveland State University Page 17
Figure 2. OHPTC Projects by County
Table 2. Status of OHPTC Approved Projects, 2014
Project Status Number of Projects
Pct. of Total
Certified 101 42.4%
Stage(s) Certified 2 0.8%
Certification Pending 6 2.5%
Near Completion 13 5.5%
Construction Underway 46 19.3%
Construction Pending 57 23.9%
Seeking Financing 13 5.5%
Total Number of Projects
238 100%
The approved projects proposed to create approximately 43,000 jobs; about 21,000 temporary
construction jobs and 22,000 permanent operational jobs, as estimated by applicants at time of
submission of proposals to the OHPTC program. Since not all projects are completed or even fully funded
at the time of this report, all discussed numbers are partially projected. Most of the job estimates further
discussed in this section are based on the survey administered for this study.12 According to responses
12 The OHPTC survey questionnaire was designed to provide supplementary information beyond what is collected by ODSA in their review of each tax credit property. Survey questions queried information for each OHPTC project, including building use before and after construction, length of construction, operating and construction budgets before and after construction, and the usage of the tax credit. Of those contacted, 89 individuals responded to the
Cuyahoga, 69
Hamilton, 68Franklin, 24
Summit, 13
Mahoning, 9
Butler, 7
Lucas, 5
Licking, 4
other, 39

Ohio Historic Preservation Tax Credit Economic Impact Study
Center for Economic Development, Cleveland State University Page 18
recorded from developers, architects, and managers of the projects, about 9,000 construction jobs have
been created in projects approved by the end of 2014, and approximately 14,350 annual operational jobs
will be created by the end of 2015.
Figure 3. Construction and Operational Jobs Created by OHPTC Projects
Source: Survey Questionnaire for owners, managers, and developers (Appendix B). Construction and operational jobs are
estimated based only on projects approved by the end of 2014. Both figures are likely to increase as more projects are
approved in coming years. N/D – no data.
While construction-related employment lasts only for the duration of each project and is considered
temporary, operational employment accounts for people who will work at the businesses located at
renovated buildings. The expectations are that this employment will stay at the level (not increase or
decrease) identified by survey respondents as employment at businesses re-opened or moved into
renovated buildings after project completion (Figure 4 and Figure 5).
survey, and 108 surveys were usable for the final analysis. Several respondents submitted surveys for multiple separate projects for which they were responsible.
1,640
2,152
1,153888
1,259
983
486
282193
105n/d n/d n/d
0
2,000
4,000
6,000
8,000
10,000
12,000
14,000
16,000
0
500
1,000
1,500
2,000
2,500
2008 2009 2010 2011 2012 2013 2014 2015 2016 2017 2018 2019 2020
Construction Operation

Ohio Historic Preservation Tax Credit Economic Impact Study
Center for Economic Development, Cleveland State University Page 19
Figure 4. Estimated Operational Employment by Building Use (2010-2014 actual, 2015-2020 projected)
Source: Survey Questionnaire for owners, managers, and developers (Appendix B).
Figure 5. Projected 2015 Operational Employment by Type of Building Usage
Source: Survey Questionnaire for owners, managers, and developers (Appendix B).
With the growing number of completed projects, total operational employment is increasing over time.
The flattening of projected operational employment after 2014 is due to projections based only on
0
2,000
4,000
6,000
8,000
10,000
12,000
14,000
16,000
2008 2009 2010 2011 2012 2013 2014 2015 2016 2017 2018 2019 2020
Retail Hotel Institutional Residential Office Industrial Vacant Other
Retail, 2,116, 15%
Hotel, 1,707, 12%
Institutional, 1,691, 12%
Residential, 96, 1%
Office, 3,016, 21%
Vacant, 2,470, 17%
Other, 3,251, 22%

Ohio Historic Preservation Tax Credit Economic Impact Study
Center for Economic Development, Cleveland State University Page 20
projects approved by 2014. As the number of projects completed after 2014 increases, operational
employment will grow.
The percentage of projected 2015 total operational employment by use of renovated spaces is nearly
evenly divided; 21% of positions (or 3,016 people) are located in offices, 15% (2,116) in retail stores, 12%
(1,691) in different types of institutions and nonprofit organizations, 11% (1,707) in hotels, and 23%
(3,251) in other types of businesses. While residential properties generate the largest growth in
population relocating into newly renovated buildings, they generate the smallest share of employment:
only 1% (or 96 workers). Approximately 18% of spaces available in renovated buildings are still vacant, in
large part due to the recent nature of completion of a number of projects.
While the residential use of buildings generates the smallest operational employment, it holds the largest
share of physical space (52% of total 20.1 million sq. ft.) (Figure 6). The second largest share of space is
held by commercial use (30%). 13.3% (31) of all OHPTC project buildings include the development of units
with affordable housing.
Figure 6. Space Created in Renovated Buildings, Square Feet
Moreover, only 20% of all buildings in OHPTC projects were in use the year prior to redevelopment; 78%
of the buildings were vacant (2% of building use is unknown due to a fact that respondents did not answer
this question). According to the survey responses, many of these buildings (78%) would have remained
vacant had the OHPTC program not supported redevelopment (Figure 7).
Residential, 10,794,729,
52%
Commercial Office, 6,288,943, 30%
Retail,1,170,249, 6%
Hotel,1,170,249, 6%
Institutional, 865,341, 4%
Restaurant, 427,962, 2%
Total 20,717,472 Sq Ft

Ohio Historic Preservation Tax Credit Economic Impact Study
Center for Economic Development, Cleveland State University Page 21
Figure 7. Survey Answers to a Question If the Project Would Have Moved Forward without the OHPTC
Note: total number of responses – 79.
Similar information was received from the data collected on 73 rejected projects. This data was provided
by Heritage Ohio board members who collected the data primarily via telephone survey. The applicants
of 73 projects that applied for OHPTC but were rejected indicated that the large number of the
renovations did not happen because of lack of OHPTC support. Out of 73 rejected projects, 24 were first-
time applicants in Round 14, the latest round of OHPTC by the time when this data was collected. Out of
the remaining 49 projects, 10 projects applied at least three times in previous rounds and were rejected
due to various reasons, and 22 projects had submitted a previous application at least once. Repeated
submissions for the tax credit indicate that projects could not be completed without the state support.
The reasons for application rejections vary and are not investigated here.
However, there are two important takeaways from returning applicants. First of all, the cost associated
with developing an application is substantial. This cost includes the processing fee, payments to third
parties (lawyers or consultants), and time spent by a developer or a property owner devoted to learning
the process and participating in the completion of application documents. Many projects which are
rejected reapply for OHPTC support; the majority of projects require OHPTC funding as gap financing to
begin renovation. Of 33 projects that applied more than once, 19 could not complete their projects
without OHPTC funds, and only 7 proceeded with completion of the rehabilitation without the credits.
Another 7 projects are considering changes in strategy or are scaling back from their initial scope in order
to move forward without state support. Out of 55 rejected projects that provided information to this
question, more than half (31 projects) are planning to re-apply in a future round.
According to interviews with developers, property owners, and nonprofit organizations helping property
development and historic preservation, the difficulty of completing renovation of historic properties
without OHPTC contributions makes the application process for these credits highly competitive;
No, 78% Yes, 5%
Yes, but not to the extent OHPTC provided, 3%
No Response, 14%
0% 10% 20% 30% 40% 50% 60% 70% 80% 90% 100%

Ohio Historic Preservation Tax Credit Economic Impact Study
Center for Economic Development, Cleveland State University Page 22
however, the cost to apply and the uncertainty of approval may discourage participation. 13 Despite this
effect, overall the program helps to protect Ohio’s heritage, contributing to the economic revitalization
of cities and their downtowns – which suffer most from neglected properties – and of rural townships
where such historic properties can serve as community anchors and hubs for development. The economic
contribution of the OHPTC is demonstrable – businesses are relocating to renovated buildings, their
employment is growing, wages are increasing, and — most importantly — the significant increase in the
value of these properties proves that the program is both a cultural and economic gain to the state and
the local communities it serves.
4. Economic Contribution of the OHPTC Program to Employment,
Population, and Property Values of Preserved Buildings and
Surrounding Areas
This section analyzes the question of the OHPTC program’s direct contribution to increases in residential
and business activity in the project buildings and in areas immediately surrounding these buildings. It is
expected by policy makers and the general public that besides the goal of preserving historical properties
across the state, the OHPTC program will help to generate business and residential revitalization in and
around renovated properties.
Overall, OHPTC projects generate additional employment, increase the number of business
establishments, and illustrate that people working for businesses located in renovated buildings earn
higher wages after project completions. From 2008 to 2014, employment in project buildings increased
by 3,612 jobs (a 140% increase) and generated 70 more business establishments (50% growth), while
adding $244.8 million in total wages (159%). The data is less conclusive on the impact of OHPTC program
on employment and wages of establishments in surrounding areas, which lost jobs and businesses during
a period that coincides with significant nation-wide economic recession known as the “Great Recession”
of 2007-2009.14
While renovation of historic properties in residential areas makes neighborhoods more attractive for
living, homeowners don’t change their residence frequently and renters may be bound by rental
contracts. The changes in population movement should be measured within a much larger timeframe
and most likely on a scale of communities where multiple OHPTC projects are completed. Data necessary
to objectively and fully measure population changes in areas surrounding completed OHPTC projects is
unavailable within the brief period of time after project completion; however, census tracts15 in residential
13 Evidence of such discouragement was obtained in the form of anecdotes from multiple sources in this research, such as applicant surveys, interviews and focus groups conducted for case studies, and meetings with developers and nonprofit organizations related to the field of historic preservation and real estate development. 14 For more information about this recession, visit the National Bureau of Economic Research, http://www.nber.org/cycles/sept2010.html. 15 A census tract is a small unit of geographic measurement defined by the U.S. Census Bureau.

Ohio Historic Preservation Tax Credit Economic Impact Study
Center for Economic Development, Cleveland State University Page 23
areas of Cleveland and Columbus show positive shifts in population using both U.S. Census decennial data
and ACS estimates. OHPTC projects in Cambridge, Cincinnati, and Youngstown tracts show mixed results.
Data on property values and collected taxes from OHPTC project parcels and parcels surrounding them
illustrates indisputably successful results of renovation. The taxable value of project parcels increased by
almost $217 million overall, or about 264%. Values rose by about 8% for adjacent parcels and by 28% for
radial parcels.16 Taxes collected from properties on project parcels increased by approximately $6.1
million overall, or almost 347%. Taxes rose by about 47% on adjacent parcels and by 64% on radial parcels.
Methodology
To conduct research on dynamics of employment and business establishments, the study team selected
a sample of OHPTC projects. The analysis was based on real estate parcels (building sites) where OHPTC
projects were located, as well as sites within a radius of 500 feet17 from the OHPTC project site. A sample
of 50 sites18 was selected based on the OHPTC-funded projects completed prior to January 31, 2014. All
sites had businesses registered in the Quarterly Census of Employment and Wages (QCEW) – the data
source for this analysis. At each site, whether it was an OHPTC project site or a site in the surrounding
area within the 500 feet radius, two types of establishments were counted: those that were previously
registered in Ohio (in the same or a different location), and those that were never before registered in
Ohio.19 The latter establishments that did not appear in the database as previously located in Ohio were
identified in the analysis as “new” businesses. The count of retained businesses at project sites includes
establishments that existed both before and after project completion. The analysis also considers the
movement of business establishments and employment located at the sites of OHPTC projects before and
after renovation while also existing prior to the project at other locations within Ohio, whether nearby or
in another city. Employment and wages20 are measured as totals for workers employed at business
establishments. In addition, the dynamics of wages per employee are reported.21
The process of counting employment, business establishments, and wages in a 500 foot radius around the
sites involved using a street map to identify businesses near the project buildings. Among OHPTC projects
certified before January 2014, some project sites were located in residential areas and did not have any
16 Radial parcels are those not adjacent to the project parcel(s) but located within 150 feet based on parcel centroids. 17 Academic literature suggests a radius of 150 feet as an affected area in residential neighborhoods around real estate renovation projects. However, this analysis is based on larger surrounding geography accounting for both residential and business activity. For some OHPTC-renovated properties, there were no businesses located within a 150 foot radius. The research team made a decision to explore employment change within a 500 foot radius. 18 Sites were located by both address and by the names of firms found through business directories and internet searches conducted for each site. 19 This analysis cannot conclusively state whether a business is new or was previously registered in another state and expanded its business activity or relocated to Ohio. 20 Wage data has been adjusted to the 2014 dollar and annualized ending with quarter one data including wages for January, February and March. In some cases the wage data included bonuses. 21 The QCEW data does not include self-employed, student employment, and a few other categories of employment. For a full description of this data source, visit the website of the U.S. Bureau of Labor Analysis: http://www.bls.gov/cew/cewover.htm.

Ohio Historic Preservation Tax Credit Economic Impact Study
Center for Economic Development, Cleveland State University Page 24
businesses in the surrounding 500 foot radius. A final count of 78 sites, including businesses located
around the sites based on the data available in QCEW, was selected for this analysis.
In order to assess changes in the count of business establishments, employment, and wages, two time
periods were selected; 2008 was selected as a benchmark level of economic activity before the OHPTC
program started, and 2014 was selected as the year that allows for the most data on completed projects
fitting other criteria for this analysis. Unfortunately, this time period includes the economic recession of
December 2007 – June 2009, the longest of any period of recession in U.S. history since World War II.
Called “The Great Recession” by some economists, this economic downturn lasted 18 months, and was
triggered by the U.S. financial crises of 2007-2008 and subprime mortgage crisis of 2007-2009 which led
to the eventual restructuring of the U.S. economy.22 The recession alone significantly altered the
economic activity of businesses and the demand for business and residential real estate. Moreover,
Cleveland was noted at the time as one of the U.S. cities affected most by the crisis of subprime mortgages
– to a significantly higher degree compared to other geographies.23 The co-incidence of the Great
Recession with this study period, together with a fact that only simple changes were observed in selected
economic indicators, prevents this study from claiming any strong causality between the dynamics of
properties renovated under the OHPTC program and the economic activity of these properties and
surrounding areas. As such, this analysis only establishes correlation between business, residential, and
property value activities regarding OHPTC projects and surrounding areas and funding for the OHPTC
program.
In the following analysis, the data on projects in Cincinnati and Cleveland is reported individually. Sample
projects within the cities of Columbus, Akron, and Youngstown are reported as one group due to QCEW
confidentiality restrictions. The remaining projects not in these five cities are categorized under “other
areas.”
Impact of OHPTC Projects on Business Activity in Renovated Buildings and Surrounding Areas
The count of business establishments is an accepted indicator for measuring business activity. Each
business establishment can represent either an independent company or a branch of a business with
multiple locations (e.g., a branch of a bank or a hospital). An increased number of business establishments
usually indicates improved economic activity; however, a higher number of business establishments does
not automatically lead to increased employment and wages. Since most historical properties are located
in the central business districts of cities and townships, the typical businesses in this count include offices
22 Austan D. Goolsbee and Alan B. Krueger, “A Retrospective Look at Rescuing and Restructuring General Motors and Chrysler.” Journal of Economic Perspectives, Vol. 29, Num. 2. Spring 2015. “The Financial Crisis and the Great Recession.” Chapter 15. PP. 337-356. In Goodwin, N., Harris, J., Nelson, J., Roach, B., & Torras, M. Macroeconomics in Context, Second Edition. Routledge. 2015. http://www.ase.tufts.edu/gdae/Pubs/te/MAC/2e/MAC_2e_Chapter_15.pdf. Tufts University. 23 Jeffrey D. Dillman, “Subprime Lending in the City of Cleveland and Cuyahoga County.” Kirwan Institute for the Study of Race and Ethnicity. The Ohio State University. 2010. http://www.kirwaninstitute.osu.edu/reports/2010/02_2010_SubprimeandCleveland_Dillman.pdf. Also Wall Street Journal: http://online.wsj.com/public/resources/documents/cleveland.pdf.

Ohio Historic Preservation Tax Credit Economic Impact Study
Center for Economic Development, Cleveland State University Page 25
of companies and not-for-profit organizations, retail establishments, hospitality businesses, restaurants
and other food service venues.
Among real estate properties that were renovated under the OHPTC program and selected for this
analysis, the number of business establishments grew from 141 in 2008 to 211 in 2014, a total growth of
50% (Table 3). Of the additional 70 establishments, 56 relocated to Ohio, opened new branches in Ohio,
or recently formed a new business. In all areas except Cleveland, the count of business establishments did
not change significantly. However, in Cleveland – the city with the largest number of earliest completed
projects that had additional time to attract business activity – the total number of retained business
establishments increased by 8%. Moreover, most data, with the exception of some projects in Cincinnati,
show one of two occurrences: businesses that were in project buildings before renovation tend to remain
and continue operations after renovation, and other businesses moving into the renovated buildings after
project completion take the places of those that left during a construction phase.24
Overall, the companies at project sites and in surrounding areas most likely followed their business
strategies. Moreover, movement across real estate properties cannot be attributed solely to OHPTC
projects’ renovations, especially during the recession. In times of economic downturn, businesses tend
to increasingly go through merger and acquisition processes to preserve core employment and
operations. These activities significantly impact business location and the demand for commercial space.
Residential decisions are also impacted by a recession economy.25
Table 3. Dynamics of Business Establishments in the OHPTC Project Buildings, 2008-2014
Category Geography
Number of
Establishments Change
Percent
Change
2008 2014 2008-2014 2008-2014
Retained Cincinnati 13 12 -1 -8%
Retained Cleveland 114 124 10 8%
Retained Columbus/Akron/Youngstown26 8 11 3 27%
Retained Other areas 6 8 2 25%
Retained All areas 141 155 14 9%
"New" All areas 56
Total All areas 141 211 70 50%
Source: Quarterly Census of Employment and Wages.
24 The small number of projects that fit requirements for this analysis, in conjunction with QCEW’s confidentiality rules, does not allow this study to show more detailed data by geography and type of business to detail these analysis results. 25 During periods of lower employment and stagnating wages, potential residents and potential business owners often become more risk-averse and tend not to engage in relocation, expansion, and other high-risk behaviors. While these are very general observations, each city and township has its own dynamic of business and residential real estate activity affected by regional and local economy, structure of population, unemployment, and additional factors that were not observed in this study. 26 These geographies are presented together due to QCEW confidentiality restrictions.
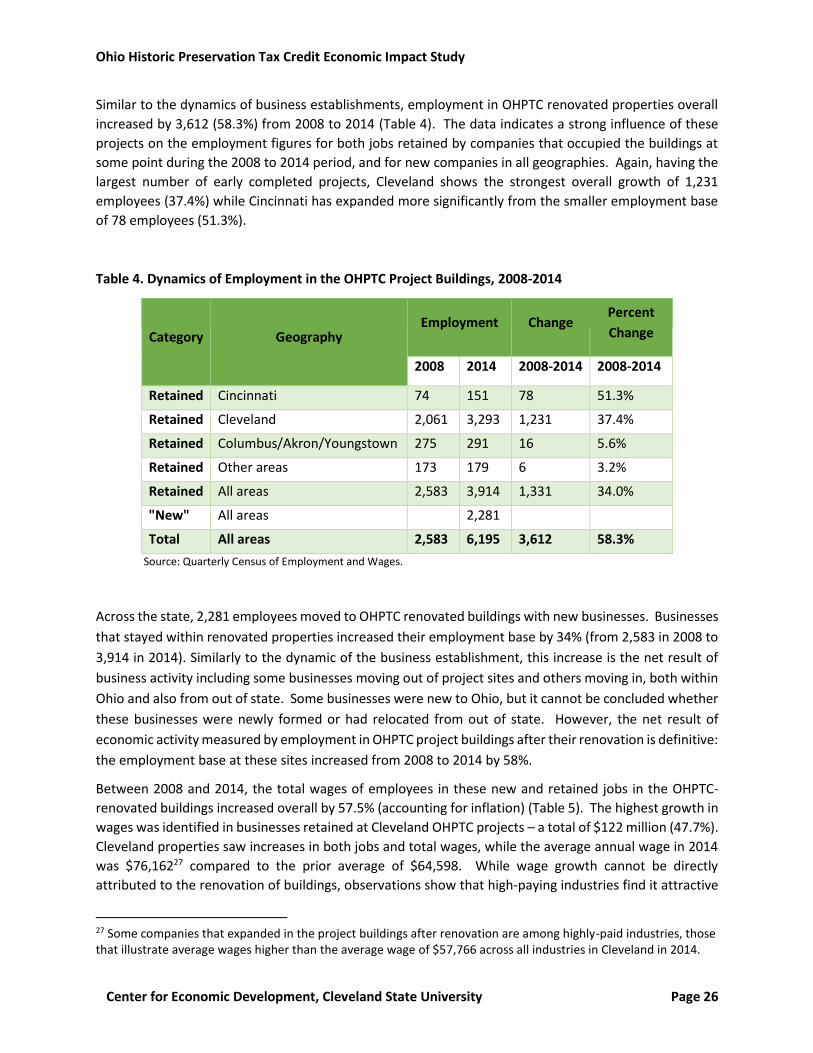
Ohio Historic Preservation Tax Credit Economic Impact Study
Center for Economic Development, Cleveland State University Page 26
Similar to the dynamics of business establishments, employment in OHPTC renovated properties overall
increased by 3,612 (58.3%) from 2008 to 2014 (Table 4). The data indicates a strong influence of these
projects on the employment figures for both jobs retained by companies that occupied the buildings at
some point during the 2008 to 2014 period, and for new companies in all geographies. Again, having the
largest number of early completed projects, Cleveland shows the strongest overall growth of 1,231
employees (37.4%) while Cincinnati has expanded more significantly from the smaller employment base
of 78 employees (51.3%).
Table 4. Dynamics of Employment in the OHPTC Project Buildings, 2008-2014
Category Geography Employment Change
Percent
Change
2008 2014 2008-2014 2008-2014
Retained Cincinnati 74 151 78 51.3%
Retained Cleveland 2,061 3,293 1,231 37.4%
Retained Columbus/Akron/Youngstown 275 291 16 5.6%
Retained Other areas 173 179 6 3.2%
Retained All areas 2,583 3,914 1,331 34.0%
"New" All areas 2,281
Total All areas 2,583 6,195 3,612 58.3%
Source: Quarterly Census of Employment and Wages.
Across the state, 2,281 employees moved to OHPTC renovated buildings with new businesses. Businesses
that stayed within renovated properties increased their employment base by 34% (from 2,583 in 2008 to
3,914 in 2014). Similarly to the dynamic of the business establishment, this increase is the net result of
business activity including some businesses moving out of project sites and others moving in, both within
Ohio and also from out of state. Some businesses were new to Ohio, but it cannot be concluded whether
these businesses were newly formed or had relocated from out of state. However, the net result of
economic activity measured by employment in OHPTC project buildings after their renovation is definitive:
the employment base at these sites increased from 2008 to 2014 by 58%.
Between 2008 and 2014, the total wages of employees in these new and retained jobs in the OHPTC-
renovated buildings increased overall by 57.5% (accounting for inflation) (Table 5). The highest growth in
wages was identified in businesses retained at Cleveland OHPTC projects – a total of $122 million (47.7%).
Cleveland properties saw increases in both jobs and total wages, while the average annual wage in 2014
was $76,16227 compared to the prior average of $64,598. While wage growth cannot be directly
attributed to the renovation of buildings, observations show that high-paying industries find it attractive
27 Some companies that expanded in the project buildings after renovation are among highly-paid industries, those that illustrate average wages higher than the average wage of $57,766 across all industries in Cleveland in 2014.

Ohio Historic Preservation Tax Credit Economic Impact Study
Center for Economic Development, Cleveland State University Page 27
to stay in the community and move to renovated properties. The significant increase in average annual
wages in Cincinnati (from $38,899 to $43,643) was also most likely the result of successful businesses
expanding or moving into OHPTC-renovated buildings. These businesses, especially those retained in the
buildings, were able to afford higher rents and, according to the data, were most likely paying their
employees higher wages.
Table 5. Dynamics of Wages in the OHPTC Project Buildings, 2008-2014
Category Geography Total Wage Change
Percent
Change
Average Annual
Wage Change
Percent
Change
2008 2014 2008-2014 2008-2014 2008 2014 2008-2014 2008-2014
Retained Cincinnati $3,027,516 $7,110,368 $4,082,852 57.4% 38,899 43,643 $4,744 10.9%
Retained Cleveland $133,565,375 $255,426,658 $121,861,283 47.7% 64,598 76,162 $11,564 15.2%
Retained Columbus/Akron/
Youngstown $9,760,642 $9,674,203 -$86,439 -0.9% 36,694 33,895 -$2,800 -8.3%
Retained Other areas $2,818,526 $3,589,865 $771,339 21.5% 15,557 19,283 $3,725 19.3%
Retained All areas $149,172,058 $275,801,094 $126,629,036 45.9% $57,537 $69,154 $11,617 16.8%
"New" All areas $74,791,586 $32,089
Total All areas $149,172,058 $350,592,680 $201,420,622 57.5% $57,537 $55,482 -$2,055 -3.6%
Source: Quarterly Census of Employment and Wages.
Both total wages and employment increased in the Columbus/Akron/Youngstown area;28 however,
employment grew more quickly than total wages. As a result, the average wages – calculated as the
product of dividing the total wages over employment – declined by 8.3% from 2008 to 2014. Companies
that were new to Ohio or new in business overall paid their employees $32,089 in 2014, also contributing
to the overall slight decline of average annual wages at -3.6% (from $57,537 in 2008 to $55,482 in 2014).
Although the average wages declined across all area properties, all three economic indicators –
employment, business establishments, and total wages of business tenants located in OHPTC buildings –
grew between 2008 and 2014, despite the recession in the middle of this time period. This is in part due
to the fact that, while commercial tenants of properties renovated with contributions from the OHPTC
program showed definite signs of economic success through all three indicators, the businesses in the
surrounding 500-feet areas around the renovated properties did not illustrate similar positive changes.
Analysis of companies which were located in buildings within 500 feet of project buildings (exclusive of
companies which at one point were located in project buildings), indicates losses for all three indicators
across the 2008 to 2014 period (Table 6). In Cincinnati, there was a decline of 38 establishments within
500 feet of the site (12%), 5,859 jobs were lost (43%), and there was a 27% decline in wages ($264M). In
Cleveland, there was a 133-establishment loss (14%), with a 3,884 job decline (16%) and a $376M decline
28 These geographies are presented together due to confidentiality restrictions.

Ohio Historic Preservation Tax Credit Economic Impact Study
Center for Economic Development, Cleveland State University Page 28
in payroll (18%). In the Columbus, Akron and Youngstown projects, there was a 12 establishment loss
(3%), with a gain of 998 jobs (7%) and $61M in lost payroll (-6%). Across all other projects, there were
declines of 42 establishments (7%), 1,222 jobs (13%) and $75.7M in wages (20%). Across all project
buildings and their radii, there was a loss of 225 establishments (10%). There was a nearly 10,000-job
decline between 2008 and 2014. Wages declined by $778M across this period.
Table 6. Employment in Buildings Located within 500 feet of Project Buildings
Establishments Employment Wages
Change
2008-2014
Percent
Change
Change
2008-2014
Percent
Change
Change
2008-2014
Percent
Change
Cincinnati -38 -12% -5,859 -43% -$264,540,294 -27%
Cleveland -133 -14% -3,884 -16% -$376,447,783 -18%
Columbus, Akron
& Youngstown -12 -3% 998 7% -$61,313,155 -6%
Others Areas -42 -7% -1,222 -13% -$75,721,911 -21%
Total for All
Projects -225 -10% -9,966 -16% -$778,023,143 -18%
Source: Quarterly Census of Employment and Wages.
These losses may be due to factors related to the recession – as well as accompanying acquisitions and
mergers – and are likely to be unrelated to the project buildings themselves. Another hypothesis
explaining negative results is the lack of sufficient time during which the positive effect of renovation
might happen. It would be an unreasonable to expect the renovation of a single site to cause large
employers from high-paid industries to immediately relocate into that area or building.29
Hypotheses for future research suggest that the impact would differ over time, and further studies would
be needed to determine the optimal time for economic results to begin to manifest in the secondary data
– along with further study of how the impact is influenced by the business cycle (e.g., recessions or other
factors impacting the real estate market). There are various types of impacts and different distances that
need to be assessed for predominantly residential or industrial/business districts. Finally, the research
team believes that economic impact would differ if an OHPTC project were completed in a neighborhood
where the project is the first or only one historic property in a block of buildings. It is believed that the
current analysis shows insufficiency of impact that individual projects might produce on surrounding areas
29 Additional research is necessary to better understand the dynamics of employment in OHPTC-renovated buildings and surrounding areas, as well as the effect of redeveloped residential properties bringing more people to live in these buildings (creating induced effect through the purchasing of goods and services at the neighborhoods where they live).

Ohio Historic Preservation Tax Credit Economic Impact Study
Center for Economic Development, Cleveland State University Page 29
and speaks to better likelihood of positive economic results from development of so called “historic
districts,” or at least several adjacent properties. The cumulative effect of renovating large blocks of
properties might create a scale effect that triggers a psychological confidence, leading to a positive trend
of area development and the attraction of new/additional businesses to locate there. The current project
was limited in time and resources to research these questions or locate examples in other states that have
similar state programs.
Impact of OHPTC Projects on Population Change in Residential Areas
The renovation of historic properties in residential areas makes neighborhoods more attractive for living.
Homeowners don’t change their residence frequently, but renters have fewer restrictions, although they
may still be bound by 1-2 year rental contracts. Changes of populations in surrounding OHPTC project
residential properties were assessed hypothesizing that these changes would happen within a census
tract30 of the OHPTC project and the earliest changes could be assessed through secondary data within 2-
4 years after the project is certified. To conduct this research the study considered increases in population
and in the number of households.
Two samples of census tracts containing OHPTC projects were selected based on the 98 projects which
were completed by the end of 2014. One sample was used to measure the change in population in the
census tracts, while the second sample was used to measure changes in the number of households in the
census tracts. The samples were selected under the same following parameters. First, only projects which
were completed between 2009 (earliest certified projects) and not later than 2011 were selected to assess
population data before and after the project completion. The periods of 2006 to 2010 and 2009 to 2013
were used because they are the earliest and latest available for current census boundaries.31 The data
was collected from the U.S. Census for 2000 and 2010 and the American Community Survey (ACS). The
latter is the only data source that measures population on a census tract level between decennial
censuses. Second, only tracts containing projects with residential components were selected for this
analysis. Third, the data was filtered to show only census tracts in Ohio which contain statistically
significant changes that were greater than the margins of errors for measurement.32
30 A census tract is a small unit of geographic measurement defined by the U.S. Census Bureau. It is often used to track changes in population over time. A tract holds the most reliable data for measurement in an analysis for the surrounding areas of single-parcel projects. The borders of tracts follow current or past political boundaries. Tracts range in size from a dozen city blocks in urban areas to whole counties. Some are large and mostly residential, with large populations. Others contain mostly industrial land, or open space, and therefore have small populations. The scale of comparison between different regions for this analysis is complicated because of these census tract size differences. 31 The averages of this data are calculated with overlapping time periods (2009 and 2010); however, the OHPTC program is still too nascent to have sufficient certified projects to allow for perfect statistical testing using American Community Survey (ACS) data. 32 To understand the application of margin of error to this study, consider the following example: if population for a tract is estimated at 100 with a margin of error of 25, this means that the population is actually somewhere between 75 and 125, with 100 being the data’s average estimate. If during this time and the previous time period the change of population is calculated as growth of 22 residents, this census tract was dismissed from the analysis

Ohio Historic Preservation Tax Credit Economic Impact Study
Center for Economic Development, Cleveland State University Page 30
The study used a secondary source of data, the Department of Housing and Urban Development (HUD)
United States Postal Service (USPS) survey, to confirm the estimates on new housing units shown by the
ACS data. This data was accessed from NEO CANDO (Northeast Ohio Community and Neighborhood Data
for Organizing),33 which provides indicators for 17 counties in Northeast Ohio. Therefore, the secondary
data was used to confirm only projects in Northeast Ohio counties. After this selection process, six census
tracts remained eligible for the analysis of population changes, along with 11 census tracts for analysis of
changes in the number of households.
Analysis of population changes shows an overall increase in population which correlates with the
additions in housing units (Table 7 and Table 8). Projects completed in residential areas of Cleveland and
Columbus census tracts show positive dynamics of population using both U.S. Census decennial data and
ACS estimates. OHPTC projects in Cambridge, Cincinnati, and Youngstown tracts show mixed results.
Two census tracts in Cleveland show the most reliable statistics on population gains. These tracts are in
Downtown Cleveland where a few new-build residential construction projects and a number of non-
residential projects occurred between 2007 and 2013. A total of 7 residential OHPTC projects were
completed in these two tracts, adding 531 units to the residential market between them (Figure 8). These
two tracts added a combined population of 1,888 residents between 2000 and 2010. The ACS estimates
showed an addition of 1,400 residents between 2006-2010 and 2009-2013. Cleveland has the earliest
certified projects completed with OHPTC, and therefore allows the longest interval between the time
when projects were completed and when the population dynamics were measured. Moreover, a number
of downtown Cleveland projects were located within close proximity of each other and perhaps created
a scale effect where consumer confidence was gained due to updates in multiple properties (both
residential and non-residential).
In Cleveland, tract 1077.01 added 709 residents between 2000 and 2010, and 381 (25%) between ACS
periods, which compares to the 332 units of various residential capacity added through six projects in the
tract between 2009 and 2011. Tract 1078.02 added 1,179 residents between 2000 and 2010, and 1,019
between ACS periods. The one tax credit project in the tract added 199 residential units between 2009
and 2011.
Population also significantly increased in Tract 74 in Cincinnati after the completion of an OHPTC project
in 2011, which added 110 units. The tract had lost 612 residents between 2000 and 2010, but showed a
significant gain of 291 residents, or 21%, between ACS periods.
because the calculated changes are smaller than the margin of error. Included in the analysis are only those census tracts where a total change is larger than the margins for error of the two ACS periods. 33NEO CANDO system, Center on Urban Poverty and Community Development, MSASS, Case Western Reserve University, http://neocando.case.edu.

Ohio Historic Preservation Tax Credit Economic Impact Study
Center for Economic Development, Cleveland State University Page 31
Table 7. Changes in Population by Census Tract
Census
Tract
Number
City
Residential Projects
Completed Between
2007 and 2011
Total
Residential
Units Added
2000 to 2010 2006-2010 to 2009-
2013
Change Percent
Change Change
Percent
Change
9773 Cambridge 1 48 -115 -3% 485 16%
74 Cincinnati 1 110 -612 -28% 291 21%
1077.01 Cleveland 6 332 709 57% 381 25%
1078.02 Cleveland 1 199 1,179 54% 1,019 44%
40 Columbus 1 76 746 34% 291 12%
8137 Youngstown 3 67 -846 -22% -22 -25%
Total 13 832 1,061 2,445
Figure 8. Location of Residential and Non-Residential Projects within Census Tracts 1077.01 and
1078.02 in Cleveland
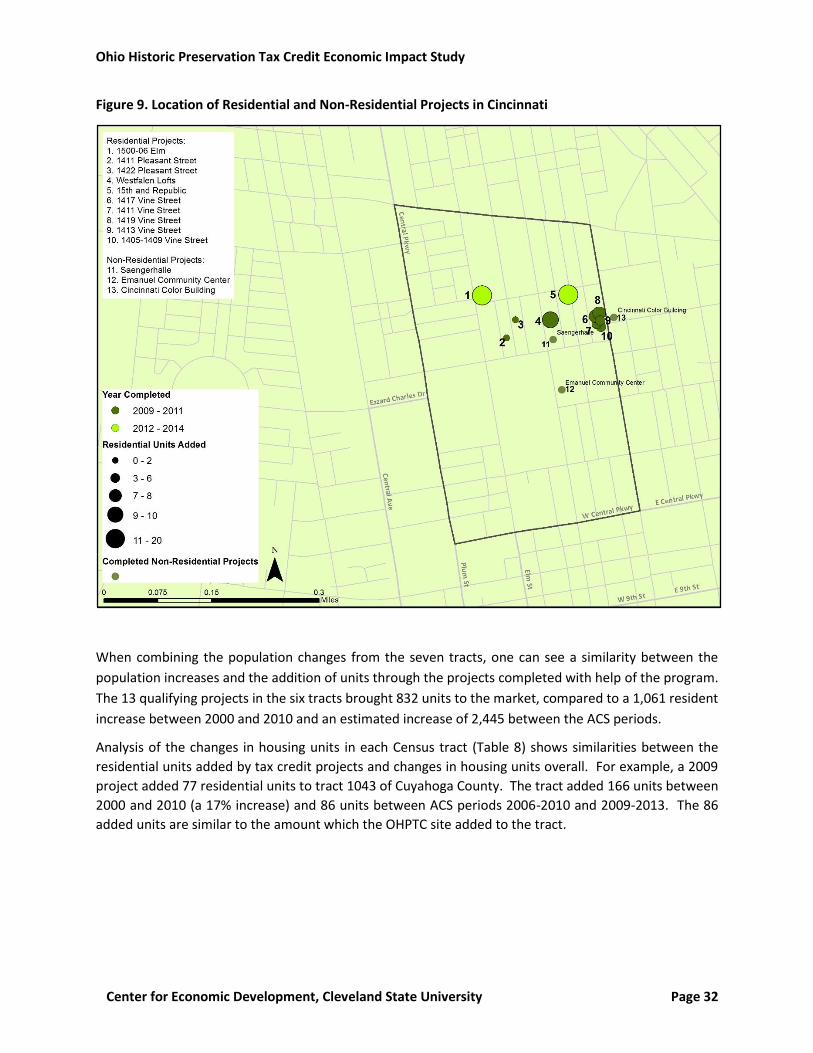
Ohio Historic Preservation Tax Credit Economic Impact Study
Center for Economic Development, Cleveland State University Page 32
Figure 9. Location of Residential and Non-Residential Projects in Cincinnati
When combining the population changes from the seven tracts, one can see a similarity between the
population increases and the addition of units through the projects completed with help of the program.
The 13 qualifying projects in the six tracts brought 832 units to the market, compared to a 1,061 resident
increase between 2000 and 2010 and an estimated increase of 2,445 between the ACS periods.
Analysis of the changes in housing units in each Census tract (Table 8) shows similarities between the
residential units added by tax credit projects and changes in housing units overall. For example, a 2009
project added 77 residential units to tract 1043 of Cuyahoga County. The tract added 166 units between
2000 and 2010 (a 17% increase) and 86 units between ACS periods 2006-2010 and 2009-2013. The 86
added units are similar to the amount which the OHPTC site added to the tract.

Ohio Historic Preservation Tax Credit Economic Impact Study
Center for Economic Development, Cleveland State University Page 33
Table 8. Changes in Housing Units by Tract, ACS Data
Census
Tract City
Residential
Projects
Completed
Between 2007
and 2011
Total
Residential
Units
Added
2000 to 2010 2006-2010 to
2009-2013
Change Percent
Change Change
Percent
Change
34 Springfield 1 85 -472 -22% -226 -12%
1043 Cleveland 1 77 166 17% 86 8%
1077.01 Cleveland 6 332 610 93% 301 30%
1078.02 Cleveland 1 199 504 27% 231 11%
40 Columbus 1 76 657 35% 203 9%
9 Cincinnati 8 45 -261 -18% -160 -12%
11 Cincinnati 1 4 -21 -3% -41 -5%
23 Cincinnati 1 12 -101 -11% -85 -9%
74 Cincinnati 1 110 -68 -7% -33 -3%
37 Toledo 1 75 191 27% -39 -5%
36 Portsmouth 1 50 -394 -26% -163 -12%
Total 23 1,065 811 74
Tract 1077.01 in Cleveland contains six projects that brought 332 residential units to the market between
2007 and 2011. The tract gained 610 units between 2000 and 2010 (a 93% increase) and an estimated
301 units between the two ACS periods (an increase of 30%). This estimated increase roughly reflects the
addition of new units brought to market with help from the OHPTC program. In all, this analysis shows
that 23 projects added 1,065 new units to the market. The ACS estimates show only a 74-unit increase
across the geographies between 2006-2010 and 2009-2013.
United States Postal Service (USPS) data was used to confirm the household increases in Northeast Ohio
Tracts. Quarterly USPS data shows the number of households and is more reliable than the ACS estimates.
These results for Northeast Ohio tracts show increases in housing units in six of seven tracts which had
completed residential tax credit projects between 2009 and 2011 (Table 9). The results show that overall
the projects contributed to an increase of 567 units in their census tracts.

Ohio Historic Preservation Tax Credit Economic Impact Study
Center for Economic Development, Cleveland State University Page 34
Table 9. Housing Unit Census Tract, USPS
Census Tract
2000
Boundary
County
Tax Credit
Projects
Completed
Between
2009 and
2011
Total
Residential
Units Added
Year
USPS:
Change in
Units
2008 - 2012
Percent
Change
1019 Cuyahoga 1 41 2009 19 2.9%
1032 Cuyahoga 1 18 2010 18 4.7%
1043 Cuyahoga 1 77 2009 119 30.4%
1077 Cuyahoga 4 294 2010 301 42.4%
1078 Cuyahoga 1 199 2010 -41 -2.3%
1079 Cuyahoga 2 38 2009/2010 122 15.1%
8037 Mahoning 3 70 2009/2011 29 5.8%
Total 13 737 567
Analysis of Property Values in OHPTC Projects and Surrounding Areas
In Ohio, a full general reappraisal is required every six years and is termed a “Sexennial Reappraisal.” For
a sexennial reappraisal, the auditor and/or approved appraisers are required to actually view and appraise
every property. Halfway between each sexennial reappraisal, the auditor is required to conduct a
“Triennial Update.” In this case, statistical methods based on recent sales are used to adjust values by
neighborhood. Counties across Ohio are on different schedules for their sexennial reappraisals and
triennial updates.34
The study focused on certified projects so that the research would have the best chance of detecting value
changes on appraisal files. There was a total of 101 certified projects at the time of study completion.
For each project, the appropriate county auditor site was searched for the availability of historic tax and
valuation data. (An exception to this was Cuyahoga County, for which much of the data was located from
data files available at the College.) The availability of historic data immediately available on county web
sites varies substantially across the state. In many cases, historic valuation data is available but historic
tax data is not (often including only the current year). In these cases, the appropriate auditor offices were
contacted and requests made for the historic data needed for the project (at least one year of data prior
to the beginning of the project, in addition to data for the intervening years up to the current year). In
some cases, data was also obtained from treasurer offices.
34 The schedule for these reappraisals can be found on the Ohio Department of Taxation site, at http://www.tax.ohio.gov/Portals/0/real_estate/Current_Reappraisal_TriEnnial_Update_Schedule.pdf
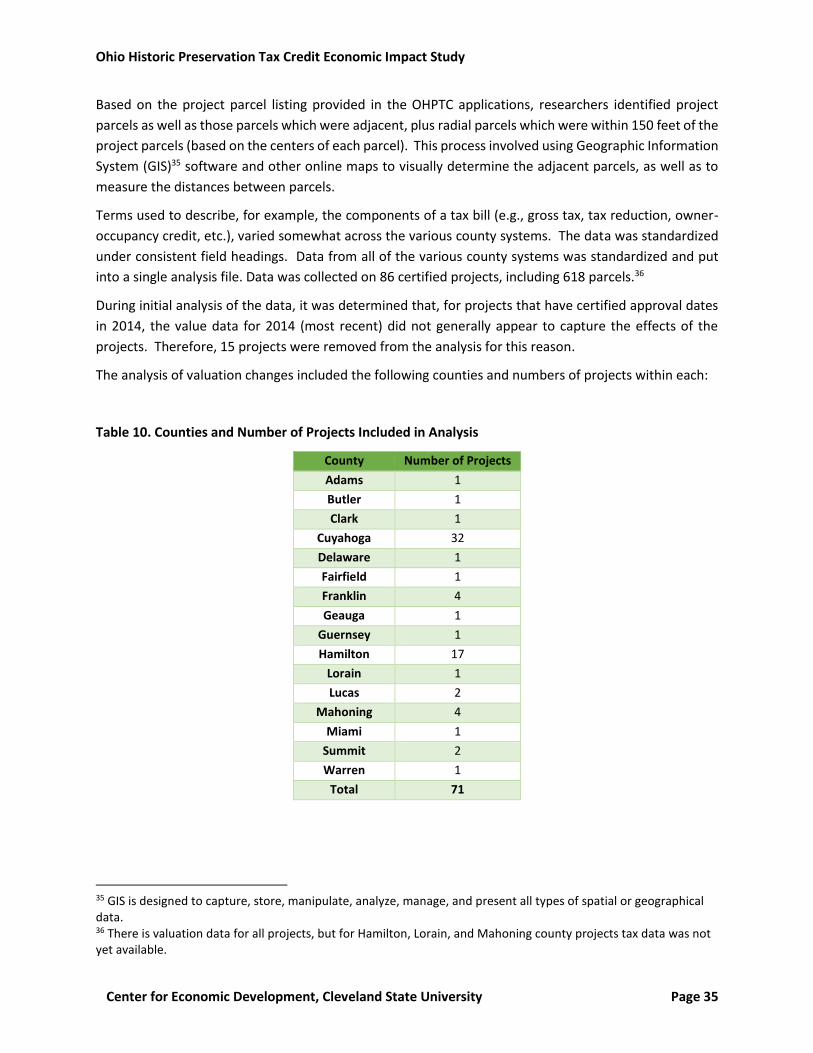
Ohio Historic Preservation Tax Credit Economic Impact Study
Center for Economic Development, Cleveland State University Page 35
Based on the project parcel listing provided in the OHPTC applications, researchers identified project
parcels as well as those parcels which were adjacent, plus radial parcels which were within 150 feet of the
project parcels (based on the centers of each parcel). This process involved using Geographic Information
System (GIS)35 software and other online maps to visually determine the adjacent parcels, as well as to
measure the distances between parcels.
Terms used to describe, for example, the components of a tax bill (e.g., gross tax, tax reduction, owner-
occupancy credit, etc.), varied somewhat across the various county systems. The data was standardized
under consistent field headings. Data from all of the various county systems was standardized and put
into a single analysis file. Data was collected on 86 certified projects, including 618 parcels.36
During initial analysis of the data, it was determined that, for projects that have certified approval dates
in 2014, the value data for 2014 (most recent) did not generally appear to capture the effects of the
projects. Therefore, 15 projects were removed from the analysis for this reason.
The analysis of valuation changes included the following counties and numbers of projects within each:
Table 10. Counties and Number of Projects Included in Analysis
County Number of Projects
Adams 1
Butler 1
Clark 1
Cuyahoga 32
Delaware 1
Fairfield 1
Franklin 4
Geauga 1
Guernsey 1
Hamilton 17
Lorain 1
Lucas 2
Mahoning 4
Miami 1
Summit 2
Warren 1
Total 71
35 GIS is designed to capture, store, manipulate, analyze, manage, and present all types of spatial or geographical data. 36 There is valuation data for all projects, but for Hamilton, Lorain, and Mahoning county projects tax data was not yet available.
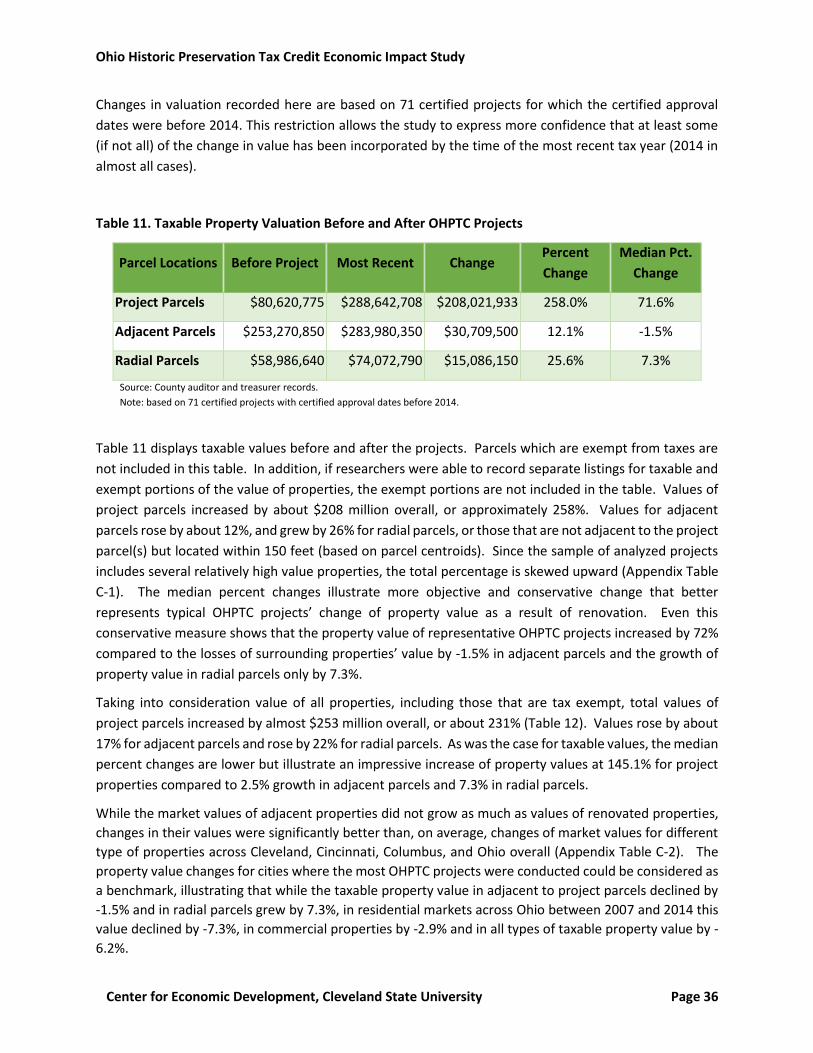
Ohio Historic Preservation Tax Credit Economic Impact Study
Center for Economic Development, Cleveland State University Page 36
Changes in valuation recorded here are based on 71 certified projects for which the certified approval
dates were before 2014. This restriction allows the study to express more confidence that at least some
(if not all) of the change in value has been incorporated by the time of the most recent tax year (2014 in
almost all cases).
Table 11. Taxable Property Valuation Before and After OHPTC Projects
Parcel Locations Before Project Most Recent Change Percent
Change
Median Pct.
Change
Project Parcels $80,620,775 $288,642,708 $208,021,933 258.0% 71.6%
Adjacent Parcels $253,270,850 $283,980,350 $30,709,500 12.1% -1.5%
Radial Parcels $58,986,640 $74,072,790 $15,086,150 25.6% 7.3%
Source: County auditor and treasurer records.
Note: based on 71 certified projects with certified approval dates before 2014.
Table 11 displays taxable values before and after the projects. Parcels which are exempt from taxes are
not included in this table. In addition, if researchers were able to record separate listings for taxable and
exempt portions of the value of properties, the exempt portions are not included in the table. Values of
project parcels increased by about $208 million overall, or approximately 258%. Values for adjacent
parcels rose by about 12%, and grew by 26% for radial parcels, or those that are not adjacent to the project
parcel(s) but located within 150 feet (based on parcel centroids). Since the sample of analyzed projects
includes several relatively high value properties, the total percentage is skewed upward (Appendix Table
C-1). The median percent changes illustrate more objective and conservative change that better
represents typical OHPTC projects’ change of property value as a result of renovation. Even this
conservative measure shows that the property value of representative OHPTC projects increased by 72%
compared to the losses of surrounding properties’ value by -1.5% in adjacent parcels and the growth of
property value in radial parcels only by 7.3%.
Taking into consideration value of all properties, including those that are tax exempt, total values of
project parcels increased by almost $253 million overall, or about 231% (Table 12). Values rose by about
17% for adjacent parcels and rose by 22% for radial parcels. As was the case for taxable values, the median
percent changes are lower but illustrate an impressive increase of property values at 145.1% for project
properties compared to 2.5% growth in adjacent parcels and 7.3% in radial parcels.
While the market values of adjacent properties did not grow as much as values of renovated properties,
changes in their values were significantly better than, on average, changes of market values for different
type of properties across Cleveland, Cincinnati, Columbus, and Ohio overall (Appendix Table C-2). The
property value changes for cities where the most OHPTC projects were conducted could be considered as
a benchmark, illustrating that while the taxable property value in adjacent to project parcels declined by
-1.5% and in radial parcels grew by 7.3%, in residential markets across Ohio between 2007 and 2014 this
value declined by -7.3%, in commercial properties by -2.9% and in all types of taxable property value by -
6.2%.

Ohio Historic Preservation Tax Credit Economic Impact Study
Center for Economic Development, Cleveland State University Page 37
Table 12. All Property Valuations (including Exempt) Before and After OHPTC Projects
Parcel Locations Before Project Most Recent Change Percent
Change
Median Pct.
Change
Project Parcels $109,488,104 $362,090,539 $252,602,434 230.7% 145.1%
Adjacent Parcels $294,924,480 $345,218,750 $50,294,270 17.1% 2.5%
Radial Parcels $69,675,560 $84,651,090 $14,975,530 21.5% 7.3%
Source: County auditor and treasurer records.
Note: based on 71 certified projects with certified approval dates before 2014.
Moreover, the changes of property value for this period declined in Cincinnati by -10.5%, in Cleveland by
-15.6%, and in Columbus by -9.0%. Based on this comparison, it is appropriate to suggest that property
value not only grew significantly for parcels with renovated projects, but also that surrounding property
values showed meaningfully better dynamic of change than the average taxable property values in Ohio.
Changes in property values for renovated OHPTC projects also triggered an increase in taxes collected
from project parcels. Moreover, not only were the collected taxes higher from renovated properties, both
adjacent and radial parcel properties yielded sufficiently higher tax revenues. Changes in taxes recorded
before and after OHPTC projects are based on 66 certified projects with certified approval dates before
2014. The projects selected for this analysis were certified and completed by the end of 2014 to allow
one full year (2014) for the assessment to be completed and recorded in the auditor’s data. Changes in
valuation recorded for taxes before and after OHPTC projects are based on 66 certified projects with
certified approval dates before 2014 (Table 13). This data restriction allows researchers to be more
confident that at least some (if not all) of the change in tax amounts has been incorporated by the time
of the most recent tax year, 2014 in almost all cases.
Table 13. Property Taxes Before and After Completion of OHPTC Projects
Parcel Locations Before Project Most Recent Change Percent
Change
Median Pct.
Change
Project Parcels $2,020,071 $9,193,941 $7,173,871 355.1% 48.2%
Adjacent Parcels $6,796,339 $10,538,402 $3,742,063 55.1% 24.7%
Radial Parcels $1,510,623 $1,961,230 $450,607 29.8% 33.9%
Source: County auditor and treasurer records.
Note: based on 66 certified projects with certified approval dates before 2014. Data for Lorain, and Mahoning counties was not
available for this analysis.
Taxes collected from properties on project parcels increased by about $7.2 million overall, or about 355%.
Taxes rose by about 55% on adjacent parcels and by 30% on radial parcels. The more conservative
measure of median project value yields 48% more in taxes, triggering an increase of collected taxes in
adjacent parcels by 25% and taxes from radial parcels by 34%.

Ohio Historic Preservation Tax Credit Economic Impact Study
Center for Economic Development, Cleveland State University Page 38
This growth in employment, business establishments, and population – when paired with significant
increases in values and collected taxes from both project parcels and property from surrounding parcels
– illustrates a clear positive impact of the OHPTC program. Helping to preserve historic properties and
reanimate economic activities in previously deteriorating buildings, the program supports development
projects that have potential to catalyze regrowth in anemic downtowns of large and small cities and to
add economic vitality in to small townships.
5. The Ohio Historic Preservation Tax Credit in Action: Case Studies from
around the State
An analysis of six case studies provides an in-depth understanding of OHPTC projects across the state,
including four completed projects (Cleveland Trust Complex [Cleveland], Old Ohio School for the
Deaf/Cristo Rey Columbus High School [Columbus], John T. Wilson Home [Adams County], and Horizon
House [Portsmouth]), one in-progress project (Goodyear Hall [Akron]), and one un-funded project (Kress
Building [Youngstown], now demolished).
The case study research shed light on the process of applying for and using the OHPTC, the history of
OHPTC buildings and projects, and the qualitative and quantitative impact of these projects on the
surrounding neighborhood, city and/or region. The case studies were strategically selected, in
consultation with ODSA, to ensure geographic dispersion across the state (Figure 10), variation in the
scope of the project and the amount of the OHPTC (Table 14), and differing final land uses (Table 15). The
case study research included site visits and interviews with more than 40 key stakeholders, including each
project’s developer, along with preservation consultants, investment partners, and local leaders (Table
16). Other sources of information included documentary materials such as media reports and OHPTC
application materials.
Overall, the case studies demonstrate the diversity of OHPTC projects and that the credits produce a range
of tangible and intangible benefits for a variety of communities. The narratives that follow illustrate that
OHPTC projects are catalyzing investment in large urban downtowns, in neighborhoods, along small town
main streets, and in rural settings. These historic building rehabilitations are helping to advance Ohio’s
21st century economy by bringing much-needed mixed-use, hospitality, residential – including affordable
and senior housing – and institutional facilities to communities across the state.
Universally, the case studies show that the OHPTC is a critical component of project financing, with direct
economic and community benefits. For the Cleveland Trust Complex, a critical decision by the state to
award what amounted to a catalytic credit (before such a credit existed), pulled the project from the brink
of demolition. The resulting complex, including the upscale Metropolitan at the 9 hotel, the Heinen’s
Grocery Store in the Ameritrust Rotunda, and the residences at 1010 Euclid, has become a cornerstone of
ongoing revitalization along the city’s E. 9th Street corridor. The rehabilitation of the Old Ohio School for
the Deaf as Cristo Rey Columbus High School has multiple community benefits, from bringing high-school
students to downtown Columbus to reinvigorating a long-dormant property and catalyzing activity in an

Ohio Historic Preservation Tax Credit Economic Impact Study
Center for Economic Development, Cleveland State University Page 39
area of town with other important community uses - including the Columbus Public Library. The adaptive
reuse of Goodyear Hall is anchoring the larger transformation of Akron’s East End, while smaller projects
such as the John T. Wilson Home in Adams County support tourism – a major economic driver in much of
Ohio. Portsmouth’s Horizon House has not only resulted in a high-quality, well-maintained property along
the city’s main street, but has also provided local senior residents with quality affordable housing in a
walkable location.
The case studies also illustrate that the OHPTC has intangible benefits that are difficult to quantify.
Interviewees from across the state articulated that it was important for the psyche of their community to
preserve these structures. In the words of Peter Goffstein (IRG, developer of Goodyear Hall): “Goodyear
is Akron’s history.” Brandon Kline (Geis Properties), developer of the Cleveland Trust Complex, expressed
a similar sentiment, arguing that one of the project’s greatest benefits was shifting perceptions about
downtown Cleveland’s real estate market through Geis’ success in “charging rents […] that everyone
thought were unreal,” with a 200-person waiting list. Across the board, it is clear that these buildings,
while useful economic engines, are also intricately intertwined with the identity, meaning and heritage of
the state’s neighborhoods, towns and cities.
Perhaps more than any other, the Kress Building narrative illustrates the challenge of financing historic
preservation under difficult economic conditions and the potential results of not funding projects with
the OHPTC. In this case – after two unsuccessful applications for the competitive OHPTC – the building
was demolished, and the property is now a parking lot along downtown Youngstown’s main thoroughfare.
The general sentiment about the loss of the Kress building was one of resigned sadness, stemming from
the realities of overcoming weak market conditions and a bias against older urban centers in private sector
financing. Furthermore, Youngstown has lost a key piece of its downtown core, as demolition is
irreversible and permanent.
While developers and others have proposed possible improvements to the program, they also nearly
universally agree that the OHPTC is a well-run, transparent, and relatively easy-to-use program. It is
efficiently administered alongside the beneficial Federal Historic Preservation Tax Credit, streamlining the
process of using both credits in tandem. The federal credit is a 20% income tax credit for qualified
rehabilitation expenditures on income-producing properties listed in, or eligible for listing in, the National
Register of Historic Places. In contrast to the OHPTC, the federal preservation credit is not competitive
and is not capped. The National Park Service, in conjunction with the state historic preservation offices,
administers the federal preservation credit.
Overall, the five funded projects included in this case study demonstrate the ability of the OHPTC to
incrementally restore the state’s neighborhoods, towns and cities, building-by-building. The narratives
on the following pages offer only a glimpse into the great diversity of projects included in the OHPTC
portfolio, but reflect the range of tangible and intangible benefits of the credit.

Ohio Historic Preservation Tax Credit Economic Impact Study
Center for Economic Development, Cleveland State University Page 40
Figure 10. Map of Ohio Showing Case Study Locations
Table 14. Case Study Summary
Case Study City Size General
Location
within Ohio
Total Project
Cost
OHPTC OHPTC Funding
Round
Building Size
(sq. ft.)
Cleveland Trust
Complex
Large Northeast $230M
$31M 1 555,714
Horizon House Small South $8.1M $1.5M 3 29,975
Old Ohio School for
the Deaf
Large Central $22.5M $3.89M 10 81,145
John T. Wilson Home Rural South $576,715 $61,756 1 2,800
Goodyear Hall Medium Northeast $36M $5M 10 292,000
Kress Building Medium Northeast n/a n/a 6 & 7
(denied)
n/a
(demolished)

Ohio Historic Preservation Tax Credit Economic Impact Study
Center for Economic Development, Cleveland State University Page 41
Table 15. Case Study Selection by End Land Use (excluding the unfunded Kress Building)
Market-Rate
Residential
Affordable
Residential
Mixed-
Use
Commercial Hospitality Institutional
Cleveland Trust Complex
Horizon House
Old Ohio School for the Deaf
John T. Wilson Home
Goodyear Hall
Table 16. Summary of Interviews
Interviewee Affiliation Role of
Interviewee
Interview
Date1
Cleveland
Trust
Complex
Brandon Kline Geis Companies Project
developer
7/21/15
Peter Ketter Sandvick Architects Preservation
consultant
7/7/15
Joe Marinucci Downtown Cleveland Alliance Local
stakeholder
7/23/15
Tom Yablonsky Historic Gateway District Local
stakeholder
7/23/15
Kathleen
Crowther
Cleveland Restoration Society Local
stakeholder
7/24/15
(email)
Jennifer
Coleman
Cleveland Landmarks
Commission
Local
stakeholder
7/23/15
Tracey Nichols City of Cleveland, Department of
Economic Development
Local
stakeholder
7/17/15
Old Ohio
School for
the Deaf
James Foley Cristo Rey Columbus High School Project
developer
7/7/15
Robert
Loversidge
Schooley Caldwell Project
architect
7/7/15
Nancy Recchie Benjamin D. Rickey & Company Preservation
consultant
7/14/15
(phone)
Randy Black Columbus Historic Resources
Commission
Local
stakeholder
7/9/15
Mark Lundine City of Columbus, Department of
Economic Development
Local
stakeholder
7/9/15

Ohio Historic Preservation Tax Credit Economic Impact Study
Center for Economic Development, Cleveland State University Page 42
Interviewee Affiliation Role of
Interviewee
Interview
Date1
Pat Losinski Columbus Metropolitan Library Project partner 7/13/15
(phone)
Horizon
House
Andrew Bailey Ohio Housing Finance Agency Project
financier
7/7/15
Hal Keller Ohio Capital Corporation for
Housing
Project
developer
7/7/15
Beth Long Ohio Capital Corporation for
Housing
Project
developer
7/7/15
Joe Pimmel Ohio Capital Corporation for
Housing
Project
developer
7/7/15
Brian Langmeyer Ohio Capital Corporation for
Housing
Project
developer
7/7/15
John Kukura III Ohio Capital Corporation for
Housing
Project
developer
7/7/15
Sarah Surina Main Street Portsmouth Local
stakeholder
7/8/15
Kevin Johnson Portsmouth City Council Local
stakeholder
7/8/15
Adam Phillips Southern Ohio Port Authority Local
stakeholder
7/8/15
John T.
Wilson
Home
Ralph Alexander Owner Project
developer
7/8/15
Patricia
Alexander
Owner Project
developer
7/8/15
Holly Johnson Adams County Economic
Development
Local
stakeholder
7/8/15
Tom Cross Adams County Travel & Tourism
Bureau
Local
stakeholder
7/8/15
Paul Worley Adams County Commissioner Local
stakeholder
7/8/15
Goodyear
Hall
Peter Goffstein IRG Project
developer
7/14/15
(phone)
Carol Smith IRG Project
developer
7/14/15
(phone)
Diana Wellman Preservation Principles
Consulting
Preservation
consultant
7/8/15
Adele Dorfner
Roth
Deputy Planning Director,
Economic Development, City of
Akron
Local
stakeholder
7/8/15

Ohio Historic Preservation Tax Credit Economic Impact Study
Center for Economic Development, Cleveland State University Page 43
Interviewee Affiliation Role of
Interviewee
Interview
Date1
Brad Beckert Development Engineering
Manager, City of Akron
Local
stakeholder
7/8/15
Christopher
Burnham
Development Finance Authority
of Summit County
Project partner 7/8/15
Kress
Building
Thomas
Humphries
Youngstown Area Community
Improvement Corporation
Project
developer
8/4/15
(phone)
Dave Kosec Youngstown Area Community
Improvement Corporation
Project
developer
8/4/15
(phone)
David Bozanich Director of Finance, City of
Youngstown
Local
stakeholder
8/4/15
(phone)
H. William
Lawson
Mahoning Valley Historical
Society
Local
stakeholder
7/22/15
Sharon Letson Cityscape Local
stakeholder
7/22/15
Sara Wenger Eastgate Regional Council of
Governments
Local
stakeholder
7/22/15
Dominic
Marchionda
NYO Property Group Local
stakeholder
7/22/15
Rodney
Lamberson
Strollo Architects Local
stakeholder
7/22/15
1 All interviews were in person unless otherwise noted.

Ohio Historic Preservation Tax Credit Economic Impact Study
Center for Economic Development, Cleveland State University Page 44
CLEVELAND TRUST COMPLEX
(The Cleveland Trust Company & Swetland
Building/1010 Euclid)
900 & 1010 Euclid Avenue
Cleveland, Ohio 44115
The adaptive reuse of the Cleveland Trust Complex
(Figure 11) – including the Swetland Building, Ameritrust
Rotunda, and Marcel Breuer-designed Ameritrust Tower
– at East 9th and Euclid Avenue in downtown Cleveland
illustrates the potential of OHPTC funding to transform
buildings on the brink of demolition into catalytic
projects with benefits extending beyond direct
economic gains. The Cleveland Trust project has
reinvigorated Cleveland’s former “Main-and-Main”
intersection, described by Brandon Kline (Geis Properties) as the former “epicenter of the banking and
financial world in Cleveland.” This complex project includes (1) the conversion of the Breuer-designed,
1970s-era Brutalist Ameritrust Tower into The 9, an upscale hotel and residences, with restaurant and
commercial amenities, (2) the adaptive reuse of the Ameritrust Rotunda into a downtown Heinen’s
Grocery Store (Figure 12), and (3) the adaptive reuse of the adjacent Swetland Building at 1010 Euclid as
a mixed-use building including residential, office, and retail spaces. The project received $31 million in
OHPTCs and pulled the unique Breuer tower from the brink, as Kline recalls that it was “literally two weeks
away from being torn down.” The Cleveland Trust Complex received the largest OHPTC ever issued, which
filled a large gap in an extremely complex financing structure totaling more than $230 million for all three
buildings. The investment has been an economic and psychological catalyst for downtown Cleveland.
The history of these three structures closely follows that of the City of Cleveland. The Cleveland Trust
Rotunda (eventually known as the Ameritrust Rotunda) – completed in 1908 by the Cleveland Trust
Company and designed by George Browne Post, the architect of the New York Stock Exchange – featured
13 historic, interior murals by Francis Millet narrating settlement in the Midwest. By 1924 Cleveland had
grown into one of America’s largest cities, and the Cleveland Trust Company was the nation’s sixth-largest
bank, anchoring a hub of large financial institutions in the city centered at E. 9th and Euclid.37 The adjacent,
thirteen-story Swetland Building facing Euclid Avenue, Cleveland’s main thoroughfare, was built in 1922.
Approximately 50 years later, the Cleveland Trust Company recruited Marcel Breuer, one of the most
prominent Brutalist architects, to design an imposing skyscraper just south of the rotunda on E. 9th Street.
Completed in 1971, the Ameritrust Tower expressed the company’s optimism at the time. In 1979, the
company changed its name to AmeriTrust, reflecting its reach beyond Northeast Ohio. Ameritrust merged
37 Steve Litt. (2013). “Geis brothers’ plan for the Ameritrust complex is rescuing two Cleveland architectural landmarks,” Plain Dealer, October 11.
Developer Geis Properties, LLC
Funding Round 1 (March 13, 2008)
OHPTC Amount $23,000,000 (Cleveland Trust)
$8,000,000 (Swetland Building)
Total Cost $187,310,000 (Cleveland Trust)
$43,355,960 (Swetland)
Building Use Market-rate housing (104 units)
Affordable housing (90 units)
Hotel (217,857 sf)
Commercial/office (37,386sf)
Retail (9,600 sf)
Estimated Job 1,085 permanent jobs
Creation 800 construction jobs
Status Completed
Certified on December 31, 2014
Ohio Historic Preservation Tax Credit Economic Impact Study
Center for Economic Development, Cleveland State University Page 45
with Society Corporation in the early 1990s and vacated its complex at E. 9th and Euclid.38 The Ameritrust
Tower, which according to Kline is known as a “city of granite,” had been vacant longer than it had been
occupied.
The Cleveland Trust complex, particularly the Breuer-designed tower, had been the center of controversy
since 2005. At that time, Cuyahoga County acquired the complex for $21.7 million, with plans to demolish
the long-vacant Cleveland Trust Tower and replace it with a newly constructed County Administration
Building. After spending millions on asbestos abatement and removing other hazardous materials from
the tower, the county reconsidered its plan for a new consolidated headquarters – leaving the fate of the
Cleveland Trust complex buildings in limbo.
According to Peter Ketter (Director of Historic Preservation, Sandvick Architects), a team including
Sandvick Architects, a local architect and preservation consulting firm, Cuyahoga County, and the Ferchill
Group applied for the OHPTC in the program’s first funding round in July 2007. The state awarded the
OHPTC in March 2008 for the two buildings listed on the National Register of Historic Places at that time:
the Ameritrust Rotunda and the Swetland Building at 1010 Euclid Avenue. Over the next five years,
Sandvick Architects, Historic Gateway Neighborhood Corporation and Cuyahoga County, worked with
potential developers to identify a suitable plan for the buildings, without success. For example, in 2009 a
deal involving the K&D Group to purchase the complex for about $35 million ($10 million less than the
county’s sunk costs in the complex) fell through.39 In the meantime, the tax credits remained unused as
Cuyahoga County, the official recipient as the building’s owner, focused on government reforms and
building a new convention center. At this point, the County Commissioners had approved demolishing
the Breuer-designed tower in 2007; with no identified use and no OHPTC for the tower, demolition
seemed inevitable.
In 2013, the Ohio Development Services Agency encouraged the project’s partners to move forward on
rehabilitation plans or risk losing the OHPTC, while the county redoubled its efforts to sell the site. Around
this time, Geis Properties, LLC put forth a proposal to pay approximately $27 million for the Swetland
building, Ameritrust Rotunda and Tower, and adjacent parcels. The Cuyahoga County Council and the
County Executive both approved Geis’ development plan, which included building a new county
administration building just south of the Ameritrust Tower. The county leases the new administration
building for $6.7 million per year, with an option to buy the building for $1 at the end of the 26-year
lease.40 The project also resulted in converting the Breuer-designed tower into an upscale hotel and luxury
38 “History of Ameritrust Corporation,” Retrieved from: http://ead.ohiolink.edu/xtf-ead/view?docId=ead/OCLWHi0299.xml;chunk.id=bioghist_1;brand=default. Also see, “Ameritrust,” in Encyclopedia of Cleveland History. Retrieved from: http://ech.case.edu/ech-cgi/article.pl?id=A8. 39 Laura Johnston. (2011). Ameritrust appraises at $17 million, $28 million less than Cuyahoga County taxpayers have invested, Plain Dealer, May 19. Retrieved from: http://www.cleveland.com/cuyahoga-county/index.ssf/2011/05/ameritrust_appraised_at_17_million_27_million_less_than_taxpayers_have_invested.html. 40 Laura Johnston. (2012). Cuyahoga County to sell Ameritrust complex, lease new office back. Plain Dealer, December 11. Retrieved from: http://www.cleveland.com/cuyahoga-county/index.ssf/2012/12/cuyahoga_county_to_sell_ameritrust_complex.html.

Ohio Historic Preservation Tax Credit Economic Impact Study
Center for Economic Development, Cleveland State University Page 46
apartments, adding commercial/retail uses to the street level, providing housing and office space in the
Swetland building, and bringing a local grocery chain, Heinen’s, to the Rotunda and Swetland buildings.
Geis’ development was an extremely complicated, risky investment and was Geis’ largest public-private
partnership to date. The project’s success hinged on the ability to leverage public financing to generate
private equity. In total, the approximately $250 million investment, included $75.5 million on the new
county building, more than $150 million on renovations to the Ameritrust Tower and Rotunda and
Swetland Building, which Geis renamed 1010 Euclid, and other site improvements including a parking
garage.41
According to Ketter, when Geis purchased the property, the OHPTC allocation was less than $5 million. A
team including Geis, local stakeholders and Sandvick Architects, among others, appealed to the state to
amend the qualifying expenses for the credit and to add the Breuer-designed tower in the original award
for the Rotunda. Since, in the first funding round, the state did not have a project cap or limit project
completion to five years, the state was able to approve an increase in the OHPTC award in August 2014.
In total, OHPTC funding amounted to $8 million for the Swetland Building and $23 million for the Rotunda
and Tower buildings, combined. The team also used federal preservation tax credits on all three buildings,
successfully arguing that Breuer’s tower, although less than 50 years old, had exceptional architectural
and historical significance. According to Ketter, ODSA’s decision to drastically increase the OHPTC for the
Cleveland Trust Complex was a significant moment because that decision “absolutely determined the fate
of the complex. There’s no way that this could have been done without that funding. It was a real
challenge even with that funding. Without the support of the state and federal tax credits, there’s no way
it could have been done.” Other interviewees reiterated this sentiment, emphasizing that the ODSA
decision literally pulled the Ameritrust Tower from the brink of demolition and these public financing
sources were essential, as private lending institutions were unwilling to serve as primary financiers on
such a large, risky, and unprecedented project.
Geis relied on layers of complex financing, in addition to the OHPTC and federal preservation tax credits.
According to Tracey Nichols (Director of Economic Development, City of Cleveland), the City of Cleveland
created a project-based, non-school, 30-year TIF (tax increment financing) and facilitated a $6 million HUD
Section 108 loan. A Community Benefits Agreement, arranged by the City of Cleveland, helped place local
students in internships and job training positions with Geis. It also required MBE, FBE and CSB
subcontractors, at least 20% of construction hours to City residents, and 4% of those hours to low-income
City residents.
One of the development team’s central arguments in their request that ODSA increase the OHPTC award
was that the completed project would be a transformative project for Cleveland and particularly for the
struggling E. 9th and Euclid district. Prior to the project, the area around E. 9th and Euclid had
approximately two million square feet of vacant office space across fourteen buildings. The Cleveland
Trust Complex was a large part of this void, functioning for years as a symbol of disinvestment and blight.
41 O'Meara, M. (2014). "Revived Historic Structures Anchor Downtown Cleveland". Novogradac Jounal of Tax Credits, Volume V(Issue XI), pp. 1-7.

Ohio Historic Preservation Tax Credit Economic Impact Study
Center for Economic Development, Cleveland State University Page 47
As Ketter summarized, “psychologically, this was such a white elephant for so long and an albatross
hanging around the county’s neck. There was so much negativity around it. It was seen for so long as a
drain, a waste, and a useless piece of property.”
To date, the completed project has surpassed even the most optimistic expectations. The construction
was labor-intensive, employing more than 800 people. The project is mixed-use and mixed-income
including luxury apartments, affordable housing, middle-market housing, a hotel, offices, a grocery store,
and restaurants. The Swetland Building (1010 Euclid), which Kline described as “beyond dilapidated and
neglected” prior to renovation, is at 100% residential occupancy. The building now provides quality
mixed-income housing in the tight downtown Cleveland housing market. Twenty percent of the building’s
units are affordable to households making 80% of area median income. Office tenants at 1010 Euclid
include a satellite office for Geis Properties, the Downtown Cleveland Alliance, and Historic Gateway and
Historic Warehouse District Neighborhood Corporations, with 23 full-time, part-time and contract
employees.42
The Marriott Autograph hotel, the first boutique hotel of its type in Cleveland, operates on the first 13
floors of the Ameritrust Tower, now named as “The 9,” and occupancy since its opening has been about
4% higher than the city’s average. Residential occupancy at The 9 is 100%. According to Kline, there are
more than 200 people on a waitlist for the building’s 104 apartments. Kline also explained that the project
set a new standard for residential rent levels in downtown Cleveland by demonstrating that the market
can support high price points:
“The 9 created validity in what was going on. It got national recognition by countless
publications. It put Cleveland on the map because it was looked at on a national level in
a different way than Cleveland has ever been looked at. It reassured people that the
housing market is there, the rental rates are there, the demand is there. It creates validity
that we are charging rents in the tower that everyone thought were unreal.”
The Heinen’s Grocery Store in the Rotunda, which opened in early 2015, is perhaps the most recognized
component of the project, described by Joe Marinucci (President & CEO, Downtown Cleveland Alliance) as
“the most beautiful grocery store in the world.” According to Ketter, Heinen’s is “a game changer for the
city” that “is an amenity that will attract more people to live and work downtown.” It is the first full-
service grocery store in downtown Cleveland and, because there is no precedent, was a risk for the
company. Heinen’s $10 million investment resulted in the smallest of any of their regional grocery stores
and the company has had to adapt to an urban model.43 According to Kline, the average purchase at the
downtown location is significantly less than in the more suburban locations, while Nichols noted that foot
traffic is significantly heavier. Heinen’s has quickly become a tourist destination in downtown Cleveland,
in addition to providing a needed community amenity for downtown residents and workers.
42 Michelle Jarboe McFee. (2014). “Downtown Cleveland Alliance plans office move to 1010 Euclid building at former Ameritrust complex.” Plain Dealer (January 8). 43 Steven Litt. (2015). “Heinen’s opens downtown supermarket in renovated Cleveland Trust Building”, Plain Dealer (February 25)

Ohio Historic Preservation Tax Credit Economic Impact Study
Center for Economic Development, Cleveland State University Page 48
By all accounts, the project is a resounding success. Ketter, for instance, notes that the scale, impact,
concentration, and mix of uses helps differentiate the project from others in downtown Cleveland. He
further discusses the effect of its quick transformation: “people didn’t have expectations for it. To see it
transformed so dramatically and quickly increases the drama of its impact. In fact the whole thing was
done at once. Normally it would take several years to do this much work.” Jennifer Coleman (Chair,
Cleveland Landmarks Commission) simply states the project’s impact as “huge” with spin-off benefits
including projects to transform at least a half-dozen vacant office buildings in the surrounding area,
including very early-stage ideas for the 925 Euclid (formerly Huntington Bank) building, which has the
most square feet of any building in downtown Cleveland. Tom Yablonsky (Executive Director, Historic
Gateway Neighborhood Corporation) describes the project’s impact as “catalytic,” arguing that it has
allowed Cleveland’s Main-and-Main intersection to “return to its grandeur.”
In addition to the project’s impact on downtown Cleveland’s residential rental market, the project
positively impacted downtown commercial real estate. It has had a net effect of taking units out of an
over-supplied office market, thus increasing demand and raising rental rates on remaining office spaces.
As Marinucci summarized, the OHPTC funding has allowed downtown Cleveland to adaptively reuse
antiquated Class B and C office space, thus reducing the vacancy that resulted when companies left
downtown and/or downsized over the past several decades.
Although residential occupancy in downtown Cleveland is around 98%, securing traditional, private-sector
project financing remains challenging. If Geis had not received the dramatically increased amended
OHPTC, the project would likely have not come to fruition in its current form. The alternative outcome
would have likely involved demolition of both the tower and the Swetland building, which was in the most
deteriorated condition of all three buildings. As Ketter reflected, “you would have ended up with no
project or a project that would have been far less impactful.”
The OHPTC was an essential piece of financing the resurgence of the Cleveland Trust Complex as a key
feature in Cleveland’s Main-and-Main intersection. Geis was able to craft an overall project pro format
that included restoring unique historic features and retaining public spaces, including the Rotunda, due
to the OHPTC funding. As Kline summarized, “the thing that I think is most exciting to see, and this is
where the tax credits come into play the most, is it allowed us to make a lot of unique aspects of this
building open to the public. The last thing that Geis wanted to do was close off some of these gems from
the public eye.” Through the Cleveland Trust Complex project, the OHPTC promoted additional
investment and reversing decades-long skepticism about the health of downtown Cleveland.

Ohio Historic Preservation Tax Credit Economic Impact Study
Center for Economic Development, Cleveland State University Page 49
Figure 11. The Cleveland Trust Complex, with the Rotunda in the foreground44
44 All pictures in this section are provided by authors of the case studies unless other source is listed.
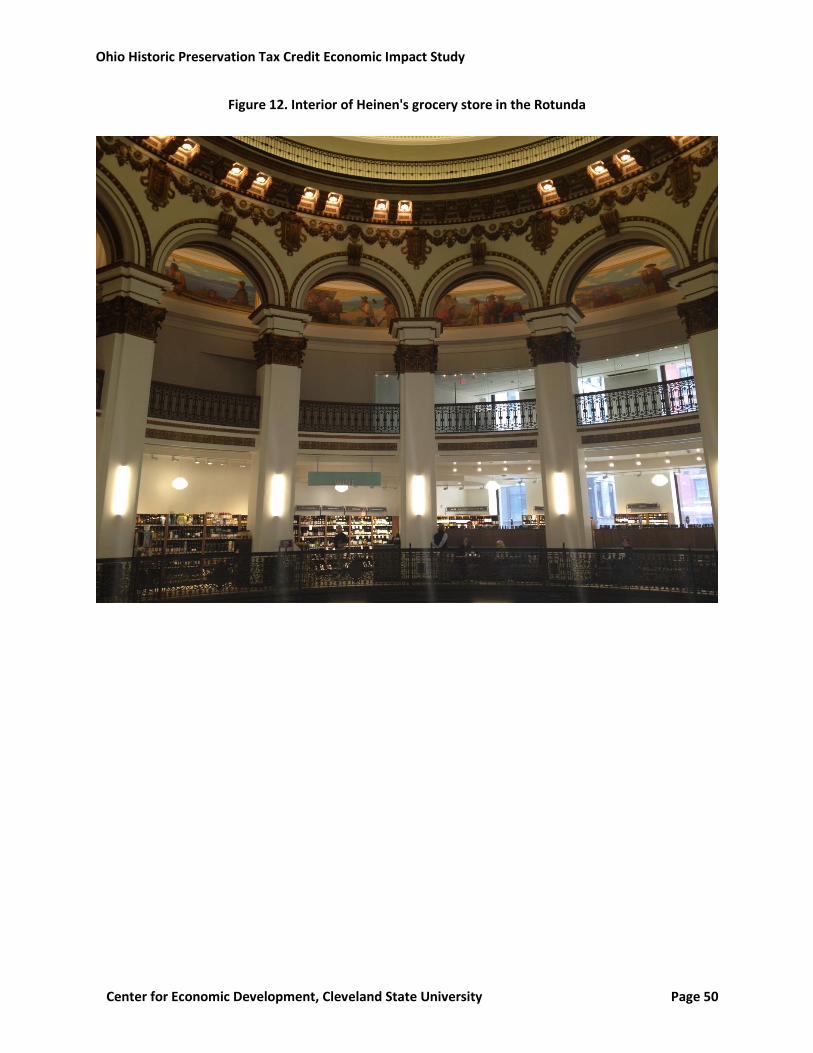
Ohio Historic Preservation Tax Credit Economic Impact Study
Center for Economic Development, Cleveland State University Page 50
Figure 12. Interior of Heinen's grocery store in the Rotunda
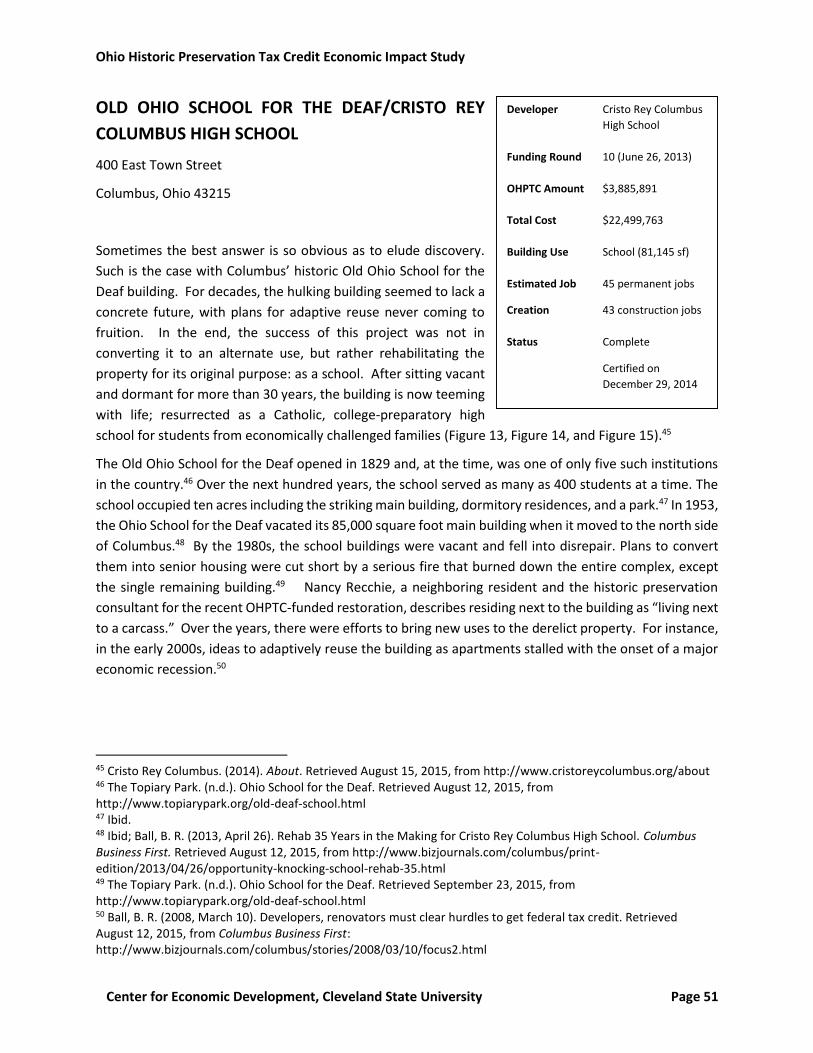
Ohio Historic Preservation Tax Credit Economic Impact Study
Center for Economic Development, Cleveland State University Page 51
OLD OHIO SCHOOL FOR THE DEAF/CRISTO REY
COLUMBUS HIGH SCHOOL
400 East Town Street
Columbus, Ohio 43215
Sometimes the best answer is so obvious as to elude discovery.
Such is the case with Columbus’ historic Old Ohio School for the
Deaf building. For decades, the hulking building seemed to lack a
concrete future, with plans for adaptive reuse never coming to
fruition. In the end, the success of this project was not in
converting it to an alternate use, but rather rehabilitating the
property for its original purpose: as a school. After sitting vacant
and dormant for more than 30 years, the building is now teeming
with life; resurrected as a Catholic, college-preparatory high
school for students from economically challenged families (Figure 13, Figure 14, and Figure 15).45
The Old Ohio School for the Deaf opened in 1829 and, at the time, was one of only five such institutions
in the country.46 Over the next hundred years, the school served as many as 400 students at a time. The
school occupied ten acres including the striking main building, dormitory residences, and a park.47 In 1953,
the Ohio School for the Deaf vacated its 85,000 square foot main building when it moved to the north side
of Columbus.48 By the 1980s, the school buildings were vacant and fell into disrepair. Plans to convert
them into senior housing were cut short by a serious fire that burned down the entire complex, except
the single remaining building.49 Nancy Recchie, a neighboring resident and the historic preservation
consultant for the recent OHPTC-funded restoration, describes residing next to the building as “living next
to a carcass.” Over the years, there were efforts to bring new uses to the derelict property. For instance,
in the early 2000s, ideas to adaptively reuse the building as apartments stalled with the onset of a major
economic recession.50
45 Cristo Rey Columbus. (2014). About. Retrieved August 15, 2015, from http://www.cristoreycolumbus.org/about 46 The Topiary Park. (n.d.). Ohio School for the Deaf. Retrieved August 12, 2015, from http://www.topiarypark.org/old-deaf-school.html 47 Ibid. 48 Ibid; Ball, B. R. (2013, April 26). Rehab 35 Years in the Making for Cristo Rey Columbus High School. Columbus Business First. Retrieved August 12, 2015, from http://www.bizjournals.com/columbus/print-edition/2013/04/26/opportunity-knocking-school-rehab-35.html 49 The Topiary Park. (n.d.). Ohio School for the Deaf. Retrieved September 23, 2015, from http://www.topiarypark.org/old-deaf-school.html 50 Ball, B. R. (2008, March 10). Developers, renovators must clear hurdles to get federal tax credit. Retrieved August 12, 2015, from Columbus Business First: http://www.bizjournals.com/columbus/stories/2008/03/10/focus2.html
Developer Cristo Rey Columbus
High School
Funding Round 10 (June 26, 2013)
OHPTC Amount $3,885,891
Total Cost $22,499,763
Building Use School (81,145 sf)
Estimated Job 45 permanent jobs
Creation 43 construction jobs
Status Complete
Certified on
December 29, 2014
Ohio Historic Preservation Tax Credit Economic Impact Study
Center for Economic Development, Cleveland State University Page 52
In 2012, Jim Foley, a former attorney who had left his 35-year career to found a high school for
underprivileged youth, was searching for a location for the new Cristo Rey Columbus High School.51 Foley
sought a downtown location and the Old Ohio School for the Deaf building proved ideal. For students,
downtown provided a central transportation hub, making the school accessible to students from across
Columbus. Additionally, the Cristo Rey schools follow a work-study model wherein students take classes
four days a week and work one day in a professional stetting (e.g. law firms, banks, hospitals and other
professional services).52 Locating downtown ensured that students were in close proximity to their work-
study placements.
As Foley was searching for a property, the Columbus Metropolitan Library’s Main Branch hoped to expand
by annexing the adjacent Old Ohio School for the Deaf.53 Ultimately, Foley and the Metropolitan Library
entered into a mutually beneficial partnership. The library purchased the entire parcel, including the
former school and its grounds, for $2.16 million.54 Cristo Rey then purchased the Old Ohio School for the
Deaf building from the library for $1 million.55 The library retained ownership of the parking lot, with plans
to convert it into an outdoor plaza.56 The library was also able to use the remainder of the parcel, which
offsets its $30.4 million renovation of the downtown branch.57
After sitting vacant and dormant for more than 30 years, the Old Ohio School for the Deaf is once again a
bustling academic center. After receiving the OHPTC in 2013, Foley and Cristo Rey restored the building
as a Catholic, college-preparatory high school for economically disadvantaged students.58 Cristo Rey
Columbus High School is a private high school of the Diocese of Columbus and is open to all students.59 As
of this writing, approximately 80% of Cristo Rey students receive free or reduced lunches, and many also
rely on public transit. A recent report in the Columbus Dispatch highlighted two Cristo Rey students who
considered the work-study program important and found that it contributed to their personal growth.60
51 Viviano, J. (2012, July 22). Man Leaves Law to Help Kids Dream Once More. The Columbus Dispatch. Retrieved August 12, 2015, from http://www.dispatch.com/content/stories/local/2012/07/22/manleaves-law-to-help-kidsdream-once-more.html 52 Cristo Rey Network. (n.d.). Corporate Work Study Program. Retrieved August 12, 2015, from http://www.cristoreynetwork.org/page.cfm?p=372 53 Narciso, D. (2013, January 24). New purpose for old Deaf School. Retrieved August 12, 2015, from The Columbus Dispatch: http://www.dispatch.com/content/stories/local/2013/01/24/new-purposefor-old-school.html 54 Ibid. 55 Ball, B. R. (2013, April 26). Rehab 35 years in the making for Cristo Rey Columbus High School. Retrieved August 12, 2015, from Columbus Business First: http://www.bizjournals.com/columbus/print-edition/2013/04/26/opportunity-knocking-school-rehab-35.html 56 Ibid. 57 Ball, B. R. (2015, March 15). Main Library Closing for 16 months to Ease Construction. Columbus Business First. Retrieved August 12, 2015, from http://www.bizjournals.com/columbus/news/2015/03/10/main-library-closing-for-16-months-to-ease.html 58 Cristo Rey Columbus. (2014). About. Retrieved August 15, 2015, from http://www.cristoreycolumbus.org/about 59 Ibid. 60 Vivano, J. (2014, August 11). Cristo Rey Brings Students Back to Old Deaf School. The Columbus Dispatch. Retrieved August 12, 2015, from http://www.dispatch.com/content/stories/local/2014/08/11/fresh-start.html

Ohio Historic Preservation Tax Credit Economic Impact Study
Center for Economic Development, Cleveland State University Page 53
Overall, attending Cristo Rey stirs excitement in students, as the Cristo Rey network of schools have an
average 88% graduation rate,61 in comparison to Columbus City Schools’ 77% graduation rate.62
Cristo Rey required complex financing from public, private, and non-profit entities. In addition to the $3.9
million OHPTC, the financing included $3.7 million from Federal Historic Preservation Tax Credits, a $10
million loan from the Catholic Diocese of Columbus, and federal New Markets Tax Credit financing, a
federal incentive for real estate and/or business development in low-income areas.63 Foley estimates that
the state and federal historic tax credits accounted for 40% of the project’s total cost. The OHPTC, with
federal preservation credits, played a vital role in bringing this project to fruition, as Foley summarizes:
“I cannot say this in strong enough terms: But for the tax credits there is absolutely no way
that this building would have been renovated by us. It was inconceivable for us to be able
to afford to do it without the tax credits. Had the building not been renovated it would
have sat here as a dilapidated, falling apart building, and the school would have been
forced to go to a comparatively substandard location – certainly something that would
have been far less than where we are now.”
Foley, the Metropolitan Library, and other key stakeholders are all pleased with the deal. The school’s
proximity to downtown is ideal and the Columbus Public Library’s investment has tremendous community
benefits. Speaking to the benefits for Cristo Rey, Foley stated that “the location works on so many
different levels. It is hard to imagine another location that would measure up to this.” Recchie succinctly
summarized the ideal nature of the Columbus Metropolitan Library and Cristo Rey’s partnership: “The
win-win was that [the deal between the library and Cristo Rey] came at the right time. Cristo Rey was
looking for a high school. They had looked in the downtown area, they had looked outside the downtown
area. The timing was absolutely perfect. I absolutely marvel that the library and Cristo Rey found each
other.” Patrick Losinski (Chief Executive Officer, Columbus Metropolitan Library) indicated that having a
school on the adjacent property is ideal, as it brings in students: “having 450 to 480 high school age
students next to our main library has provided great energy for our building and kind of a nice mix of all
ages in our building.”
Many stakeholders noted that transforming the Old Ohio School for the Deaf into the Cristo Rey Columbus
High School is a unique case as it involved rehabilitating an historic school as a school, rather than
adaptively reusing it as housing, which has become common practice. The project’s architect, Robert
Loversidge, noted that “its uniqueness lies in the fact that it was updating an old school building, badly
treated over the years, into a new school – not really an adaptive reuse.” Since projects receiving federal
and State of Ohio historic tax credits must be income-producing, schools are often not a viable end-
product. Randy Black (Historic Preservation Officer, City of Columbus), noted that, “This school is one of
61 Cristo Rey Network. (2013). Impact. Retrieved August 12, 2015, from http://www.cristoreynetwork.org/page.cfm?p=354 62 Good, J. D. (2014). Columbus City Schools 2013-2014 Review. Retrieved August 12, 2015, from http://www.ccsoh.us/Downloads/CCS%202013-2014%20State%20of%20the%20District%20Digital%20Resource%20Guide.pdf 63 Garcia, T. (August 2014). High School Finds New Home in Renovated Historic Building. Novogradac Journal of Tax Credits, 2-5; Davis, W. (2013, March).Catholic Diocese of Columbus (Approval of financing Letter). Office of Finance Parish Aid Fund/Self Insurance Fund.

Ohio Historic Preservation Tax Credit Economic Impact Study
Center for Economic Development, Cleveland State University Page 54
a kind. It is great from a historic stand point, the adaptive reuse is not an adaptive reuse. It is just a
continuation, which is just a great thing.”
The building’s rehabilitation not only provides a tremendous educational opportunity for underprivileged
children, but it has also helped catalyze revitalization in a neighborhood suffering from decades of
disinvestment. City and state leaders herald the project as the rehabilitation of two key anchors (the
school and library) in the east side of downtown Columbus. As with many neighborhood revitalization
efforts, it is impossible to attribute direct causality to a single project, although the rehabilitation of the
Old Ohio School for the Deaf has undoubtedly had a positive impact on the community. Losinski notes,
“there are significant proposals being floated right now for redevelopment of the entire area around [the
adjacent] Topiary Park; so, whether or not the school is a catalyst, it certainly hasn’t hindered the
interest.” In addition, Cristo Rey gives local economic development leaders the ability to market
downtown as having high-quality educational amenities, which did not exist prior to the OHPTC-funded
transformation of the Old Ohio School. As a new urban amenity, Cristo Rey can further economic and
community development strategies, such as recruiting senior leadership or new firms.
Cristo Rey has also supported an intangible, positive change in the neighborhood. As urban scholar Jane
Jacobs noted, city streets should have eyes upon them and regular pedestrians, which creates a sense of
safety and purpose.64 Recchie reflected this sentiment noting that Cristo Rey students “make the park
safer because there are people in it and looking out over it all the time now, and I know this, there are
more people in the park than there used to be.” This benefit furthers existing efforts on the part of the
area’s Special Improvement District, which employs safety ambassadors and other specialists to make the
neighborhood a distinctive destination.65
In the end, energy and strength emanate from a well-designed space. The Old Ohio School’s historical
features even help Foley recruit students, as he stated, “they are walking around in a really cool structure
and they like it. Some of them are coming from some pretty bad physical environments and the building
is a significant aid in recruiting our incoming students.” While Foley set out to help youth, he ended up
also catalyzing an entire neighborhood. The community and the City of Columbus as a whole have both
benefitted from the OHPTC-funded rehabilitation of the Old Ohio School for the Deaf into the Cristo Rey
Columbus High School. As Losinski summarizes, “You say, oh, this is about the library and the school, you
know that’s about five percent of it. It’s about the school being a part of that park, a part of the
neighborhood, playing a part in bringing new people to the library, and the library’s ability to serve
everyone.”
64 Jacobs, J. (1961). The Death and Life of Great American Cities. New York: Random House. 65 Downtown Columbus. (n.d.). Discovery Special Improvement District. Retrieved August 13, 2015, from http://downtowncolumbus.com/home/about-us/discovery-sid/

Ohio Historic Preservation Tax Credit Economic Impact Study
Center for Economic Development, Cleveland State University Page 55
Figure 13. Old Ohio School for the Deaf/Cristo Rey Columbus High School

Ohio Historic Preservation Tax Credit Economic Impact Study
Center for Economic Development, Cleveland State University Page 56
Figure 14. Entrance to Cristo Rey
Figure 15. Interior hallway at Cristo Rey

Ohio Historic Preservation Tax Credit Economic Impact Study
Center for Economic Development, Cleveland State University Page 57
HORIZON HOUSE
700 2nd Street
Portsmouth, Ohio 45662
Located along the Ohio River, Portsmouth, a city with
approximately 20,000 people, has a long history as a
key river town situated at the border of Ohio and
Kentucky.66 Portsmouth sits at the confluence of the
Ohio and Scioto Rivers and experienced rapid growth
during the 19th century. The city fell upon hard times
due to the Great Depression and a catastrophic flood
in 1937.67 Throughout the 20th and into the 21st
century, Portsmouth’s residents have continued the city’s legacy as an economic driver in this largely rural
region of Ohio. The city is now home to Shawnee State University, which has 4,400 full- and part-time
students.68 In addition, the city is known for the vibrant floodwall murals depicting the history of the city,
the state, and our nation.69
Situated along Portsmouth’s downtown riverfront is Horizon House, a five-story building that offers 50
units of high-quality, affordable senior housing in a prime downtown, walkable location (Figure 16 and
Figure 17). Built in 1906 as the Joseph G. Reed Co. building, it originally housed a wholesale and dry good
business that contributed to trade along the rivers. In 1981, Horizon House was adaptively reused as low-
income residential housing. Six years later, the building was listed in the National Register of Historic
Places as a part of the historic Bonneyfiddle Commercial Historic District.70
Over the next nearly three decades, Horizon House functioned as senior housing, but a lack of care,
disinvestment, and deferred maintenance left the building in a deteriorated state in need of significant
upgrading. During the recent economic downturn, the Ohio Capital Corporation for Housing (OCCH)
acquired the property as part of a portfolio of over 250 buildings. Although most of those properties were
located in Columbus, Horizon House was included due to its status as an absentee landlord building falling
into slum conditions. Upon acquiring the property, OCCH quickly realized that Horizon House was in need
of renovation and began seeking potential financing.
66 U.S. Census Bureau. (2015, May 29). State & County QuickFacts: Portsmouth (city), Ohio. Retrieved August 14, 2015, from http://quickfacts.census.gov/qfd/states/39/3964304.html 67 Ohio History Connection. (n.d.). Portsmouth, Ohio. Retrieved August 14, 2015, from http://www.ohiohistorycentral.org/w/Portsmouth,_Ohio?rec=793 68 Shawnee State University. (n.d.). Shawnee State at a Glance. Retrieved August 15, 2015, from http://www.shawnee.edu/information/index.aspx 69 Portsmouth Ohio Murals. (n.d.). The Murals. Retrieved August 14, 2015, from http://www.portsmouthohiomurals.com/murals.php 70 United States Department of the Interior. (1987). National Register of Historic Places - Nomination Form. Retrieved August 14, 2015, from pdfhost.focus.nps.gov/docs/NRHP/Text/64000611.pdf
Developer Horizon House Apartments, LLC
Funding Round 3 (December 10, 2009)
OHPTC Amount $1,543,630
Total Cost $8,128,986
Building Use Affordable senior housing (50
units)
Estimated Job 3 permanent jobs
Creation 63 construction jobs
Status Complete
Certified on December 19, 2011
Ohio Historic Preservation Tax Credit Economic Impact Study
Center for Economic Development, Cleveland State University Page 58
Like many OHPTC-funded projects, the financing for Horizon House involved a complex and layered
package. Additionally, this restoration project occurred in the middle of one of the nation’s worst financial
crises in recent history, within an associated credit market that was extremely tight. As such, securing
traditional, private financing for Horizon House was incredibly difficult, and the private equity generated
via the OHPTC and other tax credits proved essential in making the restoration a success. In total, about
90% of the project’s financing came from tax credits.71 The project received about $1.1 million in federal
historic preservation tax credits, over $1.5 million in OHPTC, and $4.4 million in low income housing tax
credits. OCCH also obtained a loan from the Ohio Housing Finance Agency to cover the remaining costs.
Hal Keller (President, Ohio Capital Corporation for Housing) noted that, “in order to do this building right,
which it took about $185,000 per unit to do, we needed every little piece of financing to make it work.”
Overall, the restoration of Horizon House helped create an enhanced environment for the seniors that
live within the building. According to Beth Long (Development Analyst, Ohio Capital Corporation for
Housing), the renovations to this building improved the quality of life for the residents and increased the
building’s functionality, stating that “it’s more welcoming. We completely revamped the entry and lobby
area so there is some gathering space on the first floor that had not been there before; that the residents
wanted.” Moreover, OCCH made a concerted effort to gather resident input when rehabilitating the
building, having the on-site manager and service coordinator survey the tenants. As Long described, “we
took resident input into the design elements where we could, especially in the exterior with the gazebo
area and also in the sitting room.” To make the building increasingly functional for its target population –
seniors – the completed project included adding a second elevator that can accommodate a gurney. As
Andrew Bailey (Former Director of Planning, Preservation and Development, Ohio Housing Finance
Agency) succinctly stated, “adding a second elevator is a huge benefit for the residents.”
The restoration of Horizon House as quality, affordable senior housing perfectly aligns with Portsmouth’s
community development objectives of creating a walkable, vibrant downtown, improving streetscapes,
and conserving and expanding the affordable housing stock.72 Affirming this contribution is that Horizon
House’s address is considered “very walkable” by the website Walk Score.73 OCCH also ensured that all
pre-existing tenants were not displaced, ensuring that they all had the opportunity to return to the
building upon its completion and relocating them to a nearby hotel during the construction period. Since
the project’s completion, Horizon House residents are able to enjoy the amenities of a walkable,
downtown location, while having an affordable place to live. Long summarized that Horizon House “has
really nice views of the Ohio River Valley because it’s right on the flood wall with the murals [of the Ohio
River] kind of along downtown Portsmouth and there are just some nice views.”
Not all buildings in Portsmouth, however, can benefit from the OHPTC or Federal Historic Preservation
Tax Credits, because too many alterations over time disqualify the structures from the National Register
71 Ohio Capital Corporation for Housing. (2009, March 19). Horizon House Deferred Fee and General Partner Capital Contribution. Columbus, Ohio. 72 City of Portsmouth Ohio. (n.d.). Community Development. Retrieved August 14, 2015, from https://portsmouthoh.org/departments/community-development; Main Street Portsmouth. (2015). Welcome to Downtown Portsmouth. Retrieved August 14, 2015, from http://www.mspohio.org/ 73 Walk Score. (2015). 700 2nd Street Portsmouth, Ohio, 45662. Retrieved August 14, 2015, from https://www.walkscore.com/score/700-2nd-st-portsmouth-oh-45662
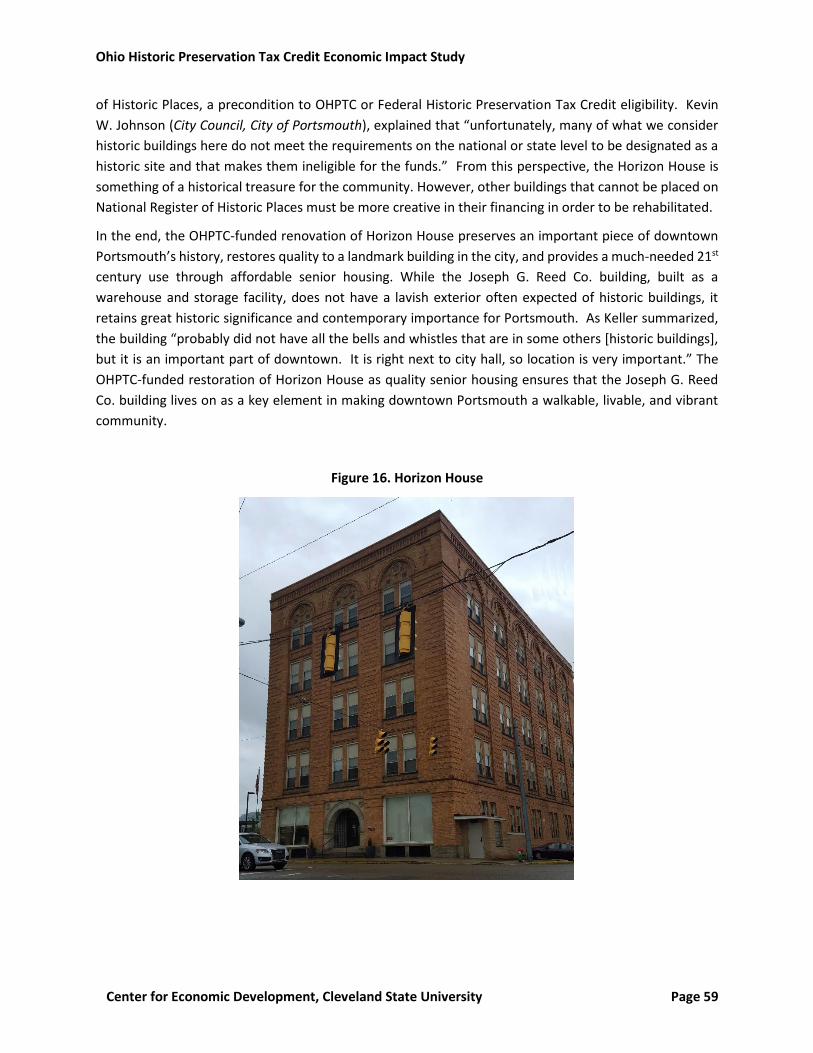
Ohio Historic Preservation Tax Credit Economic Impact Study
Center for Economic Development, Cleveland State University Page 59
of Historic Places, a precondition to OHPTC or Federal Historic Preservation Tax Credit eligibility. Kevin
W. Johnson (City Council, City of Portsmouth), explained that “unfortunately, many of what we consider
historic buildings here do not meet the requirements on the national or state level to be designated as a
historic site and that makes them ineligible for the funds.” From this perspective, the Horizon House is
something of a historical treasure for the community. However, other buildings that cannot be placed on
National Register of Historic Places must be more creative in their financing in order to be rehabilitated.
In the end, the OHPTC-funded renovation of Horizon House preserves an important piece of downtown
Portsmouth’s history, restores quality to a landmark building in the city, and provides a much-needed 21st
century use through affordable senior housing. While the Joseph G. Reed Co. building, built as a
warehouse and storage facility, does not have a lavish exterior often expected of historic buildings, it
retains great historic significance and contemporary importance for Portsmouth. As Keller summarized,
the building “probably did not have all the bells and whistles that are in some others [historic buildings],
but it is an important part of downtown. It is right next to city hall, so location is very important.” The
OHPTC-funded restoration of Horizon House as quality senior housing ensures that the Joseph G. Reed
Co. building lives on as a key element in making downtown Portsmouth a walkable, livable, and vibrant
community.
Figure 16. Horizon House

Ohio Historic Preservation Tax Credit Economic Impact Study
Center for Economic Development, Cleveland State University Page 60
Figure 17. Entrance to Horizon House
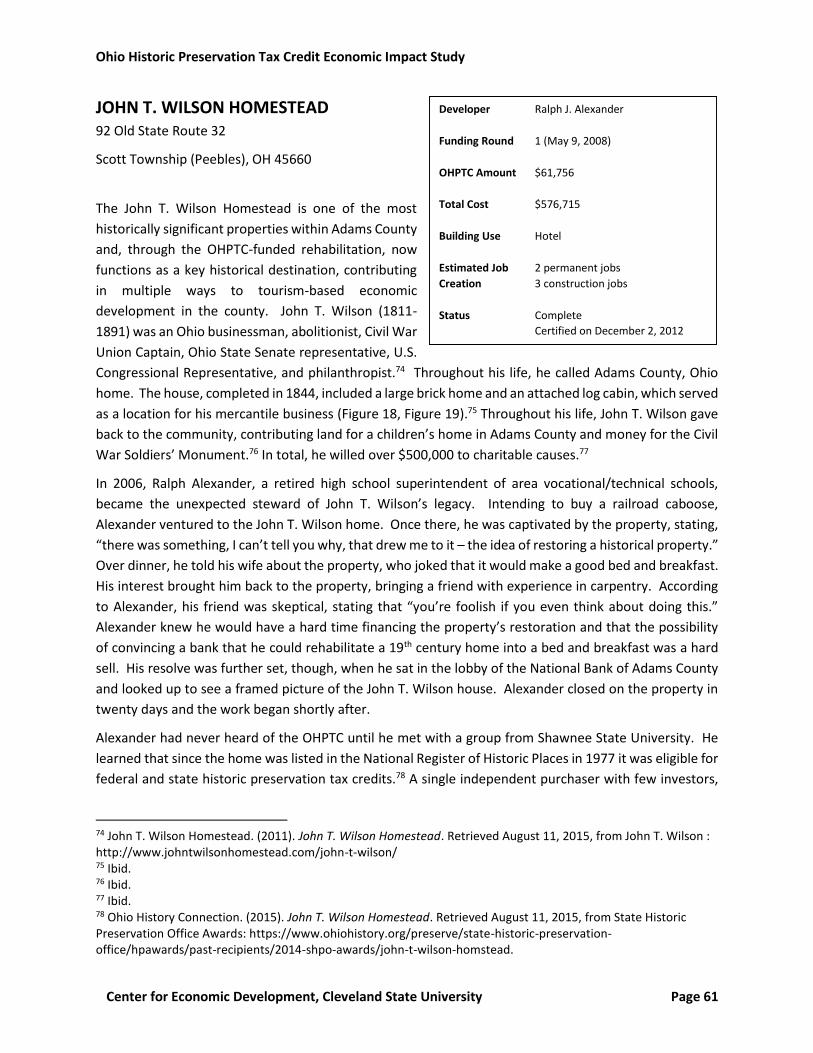
Ohio Historic Preservation Tax Credit Economic Impact Study
Center for Economic Development, Cleveland State University Page 61
JOHN T. WILSON HOMESTEAD 92 Old State Route 32
Scott Township (Peebles), OH 45660
The John T. Wilson Homestead is one of the most
historically significant properties within Adams County
and, through the OHPTC-funded rehabilitation, now
functions as a key historical destination, contributing
in multiple ways to tourism-based economic
development in the county. John T. Wilson (1811-
1891) was an Ohio businessman, abolitionist, Civil War
Union Captain, Ohio State Senate representative, U.S.
Congressional Representative, and philanthropist.74 Throughout his life, he called Adams County, Ohio
home. The house, completed in 1844, included a large brick home and an attached log cabin, which served
as a location for his mercantile business (Figure 18, Figure 19).75 Throughout his life, John T. Wilson gave
back to the community, contributing land for a children’s home in Adams County and money for the Civil
War Soldiers’ Monument.76 In total, he willed over $500,000 to charitable causes.77
In 2006, Ralph Alexander, a retired high school superintendent of area vocational/technical schools,
became the unexpected steward of John T. Wilson’s legacy. Intending to buy a railroad caboose,
Alexander ventured to the John T. Wilson home. Once there, he was captivated by the property, stating,
“there was something, I can’t tell you why, that drew me to it – the idea of restoring a historical property.”
Over dinner, he told his wife about the property, who joked that it would make a good bed and breakfast.
His interest brought him back to the property, bringing a friend with experience in carpentry. According
to Alexander, his friend was skeptical, stating that “you’re foolish if you even think about doing this.”
Alexander knew he would have a hard time financing the property’s restoration and that the possibility
of convincing a bank that he could rehabilitate a 19th century home into a bed and breakfast was a hard
sell. His resolve was further set, though, when he sat in the lobby of the National Bank of Adams County
and looked up to see a framed picture of the John T. Wilson house. Alexander closed on the property in
twenty days and the work began shortly after.
Alexander had never heard of the OHPTC until he met with a group from Shawnee State University. He
learned that since the home was listed in the National Register of Historic Places in 1977 it was eligible for
federal and state historic preservation tax credits.78 A single independent purchaser with few investors,
74 John T. Wilson Homestead. (2011). John T. Wilson Homestead. Retrieved August 11, 2015, from John T. Wilson : http://www.johntwilsonhomestead.com/john-t-wilson/ 75 Ibid. 76 Ibid. 77 Ibid. 78 Ohio History Connection. (2015). John T. Wilson Homestead. Retrieved August 11, 2015, from State Historic Preservation Office Awards: https://www.ohiohistory.org/preserve/state-historic-preservation-office/hpawards/past-recipients/2014-shpo-awards/john-t-wilson-homstead.
Developer Ralph J. Alexander
Funding Round 1 (May 9, 2008)
OHPTC Amount $61,756
Total Cost $576,715
Building Use Hotel
Estimated Job 2 permanent jobs
Creation 3 construction jobs
Status Complete
Certified on December 2, 2012

Ohio Historic Preservation Tax Credit Economic Impact Study
Center for Economic Development, Cleveland State University Page 62
he submitted his application alongside many large developers asking for millions of dollars in tax credits.
According to Alexander, he was one of only four small projects to apply during the OHPTC’s first round
and, initially, the state did not fund his project. However, after submitting additional drawings, the state
awarded him an OHPTC for $61,756 in 2008, putting Alexander on a five-year timeline to complete the
restoration. He completed the work in 2012 and the Ohio Historic Preservation Office certified the
project. Alexander acknowledges that without the OHPTC, “there is no way we could have completed this
project to the degree that we did, and to the quality that we did. We couldn’t have put that extra money
in this to make this what it is today if we hadn’t had these tax credits.”
Approximately three weeks after Alexander purchased the property, an investor toured the site and
suggested demolishing the house. His idea was to split the 42-acre parcel into 5-acre lots for residential
development. Instead, Ralph and his wife, Patricia, Alexander now operate the John T. Wilson Homestead
primarily as a bed and breakfast, contributing to Adams County’s heritage tourism sector. Many
individuals who choose to stay at the property do so because of its historic significance. They specifically
travel because they value the home and property’s historic value, the connection to the Underground
Railroad, its proximity to Serpent Mound (approximately 10 miles away) or because they are preservation
enthusiasts. Tom Cross (Executive Director, Adams County Travel & Visitors Bureau) noted that “history
is one of the largest contributors to what people are interested in,” and that it draws them to Adams
County for tourism and recreation. However, the John T. Wilson home is much more than a bed and
breakfast. It also serves as an historical site open for tours, a meeting facility, a school house, and a
location for the annual Adams County Heritage Days festival. The large room that serves breakfast to B&B
guests also hosts meetings for community groups and others in the evening.
Alexander points out that the house and the Heritage Days festival have taken on lives of their own, noting
that “if this place had fallen down, which was close to happening, none of that would have happened.”
The Adams County Heritage Days has grown from a small gathering into a two-day festival that attracts
about 1,500 people, with the Adams County Travel & Visitors Bureau labelling it one of “6 Don’t Miss
Events.”79 Heritage Days contributes to the local economy and, according to Paul Worley (Adams County
Commissioner), “it has an impact because we have a lot of local vendors that sell their wares, whether it
is homemade honey or crafts.” On a larger scale, tourism is now Adams County’s second largest industry,
behind manufacturing. The tourism sector has grown by about 10% annually over the past few years.
Through the OHPTC, Alexander turned the John T. Wilson home into a public space to share with the
community and to continue the legacy and history of John T. Wilson. Worley emphasized that the OHPTC
was vital and without it, “Ralph would have probably turned it [John T. Wilson Homestead] into a private
home.” If anything, local stakeholders believe that more investment in historic preservation and
economic development is needed in Adams County, as not all buildings have the same positive outcome
as the John T. Wilson Home. For instance, one of Adams County’s notable landmarks, the Counterfeit
House, was recently sold and demolished due to disrepair and disinvestment.80 Reflecting on this
79 Adams County Travel & Visitors Bureau. (2015). 2015 Visitors & Community Guide. Retrieved August 11, 2015, from http://adamscountytravel.org/images/AdamsCountyTravelGuide2015-lowres.pdf 80 (2010, April 12). Counterfeit House Set for Auction May 8. The Highland County Press. Retrieved on August 11, 2015 from http://www.highlandcountypress.com/main.asp?SectionID=2&SubSectionID=74&ArticleID=2828

Ohio Historic Preservation Tax Credit Economic Impact Study
Center for Economic Development, Cleveland State University Page 63
alternate fate, Cross lamented, “it’s a shame that the thing [Counterfeit House] fell down but there was
no one to save it.” He further articulated that “you can see signs of decay in other historic places, but we
were not fortunate enough to have someone like Ralph step in and restore them.”
In the scope of all historic preservation projects in Ohio, the John T. Wilson home is not the largest nor
the most prominent, but it is no less significant. In total it cost Alexander about $575,000 to rehabilitate
the home, with around $61,000 coming from the OHPTC. In the end, the estimated cost of the project
was significantly more than initially expected, even with Alexander completing much of the work himself,
free of charge, as his experience with vocational/technical education gave him an advantage of knowing
how to deal with construction and renovation issues. In total, he logged over 7,000 hours of manual labor
on the house, reflecting that this project, for him, was truly a labor of love. Alexander summarizes his
passion for the project and its intangible benefits as such: “it’s a place Adams County can be proud of. It’s
a part of history.”
The legacy of John T. Wilson as a community leader lives on in the capable hands of his contemporary
steward, Ralph Alexander. Through the OHPTC, Alexander restored the home to productive use and
shared it with all individuals – locals and visitors, alike. Adams County now has another jewel to serve as
a tourist attraction and community space. In the end, Ralph Alexander, with the help of the OHPTC, not
only preserved an historic property, but also saved a key piece of Adams County’s rich and valuable
history.

Ohio Historic Preservation Tax Credit Economic Impact Study
Center for Economic Development, Cleveland State University Page 64
Figure 18. John T. Wilson Homestead
Figure 19. John T. Wilson Homestead, including some of the grounds

Ohio Historic Preservation Tax Credit Economic Impact Study
Center for Economic Development, Cleveland State University Page 65
GOODYEAR HALL
1201 E. Market Street
Akron, OH 44305
The importance of the Goodyear Tire & Rubber
Company to Akron’s economic, social and historic
fabric cannot be overstated, and ties between the
company and the City of Akron run deep. As Peter
Goffstein (Senior Vice President, IRG), the developer
of Goodyear Hall, notes: “Goodyear is Akron’s
history. There is no other Fortune 500 company
that is more Akron than Goodyear.” Goodyear, the
third-largest tire manufacturer in the world, was
founded in Akron in 1890. The company has a deep
commitment to the city, staying in Akron while all of their competitors moved or closed operations in the
1980s.81 The adaptive reuse of Goodyear Hall (Figure 20), a 292,000 square foot building, has been central
to the multi-year economic revitalization of Akron’s East End. The project also carries symbolic
importance for the City of Akron with portions of the building becoming public spaces for the greater
Akron community. The Goodyear Hall project reflects a shift in Ohio’s urban economies from an era of
heavy manufacturing and industrial production to mixed-use neighborhoods that blend corporate
headquarters, business services, high-quality residences, retail, and recreation.
Located within the nearly 400-acre Goodyear campus, Goodyear Hall was built from 1917-1920 and
served as an educational, entertainment, and recreation space for Goodyear employees. Over time, the
building also housed the company’s gift shop and popular “World of Rubber” exhibition.82 Designed by
renowned Cleveland architectural firm Walker and Weeks, Goodyear Hall is a six-story brick and terra
cotta building in the Gothic Revival style that includes an historic ballroom, a 1,000+ seat theater and a
gymnasium, in addition to classrooms. The building is attached to the Ohio Savings and Trust Bank
designed in the Classic Revival style, making the two buildings appear architecturally distinct from the
exterior (Figure 21).83 Goodyear Hall and the bank building, however, are seamlessly connected on the
interior and provided Goodyear employees with a range of financial, educational, entertainment, and
recreational benefits.
Goodyear Hall is historically significant as part of the larger Goodyear campus. Additionally, according to
interviews with the project developer and local leaders, as many as five NBA teams can trace their history
to the Goodyear Hall’s gymnasium, where Goodyear’s corporate basketball team – the Goodyear
81 Keith Schneider, (2013). “Akron Shakes off Some Rust with Goodyear Tire’s Help,” New York Times, June 25. 82 Jim Mackinnon, (2014). “Historic Goodyear Hall transformed as East End project continues; nearby Hilton hotel opens this week,” Akron Beacon Journal, November 15. 83 Peter M. Goffstein, (March 19, 2013). Letter to Ohio Development Services Agency, OHPTC Application.
Developer IRG Rubber City Market Hall, LLC
Funding Round 10 (June 26, 2013)
OHPTC Amount $5,000,000
Total Cost $36,009,150
Building Use Market-rate housing (109 units)
Retail (84,680 sq. ft.)
Commercial/office (20,440 sq. ft.)
Restaurant (8,760 sq. ft.)
Estimated Job 250 permanent jobs
Creation 400 construction jobs
Status Under construction
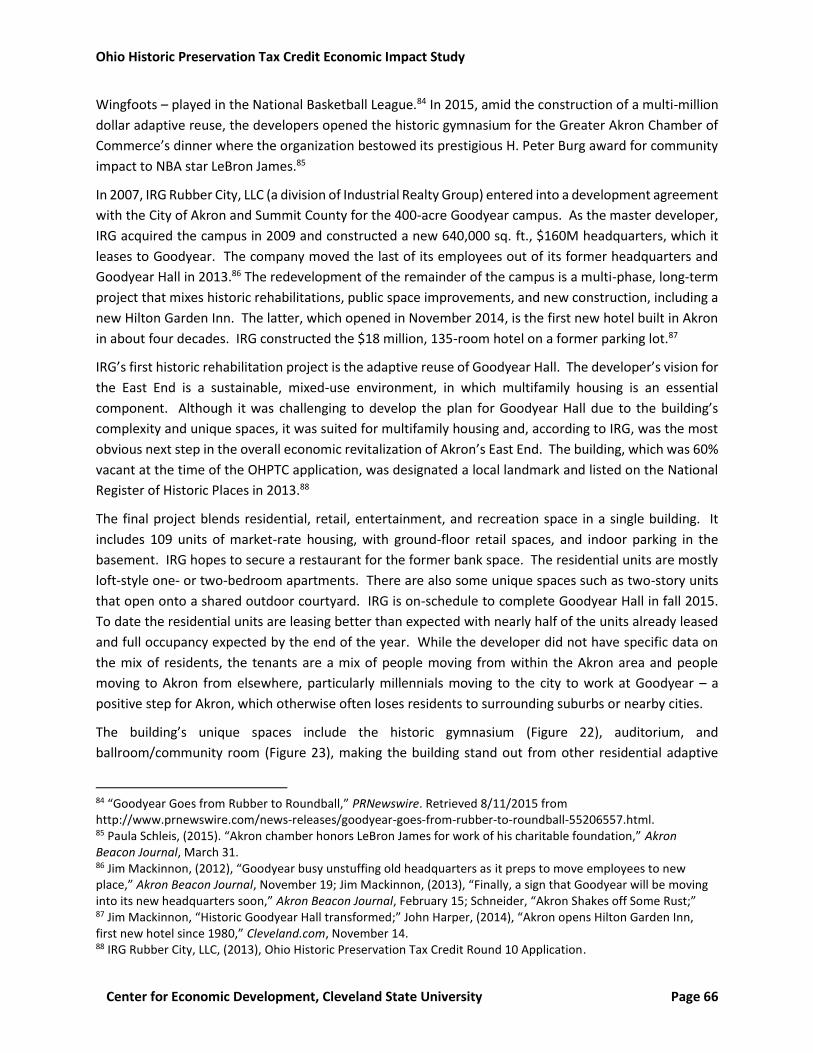
Ohio Historic Preservation Tax Credit Economic Impact Study
Center for Economic Development, Cleveland State University Page 66
Wingfoots – played in the National Basketball League.84 In 2015, amid the construction of a multi-million
dollar adaptive reuse, the developers opened the historic gymnasium for the Greater Akron Chamber of
Commerce’s dinner where the organization bestowed its prestigious H. Peter Burg award for community
impact to NBA star LeBron James.85
In 2007, IRG Rubber City, LLC (a division of Industrial Realty Group) entered into a development agreement
with the City of Akron and Summit County for the 400-acre Goodyear campus. As the master developer,
IRG acquired the campus in 2009 and constructed a new 640,000 sq. ft., $160M headquarters, which it
leases to Goodyear. The company moved the last of its employees out of its former headquarters and
Goodyear Hall in 2013.86 The redevelopment of the remainder of the campus is a multi-phase, long-term
project that mixes historic rehabilitations, public space improvements, and new construction, including a
new Hilton Garden Inn. The latter, which opened in November 2014, is the first new hotel built in Akron
in about four decades. IRG constructed the $18 million, 135-room hotel on a former parking lot.87
IRG’s first historic rehabilitation project is the adaptive reuse of Goodyear Hall. The developer’s vision for
the East End is a sustainable, mixed-use environment, in which multifamily housing is an essential
component. Although it was challenging to develop the plan for Goodyear Hall due to the building’s
complexity and unique spaces, it was suited for multifamily housing and, according to IRG, was the most
obvious next step in the overall economic revitalization of Akron’s East End. The building, which was 60%
vacant at the time of the OHPTC application, was designated a local landmark and listed on the National
Register of Historic Places in 2013.88
The final project blends residential, retail, entertainment, and recreation space in a single building. It
includes 109 units of market-rate housing, with ground-floor retail spaces, and indoor parking in the
basement. IRG hopes to secure a restaurant for the former bank space. The residential units are mostly
loft-style one- or two-bedroom apartments. There are also some unique spaces such as two-story units
that open onto a shared outdoor courtyard. IRG is on-schedule to complete Goodyear Hall in fall 2015.
To date the residential units are leasing better than expected with nearly half of the units already leased
and full occupancy expected by the end of the year. While the developer did not have specific data on
the mix of residents, the tenants are a mix of people moving from within the Akron area and people
moving to Akron from elsewhere, particularly millennials moving to the city to work at Goodyear – a
positive step for Akron, which otherwise often loses residents to surrounding suburbs or nearby cities.
The building’s unique spaces include the historic gymnasium (Figure 22), auditorium, and
ballroom/community room (Figure 23), making the building stand out from other residential adaptive
84 “Goodyear Goes from Rubber to Roundball,” PRNewswire. Retrieved 8/11/2015 from http://www.prnewswire.com/news-releases/goodyear-goes-from-rubber-to-roundball-55206557.html. 85 Paula Schleis, (2015). “Akron chamber honors LeBron James for work of his charitable foundation,” Akron Beacon Journal, March 31. 86 Jim Mackinnon, (2012), “Goodyear busy unstuffing old headquarters as it preps to move employees to new place,” Akron Beacon Journal, November 19; Jim Mackinnon, (2013), “Finally, a sign that Goodyear will be moving into its new headquarters soon,” Akron Beacon Journal, February 15; Schneider, “Akron Shakes off Some Rust;” 87 Jim Mackinnon, “Historic Goodyear Hall transformed;” John Harper, (2014), “Akron opens Hilton Garden Inn, first new hotel since 1980,” Cleveland.com, November 14. 88 IRG Rubber City, LLC, (2013), Ohio Historic Preservation Tax Credit Round 10 Application.

Ohio Historic Preservation Tax Credit Economic Impact Study
Center for Economic Development, Cleveland State University Page 67
reuse projects. While these spaces presented a challenge for the developer – there were few economic
models or precedents to base projections for eventual operations and revenue, IRG recognizes that these
spaces have unique value, could never be built into a newly constructed building today, and are beneficial
to retain as public spaces for the Akron community. Furthermore, they provided IRG with an opportunity
to retain a connection between the Goodyear campus and the Akron community by ensuring that at least
some of Goodyear Hall would be publically accessible. In a recent interview, the developer indicated that
they had recently secured an operator for the gym, and while details are not yet public, they expect to
begin hosting youth programming as early as September 2015. IRG is also in the early stages of discussions
with an operator for the theater space, the hardest component of the project.
The OHPTC was a key component to the successful, high-quality adaptive reuse of Goodyear Hall. From
the developer’s perspective, the OHPTC is an essential component of financing the rehabilitation of older
buildings, particularly ones such as Goodyear Hall which have unique components that do not have good
business models (e.g. the gymnasium and theater). According to Peter Goffstein, IRG “wants to make a
difference in communities where we work and, without programs like the OHPTC, we cannot do what we
do.” The preservation consultant for the project noted that without the OHPTC, the renovation of
Goodyear Hall would have been “value-engineered,” with a lower-quality product. Key amenities, such
as the retention and lighting of the rooftop Goodyear sign (Figure 24) or renovation of the gymnasium,
would not have occurred.
Stakeholders from the City of Akron and the Summit County Development Finance Authority remarked
that the OHPTC was allowing IRG to take an important landmark within Akron – the Goodyear campus –
and to make it useful in a new way for the 21st century. Adele Dorfner Roth (Deputy Planning Director for
Economic Development, City of Akron) links the OHPTC and Goodyear Hall project to the city’s overall
revitalization goals, stating that “it is hugely important for urban areas. We are trying to attract young
professionals and millennials who are looking for cool, interesting places to live. They don’t necessarily
go where there’s a job – they want to live in a ‘place’,” with historic buildings, in this case Goodyear Hall,
offering that unique, marketable environment. Furthermore, the OHPTC helped to attract additional
private capital and financing for the Goodyear Hall project, which is positive for the City of Akron as a
whole. In their application for the OHPTC, IRG estimated a leveraged investment ratio of 7.2. The OHPTC
was essential in securing additional public financing, especially from the Development Finance Authority
of Summit County, which provided about $6.5 million in bond funding for Goodyear Hall.89 In 2014, the
City of Akron approved tax increment financing (TIF) for the East End to funnel funds back into the overall
project.90 The developer also received federal historic preservation tax credits for Goodyear Hall (totaling
$4.5 million).
The adaptive reuse of Goodyear Hall is an essential element in the overall economic revitalization of
Akron’s East End neighborhood, with benefits extending to the City of Akron, as a whole. To fully
understand the catalytic impact of Goodyear Hall, city leaders noted that the reuse of Goodyear Hall was
inseparable from the larger effort to keep Goodyear in Akron. While Goodyear needed a new, modern
89 Development Finance Authority of Summit County, (2014), 2014 Annual Report. 90 Stephanie Warsmith, (2014), “Akron council approves tax break for Goodyear redevelopment project; money will be put back into the project,” Akron Beacon Journal, November 3.

Ohio Historic Preservation Tax Credit Economic Impact Study
Center for Economic Development, Cleveland State University Page 68
headquarters, keeping the company in Akron also required improving the neighborhood and transforming
the campus into a vibrant, mixed-use destination. Goodyear Hall is an integral component of the East
End. Its retail spaces will benefit hotel patrons and nearby office employees who work at the new
Goodyear headquarters and at future offices scheduled for renovation in the former headquarters. The
housing units are attractive for Goodyear employees and serve as a marketing tool for securing tenants
for renovated spaces in the former headquarters. IRG is currently moving forward on rehabilitation plans
for the 1.5 million sq. ft. headquarters building, which is directly across the street from Goodyear Hall.
IRG strongly believes that their success with Goodyear Hall is crucial to the viability of the headquarters
building, which is a much larger and more difficult project. The developer is willing to invest millions in
the headquarters building before having a full slate of tenants lined up and is doing so largely because of
their success with Goodyear Hall, along with the hotel project and the new Goodyear headquarters. IRG
is using Goodyear Hall to market spaces in the headquarters building, noting that prospective tenants all
want a tour of Goodyear Hall and are enticed by the idea of having nearby retail and residential amenities.
Broadly speaking, Goodyear Hall provides a number of positive catalytic benefits to the City of Akron.
Aside from returning a historically significant property to productive use and re-establishing a strong tax
base in the East End neighborhood, it was important to reopen the building to the community given
Goodyear’s integral role in Akron’s civic identity. Christopher Burnham (President, Development Finance
Authority of Summit County) captured this sentiment stating that it was unclear if Akron could have
recovered if Goodyear had left and that “there is psychological value and impact from economic
development investment that we sometimes don’t think about.” Additionally, the residential component
of the project provides Akron with much-needed “middle-market” housing that offers live/work
neighborhood opportunities, rather than high-end condominiums or student housing which dominate the
Akron rental market. The project also helps rebuild connections between the city’s East End and
downtown and offers the city a unique, marketable asset, as Adele Dorfner Roth articulated:
“If a building is torn down, you can’t market that. With Goodyear Hall, we can show this
really cool old building and say that it is a great place to have events, that LeBron James
had this big dinner there, that the NBA started there. If you have to look at a parking lot
and say what happened there, it is not the same thing. To have plaques in front of parking
lots is just not the same.”
The adaptive reuse of Goodyear Hall has potentially more widespread, long-term benefits for the State of
Ohio. IRG is one of the state’s largest landowners, particularly of older, industrial properties. Goodyear
Hall is IRG’s first OHPTC and residential project in Ohio (the company has used federal preservation tax
credits on two projects in California and has worked in Ohio on industrial projects for decades) and the
ease of using the credits, the benefits of the OHPTC to financing the project, and the project’s overall
success have already spurred IRG to embark on additional preservation and adaptive reuse projects,
including projects in Canton and Norwood.
Overall, the adaptive reuse of Goodyear Hall has tangible and intangible benefits to the City of Akron, its
East End neighborhood, and the State of Ohio, as a whole. The OHPTC was essential to the project’s high-
quality success, was easy to use, and was very streamlined with IRG’s use of the federal preservation tax

Ohio Historic Preservation Tax Credit Economic Impact Study
Center for Economic Development, Cleveland State University Page 69
credit. The preservation of Goodyear Hall transforms a piece of Akron’s heritage into an asset for the 21st
century, with the added benefit, according to Adele Dorfner Roth, that “it strengthens our sense of
ourselves and our history.”
Figure 20. Goodyear Hall, with the gymnasium in the foreground
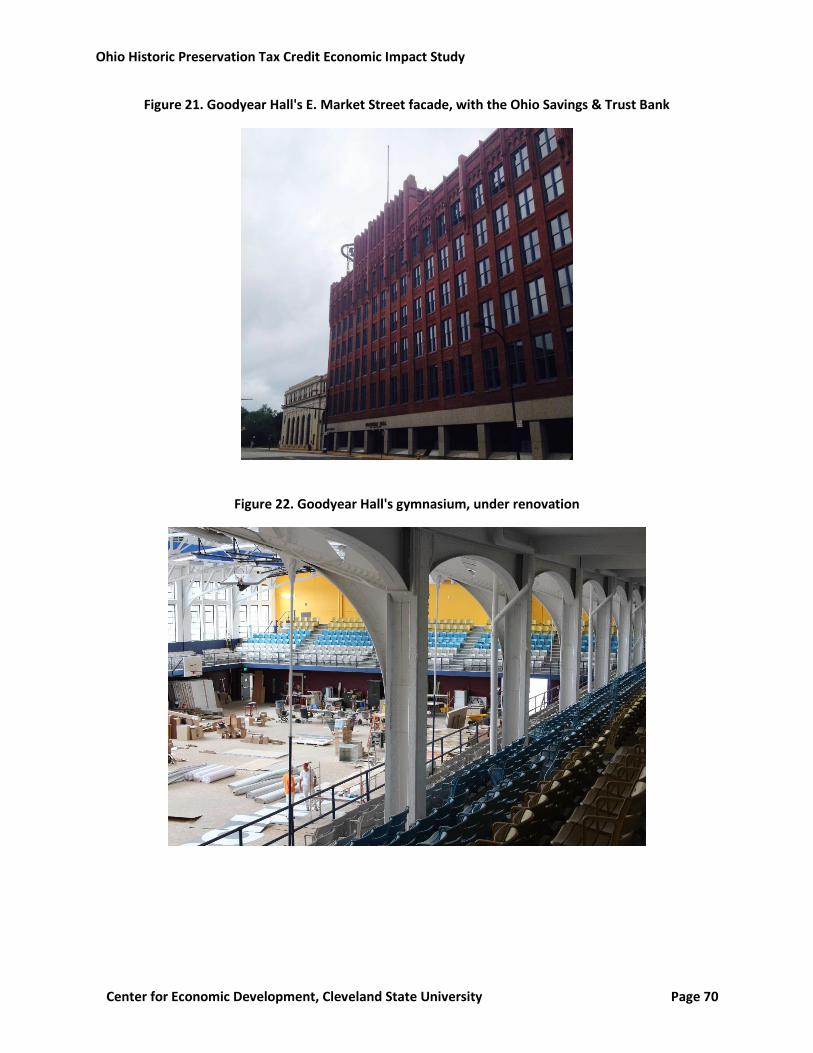
Ohio Historic Preservation Tax Credit Economic Impact Study
Center for Economic Development, Cleveland State University Page 70
Figure 21. Goodyear Hall's E. Market Street facade, with the Ohio Savings & Trust Bank
Figure 22. Goodyear Hall's gymnasium, under renovation
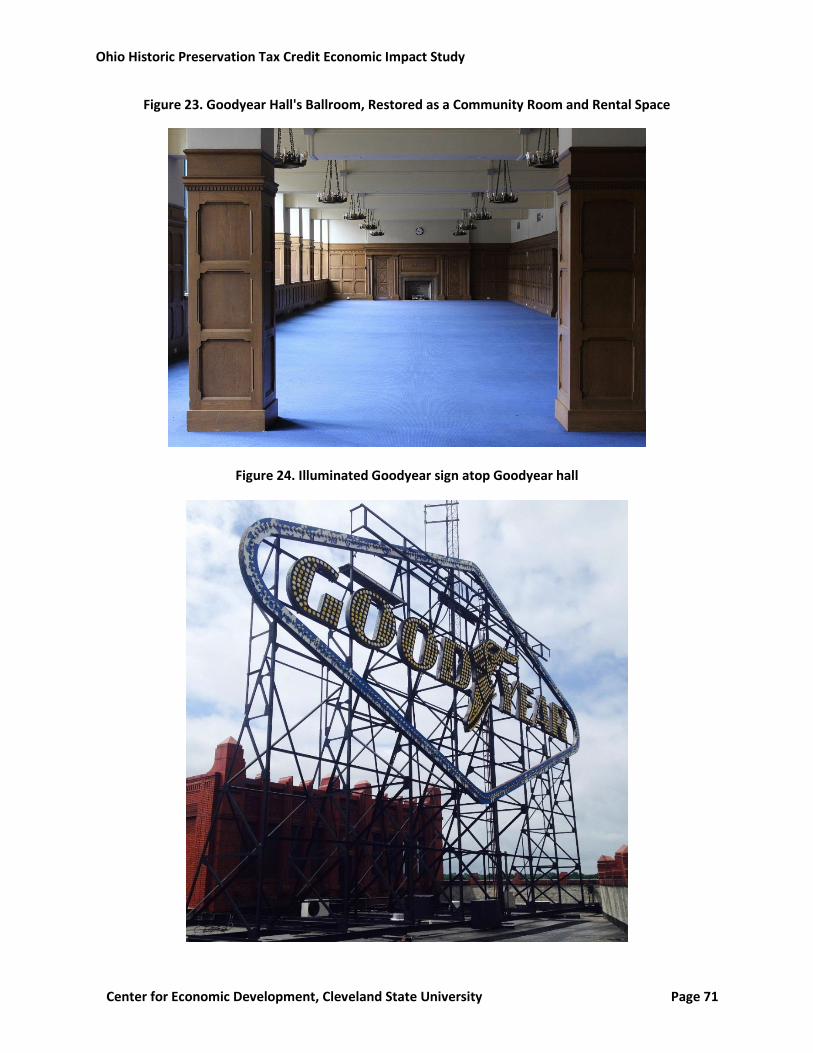
Ohio Historic Preservation Tax Credit Economic Impact Study
Center for Economic Development, Cleveland State University Page 71
Figure 23. Goodyear Hall's Ballroom, Restored as a Community Room and Rental Space
Figure 24. Illuminated Goodyear sign atop Goodyear hall

Ohio Historic Preservation Tax Credit Economic Impact Study
Center for Economic Development, Cleveland State University Page 72
KRESS BUILDING
117-121 W. Federal Street
Youngstown, OH 44503
In 2014, spectators gathered to watch the demolition
of downtown Youngstown’s historic Kress building.
Despite significant deterioration from a failing roof
and nearly twenty years of neglect and vacancy, the
steel-reinforced building held its ground. As Sharon
Letson (Executive Director, CityScape) reflected,
“when they took this building down, they couldn’t get
it down.” Ultimately, of course, the building came
down – despite multiple efforts to put together a
financing package for rehabilitation and two failed
applications for the OHPTC in 2011. Demolition is final
and irreversible, and with it comes a loss of community
character, identity, and history. The loss of the Kress building reflects the intense difficulty of restoring
historic buildings in communities such as Youngstown, where weak market conditions make financing
project extremely difficult despite positive change in the downtown core. Without key forms of public
finance, including the OHPTC, leaders in Youngstown were not able to save the Kress building.
Built in 1925, the Kress building housed its namesake five-and-dime store until the retail operation closed
in 1959.91 The building was an integral piece of W. Federal Street, Youngstown’s downtown “main street.”
The three-story building had a terracotta façade, a defining characteristic of Youngstown’s downtown
commercial buildings, and street-level retail space (Figure 25).
By the 1990s, downtown Youngstown was facing severe disinvestment and the city, in an effort to stave
off further deterioration and spur revitalization, used its CDBG funding to purchase 80 parcels that
included approximately 40 buildings in disrepair – including the Kress building. The city transferred the
properties to the newly created Youngstown Area Community Improvement Corporation (CIC), an arm of
the Youngstown/Warren Regional Chamber of Commerce. Over the past two decades, the CIC has
employed a mix of preservation, demolition, and new construction to transform downtown Youngstown.
As of this writing, the CIC has one parcel and no buildings left in its inventory.92
For the CIC, the Kress building was one of the last and most challenging buildings to tackle. The building
had been in disrepair since the 1990s, with a hole in the roof exposing the interior to the elements and
causing structural damage.93 While first-hand accounts recalled trees growing in the building and
collapsed walls, the façade of the building was salvageable and the exterior terra cotta was in sound
condition. In 2011, the CIC had located a viable tenant – Iron and String Life Enhancement (ISLE), which
planned to relocate its Purple Cat day program for mentally and developmentally disabled adults to the
91 Karen Bell, (2014), “Kress building demolition mirrored in other states,” The Vindicator, March 31. 92 Thomas Humphries, Dave Kosec and David Bozanich, (2015), personal communication, August 4. 93 David Skolnick, (2013), “The vacant downtown building needs to be demolished,” Vindy.com, September 17.
Developer Youngstown Central Area
Community Improvement
Corporation & ISLE, Inc.
Funding Rounds 6 and 7 (denied)
OHPTC Request $1,274,425 (Round 6 & 7)
Total Proposed $5,228,841 (Round 6 & 7)
Investment
Proposed Residential (5 units)
Building Use Retail (2,817 sq. ft.)
Commercial/office (29,646 sq. ft.)
Estimated Job 70 permanent jobs
Creation 40-60 construction jobs
Status Application denied
Demolished

Ohio Historic Preservation Tax Credit Economic Impact Study
Center for Economic Development, Cleveland State University Page 73
Kress building. Prior to this, the CIC had tried to make the Kress building work for a variety of potential
tenants, including the Mahoning Valley Sports Museum and Sports Center and the Mahoning Valley
Historical Society, without success.94 The ISLE deal, though, had a complex, yet viable financing package
and, with the CIC, moved forward in applying of the OHPTC. The OHPTC applications, submitted in Rounds
6 (Spring 2011) and 7 (Fall 2011), were both unsuccessful. The application included letters of financing
commitment from ISLE, Farmers National Bank, and U.S. Congressman Tim Ryan.
In 2013, after financing for the Kress building rehabilitation failed to come together, the CIC decided to
proceed with demolition.95 Demolition began in March 2014, following approval from the city’s design
review committee. The CIC sold the property to the City of Youngstown for approximately $500,000,
which covered the cost of demolition.96 The city subsequently converted the property to a parking lot
(Figure 26).
The demolition of the Kress building illustrates the fragility of complex financing packages needed to
rehabilitate historic buildings, particular in markets where traditional, private financing is difficult to
secure. Furthermore, this case sheds light on the need for various state programs to work in concert with
each other, as developers often use more than one form of public financing. In the case of the Kress
building, the CIC and ISLE sought the OHPTC and Clean Ohio brownfield abatement funds, which would
have assisted with interior demolition and clean-up, but the awards did not come through.97 Ultimately,
costs escalated as the timeline was extended, demolition and abatement costs increased (particularly
without Clean Ohio funds), and the OHPTC applications were denied. Both forms of state funding were
necessary to make the project work – without them the developer could not secure traditional, bank
financing. In interviews, the CIC stated that if the Clean Ohio grant, which would have covered the
demolition and environmental clean-up costs, were a part of the funding up front, the banks and financing
would have been in place for the OHPTC application and the private-sector tenant, ISLE, would not have
walked away from the deal.
Key stakeholders in Youngstown, including at the CIC, argue that state financing, in this case the OHPTC,
is imperative to making projects work in Youngstown, where access to private capital is limited. For
example, Dave Kosec (Development Services Manager, Youngstown Area CIC) argues that the OHPTC is
especially imperative in weaker-market locations where construction costs are similar to stronger
markets, but rental rates are significantly lower. David Bozanich (Director of Finance, City of Youngstown)
stated that even with federal and state preservation tax credits, “The City of Youngstown still has to
provide 5-10% of the total cost via utility grants just to make it possible to think about project feasibility.
Without the federal and state programs, these projects do not happen.” Underpinning the fragility of
project finance and the importance of state support is the difficulty of securing bank financing and
appraisals that make projects viable, as local real estate developer, Dominic Marchionda (NYO Property
Group, Erie & Wick buildings) summarized, “apartments are full and demand is significant. But, the
94 David Skolnick, (2013), “The vacant downtown building needs to be demolished,” Vindy.com, September 17. 95 David Skolnick, (2013), “The vacant downtown building needs to be demolished,” Vindy.com, September 17. 96 David Skolnick, (2013), “Demolition of Kress Building downtown to start in about 2 weeks,” Vindy.com, March 5; Karen Bell, “Kress building demolition.” 97 Katie Seminara, (2008), “State Theatre razing on track, officials say,” Vindy.com, November 28.

Ohio Historic Preservation Tax Credit Economic Impact Study
Center for Economic Development, Cleveland State University Page 74
financing stack has become more complex and difficult because many banks still don’t believe in urban
communities like downtown Youngstown.”
With the loss of the Kress building, downtown Youngstown lost a small but integral part of its main
street (Figure 27). The demolition removed part of the city’s legacy, reduced the ability to differentiate
downtown based on its cohesive and unique character, and furthered disinvestment rather than
revitalization. Interviewees characterized the loss as a “huge detriment” and a “wasted opportunity.”
The demolition was also detrimental to downtown’s pedestrian environment and has reduced the
potential for new businesses and street-level activity. Sara Wenger (Community Development Program
Manager, Eastgate MPO) characterized the loss as: “very significant for downtown because now there
really is no feel of density in the one section of town where there was density. Now, we have an
underutilized space that pays no tax revenue. It is a void at the epicenter of the city.”
Stakeholders in Youngstown believed that if the Kress building had been successfully rehabilitated, it
would have had a positive effect on the city, particularly by opening up much-needed space for downtown
commerce and street-level activity. For instance, H. William Lawson (Mahoning Valley Historical Society)
argued that “downtown Youngstown is evolving into a distinct district and building space is finite.” Rodney
Lamberson (Strollo Architects) stated that “the Kress building is needed now more than ever,” as other
vacant buildings have been rehabilitated and spaces for new commercial activity and residences are
limited. Additionally, Sara Wenger posits that “it would have been seen as an asset within a year” had it
been rehabilitated.
The CIC has a realistic perspective that not every building in downtown Youngstown could or should have
been saved, yet it made a concerted effort to find a way to keep the Kress building standing. Ultimately,
though, the financing hurdles proved insurmountable and the failure to successfully secure the OHPTC
resulted in the building’s demolition. The lack of an OHPTC to support the Kress building project not only
resulted in the building’s demolition, it also resulted in a significant loss of time and investment for
involved parties. According to the CIC, the business owner, ISLE, had invested time and money in
developing plans for the building; there were personal commitments in place, and 100 hours of work a
week was put into the deal. The Round 6 application lists two parcels for the Kress building. In 1995,
according to the Mahoning Valley auditor’s website, they were assessed at a total of $90,000. In the wake
of the recession, their combined value had dropped to $59,920 (a 33% decline). In the aftermath of
demolition, their combined value is now $39,560 (a 56% decline from 1995). Furthermore, the city now
owns the property, making it a non-contributor to the local tax base.
Despite the failure to secure the OHPTC for the Kress building, local leaders view the program as “critical
for cities, such as Youngstown, with distressed downtowns that need to be revitalized” (H. William
Lawson, Mahoning Valley Historical Society). Reflecting on the CIC’s ability to transform all of its inventory
over the past two decades, Tom Humphries (President, Youngstown Area CIC) stated that “if not for Clean
Ohio and the Ohio preservation tax credit, we wouldn’t have been able to do what we did.” Still,
challenges remain, as Dave Bozanich (Director of Finance, City of Youngstown) argues that the OHPTC does
not go far enough: “The economic disinvestment in cities like Youngstown creates additional challenges.
The city cannot step in to fill all the gaps, only some. At the end of the day, in places like Youngstown, it
takes more than the state is providing.”

Ohio Historic Preservation Tax Credit Economic Impact Study
Center for Economic Development, Cleveland State University Page 75
Figure 25. The Kress Building before demolition (courtesy of the Youngstown Area CIC)
Figure 26. W. Federal Street, with a chain link fence along the parking lot where the Kress building stood

Ohio Historic Preservation Tax Credit Economic Impact Study
Center for Economic Development, Cleveland State University Page 76
Figure 27. The sunken parking lot on the site of former Kress building, view from W. Federal Street
The six case studies demonstrate the diversity of OHPTC projects across the state and illustrate many
tangible and intangible benefits of rehabilitating historic buildings. As it evidenced from interviews and
focus groups, OHPTC-funded building rehabilitations have catalyzed downtown revitalization, improved
small town main streets, and supported the tourism and heritage industry across rural Ohio. Universally,
the case studies show the importance of the OHPTC to project success, with the demolition of
Youngstown’s Kress building offering a poignant example of the alternative. While each of the cases has
tangible economic and community benefits, they also provide insight into the intangible benefits of
preserving community heritage – transforming hulking “white elephants” into productive community
amenities – and other psychological benefits not readily captured in economic models. Across the board,
it is clear that these buildings, while useful economic engines, are also intricately intertwined with the
identity, meaning, and heritage of the state’s neighborhoods, towns, and cities.
Prior to their rehabilitation, interviewees described the five completed or in-progress projects (Cleveland
Trust Complex, Horizon House, John T. Wilson Home, Old Ohio School for the Deaf, and Goodyear Hall) as
vacant, run-down eyesores. These underutilized spaces, while historic, were described as dilapidated,
inefficient, and outdated by interview participants. Overall, adjectives describing their pre-OHPTC-funded
condition are gloomy and bleak (Figure 28). The transformation is clearly captured by interviewees’ choice
of post-rehabilitation adjectives (Figure 29). The OHPTC has resulted in places that are cool, functional
destinations. These buildings are restored jewels that have been creatively adapted and rejuvenated. They
are thriving, animated, and welcoming. They are drivers of economic growth. Above all, they are historical
and beautiful.

Ohio Historic Preservation Tax Credit Economic Impact Study
Center for Economic Development, Cleveland State University Page 77
Figures 28 and 29 display a Wordle98 of the most common phrases used by the interviewees to describe
OHPTC properties before and after renovation. Wordle is an online tool for generating “word clouds”
from text provided by users. The clouds give greater prominence to words that appear more frequently
in the source text. For example, before the historic preservation tax credits and renovation, these
buildings were described by interviewees and focus groups participants as rundown, underutilized,
depressing, vacant, tired, and dilapidated. Words used frequently appear larger than those used once.
After the restoration of these properties, the buildings were described as beautiful, historical, restored,
unique, and functional.
Figure 28. Pre-Rehabilitation Descriptions
Figure 29. Frequencies of Post-Rehabilitation Descriptions
98 A wordle is an info graphic that displays the most common words in larger font.
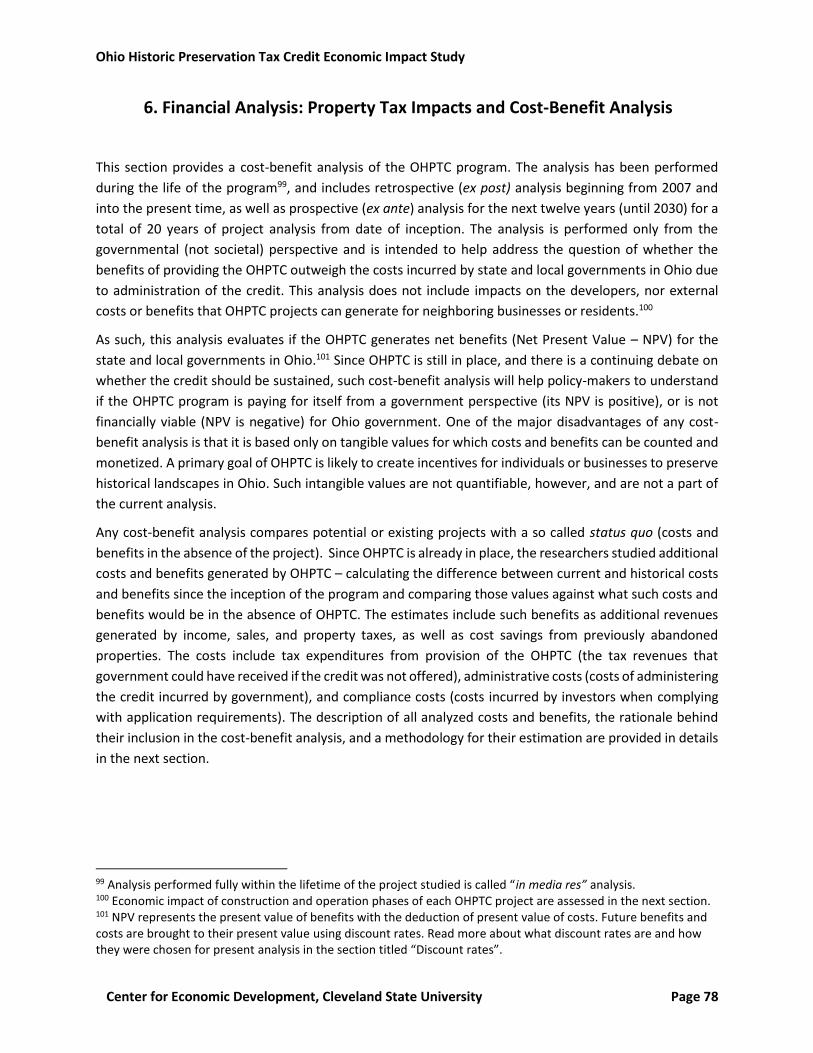
Ohio Historic Preservation Tax Credit Economic Impact Study
Center for Economic Development, Cleveland State University Page 78
6. Financial Analysis: Property Tax Impacts and Cost-Benefit Analysis
This section provides a cost-benefit analysis of the OHPTC program. The analysis has been performed
during the life of the program99, and includes retrospective (ex post) analysis beginning from 2007 and
into the present time, as well as prospective (ex ante) analysis for the next twelve years (until 2030) for a
total of 20 years of project analysis from date of inception. The analysis is performed only from the
governmental (not societal) perspective and is intended to help address the question of whether the
benefits of providing the OHPTC outweigh the costs incurred by state and local governments in Ohio due
to administration of the credit. This analysis does not include impacts on the developers, nor external
costs or benefits that OHPTC projects can generate for neighboring businesses or residents.100
As such, this analysis evaluates if the OHPTC generates net benefits (Net Present Value – NPV) for the
state and local governments in Ohio.101 Since OHPTC is still in place, and there is a continuing debate on
whether the credit should be sustained, such cost-benefit analysis will help policy-makers to understand
if the OHPTC program is paying for itself from a government perspective (its NPV is positive), or is not
financially viable (NPV is negative) for Ohio government. One of the major disadvantages of any cost-
benefit analysis is that it is based only on tangible values for which costs and benefits can be counted and
monetized. A primary goal of OHPTC is likely to create incentives for individuals or businesses to preserve
historical landscapes in Ohio. Such intangible values are not quantifiable, however, and are not a part of
the current analysis.
Any cost-benefit analysis compares potential or existing projects with a so called status quo (costs and
benefits in the absence of the project). Since OHPTC is already in place, the researchers studied additional
costs and benefits generated by OHPTC – calculating the difference between current and historical costs
and benefits since the inception of the program and comparing those values against what such costs and
benefits would be in the absence of OHPTC. The estimates include such benefits as additional revenues
generated by income, sales, and property taxes, as well as cost savings from previously abandoned
properties. The costs include tax expenditures from provision of the OHPTC (the tax revenues that
government could have received if the credit was not offered), administrative costs (costs of administering
the credit incurred by government), and compliance costs (costs incurred by investors when complying
with application requirements). The description of all analyzed costs and benefits, the rationale behind
their inclusion in the cost-benefit analysis, and a methodology for their estimation are provided in details
in the next section.
99 Analysis performed fully within the lifetime of the project studied is called “in media res” analysis. 100 Economic impact of construction and operation phases of each OHPTC project are assessed in the next section. 101 NPV represents the present value of benefits with the deduction of present value of costs. Future benefits and costs are brought to their present value using discount rates. Read more about what discount rates are and how they were chosen for present analysis in the section titled “Discount rates”.

Ohio Historic Preservation Tax Credit Economic Impact Study
Center for Economic Development, Cleveland State University Page 79
All past costs and benefits are adjusted for inflation using the GDP deflator for nondefense expenses,
estimated by the Federal Office of Management and Budgeting (OMB).102 The GDP deflator is rescaled
from 2009 base year in the OMB table, to 2015 base year in current cost-benefit analysis.
Benefits
The benefits of providing the credit from the governmental perspective include additional tax revenues
generated by sales, income, and property taxes at OHPTC project sites. Additional tax revenues can be
generated from adjacent properties that benefit indirectly from OHPTC, thanks to higher general appeal
and desirability of the area. Tax revenues not incorporated in the analysis include franchise tax revenues.
The tax was phased out in favor of the Commercial Activity Tax (estimated in the Sales tax section) and
completely repealed in 2014. Due to the recency of the OHPTC program, it is not expected that franchise
tax could generate revenues sufficient to alter the results of this cost-benefit analysis.
In addition to the tax revenues, the benefits of OHPTC include cost savings for local governments on
previously abandoned or partially vacant properties renovated as a part of historical preservation effort.
The benefits’ estimates do not consider value added by OHPTC compared to federal credits and attribute
all the benefits to OHPTC alone. Since the federal tax credit is guaranteed and the state tax credit is
competitively awarded, it is impossible to split benefits between the two programs without significant
additional research. Excepting this caveat, the estimates of the benefits for the current cost-benefit
analysis are majorly conservative, and in general produce consistent estimates.
Additional Income Tax Revenues
Income tax revenues can be generated both during a project’s renovation phase and after the
construction is completed. During the renovation phase, the income tax revenues are mainly collected
from the earnings of construction workers. The average wages of construction workers were
approximated from the online survey data.103 Income tax revenues are estimated based on the average
wage estimates of workers aggregated by each project.
After projects are completed, additional income tax revenues are generated from taxing the earnings of
those employed in the stores, hotels, and offices located in renovated properties and properties nearby
that may enjoy positive spillover effects of redevelopment (additional jobs created at nearby properties).
The wages of permanent employees working in OHPTC sites and neighboring buildings (within 500 feet
from the project site) are averaged for each project from QCEW data.104
102 Table 10.1- Gross Domestic Product and Deflators Used In the Historical Tables: 1940-2020. Retrieved on July 25, 2015 from: https://www.whitehouse.gov/omb/budget/Historicals. 103 The economic impact analysis section of this report provides details on the data extrapolation techniques. 104 23 projects are not included as QCEW does not include any employment or earnings data; however, the employment from business establishments located within 500 feet of the project was included.
Ohio Historic Preservation Tax Credit Economic Impact Study
Center for Economic Development, Cleveland State University Page 80
Income tax estimates incorporate nine state income tax brackets, and, in addition to state income tax,
include income tax rates charged by cities and school districts in Ohio.
Since this is a statewide (not local) analysis of costs and benefits associated with OHPTC, in order to
estimate additional income tax revenues generated by the preservation credit the income tax revenues
are adjusted by the annual unemployment rates. Permanent and temporary workers employed at the
OHPTC and neighboring sites likely worked, earned income, and paid taxes in other places in the same or
neighboring localities before OHPTC projects. Therefore, only the new income taxes generated by
previously unemployed individuals, or additional income taxes collected from individuals who earn higher
income working on OHPTC properties can be included in the analysis. The estimates of unemployment
are based on average annual unemployment rates in the individual sites’ counties for every year from
2007 to 2014105. Future income tax revenues are approximated separately for construction and
permanent workers based on the three-year moving average.
New income tax revenues generated between 2007 and 2015 due to the OHPTC program are estimated
to be over $25 million. Income taxes are expected to bring additional $159.7 million in revenues by 2030.
See Table 17 and Table 18 for results from income tax estimates.
Additional Sales and Gross Receipts Tax Revenues
The sales and gross receipts tax revenues are estimated for three types of taxes, including the general
retail sales tax (RST), hotel excises (lodging tax), and commercial activity tax (CAT). Retail sales tax is a tax
on general purchases, including clothing, household items, nonprescription drugs, food for consumption
on premises where sold, and such. RST in Ohio is collected at specified rates by both state and local
governments. Lodging tax is applied to all sleeping hotel rooms, and can be levied by counties and cities
(villages) in Ohio. Commercial activity tax is a state tax levied on the gross receipts from business
activities. CAT rates vary based on the amount of gross receipts. Some other special excises, such as
tobacco and alcohol excise revenues can also be generated on OHPTC and neighboring facilities, but there
is no record on the share of sales of these products in total retail sales. In this analysis, they are treated
as general retail and the revenues are calculated at RST rates.
Other potential sales tax revenues not included in the analysis are the RSTs collected on the purchases of
materials for renovation projects106 and the loss of sales tax revenues associated with lack of business
during the construction phase. The researchers believe that the loss of sales tax revenue during
construction equalizes the gains in such revenue collected on purchases of construction materials. Lastly,
the analysis does not include potential spillover effects from sales taxes because of the lack of statistics
on sales in the area.
105 There is no reason to believe that people employed at OHPTC properties earn higher (or lower) income than their counterparts working in the same positions elsewhere in the same geographical area. Therefore, no adjustments for potential differences in wages are made. County level unemployment data comes from the Bureau of Labor Statistics. Local Area Unemployment Statistics (LAU). 106 Requirements for specific materials on historical properties might dictate high cost of the materials and therefore make our estimates of benefits even more conservative.

Ohio Historic Preservation Tax Credit Economic Impact Study
Center for Economic Development, Cleveland State University Page 81
The status quo is estimated by calculating state tax revenues based on the total revenue generated by
each project and applying RST rates to the portion of revenues generated by retail stores and restaurants
on OHPTC properties, hotel excise for hotel revenues, and CAT rates for total revenues collected in each
one of the five categories of sales reported in OHPTC buildings (retail, hotel, institutional, office, or
residential revenues). As before, a 74% vacancy rate is assumed before renovations.107 Total sales tax
revenues are estimated on the remaining 26% of properties’ revenues.
The sales tax revenues from OHPTC are estimated with application of a different vacancy rate. Out of 74
respondents who answered questions about building usage, 33 completed renovations before 2014. Out
of these 33, one said that the renovated building was still vacant (about 3.03%), and one indicated a 10%
usage of a building. Based on the survey responses, the analysis assumes a 3.1% vacancy rate after
renovations. The cost-benefit estimates include the differences in sales tax collections between the status
quo and new sales tax revenues generated by completed projects.
Sales tax estimates are the most challenging part of this cost-benefit analysis. The analysis so far calculated
tax revenues generated on OHPTC properties. Only a small portion of these revenues, however,
represents new sales tax revenues for the state government. Sales on OHPTC and adjacent buildings may
be new for a locality where the project is, but on a county, or a state level (as this cost-benefit analysis is)
these sales are likely relocated from one businesses elsewhere to the others on OHPTC properties, and,
therefore, do not represent additional tax revenues for the government.
There is no data on the total dollar value of sales in any reasonable geographical proximity to the OHPTC
sites. As such it is impossible to define which part of the sales (and tax collections) in OHPTC buildings are
the new sales (and new tax revenues) and which shifted from nearby businesses. To estimate additional
sales tax revenues generated by OHPTC properties, the sales tax revenues for the OHPTC properties were
multiplied by a proportion of OHPTC revenues in the state of Ohio revenues (collected from the Survey of
Business Owners by the US Census Bureau).
It is estimated that sales and gross receipts taxes have not generated any positive revenues. In fact,
approximately $48,000 in revenue was lost because of the lack of sales on OHPTC properties during the
construction and rehabilitation stages of the projects. The result is also negative due to the highly
conservative nature of the sales and gross receipts tax estimates in current analysis. The analysis does not
include sales taxes collected on purchases of construction materials, nor does it include additional sales
tax revenues collected on properties adjacent to OHPTC sites (in both cases due to unavailability of data).
Sales and gross receipt taxes are, however, expected to generate about $4 million in revenues between
2016 and 2030. See Table 17 and Table 18 for additional details on sales and gross receipts tax estimates.
107 Read more about the estimates of the vacancy rates in the section titled “Cost savings from abandoned properties” below.

Ohio Historic Preservation Tax Credit Economic Impact Study
Center for Economic Development, Cleveland State University Page 82
Additional Property Tax Revenues
Property taxes were calculated on properties within 150 feet from centroids (geometric center of one
building to a center of another building).108 The data was collected from county assessor’s records using
the GIS system. The cost-benefit analysis is based on the actual property taxes charged on each property,
and accounts for all abatements, credits, and other tax preferences.
For the status quo the study uses the actual 2007 property tax revenue on all currently certified projects.
It is assumed that this is the base tax revenue that would be generated in the absence of OHPTC
rehabilitation projects. To identify the value added by the OHPTC projects, the base revenue is subtracted
from the observed (or predicted) property tax revenues. This computation, however, likely overestimates
the benefits added by OHPTC as some of these projects would happen in the absence of OHPTC (thanks
to federal rehabilitations credits, other government incentives, or personal motivation of property
developers).
For 2016 estimates and beyond, the average annual rate of increase109 is assumed to continue trending
as in the past eight years. This yields a very conservative estimate of the future property tax collections,
as more properties are renovated over time. The rate of increase in property tax collections has, on
average, been higher in the past three years than before. For this cost-benefit analysis the researchers
assume that such conservative estimates of future property tax collections and optimistic assumptions
about the value added to the tax yield by OHPTC should compensate for each other and produce a
consistent estimate of the overall value added to property tax collections by OHPTC.
The estimates of the property tax gains are still conservative because of the way tax delinquencies110 were
handled in this analysis. Information on actual delinquent payments has not been collected for the
analysis. These are, however, accounted for in the analysis of vacant properties.
Another detail to consider is that only properties that completed the OHPTC renovations have been
included. Sites in the process of application or rehabilitation are not likely to have higher property values
or to generate any different property tax revenues than pre-OHPTC values.
It is estimated that new property taxes revenues generated thanks to OHPTC have been around $64.4
million and will bring additional $791 million by 2030. Tables 17 and 18 show the results of the property
tax estimates.
Cost Savings from Abandoned Properties
Many OHPTC properties have been abandoned and were not in use before they were awarded the
preservation credits and restoration works began. Abandoned properties are costly to local governments
108 The choice of distance is different for the property tax and income tax estimates. For income tax, the research team made a decision to explore employment change within a 500 foot radius. The choice of distance for property tax analysis is 150 feet, based upon the following study: Ding, C., Simons, R., & Baku, E. (2000). The effect of residential investment on nearby property values: evidence from Cleveland, Ohio. Journal of Real Estate Research, 19(1), 23-48. 109 In average annual nominal property tax revenue between 2010 and 2014. 110 Delinquent charges are the unpaid property taxes and penalties.

Ohio Historic Preservation Tax Credit Economic Impact Study
Center for Economic Development, Cleveland State University Page 83
to maintain and demolish; they require additional police and fire expenses, and there is a loss in the
property (and other) tax collections from abandoned and neighboring properties. To estimate the cost
savings on renovating abandoned properties, researchers estimated the percentage of all OHPTC sites
which would qualify as abandoned based on data from the online survey.111
The average cost of vacant and abandoned properties to local governments comes from the 2008
ReBuildOhio report. This report estimates the average tax loss, maintenance, and other costs of
maintaining and demolishing vacant properties in eight cities in Ohio. 112
The total cost savings from previously abandoned properties are estimated to be around $2 million
between 2007 and 2030. See Table 17 and Table 18 for results of the cost savings estimates.
Costs
The four major categories of costs related to the OHPTC are the loss of income tax revenues associated
with the provision of the credit itself (tax expenditures), loss of other (property, sales, and income) tax
revenues during construction, the costs of administering the credit, and compliance costs. The potential
loss of tax revenue during construction is not separated in a discrete category of costs, but is rather
incorporated in the estimates of benefits that are reduced by the amount of loss.
Tax expenditures due to OHPTC
Like any other income tax credits, the OHPTC is designed to reduce the amount of taxes paid by qualified
taxpayers. The Department of Taxation estimates the general fund revenues forgone due to the credit to
be between $234 and $313 million between 2009, the first year the credit could have been claimed, and
the present.113 The loss of tax revenues by claiming the OHPTC was estimated as a moving average of the
credit claimed in the past three years. The amount of claimed credits was constant in the past five years
(except for a drop in 2013), as was the amount of tax credit awarded. Thus, nothing indicates that there
might be a substantial increase or reduction in the amount of credits claimed in the considerable future.
111 74 respondents answered questions about building usage. Of them 57 said that the buildings were not in use a year before the OHPTC project started (about 74%), and 2 said that the buildings were approximately 50% utilized. A random check of several properties showed that some were delinquent on property tax payments, even when the current owners said the properties were in use before OHPTC renovations. A 74% vacancy rate was applied to the remaining 164 properties approved for OHPTC resulting in approximately 126 additional vacant properties. The projections for the number of OHPTC properties are estimated as a three year moving average of the percentage of approved applications from total submitted applications in each year. Estimates of the number of submitted applications are discussed in the “Compliance costs” section. 112 Garber, R., Kim, J., Sullivan, K., & Dowell, E. (2008). $60 million and counting: The cost of vacant and abandoned properties to eight Ohio cities. Community Research Partners, 3-3. The same costs per vacant property were assigned to all cities within the same county as a city studied in the report. For the counties not included in the report the average cost across eight cities was estimated. 113 Ohio tax expenditure budgets for various years. Retrieved on July 25, 2015 from http://www.tax.ohio.gov/communications/publications.aspx.

Ohio Historic Preservation Tax Credit Economic Impact Study
Center for Economic Development, Cleveland State University Page 84
The total amount of the claimed credit since the inception of the program has been approximately $169
million, and is expected to be an additional $429 million in the next 15 years, if the program continues in
the same path. See Table 17 and Table 18 for estimates of tax expenditures due to the OHPTC program.
Administrative costs
Administrative costs include the costs of administering the credit. The OHPTC program is administered
by three organizations, including the State Historic Preservation Office (SHPO), the Ohio Development
Services Agency (ODSA), and the Ohio Department of Taxation (ODT). Of these three agencies, ODSA and
ODT are governmental organizations while SHPO is a nonprofit. Since the assessment of costs and benefits
is conducted from the governmental perspective, the administrative costs (and certain benefits, discussed
later) of SHPO are not included in the analysis. Minor administrative costs are also incurred by Certified
Local Governments (CLGs). The incidence of CLGs involvement with OHPTC is low, and CLGs are partially
financed from Federal funds. Therefore, the costs of administering the credit by CLGs are negligible if at
all existent, and are not included in the analysis.
Administrative costs were estimated for 2014 by the ODSA staff. Only the share of the costs for
administering the OHPTC and not the federal credit were included in the analysis. The following categories
of administrative costs were included in the analysis: salary and fringe benefits, indirect costs, personal
services (including contracts, memberships, trainings, etc.), supplies and maintenance, equipment, and
grants to the developers. ODSA also provided estimates of the full-time employment equivalent for
individuals from each department involved in administering the OHPTC beginning from 2007. A 1.5%
annual growth in salaries and fringe benefits is assumed over the 20-year period under consideration. The
annual values of other categories are approximated based on the number of employees working on the
project each year. ODSA and tax departments have the same number of staff members working on the
project from 2009 onward.
The costs of administering the credit totaled to about $3.8 million so far, and likely to add up to additional
$24 million in the coming 15 years. See Table 17 and Table 18 for results of administrative cost estimates.
Compliance costs
Compliance costs are defined as time and money spent by taxpayers-applicants to conform to OHPTC
application requirements. Despite the fact that compliance costs are paid by the developers, and current
analysis considers only the benefits and costs incurred by government, compliance costs should still be
included in such analysis as they, together with administrative costs, represent total collection costs (see
Mikesell, 2014, p 366 for details). Government can bear most of the collection costs (like with property
taxation, when county assessors do most of the collection work), or can delegate or transfer some or
most of the collection costs to taxpayers (as with income taxes). Such transfer of collection work onto

Ohio Historic Preservation Tax Credit Economic Impact Study
Center for Economic Development, Cleveland State University Page 85
taxpayers might be the reason why Stiglitz (2000) calls compliance costs "indirect administrative
costs".114 Compliance costs are routinely included in cost-benefit analysis of tax incentives’ programs.115
OHPTC-related compliance costs are incurred during the application, redevelopment, and certification
stages of the process. Potential costs include salaries and wages – as well as fringe benefits – of the
developers and their staff members who prepare the applications, travel expenses to attend required
meetings with ODSA and SHPO staff, and costs of office materials, mailing expenses, and application fees.
Additional costs may include the expenses of hiring outside contractors, such as architects, market
analysts, and accountants, to assist with application process. Most of the application requirements for
the federal and Ohio historic preservation credits are the same, and costs are shared between applications
for state and federal credits.
The estimates of compliance costs are based mainly on responses to the online survey, which included a
set of questions for developers that requested estimates of compliance costs. From 79 survey
respondents, 31 answered compliance questions (about 40% of the respondents).116 Since compliance
costs are shared between state and federal applications, respondents were asked to evaluate the share
or percentage of resources spent on OHPTC alone. The share of resources dedicated to OHPTC
compliance is estimated from the original responses, which are summarized in Figure 30. In the “other”
category respondents mentioned the help of engineers, the hiring of other consultants, or an additional
(tax credit reservation) fee a project had to pay.117 Two types of costs were estimated from data not
based on the survey responses - the amount of total fees (application, certification, and servicing fees),
and travel costs for a required meeting in Columbus with ODSA and SHPO staff.
The fees were introduced on July 1, 2011. Application fees are paid by all applicants upon submission
during the first stage of the project. The fee is estimated based on the amount of a requested tax credit,
and does not exceed $10,000. For example, for an application requesting $50,000 in preservation credit,
the fee is $500; the application fee for a $300,000 request is $1,000. The future amount of application
fees are predicted based on the number of OHPTC applications submitted in the past several years and
average fees per submitted application. The total number of federal applications has been within the
114 Joseph E. Stiglitz (2000). Economics of the Public Sector, Third Edition, W.W. Northon & Company. 115 See for example, Chen, D. (2015). The Framework for Assessing Tax Incentives: A Cost-Benefit Analysis Approach.; Bennett, F., Brewer, M., & Shaw, J. (2009). Understanding the compliance costs of benefits and tax credits (No. R70). IFS Reports, Institute for Fiscal Studies.; Lester, J. (2012). Benefit-cost analysis of R&D support programs. Canadian Tax Journal/Revue Fiscale Canadienne, 60(4). 116 Despite a quite small percentage of responses to compliance survey questions (approximately 40%), these respondents are very representative of a general pool of developers who answered the survey. They submitted applications (and incurred major compliance costs) in all years of OHPTC existence, although there are more responses from those who applied for the credit in the past six years, and fewer responses from those who applied in 2008 and 2009. These 31 respondents represent a variety of projects that differ by project cost, type of renovated property, and location of the property. 117 Since not all survey respondents included the costs of copying, mailing, and office materials, or of using company personnel, these numbers were adjusted based on the responses of those who included such estimates in the compliance costs. The survey was sent out only to those who were approved to receive OHPTC. Compliance costs are, however, incurred by all who apply for the credit, not only those who eventually received it. The response rates were averaged among all those who answered the compliance questions form the survey, and applied to all applicants independent of whether they were eventually approved for OHPTC.
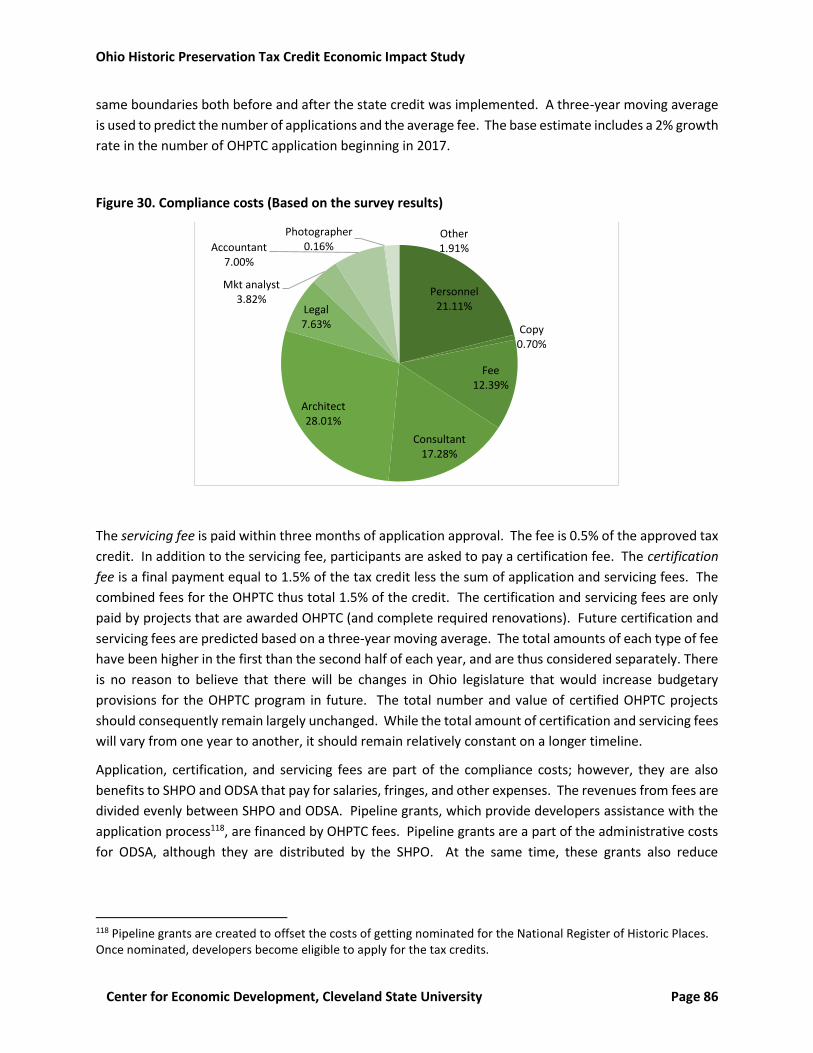
Ohio Historic Preservation Tax Credit Economic Impact Study
Center for Economic Development, Cleveland State University Page 86
same boundaries both before and after the state credit was implemented. A three-year moving average
is used to predict the number of applications and the average fee. The base estimate includes a 2% growth
rate in the number of OHPTC application beginning in 2017.
Figure 30. Compliance costs (Based on the survey results)
The servicing fee is paid within three months of application approval. The fee is 0.5% of the approved tax
credit. In addition to the servicing fee, participants are asked to pay a certification fee. The certification
fee is a final payment equal to 1.5% of the tax credit less the sum of application and servicing fees. The
combined fees for the OHPTC thus total 1.5% of the credit. The certification and servicing fees are only
paid by projects that are awarded OHPTC (and complete required renovations). Future certification and
servicing fees are predicted based on a three-year moving average. The total amounts of each type of fee
have been higher in the first than the second half of each year, and are thus considered separately. There
is no reason to believe that there will be changes in Ohio legislature that would increase budgetary
provisions for the OHPTC program in future. The total number and value of certified OHPTC projects
should consequently remain largely unchanged. While the total amount of certification and servicing fees
will vary from one year to another, it should remain relatively constant on a longer timeline.
Application, certification, and servicing fees are part of the compliance costs; however, they are also
benefits to SHPO and ODSA that pay for salaries, fringes, and other expenses. The revenues from fees are
divided evenly between SHPO and ODSA. Pipeline grants, which provide developers assistance with the
application process118, are financed by OHPTC fees. Pipeline grants are a part of the administrative costs
for ODSA, although they are distributed by the SHPO. At the same time, these grants also reduce
118 Pipeline grants are created to offset the costs of getting nominated for the National Register of Historic Places. Once nominated, developers become eligible to apply for the tax credits.
Personnel21.11%
Copy0.70%
Fee12.39%
Consultant17.28%
Architect28.01%
Legal7.63%
Mkt analyst3.82%
Accountant7.00%
Photographer0.16%
Other1.91%
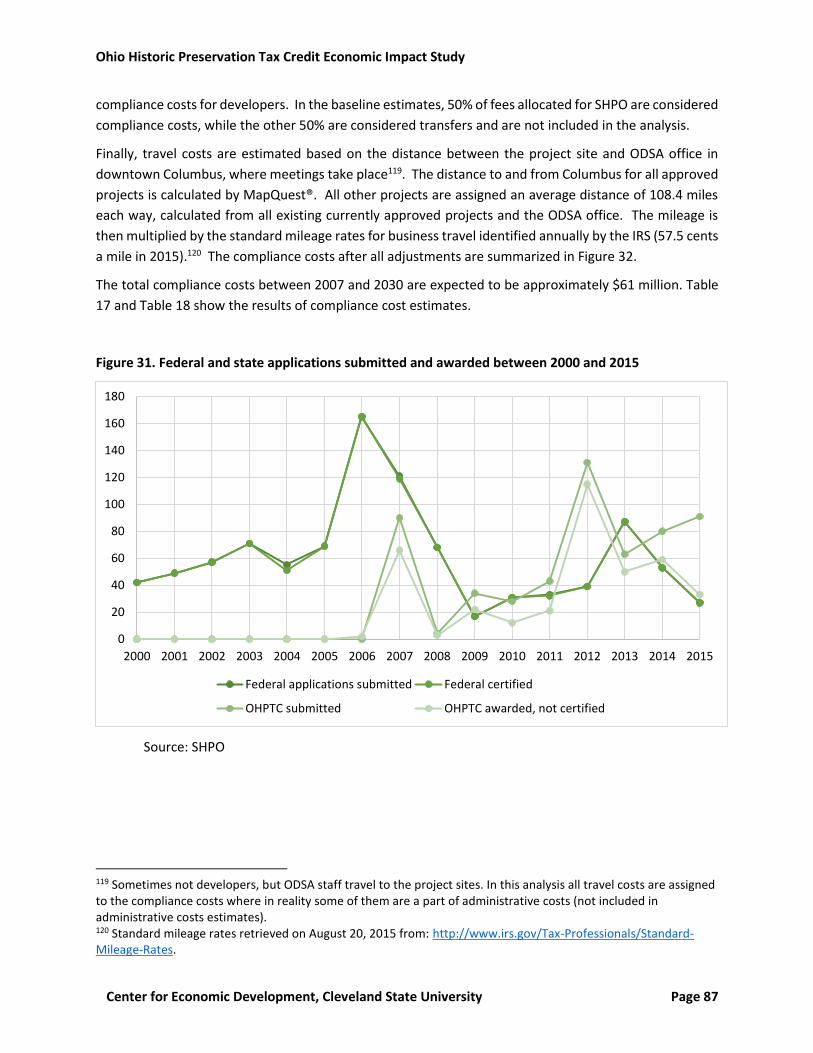
Ohio Historic Preservation Tax Credit Economic Impact Study
Center for Economic Development, Cleveland State University Page 87
compliance costs for developers. In the baseline estimates, 50% of fees allocated for SHPO are considered
compliance costs, while the other 50% are considered transfers and are not included in the analysis.
Finally, travel costs are estimated based on the distance between the project site and ODSA office in
downtown Columbus, where meetings take place119. The distance to and from Columbus for all approved
projects is calculated by MapQuest®. All other projects are assigned an average distance of 108.4 miles
each way, calculated from all existing currently approved projects and the ODSA office. The mileage is
then multiplied by the standard mileage rates for business travel identified annually by the IRS (57.5 cents
a mile in 2015).120 The compliance costs after all adjustments are summarized in Figure 32.
The total compliance costs between 2007 and 2030 are expected to be approximately $61 million. Table
17 and Table 18 show the results of compliance cost estimates.
Figure 31. Federal and state applications submitted and awarded between 2000 and 2015
Source: SHPO
119 Sometimes not developers, but ODSA staff travel to the project sites. In this analysis all travel costs are assigned to the compliance costs where in reality some of them are a part of administrative costs (not included in administrative costs estimates). 120 Standard mileage rates retrieved on August 20, 2015 from: http://www.irs.gov/Tax-Professionals/Standard-Mileage-Rates.
0
20
40
60
80
100
120
140
160
180
2000 2001 2002 2003 2004 2005 2006 2007 2008 2009 2010 2011 2012 2013 2014 2015
Federal applications submitted Federal certified
OHPTC submitted OHPTC awarded, not certified

Ohio Historic Preservation Tax Credit Economic Impact Study
Center for Economic Development, Cleveland State University Page 88
Figure 32. Average compliance costs for OHPTC projects
Discount rate
Several discount rates121 are used in the analysis. These discount rates are based on governmental ability
to borrow money from private sources. The preferred estimates are based on the 2.8% nominal rate. This
is the rate suggested by the Circular No. A-94 for cost-benefit analysis of Federal government programs.122
This cost-benefit analysis is extended for the period of 15 years from the present; the closest 10-year
maturity is used for the analysis.
The yield on taxable bonds issued by the state of Ohio has similarly been 2.8% in 2015.123 The rate on
taxable bonds is considered more appropriate as it more closely approximates the market rate.124
Sensitivity analysis is performed with additional discount rates of 2.05, 2.4, and 3.22 percent.125 The
discount rate of 2.8% is used in the preferred estimates.
121 Discount rate is the rate used to discount future costs and benefits to their present value. It is not equal to inflation (or projected inflation) rate, but rather represents a rate that government could have earned if it had invested money elsewhere (not the OHPTC program). The discount rate helps to convert the future flows of costs and benefits to their present value, and to eventually estimate the Net Present Value (NPV) of the project. 122 Nominal and real rates are published every December by the Federal Office of Management and Budgeting (OMB), and are based on the interest rates of treasury bonds and notes with different maturities. The circular suggests such rates for the base-case analysis of all Federal government projects. It reads that this discount rate “approximates the marginal pretax rate of return on an average investment in the private sector in recent years.” 2.8% and 0.9% rates are the yields on treasury bonds maturing in 10-years. The rates are published for the bonds maturing in 3, 5, 7, 10, 20, and 30 years. Circular No. A-94 Revised. Retrieved on August 1, 2015 from: https://www.whitehouse.gov/omb/circulars_a094/a94_appx-c. 123 Source: various official statements of the State of Ohio General Obligation (GO) bonds dated in 2015. 124 Mikesell, J. L. (2014). Fiscal Administration: Analysis and Applications for the Public Sector (Ninth ed.): Thompson Wadsworth, p. 328. 125 These alternative rates are based on the yields from tax exempt GO bonds issued by the state of Ohio in 2015 (Ohio’s current credit rating is AA+ by S&P and Fitch, and Aa1 by Moody’s). The rates on such bonds issued for different purposes varied between 2.05% and 2.29% with ten-year maturities (maturing in 2025), and 2.46-2.49 percent rate for bonds maturing in 2030. Yahoo Finance reports a current yield of 2.4% (last month’s yield of
Personnel37.191%
Copy1.182%
Consultant10.108%
Legal14.576%
Mkt analyst1.8%
Accountant5.302%
Photographer0.089%
Mileage0.108%
Other1.085%
Architect23.684%
Fee4.875%

Ohio Historic Preservation Tax Credit Economic Impact Study
Center for Economic Development, Cleveland State University Page 89
Results of Cost-Benefit Analysis
Overall analysis, under any estimates, shows that the OHPTC program should generate positive net
benefits by the year 2024. The project estimates yield a positive NPV sooner with a lower discount rate
(2.05%) and later with a higher discount rate (3.22%). Under all estimates, the program (in its current state
and condition) is shown to generate substantive positive net benefits during the 23-year horizon from the
inception of the program in 2007. The net benefits are expected to further grow after the studied horizon.
As of this year OHPTC program has, however, not paid for itself (Net Present Value, NPV, is negative). The
assessment shows that the costs of providing the credit so far outweighed the monetary benefits from it
for the state and local government. In general, the OHPTC program has generated approximately $90.3
million in benefits over the eight years since its inception in 2007, while the combined costs of providing
the credit over the same time totaled approximately $201.1 million.
The OHPTC program is very young. While costs of providing the credits were incurred even before the
program officially commenced (in 2006-2007), the benefits began to accumulate during construction
phase and mainly after the first projects were completed (not earlier than 2009). As more projects are
completed, the benefits from the program have been shown to grow at an increasing rate, while most
costs have remained stable during the last three to five years (dependent on the type of costs). Under the
preferred analysis (2.8% discount rate), the benefits from the OHPTC projects are estimated to be around
$956.4 million (mostly from property tax collections) over the next 15 years of the life of a project, while
the costs will total approximately $486.3 million between 2016 and 2030. These changes will total an
estimated $470 million in net benefits over the next 15 years.
There are two noteworthy features of the analysis. First, in general, the estimates of the OHPTC program
benefits are conservative, and the program may pay for itself sooner even under higher discount rates.
Second, as noted from the beginning of the cost-benefit analysis, the assessments were conducted from
a purely governmental (not societal) perspective. The program may generate positive net benefits much
sooner (or later) if the benefits and costs to private parties are included in the analysis.
2.44%) on 10-year AA-rated bonds (as of 8/24/2015). Similarly rated corporate bonds are earning a current yield of 3.22% (3.37% last month), and the current yield on US treasury bonds is 2.04% (2.32% last month).

Ohio Historic Preservation Tax Credit Economic Impact Study
Center for Economic Development, Cleveland State University Page 90
Table 17. Costs-Benefits Estimates for OHPTC Projects from Government Perspective at Discount Rates
2.8 and 2.05
Years 2007-2015 2015-2030 2007-2030 2015-2030 2007-2030
Discount rate 2.8% 2.05%
Benefits
Additional property tax
revenues
64,418,166.32 791,251,491.48 855,669,657.80 852,804,179.62 917,222,345.94
Additional income tax
revenues
25,349,194.71 159,707,851.25 185,057,045.95 169,457,852.94 194,807,047.65
Additional sales and
gross receipts tax
revenues
-48,123.50 4,012,561.34 3,964,437.83 4,357,400.38 4,309,276.87
Cost savings from
vacant properties
625,609.64 1,403,516.50 2,029,126.13 1,485,380.99 2,110,990.63
Total Benefits 90,344,847.16 956,375,420.56 1,046,720,267.71 1,028,104,813.93 1,118,449,661.09
Costs
OHPTC credits claimed 169,310,451.58 429,030,408.25 598,340,859.82 444,460,564.77 613,771,016.35
Administrative costs 3,795,248.56 24,075,817.57 27,871,066.14 21,123,685.30 24,918,933.86
Compliance costs 27,989,019.79 33,241,744.56 61,230,764.35 35,134,408.32 63,123,428.11
Total costs 201,094,719.93 486,347,970.37 687,442,690.31 500,718,658.38 701,813,378.32
Net Present Value
(NPV)
-110,749,872.78 470,027,450.18 359,277,577.41 527,386,155.54 416,636,282.77

Ohio Historic Preservation Tax Credit Economic Impact Study
Center for Economic Development, Cleveland State University Page 91
Table 18. Costs-Benefits Estimates for OHPTC Projects from Government Perspective at Discount Rates
2.4 and 3.22
Years 2007-2015 2015-2030 2007-2030 2015-2030 2007-2030
Discount rate 2.4% 3.22%
Benefits
Additional property tax revenues 64,418,166.32 842,490,091.11 887,783,488.96 759,195,297.55 823,613,463.87
Additional income tax revenues 25,349,194.71 164,809,101.58 199,944,997.15 154,582,527.56 179,931,722.26
Additional sales and gross
receipts tax revenues
-48,123.50 4,192,264.05 4,144,140.55 3,833,662.58 3,785,539.07
Cost savings from vacant
properties
625,609.64 1,446,345.35 2,071,954.99 1,360,492.26 1,986,101.89
Total Benefits 90,344,847.16 1,012,937,802.09 1,093,944,581.65 918,971,979.94 1,009,316,827.09
Costs
OHPTC credits claimed
Administrative costs 169,310,451.58 437,131,387.69 606,441,839.26 420,827,307.74 590,137,759.32
Compliance costs 3,795,248.56 21,497,337.16 25,145,262.49 20,746,564.98 24,394,490.30
Total costs 27,989,019.79 34,232,154.42 62,221,174.21 32,246,285.76 60,235,305.55
Net Present Value (NPV) 201,094,719.93 492,860,879.27 693,808,275.96 473,820,158.48 674,767,555.18
Ohio Historic Preservation Tax Credit Economic Impact Study
Center for Economic Development, Cleveland State University Page 92
7. Economic Impact of OHPTC Projects
This section of the report outlines the economic impact of the 2014 operations of facilities that were
rehabilitated using the Ohio Historic Preservation Tax Credit, as well as the economic impact of the
construction and renovation expenditures that occurred between 2008 and 2014. All economic impacts
are estimated for the entire state of Ohio. Both the operations and the rehabilitation of these buildings
affect the economy – a concept that is referred to as economic impact.
Both operations and renovations are linked to other industries through buy-sell relationships. To produce
goods and services, companies buy intermediary goods and services from other companies both inside
and outside of their industry. The buy-sell relationships that occur in the state of Ohio contribute to the
economic impact of the OHPTC. The economic impact is based on estimates of statewide employment
and revenue generated by the businesses located in the renovated facilities, as well as the construction
expenditures arising from renovations.
Methodology
This section explores the economic impact of the OHPTC on the state of Ohio by using IMPLAN®
Professional and 2013 IMPLAN Data Files. IMPLAN Professional 3.0 is an economic impact assessment
software system. The use of IMPLAN data files allows for the creation of sophisticated models of local
economies to estimate a wide range of economic impacts. For the purposes of this impact, it was assumed
that all of the projects would not have been completed in the absence of the OHPTC.126
The input-output model measures how the economy will respond to the expansion of a specific industry.
For example, growing demand for construction materials may cause producing companies to increase
activity, and in the process invest in infrastructure and hire additional people. The first round of industry
expansion is a direct effect from the investment. The producing companies may also contract out to
suppliers, such as service companies, and those suppliers may in turn contract to others for goods and
services. This can be thought of as purchases made in the supply chain that are an indirect result of the
renovation of the sites. There is a third round of spending that can also be captured. This is identified as
the spending that comes from employees of companies and their suppliers. This consumer spending is
induced by the spending of the employees and all who serve them, from hotels and restaurants to barbers
and grocery stores. This analysis presents direct and indirect economic impact together and addresses
induced effect from the consumer spending separately.
126 The economic impacts contained in this report are based on the information provided to the Center for Economic Development by the Ohio Development Services Agency and in survey responses by developers and operators of renovated sites. The financial information is taken as data, and no attempt was made to verify or audit the financial systems and procedures of the individual projects. Also, this report does not include the economic value of intangible items such as the social value of preserving historic buildings. Every attempt was made to accurately measure and place the true economic impacts.

Ohio Historic Preservation Tax Credit Economic Impact Study
Center for Economic Development, Cleveland State University Page 93
The report measures impacts on the state with four indicators: employment, labor income, output, and
value added.127 Employment measures the number of jobs supported in Ohio by the renovation and
development conducted in OHPTC properties. Labor income is calculated by combining payroll paid to
employees and proprietors’ income for employees. It represents additional household earnings created
in the state due to the expenditures from construction and operations. Output measures the total value
of goods and services produced in the state as a result of the spending on the construction and operations
at the sites. Value added calculates the value of goods and services less the intermediary goods and
represents a portion of output – often referred to as Gross Domestic Product.
To estimate the economic impact of the construction and operations spending, only the purchases that
were made in the state of Ohio are included in the model. Any purchases outside the state were excluded
from the model. IMPLAN data discounts total purchases according to the pattern of buy-sell relationships
between Ohio industries based on a local purchase percentage.
Overview of Tax Credit Projects
A total of 238 projects have been awarded the OHPTC since the program’s inception (Table 19). These
projects include 313 buildings with nearly 22 million square feet of space and almost 8,000 residential
units. The total project costs were just under $3.5 billion, with $2.7 billion in qualified rehabilitation
expenditures which allowed for $482 million in OHPTC awards.
Table 19. OHPTC Project Details
Number of Projects 238
Number of Buildings 313
Total Square Footage 21,991,085
Total Residential Units 7,975
Total Project Costs $3,495,348,284
Qualified Rehabilitation Expenditures $2,693,071,622
OHPTC Awards $482,278,984
127 The tax impact from the IMPLAN model was not included in this report as a detailed analysis of taxes is located in Chapter 5.

Ohio Historic Preservation Tax Credit Economic Impact Study
Center for Economic Development, Cleveland State University Page 94
Building Operations Impact
Two data sources were used to estimate building operation costs. A data sheet from the Ohio
Development Services Agency provided basic information on all projects including size, use, costs, and
award dates. Additionally, a survey was administered by the Center for Economic Development to all
recipients of the OHPTC. The survey collected data on building use (retail, hotel, institutional, residential,
office, industrial, vacant, or other), number of employees, and total revenues of OHPTC projects before
and after rehabilitation. This data was used to calculate the net change in employment and revenue after
rehabilitation since only new employment at each site is considered as economic impact. Because not
every OHPTC recipient responded to the survey, estimates for the remaining properties were determined
by multiplying the total square footage of each property against the average revenue per square foot.
This multiplier was calculated from the answers of OHPTC recipients that did respond to the survey. For
those projects without a response, this multiplier was applied to the known size of the project from the
state records in order to calculate the estimated new employment for each site based on the actual data
reported by those that completed the survey (minus two outliers omitted due to inconsistent responses).
New employees that existed after renovation were then entered into the model and employees that
existed prior to renovation and after the completion were omitted. The data was next organized by
building use and entered into the IMPLAN model for analysis. The new employees and new revenue were
entered into different IMPLAN sectors based on the final use of the building. These building uses that
were included in the model were based on the data provided by the state on final project uses and
included retail, hotels and motels, real estate, and other specific categories. Each project was entered
into the model by its specific use. It is important to note that only projects which have been designated
as “Certified” by the Ohio Development Services Agency were considered in this portion of the analysis.
A designation of “Certified” indicates that the project is complete and is no longer under construction.
The total direct and indirect employment impact from the additional building operations created is 12,214
employees in 2015 (Table 20).128 Of this, 79% (9,606 employees) is represented in the direct effect, which
means that employees work directly for the buildings that have been rehabilitated. Twenty one percent
(2,608 employees) is represented in the indirect effect: employees of suppliers to the businesses at the
project site.
Table 20. Additional Direct & Indirect Operations Impact, 2015 (In 2015 USD$)
Impact Type Employment Labor Income Value Added Output
Direct Effect 9,606 $977,859,720 $1,897,759,387 $1,522,258,124
Indirect Effect 2,608 $115,858,173 $199,752,881 $350,923,044
Direct + Indirect Effect 12,214 $1,093,717,893 $2,097,512,268 $1,873,181,168
128 This number differs from the total jobs created that were reported to the state in the applications. This is due to the fact that survey results estimated the actual jobs that existed after renovation. Additionally, only new jobs were taken into account in the impact; if a building had 10 employees before renovations and now has 15, only the 5 new jobs were entered into the model, which represents the true economic impact.

Ohio Historic Preservation Tax Credit Economic Impact Study
Center for Economic Development, Cleveland State University Page 95
Figure 33 shows the top ten industries in terms of employment impact. The highest number of employees
is in Real estate (7,026, 58%). This is followed by Retail - Miscellaneous store retailers, (2,006, 16%), Hotels
and motels, including casino hotels (831, 7%), and Employment services (633, 5%).
Figure 33. Top 10 Industries in Terms of Employment Direct and Indirect Impact
In terms of labor income, which represents combined payroll, proprietor income, and benefits, the total
economic impact was $1.1 billion. Almost $1 billion was in the direct effect (89%), with $116 million in
the indirect effect (11%). The industries with the highest direct employment were Real Estate, Retail -
Miscellaneous store retailers, and Hotels and motels, including casino hotels.
The value added impact, or gross state product, was $2.1 billion. Just under $1.9 billion was in the direct
effect (90%), with $200 million in the indirect effect (10%). The three highest industries in terms of the
indirect effect were Employment Services, Real Estate, and Maintenance and repair construction of
nonresidential structures.
The total output impact, the total value of goods and services produced in the state due to these projects,
was valued at $1.9 billion in 2015. Over $1.5 billion was in the direct effect (81%), with $351 million in
the indirect effect (19%). The three highest industries in terms of the indirect effect were Hospitals, Full-
service restaurants, and Limited-service restaurants, reflecting that this represents household spending.
Real estate, 7,026
Retail - Miscellaneious store retailers, 2,006
Hotels and motels, including casino hotels,
831
Employment services, 633
Maintenance and repair construction of nonresidential structures, 215
Services to buildings, 209
Investigation and security
services, 128
Landscape and horticultural services, 85
Monetary authorities and depository credit intermediation, 56
Full-service restaurants, 55
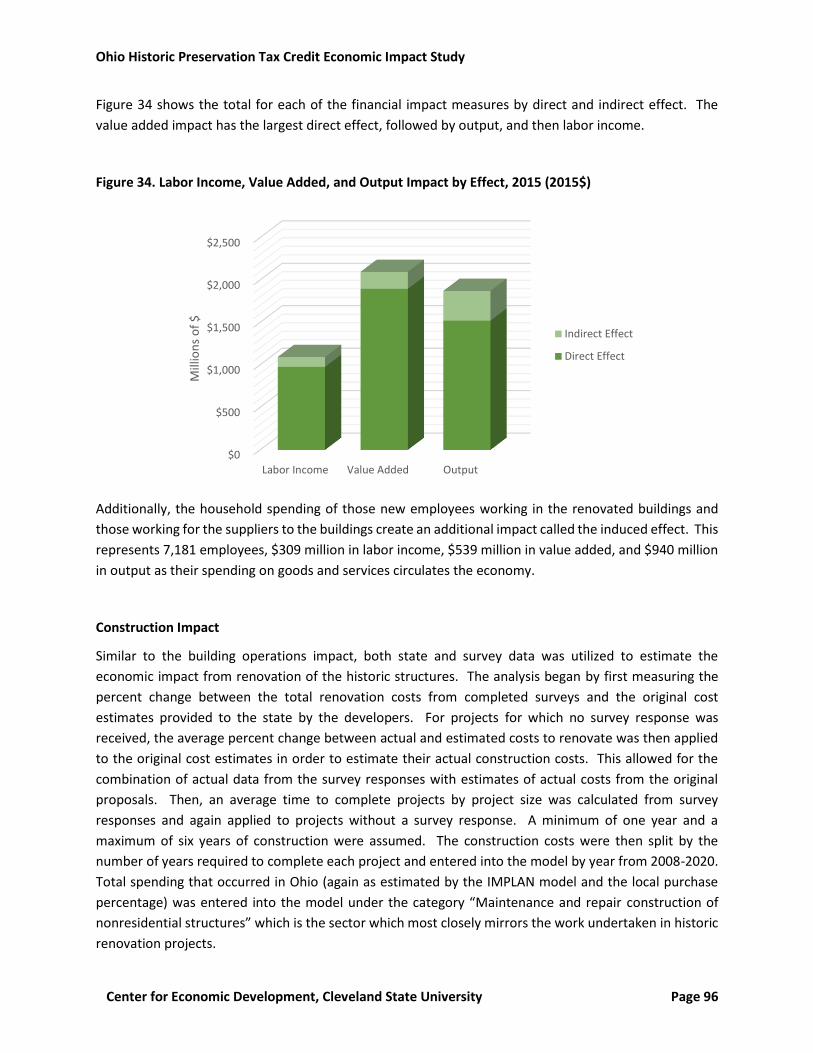
Ohio Historic Preservation Tax Credit Economic Impact Study
Center for Economic Development, Cleveland State University Page 96
Figure 34 shows the total for each of the financial impact measures by direct and indirect effect. The
value added impact has the largest direct effect, followed by output, and then labor income.
Figure 34. Labor Income, Value Added, and Output Impact by Effect, 2015 (2015$)
Additionally, the household spending of those new employees working in the renovated buildings and
those working for the suppliers to the buildings create an additional impact called the induced effect. This
represents 7,181 employees, $309 million in labor income, $539 million in value added, and $940 million
in output as their spending on goods and services circulates the economy.
Construction Impact
Similar to the building operations impact, both state and survey data was utilized to estimate the
economic impact from renovation of the historic structures. The analysis began by first measuring the
percent change between the total renovation costs from completed surveys and the original cost
estimates provided to the state by the developers. For projects for which no survey response was
received, the average percent change between actual and estimated costs to renovate was then applied
to the original cost estimates in order to estimate their actual construction costs. This allowed for the
combination of actual data from the survey responses with estimates of actual costs from the original
proposals. Then, an average time to complete projects by project size was calculated from survey
responses and again applied to projects without a survey response. A minimum of one year and a
maximum of six years of construction were assumed. The construction costs were then split by the
number of years required to complete each project and entered into the model by year from 2008-2020.
Total spending that occurred in Ohio (again as estimated by the IMPLAN model and the local purchase
percentage) was entered into the model under the category “Maintenance and repair construction of
nonresidential structures” which is the sector which most closely mirrors the work undertaken in historic
renovation projects.
$0
$500
$1,000
$1,500
$2,000
$2,500
Labor Income Value Added Output
Mill
ion
s o
f $
Indirect Effect
Direct Effect

Ohio Historic Preservation Tax Credit Economic Impact Study
Center for Economic Development, Cleveland State University Page 97
The analysis of the construction of the projects is divided between construction that has already been
completed (2008-2015) and anticipated construction (2016-2020). This was done to show the costs which
have already been incurred as well as projected costs, acknowledging that the projected estimates in
future years will likely increase when additional projects are awarded the OHPTC in coming years.
Table 21 shows the direct and indirect construction impact for the years 2008 through 2015, which
represents the start of the program through the current year. The direct and indirect employment impact
is an annual average of 3,244 jobs, the labor income impact is $1.4 billion, the value added impact is $1.8
billion, and the output impact is $4.2 billion.
Table 21. Direct and Indirect Economic Impact of Construction, 2008-2015
Employment* 3,244
Labor Income $1,436,947,343
Value Added $1,789,364,411
Output $4,205,803,443
*average annual employment
The projects that have been awarded the OHPTC have construction costs that vary by year. Table 22
shows total economic impact for each year between 2008 and 2015. The largest impact across all
categories occurred in 2015, while the smallest occurred in 2011.
Table 22. Direct and Indirect Economic Impact of Construction by Year, 2008-2015
Employment* Payroll Value Added Output
2008 3,433 $ 190,060,652 $ 236,673,785 $ 556,288,811
2009 3,864 $ 213,936,392 $ 266,405,145 $ 626,170,763
2010 2,122 $ 117,498,196 $ 146,315,096 $ 343,905,653
2011 1,694 $ 93,783,349 $ 116,784,089 $ 274,494,622
2012 2,694 $ 149,173,487 $ 185,758,880 $ 436,616,123
2013 3,495 $ 193,524,039 $ 240,986,582 $ 566,425,804
2014 3,693 $ 204,492,353 $ 254,644,918 $ 598,529,006
2015 4,958 $ 274,478,875 $ 341,795,916 $ 803,372,661
*Average annual employment

Ohio Historic Preservation Tax Credit Economic Impact Study
Center for Economic Development, Cleveland State University Page 98
The average annual employment impact from the construction between 2008 and 2015 is 3,244 (Table
23). Of this, 1,911 employees (59%) are represented in the direct effect, which means that they worked
directly on rehabilitation projects. Over 1,300 employees (41%) are represented in the indirect effect,
working for suppliers to the construction industry.
Table 23. Direct and Indirect Economic Impact of Construction, 2008-2015
Employment* Payroll Value Added Output
Direct Effect 1,911 $974,940,997 $993,265,361 $2,710,717,438
Indirect Effect 1,333 $462,006,346 $796,099,050 $1,495,086,005
Direct + Indirect Effect 3,244 $1,436,947,343 $1,789,364,411 $4,205,803,443
*Average annual employment
Figure 35 shows the top ten industries in terms of annual average employment impact. The highest
number of employees is in Maintenance and repair construction of nonresidential structures (15,352,
59%). This is followed by Retail – Nonstore retailers, (1,383, 5%), Retail - Clothing and clothing accessories
stores (1,103, 4%), and Retail - Miscellaneous store retailers (804, 3%).
Figure 35. Top 10 Industries in Terms of Average Annual Employment Direct and Indirect Impact,
2008-2015
Maintenance and repair construction of
nonresidential structures, 15,352
Retail - Nonstore retailers, 1,383
Retail - Clothing and clothing accessories
stores, 1,103
Retail - Miscellaneious store retailers, 804
Wholesale trade, 601
Retail - General merchandise stores,
518
Retail - Health and personal care stores,
507
Retail - Gasoline stores, 394
Real estate, 345
Truck transportation 343

Ohio Historic Preservation Tax Credit Economic Impact Study
Center for Economic Development, Cleveland State University Page 99
For labor income, which represents combined payroll, proprietor income, and benefits, the total economic
impact was $1.4 billion. Almost $1 billion was in the direct effect (68%) with $462 million in the indirect
effect (32%). The industries with the highest labor income were Maintenance and repair construction of
nonresidential structures, Wholesale trade, and Hospitals.
The value added impact of the renovation projects between 2008 and 2015 was $1.8 billion. Just under
$1 billion was in the direct effect (56%) with $796 million in the indirect effect (44%). The three highest
industries in terms of the indirect effect were Maintenance and repair construction of nonresidential
structures, Wholesale trade, and Real estate.
The output impact, the total value of goods and services produced in the state due to these projects, was
valued at $4.2 billion between 2008 and 2015. Over $2.7 billion was in the direct effect (64%) with $1.5
billion in the indirect effect (36%). The three highest industries in terms of the indirect effect were
Maintenance and repair construction of nonresidential structures, Wholesale trade, and Retail - Nonstore
retailers.
Figure 36 shows the total for each of the financial impact measures by direct and indirect effect. The
output impact has the largest direct effect, followed by labor income, then value added.
Figure 36. Labor Income, Value Added, and Output Impact by Effect, 2008-2015 (2015$)
Additionally, the household spending of those new employees working on the renovation as well as those
working for the suppliers to renovation create an additional impact called the induced effect. This
represents 1,185 employees, $408 million in labor income, $711 million in value added, and $1.2 billion
in output as new employees’ spending on goods and services circulates the economy.
Looking ahead to the projects that have already received the OHPTC and will be working on rehabilitation
over the next five years, the data shows that in the direct and indirect effects there will be approximately
1,465 average annual employees, labor income of $406 million, value added impact of $505 million, and
output of $1.2 billion (Table 24).
$0
$500
$1,000
$1,500
$2,000
$2,500
$3,000
$3,500
$4,000
$4,500
Labor Income Value Added Output
Mill
ion
s o
f $
Indirect Effect
Direct Effect

Ohio Historic Preservation Tax Credit Economic Impact Study
Center for Economic Development, Cleveland State University Page 100
Table 24. Direct and Indirect Economic Impact of Construction, 2016-2020
Employment* 1,465
Payroll $405,653,261
Value Added $505,141,343
Output $1,187,307,184
*Average annual employment
Figure 37 shows the level of average annual employment for the thirteen years since the inception of the
OHPTC in 2008 through the end of current construction projections in 2020.129 Although projected
employment trails off in 2015, it is expected that additional projects will be certified and new projects will
be awarded the OHPTC, which will increase future employment.
Figure 37. Average Annual Employment for Construction, 2008-2020
Economic Impact of the OHPTC per Million Dollars
The OHPTC program must meet standards of historic preservation but also be a fiscally responsible
investment for the state. Considering 2014 operations of facilities that have completed rehabilitation, for
every $1 million the state invests in the OHPTC Program, the program yields $118,481 in labor income,
$105,257 in value added impact, and $230,528 in output impact (Table 25), as measured by direct and
129 The total employment in this table represents the direct and indirect employment only and does not include the household spending (induced effect).
0
1,000
2,000
3,000
4,000
5,000
6,000
7,000
8,000
2008 2009 2010 2011 2012 2013 2014 2015 2016 2017 2018 2019 2020
Direct Employment Projected Direct Employment
Total Employment Projected Total Employment

Ohio Historic Preservation Tax Credit Economic Impact Study
Center for Economic Development, Cleveland State University Page 101
indirect impacts. Similarly, for every employee working at one of the rehabilitated sites (one job
supported by the additional operations), 27% of one additional employee is generated in the state,130
along with an additional $113,858 in labor income, $218,354 in value added impact, and $195,001 in
output impact, accounting for direct and indirect impacts.131 Induced effect is not included in these
calculations.
Table 25. Operations Direct and Indirect Impact per Employee and per Dollar spent on OHPTC
Program, 2014
Employment Labor Income Value Added Output
Per $1 million Investment 0.27 $118,481 $105,257 $230,528
Per Employee 1.27 $113,858 $218,354 $195,001
For each $1 million that the state invested between 2008 and 2015 in terms of construction, the program
yielded $473,881 in labor income, $801,497 in value added impact, and $551,546 in output impact (Table
26) as measured by direct and indirect effects. Similarly, for each new employee at one of the
rehabilitated sites, an additional 70% of one employee is generated, as well as an additional $751,935 in
labor income, $936,350 in value added impact, and $2.2 million in output impact, accounting for direct
and indirect impacts. Induced effect is not included in these calculations.
Table 26. Construction Direct and Indirect Impact per Employee and per Dollar spent on OHPTC
Program, 2008-2015
Employment Labor Income Value Added Output
Per $1 million Investment 0.70 $473,881 $801,497 $551,546
Per Employee 1.70 $751,935 $936,350 $2,200,839
While noting the importance of preserving Ohio’s historic structures as part of the fabric of the state’s
cities and towns, it is also imperative to examine the fiscal benefits provided by such a sizeable public
investment. By allowing developers to close the gap in financing historic structures, this program allows
them to choose renovation in lieu of demolishing or ignoring historic elements. Additionally, the program,
as shown through this economic impact analysis, is a job and wealth generator for the state – creating
direct and indirect benefits of 12,214 permanent jobs and an annual average of 3,244 construction-related
jobs, while adding approximately $2.1 billion per year to the gross state product from the increased
operations at these sites and $1.8 billion from the renovation of projects since 2008.
130 An additional employee is a summation of the small fractions of employment generated across multiple sectors of the economy. 131 Detailed explanation of economic impact indicators is provided on page 52.

Ohio Historic Preservation Tax Credit Economic Impact Study
Center for Economic Development, Cleveland State University Page 102
APPENDICES
Appendix A. Literature References
Appendix B. Survey Questionnaire
Appendix C. Real Estate Property Data
Appendix Table C-1. Data for Project Parcels Used in Analyses
Appendix Table C-2 Taxable Market Value for Selected Years and Places, by Type
Appendix D. About the Study Team

Ohio Historic Preservation Tax Credit Economic Impact Study
Center for Economic Development, Cleveland State University Page 103
Appendix A: Literature References
Bowitz, Einar and Ibenholt, Karin. “Economic Impacts of Cultural Heritage – Research and Perspectives.”
Journal of Cultural Heritage 10.1 (January-March 2009): 1-8.
Clark, D.E. and Herrin, W.E. “Historical preservation and home sale prices: evidence from the
Sacramento housing market.” Journal of Real Estate Finance and Economics 27 (1997): 29-48.
Doyle, Gillian. “Why Culture Attracts and Resists Economic Analysis.” Journal of Cultural Economics 34
(2010): 245-259.
Glaeser, Edward. Triumph of the City: How Our Greatest Invention Makes Us Richer, Healthier, and
Happier. New York: Penguin Press, 2011.
Leichenko, R., Coulson, E. and Listokin, D. “Historic preservation and residential property values: an
analysis of Texas cities.” Urban Studies 38.11 (2001): 1973-1987.
Mason, Randall. “Be Interested and Beware: Joining Economic Valuation and Heritage Conservation.”
International Journal of Heritage Studies 14.4 (2008): 303-318.
Schaeffer, P.V. and Millerick, C.A. “The impact of historic district designation on property values: an
empirical study.” Economic Development Quarterly 5 (1991): 301-331.
Snowball, J.D. Measuring the Value of Culture: Methods and Examples in Cultural Economics. Berlin:
Springer, 2008.
Zahirovic-Herbert, Velma and Chatterjee, Swarn. “Historic Preservation and Residential Property Values:
Evidence from Quantile Regression.” Urban Studies 49.2 (2012): 369-382.

Ohio Historic Preservation Tax Credit Economic Impact Study
Center for Economic Development, Cleveland State University Page 104
Appendix B: Survey Questionnaire
Dear Ohio Historic Preservation Tax Credit Recipient: The Center for Economic Development (The Center) at Cleveland State University’s Levin College of Urban Affairs is conducting research to evaluate the economic impact and effectiveness of the Ohio Historic Preservation Tax Credit Program with funding provided by the Ohio Development Services Agency. On behalf of the Center and the Ohio Development Services Agency, we are asking you to participate in this confidential survey. The survey will take approximately 10-15 minutes of your time. All responses are strictly confidential and the data will be aggregated, so that no information can be attributed to an individual company. If you have any questions regarding the study or this survey, please contact Iryna V. Lendel (216-875-9967; [email protected]) at the Center for Economic Development, Maxine Goodman Levin College of Urban Affairs at Cleveland State University. Informed Consent Your participation in the study is voluntary. You may withdraw from the research and discontinue the survey at any time. All participants shall remain anonymous; no identified individual, business, or propitiatory information will be made public without his/her written permission. If you have any questions regarding your rights as a research subject, you may contact Cleveland State University’s Institutional Review Board at 216-687-3630. I have read and understand the consent form and agree to participate:132 A. Yes B. No
132 This is the only mandatory question of the survey. If participant says/clicks “No” then they will be transferred to the end of the survey.

Ohio Historic Preservation Tax Credit Economic Impact Study
Center for Economic Development, Cleveland State University Page 105
INTRO
1. What is the address of the Ohio Historic Preservation Tax Credit project that you were associated with?
a. Name b. Address c. City
PROJECT INFORMATION
2. Was the building in use within the last year before the redevelopment using the Ohio Historic
Preservation Tax Credit? a. Yes b. No
3. It is important to understand the use of the building BEFORE and in 2015. Please provide the
following information:
Please leave blank if not applicable
Building Information 1-Year before Rehabilitation
Building Information in 2015:
Building Use (Percentage)
Number of Employees
Total Revenue (Gross Receipts)
Building Use (Percentage)
Number of Employees
Total Revenue (Gross Receipts)
Retail
Hotel
Institutional
Residential
Office
Industrial
Vacant
Other
***If a respondent answers hotel or residential they are piped Q4; If a respondent answers retail they are piped Q5, If not, continue, to Q6 ****

Ohio Historic Preservation Tax Credit Economic Impact Study
Center for Economic Development, Cleveland State University Page 106
4. Since you indicated the building was/is used for residential and/or a hotel, could you please indicate the number of units and average annual occupancy rate.
Please leave blank if not applicable
Building Information 1-Year before Rehabilitation
Building Information in 2015:
Number of Units
Average Annual Occupancy rate
Number of Units
Average Annual Occupancy rate
Low-Income Residential
Market-rate Residential
Hotel
5. Since you indicated the building was/is used for retail, could you please indicate the type of retail at the property BEFORE rehabilitation and in 2015? Please leave blank if not applicable
Building Information 1-Year before Rehabilitation
Building Information in 2015
Groceries/Food
Pharmacy
Cigarettes
Liquor, Beer, & Wine
Household Items, cloth
Other ___________________
6. Please provide an estimate of the annual operating budget of the building in the year prior to redevelopment. $_______________________
7. Please provide an estimate of the value of the land and building in the year prior to re-development. $__________________
BANNER AT TOP OF EVERY PAGE IN SECTION: It is important for us to understand the building use during construction, please answer the following questions:
8. From breaking ground, how many years did it take you to complete the redevelopment? A: The building was under construction from to YEAR
YEAR

Ohio Historic Preservation Tax Credit Economic Impact Study
Center for Economic Development, Cleveland State University Page 107
9. What was the total cost of the redevelopment project? Please indicate costs per year. If you do not know the costs per year, please provide total redevelopment costs.
Year Cost
Year 1
Year 2
Year 3
Year 4
Year 5
Year 6
Year 7
Year 8
Year 9
Year 10
Total $____________________
BANNER AT TOP OF EVERY PAGE IN SECTION: It is important for us to understand the building use after construction was completed, please answer the following questions: 10. Please provide an estimate of the current annual operating budget of the building.
$__________________
11. Please provide an estimate of the current value of the land and building. $__________________
12. Do you know of any nearby development or redevelopment that occurred since the project for that property was completed? (open-ended)
TAX SECTION
13. Over how many years do you plan to claim (or did claim) your Ohio Historic Preservation Tax credit? A: FROM TO
14. On average, what amount will you /did you claim of the tax credit each year? $____________

Ohio Historic Preservation Tax Credit Economic Impact Study
Center for Economic Development, Cleveland State University Page 108
15. It is important for us to understand the money you spent on all phases of the Ohio Historic Preservation Tax project in order to evaluate it. Please indicate the resources you spent on compiling your application for the Ohio Historic Preservation Tax Credit and what portion, if any, were used to help compile your Federal Historic Preservation Tax Credit application. You can provide this information in dollars or hours spent on the application.
Spending location Ohio Historic Preservation Tax Credit Application
Resources shared with Federal Historic Preservation Tax Credit
INTERNAL TO THE COMPANY Dollar Amount Hours Percentage
Company Personnel
Copying, mailing, office materials
Application fee
EXTERNAL TO THE COMPANY Dollar Amount Hours Percentage
Historic preservation consultant(s)
Architect(s)
Legal council
Market analyst(s)
Accountant, tax, or financial advisor(s)
Photographer
Other________________
16. Without the Ohio Historic Preservation Tax credit, would this project have happened? Explain. RESPONDENT INFORMATION
17. Name 18. Title 19. Company Name 20. Ownership Structure of Company:
a. Sole proprietorship b. Partnership c. “S” Corporation d. “C” Corporation
21. Company sector: a. Nonprofit private b. For-profit c. Public

Ohio Historic Preservation Tax Credit Economic Impact Study
Center for Economic Development, Cleveland State University Page 109
Appendix C: Real Estate Property Data
Appendix Table C-1. Data for Project Parcels Used in Analyses
Project Project Name City
Taxable Market Value All Market Value* Taxes (Half Year)
Before Project
After Project Percent Change
Before Project After Project Percent Change
Before Project
After Project
Percent Change
ODSA-2013-02502 Ford Motor Company Cleveland Plant (Cleveland Institute of Art)
Cleveland $369,000 $385,800 4.6% $1,692,000 $17,601,900 940.3% $5,163 $6,795 31.6%
ODSA-2013-02503 William Taylor, Son, and Co. Department Store (668 Euclid)
Cleveland $3,941,100 $8,102,500 105.6% $3,941,100 $19,449,800 393.5% $55,386 $142,701 157.6%
ODSA-2013-02506 Second National Bank Building Hamilton $150,000 $150,000 0.0% $150,000 $1,422,930 848.6% $1,481 $1,667 12.5%
ODSA-2013-02515 Union Gospel Press Cleveland $1,260,600 $1,485,800 17.9% $1,260,600 $7,764,800 516.0% $993 $26,169 2534.4%
ODSA-2013-02516 Neal Terrace Apartments Cleveland $875,600 $517,300 -40.9% $875,600 $2,035,100 132.4% $12,249 $9,111 -25.6%
ODSA-2013-02517 Boulevard Terrace Apartments Cleveland $1,684,900 $1,561,200 -7.3% $1,684,900 $4,157,300 146.7% $23,570 $27,496 16.7%
ODSA-2013-02520 Hanna Building Complex Cleveland $3,416,600 $13,049,900 282.0% $16,178,100 $13,503,500 -16.5% $47,796 $232,806 387.1%
ODSA-2013-02521 Cogswell Hall Cleveland $324,700 $344,600 6.1% $324,700 $1,751,900 439.5% $4,563 $6,069 33.0%
ODSA-2013-02522 Capitol Theater Cleveland $1,991,400 $1,686,600 -15.3% $1,991,400 $1,821,400 -8.5% $27,987 $29,705 6.1%
ODSA-2013-02523 Fort Piqua Hotel Piqua $215,800 $227,400 5.4% $215,800 $5,804,000 2589.5% $1,918 $2,346 22.3%
ODSA-2013-02525 Erie Terminal Youngstown $465,890 $2,216,930 375.8% $465,890 $2,216,930 375.8% 0.0%
ODSA-2013-02526 Realty Building Youngstown $465,140 $1,618,830 248.0% $465,140 $1,618,830 248.0% 0.0%
ODSA-2013-02527 Higbee Building Cleveland $5,750,000 $113,963,900 1882.0% $5,750,000 $113,963,900 1882.0% $80,438 $2,007,129 2395.3%
ODSA-2013-02529 Andrew Jackson Residence Akron $184,560 $387,620 110.0% $184,560 $387,620 110.0% $1,851 $6,013 224.8%
ODSA-2013-02530 Seneca Hotel Columbus $1,500,000 $1,301,100 -13.3% $1,500,000 $1,301,100 -13.3% $17,478 $18,389 5.2%
ODSA-2013-02531 St. Luke's Hospital Cleveland $1,171,300 $918,300 -21.6% $1,171,300 $1,072,300 -8.5% $16,386 $16,173 -1.3%
ODSA-2013-02532 Cleveland Club / Tudor Arms Cleveland $0 $5,530,000 0.0% $500,000 $9,625,000 1825.0% $0 $97,395 0.0%
ODSA-2013-02533 Central National Bank/United Office Bldg
Cleveland $2,211,600 $2,422,000 9.5% $2,211,600 $2,422,000 9.5% $30,939 $42,656 37.9%
ODSA-2013-02534 Shawnee Hotel Springfield $1,908,650 $1,795,350 -5.9% $1,908,650 $1,795,350 -5.9% $20,450 $23,107 13.0%
ODSA-2013-02535 West Side YMCA Cleveland $1,093,600 $956,800 -12.5% $556,400 $3,732,400 570.8% $15,302 $13,891 -9.2%
ODSA-2013-02536 John T. Wilson Home and Farm Scott Township
$67,300 $177,800 164.2% $67,300 $177,800 164.2% $53 $893 1579.0%
ODSA-2013-02537 Golden Lamb Lebanon $570,570 $848,670 48.7% $570,570 $848,670 48.7% $4,801 $9,054 88.6%
ODSA-2013-02538 Arrow Apartments Cincinnati $73,700 $286,030 288.1% $73,700 $286,030 288.1% $903 $4,421 389.6%
ODSA-2013-02540 American Can Building Cincinnati $296,300 $14,485,440 4788.8% $296,300 $14,485,440 4788.8% $3,627 $223,000 6048.4%
ODSA-2013-02550 Westfalen Lofts Cincinnati $1,211,500 0.0% $1,211,500 0.0% $2,789 0.0%
ODSA-2013-02551 Saengerhalle Cincinnati $423,200 $2,665,670 529.9% $423,200 $2,665,670 529.9% $5,121 $6,158 20.3%
ODSA-2013-02552 1422 Pleasant Street Cincinnati $319,900 0.0% $319,900 0.0% $625 0.0%
ODSA-2013-02553 1411 Pleasant Street Cincinnati $409,790 0.0% $409,790 0.0% $816 0.0%
ODSA-2013-02554 Allerton Hotel Cleveland $3,337,800 $3,741,000 12.1% $3,337,800 $3,741,000 12.1% $46,693 $65,887 41.1%
ODSA-2013-02555 1346 Broadway Cincinnati $63,700 $364,590 472.4% $63,700 $364,590 472.4% $769 $1,564 103.5%
ODSA-2013-02556 Standart-Simmons Hardware Company
Toledo $575,000 $2,946,029 412.4% $575,000 $2,946,029 412.4% $7,545 $5,885 -22.0%
ODSA-2013-02559 ASM Headquarters and Geodesic Dome
Russell Township
0.0% $4,832,800 $5,585,600 15.6% $0 $0 0.0%
ODSA-2013-02560 Born Capital Brewery Bottle Works
Columbus $943,700 $950,000 0.7% $943,700 $950,000 0.7% $0 $48,054 0.0%
ODSA-2013-02561 Youngstown YWCA Youngstown $601,200 $885,470 47.3% $601,200 $885,470 47.3% 0.0%
ODSA-2013-02562 Kaiser Building Akron $365,000 $362,700 -0.6% $365,000 $362,700 -0.6% $4,824 $5,626 16.6%
ODSA-2013-02563 Apollo Theatre Oberlin $250,800 $1,706,460 580.4% $250,800 $1,706,460 580.4% 0.0%
ODSA-2013-02567 Berwick Hotel Apartments Cambridge $749,486 $723,480 -3.5% $749,486 $723,480 -3.5% $7,264 $7,779 7.1%
ODSA-2013-02572 Federal Reserve Building Cincinnati $3,764,600 $11,649,510 209.4% $3,764,600 $11,649,510 209.4% $53,774 $73,616 36.9%
ODSA-2013-02573 Metropole Building Cincinnati $6,250,000 $18,974,250 203.6% $6,250,000 $18,974,250 203.6% $52,759 $294,889 458.9%
ODSA-2013-02578 Federal Building Youngstown $147,300 $682,830 363.6% $147,300 $682,830 363.6% 0.0%
ODSA-2013-02579 University Tower Apartments Cleveland $2,195,400 $2,281,300 3.9% $2,195,400 $3,856,800 75.7% $31,174 $40,178 28.9%
ODSA-2013-02583 Union Building Cleveland $2,206,900 $4,834,000 119.0% $2,206,900 $4,834,000 119.0% $31,309 $85,136 171.9%

Ohio Historic Preservation Tax Credit Economic Impact Study
Center for Economic Development, Cleveland State University Page 110
Project Project Name City
Taxable Market Value All Market Value* Taxes (Half Year)
Before Project
After Project Percent Change
Before Project After Project Percent Change
Before Project
After Project
Percent Change
ODSA-2013-02585 East Ohio Gas/Rockwell Building Cleveland $2,375,000 $16,035,900 575.2% $2,375,000 $16,035,900 575.2% $33,694 $282,424 738.2%
ODSA-2013-02590 Stuyvesant Hall Delaware 0.0% $7,801,200 $1,418,200 -81.8% $0 $0 0.0%
ODSA-2013-02594 Haddon Hall Apartments Cincinnati $1,539,790 $4,720,000 206.5% $1,539,790 $4,720,000 206.5% $21,572 $72,690 237.0%
ODSA-2013-02596 15th and Republic Cincinnati $248,670 $605,440 143.5% $248,670 $605,440 143.5% $5,725 $8,484 48.2%
ODSA-2013-02600 Gifford House and Carriage House Cleveland $150,000 $325,000 116.7% $150,000 $325,000 116.7% $2,130 $5,724 168.7%
ODSA-2013-02605 Rialto Theater Cleveland $225,200 $1,025,000 355.2% $225,200 $1,025,000 355.2% $3,198 $18,053 464.5%
ODSA-2013-02607 Vincent Tower Cleveland $12,517,600 $15,000,000 19.8% $12,517,600 $18,995,400 51.7% $160,132
$264,180 65.0%
ODSA-2013-02608 Yankee Trader Building Columbus $377,300 $377,300 0.0% $377,300 $377,300 0.0% $5,185 $32,366 524.2%
ODSA-2013-02618 Bodenheimer-Mayer House Lancaster $113,990 $123,490 8.3% $113,990 $123,490 8.3% $734 $961 30.9%
ODSA-2013-02633 Ohio Theatre Toledo 0.0% $537,629 $70,200 -86.9% $7,478 $1,165 -84.4%
ODSA-2013-02662 Clione Bailey House Westerville $99,100 $106,700 7.7% $99,100 $106,700 7.7% $1,407 $1,640 16.5%
ODSA-Mega1 BW Conserv. Music, Beech St. Residence Halls
Berea $3,790,100 $7,445,000 96.4% $5,438,500 $9,455,100 73.9% $54,213 $118,150 117.9%
ODSA-Mega10 Sunshine Cloak Bldg., M.T. Silver Bldg.
Cleveland $936,400 $2,502,600 167.3% $936,400 $2,502,600 167.3% $13,160 $44,076 234.9%
ODSA-Mega15 Scott A. Rogers Bldg., Liberty Bldg. Cleveland $726,000 $1,412,000 94.5% $726,000 $2,628,600 262.1% $10,204 $24,868 143.7%
ODSA-Mega2 McCrory, Kresge, Petrie Plus Bldgs.
Cleveland $2,715,200 $3,583,700 32.0% $2,715,200 $6,333,800 133.3% $37,984 $63,116 66.2%
ODSA-Mega3 Cowell & Hubbard, Woolworth, Middough
Cleveland $2,647,200 $3,122,300 17.9% $2,647,200 $3,122,300 17.9% $37,289 $54,990 47.5%
ODSA-Mega8 1405-1409, 1411, 1413, 1417, 1419 Vine St., Cincinnati Color Bldg.
Cincinnati $296,830 $3,129,930 954.5% $296,830 $3,129,930 954.5% $1,366 $18,096 1224.6%
* "All Market Value" includes exempt value, where it was possible to extract it
[a] The following projects were consolidated into one for the purpose of analysis: 02575 and 02624
[b] The following projects were consolidated into one for the purpose of analysis: 02500 and 02501
[c] The following projects were consolidated into one for the purpose of analysis: 02519 and 02557
[d] The following projects were consolidated into one for the purpose of analysis: 02541, 02542, and 02543
[e] The following projects were consolidated into one for the purpose of analysis: 02566, 02587, and 02588
[f] The following projects were consolidated into one for the purpose of analysis: 02545, 02546, 02547, 02548, 02549, 2569
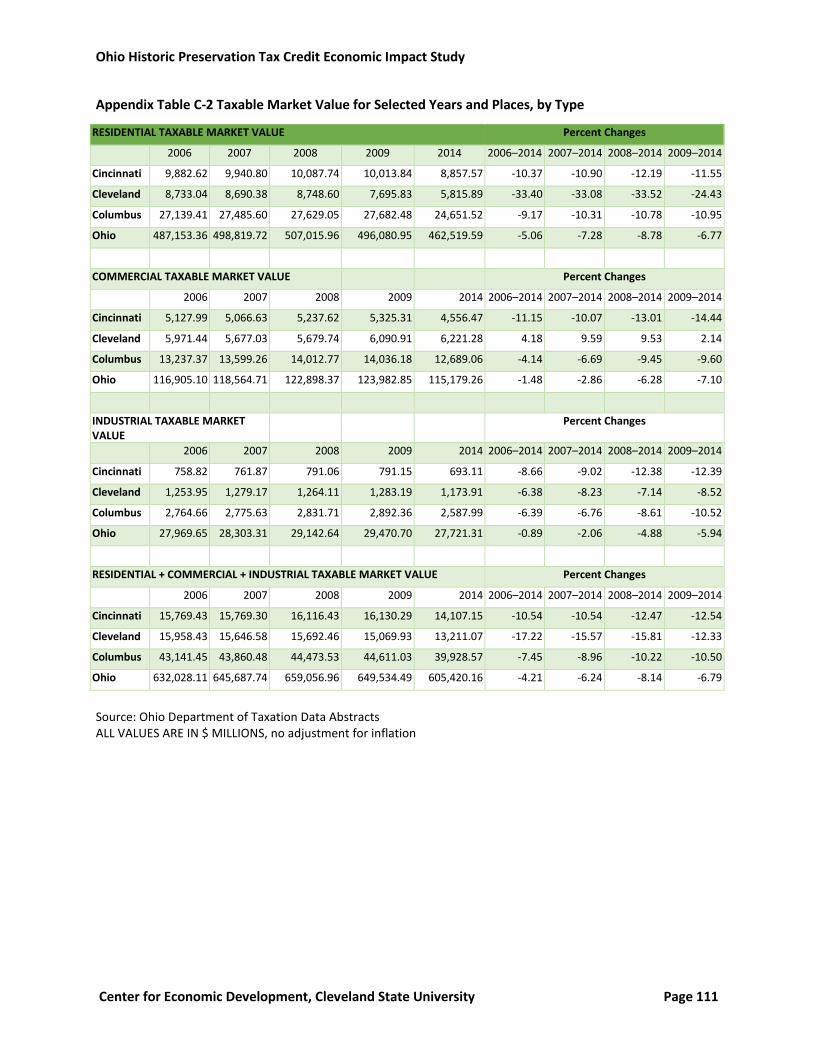
Ohio Historic Preservation Tax Credit Economic Impact Study
Center for Economic Development, Cleveland State University Page 111
Appendix Table C-2 Taxable Market Value for Selected Years and Places, by Type
RESIDENTIAL TAXABLE MARKET VALUE Percent Changes
2006 2007 2008 2009 2014 2006–2014 2007–2014 2008–2014 2009–2014
Cincinnati 9,882.62 9,940.80 10,087.74 10,013.84 8,857.57 -10.37 -10.90 -12.19 -11.55
Cleveland 8,733.04 8,690.38 8,748.60 7,695.83 5,815.89 -33.40 -33.08 -33.52 -24.43
Columbus 27,139.41 27,485.60 27,629.05 27,682.48 24,651.52 -9.17 -10.31 -10.78 -10.95
Ohio 487,153.36 498,819.72 507,015.96 496,080.95 462,519.59 -5.06 -7.28 -8.78 -6.77
COMMERCIAL TAXABLE MARKET VALUE Percent Changes
2006 2007 2008 2009 2014 2006–2014 2007–2014 2008–2014 2009–2014
Cincinnati 5,127.99 5,066.63 5,237.62 5,325.31 4,556.47 -11.15 -10.07 -13.01 -14.44
Cleveland 5,971.44 5,677.03 5,679.74 6,090.91 6,221.28 4.18 9.59 9.53 2.14
Columbus 13,237.37 13,599.26 14,012.77 14,036.18 12,689.06 -4.14 -6.69 -9.45 -9.60
Ohio 116,905.10 118,564.71 122,898.37 123,982.85 115,179.26 -1.48 -2.86 -6.28 -7.10
INDUSTRIAL TAXABLE MARKET VALUE
Percent Changes
2006 2007 2008 2009 2014 2006–2014 2007–2014 2008–2014 2009–2014
Cincinnati 758.82 761.87 791.06 791.15 693.11 -8.66 -9.02 -12.38 -12.39
Cleveland 1,253.95 1,279.17 1,264.11 1,283.19 1,173.91 -6.38 -8.23 -7.14 -8.52
Columbus 2,764.66 2,775.63 2,831.71 2,892.36 2,587.99 -6.39 -6.76 -8.61 -10.52
Ohio 27,969.65 28,303.31 29,142.64 29,470.70 27,721.31 -0.89 -2.06 -4.88 -5.94
RESIDENTIAL + COMMERCIAL + INDUSTRIAL TAXABLE MARKET VALUE Percent Changes
2006 2007 2008 2009 2014 2006–2014 2007–2014 2008–2014 2009–2014
Cincinnati 15,769.43 15,769.30 16,116.43 16,130.29 14,107.15 -10.54 -10.54 -12.47 -12.54
Cleveland 15,958.43 15,646.58 15,692.46 15,069.93 13,211.07 -17.22 -15.57 -15.81 -12.33
Columbus 43,141.45 43,860.48 44,473.53 44,611.03 39,928.57 -7.45 -8.96 -10.22 -10.50
Ohio 632,028.11 645,687.74 659,056.96 649,534.49 605,420.16 -4.21 -6.24 -8.14 -6.79
Source: Ohio Department of Taxation Data Abstracts ALL VALUES ARE IN $ MILLIONS, no adjustment for inflation

Ohio Historic Preservation Tax Credit Economic Impact Study
Center for Economic Development, Cleveland State University Page 112
Appendix D: About the Study Team
Iryna V. Lendel
Iryna Lendel is Research Associate Professor of Economic Development and Assistant Director of the
Center for Economic Development at the Maxine Goodman Levin College of Urban Affairs at Cleveland
State University. Dr. Lendel was the principal investigator for this project and developed the overall
framework and methodologies for research components of the project. Lendel managed the team of
researchers and participated in each phase of the project. Dr. Lendel is an economist with 20 years of
experience conducting applied economic research and analyzing regional and urban economic
development. Her research portfolio includes projects on industry analyses; state and regional science
and innovation policies; university products; and high-tech, emerging, and creative industries and their
role in economic development. Dr. Lendel also writes on energy policy and is affiliated with the Energy
Policy Center at the Urban College. Dr. Lendel earned a Ph.D. in Economic Development from the
Cleveland State University and a Ph.D. in Economics from the Lviv Regional Institute of Ukrainian Academy
of Science.
Candice Clouse
Candice Clouse is the Program Manager in the Center for Economic Development at the Maxine Goodman
Levin College of Urban Affairs at Cleveland State University. Ms. Clouse was the primary researcher for
the economic impact analysis. She also participated in creating case studies and developing methodology
for data estimation. Her areas of expertise are regional and urban economic development, economic
impact analysis, industry analysis, and place image. Ms. Clouse is a Ph.D. candidate in Urban Studies with
a concentration in economic development.
Ellen Cyran
Ellen Cyran is a senior programmer/analyst for the Center for Economic Development at the Maxine
Goodman Levin College of Urban Affairs at Cleveland State University. She received a M.S. in Mathematics
from Cleveland State University and a B.S. in Computer Science from Bowling Green State University. Ms.
Cyran has experience in conducting research using regression analysis, creating population projections
and economic trends, database programming and design, Geographic Information Systems (GIS), and
system administration.
Tatyana Guzman
Tatyana Guzman is an Assistant Professor of Government Finance and Policy Analysis in the Levin College
of Urban Affairs in Cleveland State University (CSU). She has taught classes in Public Finance, Budgeting,
Statistics, Research Methods, and Economics at Indiana University Bloomington, Indiana University –
Purdue University Indianapolis, and CSU. Tatyana's primary research interests are in municipal finance,
personal income tax, and higher and secondary education finance. Her works have been published in
Public Budgeting and Finance, Policy Studies Journal, Tax Notes, and other outlets.

Ohio Historic Preservation Tax Credit Economic Impact Study
Center for Economic Development, Cleveland State University Page 113
Merissa Piazza
Merissa C. Piazza is a Research Associate for the Center for Economic Development at the Maxine
Goodman Levin College of Urban Affairs at Cleveland State University. She specializes in economic
development, methodology, workforce development, and entrepreneurship. Ms. Piazza played a
significant role in all elements of the case studies, including methodology design, conducting interviews,
data collection, and drafting reports. She was also involved with all elements of the design, measurement,
collection, and analysis of the Ohio Historic Preservation Tax Credit Program Survey. In addition to
working full time for the Center, she is a doctoral candidate in Urban Studies and Public Policy specializing
in entrepreneurship and public policy.
Stephanie Ryberg-Webster
Stephanie Ryberg-Webster is an Assistant Professor of Urban Studies in the Levin College of Urban Affairs
at Cleveland State University. Her research broadly explores the intersections of historic preservation and
urban development, with current projects addressing: preservation in post-industrial, legacy cities;
synergies and tensions between preservation and community development; federal and state historic
rehabilitation tax credits; the preservation of Cleveland's African American heritage; and this history of
historic preservation in Cleveland. Dr. Ryberg-Webster earned a Ph.D. from the University of Pennsylvania
in 2010 and holds a Master of Historic Preservation from the University of Maryland and a Bachelor of
Urban Planning from the University of Cincinnati.
Charlie Post
Charlie Post has been a Project Manager/Research Associate in the Levin College since 1992. Charlie
provides computer programming and data analysis related to the various facets of urban and regional
policy. He cleans, assembles, and analyzes the Cuyahoga County Fiscal Office data files, which allow for
the parcel-level tracking of sales and market values, tax assessments, and delinquencies, among many
other real property characteristics variables. Charlie earned a B.A. in Economics and Math from Earlham
College, an M.A. in Economics from Washington University, and an M.S. in Public Policy and Management
from Carnegie-Mellon University.
Kenneth Kalynchuk
Kenneth Kalynchuk is a research assistant at the Center for Economic Development in the Maxine Levin
Goodman College of Urban Affairs at Cleveland State University. He holds a degree in Urban & Regional
Studies from Cornell University, where his research focused on neighborhood identity and international
development. Ken was involved in research on case studies, employment and demographics. His previous
work experience is centered on community engagement in Cleveland and Portland, Oregon. Kenneth is
currently enrolled in the Masters of Urban Planning and Development at Cleveland State University,
where he is concentrating in real estate development.
The research team appreciates extensive data support provided by graduate assistants from the Center
for Economic Development, Bryan Townley and Jinhee Yun.