offshoring, terms of trade and the measurement of u.s ...iiep/waits/documents/mandel-off...these...
TRANSCRIPT
Offshoring, Terms of Trade and the Measurement of U.S. Productivity Growth
Benjamin R. Mandel Federal Reserve Board of Governors
Based on: “Offshoring Bias in U.S. Manufacturing: Implications for Productivity and Value
Added” (w/ Susan Houseman, Christopher J. Kurz, and Paul Lengermann).
“Effects of Terms of Trade Gains and Tariff Changes on the Measurement of U.S. Productivity Growth” (w/ Robert C. Feenstra, Marshall B. Reinsdorf and Matthew J. Slaughter), and
The views expressed in this paper are those of the authors, not those of the Board of Governors of the Federal
Reserve System or the Bureau of Economic analysis.

The Role of Economic Research at the Federal Reserve
1. Policy relevance
2. Expertise in a part of the U.S. or global economy
3. Credibility of monetary policy

I. Motivation:
1. Acceleration in U.S. productivity growth after 1995, simultaneous with a major
improvement in the U.S. terms of trade
95
100
105
110
115
120
Figure 1: U.S. Terms of Trade and Productivity
BLS Laspeyres Productivity
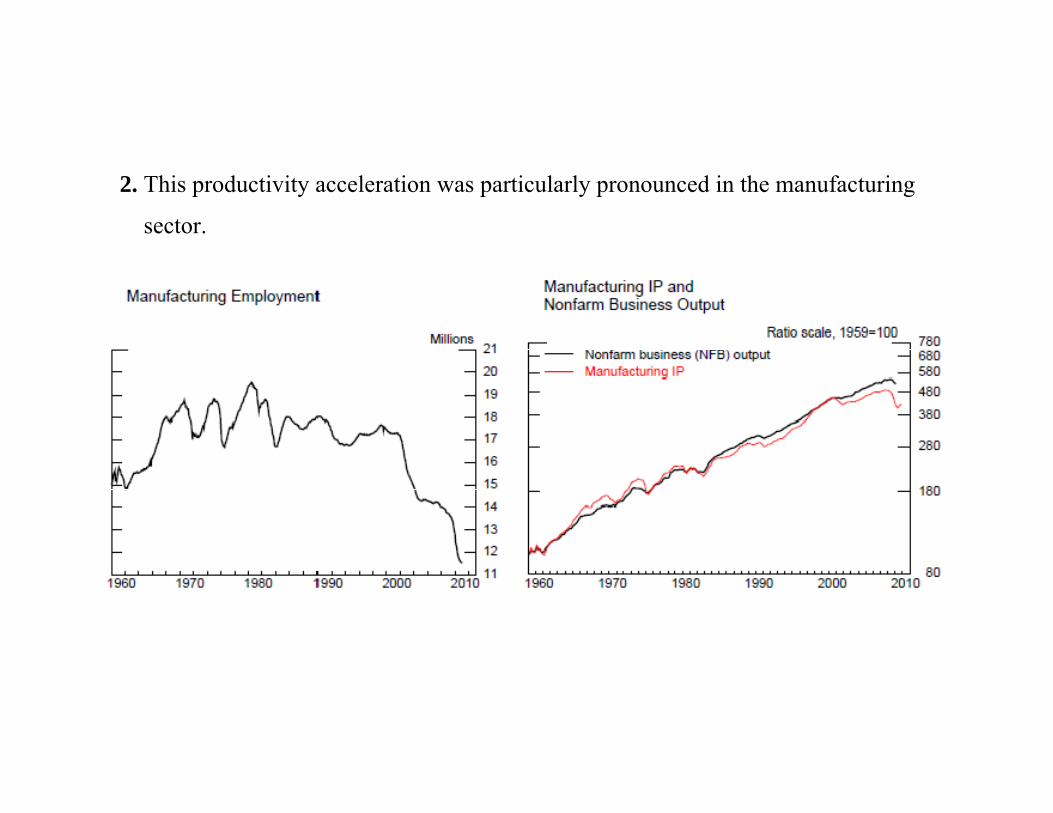
2. This productivity acceleration was particularly pronounced in the manufacturing
sector.
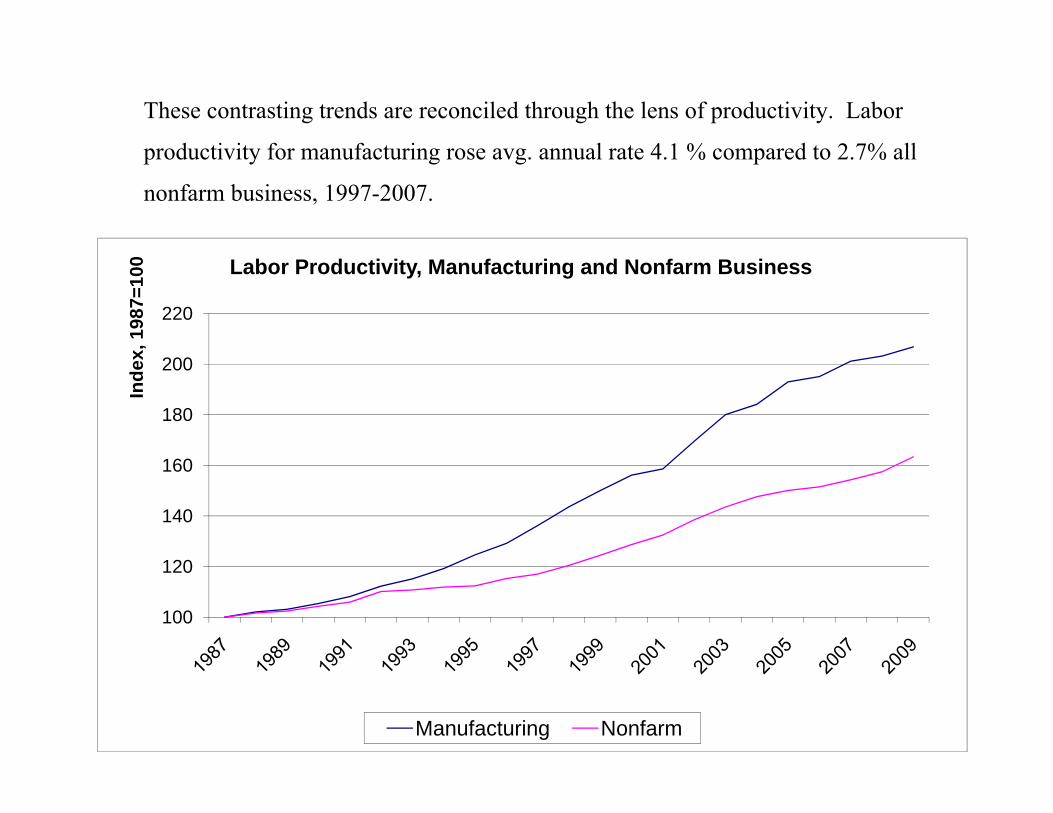
These contrasting trends are reconciled through the lens of productivity. Labor
productivity for manufacturing rose avg. annual rate 4.1 % compared to 2.7% all
nonfarm business, 1997-2007.
100
120
140
160
180
200
220
Inde
x, 1
987=
100 Labor Productivity, Manufacturing and Nonfarm Business
Manufacturing Nonfarm

3. But in suggesting a link between the terms of trade and productivity, we need to
recognize that in theory, improvement the terms of trade do not have a first-order
impact on value added or productivity when tariffs are small (e.g., Kehoe and Ruhl,
2007)
Intuition: terms of trade affect both real output and real inputs in an offsetting
manner, thus terms of trade effects do not have a large impact on real value
added.
4. We illustrate the terms of trade – productivity link in two ways:
In theory, real value added measures are affected by trade prices in the presence
of ad valorem tariffs. We will extend Kehoe-Ruhl to a multi-sector setting and
show this result.
What about if the terms of trade are mismeasured due to index number issues?
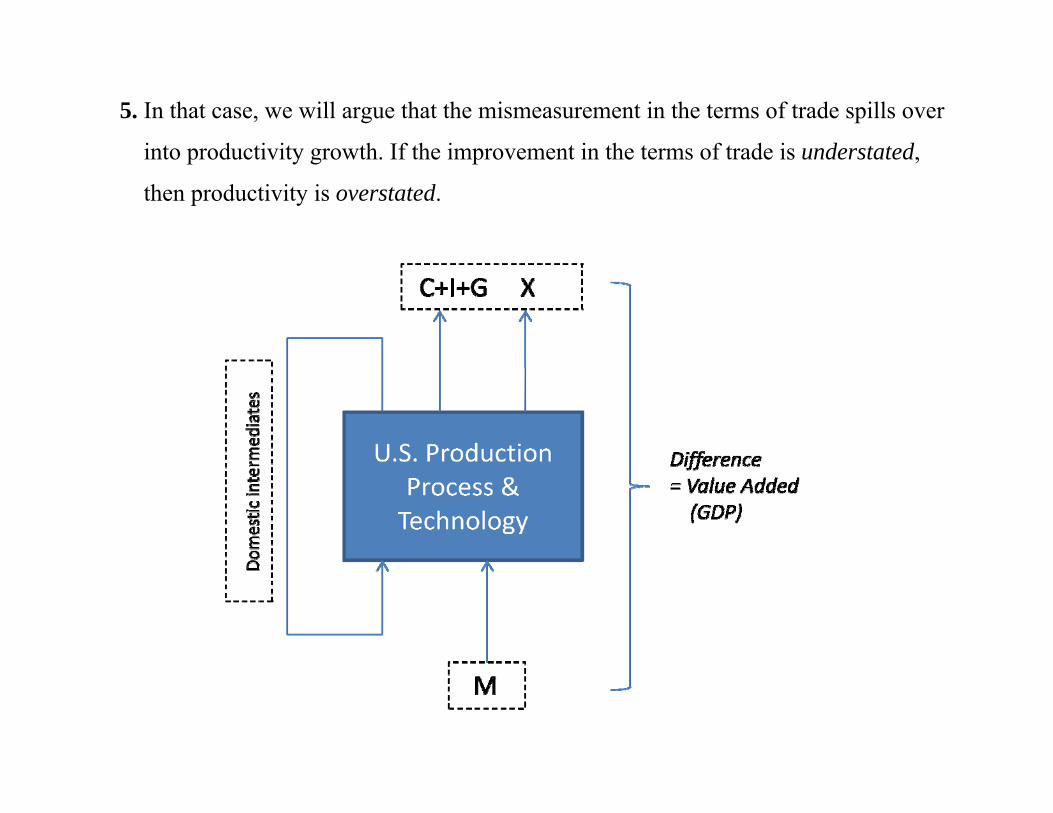
5. In that case, we will argue that the mismeasurement in the terms of trade spills over
into productivity growth. If the improvement in the terms of trade is understated,
then productivity is overstated.

That is suggested by e.g. Michael Mandel, “The Real Cost of Offshoring.” Business
Week, June 18, 2007.

6. Indeed, part of the reason that manufacturing employment is declining is the
substitution of foreign-made inputs for those previously produced domestically.
0
0.05
0.1
0.15
0.2
0.25
0
0.05
0.1
0.15
0.2
0.25
1997 1998 1999 2000 2001 2002 2003 2004 2005 2006 2007
The Import Share of Materials Inputs Used by U.S. Manufacturers
Advanced
Intermediate
Developing

7. One might expect that these large increases in foreign input shares corresponded to
decreases in the relative price of imported intermediates, but official statistics
actually indicate the opposite.
0.8
0.9
1
1.1
1.2
1.3
1.4
1.5
1997 1998 1999 2000 2001 2002 2003 2004 2005 2006 2007
Purchased Materials Price Deflators for Manufacturing
Import
Total
Domestic
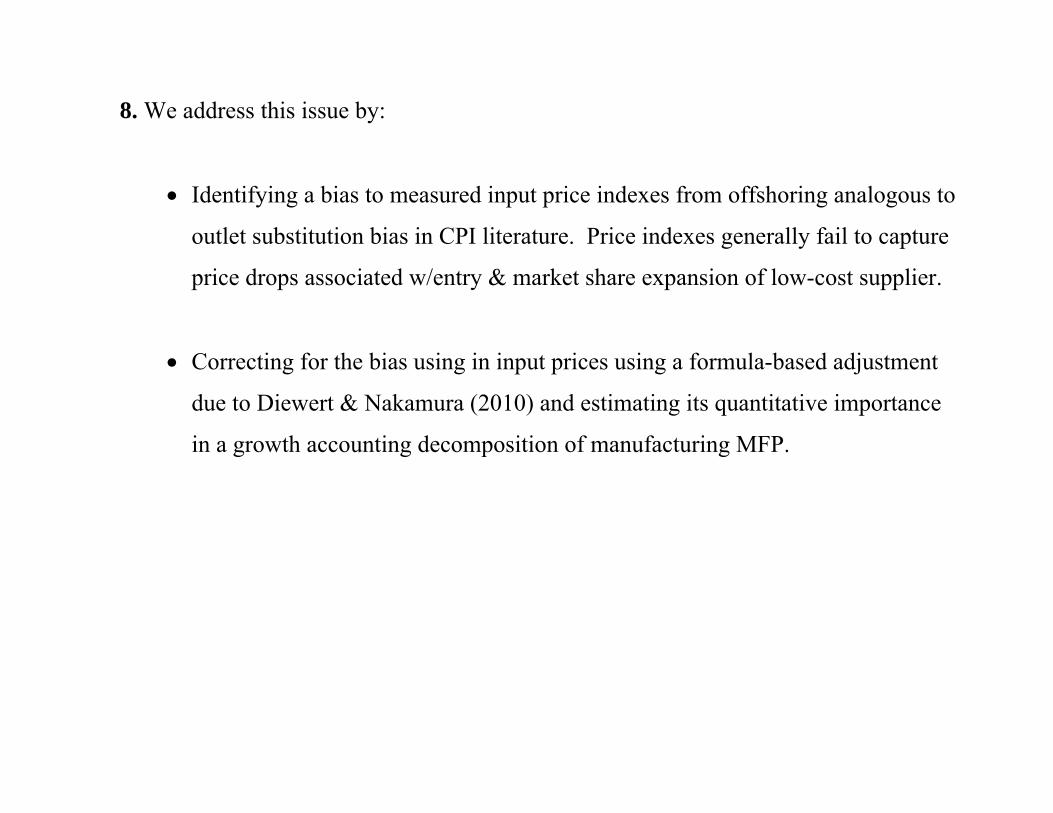
8. We address this issue by:
Identifying a bias to measured input price indexes from offshoring analogous to
outlet substitution bias in CPI literature. Price indexes generally fail to capture
price drops associated w/entry & market share expansion of low-cost supplier.
Correcting for the bias using in input prices using a formula-based adjustment
due to Diewert & Nakamura (2010) and estimating its quantitative importance
in a growth accounting decomposition of manufacturing MFP.

Conclusions:
The growth rates of our alternative materials input price indexes are as much as
1 ppt. per year lower than the growth rate of official statistics.
This mismeasurement can account for about 0.3 ppt. per year, or about 15% of the
annual value added growth for the U.S. manufacturing sector over the past decade.
Broader Implications
More balanced view of the performance of the U.S. manufacturing sector.
o “Lean and productive” vs. “hollowed out”
International trade is more important in driving the U.S. economy than official
statistics suggest.
Measurement errors in import prices are themselves a byproduct of globalization.

Illustration of ‘offshoring bias’: The matched model index computes price changes
for the same item in two adjacent periods. Since t-1 is unobserved from the
perspective of IPP, the entering item is not included in (‘linked out of’) the index in
its initial period.
The level difference between exiting items in the PPI and entering items in the IPP
is not observed.

Example of ‘offshoring bias’:
t t+1 t+2 t+3
Domestic supplier price $10.00 $10.00 $10.00 $10.00Domestic quantity sold 100 90 80 70
Chinese supplier price $6.00 $6.00 $6.00 $6.00Chinese quantity sold 0 10 20 30
Average price paid for obtanium $10.00 $9.60 $9.20 $8.80
Domestic input price index 100 100 100 100Import input price index ─ 100 100 100Input index, as computed 100 100 100 100
True input price index 100 96 92 88
Hypothetical Offshoring of Obtanium

Bias to input price index at elemental level from shifts in sourcing (Diewert and
Nakamura, 2009):
Bias ≈ (1 + i)* s*d
Where i is the rate of price increase, s is share captured by new, low-cost supplier,
and d is percent discount of the low-cost supplier (foreign) relative to the high-cost
(domestic) supplier
Characterization of bias to input price from offshoring identical to that of bias to CPI
from outlet substitution (Diewert 1998)

Evidence of shifting shares (s):
-0.6
-0.5
-0.4
-0.3
-0.2
-0.1
0
0.1
-0.1 0 0.1 0.2 0.3 0.4 0.5 0.6
Cha
nge
in D
omes
tic In
put S
hare
(97-
07)
Change in Combined Developing & Intermediate Country Input Share (97-07)
Developing & intermediate share increasing at the
expense of domestic and advanced
Developing, intermediate & advanced share increasing at the
expense of domestic

Evidence of the offshoring discount (d):
o Method 1 - Full Sample IPP Microdata: The import price discount for an individual item in the developing set is defined as:
Discount aggregated further using IPP item- and establishment-level weights
-100
-50
050
100
Dis
coun
t Rel
ativ
e to
Adv
ance
d (%
)
3100
3110
3120
3130
3140
3150
3160
3170
3180
3190
3200
3210
3220
3230
3240
3250
3260
3270
3280
3290
3300
3310
3320
3330
3340
3350
3360
3370
3380
3390
3400
NAICS P roduct Code
Intermediate Developing
Percent Discounts, Weighted by Change in Quantity Shares

Evidence of the offshoring discount (d), cont’d:
o Method 2 - Switching Sample: A closer empirical counterpart to the decision of U.S. producers to offshore is the
decision of U.S. importing firms to switch among foreign source countries
Controls for cross-firm variation in import composition
Developing Intermediate AdvancedDeveloping 3% 4% -44%N 391 315 182Intermediate 18% -2% -28%N 192 118 164Advanced 43% 35% 23%N 163 175 367
1993-2007INCUMBENT
NEW

Evidence of the offshoring discount (d), cont’d:
o Method 3 - Full Sample: Adjusted Estimates
Estimate degree of unobserved compositional differences driving relative prices
Products with a high correlation of price skewness and firm size skewness are classified
as high quality scope industries (Mandel, 2010)
Intuition:
Implementation:

Evidence of the offshoring discount (d), cont’d:
o Unadjusted Full Sample
63% for developing
58% for intermediate
o Switching Estimates
44% for developing
28% for intermediate
o Adjusted Full Sample
25% for developing
14% for intermediate
o Industry case studies:
Country Industry/productDiscount off
U.S. Source NAICS Unadjusted Firm-LevelQuality-Adjusted
Electronic Equipment 20, 60, 60 McKinsey (2006)
334: Computer and Electronic Product
Manufacturing73 38 18
Semiconductors 40 Byrne, Kovak, and Michaels (2009)
Circuit Boards 40-50General Manufactured Products
30-50, sometimes
higher 31-33: Manufacturing 60 35 13
Aluminum Wheels19 (36% on processing
costs)
Klier and Rubenstein (2009)
Auto Parts 20-30 Kennedy (2004)
Singapore Semiconductors 24 Byrne, Kovak, and Michaels (2009)
334: Semiconductor and Other Electronic
Components72 40 34
-60
Business Week (2004)
Inte
rmed
iate Mexico 3361: Motor Vehicle
Manufacturing 34 26
Case Study Estimates Estimates using IPP Data
Dev
elop
ing
China3344: Semiconductor and Other Electronic
Components82 54 47

Bias-Corrected Intermediate Input Cost Inflation
Manufacturing
Food & beverage
Textile mills
Apparel
Wood products
Paper
Printing
Chemicals
Plastics and rubber
Non metallicminerals
Primarymetals
Fabricated metalproducts
Machinery Electrical equipment
Motor vehiclesOther transportationFurniture
Miscellaneous
-0.1
0
0.1
0.2
0.3
0.4
0.5
0.6
0 0.1 0.2 0.3 0.4 0.5 0.6Bia
s-C
orre
cted
Inte
rmed
iate
Inpu
t Cos
t Inf
latio
n (9
7-07
)
Intermediate Input Cost Inflation (97-07)