offshore wind operational report - thecrownestate.co.uk · uk offshore wind generated over 20.8 twh...
TRANSCRIPT
Offshore wind operational report January – December 2017
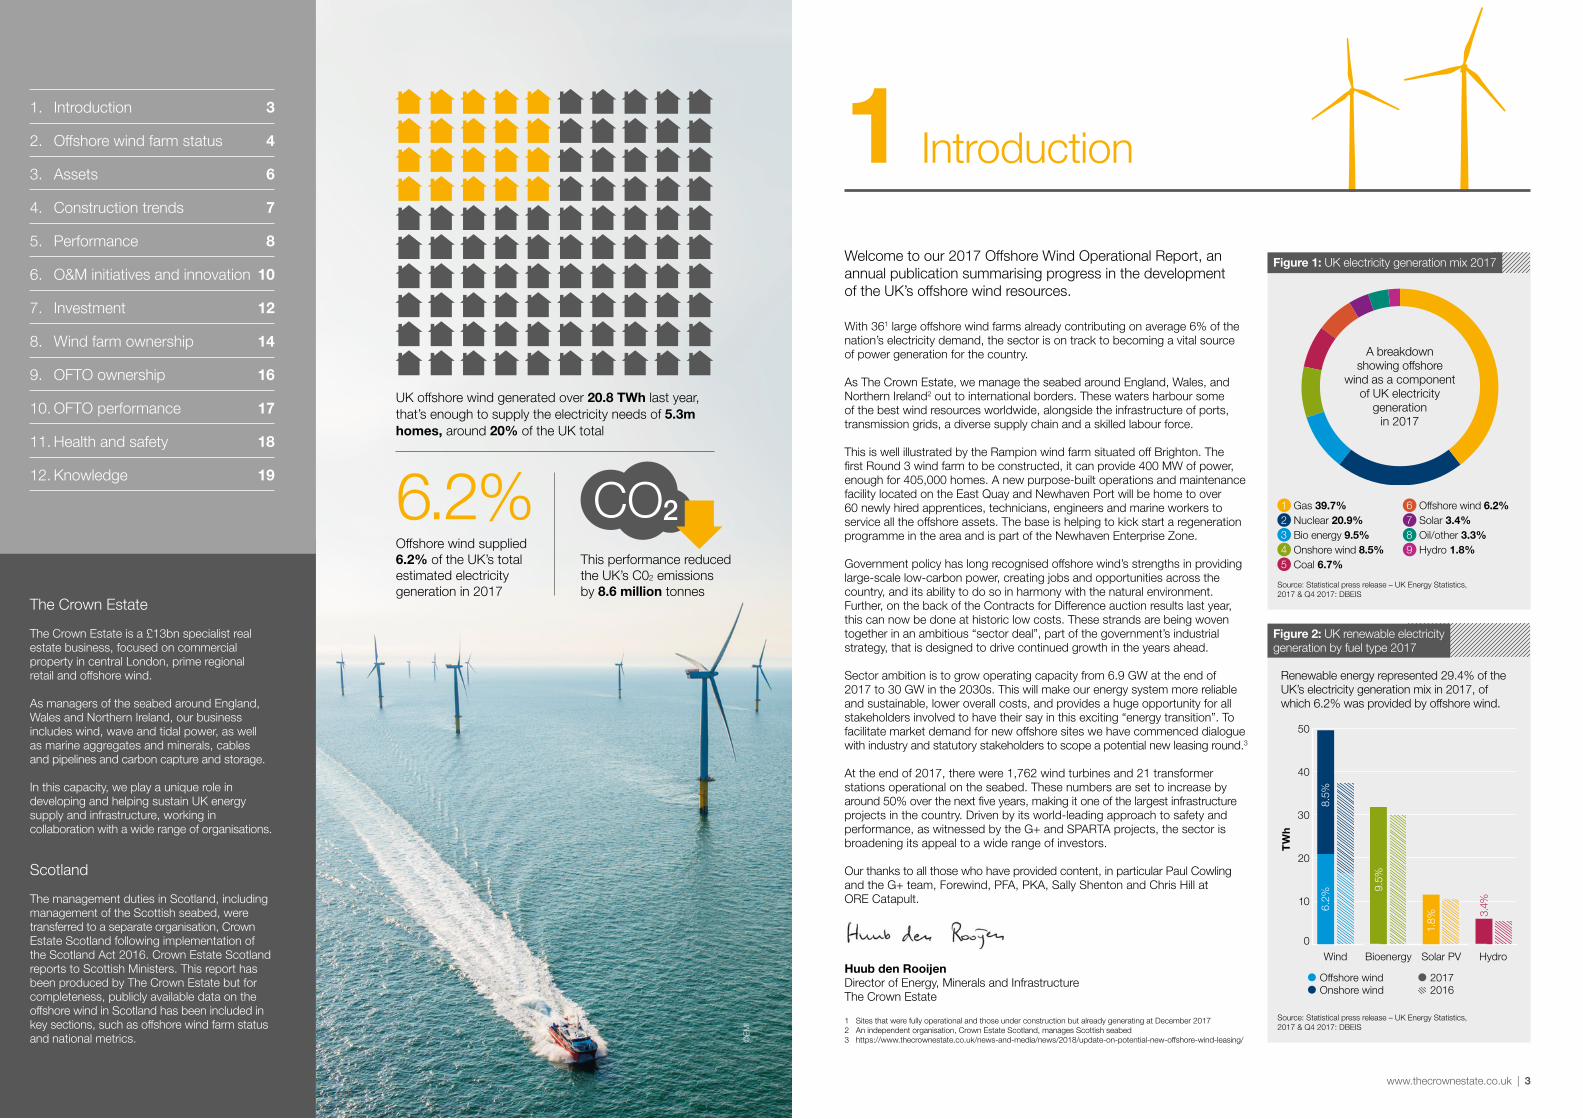
Welcome to our 2017 Offshore Wind Operational Report, an annual publication summarising progress in the development of the UK’s offshore wind resources.
With 361 large offshore wind farms already contributing on average 6% of the nation’s electricity demand, the sector is on track to becoming a vital source of power generation for the country.
As The Crown Estate, we manage the seabed around England, Wales, and Northern Ireland2 out to international borders. These waters harbour some of the best wind resources worldwide, alongside the infrastructure of ports, transmission grids, a diverse supply chain and a skilled labour force.
This is well illustrated by the Rampion wind farm situated off Brighton. The first Round 3 wind farm to be constructed, it can provide 400 MW of power, enough for 405,000 homes. A new purpose-built operations and maintenance facility located on the East Quay and Newhaven Port will be home to over 60 newly hired apprentices, technicians, engineers and marine workers to service all the offshore assets. The base is helping to kick start a regeneration programme in the area and is part of the Newhaven Enterprise Zone.
Government policy has long recognised offshore wind’s strengths in providing large-scale low-carbon power, creating jobs and opportunities across the country, and its ability to do so in harmony with the natural environment. Further, on the back of the Contracts for Difference auction results last year, this can now be done at historic low costs. These strands are being woven together in an ambitious “sector deal”, part of the government’s industrial strategy, that is designed to drive continued growth in the years ahead.
Sector ambition is to grow operating capacity from 6.9 GW at the end of 2017 to 30 GW in the 2030s. This will make our energy system more reliable and sustainable, lower overall costs, and provides a huge opportunity for all stakeholders involved to have their say in this exciting “energy transition”. To facilitate market demand for new offshore sites we have commenced dialogue with industry and statutory stakeholders to scope a potential new leasing round.3
At the end of 2017, there were 1,762 wind turbines and 21 transformer stations operational on the seabed. These numbers are set to increase by around 50% over the next five years, making it one of the largest infrastructure projects in the country. Driven by its world-leading approach to safety and performance, as witnessed by the G+ and SPARTA projects, the sector is broadening its appeal to a wide range of investors.
Our thanks to all those who have provided content, in particular Paul Cowling and the G+ team, Forewind, PFA, PKA, Sally Shenton and Chris Hill at ORE Catapult.
Huub den RooijenDirector of Energy, Minerals and Infrastructure The Crown Estate
0
10
20
30
40
50
8.5%
6.2%
9.5%
1.8%
3.4%
Wind Bioenergy HydroSolar PV
TW
h
Offshore windOnshore wind
20172016
1 Gas 39.7%2 Nuclear 20.9%3 Bio energy 9.5%4 Onshore wind 8.5%5 Coal 6.7%
6 Offshore wind 6.2%7 Solar 3.4%8 Oil/other 3.3%9 Hydro 1.8%
Introduction1
A breakdown showing offshore
wind as a component of UK electricity
generation in 2017
1 Sites that were fully operational and those under construction but already generating at December 20172 An independent organisation, Crown Estate Scotland, manages Scottish seabed3 https://www.thecrownestate.co.uk/news-and-media/news/2018/update-on-potential-new-offshore-wind-leasing/
Source: Statistical press release – UK Energy Statistics, 2017 & Q4 2017: DBEIS
Source: Statistical press release – UK Energy Statistics, 2017 & Q4 2017: DBEIS
Figure 1: UK electricity generation mix 2017
Figure 2: UK renewable electricity generation by fuel type 2017
Renewable energy represented 29.4% of the UK’s electricity generation mix in 2017, of which 6.2% was provided by offshore wind.
©E
MI
6.2% CO2Offshore wind supplied 6.2% of the UK’s total estimated electricity generation in 2017
This performance reduced the UK’s C02 emissions by 8.6 million tonnes
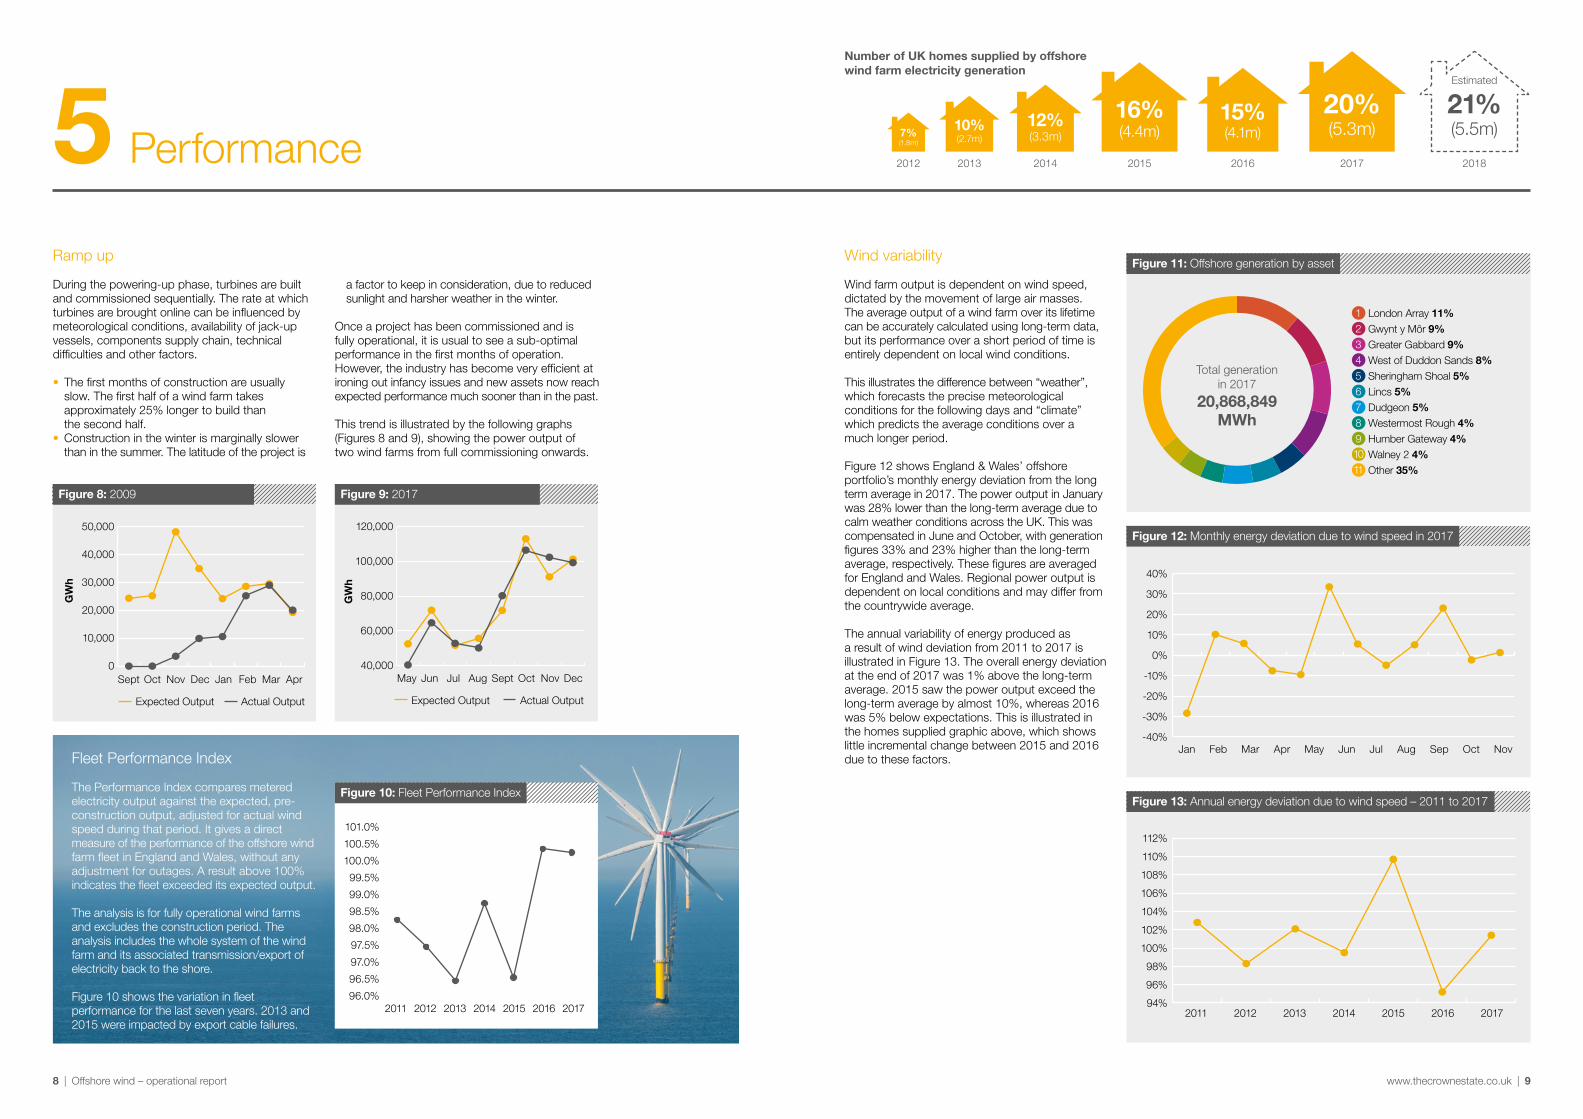
UK offshore wind generated over 20.8 TWh last year, that’s enough to supply the electricity needs of 5.3m homes, around 20% of the UK total
The Crown Estate
The Crown Estate is a £13bn specialist real estate business, focused on commercial property in central London, prime regional retail and offshore wind.
As managers of the seabed around England, Wales and Northern Ireland, our business includes wind, wave and tidal power, as well as marine aggregates and minerals, cables and pipelines and carbon capture and storage.
In this capacity, we play a unique role in developing and helping sustain UK energy supply and infrastructure, working in collaboration with a wide range of organisations.
Scotland
The management duties in Scotland, including management of the Scottish seabed, were transferred to a separate organisation, Crown Estate Scotland following implementation of the Scotland Act 2016. Crown Estate Scotland reports to Scottish Ministers. This report has been produced by The Crown Estate but for completeness, publicly available data on the offshore wind in Scotland has been included in key sections, such as offshore wind farm status and national metrics.
1. Introduction 3
2. Offshore wind farm status 4
3. Assets 6
4. Construction trends 7
5. Performance 8
6. O&M initiatives and innovation 10
7. Investment 12
8. Wind farm ownership 14
9. OFTO ownership 16
10. OFTO performance 17
11. Health and safety 18
12. Knowledge 19
www.thecrownestate.co.uk | 3
34
35
4313
44
17
23
24
2531 30
22
1432
41
11
23 215
28
3342
12
14
20 39
18
45
6 38
27
26
79108
15
16 2919
40
37
36
Offshore wind farm status2
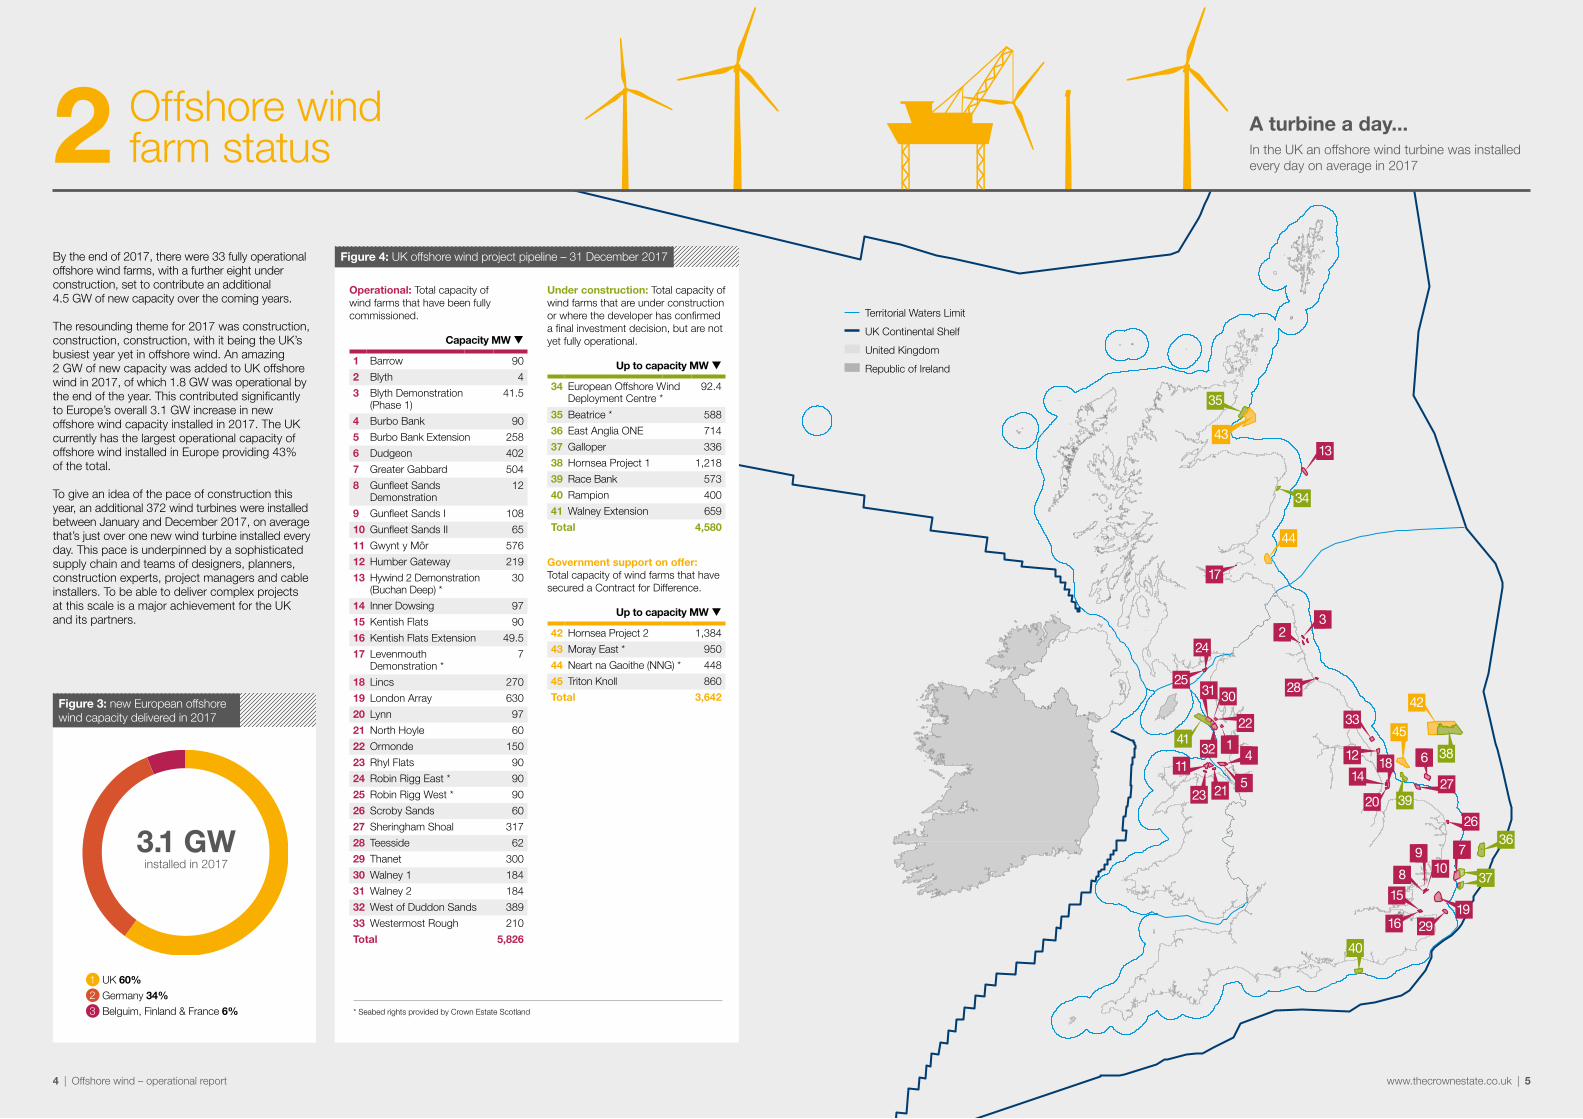
Under construction: Total capacity of wind farms that are under construction or where the developer has confirmed a final investment decision, but are not yet fully operational.
Up to capacity MW q
34 European Offshore Wind Deployment Centre *
92.4
35 Beatrice * 588
36 East Anglia ONE 714
37 Galloper 336
38 Hornsea Project 1 1,218
39 Race Bank 573
40 Rampion 400
41 Walney Extension 659
Total 4,580
Government support on offer: Total capacity of wind farms that have secured a Contract for Difference.
Up to capacity MW q
42 Hornsea Project 2 1,384
43 Moray East * 950
44 Neart na Gaoithe (NNG) * 448
45 Triton Knoll 860
Total 3,642
Figure 4: UK offshore wind project pipeline – 31 December 2017By the end of 2017, there were 33 fully operational offshore wind farms, with a further eight under construction, set to contribute an additional 4.5 GW of new capacity over the coming years.
The resounding theme for 2017 was construction, construction, construction, with it being the UK’s busiest year yet in offshore wind. An amazing 2 GW of new capacity was added to UK offshore wind in 2017, of which 1.8 GW was operational by the end of the year. This contributed significantly to Europe’s overall 3.1 GW increase in new offshore wind capacity installed in 2017. The UK currently has the largest operational capacity of offshore wind installed in Europe providing 43% of the total.
To give an idea of the pace of construction this year, an additional 372 wind turbines were installed between January and December 2017, on average that’s just over one new wind turbine installed every day. This pace is underpinned by a sophisticated supply chain and teams of designers, planners, construction experts, project managers and cable installers. To be able to deliver complex projects at this scale is a major achievement for the UK and its partners.
Operational: Total capacity of wind farms that have been fully commissioned.
Capacity MW q
1 Barrow 90
2 Blyth 4
3 Blyth Demonstration (Phase 1)
41.5
4 Burbo Bank 90
5 Burbo Bank Extension 258
6 Dudgeon 402
7 Greater Gabbard 504
8 Gunfleet Sands Demonstration
12
9 Gunfleet Sands I 108
10 Gunfleet Sands II 65
11 Gwynt y Môr 576
12 Humber Gateway 219
13 Hywind 2 Demonstration (Buchan Deep) *
30
14 Inner Dowsing 97
15 Kentish Flats 90
16 Kentish Flats Extension 49.5
17 Levenmouth Demonstration *
7
18 Lincs 270
19 London Array 630
20 Lynn 97
21 North Hoyle 60
22 Ormonde 150
23 Rhyl Flats 90
24 Robin Rigg East * 90
25 Robin Rigg West * 90
26 Scroby Sands 60
27 Sheringham Shoal 317
28 Teesside 62
29 Thanet 300
30 Walney 1 184
31 Walney 2 184
32 West of Duddon Sands 389
33 Westermost Rough 210
Total 5,826
* Seabed rights provided by Crown Estate Scotland
1 UK 60%2 Germany 34%3 Belguim, Finland & France 6%
Figure 3: new European offshore wind capacity delivered in 2017
3.1 GWinstalled in 2017
Territorial Waters Limit UK Continental Shelf United Kingdom
Republic of Ireland
A turbine a day...In the UK an offshore wind turbine was installed every day on average in 2017
4 | Offshore wind – operational report www.thecrownestate.co.uk | 5
Offshore turbines q
Offshore substations
q
Export cables q
Offshore masts q
Wind farms q
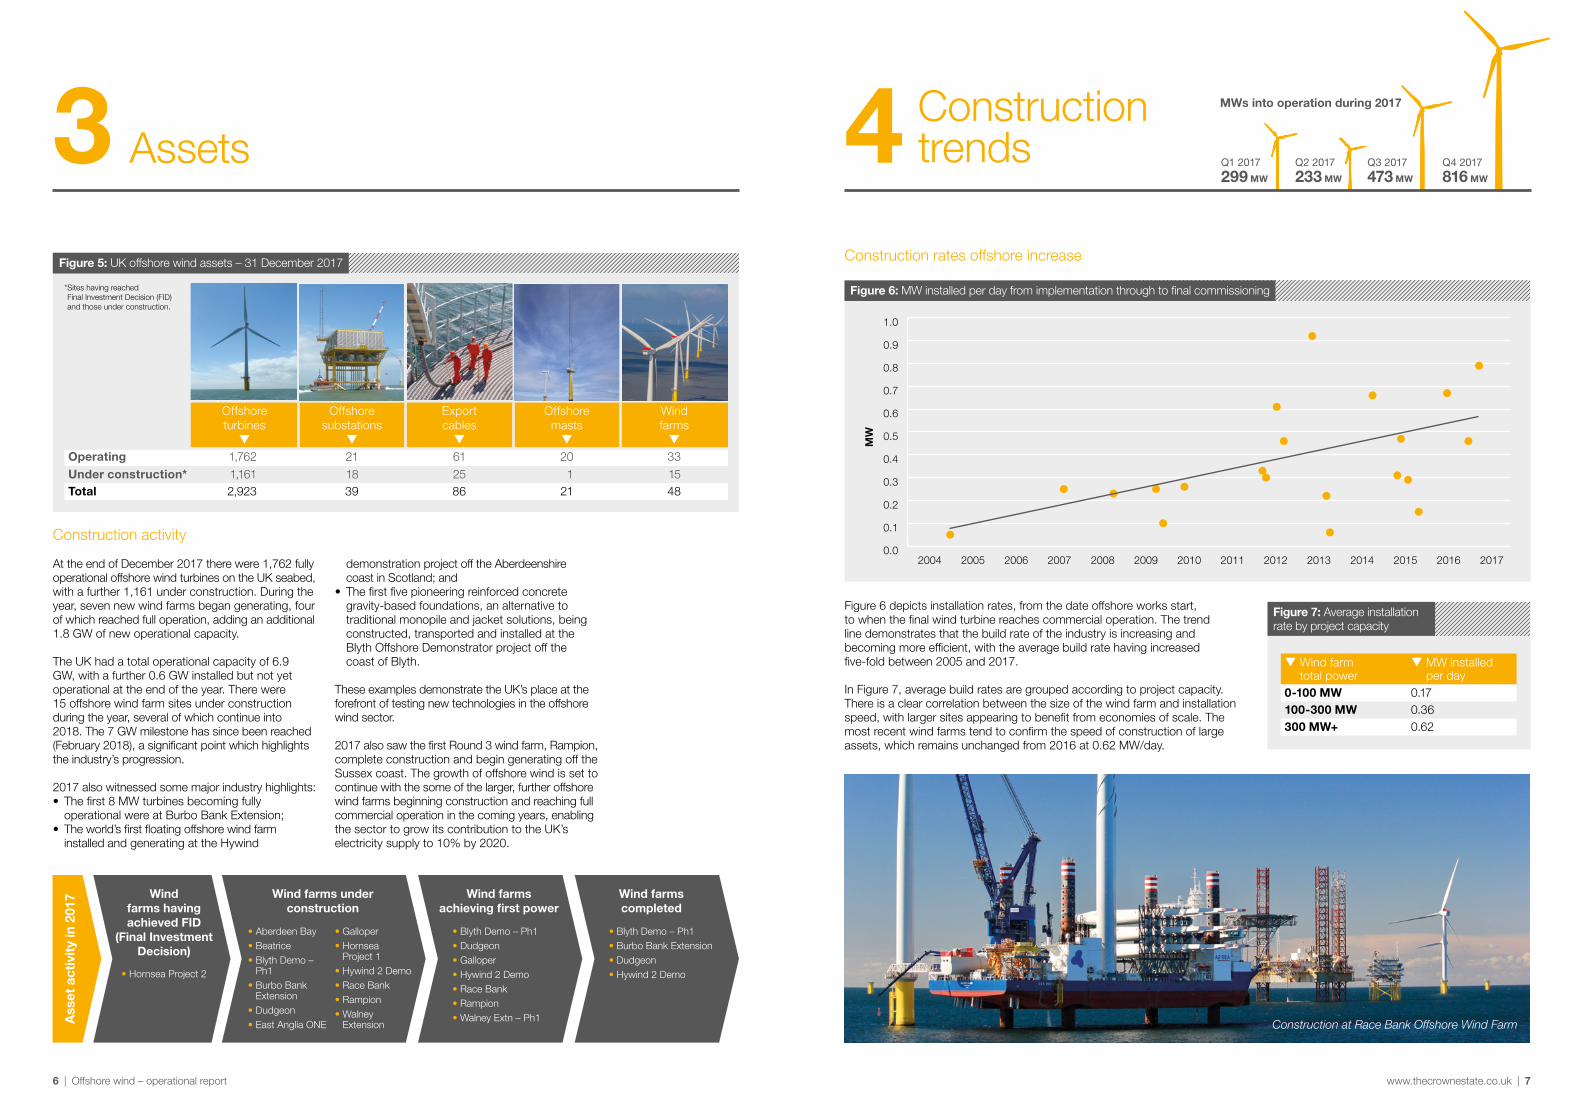
Operating 1,762 21 61 20 33Under construction* 1,161 18 25 1 15Total 2,923 39 86 21 48
Construction activity
At the end of December 2017 there were 1,762 fully operational offshore wind turbines on the UK seabed, with a further 1,161 under construction. During the year, seven new wind farms began generating, four of which reached full operation, adding an additional 1.8 GW of new operational capacity.
The UK had a total operational capacity of 6.9 GW, with a further 0.6 GW installed but not yet operational at the end of the year. There were 15 offshore wind farm sites under construction during the year, several of which continue into 2018. The 7 GW milestone has since been reached (February 2018), a significant point which highlights the industry’s progression.
2017 also witnessed some major industry highlights:• The first 8 MW turbines becoming fully
operational were at Burbo Bank Extension; • The world’s first floating offshore wind farm
installed and generating at the Hywind
• Blyth Demo – Ph1• Dudgeon• Galloper• Hywind 2 Demo• Race Bank• Rampion• Walney Extn – Ph1
Wind farms having achieved FID
(Final Investment Decision)
• Hornsea Project 2
Ass
et a
ctiv
ity in
201
7
* Sites having reached Final Investment Decision (FID) and those under construction.
• Blyth Demo – Ph1• Burbo Bank Extension• Dudgeon• Hywind 2 Demo
Assets3
demonstration project off the Aberdeenshire coast in Scotland; and
• The first five pioneering reinforced concrete gravity-based foundations, an alternative to traditional monopile and jacket solutions, being constructed, transported and installed at the Blyth Offshore Demonstrator project off the coast of Blyth.
These examples demonstrate the UK’s place at the forefront of testing new technologies in the offshore wind sector.
2017 also saw the first Round 3 wind farm, Rampion, complete construction and begin generating off the Sussex coast. The growth of offshore wind is set to continue with the some of the larger, further offshore wind farms beginning construction and reaching full commercial operation in the coming years, enabling the sector to grow its contribution to the UK’s electricity supply to 10% by 2020.
• Aberdeen Bay• Beatrice• Blyth Demo –
Ph1• Burbo Bank
Extension• Dudgeon• East Anglia ONE
• Galloper• Hornsea
Project 1 • Hywind 2 Demo• Race Bank• Rampion• Walney
Extension
Wind farms under construction
Wind farms achieving first power
Wind farms completed
Figure 5: UK offshore wind assets – 31 December 2017
4 Construction trends
0.0
0.1
0.2
0.3
0.4
0.5
0.6
0.7
0.8
0.9
1.0
2004 2005 2006 2007 2008 2009 20172016201520142013201220112010
MW
Figure 6 depicts installation rates, from the date offshore works start, to when the final wind turbine reaches commercial operation. The trend line demonstrates that the build rate of the industry is increasing and becoming more efficient, with the average build rate having increased five-fold between 2005 and 2017.
In Figure 7, average build rates are grouped according to project capacity. There is a clear correlation between the size of the wind farm and installation speed, with larger sites appearing to benefit from economies of scale. The most recent wind farms tend to confirm the speed of construction of large assets, which remains unchanged from 2016 at 0.62 MW/day.
Construction rates offshore increase
q Wind farm total power
q MW installed per day
0-100 MW 0.17100-300 MW 0.36300 MW+ 0.62
Q1 2017
299 MW
Q2 2017
233 MW
Q3 2017
473 MW
Q4 2017
816 MW
Figure 7: Average installation rate by project capacity
Figure 6: MW installed per day from implementation through to final commissioning
MWs into operation during 2017
Construction at Race Bank Offshore Wind Farm
6 | Offshore wind – operational report www.thecrownestate.co.uk | 7
Sept Oct Nov Dec Jan Feb Mar Apr
GW
h
Expected Output Actual Output
0
10,000
20,000
30,000
40,000
50,000
Figure 8: 2009
May Jun Jul Aug Sept Oct Nov Dec
GW
h
Expected Output Actual Output
40,000
60,000
80,000
100,000
120,000
Figure 9: 2017
2011 2012 2013 2014 2015 2016 201796.0%
96.5%
97.0%
97.5%
98.0%
98.5%
99.0%
99.5%
100.0%
100.5%
101.0%
Performance5Ramp up
During the powering-up phase, turbines are built and commissioned sequentially. The rate at which turbines are brought online can be influenced by meteorological conditions, availability of jack-up vessels, components supply chain, technical difficulties and other factors.
• The first months of construction are usually slow. The first half of a wind farm takes approximately 25% longer to build than the second half.
• Construction in the winter is marginally slower than in the summer. The latitude of the project is
Figure 10: Fleet Performance Index
Fleet Performance Index
The Performance Index compares metered electricity output against the expected, pre-construction output, adjusted for actual wind speed during that period. It gives a direct measure of the performance of the offshore wind farm fleet in England and Wales, without any adjustment for outages. A result above 100% indicates the fleet exceeded its expected output.
The analysis is for fully operational wind farms and excludes the construction period. The analysis includes the whole system of the wind farm and its associated transmission/export of electricity back to the shore.
Figure 10 shows the variation in fleet performance for the last seven years. 2013 and 2015 were impacted by export cable failures.
a factor to keep in consideration, due to reduced sunlight and harsher weather in the winter.
Once a project has been commissioned and is fully operational, it is usual to see a sub-optimal performance in the first months of operation. However, the industry has become very efficient at ironing out infancy issues and new assets now reach expected performance much sooner than in the past.
This trend is illustrated by the following graphs (Figures 8 and 9), showing the power output of two wind farms from full commissioning onwards.
Number of UK homes supplied by offshore wind farm electricity generation
2012 2013 2014 2015 2016 2017 2018
12%(3.3m)
16%(4.4m)
15%(4.1m)
20%(5.3m)
21%(5.5m)10%
(2.7m)7%(1.8m)
Estimated
1 London Array 11%2 Gwynt y Môr 9%3 Greater Gabbard 9%4 West of Duddon Sands 8%5 Sheringham Shoal 5%6 Lincs 5%7 Dudgeon 5%8 Westermost Rough 4%9 Humber Gateway 4%10 Walney 2 4%11 Other 35%
Total generation in 2017
20,868,849 MWh
Figure 11: Offshore generation by asset
Jan MarFeb MayApr JulJun Aug Sep Oct Nov-40%
-30%
-20%
-10%
0%
10%
20%
30%
40%
Figure 12: Monthly energy deviation due to wind speed in 2017
2011 2012 2013 2014 2015 2016 201794%
96%
98%
100%
102%
104%
106%
108%
110%
112%
Figure 13: Annual energy deviation due to wind speed – 2011 to 2017
Wind variability
Wind farm output is dependent on wind speed, dictated by the movement of large air masses. The average output of a wind farm over its lifetime can be accurately calculated using long-term data, but its performance over a short period of time is entirely dependent on local wind conditions.
This illustrates the difference between “weather”, which forecasts the precise meteorological conditions for the following days and “climate” which predicts the average conditions over a much longer period.
Figure 12 shows England & Wales’ offshore portfolio’s monthly energy deviation from the long term average in 2017. The power output in January was 28% lower than the long-term average due to calm weather conditions across the UK. This was compensated in June and October, with generation figures 33% and 23% higher than the long-term average, respectively. These figures are averaged for England and Wales. Regional power output is dependent on local conditions and may differ from the countrywide average.
The annual variability of energy produced as a result of wind deviation from 2011 to 2017 is illustrated in Figure 13. The overall energy deviation at the end of 2017 was 1% above the long-term average. 2015 saw the power output exceed the long-term average by almost 10%, whereas 2016 was 5% below expectations. This is illustrated in the homes supplied graphic above, which shows little incremental change between 2015 and 2016 due to these factors.
8 | Offshore wind – operational report www.thecrownestate.co.uk | 9
O&M initiatives and innovation6
Holistic projects and disruptive innovation
HOME Project – Holistic Operation and Maintenance for Energy from Offshore Wind Farms. A programme on the use of advanced sensing, robotics, virtual reality models and artificial intelligence to reduce maintenance cost and effort for offshore wind farms
AURA – a multidisciplinary programme of offshore wind innovation & skills development which aims to reduce costs by creating an offshore wind innovation hub that brings together research and development, innovation, industry collaboration and talent development
O&M Innovation Hub – highlighting O&M challenges and driving innovative solutions
O&M Centre of Excellence – working with UK industry to drive improvements in O&M
Centre for Doctoral Training (CDT) comprehensive research into Wind & Marine Energy – Strathclyde and Edinburgh Universities
Industry
Academia
Industry/academia
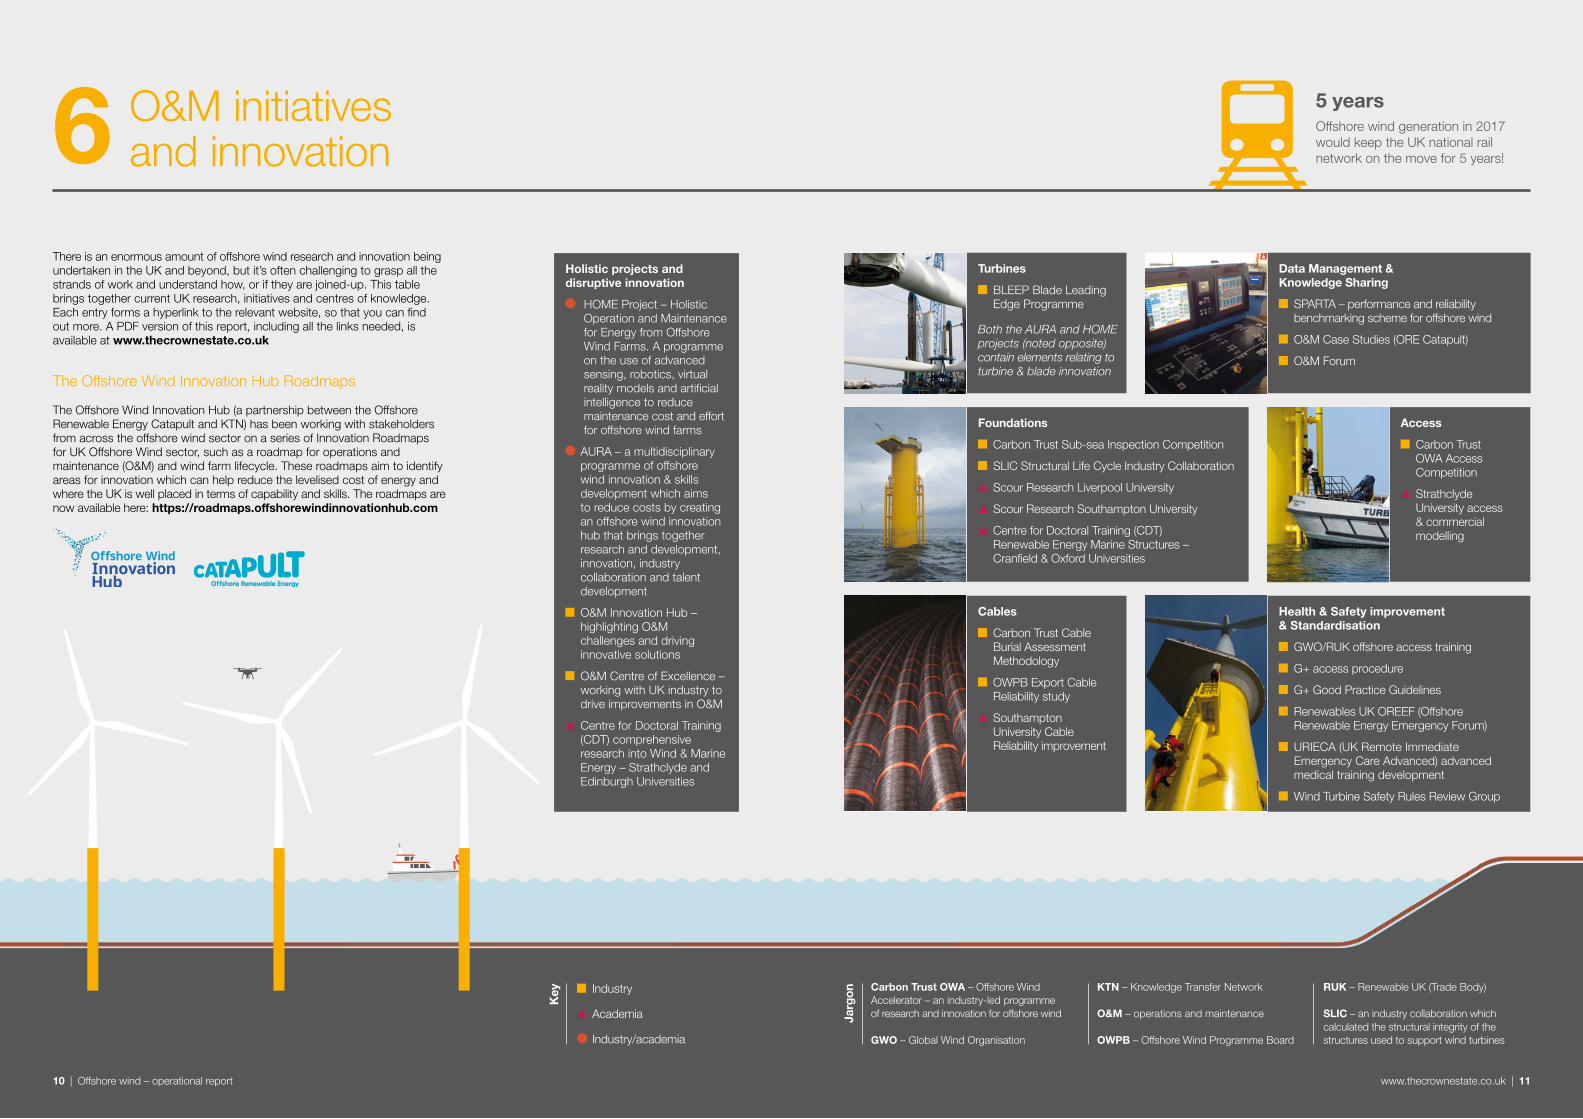
There is an enormous amount of offshore wind research and innovation being undertaken in the UK and beyond, but it’s often challenging to grasp all the strands of work and understand how, or if they are joined-up. This table brings together current UK research, initiatives and centres of knowledge. Each entry forms a hyperlink to the relevant website, so that you can find out more. A PDF version of this report, including all the links needed, is available at www.thecrownestate.co.uk
The Offshore Wind Innovation Hub Roadmaps
The Offshore Wind Innovation Hub (a partnership between the Offshore Renewable Energy Catapult and KTN) has been working with stakeholders from across the offshore wind sector on a series of Innovation Roadmaps for UK Offshore Wind sector, such as a roadmap for operations and maintenance (O&M) and wind farm lifecycle. These roadmaps aim to identify areas for innovation which can help reduce the levelised cost of energy and where the UK is well placed in terms of capability and skills. The roadmaps are now available here: https://roadmaps.offshorewindinnovationhub.com
Key
Foundations
Carbon Trust Sub-sea Inspection Competition
SLIC Structural Life Cycle Industry Collaboration
Scour Research Liverpool University
Scour Research Southampton University
Centre for Doctoral Training (CDT) Renewable Energy Marine Structures – Cranfield & Oxford Universities
Access
Carbon Trust OWA Access Competition
Strathclyde University access & commercial modelling
Health & Safety improvement & Standardisation
GWO/RUK offshore access training
G+ access procedure
G+ Good Practice Guidelines
Renewables UK OREEF (Offshore Renewable Energy Emergency Forum)
URIECA (UK Remote Immediate Emergency Care Advanced) advanced medical training development
Wind Turbine Safety Rules Review Group
Turbines
BLEEP Blade Leading Edge Programme
Both the AURA and HOME projects (noted opposite) contain elements relating to turbine & blade innovation
Cables
Carbon Trust Cable Burial Assessment Methodology
OWPB Export Cable Reliability study
Southampton University Cable Reliability improvement
Data Management & Knowledge Sharing
SPARTA – performance and reliability benchmarking scheme for offshore wind
O&M Case Studies (ORE Catapult)
O&M Forum
Carbon Trust OWA – Offshore Wind Accelerator – an industry-led programme of research and innovation for offshore wind
GWO – Global Wind Organisation
KTN – Knowledge Transfer Network
O&M – operations and maintenance
OWPB – Offshore Wind Programme Board
RUK – Renewable UK (Trade Body)
SLIC – an industry collaboration which calculated the structural integrity of the structures used to support wind turbines
Jarg
on
5 yearsOffshore wind generation in 2017 would keep the UK national rail network on the move for 5 years!
10 | Offshore wind – operational report www.thecrownestate.co.uk | 11
18902017
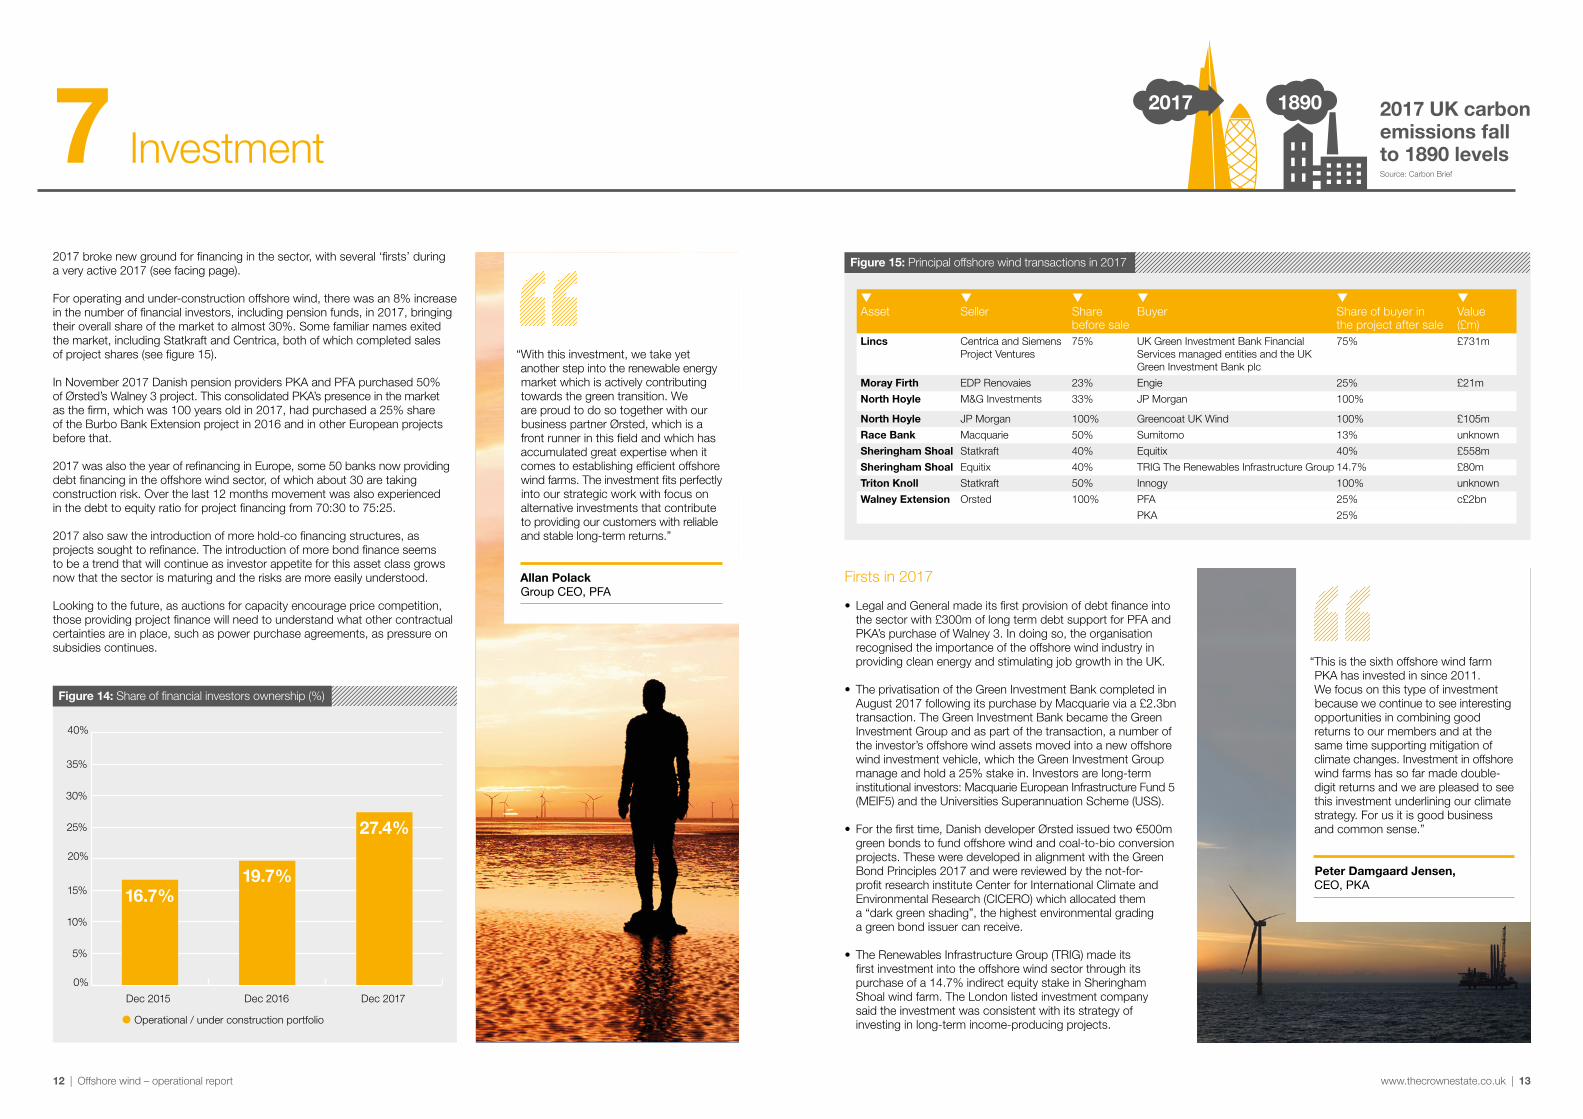
2017 broke new ground for financing in the sector, with several ‘firsts’ during a very active 2017 (see facing page).
For operating and under-construction offshore wind, there was an 8% increase in the number of financial investors, including pension funds, in 2017, bringing their overall share of the market to almost 30%. Some familiar names exited the market, including Statkraft and Centrica, both of which completed sales of project shares (see figure 15).
In November 2017 Danish pension providers PKA and PFA purchased 50% of Ørsted’s Walney 3 project. This consolidated PKA’s presence in the market as the firm, which was 100 years old in 2017, had purchased a 25% share of the Burbo Bank Extension project in 2016 and in other European projects before that.
2017 was also the year of refinancing in Europe, some 50 banks now providing debt financing in the offshore wind sector, of which about 30 are taking construction risk. Over the last 12 months movement was also experienced in the debt to equity ratio for project financing from 70:30 to 75:25.
2017 also saw the introduction of more hold-co financing structures, as projects sought to refinance. The introduction of more bond finance seems to be a trend that will continue as investor appetite for this asset class grows now that the sector is maturing and the risks are more easily understood.
Looking to the future, as auctions for capacity encourage price competition, those providing project finance will need to understand what other contractual certainties are in place, such as power purchase agreements, as pressure on subsidies continues.
Investment7
Dec 2015 Dec 2016 Dec 2017
Operational / under construction portfolio
0%
5%
10%
15%
20%
25%
30%
35%
40%
16.7%19.7%
27.4%
Figure 14: Share of financial investors ownership (%)
“With this investment, we take yet another step into the renewable energy market which is actively contributing towards the green transition. We are proud to do so together with our business partner Ørsted, which is a front runner in this field and which has accumulated great expertise when it comes to establishing efficient offshore wind farms. The investment fits perfectly into our strategic work with focus on alternative investments that contribute to providing our customers with reliable and stable long-term returns.”
Allan PolackGroup CEO, PFA
2017 UK carbon emissions fall to 1890 levelsSource: Carbon Brief
q Asset
q Seller
q Share before sale
q Buyer
q Share of buyer in the project after sale
q Value (£m)
Lincs Centrica and Siemens Project Ventures
75% UK Green Investment Bank Financial Services managed entities and the UK Green Investment Bank plc
75% £731m
Moray Firth EDP Renovaies 23% Engie 25% £21m
North Hoyle M&G Investments 33% JP Morgan 100%
North Hoyle JP Morgan 100% Greencoat UK Wind 100% £105m
Race Bank Macquarie 50% Sumitomo 13% unknown
Sheringham Shoal Statkraft 40% Equitix 40% £558m
Sheringham Shoal Equitix 40% TRIG The Renewables Infrastructure Group 14.7% £80m
Triton Knoll Statkraft 50% Innogy 100% unknown
Walney Extension Orsted 100% PFA 25% c£2bn
PKA 25%
Figure 15: Principal offshore wind transactions in 2017
“This is the sixth offshore wind farm PKA has invested in since 2011. We focus on this type of investment because we continue to see interesting opportunities in combining good returns to our members and at the same time supporting mitigation of climate changes. Investment in offshore wind farms has so far made double-digit returns and we are pleased to see this investment underlining our climate strategy. For us it is good business and common sense.”
Peter Damgaard Jensen, CEO, PKA
Firsts in 2017
• Legal and General made its first provision of debt finance into the sector with £300m of long term debt support for PFA and PKA’s purchase of Walney 3. In doing so, the organisation recognised the importance of the offshore wind industry in providing clean energy and stimulating job growth in the UK.
• The privatisation of the Green Investment Bank completed in August 2017 following its purchase by Macquarie via a £2.3bn transaction. The Green Investment Bank became the Green Investment Group and as part of the transaction, a number of the investor’s offshore wind assets moved into a new offshore wind investment vehicle, which the Green Investment Group manage and hold a 25% stake in. Investors are long-term institutional investors: Macquarie European Infrastructure Fund 5 (MEIF5) and the Universities Superannuation Scheme (USS).
• For the first time, Danish developer Ørsted issued two €500m green bonds to fund offshore wind and coal-to-bio conversion projects. These were developed in alignment with the Green Bond Principles 2017 and were reviewed by the not-for-profit research institute Center for International Climate and Environmental Research (CICERO) which allocated them a “dark green shading”, the highest environmental grading a green bond issuer can receive.
• The Renewables Infrastructure Group (TRIG) made its first investment into the offshore wind sector through its purchase of a 14.7% indirect equity stake in Sheringham Shoal wind farm. The London listed investment company said the investment was consistent with its strategy of investing in long-term income-producing projects.
12 | Offshore wind – operational report www.thecrownestate.co.uk | 13
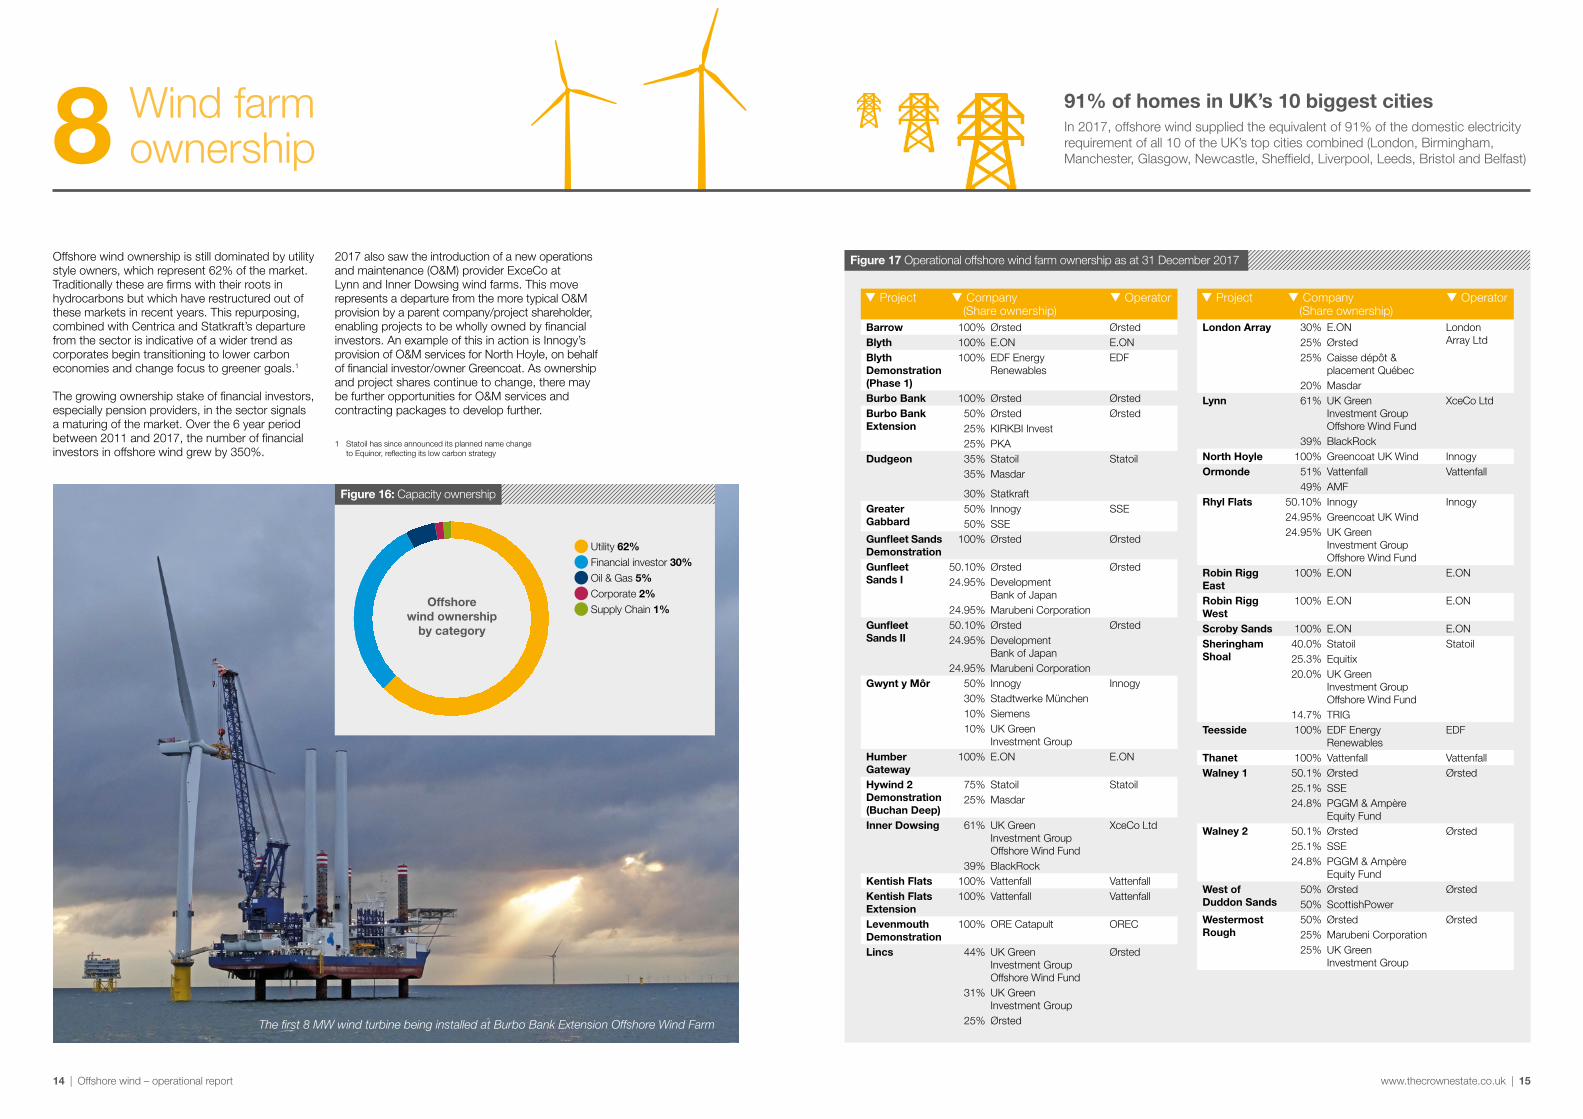
Figure 16: Capacity ownership
Wind farm ownership8
Offshore wind ownership is still dominated by utility style owners, which represent 62% of the market. Traditionally these are firms with their roots in hydrocarbons but which have restructured out of these markets in recent years. This repurposing, combined with Centrica and Statkraft’s departure from the sector is indicative of a wider trend as corporates begin transitioning to lower carbon economies and change focus to greener goals.1
The growing ownership stake of financial investors, especially pension providers, in the sector signals a maturing of the market. Over the 6 year period between 2011 and 2017, the number of financial investors in offshore wind grew by 350%.
Utility 62% Financial investor 30% Oil & Gas 5% Corporate 2% Supply Chain 1%
Offshore wind ownership
by category
2017 also saw the introduction of a new operations and maintenance (O&M) provider ExceCo at Lynn and Inner Dowsing wind farms. This move represents a departure from the more typical O&M provision by a parent company/project shareholder, enabling projects to be wholly owned by financial investors. An example of this in action is Innogy’s provision of O&M services for North Hoyle, on behalf of financial investor/owner Greencoat. As ownership and project shares continue to change, there may be further opportunities for O&M services and contracting packages to develop further.
91% of homes in UK’s 10 biggest citiesIn 2017, offshore wind supplied the equivalent of 91% of the domestic electricity requirement of all 10 of the UK’s top cities combined (London, Birmingham, Manchester, Glasgow, Newcastle, Sheffield, Liverpool, Leeds, Bristol and Belfast)
Figure 17 Operational offshore wind farm ownership as at 31 December 2017
q Project q� Company (Share ownership)
q Operator
Barrow 100% Ørsted ØrstedBlyth 100% E.ON E.ONBlyth Demonstration (Phase 1)
100% EDF Energy Renewables
EDF
Burbo Bank 100% Ørsted ØrstedBurbo Bank Extension
50% Ørsted Ørsted25% KIRKBI Invest25% PKA
Dudgeon 35% Statoil Statoil35% Masdar
30% StatkraftGreater Gabbard
50% Innogy SSE50% SSE
Gunfleet Sands Demonstration
100% Ørsted Ørsted
Gunfleet Sands I
50.10% Ørsted Ørsted24.95% Development
Bank of Japan24.95% Marubeni Corporation
Gunfleet Sands II
50.10% Ørsted Ørsted24.95% Development
Bank of Japan24.95% Marubeni Corporation
Gwynt y Môr 50% Innogy Innogy30% Stadtwerke München10% Siemens10% UK Green
Investment GroupHumber Gateway
100% E.ON E.ON
Hywind 2 Demonstration (Buchan Deep)
75% Statoil Statoil25% Masdar
Inner Dowsing 61% UK Green Investment Group Offshore Wind Fund
XceCo Ltd
39% BlackRockKentish Flats 100% Vattenfall VattenfallKentish Flats Extension
100% Vattenfall Vattenfall
Levenmouth Demonstration
100% ORE Catapult OREC
Lincs 44% UK Green Investment Group Offshore Wind Fund
Ørsted
31% UK Green Investment Group
25% Ørsted
q Project q� Company (Share ownership)
q Operator
London Array 30% E.ON London Array Ltd25% Ørsted
25% Caisse dépôt & placement Québec
20% MasdarLynn 61% UK Green
Investment Group Offshore Wind Fund
XceCo Ltd
39% BlackRockNorth Hoyle 100% Greencoat UK Wind InnogyOrmonde 51% Vattenfall Vattenfall
49% AMFRhyl Flats 50.10% Innogy Innogy
24.95% Greencoat UK Wind24.95% UK Green
Investment Group Offshore Wind Fund
Robin Rigg East
100% E.ON E.ON
Robin Rigg West
100% E.ON E.ON
Scroby Sands 100% E.ON E.ONSheringham Shoal
40.0% Statoil Statoil25.3% Equitix20.0% UK Green
Investment Group Offshore Wind Fund
14.7% TRIGTeesside 100% EDF Energy
RenewablesEDF
Thanet 100% Vattenfall VattenfallWalney 1 50.1% Ørsted Ørsted
25.1% SSE24.8% PGGM & Ampère
Equity FundWalney 2 50.1% Ørsted Ørsted
25.1% SSE24.8% PGGM & Ampère
Equity FundWest of Duddon Sands
50% Ørsted Ørsted50% ScottishPower
Westermost Rough
50% Ørsted Ørsted25% Marubeni Corporation25% UK Green
Investment Group
1 Statoil has since announced its planned name change to Equinor, reflecting its low carbon strategy
The first 8 MW wind turbine being installed at Burbo Bank Extension Offshore Wind Farm
14 | Offshore wind – operational report www.thecrownestate.co.uk | 15

OFTO ownership9
q Project q Company (Share ownership)
q Connection voltage
q Interfacing party*
q Operator/ O&M Provider
Barrow OFTO 100% Transmission Capital Partners 132 kV DNO Transmission Capital Services
Greater Gabbard OFTO 100% Equitix 400 kV Transmission Balfour Beatty Power & Transmission
Gunfleet Sands OFTO 100% Transmission Capital Partners 132 kV DNO Transmission Capital Services
Gwynt y Môr OFTO 60% Balfour Beatty 400 kV Transmission Balfour Beatty Power & Transmission40% Equitix
Humber Gateway OFTO 80% Equitix 275 kV Transmission Balfour Beatty Power & Transmission20% Balfour Beatty
Lincs OFTO 100% Transmission Capital Partners 400 kV Transmission Transmission Capital Services
London Array OFTO 100% Blue Transmission 400 kV Transmission Frontier Power
Ormonde OFTO 100% Transmission Capital Partners 132 kV DNO Transmission Capital Services
Robin Rigg OFTO 100% Transmission Capital Partners 132 kV DNO Transmission Capital Services
Sheringham Shoal OFTO 100% Blue Transmission 132 kV DNO Frontier Power
Thanet OFTO 80% Equitix 132 kV DNO Balfour Beatty Power & Transmission20% Balfour Beatty
Walney 1 OFTO 100% Blue Transmission 132 kV Transmission RES
Walney 2 OFTO 100% Blue Transmission 132 kV DNO RES
West of Duddon Sands OFTO
50% 3i infrastructure Plc 400 kV Transmission Frontier Power/Ørsted
50% Dalmore CapitalWestermost Rough OFTO 100% Transmission Capital Partners 275 kV Transmission Transmission Capital Services
Offshore Transmission Owner (OFTO) transactions
During 2017 no new transfers of OFTO assets occurred but the tender processes for several sites progressed, with the latest position shown in Figure 18. Transmission Capital Partners has the largest slice of the OFTO market with almost a third, followed by Blue Transmission and Equitix, Figure 19 provides an overview with additional detail in Figure 20.
Figure 20: OFTO ownership as at 31 December 2017
Ofgem is responsible for managing the competitive tender process through which offshore transmission licences are granted. The following tenders are currently underway:
Licence to be granted 2018• Burbo Bank Extension – Preferred Bidder appointed
July 2017TenderRound 4
TenderRound 5
Figure 18: Offshore Transmission Owner (OFTO) Transactions
For more information on the tenders, please refer to Ofgem’s website https://www.ofgem.gov.uk/electricity/transmission-networks/offshore-transmission/offshore-transmission-tenders
Licence to be granted 2018• Dudgeon – Preferred Bidder appointed November 2017
Preferred Bidder to be appointed 2018• Race Bank – ITT stage commenced 2017
Invitation to Tender (ITT) stage to commence 2018• Galloper • Walney Extension • Rampion
Figure 19: OFTO ownership
3i infrastructure Plc 5% Dalmore Capital 5% Balfour Beatty Investments 16% Blue Transmission 21% Equitix 21% Transmission Capital Partners 32%
Ownership of transmission assets/
OFTO licences by company
All
OFT
O a
vera
ge
% a
vaila
bili
ty
93
94
95
96
97
98
99
100
2014–15 2015–16 2016–17
q Project2013-14
q2014-15
q2015-16
q2016-17
qBarrow OFTO 99.64 100 99.88 100
Greater Gabbard OFTO 99.81 100 100 99.78
Gunfleet Sands OFTO 100 99.53 100 99.95
Gwynt y Môr OFTO N/A 82.59 82.58 99.73
Humber Gateway OFTO N/A N/A N/A 100
Lincs OFTO N/A 100 99.96 99.93
London Array OFTO 99.97 99.90 99.98 98.88
Ormonde OFTO 100 99.93 100 99.59
Robin Rigg OFTO 99.85 98.19 99.99 98.08
Sheringham Shoal OFTO 99.20 99.84 100 99.95
Thanet OFTO N/A 82.47 83.05 96.15
Walney 1 OFTO 99.99 100 100 99.62
Walney 2 OFTO 94.89 100 92.47 100
West of Duddon Sands OFTO N/A N/A 100 99.64
Westermost Rough OFTO N/A N/A 100 100
Figure 20 provides details of the OFTOs, including their connection voltages and interfaces with either the National Electricity Transmission System or the lower voltage distribution networks owned and operated by Distribution Network Operators (DNO).
Transmission system availability for OFTOs is published by National Grid each financial year. 2017–18 data is not expected to be published until July 2018, so the information in this section covers the period April 2016 to March 2017.
Annual Availability
Operators of the offshore transmission systems are incentivised through the regulatory framework to provide prescribed minimum levels of availability. The default for this is 98%, with specific targets established for each OFTO.
National Grid collates availability data for each OFTO annually – this includes all outages that originate on an OFTO’s system but excludes outages that originate elsewhere, for example on a wind farm generator or DNO. The OFTO availability incentive then adjusts the reported outage data to calculate incentivised performance for each OFTO.
In 2016/17, average OFTO availability was 99.36%, significantly higher than the previous year (95.99%) with Figure 22 showing a general trend of increasing availability. The only OFTO not to attain 98% availability was Thanet which was impacted by repairs to Export Cable 2 and the replacement of a transformer radiator in 2016. Information is available in the National Grid’s National Electricity Transmission System Performance Report. Transmission Capital Partners made a pre-emptive export cable repair at Ormonde during 2017. Whilst the impact will not be shown until latest National Grid figures are published, it is encouraging to industry and investors to see a proactive approach to management of transmission assets in order to minimize losses.
The Offshore Wind Programme Board (OWPB) Grid Group commissioned an assessment of export cable reliability in 2017, with the aim to better understand the causes of cable failures connecting offshore wind farms, as such failures had increased in frequency at that time. All OFTOs and many offshore wind developers input to the project1 and further work is being progressed through the OWPB Grid Group.
99.36% Annual System Availability of Offshore Networks for 2016-17
Figure 21: Offshore transmission networks % annual availability
Figure 22: OFTO availability trend
OFTO performance10
1 Report available at https://ore.catapult.org.uk/work-with-us/ industry/offshore-wind-programme-board
16 | Offshore wind – operational report www.thecrownestate.co.uk | 17
The Global Offshore Wind Health and Safety Organisation (G+) continues to create and support health and safety best practice throughout the offshore wind industry. During 2017, the focus has been to strengthen links to stakeholder organisations in order to bring more international best practice and learnings into the G+ and expand its influence. The G+ has introduced a new level of Associate Membership to involve contractors, OFTOs, non-operating owners and non-lead operators/developers, which has already seen a number of new members join the G+.
Drawing on applicable safety culture guidance from other industries, for example construction and oil and gas, is helping G+ members identify potential risk areas and streamline solutions. The G+ is now a member of the cross-industry organisation set up to prevent incidents caused by dropped objects, DROPS, and a working group has been set up to apply their key material to the offshore wind industry.
The Safe by Design workshop programme remains a key output, with topic areas for 2018 including the design of and access within WTG foundation internals. Past topics have included access and egress, davit crane operations, and service lifts.
There is an emerging focus on occupational health. A key 2018 publication will describe the results of G+ commissioned research on the ergonomics of ladder climbing, which has the potential to transform physical fitness standards for offshore wind.
The G+ continues to base its work streams on the best available evidence; accident and incident data submitted by G+ members. The next annual incident data report is due to be published in April 2018. Key benchmarking statistics included every year are the lost time injury frequency, and the total recordable injury rate.
Looking ahead, the G+ recognises the need to increase international communication of its work outside the most mature offshore wind markets, and internationalisation will be a key theme over the next few years as the offshore wind industry expands outside of Europe.
Sharing experience and knowledge: Safe decommissioning of suction buckets without divers
Health and safety11
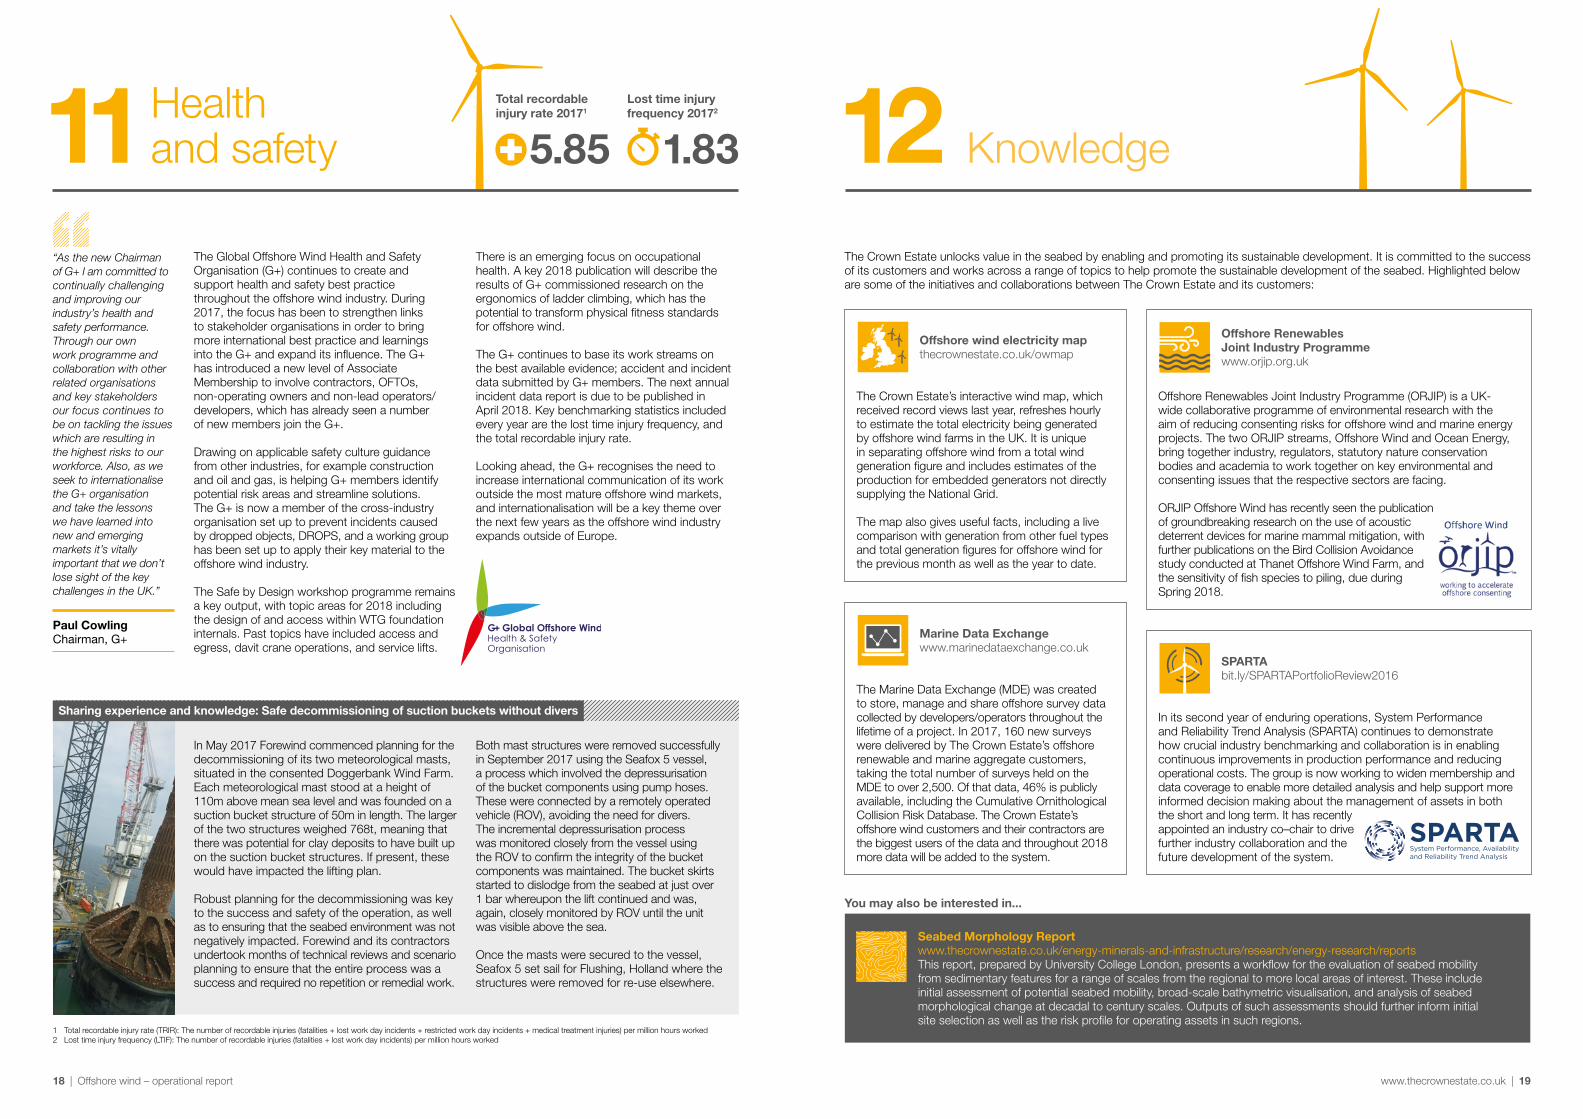
In May 2017 Forewind commenced planning for the decommissioning of its two meteorological masts, situated in the consented Doggerbank Wind Farm. Each meteorological mast stood at a height of 110m above mean sea level and was founded on a suction bucket structure of 50m in length. The larger of the two structures weighed 768t, meaning that there was potential for clay deposits to have built up on the suction bucket structures. If present, these would have impacted the lifting plan.
Robust planning for the decommissioning was key to the success and safety of the operation, as well as to ensuring that the seabed environment was not negatively impacted. Forewind and its contractors undertook months of technical reviews and scenario planning to ensure that the entire process was a success and required no repetition or remedial work.
1 Total recordable injury rate (TRIR): The number of recordable injuries (fatalities + lost work day incidents + restricted work day incidents + medical treatment injuries) per million hours worked2 Lost time injury frequency (LTIF): The number of recordable injuries (fatalities + lost work day incidents) per million hours worked
“As the new Chairman of G+ I am committed to continually challenging and improving our industry’s health and safety performance. Through our own work programme and collaboration with other related organisations and key stakeholders our focus continues to be on tackling the issues which are resulting in the highest risks to our workforce. Also, as we seek to internationalise the G+ organisation and take the lessons we have learned into new and emerging markets it’s vitally important that we don’t lose sight of the key challenges in the UK.”
Both mast structures were removed successfully in September 2017 using the Seafox 5 vessel, a process which involved the depressurisation of the bucket components using pump hoses. These were connected by a remotely operated vehicle (ROV), avoiding the need for divers. The incremental depressurisation process was monitored closely from the vessel using the ROV to confirm the integrity of the bucket components was maintained. The bucket skirts started to dislodge from the seabed at just over 1 bar whereupon the lift continued and was, again, closely monitored by ROV until the unit was visible above the sea.
Once the masts were secured to the vessel, Seafox 5 set sail for Flushing, Holland where the structures were removed for re-use elsewhere.
Paul CowlingChairman, G+
In its second year of enduring operations, System Performance and Reliability Trend Analysis (SPARTA) continues to demonstrate how crucial industry benchmarking and collaboration is in enabling continuous improvements in production performance and reducing operational costs. The group is now working to widen membership and data coverage to enable more detailed analysis and help support more informed decision making about the management of assets in both the short and long term. It has recently appointed an industry co–chair to drive further industry collaboration and the future development of the system.
SPARTA bit.ly/SPARTAPortfolioReview2016
The Crown Estate unlocks value in the seabed by enabling and promoting its sustainable development. It is committed to the success of its customers and works across a range of topics to help promote the sustainable development of the seabed. Highlighted below are some of the initiatives and collaborations between The Crown Estate and its customers:
The Marine Data Exchange (MDE) was created to store, manage and share offshore survey data collected by developers/operators throughout the lifetime of a project. In 2017, 160 new surveys were delivered by The Crown Estate’s offshore renewable and marine aggregate customers, taking the total number of surveys held on the MDE to over 2,500. Of that data, 46% is publicly available, including the Cumulative Ornithological Collision Risk Database. The Crown Estate’s offshore wind customers and their contractors are the biggest users of the data and throughout 2018 more data will be added to the system.
Marine Data Exchange www.marinedataexchange.co.uk
Offshore Renewables Joint Industry Programme (ORJIP) is a UK-wide collaborative programme of environmental research with the aim of reducing consenting risks for offshore wind and marine energy projects. The two ORJIP streams, Offshore Wind and Ocean Energy, bring together industry, regulators, statutory nature conservation bodies and academia to work together on key environmental and consenting issues that the respective sectors are facing.
ORJIP Offshore Wind has recently seen the publication of groundbreaking research on the use of acoustic deterrent devices for marine mammal mitigation, with further publications on the Bird Collision Avoidance study conducted at Thanet Offshore Wind Farm, and the sensitivity of fish species to piling, due during Spring 2018.
Offshore Renewables Joint Industry Programme www.orjip.org.uk
The Crown Estate’s interactive wind map, which received record views last year, refreshes hourly to estimate the total electricity being generated by offshore wind farms in the UK. It is unique in separating offshore wind from a total wind generation figure and includes estimates of the production for embedded generators not directly supplying the National Grid.
The map also gives useful facts, including a live comparison with generation from other fuel types and total generation figures for offshore wind for the previous month as well as the year to date.
Offshore wind electricity map thecrownestate.co.uk/owmap
Knowledge12
Seabed Morphology Reportwww.thecrownestate.co.uk/energy-minerals-and-infrastructure/research/energy-research/reportsThis report, prepared by University College London, presents a workflow for the evaluation of seabed mobility from sedimentary features for a range of scales from the regional to more local areas of interest. These include initial assessment of potential seabed mobility, broad-scale bathymetric visualisation, and analysis of seabed morphological change at decadal to century scales. Outputs of such assessments should further inform initial site selection as well as the risk profile for operating assets in such regions.
You may also be interested in...
Total recordable injury rate 20171
5.85Lost time injury frequency 20172
1.83
18 | Offshore wind – operational report www.thecrownestate.co.uk | 19

The Crown Estate 1 St James’s MarketLondonSW1Y 4AH
020 7851 5000
thecrownestate.co.uk/energy-minerals- and-infrastructure/offshore-wind-energy
@TheCrownEstate
Correct as of April 2018, unless otherwise stated.
Cover Photo – Courtesy of Chris Henderson Photography and EDF Energy. Thank you to the following for providing images for this report: Orsted (Race Bank/Burbo Bank/Walney Extension); Forewind (Dogger Bank); Innogy (Galloper); Matthew Woods / Alamy Stock Photo (page 12)
© Crown Copyright 2017, all rights reserved. Ordnance Survey Data: Licence No. 100019722, www.thecrownestate.co.uk/ordnance-survey-licence. Limits: Supplied by UKHO. Not to be used for Navigation.