offshore racing congress
TRANSCRIPT

OFFSHORE RACING CONGRESS
ORC Speed Guide Explanation

1. INTRODUCTION
The ORC Speed Guide is a custom-calculated manual for improving performance for an individual
boat. It is intended to augment, not to replace, other books and articles which offer general suggestions
for the improvement of sailing performance by providing you with specific performance targets for your
boat.
This Speed Guide will be of interest to both beginners and more experienced sailors who want to have a
deeper understanding of the relationships between speed and factors such as sail selection, wind speed,
and wind angle.
The speed predictions for the individual boats which are central elements of the Speed Guide are
derived in two steps: First, the hull and appendages are measured by use of an electronic device so as to
put the hull lines into the computer data bank. The other elements of measurement - the rig and sail
dimensions, the flotation and stability data, etc. - are also added to the data bank for this one boat.
Second, a series of complex calculations are made to find the boat speeds at which all of the elements of
drag come into equilibrium with the drive provided by the sails. This is what constitutes the Velocity
Prediction Program, or VPP, which is annually updated and improved by ORC.
The utility of these VPP-generated predictions and how they relate to the measured performance on
board your boat will greatly depend on the steadiness of the sailing conditions, the abilities of the
helmsman and crew, and the accuracy of the instrumentation on board. While you cannot necessarily
control the weather, the skills of your team can be improved as well as the calibration of the instruments
as described in Appendix C of this Guide.
It is also important to consider any other unusual or local factors (eg, sea state, wind shear, etc) to
amend this polar data to best suit your boat sailing in your conditions with your crew. Ultimately this
combination of the theoretical polars provided here along with the amendments made by you and your
crew will create the most accurate set of performance targets for your team.
2. POLAR DIAGRAMS AND HOW TO READ THEM
Polar diagrams are a convenient way to display the speed prediction data generated by the VPP in
HTML format, and are extremely useful in understanding both the general and specific relationship
between the three most important factors in a boat’s performance: wind speed, wind angle, and boat
speed.
In the provided polar diagrams, True and Apparent Wind directions are indicated by the drawn arrows
and increase radially from 0° at the top to 180° at the bottom. Each radial line extending from the center
represents a sailing angle relative to the indicated True or Apparent Wind Angle (TWA or AWA). Note
that it is AWA that is the wind as felt or observed on the boat or as seen aloft by the masthead fly.
Each radial line shown is graduated into one-knot increments by tick marks with smaller ticks on tenths
of knots. These are scales of the predicted boat speed: the farther from the center the higher the boat
speed. The corresponding scale of speeds in knots are shown along the 90° line.
The plotted curves represent the boat’s speed at seven different True Wind Speeds (TWS): 6, 8, 10, 12,
14, 16 and 20 knots. The inner curve nearest the center presents the boat speeds at the six-knot TWS
and the curve farthest from the center presents boat speeds at 20-knot TWS.
The shapes of these curves give a qualitative as well as quantitative notion of performance: notice for
example that at close-hauled sailing angles, near 45° TWA, the boat speeds do not increase very much
with stronger TWS, but in reaching conditions they do increase greatly with wind strength.
Color coding and line styles are used to indicate the boat’s performance under the largest Headsail,
Headsail(s) set Flying, the largest Asymmetric and Symmetric spinnaker(s) and Asymmetric

spinnaker(s) <85% (ie, Code Zero) sail combinations, showing the effects of these sails on performance.
Only sails that are listed in the boat’s certificate used to generate the Speed Guide are shown. Selection
of individual sail types in the polar diagrams is possible by ticking on or off the boxes shown for each
sail. The optimum beat and run angles and speeds are also indicated for racing on windward-leeward
courses.
For Headsails set Flying and Asymmetric spinnaker(s) <85%, multiple sails of these types may be
shown, provided they are listed on the boat’s certificate. The performance of each sail may be shown as
well as the best performance of a virtual sail of this type “blended” from the performance curves of all
the sail options.
Note that your boat's Age Allowance (AA) and Dynamic Allowance (DA) are not applied in the polars,
because these factors are not relevant to the boat's straight-line performance. The AA and DA are
applied only in the handicap rating to account for the various effects encountered whilst sailing a
specified course type.
3. FLATTENING AND REEFING
The data sheet shows the relative flattening and reefing required for best performance. The “FLAT”
column indicates a flattening of the sails to reduce the drag of the sails (at the expense of some loss of
drive). Flattening as used here includes not only using a cunningham, flattening through more outhaul
on the main or through tighter halyards, lowering the main sheet traveler or increasing twist off, but also
the flattening accomplished through jib trim, with not only a flatter sail but one with a shorter foot as
well.
The “REEF” column shows the percent of sail area reduction but the reduction will usually be
accomplished both by reefing the main and also by using smaller jibs. A reefing factor of 1.00 indicates
no reduction in sail. The reefing factor is a linear measure that must be squared to get the percentage of
sail area remaining after reefing. In other words, a reefing factor of 0.95 squared indicates that a
reduction in sail area of about 10 percent is needed.
4. BEST SAILING ANGLES
The most valuable information this guide provides is the indication of optimum sailing angles in any
given condition to produce the best Velocity Made Good (VMG) towards a windward or leeward mark.
These angles are shown on the polar diagram itself and on the adjoining table. Besides providing a
guide to what angle to be sailing to the wind to optimize VMG, this information can also be helpful to
determine the new course on the opposite tack. If, for example, you have been sailing at an AWA of
141° (the optimum angle for 12 knots TWS) the use of the second polar diagram (showing TWA)
shows that this is equivalent to a TWA of 162°, which is 18 degrees from dead downwind (180°-
162°=18°). When you gybe you will have to turn through twice this angle, or 36°. So, when the mark
bears 36° from your present heading you can gybe over and sail at the optimum angle directly for the
mark – if you sail further you have sailed too far, and if you gybe earlier you may have to gybe again.
Similarly, the optimum angle to produce the best VMG to windward is shown, and can be used in
similar manner to calculate tacking angles. Bear in mind, however, this angle may vary within a few
degrees depending on sea state.
On the curve for each wind speed there is a crossover where the headsail is changed from a jib to a
spinnaker. The relative inefficiency of these sails in this condition shown by a reduction in boatspeed,
resulting in a pronounced cusp in the curve. When the course to the mark lies in the vicinity of this
cusp, it can be tactically advantageous to sail a little higher or lower to increase the progress towards the
mark, then switch headsails and sail a course lying on the other side of the crossover, again at a higher
course towards the mark than sailing in the cusp. Of course, you should weigh the gain of higher VMC

(Velocity Made good to Course) against the loss inherent to a headsail change, and note that “course”
does not take into account any loss of angle due to leeway.
5. CHECK FOR DEFICIENT PERFORMANCE
If you find deficient performance of your boat after optimizing the instrumentation, look for
opportunities to improve the sails or other aspect of your boat’s set-up and equipment. Older sails which
are no longer in optimal shape, appendages which are not fair, incorrect rig and spar set-up, these are all
possible sources of slowing down your speed. Even though it is not a part of this guide to suggest all of
the adjustments that might be tried, the polar diagram can be used to point out these possible
performance deficiencies in various sailing conditions and therefore indicate areas of improvement.
6. POLAR DATA
The polar graphics in the Speed Guide are constructed from the data listed at the end of the Speed
Guide as tables of numbers. This polar data is also included as links in the Speed Guide package to this
data in SYLK (slk) and Expedition routing software formats. These files can be opened using popular
spreadsheet software (such as Microsoft Excel) for further processing or conversion to a different
format, suitable for uploading to the boat's instruments or other navigation software.
Check the requirements of your navigation software for which file type and in what specific order the
data may need to be edited to operate with this software.

Appendix A - MATHEMATICAL RELATIONS
For mathematical conversion of apparent wind to true wind and vice versa, use the following formulae:
True Wind conditions given Apparent Wind conditions:
VTW = [VAW sin(BAW)] [VAW cos(BAW) V ]2
boat
2× + × −
BTW = arc tan[ ]VAW sin(BAW)
VAW cos(BAW) Vboat
×
× −
Apparent Wind conditions given True Wind conditions:
VAW = [VTW sin(BTW)] [VTW cos(BTW) V ]2
boat
2× + × +
BAW = arc tan [ ]VTW sin(BTW)
VTW cos(BTW) Vboat
×
× +
Add 180 degrees to BTW or BAW if it is negative.
VTW is the velocity of the true wind.
VAW is the velocity of the apparent wind.
BTW is the bearing of the true wind.
BAW is the bearing of the apparent wind.
Vboat is the velocity of the boat.
Note: Wind reading is assumed to be sensed at 10 meters (33’) above water
see Appendix C: CORRECTIONS of INSTRUMENT READINGS)
While it may be impractical to use calculators while racing, and many instrument systems have the
capability to calculate and display these figures, there will be some utility in becoming familiar with these
formulae to get at least a qualitative understanding of how these parameters are related.
For example, more than one skipper after sailing a long spinnaker leg is lulled into a feeling of light air only
to discover, on rounding up to windward at the mark, that he has hoisted a jib too large for the beat. Or he
may have resisted the tendency to underestimate the wind strength and has over-compensated. It is relatively
easy to calculate the True Wind Speed and from this to calculate the Apparent Wind over the deck for the
upcoming beat. This permits selecting the jib that is just right for the conditions.
So for example, suppose we are sailing towards the leeward mark at 6 knots with the apparent wind from
150° at 6 knots. This gives a true wind speed of
VTW = [6 sin(150 ) [6 cos(150 ) 6]o 2 o 2× + × − = 11.6 knots.
For making the calculation of apparent wind angle upwind it is necessary to estimate the speed through the
water on the beat. The polar diagram can provide this needed information.
Suppose the optimum tacking angle is 40° and the 12-knot true wind polar curve shows a boat speed of 6.3
knots at 40°. The apparent wind over the deck will be:
VAW = [11.6 sin(40 ) [11.6 cos(40 ) 6.3]o 2 o 2× + × + = 16.9 knots.

WIND LISTTrue Wind
Speeds
COURSESHeadings
Sailing Conditions.Upwind and
Downwind Sail
Combinations.
AE
RO
FO
RC
EM
OD
EL
HY
DR
O
FO
RC
E
MO
DE
L
SAILSDimensionsSailTypes
Aerodynamic Forces
Sail Type SpecificAerodynamic Coefficients.
Rig DimensionsMast Height
LP SPL etc.
Lines
ProcessingLPP
Lines Generation.&
Inclining Test
&In water
measurements.
Performance CurveScoring
Polar Curve Performance Analysis
Measurements
Appendix B - VELOCITY PREDICTION PROGRAM (VPP)
The computer program that produces polar diagrams consists of two parts: the LPP (Lines Processing
Program) and the VPP (Velocity Prediction Program). The LPP calculates hydrostatic data, like wetted
surface, displacement and stability. These are necessary inputs for the VPP program which creates a
computer simulation of the boat’s performance based on scientific research of boat hulls in hydrodynamic
basins, sails in aerodynamic tunnels and measurements taken on real boats.
Hull resistance is calculated in sailing trim with the total crew weight and equipment onboard for various
angles of inclination and wind strength. Forces that propel and heel the boat are calculated for all possible
combinations of sails, along with a choice of the optimal combination for the given conditions.
At the speeds shown on the VPP data sheet, various factors of drag have been balanced against the driving
force. The important thing to have in mind is that each factor contributes either to drive or to drag. There are
no "speed producing" elements in the hull. Thus length, for example, is not a speed producer per se, but
simply affects the drag differently under different sailing conditions. But drive (from the sails) and drag can
be influenced in some degree by the way a boat is sailed.
The figure below depicts the various contributing elements to the ORC VPP. For more detailed information
on how the VPP works and why, consult the ORC VPP Doumentation text available online at www.orc.org.
Appendix C - CORRECTIONS OF INSTRUMENT READINGS
There are corrections which must be made in the instrument readings for the most accurate comparisons.
Here are a few suggestions for correction of wind readings.
If your instruments are calibrated and accurate, you should still expect that your indicated speeds will be a
littler lower or higher than the predictions according to the height of your wind instrument sensor above the
water. This may be due to the "wind gradient" (higher velocities at greater heights above the water) where
the masthead true wind velocity for your yacht may be different from that of yachts in larger or smaller
classes at any given instant. This can also be a significant effect where the water temperature is significantly
colder than the air temperature, producing “wind shear.”
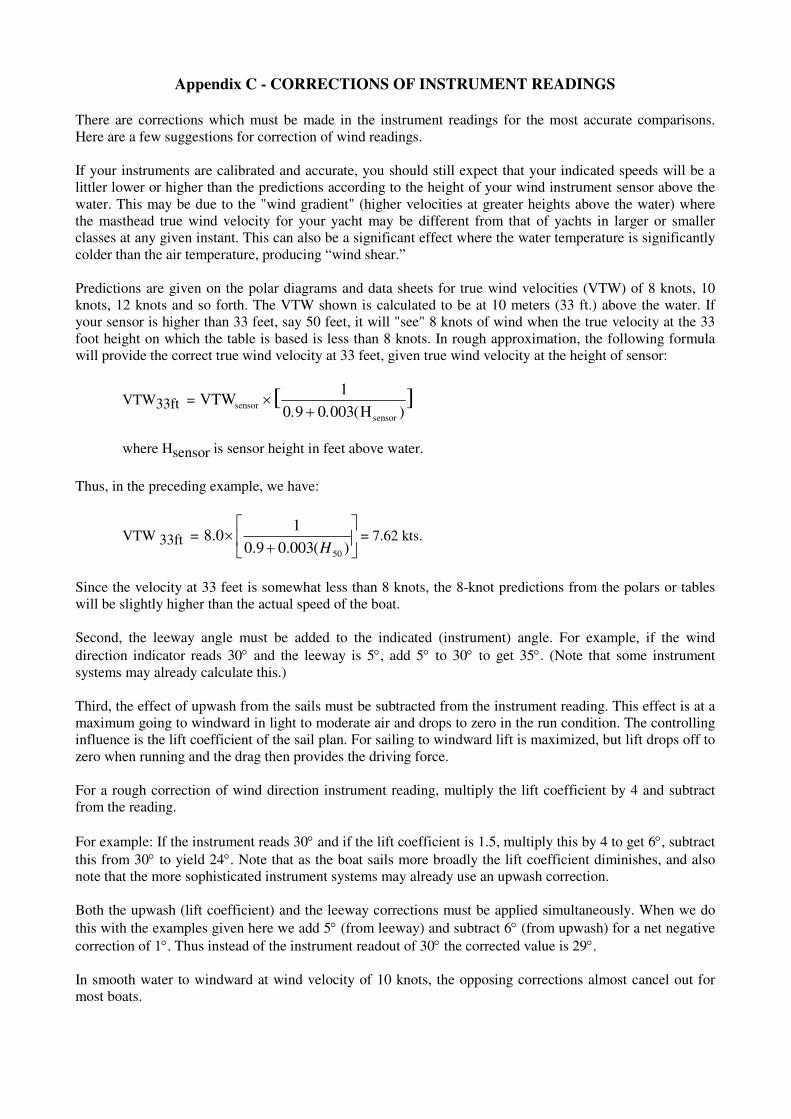
Predictions are given on the polar diagrams and data sheets for true wind velocities (VTW) of 8 knots, 10
knots, 12 knots and so forth. The VTW shown is calculated to be at 10 meters (33 ft.) above the water. If
your sensor is higher than 33 feet, say 50 feet, it will "see" 8 knots of wind when the true velocity at the 33
foot height on which the table is based is less than 8 knots. In rough approximation, the following formula
will provide the correct true wind velocity at 33 feet, given true wind velocity at the height of sensor:
VTW33ft = VTW1
0.9 0.003(H )sensor
sensor
[ ]×+
where Hsensor is sensor height in feet above water.
Thus, in the preceding example, we have:
VTW 33ft =
+×
)(003.09.0
10.8
50H= 7.62 kts.
Since the velocity at 33 feet is somewhat less than 8 knots, the 8-knot predictions from the polars or tables
will be slightly higher than the actual speed of the boat.
Second, the leeway angle must be added to the indicated (instrument) angle. For example, if the wind
direction indicator reads 30° and the leeway is 5°, add 5° to 30° to get 35°. (Note that some instrument
systems may already calculate this.)
Third, the effect of upwash from the sails must be subtracted from the instrument reading. This effect is at a
maximum going to windward in light to moderate air and drops to zero in the run condition. The controlling
influence is the lift coefficient of the sail plan. For sailing to windward lift is maximized, but lift drops off to
zero when running and the drag then provides the driving force.
For a rough correction of wind direction instrument reading, multiply the lift coefficient by 4 and subtract
from the reading.
For example: If the instrument reads 30° and if the lift coefficient is 1.5, multiply this by 4 to get 6°, subtract
this from 30° to yield 24°. Note that as the boat sails more broadly the lift coefficient diminishes, and also
note that the more sophisticated instrument systems may already use an upwash correction.
Both the upwash (lift coefficient) and the leeway corrections must be applied simultaneously. When we do
this with the examples given here we add 5° (from leeway) and subtract 6° (from upwash) for a net negative
correction of 1°. Thus instead of the instrument readout of 30° the corrected value is 29°.
In smooth water to windward at wind velocity of 10 knots, the opposing corrections almost cancel out for
most boats.

The attached printout schedule for your boat shows lift coefficients for various sailing conditions of wind
angle and wind speed. For leeway you will have to make your own estimates or measurements. (One method
is to tow a thin wire with a weight at the end and lay it across a compass.)
You are likely to find in comparing your actual speeds with the predicted that some of the sailing conditions
will show close correspondence, within a tenth or two of a knot. Other courses may show more deviation. If
this is the case, look first for instrument error. Instruments which are quite accurate for reaching may be off
for beating.
A common instrument error is in the speedometer installation. The flow across the transducers may be
accelerated, disturbed or misdirected by the water flow washing across the hull. For speed calibration a
simple expedient is to tow a Walker log extending the spinner line about two boat lengths astern. Though
this instrument has to be timed and gives no continuous reading, it is amazingly accurate. Some skippers
have reported successful use of GPS for speedometer calibration. This will be done best in steady wind
conditions; averaging a constantly changing speedometer reading is not easy or as reliable as one would
wish. If you make a deviation card for your speedometer be sure to write down the sailing conditions at the
time of comparisons.
Copyright © 2020 Offshore Racing Congress.
Cover picture courtesy by Maria Spirideli