offsetting co2 emissions - iisd · climate change. if the balance of natural fluxes were disrupted,...
TRANSCRIPT

I
Offsetting CO2 EmissionsTree Planting on the Prairies
Prepared by the International Institute for Sustainable Development

II
TABLE OF CONTENTS
LIST OF TABLES................................................................................................................................................................................. IV
INTRODUCTION....................................................................................................................................................................................1
STUDY ASSUMPTIONS.............................................................................................................................................................................1BACKGROUND ........................................................................................................................................................................................1
CONTROLLING RISING CO2 LEVELS..............................................................................................................................................5
SUBSTITUTION OF LOWER CARBON ENERGY SOURCES ..........................................................................................................................5REDUCTION OF THE ACTIVITY CAUSING THE EMISSIONS ........................................................................................................................5SEQUESTRATION OF CO2 ........................................................................................................................................................................5
INTERNATIONAL POLICIES..............................................................................................................................................................6
COMMITMENTS AND GOALS ...................................................................................................................................................................6THE EUROPEAN UNION ..........................................................................................................................................................................7THE UNITED STATES ............................................................................................................................................................................10CANADA...............................................................................................................................................................................................12
Practices .........................................................................................................................................................................................20
FEASIBILITY OF TREE PLANTING AS AN ACTION...................................................................................................................25
BENEFITS..............................................................................................................................................................................................25Environmental ................................................................................................................................................................................26Economic ........................................................................................................................................................................................27Social ..............................................................................................................................................................................................28
COSTS AND COST MITIGATION OF TREE PLANTING...............................................................................................................................28The Cost of Inaction........................................................................................................................................................................28Direct Costs ....................................................................................................................................................................................29Opportunity Costs...........................................................................................................................................................................30Cost Recovery Schemes ..................................................................................................................................................................30Carbon Credits ...............................................................................................................................................................................33Cost Structures................................................................................................................................................................................34
CONCLUSIONS AND RECOMMENDATIONS................................................................................................................................37
CONCLUSIONS ......................................................................................................................................................................................37RECOMMENDATIONS ............................................................................................................................................................................38
GLOSSARY............................................................................................................................................................................................39
BIBLIOGRAPHY ..................................................................................................................................................................................40
APPENDICES ........................................................................................................................................................................................45
APPENDIX A. ABOVE GROUND BIOMASS IN KG/TREE BY SPECIES AND SOIL ZONE...............................................................................45APPENDIX B. ALBERTA NATURAL UNMANAGED STANDS. ...................................................................................................................46APPENDIX C. SASKATCHEWAN MIXED WOOD FOREST.........................................................................................................................49APPENDIX D. MANITOBA UNMANAGED STANDS (EXCEPT SCOTCH PINE).............................................................................................50

III
LIST OF FIGURES
FIGURE 1. GREENHOUSE EFFECT. ................................................................................................................................................................2FIGURE 2: THE GENERALIZED CARBON CYCLE...........................................................................................................................................3FIGURE 3. PLANT-SOIL-ATMOSPHERE CARBON CYCLE...............................................................................................................................4

IV
LIST OF TABLES
TABLE 1. MAJOR GREENHOUSE GAS EMISSIONS BY SECTOR FOR CANADA IN 1990 (KILOTONNES). .........................................................14TABLE 2. SUMMARY OF CARBON DIOXIDE EMISSIONS BY SECTOR, PROVINCE AND TERRITORY IN 1990 (KILOTONNES)..........................15TABLE 3. PROJECTED REDUCTIONS IN NET GHG EMISSIONS....................................................................................................................23TABLE 4. A TAXONOMY OF INTERVENTIONS IN THE ENERGY SECTOR......................................................................................................35TABLE 5. COSTS AND BENEFITS OF CARBON OFFSET PROJECTS AT EIGHT LOCATIONS WORLDWIDE............................................................36
1
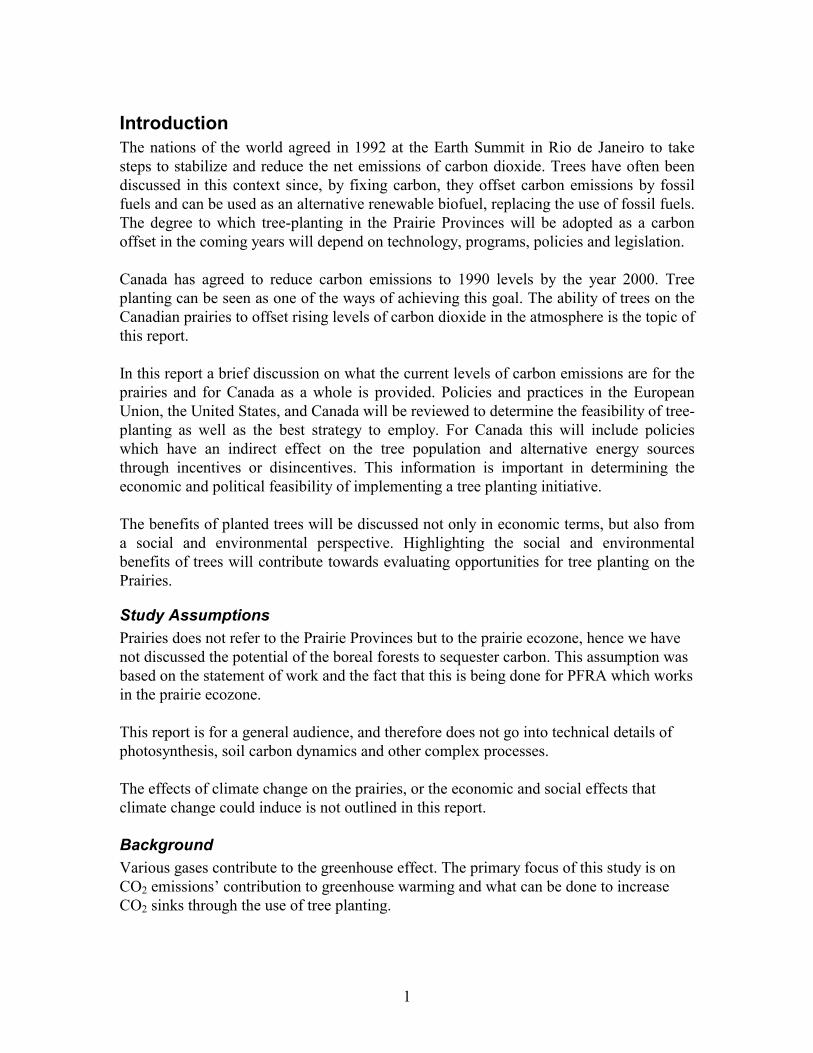
IntroductionThe nations of the world agreed in 1992 at the Earth Summit in Rio de Janeiro to takesteps to stabilize and reduce the net emissions of carbon dioxide. Trees have often beendiscussed in this context since, by fixing carbon, they offset carbon emissions by fossilfuels and can be used as an alternative renewable biofuel, replacing the use of fossil fuels.The degree to which tree-planting in the Prairie Provinces will be adopted as a carbonoffset in the coming years will depend on technology, programs, policies and legislation.
Canada has agreed to reduce carbon emissions to 1990 levels by the year 2000. Treeplanting can be seen as one of the ways of achieving this goal. The ability of trees on theCanadian prairies to offset rising levels of carbon dioxide in the atmosphere is the topic ofthis report.
In this report a brief discussion on what the current levels of carbon emissions are for theprairies and for Canada as a whole is provided. Policies and practices in the EuropeanUnion, the United States, and Canada will be reviewed to determine the feasibility of tree-planting as well as the best strategy to employ. For Canada this will include policieswhich have an indirect effect on the tree population and alternative energy sourcesthrough incentives or disincentives. This information is important in determining theeconomic and political feasibility of implementing a tree planting initiative.
The benefits of planted trees will be discussed not only in economic terms, but also froma social and environmental perspective. Highlighting the social and environmentalbenefits of trees will contribute towards evaluating opportunities for tree planting on thePrairies.
Study AssumptionsPrairies does not refer to the Prairie Provinces but to the prairie ecozone, hence we havenot discussed the potential of the boreal forests to sequester carbon. This assumption wasbased on the statement of work and the fact that this is being done for PFRA which worksin the prairie ecozone.
This report is for a general audience, and therefore does not go into technical details ofphotosynthesis, soil carbon dynamics and other complex processes.
The effects of climate change on the prairies, or the economic and social effects thatclimate change could induce is not outlined in this report.
BackgroundVarious gases contribute to the greenhouse effect. The primary focus of this study is onCO2 emissions’ contribution to greenhouse warming and what can be done to increaseCO2 sinks through the use of tree planting.

2
Figure 1. Greenhouse effect.
Source: Royal Society of Canada (1993).
The greenhouse effect is a natural phenomenon that is vital to life on Earth. The sunirradiates the Earth and about 70% of the incoming radiation are absorbed by gases in theatmosphere and by the planet’s surface. The result is similar to the action of a greenhousewhere warm air is held inside the greenhouse. The average temperature of the Earth’satmosphere is raised by the energy trapped by these gases, maintaining the Earth’stemperature within a tolerable range. This phenomenon is known as the “greenhouseeffect” and causes the earth’s surface to be about 33oC warmer than it would beotherwise. How solar energy and surface radiation is absorbed and reflected in thegreenhouse effect is depicted in Figure 1.
The most predominate greenhouse gases (GHG) are water vapour (H2O) and carbondioxide (CO2). Other greenhouse gases include chlorofluorocarbons (CFCs), methane
3
(CH4), nitrous oxide (N2O) and ozone (O3). Except for CFCs, all GHG occur naturally.CO2 is the most important GHG because of its long life span in the atmosphere.
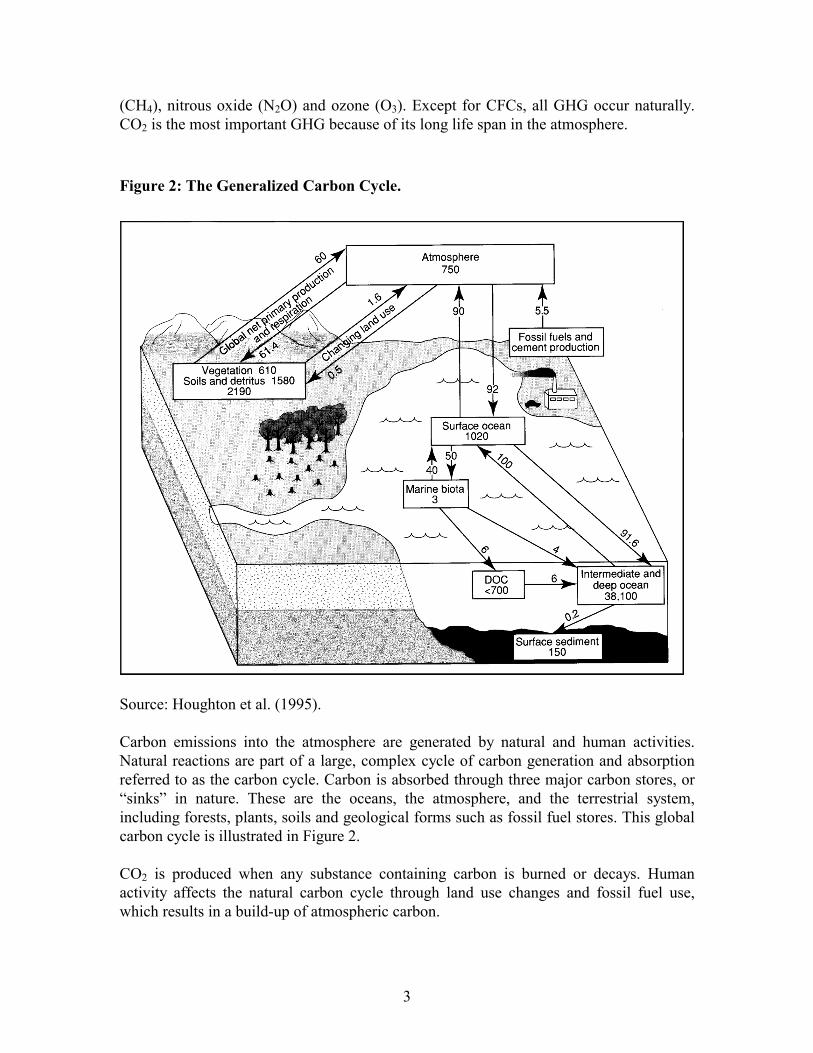
Figure 2: The Generalized Carbon Cycle.
Source: Houghton et al. (1995).
Carbon emissions into the atmosphere are generated by natural and human activities.Natural reactions are part of a large, complex cycle of carbon generation and absorptionreferred to as the carbon cycle. Carbon is absorbed through three major carbon stores, or“sinks” in nature. These are the oceans, the atmosphere, and the terrestrial system,including forests, plants, soils and geological forms such as fossil fuel stores. This globalcarbon cycle is illustrated in Figure 2.
CO2 is produced when any substance containing carbon is burned or decays. Humanactivity affects the natural carbon cycle through land use changes and fossil fuel use,which results in a build-up of atmospheric carbon.

4
Plants acquire CO2 from the atmosphere through photosynthesis to produce carbohydratessome of which are converted into new plant tissues. When this happens, carbon is fixedinto trees accumulating biomass in the form of organic carbon. While growth occurs, CO2continues to be absorbed. The rate of absorption will depend on the rate of growth of theplant. As long as plant growth exceeds decomposition, the net rate of carbonsequestration will be positive. Throughout the life of the plant and after the plant dies,plant residues, roots and exudates are decomposed by microbes. Some of the carbon isreleased back into the atmosphere as CO2 through respiration and some becomes part ofthe soil in the form of soil organic matter (SOM). Soil organic matter decomposes veryslowly and hence, soil becomes a substantial reservoir of carbon. Levels of soil carbon aredependent on many variables: microbial activity, temperature, moisture, and soildisturbances such as agricultural activity, clearing of forests, or fires. Figure 3 outlines theinteraction between plants, soil and the atmosphere as carbon is cycled.
Figure 3. Plant-Soil-Atmosphere Carbon Cycle.
Soil Organic Carbon
Shoot
Roots
CO2
(humus)Exudates
The ability of the soil and plants to fix carbon is attracting more and more attention as thetopic of global warming becomes a contentious issue. As yet, scientists cannot predictwith certainty whether a human-induced warming effect due to rising levels of GHG hasbegun; how much or at what rate the earth might warm; and how the climate change willaffect individual countries or regions over time. Climate and weather patterns changenaturally and it is difficult to separate normal shifts from human induced changes.Weather observation records point to global warming of about 0.5OC over the pastcentury. There is much contradictory evidence and analytical forecasting is uncertain.Scientists agree that atmospheric concentrations of carbon dioxide, methane,chlorofluorocarbons and nitrous oxide are increasing and that these concentrations maypossibly lead to higher global temperatures.
5
Assuming that global warming is taking place, warming is expected to be greater athigher latitudes and temperature increases are expected to be accompanied byunpredictable changes in climatic conditions. Patterns of agriculture and water availabilitywill be affected. Altered climates could affect world food security by changingagricultural productivity and would affect the productivity and biological diversity offorests and other natural ecosystems.
Controlling Rising CO2 Levels
Three ways of combating rising CO2 emissions are:• Substitution of lower carbon energy sources;• Reduction of the activity causing the emissions; or• Sequestration of CO2 .
Substitution of Lower Carbon Energy SourcesSubstitution of lower carbon energy sources can be done through switching from high-carbon fuels to lower-carbon fuels or switching to non-carbon sources of energy. Fuelswitching involves: 1) replacing fossil fuels, such as coal or oil, with lower carbon fuelssuch as natural gas; 2) replacing fossil fuels with biomass such as wood or ethanol; and 3)replacing fossil fuels and/or biomass with other energy sources such as solar, wind,geothermal, nuclear, tidal and hydro. The rationale behind such actions is that biomassenergy and biofuels emit less carbon than the burning of fossil fuels and are releasingcarbon that is in the carbon cycle. Carbon contained in biomass is not fixed and removedfrom the carbon cycle as is the case with fossil fuels before they are burnt. Furthermore,no net CO2 emissions are released during burning since any CO2 emitted is reabsorbed bygrowing crops
Reduction of the Activity Causing the EmissionsReduction of the activity causing the emissions can take place though a wide range ofmeans. These reductions would include changes in consumption patterns, more efficientgeneration of electricity and greater efficiency in energy use.
Most studies have concluded that reduced energy use is likely to be more important thansubstitution of lower carbon energy sources in reducing CO2 emissions but both will berequired if overall costs are to be minimized (Nichols & Harrison, 1991).
Sequestration of CO2
Sequestration of CO2 is the process of removing CO2 from the atmosphere and into othermediums, such as the oceans, soil and biomass of trees and plants. The speed of thisnatural process can be altered by human activity, and can lead to increasing or decreasingrates of sequestration. Typically, human activity results in a decreasing rate of carbonsequestering, but certain management practices can increase the net uptake ofatmospheric CO2 by vegetation and soils.

6
There is some uncertainty as to how natural carbon fluxes might be affected by potentialclimate change. If the balance of natural fluxes were disrupted, the future growth rate ofatmospheric CO2 could dramatically accelerate or decrease in a way that could makepolicies about human induced emissions irrelevant.
Human activities add to the natural occurrence of carbon dioxide in the atmospherethrough the burning of fossil fuels, the disturbance of carbon sinks and the use ofindustrial chemicals and fertilizers1. Coal, gas and oil are burned primarily fortransportation and power generation and are known to contribute significantly to CO2concentrations in the atmosphere. Carbon sinks are affected by soil disturbances andecosystem conversion such as deforestation or conversion of prairie and steppeecosystems into agricultural crops. Disturbing carbon sinks both emits CO2 and reducesthe amount of carbon dioxide that can be sequestered affecting their potential to fightrising CO2 levels. It is estimated that approximately 2 billion tonnes of carbon arereleased globally into the atmosphere annually due to tropical deforestation and changingland management practices (Houghton et al., 1990). It is possible for humans to compensate for the effect of these activities by creating newcarbon sinks or improving existing ones. At this point no way has been found in which toraise the potential of oceans to absorb more carbon. However, the two main ways toincrease carbon sequestration are to plant trees to compensate for deforestation andharvesting, and to change land management practices to maximize the soil organic matter.
International PoliciesThe international community has recognized the need to decrease carbon emissions andhas signed agreements which support the adoption of various activities which reduce oroffset carbon dioxide emissions. Individual governments are now in the process offormulating policy and legislation which will help them meet the commitments made inthese international agreements. What follows is a brief overview of the internationaldialogue on climate change and the various policies, statutes and actions which thegovernments of Europe, the United States and Canada have implemented.
Commitments and GoalsCanada has taken a strong leadership role internationally to address greenhouse warming.Canada helped to broker a consensus on an emissions protocol for developing countries,and on the implementation of pilot projects for the sharing of green technologies. Canadahas committed to a number of international agreements that recognized the need to reduceCO2 emissions.
1 Other sources of GHG also include rotting garbage, volcanoes, forest fires, decaying plants and
respiration by animals.
7
• In 1988, at the World Conference on the Changing Atmosphere in Toronto, it wassuggested for the first time that CO2 emissions be reduced 20% from their 1988 levelsby the year 2005.
• The Intergovernmental Panel on Climate Change (IPCC) was established in 1988 byUNEP and the World Meteorological Organization to assess existing scientificinformation on climate change, assess the environmental and socio-economic impactsof climate change and to advise the international community on the basis of thatknowledge.
• In 1987, Canada signed the Montreal Protocol, agreeing to reduce the use ofchlorofluorocarbons (CFCs).
• In 1990 Canada strengthened the Montreal Protocol by agreeing to eliminate the use ofthe most damaging CFCs by 1997.
• In 1992 Canada announced that it would eliminate use of CFCs by 1996.
In 1992 at the Earth Summit in Rio de Janeiro, Canada signed the Framework Conventionon Climate Change (FCCC) agreeing to reduce pollution, report on their actions, co-operate in research and carry out education on climate change. Canada was one of the firstcountries in Rio to sign the declaration agreeing to stabilize GHG emissions at 1990levels by the year 2000. The Convention recognizes the historical responsibility ofindustrialized countries for the current levels of human emissions of GHGs. Attentionwas focused on forests around the world and their role in the global carbon cycle. TheFCCC stresses the potential role of carbon sinks to mitigate the accumulation of GHG inthe atmosphere.
In 1995 at the First Conference of the Parties to the Framework Convention in Berlin,Canada agreed that current commitments to reduce GHG are inadequate. A draft programof Canada’s National Action Program on Climate Change (NAPCC) was approved andtabled at the Conference. Negotiations towards a protocol for quantified reductioncommitments beyond the year 2000 began. Canada also agreed to a pilot phase for JointImplementation where developed countries would get credit for sponsoring emissions-reducing measures in lesser developed countries. Joint Implementation was formallyadopted into the text of the Framework Convention on Climate Change in 1992 and refersto international co-operation between two or more governments who agree to implementstrategies to reduce or sequester greenhouse gas emissions. Canada has established itsown Joint Implementation Pilot Initiative as part of its National Action Program.(Canada, 1995; Environment Canada, 1995; SOE Report, 1995).
The European UnionThe European Union has fifteen Member States (Austria, Belgium, Denmark, Finland,France, Germany, Greece, Ireland, Italy, Luxembourg, The Netherlands, Portugal, Spain,Sweden and the United Kingdom). The first aim of the Union is to lay the foundation ofan ever-closer union between the peoples of Europe. The signing of the Maastricht Treaty(also known as the Treaty on European Union) in February, 1992 has laid the legalfoundation for doing so. A single European market and European Economic Area is nowin existence and should lead to economic and monetary union and, ultimately a single

8
currency in 1997. Balanced and sustainable economic and social progress is to bepromoted through these actions (European Commission, 1996a & b). Consequently, theUnion formulates policy and legislation in all areas relating to its Members including theenvironment.
Environmental concerns are not only a priority but are also inseparable from most otherpolicy areas for the European Union. This stance was given momentum in 1972 in ameeting of heads of European Community states in Paris. They agreed that economicgrowth was not an end in itself but that it should lead to an improvement in the quality oflife and standard of living. As such, particular attention should be paid to protecting theenvironment. The Single European Act (1987) reinforced this by requiring thatenvironmental protection form a part of the Community’s other policies. It also requiresthat environmental protection be pursued as an end in itself. The Maastricht Treatyextends the Union’s environmental policy objectives to include the goals of sustainablegrowth and the resolution of global environmental problems (Vohrer, 1991; Commissionof the European Communities, 1992).
Concern about global warming has prompted the Union to adopt policies relating tomeasures which it can undertake itself, as well as global responses which need to benegotiated multilaterally. A joint Council of Community Environment and EnergyMinisters convened in 1990 agreed on a common approach to the issue and aCommunity-wide response to this issue. The goal is to take action that will stabilizecarbon dioxide emissions at 1990 levels by 2000 in the Community as a whole. Potentialclimate change linked to the greenhouse gas effect will be built into future policyformulation. It has also become official policy that action needs to be taken to increaseenergy savings, improve energy efficiency and promote the development and use of non-fossil energy sources. This would address all human activities which contribute to theproblem, including energy, transport, agriculture and industry (Commission of theEuropean Communities, 1992; Samaras & Zierok, 1992)
Action taken in any one of these sectors is to be based upon an equitable burden sharingarrangement according to each state’s ability to bring about an improvement in thesituation. Measures are also to be co-ordinated and policies within Member states are tobe harmonized in order to achieve the maximum results possible. Thus, collective policieshave been developed for the transport and energy sector which are most responsible forcontributing to global warming. Such measures in the transport sector include permittingnational phased tax increases on fossil fuel oil in keeping with pollution of theenvironment, a weight distance tax2 on vehicles community wide, and restructuringtransport performance with the aid of economic and fiscal instruments. Priority is beinggiven to encouraging energy savings and renewable energy use by charging forenvironmental pollution as well as restructuring energy tariffs to reward energy saving. Astandardized tax on fossil fuel for primary consumption is also being suggested. As well, 2 A weight distance tax is differentiated according to the weight capacity of the vehicle and the
distance travelled. All things being equal, a heavier vehicle will consume more fuel and thus issubject to a higher carbon tax.
9
Member states are required to adopt targets and strategies that will limit greenhouse gasemissions as soon as possible. In keeping with a commitment to a global response,Member states are expected to collaborate internationally in the fight against human-induced climate change. The Community is especially committed to the transfer of energyplanning and technology to the developing countries.
The European Union (EU), thus far, has passed legislation and formulated policy onclimate change issues. Practices have not specifically been adopted by the Union.However, it has set up various programs which provide a support structure for Memberstates to take action. This is in accordance with the principle of subsidiarity wherebypolicy, legislation and practices should be applied at the source of the problem. Memberstates are more able to tackle emissions at their source within their own country. It isimportant to note, however, that all legislation passed in member states is subservient toEU legislation. Thus EU legislation and policies form the basis for practices adoptedwithin Member states. Hence it will be useful to review some of the programs that the EUhas and the practices which have been adopted by these Members.
In an effort to combine the goals of controlling carbon emissions and increasing energyefficiency, the Union has proposed a combined carbon and energy tax. Carbon would betaxed at double the rate for non-carbon fuels (nuclear) and renewable energy sourceswould be exempt. This proposal has not received wide-spread acceptance and has not yetbeen implemented. The THERMIE program aimed at innovative energy technologies hasbeen successful, however. Technologies funded through THERMIE have led to areduction in carbon emissions of 3 million tonnes. This new program not only supportsinnovation but also promotes the implementation of these technologies in the marketplace. The European Investment Bank also offers loans under advantageous conditionsfor investments in energy efficiency. SAVE is a medium to long-term program whichendeavours to create a more positive environment for energy efficiency by settingstandards and improving the quality of information available to consumers. Finally, theALTENER program will limit the emissions of CO2 by promoting the development ofrenewable energy.
Different Member states have opted to use differing methods for tackling climate changeproblems. Italy and Germany are both implementing co-generation schemes for energyproduction. Germany has also adopted improved soil conservation techniques to protectsoil carbon and a feebate3 system which encourages vehicle owners to use catalyticconverters. The Netherlands and Germany are involved in an international project where2 thousand hectares per year of the tropics will be reforested to offset carbon emissions.
3 Feebates refers to a system where producers of consumers of certain substances are required to pay
a certain rate for that action regardless of the legal limit permitted. Those who consume/produceless of the substance than the legal limits are then compensated for restraint. Thoseconsuming/producing more than the legal limit receive little or no compensation depending on howthe system is set up.

10
One of Ireland’s greatest efforts in combating CO2 emissions is afforestation andreforestation. The government’s target is to plant trees on 30,000 hectares a year. OtherIrish actions include fuel switching from coal to natural gas, and participation in the EUSAVE and ALTENER programs. Sweden’s efforts have concentrated on a carbon taxwhich has been in existence since 19914.
The United StatesAt Earth Day 1993, President Clinton announced that the U.S. would comply with theFramework Convention on Climate Change agreed to in Rio in 1992. Accordingly, theFederal Government has adopted a series of policies, legislation and practices which worktowards reducing net U.S. greenhouse gas emissions to 1990 levels5 by 2000. Clinton’sClimate Change Action Plan forms the foundation of the Federal approach.
The goal of U.S. climate change policy is to reduce the emission of greenhouse gases andconserve energy. The federal and states departments are supposed to apply measures to allsectors of the economy that emit greenhouse gases, and co-ordinate multiple programs. Acollective effort is considered desirable since it is assumed that using measures on theirown will only result in a modest impact on climate change. Investing in clean air andrenewable energy technologies is also considered to be an important policy objective.Ideally, research and development should lead to the creation of new jobs as well. Acommitment to monitor, evaluate and adjust current policies related to greenhouse gasemissions has been made by President Clinton (Clinton & Gore, 1993; US.EPA, 1990)
Internationally, the U.S. has committed to the prevention, mitigation and adaptation ofglobal climate change. In line with the perspective that climate change problems shouldbe collectively tackled, the U.S. government has adopted a policy of JointImplementation.
The basic federal instrument to improve air quality standards is the Clean Air Act. Theoriginal Act was enacted in 1955 and has been substantially amended in 1970, 1977, and1990. State programs under the Clean Air Act typically incorporate the followingelements:• inventorying of emission sources and monitoring of air quality for the purpose of
planning pollution control strategies;• issuance of permits to existing sources specifying permissible levels of emissions and,
if reductions are necessary, dates by which reductions must be achieved;
4 More information on these measures can be found in Enquete Commission (1995), Ireland
Department of the Environment (1993), Italy Ministry of the Environment (1994), Sampson(1995),and Schnutenhaus (1995).
5 U.S. greenhouse gas emissions for 1990 were of the order of 1462 million metric tons of carbonequivalent (MMTCE) (Clinton & Gore, 1993)

11
• monitoring of sources’ compliance via inspections, review of records, or sampling ofemissions and fuels;
• enforcement action against non-complying sources; and review and permitting ofproposed new sources of pollution (Liroff in Hansen & Roland, 1990).
Amendments to the Clean Air Act include a mandate to use emission trading and othereconomic incentives to curb pollution and CO2 emissions. Revenue from emissionstrading would be used to fund clean air programs and invest in infrastructure andpollution abatement technologies. The sale of cleaner gasolines is required in a clausewhich establishes the Oxygenated Fuel and Reformulated Gasoline Programs. Ethanoland methanol are listed as clean alternative fuels in the Clean Air Act and in the 1992Energy Policy Act. Requirements of the Energy Policy Act (1992), the Alternative MotorFuels Act (1988), the 1991 Executive Order 12759 - Federal Energy Management, andthe 1993 Executive Order 12844 - Federal Use of Alternative Fuelled Vehicles, shouldalso draw significant numbers of non-petroleum using vehicles into Federal, state, andprivate fleets by 2000.
A voluntary program for the reporting of information on greenhouse gas emissions andreductions, with the latter including forest management practices and tree planting hasbeen established through the Energy Policy Act (1992). In this way U.S. policy is alsoencouraging industry to look to forests as one way of mitigating greenhouse gasemissions (Sampson, 1995). Tree planting is also encouraged, but not a mandatory part ofthe Conservation Reserve Program contained in the 1985 Farm Bill which requires thesetting aside of some farm land under cultivation. The 1995 Farm Bill also contains theConservation Reserve Program, however, the 1995 Farm Bill has not yet been ratified.
Under the Clean Air Act each state is to develop its own pollution abatement program inorder to achieve ambient air standards. States have also been presented with increasedadministrative responsibilities and the need to make new investments in areas such aspublic transit in order to avoid cuts to their federal highway funds. An example of onesuch state program is the Minnesota ReLeaf Program. This is a tree planting programwhich is funded by a carbon content fee on fossil fuels. This essentially amounts to acarbon tax of 54¢ per ton of carbon. Further research by the Minnesota Pollution Agencyfound that while trees help to combat global climate change they do not necessarily resultin lower energy use in Minnesota. In response to this finding, the Minnesota governmentintroduced a bill in 1992 called the Sustainable Energy Transition Bill. This legislationproposes a $6 per ton carbon tax. Whereas the carbon content fee of 54c per ton of carbonis charged in order to fund the ReLeaf program, the $6 per ton carbon tax is intended toinduce individuals to reduce the amount of energy which they consume. The revenues ofthis tax are to be used to support energy assistance and energy conservation programs forlow income families, and for financing energy efficiency and renewable energy programs,and capital investments (Muller, 1993; Muller & Hoerner, 1993).
The Climate Change Action Plan (Clinton & Gore, 1993) draws the threads of policy andlegislation together well. The Plan, if implemented correctly, will reach the target for
12
greenhouse gas emissions through cost effective domestic actions. Such actions take theform of the Climate Challenge, the Climate Wise Programme, the Motor Challenge,Employer Paid Parking, The Biofuels Systems Program, the Biomass Power Program, aGreen Lights effort, “Golden Carrot” Programs for industrial equipment, and thePartnership for a New Generation Vehicle Initiative. Most of these actions are supportedby the policy objectives of collaboration between the private sector and the federalgovernments, and funding research and development.
Joint Implementation is viewed as a central part of the US’s international strategy toreduce greenhouse gas emissions. The U.S. Environmental Protection Agency (EPA),U.S. Agency for International Development and U.S. Department of Agriculture ForestService have launched a co-operative effort called “Forests for the Future”. As part of thiseffort, carbon offset projects are being negotiated in a number of countries includingMexico, Russia, Guatemala, Indonesia and Papua New Guinea. The U.S. has alreadysigned an agreement (in September 1994) with Costa Rica pledging their co-operation inreducing the threat of global climate change (U.S. Initiative on Joint Implementation,1994). The agreement endorses the use of bilateral private sector partnerships to reducegreenhouse gas emissions. Canada and the U.S. also have an Air Quality Agreement.They have agreed to control transboundary air pollution between the two countries and toset up objectives for limiting emissions and reducing air pollutants. Most of theseobjectives apply to sulphur dioxide and nitrogen oxides. However, the Subcommittee onAir Quality has been given the task of integrating other air quality issues such as smog,particulate matter and climate change which includes carbon dioxide emissions (The AirQuality Committee, 1994).
CanadaCurrently in Canada, CO2 is the principal greenhouse gas (GHG) emitted, accounting for87%, or 460Mt, of the total of all Canadian GHG emissions. (Environment Canada,1994). It was estimated in 1990 that the total GHG generated by humans in Canada wasequivalent to 526 megatonnes (Mt) of CO2 emissions. However, these figures have beenrevised to take into account methane from landfills and livestock, and revisions to theglobal warming potentials for methane and nitrous oxide. The most recent estimate oftotal CO2 equivalent emissions is now 577 Mt. “Based on this revision and changesestimated for projected energy-related emissions, forecasts indicate that total GHGemissions in the year 2000 will be in the range of 645 Mt, or about 13% higher than 1990emission levels (Environment Canada, 1995a).” Table 1 presents 1990 figures forCanada’s greenhouse gas emissions broken down by sector.

13
Internationally, Canada has the second highest levels of CO2 production per capita andper unit of GDP, second only to the United States of America. This is due, in part, to theproduction of energy intensive, internationally traded export commodities (gas, oil,minerals, forestry and agricultural) on which Canada’s economy is based. Large distancesbetween urban centres and a cold climate are also contributing factors in Canada’s highlevels of CO2 production. Broken down by province, Canadian CO2 emissions in 1990were as follows:
• 32% Ontario• 27% Alberta• 13% Quebec• 9% British Columbia• 6% Saskatchewan• 3% Manitoba• 10% Other
(Canada’s National Report on Climate Change, 1994)
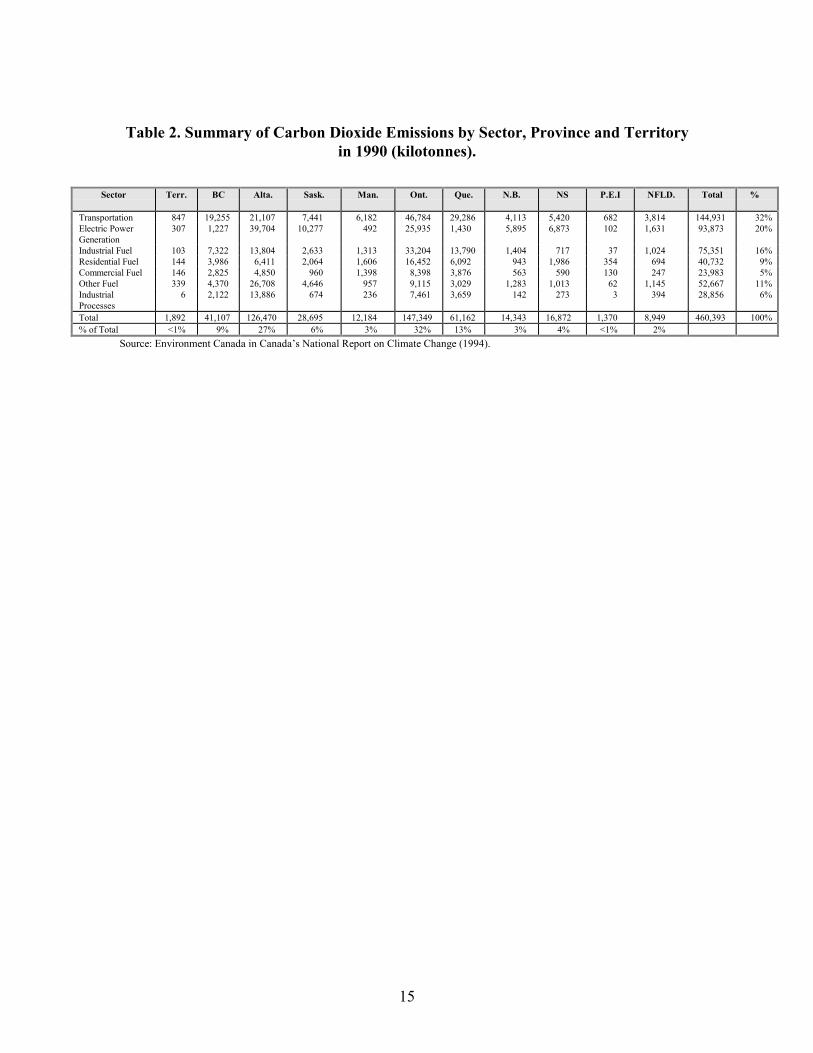
A more detailed breakdown of provincial CO2 emissions for each sector is in Table 2.

14
Table 1. Major Greenhouse Gas Emissions by Sector for Canada in 1990 (kilotonnes).
Source CO2 CH4 CH4CO2
Equiv.
N2O N2OCO2
Equiv.
TotalCO2
Equiv.
% ofTotalCO2
Equiv.Transportation SourcesAutomobiles 49,019 10 110 20 5,400 54,529 10.4%Light-duty Gasoline Trucks 23,094 5 55 9 2,430 25,579 4.9%Heavy-duty Gasoline Trucks 2,235 <1 <1 2,235 0.4%Motorcycles 149 <1 <1 149 <0.1%Other 7,292 1 11 1 270 7,573 1.4%Light-duty Diesel Vehicles 136 <1 <1 136 <0.1%Heavy-duty Diesel Vehicles 21,410 2 22 3 810 22,242 4.2%Other Diesel Engines 14,363 1 11 2 540 14,914 2.8%Air 13,137 1 11 1 270 13,418 2.5%Rail 6,315 <1 1 270 6,585 1.3%Marine 7,782 <1 1 270 8,052 1.5%Subtotal- Mobile Fuel Sources 144,931 23 253 38 10,260 155,444 29.5%
Stationary SourcesElectric Power Generation 93,873 1 11 2 540 94,424 17.9%Industrial Fuel 75,350 3 33 2 540 75,923 14.4%Residential Fuel 40,733 2 22 2 540 41,295 7.8%Commercial Fuel 23,984 1 11 <1 23,995 4.6%Other Fuel 52,667 <1 <1 52,667 10.0%Fuel Wood 1 11 3 810 821 0.2%Subtotal - Stationary FuelSources
286,607 8 88 9 2,430 289,125 54.9%
Industrial ProcessesUpstream Oil and GasProduction
7,567 1,100 12,100 19,667 3.7%
Natural Gas Distribution ? 18 198 198 <0.1%Cement/Lime Production 7,666 7,666 1.5%Non-energy Use 13,620 13,620 2.6%Coal Mining 143 1,573 1,573 0.3%Chemical Production ? ? ? 31 8,370 8,370 1.6%Subtotal - Industrial Processes 28,856 1,261 13,871 31 8,370 51,097 9.7%
IncinerationWood Waste 1 11 ? ? 11 <0.1%Other <1 ? ? <0.1%Subtotal - Incineration 0 1 11 11 <0.1%
AgricultureLivestock/Manure 1,000 11,000 11,000 2.1%Fertilizer Use 11 2,970 2,970 0.6%Land Use Change ? ? ?Subtotal - Agriculture 0 1,000 11,000 11 2,970 13,970 2.7%
MiscellaneousPrescribed Burning 38 418 1 270 688 0.1%Landfills 1,405 15,455 15,455 2.9%Anaesthetics 2 540 540 0.1%Subtotal - Miscellaneous 0 1,443 15,873 3 810 16,683 3.2%
National Total 460,394 3,736 41,096 92 24,840 526,330 100%
% of National Total 87% 8% 5%Source: Environment Canada in Canada’s National Report on Climate Change (1994).
15
Table 2. Summary of Carbon Dioxide Emissions by Sector, Province and Territoryin 1990 (kilotonnes).
Sector Terr. BC Alta. Sask. Man. Ont. Que. N.B. NS P.E.I NFLD. Total %
Transportation 847 19,255 21,107 7,441 6,182 46,784 29,286 4,113 5,420 682 3,814 144,931 32%Electric PowerGeneration
307 1,227 39,704 10,277 492 25,935 1,430 5,895 6,873 102 1,631 93,873 20%
Industrial Fuel 103 7,322 13,804 2,633 1,313 33,204 13,790 1,404 717 37 1,024 75,351 16%Residential Fuel 144 3,986 6,411 2,064 1,606 16,452 6,092 943 1,986 354 694 40,732 9%Commercial Fuel 146 2,825 4,850 960 1,398 8,398 3,876 563 590 130 247 23,983 5%Other Fuel 339 4,370 26,708 4,646 957 9,115 3,029 1,283 1,013 62 1,145 52,667 11%IndustrialProcesses
6 2,122 13,886 674 236 7,461 3,659 142 273 3 394 28,856 6%
Total 1,892 41,107 126,470 28,695 12,184 147,349 61,162 14,343 16,872 1,370 8,949 460,393 100%% of Total <1% 9% 27% 6% 3% 32% 13% 3% 4% <1% 2%
Source: Environment Canada in Canada’s National Report on Climate Change (1994).

16
In 1988, oil was the largest source of CO2 emissions, accounting for 55% of Canada’stotal human induced CO2 emissions. The remaining human induced CO2 emissions aresplit about equally between natural gas and coal. In Alberta, production, transportationand refining of gas and oil, and the petrochemical industry are major consumers of gasand oil as both fuel and feedstock. In Quebec and British Columbia, low-cost electricitygenerated hydrologically and through the use of biomass, including sawmill waste fromthe pulp and paper industry, reduce CO2 emissions. Fossil fuels, largely coal, are used togenerate essentially all the electricity in Saskatchewan and Alberta, and hence bothprovinces have large CO2 emissions from this source. Manitoba has relatively low-cost,hydrologically-generated electricity available. All the prairie provinces have relativelysevere winters and higher energy consumption in the winters for heating purposes.
Regional differences in CO2 emissions generation across Canada mean that maintenanceof the principle of interregional equity makes it difficult when developing policy toaddress the issue of CO2 emissions.
In Canada, the federal and provincial governments agree that climate change and risingCO2 levels are an issue of concern. This concern was recently echoed by theIntergovernmental Panel on Climate Change (IPCC) in 1995 when they wrote that “globalmean temperature changes over the last century are unlikely to be entirely due to naturalcauses, and that a pattern of climate response to human activities is identifiable inobserved climate records.” However, there is no agreement on just what the consequencesof climate change will be, in particular, prediction of rates and regional distributions ofclimate change.
The National Action Program on Climate Change (NAPCC) is Canada’s most recent planto address climate change. It is an update to Canada’s National Report on Climate Changereleased in 1994. In a consensus of federal, provincial and territorial governments, it setsout the principles, strategic directions and opportunity areas that Canada will follow toreduce GHG emissions. There are three components to address climate change. The firstcomponent is a variety of policy measures to reduce net emissions. The second is toresearch the connections between climate change and GHG. The third component withinthe NAPCC is to study the risks to Canada from climate change and how Canada mightadapt. The NAPCC is scheduled for review in December 1996.
One of the key elements under Canada’s NAPCC is the Climate Change VoluntaryChallenge and Registry Program (VCR). Under this VCR Program, Canadianorganizations, especially those in the industrial, commercial, and governmental sectors,are asked to voluntarily take actions to limit or reduce net GHG emissions. Eachorganization’s commitments, action plans, progress and achievements are then publiclydocumented. Under the VCR Program, organizations are asked to provide information onnet emission reductions planned. Actions such as energy efficiency improvement projects,fuel switching, or directly reducing emissions are encouraged. One of the main reportingcategories in the VCR Program is that of offsets. Initiatives that organizations take toenhance a carbon sink or to sequester greenhouse gases either through plants or soils,

17
domestically or internationally, are encouraged. Success of the VCR program reliesentirely on corporations and organizations to accept the challenge and devise action plansto reduce net emissions.
Industry does not want GHG emission reductions to be driven by government imposedregulations, taxation, or legislation. Instead, companies and organizations have asked foran opportunity to deal with emission reductions in a cost-effective way. The VCRProgram is seen as a way for industry to deliver in the manner that best suits theirparticular production and needs. This is a flexible program compared to carbon taxes,emission caps, and other programs that might be imposed if industry doesn’t comply withthe intent of the VCR.
Proponents of voluntary measures say business and governments have an opportunity tomaintain economic growth while making innovative, cost-effective and measurablereductions in GHG emissions. Such an approach recognizes that Canada’s internationalcompetitive position needs to be retained to meet domestic economic goals whilescientific knowledge is being improved. However, those critical of the National ActionProgram fear that without specific commitments to take action, supported by fiscal policyinstruments and minimum requirements set by regulation, no real progress on reducingemissions will be made. Government contends that the balanced approach offered throughthe use of voluntary measures allows the most cost effective means to reduce net GHG.
Provinces which wish to implement regulations or fiscal measures to regulate CO2emissions may do so (CASA, 1995). The federal government has authorized marketablepermits6 as an economic instrument, however, no jurisdiction has implementedmarketable permits for CO2 yet. There is concern that using economic instruments forreducing carbon emissions will have equity implications. While government imposedeconomic instruments such as marketable permits or a carbon tax offer cost-effectiveoptions of stabilizing or reducing CO2 emissions, they can often involve large transfers ofincome. Other legislation forcing reductions in CO2 emissions would require anunprecedented level of government intrusion into the economy and the decisions ofprivate firms and consumers (Nichols & Harrison, 1991). Voluntary reductions andmitigating efforts avoid these problems and is the way the federal government has chosento reduce CO2 emissions.
The NAPCC states that, “Canada will actively exploit opportunities to reduce greenhousegas emissions and enhance carbon sinks in agriculture and forestry.” According to theNAPCC, appropriate actions to enhance and maintain the carbon sink capacity ofCanada’s forests include increasing afforestation and establishing permanent plantcoverage with native grasses on marginal agricultural lands. Promotion of tree planting inurban and rural settings is suggested as a measure that could make an important
6 A government creates marketable permits for carbon by issuing x permits that allow y tonnes of
carbon to be emitted. In order to emit carbon it is then regulated that the producer has to have (a)permit(s). This creates a market where producers can buy and sell permits. Usually any amount ofcarbon emitted above the levels permitted is subject to a fine
18
contribution to enhance carbon sinks, though the NAPCC does not attach any numbers tothis suggestion. Changing agricultural practices in order to decrease other environmentalproblems such as soil erosion is highlighted as an opportunity to reduce GHG emissionand as well as a way to improve carbon sinks. Reducing summer fallow acreage,improving tillage practices, and making greater use of crop residues are recommended asimproved agricultural practices.
A principal piece of federal legislation in Canada dealing with environmental protectionis the Canadian Environmental Protection Act (CEPA). Initially developed in the mid1980s and proclaimed in 1988, it is currently being redrafted. A standing committeereviewed CEPA, and in December 1995 the government released a comprehensiveGovernment Response to the Standing Committee review of CEPA. Canada has alsoestablished the Canadian Climate Research Network (CCRN) to address critical scientificquestions related to climate change and climate variability. The CCRN stresses globalclimate models and is not action oriented.
The federal government released Canada’s Green Plan in 1990. The Green Plan set forth anational objective to provide a safe and healthy environment and a sound and prosperouseconomy for current and future generations. To meet this objective, the Green Plan was toprovide policy and direction for GHG emissions. There were several Green Planinitiatives that related to clean air, one of them being the stabilization of CO2 emissionsand other GHG emissions at 1990 levels by the year 2000. Under the Green Plan, aprocess of voluntary commitment by industry to reduce the production of CO2 emissionswas put forth. The Green Plan also recommended that 325 million trees or 325,000 ha offorest be planted to combat rising CO2 levels.
The Green Plan has recently been sunsetted as a result of the change in government.Programs that were created under the Plan may still be in existence but are being phasedout. Under the Green Plan, initiatives such as Environmental Partners looked aftercommunity funding, and environmental citizenship programs. Tree planting activitiesformed a part of the environmental citizenship programs. With the demise of the GreenPlan, Action 21 was launched by Environment Canada in September 1995 to respond tothe federal government’s commitment to communicate the individual and collectiveactions needed for sustainable development. Action 21 is not legislated but it will takeover the role of the Environmental Partners initiative. Under Action 21, the CommunityFunding Program provides financial support to non-profit, non-governmental groups toundertake environmental projects in their communities. Projects must protect, conserve,rehabilitate or enhance the natural environment and/or lead to the practice ofenvironmentally responsible behaviours. Under this program, projects that address theissues of air, ecosystems and natural diversity are encouraged. Ten million dollars peryear have been slated for Action 21. While the programs under Action 21 are just in thestart up phase, there appears to be many opportunities for tree planting activities toreceive funding.

19
The National Community Tree Foundation, now the Tree Canada Foundation (TCF) wasestablished in 1992 as an initiative of the Green Plan. The Foundation’s mandate is toadminister and promote the Tree Plan Canada program over a six year period. The TCFprovides education, resources, and financial contributions through partnerships toencourage Canadians to plant, care for and maintain trees in urban and rural Canada. Overa four year period, ending March 31, 1996, the TCF has been involved in the planting ofsome 52 million trees (personal communication Depper)7. In accomplishing this feat, theFoundation worked with the Canadian Forest Services and in partnership withorganizations such as Global ReLeaf, Earth Day Canada, and the Evergreen Foundation.TCF continues the Green Streets Canada program which expands urban forestry actionthrough involving local communities in tree planting. As well, TCF provides technicalassistance and endorsement for companies who wish to contribute to tree plantingthrough sponsorship programs. If carbon credits were to be offered in Canada for treeplanting programs, the Tree Canada Foundation would be well suited as a mechanism tooversee such a venture.
There has been much talk of more regulations and incentives such as rebate schemes tohelp reduce CO2 emissions. Various reports look into the feasibility of such actions. TheDRI/Marbek Resources report (1993) Canadian Competitiveness and the Control ofGreenhouse Gas Emissions and Alberta Energy/Environment/CAPP report (1991)Market-based Approaches to Managing Air Emissions in Alberta, are two such reports.The latter of these two finds that economic instruments such as tradable carbon couponsor a carbon tax are cost effective options for Canada as it strives to reduce CO2 emissions.
In the COGGER Report (1993) various studies, both in Canada and internationally wereevaluated, and it was determined that Canada not only has the ability to reduce emissionlevels to 1990 levels, but that to do so would be economically feasible. It was concludedthat reducing CO2 emissions is something Canada should do even without taking globalwarming into consideration.
The fact that reported industry actions to reduce emissions are currently not enough isdiscussed in the COGGER Report. No companies are taking sufficient steps to allowCanada to meet its stated goals, and no companies are going the extra mile and puttingplans into place to allow them to further reduce emissions. COGGER strongly states thatpolicy measures are necessary. However, no legislation or policies are forthcoming. Eventhe hint of impending steps by the government is enough to arouse industry leaders.Industries such as the Coal Association of Canada support voluntary measures“embracing cost effective, practical actions that have the additional merit of reducing therate of emissions. New or increased regulation and taxation are not justified” (CoalAssociation of Canada, 1994).
7 Tree seedlings planted though the Tree Canada Foundation programs are obtained from public and
private nurseries in the area. In the prairie region this would include PFRA tree nursery, theprovincial government tree nurseries, as well as private tree nurseries.

20
Companies and organizations are making changes and these changes have led toreductions such as those reported by organizations such as the Canadian ChemicalProducers’ Association (CCPA). The CCPA reports reductions of about one milliontonnes of carbon dioxide in 1993, a reduction of 8% over 1992. They are projectingcontinued decreases in CO2 emissions by 1998. The reduction of GHG emissions are dueto energy efficiency improvements made throughout the 1970s and 1980s. However, theystate: “Since the chemical industry is energy intensive, emissions of carbon dioxide arerelated to the rate of production. As the economy grows over the longer term, memberswill find it increasingly difficult to achieve the goal of stabilizing carbon dioxideemissions due to the challenge of further reducing the amount of energy used per tonne ofproduct (CCPA, 1993)”. This is not to say that industry will lessen efforts to achievefurther emission reductions. Rather, they expect to continue to work towards this andsearch for alternatives to some substances and to develop more efficient manufacturingmethods. These sentiments are echoed by other Canadian gas and oil producers.
Canada’s National Report on Climate Change (1994) predicts an increase in emissions ofGHG by 2000 over 1990. The report concludes that additional measures will be needed ifCanada is to meet its climate change objectives. Actions to do so are already under way ascan be seen by what some of the provinces are doing, however, they are not sufficient.
PracticesAlberta has led the way in setting action plans for air quality. Due to the province’s heavyreliance on natural gas and oil production, air quality has long been a concern. In 1990,the Government of Alberta initiated a public consultation process called the “Clean AirStrategy for Alberta”. That process acted as a catalyst for discussion on air quality issues,and helped to define the most pressing problems in Alberta and decide how best tocontrol them (Alberta Government, 1990). A recommendation that came out of thisconsultation was the need for a multistakeholder group to implement a new air qualitymanagement system. To meet this recommendation, in 1994 the Clean Air StrategicAlliance (CASA) was formed. CASA has put forth a number of recommendations forAlberta’s participation in the national climate change process which is the basis for theAlberta Action Plan and for the Alberta position in the national climate changediscussions. The Alliance has adopted a sustainable development approach to air qualitymatters and to achieve this manages air quality issues and makes public policy usingmulti-stakeholder consultation and consensus decision-making (CASA , 1995; AlbertaGovernment, 1990).
CASA has formed a carbon sequestration opportunities working group to identifyopportunities to enhance Alberta’s contribution to Canada’s stabilization undertakingthrough sequestration and storage of carbon in prairie soils and boreal forest ecosystems.They have, through the Alberta Government, encouraged the governments ofSaskatchewan, Manitoba and Canada to include the potential contribution through prairiesoils in their action plans.

21
Various energy efficiency programs are in place to reduce energy consumption across thecountry. One example is the Twenty Percent Club, in which at least eight Canadian cities,each with their own plan, pledge to reduce GHG emissions by one-fifth by 2005 from1988 levels. The eight cities (Edmonton, Metro Toronto, Montreal, Ottawa, Regina,Toronto, Vancouver, and Victoria) are sharing ideas in a joint effort to combat globalwarming. Main activities include retrofitting city buildings, introducing energy savingmeasures for the cities’ fleet of vehicles, and planting of trees. In addition to theenvironmental benefits, positive spin-offs of these activities are jobs and estimated energysavings in future years.
The Federal Government considers ethanol to be an alternative fuel and does not levy thefuel excise tax on ethanol, or the ethanol portion of ethanol blended gasoline. Provincialgovernments are free to do as they will with taxing of ethanol. Currently in Manitobaethanol blended gasoline is taxed at 2.4¢/L less than regular gasoline. Saskatchewanremoved the subsidy that had been allocated to ethanol blended fuels in 1995 and now, asin Alberta, the ethanol portion of the gasoline is not taxed. These tax breaks do nottranslate into savings at the pump as ethanol is presently more than twice the price ofconventional fuel. Bruce Hodgins, Mohawk Oil Co. Ltd. (personal communication,March 14, 1996) states that remaining ethanol subsidies and tax breaks are beingreviewed and may disappear in the next few years as provincial governments continue totighten their budgets.
In British Columbia, BC Hydro can apply a premium to electricity derived fromenvironmentally acceptable sources. Regional Districts in British Columbia, for examplethe Capital Regional District, have developed recommendations for all levels ofgovernment to address atmospheric change. Measures to reduce GHG and to increase andprotect carbon sinks, coupled with emission regulations have shown commitment by theprovincial government to take action rising GHG levels. Ontario has a mid-efficiency gasfurnace standard, and various provinces have vehicle inspection and maintenanceprograms. Under the Green Plan, the federal government specified some policies, such asminimum appliance efficiency standards and expansion of the R-2000 program.
The programs mentioned above encourage reductions in CO2 emissions. There are alsoprograms which encourage actions that enhance carbon sequestration. The governmentrecognizes that there are two ways in which humans can do this: changing landmanagement practices and planting trees.
CO2, methane and nitrous oxide emissions related to agricultural activities, such asmanure and fertilizers (represented on a CO2 equivalent basis) account for approximately5% of Canada’s greenhouse gas emissions. Agricultural production is also a largeconsumer of fossil fuels to power farm equipment and vehicles. One program that may beeliminated in the future is the fuel rebate for fuel used for agricultural production. Such aprogram does little to encourage reduction of fossil fuels, which goes against the NAPCC.If the program is not eliminated, perhaps it will be modified to encourage use of biofuels.
22
Given agriculture’s contribution to rising CO2 levels, it would make sense to apply policyand action in this sector too.
To encourage the transfer of land out of production and into a protected, preserved,conserved, or natural state, there are tax exemptions for land owners. These exemptionsfall under Canada’s Permanent Cover Program. Such changes can reduce the amount ofcarbon loss associated with agricultural operations, and improve soil organic matter andsink capacity of the soil. Agricultural soils will either be a source or sink for carbondepending on the quantity and quality of soil organic matter and the managementpractices used. Interactions among agricultural practices, climate, and retained carbon areextremely complex (NAPCC, 1995). Since it is not possible to control the effect ofclimate on soil organic matter, attention must be focused on adjusting agriculturalpractices.
Agriculture is fundamental to current human existence and cannot be terminated as anactivity. However, by changing agricultural practices it is possible to decrease carbonemissions and prevent further carbon losses. Changing farming practices can includereduction and elimination of tillage, direct seeding, and decreased summer fallow all ofwhich lead to less cultivation and therefore less fuel burned. Continuous cropping,permanent forages, the use of forages in crop rotations, and trees planted in shelterbelts orin woodlots all represent storage sites for carbon. Continuous cropping and reducedtillage systems increase soil organic matter which is another major site of carbonretention. Better tire performance, gear selection, and tractor sizing also help improve fuelefficiency and reduce emissions. Decreased usage of fossil fuels and increased productionof renewable fuels such as ethanol will also decrease the net CO2 emissions generated bythe agricultural producer. Production of nitrogen fertilizer used in agriculture is anothermajor source of carbon emissions. Therefore, substitution of animal manures and legumesfor commercial nitrogen fertilizers would lessen the consumption of fossil fuels.(CASA,1995). Many of these practices are already being incorporated in Canada for economicand environmental reasons.
If farm practices are changed and if there is a reduction in ruminant animal methaneemissions and improvements in livestock manure efficiency, it is estimated GHGemissions can be reduced by 14 million tonnes of CO2 equivalent (3.7 million tonnes ofcarbon) by the year 2000 relative to 1990 (National Agriculture Environment Committee,1994). These projected carbon reductions are presented below in Table 3. The figures of3.7 and 5.6 million tonnes of carbon translate into 14 and 20 million tonnes of CO2respectively. When compared to total estimates of Canadian emissions of CO2 equivalentfor 1990 this represents 2.7% and 3.8% of emissions related to human activities.
In addition to changing farming practices, tree planting is seen as a relatively low-costsolution to sequester carbon with multiple benefits. Tree planting helps offsetdeforestation, expands carbon sinks, and trees can be used in the production of biofuels.

23
Table 3. Projected Reductions in Net GHG Emissions.
1990-2000 1990-2005 - - millions of tonnes of carbon/year - -
Reduced summer-fallow 0.2 0.2Adoption of no-tillage 1.0 1.6More forages 0.9 1.2Higher yields 0.9 1.4Ruminant animals 0.1 0.2Livestock manure NE NENitrogen fertilizer NE NEFossil fuel usage 0.5 0.7Ethanol-blended gasoline 0.1 0.3Photosynthetic “feed-back” NE NE
TOTAL ESTIMATE 3.7 5.6
NE - Not estimatedSource: National Agriculture Environment Committee (1994).
The rate at which CO2 is sequestered by trees depends on the species of trees planted, soil,water and weather conditions, age of trees, as well as the location of their planting. TheOECD (1991) provides an average carbon sequestration rate of 2 tonnes ofcarbon/hectare-year on average for tree plantations in temperate climates. This figure issomewhat higher than the sequestration rate that is expected in urban areas. However, thisrate is considered conservative as it does not take into account the carbon added to thesoil pool by leaves and branches falling from the trees (Stewart, 1992 in DRI & Marbek,1993).
There are conflicting opinions on whether planting trees will help Canada reach its short-term 2000 target. A study prepared for the Canadian government by DRI and Marbek(1993) states that: “Planting more trees than the 325 million called for in the Green Planover the simulation period could not take up significant additional amounts of carbon by2000 or even 2010.” They assumed that it would take trees fifteen years to reach theaverage sequestration rate of 2 tonnes/hectare/year. Their calculations suggest thatapproximately 230,000 tonnes/year of carbon, or 851 kilotonnes/year of CO2, would besequestered after 10 years. After 20 years approximately 650,000 tonnes/year of carbon or2,383 kilotonnes/year of CO2 would be sequestered (DRI & Marbek, 1993). Planning forshort-term goals, however, does not take care of sustainability issues such asintergenerational equity8. In the longer term trees do have the potential to offsetsignificant amounts of carbon dioxide. 8 Intergenerational equity refers to consideration of future generations in the allocation, distribution
and use of resources.

24
The Prairie Farm Rehabilitation Administration (PFRA) has been carrying out research ontree and shrubs in the prairies, and providing tree and shrub seedlings, along withtechnical expertise on planning, planting, and maintaining trees and shelterbelts in theprairie provinces since 1935. More recently, PFRA has been conducting research onbiomass production on the prairies. Estimates on biomass and the amount of carbon incaragana, green ash, Manitoba maple, hybrid poplar and Siberian elm are given inAppendix A (Kort & Ashford 1994; Kort, 1996). The Tree Canada Foundation hastabulated carbon data for the prairie provinces looking at various species of trees, sitetype, and age of trees and calculating biomass and total carbon fixed by the trees (TreeCanada Foundation, 1995). This information is available in tables in Appendix B, C, andD of this report.
Tree planting initiatives can fall under a number of categories. Reforestation takes placein commercial forests which are managed primarily for harvesting and regeneration ofwood for use in the timber, or pulp and paper industry. Reforestation or afforestation cancreate woodlots in rural areas where land is currently used for crops, pasture, or which isof marginal value. Planting of trees to form shelterbelts, living fences or for aestheticpurposes adds trees to an area without drastically changing the use of the land. Trees canalso be planted, or protected, to create urban forests. Urban forests consist of treesgrowing in the vicinity of homes and other buildings in places where the dominant landuse is urban or suburban areas.
On the prairies, corporations and organizations have initiated tree planting projectsoutside of those aided by the Tree Canada Foundation. TransAlta Utilities Corporation inAlberta has been very proactive in its tree planting efforts and research on carbon fixing.In Saskatchewan, SaskPower operates a greenhouse, heated by wasted heat generated atits Shand Power Station, which produces about 300,000 seedlings each year forreforestation projects (SaskPower, 1995)9. An association of western Canadian electricaland gas and oil companies is in the process of forming the Greenhouse Gas EmissionsManagement Consortium (GEMCo.) GEMCo aims to demonstrate industry leadership indeveloping voluntary and low cost opportunities for GHG emission management. Energyproducing companies seem to be interested in planting trees as part of their overallenvironmental program. Tree planting does not appear to be seen as an economicallyviable undertaking for corporations if the purpose is strictly for carbon fixing. If increasedCO2 sequestration is one of a number of benefits (i.e. local economic development, andcommunity benefits) then corporations are more likely to become involved inreforestation and afforestation projects. This interest could also be due to the highvisibility of tree planting, and more importantly, that this activity may delay theimposition of government regulations.
9 These reforestation projects were originally intended for reclaiming land that had been mined.
However, SaskPower is now recognizing the carbon sink potential of these trees as well.
25
Ownership rights to trees planted under initiatives to offset CO2 emissions could becomea contentious issue. Rheaume (1993) cites an example of an oil company investing inafforestation done by a logging company on provincial land. Who owns and isresponsible for the trees; and then who decides if, and/or when they are harvested(reducing the offsetting effect in the process); are all questions with no easy answers.Rules of conduct in the use of offsets need to be established in cases such as the one justdescribed, or in variations of this scenario, such as international reforestation.
Feasibility of Tree Planting as an ActionTo assess whether it is feasible to reduce carbon dioxide emissions through plant biomassincrease, a couple of things need to be taken into account. First of all, it would be logicalto use plant species that fix the most carbon or have the greatest potential forphotosynthesis. The rate at which CO2 is sequestered depends on the species planted aswell as the location of their planting, soil type, and weather. Not all plants are suitable forall environments, so they need to be selected first on the basis of whether they will growin the environment in question. Trees and shrubs that grow well in the prairies must beable to deal with the limited water and harsh winters. Caragana is the most widelydistributed shelterbelt species on the prairies because it is so hardy and adapted to theconditions. However, fruit bearing trees and shrubs such as the buffaloberry, chokecherry, and Saskatoon also grow well.
Furthermore, when considering how much carbon can be fixed, it is not only important tolook at how much is accumulated in the biomass but also at what the turnover rate ofcarbon is in the cycle. Agricultural plant biomass stores less than 10% the carbon thattrees do, but Naeth (1990) in reviewing the published literature has found that theturnover rate for non-woody species is much higher than for tree species. She also foundthat the amount of below-ground biomass, which contributes significantly more to carbonsinks, is higher in non-woody plants. Thus, temperate grasses and legumes have greatpotential to enhance the amount of carbon being stored as soil organic matter. Plantingherbaceous species such as grasses, vegetables, and cereal crops can be just as effective asplanting trees in reducing atmospheric CO2. In this paper, however, we look at thefeasibility of planting trees only. In examining the feasibility of adopting such an action itis necessary to look at both the benefits and the costs of doing so.
Trees are net sources or sinks for carbon depending upon net changes in biomass. Morecarbon is absorbed than released only when incremental growth exceeds incrementaldecay. Investment in afforestation programs and encouraging various forest managementactivities designed to promote tree growth as a method to mitigate global warming is seenas a temporary and limited solution as trees absorb carbon only as long as they aregrowing.
BenefitsMany of the actions that can be taken to reduce climate change have other benefits. Forexample, conserving energy saves money and also helps reduce problems such as acidrain and smog. Forests and trees, because of their carbon storage capacity, present an

26
important opportunity for CO2 emission mitigation. In addition to fixing carbon, treesoffer a myriad of additional socio-economic benefits such as erosion control andconservation of soil and water, aesthetics, wildlife habitats, conservation of biodiversity,watershed protection, pollution control, and reduction in temperatures. Some of theenvironmental, economic and social benefits of trees bear further discussion.
EnvironmentalTrees contribute to the health of the environment both within Canada and around theworld. They help to regulate atmospheric conditions and moderate the effects of externalforces on soil and water. Trees protect the soil by sheltering it from strong water flow andfrom wind. Tree roots absorb water and nutrients from the soil. Leaves fix carbon dioxidefrom the atmosphere, returning oxygen as a by-product. The carbon is fixed in thebiomass and soil during the process and stored for years. The functional value providedby these benefits is difficult to quantify, however.
Ecological functions that trees perform, such as hydrological and carbon cycling,regulation of watersheds, and protection of soil are very important to the ecosystem andas a result, communities within the system. The following is a list of some of the moreimportant environmental effects of trees:
• improve soil health; increase soil organic matter• reduce wind and soil erosion; protect soil, crops, livestock, homes• increase moisture• wildlife and biodiversity aspects, both positive and negative• purify air• assist in snow trapping for dams/dugouts• improve watershed and groundwater conditions• carbon fixing• climate regulation
Whether soil organic matter will be enhanced may depend on the status of the soil at thetime of planting. Soils under brush or pasture may be at or near normal SOM levels.
Anielski (1991) estimated the service value of Alberta forests and peatlands in thefixation of carbon from CO2 emissions. These estimates show that Alberta’s forestssequester roughly 24% of Alberta’s total CO2 emissions and that forest peatlandssequestered an additional 3%. The conservative value of the benefit of the carbonsequestering in 1990 was $186 million dollars with an upper value given as $2.79 billion.This conservative estimate translates roughly into 23% of forestry GDP ($807 million) in1990 (Anielski, 1991). When looking at these estimates it must be noted that because ofproblems with measuring emissions and removal of CO2 emissions by organic matter, itis not possible to reach definite conclusions.
27
EconomicBeyond the environmental benefits of trees, there are a variety of economic spin-offs fromplanting trees to sequester carbon. To begin with, economists have attempted to estimatethe value of carbon and the economic welfare losses due to GHG emissions to determinea shadow price for CO2. Estimates of the value of carbon vary depending on assumptionsconcerning the rate of technical change, the rate of growth of the economy, the discountrate, levels of damage from CO2 emissions, and the percentage reduction in CO2emissions. The value for carbon for a 20% reduction from 1990 levels has variously beencalculated at between US$11 and $275 per tonne. At a reduction rate of 50% from 1990levels, the value of carbon has been calculated at $132 per tonne (Nordhaus in VanKooten, 1992). Nordhaus (in Van Kooten, 1992) has also assessed that the best estimatefor marginal damages from carbon emissions is $14 per tonne. These values may becomesignificant if a market for carbon emissions credits is set up.
A more direct economic benefit of trees is that they provide an opportunity forlandowners to diversify and stabilize incomes. With recent changes in technology, whatwas once considered waste wood can now also be utilized for fibre. This coupled withpressure on public forests by recreational users, environmental groups and others, manyforest products firms have been considering alternative sources of fibre. Trees inwoodlots are receiving high prices from BC sawmills for pulp and paper production. Landowners in Alberta were getting $45 to $50 a cubic metre in 1994, while Saskatchewanwoodlot owners were receiving $25 to $29 a cubic metre for softwoods. Rampantharvesting of these private wood supplies is now coming under regulation in order tomeet environmental standards. This will affect how much private land is harvested andwhen, thereby limiting the regularity with which harvesting can take place, but raising theprice of timber due to scarcity value. High prices for timber such as these could work as astrong motivator for farmers to adopt tree planting practices (Nikiforuk, 1995). However,while woodlots on the prairies may be one way for land owners to diversify, a 1995 reportsuggests that hybrid aspen plantations may not be financially feasible on private land(Salkie & White, 1995).
Lumber from prairie trees can also be used for rough construction, used by artisans, orsold for fuelwood. PFRA has assessed the lumber potential of Manitoba shelterbelts andfound that the average value of lumber for a half mile shelterbelt was $3,465 based onlumber values of $462/thousand board feet for ash and $400/thousand board feet for elm.Wood from prairie trees can also be sold as firewood (PFRA, 1993).
Harvestable produce from trees offers another source of income to land owners. Softfruits such as Saskatoon berries and choke cherries are becoming more and more popular.Fruit trees require a lot of water and maintenance and this may be an inhibiting factor iffarmers were to plant them in their shelterbelts. PFRA is now also looking into theproduction of maple syrup from native Manitoba maples.
Conservation benefits of trees offer economic savings too. Increased soil organic matterresults in reduced fertilizer costs and higher crop yields. Energy is conserved through

28
shading and windbreak effects on buildings which means lower heating and cooling billsas well. In a study looking at shelterbelts in Saskatchewan determined that while heat lossreduction varied with the density of the shelter and the velocity of the wind with thereduction realized between 17.5 - 25% (Moyer, 1990). These values were consideredconservative. Other studies have looked at urban tree planting and found that coolingsavings from a well-placed trees can be in the 10 - 43% range. This cooling results bothfrom shade from the tree and lower air temperatures from evapotranspirational cooling(McPherson, 1994).
SocialWhile the main benefits of planting trees in the prairies are environmental and economic,there are also social benefits realized through tree planting. Social benefits of trees aredifficult to quantify. For instance, there is an existence value of trees which peoplereceive just by knowing that they exist.
The primary social benefit of trees is the aesthetic value they provide. Trees areconsidered to be beautiful and to add the landscape. They provide habitat to wildlife andin so doing add to amenity and recreational values, particularly for birdwatchers andhunters. Wooded areas also offer the possibility of nature education for children. Treesperform a security function too. They are a shelter against the elements in general androadside shelterbelts can be used to control snow drifting.
Trees help to reduce winds, control dust, and absorb air emissions resulting in cleaner air,which is a social benefit in terms of human health. Shade and cooling benefits providedby trees can also have positive health impacts during the hot season.
Costs and Cost Mitigation of Tree PlantingCosts associated with tree planting programs need to be examined from threeperspectives: the cost of not adopting any measures to reduce or counteract CO2emissions; the direct cost incurred in adopting a tree planting programme; and the cost ofusing land for trees rather than some other purpose like crops or pasture. From theviewpoint of sustainability it is also important to consider not only the pecuniary costs,but also the social and environmental costs of these actions. Ways of recovering cost isalso something to be considered because in the balance of things this will make certainactions more viable.
The Cost of InactionIntensification of the greenhouse effect is thought to cause global warming and climatechange. To date no actual effects of this process have been convincingly demonstrated,but it is reasonable to suppose that important environmental consequences will resultfrom an intensification of this warming function. These effects could be more frequentand climate extremes; disruptions to agriculture; extinction of some species of animalsand plants; increased disease and pest infestations; rising sea levels; changes in waterquality; and economic consequences (Freedman & Keith, 1995). Changing climate mayhave a detrimental effect on agriculture as well. The more productive lands of the
29
southern prairies are projected to experience more frequent droughts and reduced yieldswhich could be accompanied by a new wave of human resettlement. In the north, warmertemperatures will expand the growing season and may increase yields. The potential alsoexists for expanding agriculture further north. However, a limiting factor will be a lack ofsuitable soils.
Assuming the climate is changing as predicted by the various climate change models,coping with increased drought, forest fires and severe storms would cost Canadiansbillions of dollars. Less would be spent on heating but this would be balanced by the airconditioning bill. Shorter winters and longer summers would change the recreationalchoices that people make, at the same time threatening some people’s livelihoods andimproving other’s. Municipal taxpayers would pay more or less for snow removalservices depending on where they live and the shipping season would be ice-free forlonger. Individuals and insurance companies alike will have to bear the costs of copingwith a changing climate (Environment Canada, 1995b).
An actual pecuniary cost has not yet been calculated for these possibilities. It is, however,prudent to consider strategies to avoid the potentially devastating consequences of globalwarming and climate change. It is from this perspective that tree planting on the prairiesis considered as a method for offsetting harmful carbon emissions.
Direct CostsDirect costs of tree planting include the cost of site preparation, the cost of seedlings, thecost of planting the trees and the cost of maintaining them once they have beenestablished. Maintenance consists of weed and pest control, and tillage. PFRA (undated)estimates the costs of maintaining shelterbelts at Cdn $31/km (these costs do not includepruning or watering). Direct cost for planting trees in Saskatchewan has tentatively beenestimated at $1,215 per ha.
In determining whether it is viable to plant trees for sequestering carbon it is necessary toknow how much it cost per tonne of carbon fixed. The cost of planting trees per tonne ofcarbon fixed for both urban and rural forests has been calculated. The cost per tonne ofcarbon fixed in Saskatchewan would then range between $9.14 (assuming 133 tonnes ofcarbon fixed) and $37.04 (for 32.8 tonnes of carbon fixed) depending on the type oftree/forest and soil type. Typically, urban forests cost more than rural forests due to thefact that trees are larger when planted and have higher maintenance costs in the earlypost-planting years. Estimates for planting urban trees have been calculated at U.S. $15-30 per tonne of carbon fixed compared to U.S. $1-10 per tonne carbon fixed for ruraltrees10. However, the benefits of energy saving through strategic planting of urban trees
10 Other studies (in North America) have estimated the cost of establishing rural trees for carbon
sequestration by calculating the cost of establishing trees plus the opportunity cost as agriculturalcommodities are displaced by trees. The estimates for sequestering 39 million tonnes of carbon peryear range from U.S. $13.52 per tonne to U.S. $18.22 per tonne of carbon (McCarl &MacCallaway, 1995).

30
have not been figured into the calculation. A study in Chicago showed that urban treesoffset 2-10 times more carbon in energy savings than was sequestered by the growingtrees (McCarl & MacCallaway, 1995; Freedman & Keith, 1995). The ratio of carbonreduction through energy saving to carbon sequestered through the planting of trees,however, will vary depending on whether fossil fuel inputs are used to generate energy ornot.
Opportunity CostsPlanting trees on a large scale, particularly in the rural areas, means forfeiting otheractivities which could take place on that land. The cost of forfeiting one activity foranother is known as the opportunity cost. Most commonly, planting trees on rural landswill reduce the land available for planting crops which will involve reduced income dueto smaller yields. Trees could be planted on what was formerly pasture as well. Farmerscould benefit from this new activity as the trees provide shelter from the wind in winterand sun in the summer. If the trees planted are harvested for commercial gain this willalso affect the price of timber when done on a large enough scale. Furthermore, somefarmers are reluctant to plant trees because they limit their flexibility in using the land infuture years (Sampson, 1995). Other factors which inhibit farmers from planting trees are:increasing numbers of birds and wildlife which threaten crops; decreased yields due toland loss; time spent on maintaining trees which could be otherwise spent; increasingwear and tear on equipment due to turning in smaller areas; competition of trees forlimited water; sometimes trees trap too much moisture at the end of winter and delayseeding.
Agricultural activities also have the potential to sequester carbon. Crops and pasture storecarbon through photosynthesis and increasing soil organic matter. By changingagricultural practices this potential can be further enhanced. No till practices, reducingsummer fallow, and permanent pasture contribute to increased soil carbon. The level ofsoil carbon will increase as these improved farming practices are adopted. However, thelevel of soil carbon will only increase up to an equilibrium point which is dependent uponvarious characteristics of the soil. Once this level of soil carbon has been reached, nofurther net carbon increases will be achieved. In this sense trees have a greater long-termpotential for sequestering carbon since they fix carbon for as long as their biomass isincreasing.
Cost Recovery SchemesSome of the costs of adopting tree planting on the prairies could be recovered. Trees havemultiple uses beyond that of carbon fixing. Soil erosion is decreased by trees planted aswindbreaks and shelterbelts which also protect soil organic matter. As an economicsaving, they reduce the amount of fertilizer needed and produce energy savings which canbe used to offset costs. Urban forests can also result in significant energy savings throughshading of buildings in summer and reducing the cooling effect of windspeeds in winter.Trees, as shelterbelts and as woodlots, also have the potential to be harvested for energyproduction, be that for replacing coal, oil or natural gas in electric power stations; orproducing ethanol - a biofuel (Freedman & Keith, 1995; Sampson, 1995). The rationale

31
behind such actions is that biomass energy and biofuels emit less carbon than the burningof fossil fuels. Furthermore, no net CO2 emissions are released during burning since CO2emitted is reabsorbed by growing crops.
High-energy crops such as alfalfa and switch grass, and short rotation forestry systems,like hybrid poplar and willow trees, are used for generating biomass energy. If trees inshelterbelts and woodlots are to be used for generating energy, then attention needs to bepaid to the types of trees planted in these settings. Trees need to be fast growing andharvested in 5- to 15-year cycles to be economically viable as a source of biomass energy.Growing poplars and hybrid poplars on the prairies may meet these requirements,although it would appear that poplars are harvestable in 15- to 20-year cycles. However,poplars are sparsely branched and once they lose their leaves in the fall, offer very littleprotection from the wind. Their shallow root system also makes them competitive withcrops and gardens for water. Thus many of the other benefits from planting trees are lostby planting poplars in shelterbelts. If poplars were planted on the outside of farmyardshelterbelts or in woodlots they would be more viable for biomass energy and as a carbonsink (PFRA, 1992).
Thus far, most experience in biomass energy generation has not involved tree crops.However, scientists are of the opinion that trees are the best way forward since they donot suppress world food prices and are cheaper to use for this purpose than food crops.Most of the emphasis in studies being conducted in the U.S. and Canada is now ondeveloping fast-growing trees and grasses as energy crops (US.DOE, 1994, Samson &Omielan, 1992).
While trees have the potential to be used as alternative energy crops, they are stillrelatively expensive in comparison to conventional forms of energy. A study done by theOrganization for Economic Co-operation and Development (OECD) revealed thatgenerating a kilowatt-hour of electricity from wood results in only about 10-20% of thegreenhouse gas emissions that result from existing electricity generation in Europe or theUnited States. The electricity, though, comes out at 20-80% more expensive than powergenerated with existing fossil fuels (assuming no subsidy to wood production) (Michaelis,1994). Thus, in the bigger scheme of things, producers of energy crops may recoup someof their expenses but the overall costs of producing alternative energy may be exorbitant.If overall cost recovery is to occur in this way, major improvements need to be made inthe technology used to produce biomass energy.
Another way of recovering costs is to use trees in the production of ethanol. At presentethanol is used as a blending ingredient in gasolines or as a raw material to produce high-octane fuel ether additives. To date ethanol has primarily been produced from wheat inCanada, corn and other starch crops in the United States, and from rapeseed oil in Europe.The production cost of corn ethanol ranges from 35¢ to 58¢ per litre of gasolinesubstituted, wheat ethanol costs 35¢ - 45¢ per litre to produce, and rapeseed oil methylester (RME or biodiesel) costs 50-60¢ per litre diesel replaced (prices quoted in U.S.$).For wheat-based ethanol, recent Canadian estimates of energy efficiency range from 150

32
to 180 percent depending on production methods used, while corn-based ethanol is 110 to125 percent (Girt, 1995)
The possibility of using tree crops for the production of ethanol is limited. In theory it ispossible to do so but in practice the only ethanol produced from trees has been in thelaboratory. So far it has been calculated that the production of ethanol from woodbiomass would cost between 26¢ and 70¢ (CD$) per litre of ethanol produced11 (Freeze,1995). Besides the cost of producing ethanol, the major hindrance to using wood for itsproduction is the technology. This technology is fundamentally different from that forethanol produced from food crops and high costs will be incurred in converting ethanolplants to ones which can process woody biomass. According to a study by Lynd, et al.,(1991) a cost-competitive process appears to be possible by about 2000.
Research and development has also been conducted using wood for the production ofmethanol in Hearst, Ontario. This project was technically successful but had to beabandoned due to economic disadvantages. The predicted production cost of woodmethanol was projected to be 18¢ per litre in comparison to a price of 13¢ per litre fornatural gas methanol in 1993 (Duff, et al., 1993). The same arguments for cost recoverywith biomass energy apply to the production of ethanol. A by-product of ethanolproduced from cereal crops, however, is a high-protein cake usually sold as animal feed
11 This cost estimate varies according to the method used for producing ethanol from wood
Ethanol Scenarios: Acid hydrolysiswith glucosefermentation
Enzyme hydrolysiswith glucosefermentation
SimultaneousSaccharificationwith separatefermentation ofglucose and xylose
SimultaneousSaccharificationwith co-fermentation ofglucose and xylose
Cost in $ per litreof ethanolproduced
0,70 0.63 0.37 0.26
(Freeze, 1995)
Cost of producing ethanol from corn stover (US $30 per dry tonne)Process Costs of ethanol in
US cents per litreConcentrated acid: separate fermentation 43APEX-10: 10% solids in enzyme hydrolysis, 98% cellulose conversion, separate C5and C6 fermentation.
31
MAFEX: 10% solids in enzyme hydrolysis, 80% cellulose conversion, separate C5and C6 fermentation
30
Bioenergy with AFEX-10 pretreatment, 98% cellulose conversion, combined C5 andC6 fermentation
31
Bioenergy with MAFEX with sugar evaporator combined C5 and C6 fermentation,higher glucose concentration, high yields of ethanol
25
MAFEX with Pichia stiptis yeast, high cellulose hydrolysis yields, combined C5 andC6 fermentation with high yields(Freeze, 1995)
33
which sometimes fetches a higher price than ethanol itself. The by-product which resultsfrom producing wood ethanol, though, poses a waste disposal challenge which is alsopotentially costly (Girt, 1995; Michaelis, 1994; DOE, 1994).
Carbon CreditsPotentially, the amount of carbon extracted from the atmosphere through the planting oftrees could qualify as a carbon credit and be sold on a carbon credit market. Producers oftrees could then use the money earned on the emissions market to offset the costs ofestablishing and maintaining their trees. The only experimentation with emissions tradingso far has been in the United States where sulphur dioxide credits are traded. The way themarket works is that factories discharging less sulphur dioxide than the regulated level areaccredited with an emission reduction credit. These factories are then able to sell theircredit to another factory which buys the right to emit that amount of sulphur dioxide intothe atmosphere.
Setting up a market for carbon credits is quite a complicated undertaking. To begin with,for the market to operate well there need to be enough players. It is uncertain how manyplayers are actually necessary and a United Nations Conference on Trade andDevelopment (UNCTAD) study is of the opinion that a global market would be necessaryto fulfill this condition. Furthermore, the commodity needs to be well defined and thebarriers to trading minimized. Barriers to trading include trading costs, search costs, andcounterparty risks. Because of the high risk involved, the market needs to be supported byescrow agents, letters of credit, legal opinions and other structures which also push thecosts up of participating in the market. Legal uncertainties and transferability constraintswould also hinder the establishment of a successful global CO2 emissions credit market(UNCTAD, 1994; Hansen & Roland, 1990). Without a strong legal framework andmethod of enforcement there will be no incentive for buyers and sellers to trade.
If all the constraints mentioned above could be minimized or overcome, then it isestimated that annually an $8.35 billion global CO2 credit market at $10 per ton could becreated. This would be assuming that the goal of stabilizing CO2 emissions at 1990 levelsby the year 2000 is used. Assuming that the U.S. were to set up an internal CO2 emissionmarket and establish an emissions cap of 1,530 million tonnes of carbon per year, thenallowing a five year implementation period would result in carbon credits costingbetween $2 and $22 per tonne in the U.S. As yet no market for carbon emission creditshas been established by individual states or on an international level (UNCTAD, 1994).
Planting trees for carbon emission credits has its difficulties. What happens when thetrees die or are harvested? Would farmers be required to buy carbon credits in order toharvest their trees? Ascertaining how much carbon has been fixed by trees is also difficultand cannot be established with much certainty12 (Greene, 1993). This increases the costs 12 The dynamics of tree growth vary with tree species, soil, water and weather conditions, and tree
age so that actual carbon accretion rates depend on forest type and the time frame of analysis.

34
of participating in a carbon emission credit market. Additional rules have to beestablished which increase transaction costs, as does the time and effort involved incollecting reliable data on the amount of carbon sequestered by the trees in question.Furthermore, the possibility of allowing carbon fixed through trees to be included in themarket will depend on a nation’s climate change policy. If a nation’s policy is to conserveenergy and promote the use of more efficient technologies then swapping the sinkcapacities of trees for the right of manufacturers and others to emit carbon will notachieve that goal. If, however, the policy is just to maintain levels of carbon at what theyare then this could be a valid option.
Cost StructuresIf emitters of carbon dioxide are required to reduce or offset their emissions they aregoing to choose the most cost-effective way of doing so. To determine whether plantingtrees on the prairies is a cost-effective method of offsetting carbon it is necessary to knowwhat other methods are available to corporations and what they would cost per tonne ofcarbon reduced or offset. The options open to various corporations will depend on whatindustry they are involved in. Options for reducing emissions include fuel switching, andadopting alternative energy technologies such as biomass energy, solar, wind, or nuclearenergy. Reducing emissions can also be done by installing energy efficient technologies.These are specific to the industry and the plant in question and are difficult to attach aprice to without an in-depth knowledge of the situation. An overview of the kind ofoptions which should be considered when establishing a cost structure for combatingrising carbon dioxide levels in the energy sector is provided in Table 4.
Various organizations have already engaged in carbon sequestration projects whichinvolve the planting of trees. These include PacifiCorp projects in Oregon and Utah in theU.S.; and joint implementation projects by AES Thames (a subsidiary of AESCorporation) in Guatemala; AES Barbers Point in Paraguay; the Forest Absorbing CarbonDioxide Emissions (FACE) Foundation (established by the Dutch Electricity GeneratingBoard) in Malaysia; the Global Environmental Facility (GEF) in Ecuador; the NewEngland Electric System (NEES) in Malaysia; and the Tenaska Saratov Project in Russia.The costs of these projects in US $ are tabulated in Table 5.

35
Table 4. A Taxonomy of Interventions in the Energy Sector.
Option Production/genera -tion
Transmission &distribution
End-use
• Reduce energyconsumption ofexisting processes byincreasing efficiency
• Refurbish old powerplants
• Repower old powerplants
• Reduce T & D lossesin electrical grids
• Reduce energyintensity of basicmaterials production
• Efficient motors anddrives
• Irrigation pumpsets• Vehicular fuel
efficiency• Process heating and
cooling• Energy conservation
• Reduce emissionsfrom existingprocesses
• Reduce associatedgas flaring
• Use coalbed methane• Collect CO2 from
fossil-fuel systemsand store in depletedgas/oil fields or indeep ocean
• Reduce leaks innatural gas pipelines
• Install end-of-pipeemissions controls inwood-stoves, cars(e.g., catalyticconverters)
• Switch to moreenergy-efficientprocesses
• Biomass gasifiers -gas turbines
• Advanced efficientgas turbine cycles
• Clean coaltechnologies
• HVDC transmission• Promote inter-
regional flows ofnatural gas andhydro-electricity
• Lighting (CFLs)• Transport modal
shifts (road to rail,personal to mass)
• Innovativetechnologies forappliances, vehicles
• Improved cookstoves• Land-use planning• Infrastructure
efficiency
• Switch to loweremission processes
• Photovoltaics• Biomass• Wind farms• Solar thermal• Small hydro• Geothermal• Fuel cells• H2 from non-fossil
electricity• Methanol from flared
gas• Nuclear• MHD generators
• Hydrogen as anenergy carrier
• Solar water heating• CNG transport• Electric vehicles• Natural gas-fired
engine-drivencooling systems
Note: T & D = transmission and distribution, HVDC = high-voltage direct current, CFL = compactfluorescent lamps, CNG = compressed natural gas, H2 = hydrogen, MHD = magneto-hydro dynamics.
Source: Anhuja (1993)
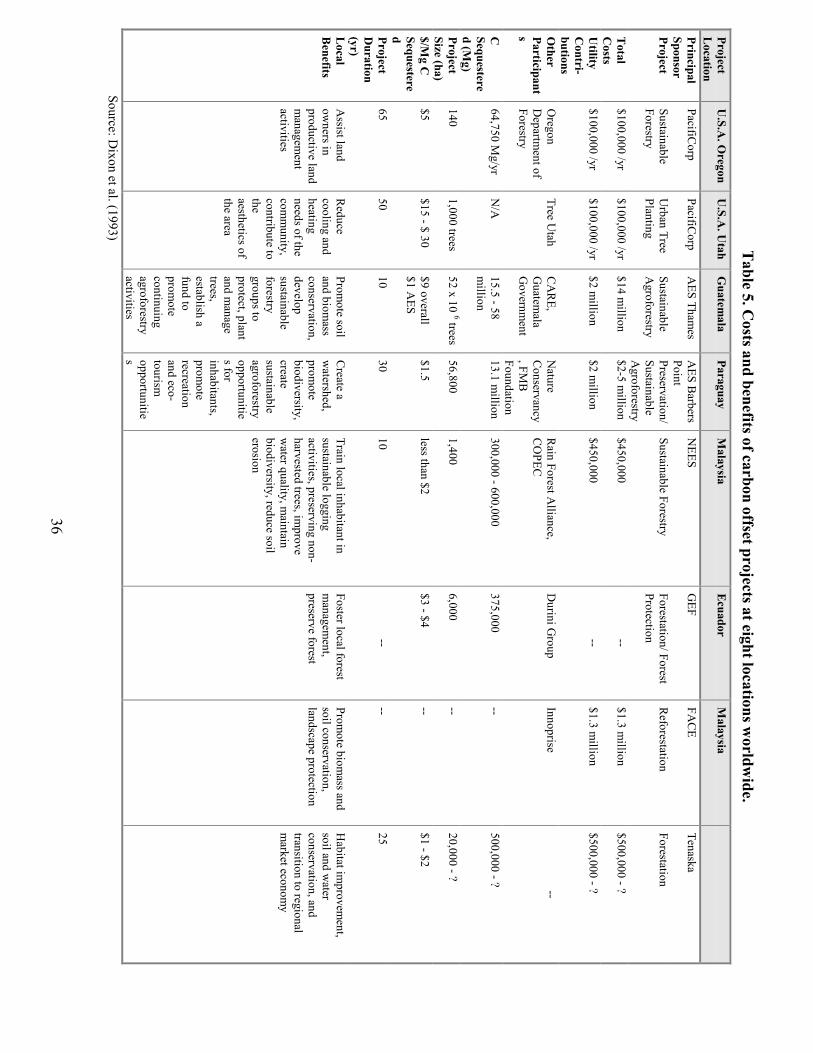
36
Table 5. C
osts and benefits of carbon offset projects at eight locations worldw
ide.ProjectLocation
U.S.A
. Oregon
U.S.A
. Utah
Guatem
alaParaguay
Malaysia
Ecuador
Malaysia
PrincipalSponsor
PacifiCorp
PacifiCorp
AES Tham
esA
ES Barbers
PointN
EESG
EFFA
CE
Tenaska
ProjectSustainableForestry
Urban Tree
PlantingSustainableA
groforestryPreservation/SustainableA
groforestry
Sustainable ForestryForestation/ ForestProtection
Reforestation
Forestation
Total
Costs
$100,000 /yr$100,000 /yr
$14 million
$2-5 million
$450,000--
$1.3 million
$500,000 - ?
Utility
Contri-
butions
$100,000 /yr$100,000 /yr
$2 million
$2 million
$450,000--
$1.3 million
$500,000 - ?
Other
Participants
Oregon
Departm
ent ofForestry
Tree Utah
CA
RE,
Guatem
alaG
overnment
Nature
Conservancy
, FMB
Foundation
Rain Forest A
lliance,C
OPEC
Durini G
roupInnoprise
--
CSequestered (M
g)
64,750 Mg/yr
N/A
15.5 - 58m
illion13.1 m
illion300,000 - 600,000
375,000--
500,000 - ?
ProjectSize (ha)
1401,000 trees
52 x 10 6 trees56,800
1,4006,000
--20,000 - ?
$/Mg C
Sequestered
$5$15 - $ 30
$9 overall$1 A
ES$1.5
less than $2$3 - $4
--$1 - $2
ProjectD
uration(yr)
6550
1030
10--
--25
LocalB
enefitsA
ssist landow
ners inproductive landm
anagement
activities
Reduce
cooling andheatingneeds of thecom
munity,
contribute totheaesthetics ofthe area
Promote soil
and biomass
conservation,developsustainableforestrygroups toprotect, plantand m
anagetrees,establish afund toprom
otecontinuingagroforestryactivities
Create a
watershed,
promote
biodiversity,createsustainableagroforestryopportunities forinhabitants,prom
oterecreationand eco-tourismopportunities
Train local inhabitant insustainable loggingactivities, preserving non-harvested trees, im
provew
ater quality, maintain
biodiversity, reduce soilerosion
Foster local forestm
anagement,
preserve forest
Promote biom
ass andsoil conservation,landscape protection
Habitat im
provement,
soil and water
conservation, andtransition to regionalm
arket economy
Source: Dixon et al. (1993)
37
Conclusions and Recommendations
ConclusionsWhile the decision is still being reached about the impacts of climate change, it can be said thatthe ratio of greenhouse gases is increasing in our atmosphere. In this report policies and practicesin Canada, the United States and the European Union were reviewed to find out what is beingdone to control the carbon dioxide ratio in the atmosphere. It is apparent that this is an issue ofconcern in all of these countries. In Canada, little has been done in terms of policy that has directinfluence on carbon dioxide in the atmosphere. In this study, three ways to combat rising CO2emissions have been considered: substitution of lower carbon energy sources, reduction of theactivity causing the emissions and finally sequestration of carbon dioxide.
Tree planting is part of a larger strategy for fighting rising CO2 levels. Canada’s commitment toreduce CO2 levels in the atmosphere cannot acceptably be handled by trees alone, however. Treeplanting should be used in conjunction with reducing emissions through the use of fuelswitching, adoption of more energy efficient technologies, alternative energy sources andimproved farming practices. Despite progress being made in developing technologies that aremore energy efficient, if economies continue to grow, and the rate of production with it, strivingafter energy efficiency may be a short-term measure in fighting emissions. A more appropriatelong-term measure would be replacement of fossil fuels with alternative fuels.
The substitution of high carbon energy sources with low carbon energy sources shows promise inreducing Canada’s carbon dioxide emissions. This can be done by replacing coal and oil withnatural gas or by moving towards non-fossil fuels such as wood, ethanol and other energysources like hydro, wind, solar, geothermal, nuclear and tidal.
The final method is to reduce CO2 emission by limiting production processes that produce CO2.These reductions would also have an effect on consumption patterns and sources of energy. Moststudies conclude that a reduction in energy use is the most effective method of reducing CO2emissions.
This being said, tree planting is still a viable component because of its other inherent benefits.Trees offer possibilities for reducing energy requirements in an urban and rural setting, erosioncontrol, harvestable produce such as fruit and wood, increased biodiversity, aesthetics, andrecreation. Carbon sequestration is an added benefit. In order for this benefit to be a lasting one,tree-planting initiatives need to be sustained over the long-term.
One policy implication of fighting rising CO2 levels is that taxes used as an incentive to inducelower energy use need to be very high. This is politically unfeasible. Another is that the mannerin which resources are managed could be affected if trees and grasslands become more valuablefor carbon sequestration than for the economic values gained from timber harvesting andagricultural production. Resource management and development policies must be sensitive to thecarbon factor.

38
RecommendationsThere is still substantial uncertainty as to how much it will cost to use trees as a carbon sink.However, there is evidence that trees play an important role in the reduction of energy use andcarbon dioxide emissions. The planting of trees as shelterbelts to reduce wind erosion is a well-documented benefit. The effectiveness of trees in an urban setting has also been noted. Newtechnology in the production of ethanol from biomass has significant implications on the role oftrees as an energy source. Given the results of this study, the recommendations are as follows:
1) Trees should be evaluated for their effectiveness in removing carbon dioxide from theatmosphere and storing it, not only in its own biomass, but also the amount of carbon that istransferred to the soil.
2) More research should be conducted on the feasibility of using trees’ biomass as an alternativesource of energy, either as ethanol or in power generation.
3) A better understanding of the carbon cycle in an agricultural context is required to determineif agriculture on the prairies is a net source or sink of carbon. A fair amount of work is beingdone by agronomists in this area. However, what is lacking is a comparison of how the sinkcapacities of agriculture compare to that of trees.
4) A comprehensive list/database of what studies and actions are going on in relation to CO2
sequestration on the prairies and elsewhere would be useful. 5) Research is required to determine the acceptability of a carbon credit market. If a carbon credit
market is to be set up, there needs to be strong legislation which helps define the commodityand sets the rules of the market. If emitters of carbon are not required to buy credits in order toemit carbon dioxide, there is no incentive for the market to work. Also, those involved infixing carbon need to look at what it will cost them to fix carbon and set the price for thecredits they sell accordingly, rather than based on what the buyer is willing to pay.
6) Finally, with climate change also comes the prospect of increasing weather variability. There
is still much uncertainty as to the degree of variability that can be expected and what all theimpacts of it will be. In formulating policy for climate change, attention also needs to bedevoted to how policy can encourage communities and individuals to adapt to their changingenvironment and cope with uncertainty.
7) A detailed assessment of other options for carbon sequestration should be made. Their
efficiencies plus the costs for power generation, transmission, and use also need to beexamined.
For these recommendations to be effective, there needs to be an increased public awareness ofthe value of trees on the prairies. Some groups do not consider tree planting as a valid action forfighting carbon emissions and climate change. For this kind of measure to be publicly acceptableas a government action a good marketing strategy will be necessary.
39
GlossaryAfforestation: Planting trees to form a forest, usually on land that has not been forested before.
Biofuels: Biofuels are alcohols, ethers and other chemicals made from cellulosic biomass -renewable resources such as fast growing trees, grasses, aquatic plants, and waste products, suchas agricultural and forestry residues, and municipal and industrial wastes.
Biomass: Biomass is found in trees, grasses, and ocean plants. Biomass is produced from thesegrowing living plants through photosynthesis - the process by which plant matter is formed usingthe energy of sunlight.
Carbon Cycle: The cycle of carbon in its different chemical forms in the atmosphere, thebiosphere, hydrosphere and in the lithosphere.
Carbon Sequestration: The removal and long-term storage of atmospheric carbon in soils andbiomass.
CO2: The chemical formula for carbon dioxide.
Cogeneration: Cogeneration occurs when a power generating station is used to produce morethan one type of energy, e.g., electricity and heat.
Global Climate Change: refers to a theory; if the amount of CO2 and other trace greenhousegases in the atmosphere are increased, more heat will be trapped potentially causing a variety ofchanges to current climate patterns, temperature, and atmospheric processes.
Global Warming: Global warming - or its opposite, global cooling - is a long-term change in theaverage temperature of the Earth.
Greenhouse Effect: is a natural phenomenon by which Earth’s atmosphere traps and holdswarmth from the sun. The Earth’s surface absorbs the solar radiation that reaches it and thenradiates heat back into the atmosphere. Trace gasses (CO2, ozone, methane, oxides of nitrogen,and others) that exist in the Earth’s atmosphere absorb and bounce back much of the planetsradiated heat before it escapes into space. CO2 exists in the atmosphere in far larger quantitiesthan other trace gases and is thus responsible for more than half the Earth’s greenhouse effect.Without the process the Earth’s temperature would be about 33oC cooler and unable to supportlife as we know it.
Greenhouse Gases: are carbon dioxide (CO2), methane, nitrous oxides, and hydroflourocarbons(HFCs).

40
Bibliography
Anielski, Mark. 1992. Accounting for carbon fixation by Alberta’s forests and peatlands. Paperpresented at Investing in Natural Capital - A Prerequiste for Sustainability. August 3-6, 1992.Stockholm, Sweden. Sponsored by ISEE.
Anielski, Mark. 1993. Natural Resource Accounting: Alberta’s Forest Account in 1991.Edmonton: Alberta Government.
Ahuja, Dilip. 1993. The Incremental Cost of Climate Mitigation Projects, GEF Working PaperNumber 9. Washington D.C.: The Global Environmental Facility (GEF).
Alberta Government. 1990. Clean Air Strategy for Alberta. Edmonton: Alberta Government.
Canada. 1994. Canada’s National Report on Climate Change: Actions to Meet CommitmentsUnder the United Nations Framework Convention on Climate Change. Ottawa: Government ofCanada.
Canadian Chemical Producers’ Association. 1994. Reducing Emissions: 1993 EmissionsInventory and Five Year Projections. Ottawa: Canadian Chemical Producers’ Association.
Clean Air Strategic Alliance (CASA). 1995. Clean Air Views, 4(1). Edmonton: CASA.
Clinton, William. J. and Albert Gore, Jr. 1993. The Climate Change Action Plan. WashingtonD.C.: United States Government Printing Agency.
Coal Association of Canada. 1994. Greenhouse gas emissions, the economy and objectives thatinvite collaboration: a brief submitted to the 2nd Joint Meeting of the Canadian Council ofMinisters of the Environment and Council of Energy Ministers. November 8, 1994. Bathurst,New Brunswick. Calgary: Coal Association of Canada.
Commission of the European Communities. 1992. Report of the Commission of the EuropeanCommunities to the United Nations Conference on Environment and Development. Luxembourg:Office for Official Publications of the European Communities.
Depper, Mike. 1994. Tree Canada Foundation. Personal communication, March 13, 1994.
Dixon, R.K., K.J. Andrasko, F.G. Sussman, M.A. Lavinson, M.C. Trexler, and T.S. Vinson.1993. Forest Sector Carbon Offset Projects: Near-Term Opportunities to Mitigate GreenhouseGas Emissions. Water, Air and Soil Pollution. 561-577.
DRI Canada and Marbek Resource Consultants. 1993. Canadian Competitiveness and theControl of Greenhouse Gas Emissions. Lexington: McGraw-Hill

41
Duff, S. J.B., J.A. Barclay, E.N. Hogan, and G.S. Carisse. 1993. Biomass ConversionTechnologies: The Research and Development Activities of Energy, Mines and ResourcesCanada. Ottawa: Alternative Energy Division Energy, Mines and Resources Canada.
Enquete Commission. 1995. Protecting Our Green Earth: How to Manage Global Warmingthrough Environmentally Sound Farming and Preservation of the World’s Forests. Bonn:German Bundestag.
Environment Canada. 1995a. Canada’s National Action Program on Climate Change. Ottawa:Environment Canada.
Environment Canada. 1995b. Global Climate Change Fact Sheet. Ottawa: Supply and Services.
European Commission. 1996a. Europa - Chronology of the Union.http://www.cec.lu/en/eu/hist/euchron.html (24 January, 1996).
European Commission. 1996b. Europa - What is the European Union?http://www.cec.lu/europarl/bro_en1.htm (24 January, 1996).
Freedman, Bill and Todd Keith. 1995. Planting Trees for Carbon Credits: A Discussion of theIssues, Feasibility, and Environmental Benefits. Toronto: Tree Canada Foundation.
Freeze, Brian. 1995. Ethanol from Biomass - Possible and Profitable? Lethbridge: LethbridgeResearch Centre, Agriculture and Agri-Food Canada.
Girt, John and Associates. 1995. Ethanol: Canadian Financial Liability or EnvironmentalOpportunity?
Greene, Owen and Julian E. Salt. 1993. Agricultural emissions of greenhouse gases: Monitoringand verification. In Agricultural Dimensions of Global Climate Change. Eds. H.M. Kaiser, andT.E. Drennen. Chap. 13. Delray Beach, FL: St. Lucie Press.
Hansen, Stein and Kjell Roland. 1990. European Climate Change Co-operation - A Role forEmission Trading? Lysaker, Norway: Fridtjof Institute.
Houghton, J.T., L.G.M. Filho, J. Bruce, H. Lee, B.A. Callander, E. Haites, N. Harris, and K.Maskell. 1995. Climate Change 1994: Radiative Forcing of Climate Change and an Evaluationof the IPCC IS92 Emissions Scenarios. Cambridge: Cambridge University Press.
Houghton, J.T., G.J. Jenkins, and J.J. Ephraums. 1990. Climate Change: The IPCC ScientificAssessment. Cambridge: Cambridge University Press.
Independent Petroleum Association of Canada. 1991. Submission of the Independent PetroleumAssociation of Canada in response to the Fourth Report of the Standing Committee on
42
Environment: no time to lose - the challenge of global warming. (S.1.): Independent PetroleumAssociation of Canada.
Intergovernmental Panel on Climate Change (IPCC). 1994. Radiative Forcing of ClimateChange: The 1994 Report of the Scientific Assessment Working Group of IPCC. New York:Cambridge University Press.
Italy Ministry of the Environment. 1994. National Programme for the Limitation of CarbonDioxide Emissions to 1990 Levels by the Year 2000. Roma - Italy: Ministry of the Environment.
Ireland Department of the Environment. 1993. Ireland Climate Change: CO2 AbatementStrategy. Dublin: The Stationery Office.
Kort, John and Andrew Ashford. 1994. Estimating Biomass Production from CaraganaShelterbelts: A Green Plan Project. PFRA Shelterbelt Centre supplementary Report 94-2. IndianHead, Saskatchewan: Government of Canada.
Kort, John. 1996. Draft Report: Biomass Production on the Prairies, Green Plan #4. IndianHead: Indian Head, Saskatchewan: Prairie Farm Rehabilitation Administration.
Lynd, Leer R., Janet H. Cushman, Roberta J. Nichols, and Charles E. Wyman. 1991. Fuel ethanolfrom cellulosic biomass. Science, 251:1318-1323.
McCarl, B.A., and J. MacCallaway. 1995. Carbon sequestration through tree planting onagricultural lands. In Soil Management and the Greenhouse Effect. Eds. R. Lal, J. Kimble, E.Levine, and B.A. Stewart. Boca Raton: Lewis Publishers.
McPherson E.G. 1994. Using urban forests for energy efficiency and carbon storage. J. Forestry,94:36-41.
Michaelis, Laurie. 1994. The Real Costs of Liquid Fuels, The OECD Observer, N0.190October/November.
Moyer, R.L. 1990. Shelterbelt benefit to home heating cost. Transactions of the ASAE,33(6):2003-10.
Muller, Frank. 1993. Carbon taxes: The case for state leadership. J. Electricity, 6(1):58-69.
Muller, Frank and Andrew Hoerner. 1993. The Promise of State Carbon Taxes: Opportunitiesand Policy Issues. CGC Paper PP-03-6. Maryland: Center for Global Change.
Naeth, M.A. 1990. Photosynthetic Carbon Fixation and Its Relationship to Increased CarbonDioxide. Paper for TransAlta Utilities Corp. Edmonton: University of Alberta.
43
National Agriculture Environment Committee. 1994. Canadian Agriculture and Net GreenhouseGas Emissions. Working Group on Agriculture and Greenhouse Gases. Paper. September, 1994.
Nichols, A.L. and D. Harrison. 1991. Market-Based Approaches to Managing Air Emissions InAlberta. A Discussion Paper. Cambridge, Massachusetts: National Economic ResearchAssociates, Inc.
Nikiforuk, Andrew. 1995. Stumped. Canadian Business, September 1995:64-73.
Prairie Farm Rehabilitation Administration (PFRA). 1992. Poplar Choices. ShelterbeltNewsletter, Fall 1992:4-8.
Prairie Farm Rehabilitation Administration (PFRA). 1993. 1993 Report of the PFRA ShelterbeltCentre. Indian Head, Saskatchewan: Government of Canada.
Prairie Farm Rehabilitation Administration (PFRA). Undated. Soil Works: Economics ofShelterbelts. Canada-Saskatchewan Agreement on Soil Conservation.
Rheaume, G. 1993. The Challenge of Climate Change: Policy Options for Canada. Ottawa:Conference Board of Canada.
Royal Society of Canada. 1993. Global Change and Canadians. Ottawa: Canadian GlobalChange Program.
Royal Society of Canada. 1993. Canadian Options for Greenhouse Gas Emission Reduction(COGGER). Canadian Global Change Program Technical Report Series No. 93-1. Ottawa:Canadian Global Change Program Secretariat.
Salkie, F.J. and W.A. White. 1995. A Financial Analysis of Hybrid Aspen Production forPulpwood by Private Landowners in Northwestern Saskatchewan. Edmonton. Unpublished.
Samaras, Z. and K.H. Zierok. 1992. Assessment of the Effect in EC Member States of theImplementation of Policy Measures for CO2 Reduction in the Transport Sector - Final Report.Luxembourg: Office for Official Publications of the European Communities.
Samson, Roger A. and Joseph Omielan. 1992. Switchgrass: A Potential Biomass Energy Crop forEthanol Production, Thirteenth North American Prairie Conference pp. 253-258.
Sampson, R. Neil. 1995. The role of management in affecting soil carbon: Policy considerations.In Soil Management and the Greenhouse Effect. Eds. R. Lal, J. Kimble, E. Levine, and B.A.Stewart. Boca Raton: Lewis Publishers.
SaskPower. 1995. SaskPower’s Climate Change Action Plan. Regina: SaskPower.

44
Schnutenhaus, Jörn. 1995. Tax differentials for catalytic converters and unleaded petrol inGermany. In Green Budget Reform: An International Casebook of Leading Practices. Eds. R.Gale and S. Barg. London: Earthscan Publications Limited.
Secretariat of the U.S. Initiative on Joint Implementation. 1994. U.S., Costa Rica Sign HistoricEnvironmental Agreement, International Partnerships Report 1(1) pp. 1.
State of the Environment Report. 1995. A State of the Environment Report: UnderstandingAtmospheric Change. H. Hengeveld. SOE Report No. 95-2. Ottawa: Environment Canada.
The Air Quality Committee. 1994. Canada - United States Air Quality Agreement: 1994Progress Report. Ottawa: Secretary, Canadian Section International Joint Commission.
United Nations Conference on Trade and Development (UNCTAD). 1994. Combating GlobalWarming: Possible rules, regulations and administrative arrangements for a global market inCO2 emission entitlements. New York: United Nations.
United States Department of Energy (DOE). 1994. Biofuels: At the Crossroads - Strategic Planfor the Biofuels Systems Program. Washington D.C.: U.S. Department of Energy.
United States Department of Energy (DOE). 1994. Biomass Power: Program Overview FiscalYears 1993-1994. Washington D.C.: U.S. Department of Energy.
United States Environmental Protection Agency (EPA). 1990. Policy Options for StabilizingGlobal Climate Change: Report to Congress - Main Report. Washington D.C.: United StatesEnvironmental Protection Agency.
Van Kooten, G.C. and L.M. Arthur. 1996. Potential applications of economic instruments toreduce greenhouse gas emissions in Canadian agriculture. Paper presented at Symposium onEconomic Instruments and Cross Compliance. January 17, 1996. Ottawa.
Van Kooten, G.C., W.A. Thompson and I. Vertinsky. 1992. Turning Down the Heat in Canada:Reforestation When Benefits of CO2 Reduction are Included. Forestry Economics and PolicyAnalysis Research Unit, University of British Columbia, Vancouver.
Vohrer, Manfred. 1991. Report of the Committee on the Environment, Public Health, andConsumer Protection on Economic and Fiscal Instruments of Environmental Policy, EuropeanCommunities European Parliament Session Documents A3-0130/91. Luxembourg: EuropeanParliament.

45
Appendices
Appendix A. Above Ground Biomass in kg/tree by Species and Soil Zone.Above Ground Biomass in kg/tree and Carbon percentages of four shelterbelt species in three soil zones.
Soil Zones Green Ash48.6% Carbon
ManitobaMaple 48.0%Carbon
Hybrid Poplar48.2% Carbon
Siberian Elm49.4% Carbon
Brown 98.46 120.44 423.63 131.71Dark Brown 158.65 186.02 296.21 229.45Black 294.17 214.62 592.04 --Average 183.76 173.69 437.29 180.58Source: Kort (1996).
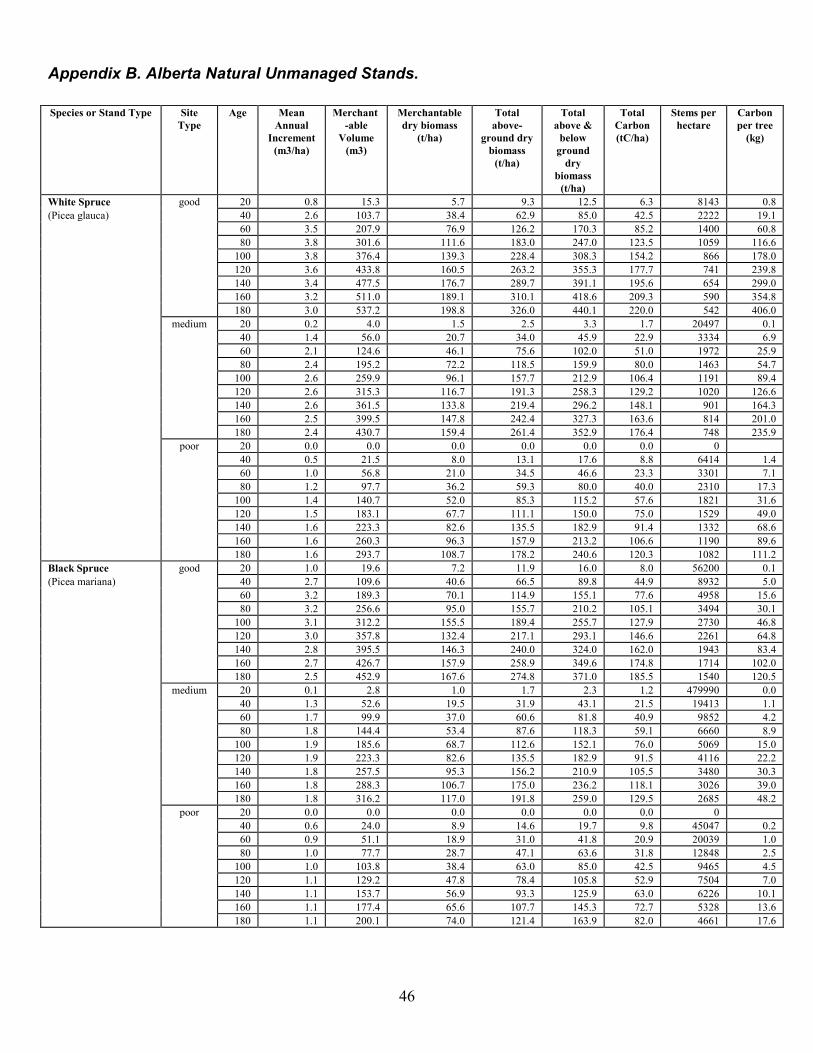
46
Appendix B. Alberta Natural Unmanaged Stands.
Species or Stand Type SiteType
Age MeanAnnual
Increment(m3/ha)
Merchant-able
Volume(m3)
Merchantabledry biomass
(t/ha)
Totalabove-
ground drybiomass
(t/ha)
Totalabove &
belowground
drybiomass
(t/ha)
TotalCarbon(tC/ha)
Stems perhectare
Carbonper tree
(kg)
White Spruce good 20 0.8 15.3 5.7 9.3 12.5 6.3 8143 0.8(Picea glauca) 40 2.6 103.7 38.4 62.9 85.0 42.5 2222 19.1
60 3.5 207.9 76.9 126.2 170.3 85.2 1400 60.880 3.8 301.6 111.6 183.0 247.0 123.5 1059 116.6
100 3.8 376.4 139.3 228.4 308.3 154.2 866 178.0120 3.6 433.8 160.5 263.2 355.3 177.7 741 239.8140 3.4 477.5 176.7 289.7 391.1 195.6 654 299.0160 3.2 511.0 189.1 310.1 418.6 209.3 590 354.8180 3.0 537.2 198.8 326.0 440.1 220.0 542 406.0
medium 20 0.2 4.0 1.5 2.5 3.3 1.7 20497 0.140 1.4 56.0 20.7 34.0 45.9 22.9 3334 6.960 2.1 124.6 46.1 75.6 102.0 51.0 1972 25.980 2.4 195.2 72.2 118.5 159.9 80.0 1463 54.7
100 2.6 259.9 96.1 157.7 212.9 106.4 1191 89.4120 2.6 315.3 116.7 191.3 258.3 129.2 1020 126.6140 2.6 361.5 133.8 219.4 296.2 148.1 901 164.3160 2.5 399.5 147.8 242.4 327.3 163.6 814 201.0180 2.4 430.7 159.4 261.4 352.9 176.4 748 235.9
poor 20 0.0 0.0 0.0 0.0 0.0 0.0 040 0.5 21.5 8.0 13.1 17.6 8.8 6414 1.460 1.0 56.8 21.0 34.5 46.6 23.3 3301 7.180 1.2 97.7 36.2 59.3 80.0 40.0 2310 17.3
100 1.4 140.7 52.0 85.3 115.2 57.6 1821 31.6120 1.5 183.1 67.7 111.1 150.0 75.0 1529 49.0140 1.6 223.3 82.6 135.5 182.9 91.4 1332 68.6160 1.6 260.3 96.3 157.9 213.2 106.6 1190 89.6180 1.6 293.7 108.7 178.2 240.6 120.3 1082 111.2
Black Spruce good 20 1.0 19.6 7.2 11.9 16.0 8.0 56200 0.1(Picea mariana) 40 2.7 109.6 40.6 66.5 89.8 44.9 8932 5.0
60 3.2 189.3 70.1 114.9 155.1 77.6 4958 15.680 3.2 256.6 95.0 155.7 210.2 105.1 3494 30.1
100 3.1 312.2 155.5 189.4 255.7 127.9 2730 46.8120 3.0 357.8 132.4 217.1 293.1 146.6 2261 64.8140 2.8 395.5 146.3 240.0 324.0 162.0 1943 83.4160 2.7 426.7 157.9 258.9 349.6 174.8 1714 102.0180 2.5 452.9 167.6 274.8 371.0 185.5 1540 120.5
medium 20 0.1 2.8 1.0 1.7 2.3 1.2 479990 0.040 1.3 52.6 19.5 31.9 43.1 21.5 19413 1.160 1.7 99.9 37.0 60.6 81.8 40.9 9852 4.280 1.8 144.4 53.4 87.6 118.3 59.1 6660 8.9
100 1.9 185.6 68.7 112.6 152.1 76.0 5069 15.0120 1.9 223.3 82.6 135.5 182.9 91.5 4116 22.2140 1.8 257.5 95.3 156.2 210.9 105.5 3480 30.3160 1.8 288.3 106.7 175.0 236.2 118.1 3026 39.0180 1.8 316.2 117.0 191.8 259.0 129.5 2685 48.2
poor 20 0.0 0.0 0.0 0.0 0.0 0.0 040 0.6 24.0 8.9 14.6 19.7 9.8 45047 0.260 0.9 51.1 18.9 31.0 41.8 20.9 20039 1.080 1.0 77.7 28.7 47.1 63.6 31.8 12848 2.5
100 1.0 103.8 38.4 63.0 85.0 42.5 9465 4.5120 1.1 129.2 47.8 78.4 105.8 52.9 7504 7.0140 1.1 153.7 56.9 93.3 125.9 63.0 6226 10.1160 1.1 177.4 65.6 107.7 145.3 72.7 5328 13.6180 1.1 200.1 74.0 121.4 163.9 82.0 4661 17.6

47
Species or Stand Type Site Type Age MeanAnnual
Increment(m3/ha)
Merchant-able
Volume(m3)
Merchantabledry biomass
(t/ha)
Totalabove-
ground drybiomass
(t/ha)
Totalabove &
belowground
drybiomass
(t/ha)
TotalCarbon(tC/ha)
Stems perhectare
Carbonper tree
(kg)
Pine good 20 2.9 58.3 21.6 35.4 47.8 23.9 15982 1.5(Pinus sp.) 40 4.7 189.1 70.0 114.8 154.9 77.5 3347 23.1
60 4.8 290.2 107.4 176.1 237.7 118.9 1798 66.180 4.5 362.7 134.2 220.1 297.1 148.5 1243 119.5
100 4.2 414.7 153.4 251.6 339.7 169.8 966 175.8120 3.8 452.9 167.6 274.8 371.0 185.5 803 231.0140 3.4 481.8 178.3 292.4 394.7 197.4 696 283.6160 3.2 504.2 186.6 306.0 413.1 206.5 621 332.6180 2.9 522.0 193.1 316.7 427.6 213.8 565 378.4
medium 20 1.8 36.0 13.3 21.9 29.5 14.7 30366 0.540 3.3 130.1 48.1 78.9 106.6 53.3 5543 9.660 3.5 209.2 77.4 126.9 171.4 85.7 2909 29.580 3.4 270.7 100.1 164.2 221.7 110.9 2001 55.4
100 3.2 317.9 117.6 192.9 260.4 130.2 1555 83.7120 3.0 354.3 131.1 215.0 290.3 145.1 1295 112.1140 2.7 383.0 141.7 232.4 313.7 156.9 1126 139.3160 2.5 405.9 150.2 246.3 332.5 166.2 1008 164.9180 2.4 424.5 157.0 257.6 347.7 173.9 922 188.6
poor 20 1.0 19.7 7.3 11.9 16.1 8.1 68585 0.140 2.0 80.2 29.7 48.7 65.7 32.8 10501 3.160 2.3 135.1 50.0 82.0 110.7 55.3 5271 10.580 2.3 181.6 67.2 110.2 148.8 74.4 3539 21.0
100 2.2 220.0 81.4 133.5 180.2 90.1 2709 33.3120 2.1 251.6 93.1 152.7 206.1 103.1 2231 46.2140 2.0 277.8 102.8 168.6 227.5 113.8 1924 59.1160 1.9 299.5 110.8 181.8 245.4 122.7 1711 71.7180 1.8 317.8 117.6 192.9 260.4 130.2 1556 83.7
Hardwoods good 20 3.4 68.7 34.3 56.3 76.0 38.0 3062 12.440 4.2 169.6 84.8 139.1 187.7 93.9 1252 75.060 4.2 254.3 127.1 208.5 281.5 140.7 822 171.280 4.0 317.0 158.5 259.9 350.9 175.4 634 276.7
100 3.6 362.4 181.2 297.2 401.2 200.6 530 378.5120 3.3 395.8 197.9 324.6 438.2 219.1 464 472.1140 3.0 420.9 210.5 345.2 466.4 233.0 420 554.7160 2.8 440.3 220.1 361.0 487.4 243.7 388 628.1180 2.5 455.5 227.8 373.5 504.2 252.1 365 690.8
medium 20 2.4 47.1 23.5 38.6 52.1 26.0 4562 5.740 3.0 118.7 59.4 97.3 131.4 65.7 1775 37.060 3.0 181.7 90.8 149.0 201.1 100.5 1169 86.080 2.9 230.9 115.4 189.3 255.6 127.8 913 140.0
100 2.7 268.2 134.1 219.9 296.9 148.4 774 191.8120 2.5 296.6 148.3 243.2 328.3 164.2 688 238.6140 2.3 318.5 159.3 261.2 352.6 176.3 630 279.9160 2.1 335.8 167.9 275.3 371.7 185.9 588 316.1180 1.9 349.6 174.8 286.7 387.0 193.5 557 347.4
poor 20 1.5 30.2 15.1 24.7 33.4 16.7 7503 2.240 1.9 77.2 38.6 63.3 85.5 42.7 2718 15.760 2.0 119.8 59.9 98.2 132.6 66.3 1760 37.780 1.9 154.6 77.3 126.8 171.2 85.6 1371 62.4
100 1.8 182.2 91.1 149.4 201.7 100.9 1165 86.6120 1.7 204.0 102.0 167.3 225.8 112.9 1039 108.7140 1.6 221.3 110.7 181.5 245.0 122.5 955 128.3160 1.5 235.3 117.6 192.9 260.5 130.2 895 145.5180 1.4 246.7 12.3. 202.3 273.1 136.5 850 160.6

48
Species or Stand Type Site Type Age MeanAnnual
Increment(m3/ha)
Merchant-able
Volume(m3)
Merchantabledry biomass
(t/ha)
Totalabove-
ground drybiomass
(t/ha)
Totalabove &
belowground
drybiomass
(t/ha)
TotalCarbon(tC/ha)
Stems perhectare
Carbonper tree
(kg)
Mixed Wood good 20 0.4 7.0 3.1 5.1 6.8 3.4 572 6.0(Coniferous 40 1.4 55.0 24.2 39.7 5.3.6 26.8 683 39.2component) 60 2.1 127.2 56.0 91.8 123.9 61.9 691 89.6
80 2.6 206.0 90.6 148.6 200.6 100.3 691 145.2100 2.8 278.1 122.4 200.7 270.9 135.5 679 199.8120 2.8 338.7 149.0 244.4 329.9 165.0 658 250.7140 2.8 387.6 170.5 279.7 377.6 188.8 636 296.8160 2.7 426.7 187.8 307.9 415.7 207.8 614 338.5180 2.5 458.0 201.5 330.5 446.2 223.1 593 376.2
medium 20 0.0 0.0 0.0 0.0 0.0 0.0 0 0.040 0.7 27.6 12.1 19.9 26.9 13.4 681 19.760 1.1 68.1 30.0 49.2 66.4 33.2 685 48.480 1.5 117.5 51.7 84.8 114.5 57.2 691 82.8
100 1.7 169.3 74.5 122.1 164.9 82.4 693 119.0120 1.8 218.7 96.2 157.8 213.0 1065 689 154.6140 1.9 263.2 115.8 189.9 256.4 128.2 681 188.2160 1.9 302.0 132.9 217.9 294.2 147.1 671 219.2180 1.9 335.4 147.6 242.0 326.7 163.3 659 247.9
poor 20 0.0 0.0 0.0 0.0 0.0 0.0 0 0.040 0.3 13.5 5.9 9.7 13.2 6.6 662 9.960 0.6 35.6 15.7 25.7 34.7 17.3 682 25.480 0.8 63.9 28.1 46.1 62.2 31.1 684 45.5
100 1.0 96.2 42.3 69.4 93.7 46.9 688 68.1120 1.0 130.5 57.4 94.2 127.2 63.6 692 91.9140 1.2 164.9 72.6 119.0 160.7 80.3 693 115.9160 1.2 198.0 87.1 142.9 192.9 96.4 691 139.6180 1.3 228.9 100.7 165.2 223.0 111.5 688 162.1
Mixed Wood good 20 0.6 11.4 5.0 8.3 11.1 5.6 512 10.9(Deciduous 40 1.3 53.0 23.3 38.3 51.6 25.8 355 72.7component) 60 1.9 112.4 49.5 81.1 109.5 54.8 313 174.9
80 2.0 155.7 68.5 112.3 151.6 75.8 297 255.3100 1.8 177.5 78.1 128.1 172.9 86.5 290 298.1120 1.6 185.6 81.7 133.9 180.8 90.4 288 313.9140 1.3 186.7 82.1 134.7 181.8 90.9 287 316.8160 1.2 184.5 81.2 133.1 179.7 89.9 288 312.1180 1.0 181.1 79.7 130.7 176.4 88.2 289 305.2
medium 20 0.4 7.8 3.4 5.7 7.6 3.8 555 6.940 0.7 28.1 12.4 20.3 27.4 13.7 405 33.860 1.1 64.9 28.6 46.8 63.2 31.6 342 92.480 1.3 105.5 46.4 76.1 102.8 51.4 316 162.6
100 1.4 138.4 60.9 99.9 134.8 67.4 303 222.4120 1.3 160.6 70.7 115.9 156.5 78.2 295 265.2140 1.2 174.2 76.6 125.7 169.7 84.8 291 291.5160 1.1 181.7 79.9 131.1 177.0 88.5 289 306.2180 1.0 185.4 81.6 133.8 180.6 90.3 288 313.5
poor 20 0.0 0.0 0.0 0.0 0.0 0.0 0 0.040 0.4 16.3 7.2 11.8 15.9 8.0 465 17.160 0.6 35.3 15.5 25.5 34.4 17.2 385 44.680 0.8 61.1 26.9 44.1 59.5 29.7 346 86.0
100 0.9 89.0 39.2 64.2 86.7 43.4 325 133.4120 1.0 114.7 50.5 82.8 111.8 55.9 312 179.1140 1.0 136.0 59.8 98.1 132.5 66.2 304 217.9160 1.0 152.3 67.0 109.9 148.4 74.2 298 248.9180 0.9 164.3 72.3 118.5 160.0 80.0 294 272.1
Data from Alberta Phase 3 Forest Inventory: yield tables for unmanaged stands. 1985

49
Appendix C. Saskatchewan Mixed Wood Forest.
Species or Stand Type Site Type Age MeanAnnual
Increment(m3/ha)
Merchant-able
Volume(m3)
Merchantabledry biomass
(t/ha)
Totalabove-
ground drybiomass
(t/ha)
Totalabove &
belowground
drybiomass
(t/ha)
TotalCarbon(tC/ha)
Stems perhectare
Carbonper tree
(kg)
White Spruce good 70 4.3 301.0 111.4 182.6 246.6 123.3 1059 116.4(Picea Glauca) medium 75 3.1 232.5 86.0 141.1 190.5 95.2 1463 65.1
poor 80 2.0 160.0 59.9 97.1 131.1 65.5 1821 36.0Black Spruce good 90 2.0 180.0 66.6 109.2 147.5 73.7 4958 14.9(Picea mariana) medium 100 1.4 140.0 51.8 85.0 114.7 57.3 6660 8.6
poor 120 0.8 96.0 35.5 58.3 78.6 39.3 9465 4.2Jack Pine good 65 2.7 175.5 64.9 106.5 143.8 71.9 1480 48.6(Pinus banksiana) medium 70 2.0 140.0 51.8 85.0 114.7 57.3 1500 38.2
poor 80 1.3 104.0 38.5 63.1 85.2 42.6 1678 25.4Tamarack medium 100 0.8 80.0 29.6 48.5 65.5 32.8 2700 12.1(Lanix laracina)Aspen good 60 3.5 210.0 105.0 172.2 232.5 116.2 1037 112.1(Populus sp.) medium 70 2.8 196.0 98.0 160.7 217.0 108.5 1150 94.3
poor 80 2.0 160.0 80.0 131.2 177.1 88.6 1371 64.6Spruce-Aspen good 70 4.1 287.0 120.5 197.7 266.9 133.4 678 196.8(50-75% softwood) medium 75 3.1 232.5 97.7 160.1 216.2 108.1 685 157.8
poor 80 2.6 208.0 87.4 143.3 193.4 96.7 690 140.2Aspen-Spruce good 65 3.7 240.5 108.2 177.5 239.6 119.8 685 174.9(50-75% hardwood) medium 70 2.9 203.0 91.4 149.8 202.2 101.1 691 146.3
poor 80 2.0 160.0 72.0 118.1 159.4 79.7 693 115.0Jack Pine-Aspen good 65 2.9 188.5 79.2 129.8 175.3 87.6 691 126.8(50-75% softwood) medium 70 2.2 154.0 64.7 106.1 143.2 71.6 693 103.3
poor 80 1.5 120.0 50.4 82.7 111.6 55.8 692 80.6Aspen-Jack Pine good 60 3.3 198.0 89.1 146.1 197.3 98.6 691 142.7(50-75% hardwood) medium 70 2.6 182.0 81.9 134.3 181.3 90.7 692 131.0
poor 80 1.8 144.0 64.8 106.3 143.5 71.7 693 103.5
Data from Technical Bulletin No. 8, Canada-Saskatchewan Forest resource development Agreement, 1986.
* stems per hectare estimated based on data from Alberta stands for similar site, volume, and age.Jack pine and larch density estimates based on Ontario data

50
Appendix D. Manitoba Unmanaged Stands (except Scotch Pine).
Species or Stand Type Site Type Age MeanAnnual
Increment(m3/ha)
Merchantable
Volume(m3)
Merchantabledry biomass
(t/ha)
Total above-ground dry
biomass(t/ha)
Totalabove &
belowground
drybiomass
(t/ha)
TotalCarbon(tC/ha)
Stems perhectare
Carbonper tree
(kg)
Manitoba Aspen ParklandTrembling Aspen good 60 1.7 100.2 50.1 82.2 110.9 55.5 1775 31.2(Populus tremuloides) medium 60 1.0 62.4 31.2 51.2 69.1 34.5 2718 12.7White Birch good 60 1.7 102.0 51.0 83.6 112.9 56.5 1441 39.2(Betula papynifera)Ash good 60 2.7 159.6 79.8 130.9 176.7 88.3 N/A -(Fraxinus sp.) medium 60 0.9 52.2 26.1 42.8 57.8 28.9 N/A -Oak medium 60 1.1 64.8 32.4 53.1 71.7 35.9 N/A -(Quercus sp.)Manitoba Maple good 60 1.4 83.4 41.7 68.4 92.3 46.2 N/A -(Acer negundo.)Balsam poplar good 60 1.9 116.4 48.9 80.2 108.2 54.1 1775 30.5(Populus balsamifera)Basswood good 60 3.3 196.8 98.4 161.4 217.9 108.9 N/A -(Tilia americana)Scotch Pine Plantation medium 60 2.36 141.6 52.4 85.9 116.0 58.0 1400 41.4(Pinus sylvestris)
Manitoba Mountain ForestWhite Spruce good 100 1.9 192.0 71.0 116.5 157.3 78.6 2454 32.0(Picea glauca)Black Spruce good 80 2.2 172.0 63.6 104.4 140.9 70.4 2414 29.2(Picea mariana) medium 140 0.6 82.6 30.6 50.1 67.7 33.8 3300 10.3Jack Pine good 60 3.3 198.0 73.3 120.1 162.2 81.1 1400 57.9(Pinus banksiana) medium 60 1.4 85.2 31.5 51.7 69.8 34.9 2270 15.4Tamarack good 90 1.0 89.1 33.0 54.1 73.0 36.5 2670 13.7(Larix laracina)Balsam Fir good 60 2.5 147.0 54.4 89.2 120.4 60.2 2866 21.0(Abies balsamea)Trembling Aspen good 55 2.6 141.4 70.7 115.9 156.5 78.2 1650 47.4(Populus tremuloides)White Birch good 50 2.0 101.5 50.8 83.2 112.4 56.2 1440 39.0(Betula papyrifera)Elm good 50 3.2 157.5 78.8 129.2 174.4 87.2 N/A -(Ulmus americana)Oak good 50 0.9 47.0 23.5 38.5 52.0 26.0 N/A -(Quercus sp.)Manitoba Maple good 50 4.0 202.0 101.0 165.6 223.6 111.8 N/A -(Acer negundo)Balsam poplar good 50 2.5 125.0 52.5 86.1 116.2 58.1 1700 34.2(Populus balsamifera)
Manitoba Pineland ForestRed Pine good 80 2.3 185.6 68.7 112.6 152.0 76.0 960 79.2(Pinus resinosa)Jack Pine good 60 2.0 121.2 44.8 73.5 99.3 49.6 1482 33.5(Pinus banksiana) medium 60 1.2 69.6 25.8 42.2 57.0 28.5 2776 10.3Black Spruce good 80 1.4 110.4 40.8 67.0 90.4 45.2 3126 14.5(Picea mariana) medium 140 0.5 70.0 25.9 42.5 57.3 28.7 3500 8.2Balsam Fir good 60 2.1 124.2 46.0 75.4 101.7 50.9 3100 16.4(Abies balsamea)Tamarack good 90 0.8 72.0 26.6 43.7 59.0 29.5 2476 11.9(Larix laracina)

51
Species or Stand Type Site Type Age MeanAnnual
Increment(m3/ha)
Merchant-able
Volume(m3)
Merchantabledry biomass
(t/ha)
Total above-ground dry
biomass(t/ha)
Totalabove &
belowground
drybiomass
(t/ha)
TotalCarbon(tC/ha)
Stems perhectare
Carbonper tree
(kg)
Manitoba Pineland ForestEastern Cedar good 80 1.6 124.8 46.2 75.7 102.2 51.1 2430 21.0(Thuja occidentalis)Trembling Aspen good 60 1.9 111.0 55.5 91.0 122.9 61.4 1900 32.3(Populus tremuloides) medium 60 1.1 63.0 31.5 51.7 69.7 34.9 2200 15.9White Birch good 60 1.5 87.0 43.5 71.3 96.3 48.2 1760 27.4(Betula papyrifera)Elm good 60 1.6 97.2 48.6 79.7 107.6 53.8 N/A -(Ulmus americana)Ash good 60 2.0 118.8 59.4 97.4 131.5 65.8 N/A -(Fraxinus sp.)Balsam poplar good 60 1.2 70.2 29.5 48.4 65.3 32.6 2150 15.2(Populus balsamifera)
Manitoba - Lake Winnipeg East SectionJack Pine good 80 1.7 136.8 50.6 83.0 112.1 56.0 1300 43.1(Pinus banksiana) medium 80 1.0 83.2 30.8 50.5 68.2 34.1 2300 14.8White Spruce good 100 1.7 165.0 61.1 100.1 135.2 67.6 1800 37.5(Picea glauca)Black Spruce good 80 1.4 114.4 42.3 69.4 93.7 46.9 3130 15.0(Picea mariana) medium 140 0.6 85.4 31.6 51.8 70.0 35.0 3400 10.3
poor 140 0.4 60.2 22.3 36.5 49.3 24.7 3700 6.7Tamarack good 90 1.2 105.3 39.0 63.9 86.3 43.1 2680 16.1(Larix laracina) 140 0.6 88.2 32.6 53.5 72.3 36.1 2340 15.4Balsam Fir good 70 1.6 114.1 42.2 69.2 93.5 46.7 3120 15.0(Abies balsamea)Eastern Cedar good 80 2.0 157.6 58.3 95.6 129.1 64.6 2300 28.1(Thuja occidentalis) mediumTrembling Aspen good 65 2.2 142.2 71.2 116.7 157.6 78.8 1650 47.8(Populus tremuloides) 65 1.0 67.6 33.8 55.4 74.8 37.4 2200 17.0White Birch good 65 1.4 88.4 44.2 72.5 97.9 48.9 1750 28.0(Betula papyrifera)Elm good 65 1.0 65.7 32.8 53.8 72.7 36.3 N/A -(Ulmus americana)Ash good 65 1.6 105.3 52.7 86.3 116.6 58.3 N/A -(Fraxinus sp.)Balsam poplar good 65 1.5 95.6 40.1 65.8 88.9 44.4 2000 22.2(Populus balsamifera)Mixed Hardwoods good 65 2.2 140.4 59.0 96.7 130.6 65.3 1400 46.6
medium 65 1.3 85.8 36.0 59.1 79.8 39.9 2600 15.3Manitoba - Interlake Section
Red Pine good 80 3.6 286.4 106.0 173.8 234.6 117.3 600 195.5(Pinus resinosa)Jack Pine good 60 1.6 97.8 36.2 59.3 80.1 40.1 1700 23.6(Pinus banksiana) medium 60 1.1 66.6 24.6 40.4 54.6 27.3 2400 11.4White Spruce good 80 1.7 138.4 51.2 84.0 113.4 56.7 1821 31.1(Picea glauca)Black Spruce good 80 1.5 121.6 45.0 73.8 99.6 49.8 3100 16.1(Picea mariana) medium 140 0.5 74.2 27.5 45.0 60.8 30.4 3700 8.2Balsam Fir good 60 1.5 91.8 34.0 75.2 75.2 37.6 3200 11.8(Abies balsamea)

52
Species or Stand Type Site Type Age MeanAnnual
Increment(m3/ha)
Merchant-able
Volume(m3)
Merchantabledry biomass
(t/ha)
Total above-ground dry
biomass(t/ha)
Totalabove &
belowground
drybiomass
(t/ha)
TotalCarbon(tC/ha)
Stems perhectare
Carbonper tree
(kg)
Manitoba - Interlake SectionTamarack good 90 1.2 104.4 38.6 63.3 85.5 42.8 2680 16.0(Larix laracina) medium 140 0.2 29.4 10.9 17.8 24.1 12.0 3400 3.5Eastern Cedar medium 140 0.7 102.2 37.8 62.0 83.7 41.9 2700 15.5(Thuja occidentalis)Trembling Aspen good 60 2.0 121.8 60.9 99.9 134.8 67.4 1900 35.5(Populus tremuloides) medium 60 1.0 61.8 30.9 50.7 68.4 34.2 2200 15.5White Birch good 60 1.8 108.0 54.0 88.6 119.6 59.8 1440 41.5(Betula papyrifera)Elm good 60 3.8 226.2 113.1 185.5 250.4 125.2 N/A -(Ulmus americana)Balsam poplar good 60 1.8 107.4 45.1 74.0 99.9 49.9 1950 25.6(Populus balsamifera) medium 60 0.6 33.0 13.9 22.7 30.7 15.3 2500 6.1
Manitoba - Saskatchewan River SectionJack Pine good 75 1.6 117.8 43.6 71.5 96.5 48.2 2000 24.1(Pinus banksiana) medium 75 0.6 44.3 16.4 26.9 36.2 18.1 3000 6.0White Spruce good 100 1.9 188.0 69.6 114.1 154.0 77.0 1470 52.4(Picea glauca) medium 100 0.6 64.0 23.7 38.8 52.4 26.2 3200 8.2Black Spruce good 80 1.4 115.2 42.6 69.9 94.4 47.2 3100 15.2(Picea mariana) medium 140 0.4 58.8 21.8 35.7 48.2 24.1 3700 6.5Balsam Fir good 80 1.7 136.0 50.3 82.5 111.4 55.7 2800 19.9(Abies balsamea)Trembling Aspen good 60 1.8 108.0 54.0 88.6 119.6 59.8 1950 30.7(Populus tremuloides)White Birch good 60 1.3 76.2 38.1 62.5 84.4 42.2 1650 25.6(Betula papyrifera) medium 60 0.4 21.0 10.5 17.2 23.2 11.6 3000 3.9Elm good 60 2.9 175.8 87.9 144.2 194.6 97.3 N/A -(Ulmus americana)Ash good 60 2.3 137.4 68.7 112.7 152.1 76.1 N/A -(Fraxinus sp.)Manitoba Maple good 60 2.8 166.8 83.4 136.8 184.6 92.3 N/A -(Acer negundo)Balsam poplar good 60 2.7 161.4 67.8 111.2 150.1 75.0 1500 50.0(Populus balsamifera)
Manitoba - Highrock SectionJack Pine good 80 1.7 132.8 49.1 80.6 108.8 54.4 2000 27.2(Pinus banksiana) medium 80 0.9 68.8 25.5 41.7 56.4 28.2 2300 12.3White Spruce good 100 1.8 181.0 67.0 109.8 148.3 74.1 1500 49.4(Picea glauca) poor 100 0.8 81.0 30.0 49.2 66.4 33.2 2400 13.8Black Spruce good 80 1.6 124.8 46.2 75.7 102.2 51.1 3000 17.0(Picea mariana) medium 140 0.5 74.2 27.5 45.0 60.8 30.4 3670 8.3
poor 140 0.6 77.0 28.5 46.7 63.1 31.5 3600 8.8Balsim Fir good 80 2.2 176.8 65.4 107.3 144.8 72.4 2400 30.2(abies balsamea)Mixed Hardwoods good 80 1.8 140.8 59.1 97.0 130.9 65.5 1600 40.9
medium 80 1.1 85.6 36.0 59.0 79.6 39.8 2400 16.6Manitoba - Churchill River Section
Jack Pine good 80 0.6 48.0 17.8 39.3 39.3 19.7 3000 6.6(Pinus banksiana) medium 80 0.4 28.0 10.4 22.9 22.9 11.5 4500 2.5