offsets in defense trade - discs.dscu.mil · offsets in defense trade prepared by the u.s....
TRANSCRIPT

Offsets In Defense Trade
Prepared by The U.S. Department of Commerce
[The following material is extracted from an August 1998 U.S. Department of Commercestudy entitled, Offsets in Defense Trade; A Study Conducted Under Section 309 of the DefenseProduction Act of 1950, as amended. The report was produced by the Strategic Analysis Divisionin the Office of Strategic Industries and Economic Security of the Bureau of ExportAdministration (BXA). This is the third in a series of congressionally required annual reports ondefense related offset agreements. (Excerpts from the first such report was published in the Fallof 1996 issue of The DISAM Journal, pp.30-56. The second such report was published in theWinter 1997-1998 issue of The DISAM Journal, pp. 65-92). A copy of the complete report isavailable through BXA. Phone: 202-482-4060; Fax: 202-482-5650; E-mail: <[email protected]>.
OVERVIEW
Legislation
In 1984, Congress enacted amendments to the Defense Production Act of 1950, as amended,which included the addition of Section 309. Section 309 required the President to submit anannual report on the impact of offsets on U.S. defense preparedness, industrial competitiveness,employment, and trade to the Committee on Banking, Finance, and Urban Affairs of the Houseof Representatives and, the Committee on Banking, Housing, and Urban Affairs of the Senate.
When Section 309 was first enacted, the Office of Management and Budget (OMB) wasappointed as the interagency coordinator in the preparation of the annual offset report for theCongress. These reports were to be prepared in consultation with the Departments of Commerce,Defense, and Labor, and the Office of the United States Trade Representative. This interagencyreporting requirement continued, with minor adjustments, until 1992, when Section 309underwent major modifications. The interagency coordination role was then transferred fromOMB to the Secretary of Commerce.
The Secretary was given authority to develop and administer regulations to collect fromindustry the offset data required for the report. This responsibility was later delegated to theDepartment’s Bureau of Export Administration (BXA). A change was also made in Section 309,adding a sales reporting threshold previously cited in the National Defense Authorization Act forFiscal Year 1991. The offset agreement threshold was reduced from $50 million to $5 million forU.S. firms entering into foreign defense sales contracts subject to offset agreements. On a pertransaction level, firms report all offset transactions for which they receive offset credits of$250,000 or more. [A copy of Section 309 can be found in Appendix A in BXA`s 1998 Offsetsin Defense Tradereport. An itemized list of information that is collected annually from industryis located in Appendix B in BXA`s 1998 Offsets in Defense Trade report]
The DISAM Journal, Spring 199957

PERSPECTIVES ON OFFSETS
Who Really Pays for Offsets?
Do offsets increase the price of the weapon system?The answer is almost always, yes;offsets increase the price of the weapon system by imposing added costs.
The cost of offsets is difficult to measure and varies greatly in different situations, but it canbe substantial. For example, if a foreign subcontractor is substituted for an established U.S.subcontractor, the cost of the first 100 units the foreign subcontractor produces will (in theory) behigher than the last 100 units produced by the U.S. firm. The actual cost difference, including thecost of qualification, is dependent on the level of prior experience and know-how existing with-in the foreign firm and, ultimately, the volume of work to be performed. The foreignsubcontractor will probably never reach the volume levels of the U.S. counterpart, and therefore,will have higher unit costs for the lower volume of units produced.
The foreign government may subsidize the foreign subcontractor by various methods, whichlowers the cost to the U.S. prime contractor and the weapon system. Nonetheless, the subsidy isstill a cost incurred by the foreign government and ultimately the foreign population, andtherefore is just as real an offset cost had it instead been passed through by the U.S. prime.
The unit production cost curve starts at a high level with production of the first unit and thenslopes downward at a decreasing rate for each additional unit until, at some point, it will startupward again. This is known as the marginal cost curve (i.e., cost of the last unit produced). Theaverage cost of all units also falls as progressively cheaper units are produced. However, at somepoint, the marginal cost and average cost curves intersect, and this is the lowest average unit costachievable using current technology, factory layout, and labor inputs. The least cost plantconfiguration can vary greatly by engineering design. For example, an auto assembly plant’slowest average unit cost may be engineered into the plant at about 200,000-250,000 vehicles peryear
Military weapon-system production lines, such as aircraft, do not use mass productiontechniques, but instead design production to minimize cost related to maximum anticipated yearlydeliveries. Also, the relatively small quantities ordered by the military raise the cost per unit,making overall cost more sensitive to changes in unit volume. Thus, the larger the order quantitiesthe more dramatically the per unit cost falls.
The U.S. producer of the weapon system may subcontract additional work to the foreignsubcontractor for the same weapon system on sales to other countries or sales or upgrades to theU.S. Defense Department. The greater volume will reduce the foreign contractor’s costs. Also,the aftermarket, which can last 20-30 years into the future, can provide additional opportunitiesfor the foreign subcontractor, certainly for those systems in his own country, but including bidsfor replacements in the United States. In addition, if the foreign subcontractor’s performance isout-standing, the American prime may establish a longer-term relationship and use the firm onother projects as a primary source.
The DISAM Journal, Spring 1999 58

The United States also pays for offsets. Again, the volume of production is critical to coststructure across all part and component suppliers and production lines. The fact that the UnitedStates orders the most aircraft pushes the unit cost of aircraft down the cost curve. Additional unitcost savings can be achieved by exporting the system, which, of course, is the classic reasonmarket-driven trade takes place at all. However, as discussed above, direct offset can quicklynullify these gains. Assuming offsets can be anticipated, especially now that many countries haveformalized policies, the intelligent U.S. subcontractor would bid a higher price for a given part orcomponent to begin with rather than risk losing money resulting from offsets. These added costs,though hidden, will be passed on to the U.S. Defense Department.
Non-defense indirect offsets are less distorting to U.S. weapon systems. However, they dopresent the U.S. exporter with administrative costs and the unnatural job of marketing a varietyof goods for which he has no particular expertise. These costs must be recouped in the price ofthe weapon system to the foreign purchaser. Also, the widely distributed, mostly negative effectsthese indirect offsets have on U.S. competitor firms are largely untraceable and almost impossibleto assess. Only anecdotal evidence exists, and while most of this evidence reflects a negativeimpact, a minor portion is also positive.
Another cost to the U.S. taxpayer is the publicly funded research and development that wentinto the weapon system, but not recaptured by the U.S. prime when exporting the weapon systemto a foreign government. The Defense Department typically waives this cost. This policy affectsexports that are offset as well as those that are not. However, with offsets some of the advancedtechnologies incorporated in the weapon system may be transferred to the foreign purchaseressentially free of charge. This issue needs further exploration.
Offsets penalize both the foreign purchaser and U.S. taxpayers. Then, why offset? If giventhe opportunity, foreign national governments prefer to spend national budgets domestically. Byoffsetting the high-priced import of a major weapon system, a government can redirectexpenditures back into its domestic economy up to the value of the offset agreement. So, insteadof spending the money abroad, it is actually spent at home. Moreover, the offset may also helppromote or preserve an indigenous defense base, infuse new technology into the economy, orintroduce domestic firms to potential export partners.
Co-production Agreements
In economic terms, co-production is perhaps the most inefficient and costly form of offset.Co-production puts a far heavier financial burden on the purchasing country than would theoutright purchase of the weapon system. In spite of this, its justification is touted on nationalsecurity grounds or national aspirations. Presumably, much, if not all, of the research anddevelopment work is already accomplished when a co-production agreement is negotiated. Thiswould be a savings to the foreign co-producer. Depending upon the specific terms of theagreement, technical data may be transferred to the purchasing country with or withoutcompensation so that a duplicate assembly facility can be established in the purchasing country.The details of part and component sourcing may also be negotiated.
The DISAM Journal, Spring 199959
While many nations may prefer self-sufficiency in armaments production, for almost allcountries the cost is prohibitive. Implicit in a nation’s decision to purchase foreign weaponsystems is the cost of home production vs. cost of overseas purchase. This gives military trade aneconomic dimension. However, other national aspirations or internal politics sometimes interferewith the decision.
Co-production deprives the original producer of production volume, while creating a clonefacility in a foreign country. The production volume of aircraft in the clone facility will almostcertainly be (much) less than in the original producer’s facility. This establishes a higher averagecost structure in both the clone facility and in the original producer’s facility, whose productionvolume decreases by an amount equivalent to that co-produced.
In the 1980s, the Japanese co-produced about 200 F-15s at an estimated 250 percent the costof purchase from the U.S. producer. Is Japan more secure? That can be debated. Did they achievetheir national aspirations? Perhaps, but the cloned facility had very limited market potential. Onceproduction was finished, its useful life was over and it would require a new infusion of capital torestore viability in some other area.
Other examples abound. Japan’s co-production of 130 F-2 (formerly the FSX) fighter aircraft(a hybrid of the F-16) may ultimately cost the country about $100 million per plane vs. $20million per aircraft if purchased from the United States. Japan’s economy is large enough toabsorb this added cost, and presumably the experience will help their ambitions to develop acommercial aircraft industry. This remains to be seen. Additional co-production agreements forthe F-16 with the European Participants Group (Belgium, Netherlands, Denmark, and Norway)and Turkey also resulted in cost penalties to the co-producer countries, while reducing businessfor the U.S. prime. Another co-production program in Egypt was completed in early 1998. Egypthad a co-production program for 555 kits of the M1A1 Abrams tank for final assembly, and isnow trying, to convert the facility to commercial operations. In general, the more expensive theweapon system, the lower its overall volume is likely to be and the less economic sense it makesto co-produce.
Turkey recently eased its offsets policy (Defense News, June 29-July 5, 1998, page 4), in partto encourage more international arms traders to form joint ventures with domestic defense firms.While Turkey’s objective remains the establishment of a stronger domestic defense infrastructure,the Turkish Government recognized that offsets as currently structured added costs andinefficiencies to weapon systems. It is hoped that this policy will generate foreign investment andan infusion of technology transfer. This may reduce future direct co-production typearrangements with their inflated prices.
Military Export Contracts
The U.S. State Department is responsible for issuing licenses for the export of defense itemscovered under the International Traffic in Arms Regulations (ITAR). In each of the last severalyears, State has issued about 45,000-50,000 licenses (for 4-year validation periods) with a totalvalue ranging from $20-30 billion. These licenses were issued to private U.S. firms to export
The DISAM Journal, Spring 1999 60
items covered by the “munitions list,” for what can be called commercial military exports. Theforeign buyer could be a public or private entity.
The majority of State-licensed military export orders are written for less than $1 million,andmost are between private firms. The great majority of these fall below the offset reportingthreshold. However, most of these likely do not include formalized offsets because of theirgenerally low value and the involvement of private entities. Still, much of this business mayinclude replacement parts or service items related to major weapon systems exported previously,which could have included offsets.
The average commercial military export license was for roughly $600,000. However, themedian (middle value) is much lower, at under $100,000. A few licenses may be for over a billiondollars, although most of the higher values go the Foreign Military Sales (FMS) (i.e., goverment-to-government) route. Larger contracts are almost always negotiated with a foreign government,and are more likely to include offsets. It is not known how much of the $20-30 billion is actuallyexported, but much of it is ultimately cancelled. Licenses are frequently acquired simply to havethem ready should an emergency shipment become necessary. Also, it is often difficult toaccurately plan four years out, but it is better to err on the high side and acquire a license for thegreater estimate.
A review of FMS agreements, published by the U.S. Defense Security Assistance[Cooperation] Agency, indicates 8,672 FMS agreements totaling over $65.6 billion were enteredinto between FY1993 and FY1996. Over the same period actual FMS deliveries equaled $44.7billion, indicating that many cancellations, perhaps as much as one-third of the business, probablyhave occurred or will occur. The average export agreement was for less than $7.6 million.However, this average is several times as large as the median FMS value, which would actuallyplace the great majority of the FMS agreements below our reporting threshold.
By comparison, BXA received reports on 173 offset agreements supporting export contractsvalued at $29.1 billion. These included both commercial and FMS agreements. The four-yearaverage export contract was $168.4 million, although this varied a great deal from one year to thenext. This implies that a small percentage of the total FMS export contracts and a smaller fractionof the commercially licensed exports are offset. However, even the contracts that are offset arevery large and represent at least an estimated 30-40 percent of the total dollar value of militaryexports.
This conclusion is reinforced by various known country thresholds at which formal offsetsareimplemented. Appendix D in BXA’s 1997 Offsets in Defense Tradereport includedinformation on the export dollar value at which selected countries require offsets. The 15 citedthresholds ranged from Israel’s low of $500,000 to $50 million for Taiwan. The average value was$7.9 million and the median, $1.7 million. Three thresholds were less than $1 million.
The United Kingdom, which alone accounted for more than 30 percent of total new offsetagreements between 1993 and 1996, has a high threshold of $16 million. Britain is also one of themajor destinations of defense products licensed by the State Department. Israel, with a lower
The DISAM Journal, Spring 199961
threshold, has a low percentage of new agreements (2.4 percent), but a high percentage of offsettransactions (8.9 percent). Some of these transactions emanate from agreements entered into priorto 1993. Others could be from agreements beneath BXA’s $5 million reporting requirement.
Aerospace Dominates Offsets
Offset agreements are overwhelmingly tied to aerospace exports. With literally tens of thou-sands of parts and components per aircraft and an abundance of advanced technology, from thepurchaser’s view aerospace products offer ample opportunities for offsets. BXA’s database (1993-1996) indicates that 91.1 percent of the dollar value of all new offset agreements ($13.8 of $15.1billion) were written against aerospace exports. The aerospace export contracts these offsetagreements referenced were 91.8 percent ($26.7 of $29.1 billion) of all the export contracts. Thepercentage of offsets aerospace export contracts averaged 51.6 percent.
Offset transactions told a similar story. Offset transactions referenced aerospace weaponsystem exports 92.7 percent ($8.56 of $9.23 billion) of the time. However, only 53.7 percent ofoffset transactions themselves were identified as aerospace products. This means that aerospaceexports are frequently offset by non-aerospace products. The transaction breakout was $4.96billion aerospace, $4.16 non-aerospace, and $0.11 unknown products. If just aerospace exportsare matched to aerospace transactions, the relationship is about 58 percent ($4.96/$8.56 billion).
It is also evident that a very high percentage of all exported military aircraft, engines, andmissiles are offset. Estimates of aerospace exports published in the Aerospace IndustriesAssociation’s 1998 Facts and Figures,indicate roughly $14.8 billion of these systems wereexported from 1993 to 1996. Judging from BXA’s total of $26.7 billion in export contracts thatwere offset over the same period with an average term of about seven years, it is apparent offsetsplayed a major role in moving these items.
In addition to the $14.8 billion in major system exports, AIA reported that $18.9 billion in(military) parts and components were exported. Exports of major U.S. weapons systems generatea future flow of parts exported to the after market. A large (but unknown) portion of the partstrade is accounted for in this way. In addition, foreign production of new systems, and the aftermarket for those systems also generates parts exports from the United States. However, the partstrade is understated because of the wide cross-section of industries that feed parts into aerospacesystems (e.g., software, forgings, ammunition, tires, etc.), but that are not captured as such in theofficial trade statistics.
Effects of Defense Industry Consolidation on Offsets
Mega-mergers and consolidations within the U.S. defense establishment have reduced thenumber but increased the average size of companies reporting offset activity. Some companiescontinue reporting under their old names, and others report as divisions of the new parentcorporation. Of the 32 companies reporting new offset agreements at any time during 1993-1996,11 have now merged with others. These same 11 are also included among the 34 reporting offset
The DISAM Journal, Spring 1999 62
transactions. In 1993, 18 companies or divisions reported new offset agreements. In 1996, thenumber was 15, four of whom were now parts of larger firms.
Aside from reducing the number of firms reporting offsets, the consolidation trend couldhave more profound effects on offsets. Under one scenario, the stronger competitive position ofmerged U.S. defense prime contractors poses an increased threat to European defense firms. Thestronger presence of U.S. firms and the shrinking global defense market could foster a more rapidconsolidation among European defense producers and lead to a degree of isolation. Oneindication that this is already happening is the Eurofighter 2000, an effort by four Europeannations to reduce dependence on the United States. Consolidation in Europe could reduce theinternational market potential available to U.S. firms and in so doing reduce offsets.
However, rationalization and consolidation of defense assets have not proceeded at theEuropean level. Rather, individual countries have done so primarily on their own, resulting in asurplus of defense assets, with numerous redundancies across Europe. A more likely scenario isthat defense budgets will drop further, and consequently reduce the market for U.S. weaponsystems. Such a drop would have little connection to consolidation.
Under a rosier scenario, company consolidations could extend across national borders andincrease the participation of foreign entities in the development and production of new U.S.weapon systems. This could also occur by partnering or joint venturing, as well as by acquisition,with foreign entities. For example, the Joint Strike Fighter program seems to be evolving multi-nation program without offsets. Currently, the program has U.S., U.K., Dutch, and Canadianparticipation. In other areas, the U.K.’s General Electric Company recently acquired Tracor. In thelast decade, the U.K.’s Lucas Aerospace (now part of Rolls-Royce) purchased Western Gear, andRolls-Royce bought Allison Gas Turbine.
It’s also conceivable the U.S. and allied foreign governments will encourage suchdevelopments, and combine defense budgets to develop future weapon systems. This wouldspread costs and benefits across borders, and help eliminate redundancies. Assuming allparticipants share in costs and profits, it would also provide incentives to market the system aswidely as possible. Offsets would then be less of a factor, except in sales to third parties.
In another scenario the U.S. government could elect to develop and produce weaponsdomestically on national security grounds. This option may be a more expensive choice in lightof the increased complexity and cost of the latest aircraft. It may also serve to increase offsetsabove current levels, particularly in aerospace defense trade, assuming a higher proportion ofultimate production of aircraft may be exported than in the past.
Historical Review, 1980-1996
The Office of Management and Budget (OMB) was responsible for reporting on offsetsunder the Defense Production Act (of 1950), Section 309, beginning in 1984. Acting under thatauthority in 1988, OMB tasked the U.S. International Trade Commission (ITC) to collect offsetsdata from defense prime contractors for the years 1980 through 1984. The collection required a
The DISAM Journal, Spring 199963

response from the prime if any military export sales contract valued at $500,000 or more wascountered by an offset agreement of any magnitude. ITC sent a mandatory survey to 52 defenseprime contractors, of whom 36 returned completed surveys. A similar data collection, alsocovering 1980 through 1987, was made by the Commerce Department’s Bureau of EconomicAnalysis for OMB a few years later.
BXA’s offsets database differs from OMB’s information in method of collection andminimum value reporting requirements. Military exporters are required to submit a reportannually to BXA for any offset agreements (as opposed to export sales contract) valued at $5million or greater and/or offset transactions valued at $250,000 or more. The export contract valueis also reported, but its size is incidental. BXA has reports from 32 companies as opposed toOMB’s 36 companies, which reported to OMB before defense downsizing and consolidationreduced the number of companies.
OMB published this information in December 1988 in their Offsets in Military Exportsreport. The OMB information was restated and summarized in the Commerce Department’s firstoffset report, Offsets in Defense Tradeestablished in May 1996. BXA combined the OMBinformation with offset data submitted by defense prime contractors for 1993 to 1996. No offsetdata was collected from 1988 to 1992.
Chart 1 includes OMB’s offset data and that received by BXA. The data is presented inconstant 1996 dollars using the Commerce Department’s 1996 GNP deflator as calculated by theBureau of Economic Analysis. Three elements are shown on the graph: the value of export salescontracts (the white bar); the value of offset obligations (the black bar); and the percent offsetobligations to the value of export sales contracts (the line).
The DISAM Journal, Spring 1999 64
Chart 1. New Offset Agreements: Selected Years (in Constant 1996 Dollars)
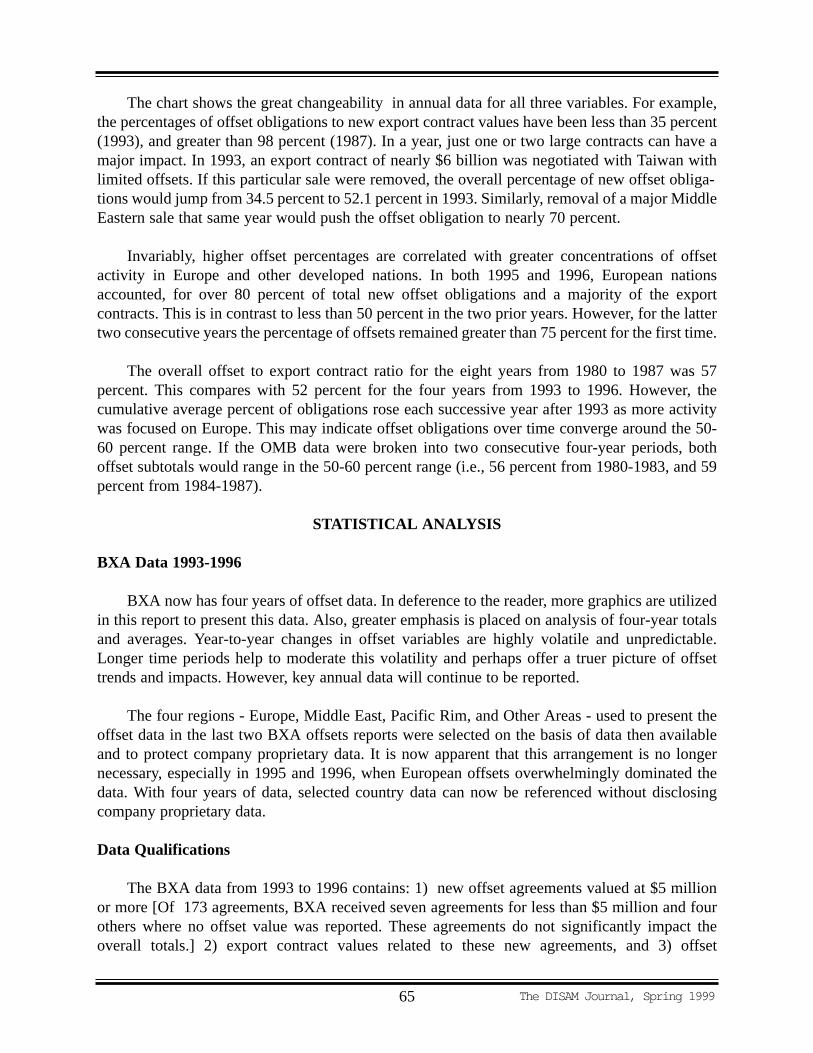
The chart shows the great changeability in annual data for all three variables. For example,the percentages of offset obligations to new export contract values have been less than 35 percent(1993), and greater than 98 percent (1987). In a year, just one or two large contracts can have amajor impact. In 1993, an export contract of nearly $6 billion was negotiated with Taiwan withlimited offsets. If this particular sale were removed, the overall percentage of new offset obliga-tions would jump from 34.5 percent to 52.1 percent in 1993. Similarly, removal of a major MiddleEastern sale that same year would push the offset obligation to nearly 70 percent.
Invariably, higher offset percentages are correlated with greater concentrations of offsetactivity in Europe and other developed nations. In both 1995 and 1996, European nationsaccounted, for over 80 percent of total new offset obligations and a majority of the exportcontracts. This is in contrast to less than 50 percent in the two prior years. However, for the lattertwo consecutive years the percentage of offsets remained greater than 75 percent for the first time.
The overall offset to export contract ratio for the eight years from 1980 to 1987 was 57percent. This compares with 52 percent for the four years from 1993 to 1996. However, thecumulative average percent of obligations rose each successive year after 1993 as more activitywas focused on Europe. This may indicate offset obligations over time converge around the 50-60 percent range. If the OMB data were broken into two consecutive four-year periods, bothoffset subtotals would range in the 50-60 percent range (i.e., 56 percent from 1980-1983, and 59percent from 1984-1987).
STATISTICAL ANALYSIS
BXA Data 1993-1996
BXA now has four years of offset data. In deference to the reader, more graphics are utilizedin this report to present this data. Also, greater emphasis is placed on analysis of four-year totalsand averages. Year-to-year changes in offset variables are highly volatile and unpredictable.Longer time periods help to moderate this volatility and perhaps offer a truer picture of offsettrends and impacts. However, key annual data will continue to be reported.
The four regions - Europe, Middle East, Pacific Rim, and Other Areas - used to present theoffset data in the last two BXA offsets reports were selected on the basis of data then availableand to protect company proprietary data. It is now apparent that this arrangement is no longernecessary, especially in 1995 and 1996, when European offsets overwhelmingly dominated thedata. With four years of data, selected country data can now be referenced without disclosingcompany proprietary data.
Data Qualifications
The BXA data from 1993 to 1996 contains: 1) new offset agreements valued at $5 millionor more [Of 173 agreements, BXA received seven agreements for less than $5 million and fourothers where no offset value was reported. These agreements do not significantly impact theoverall totals.] 2) export contract values related to these new agreements, and 3) offset
The DISAM Journal, Spring 199965
transactions valued at $250,000 or more completed during the reporting period. [Of 2,277transactions BXA reviewed, 251 had actual values of less than $250,000. Thirty-one transactionshad negative values, which were mostly accounting adjustments to previous reports, orcancellations of reported transactions. There were also 17 zero actual value entrees, but most ofthese had large credit values. The effect of these 251 transactions was to reduce total, actualtransactions by a net $45.6 million, and increase credit transactions by $330.3 million.]
Offset Transaction Analysis
Description _#_ Actual Value Credit ValueNegative Values 31 ($64,888,000) ($64,896,000)Zero Actual Values 17 $0 $152,376,000Less than $250,000 203 $19,321,695 $242,810,001Net Total 251 ($45,566,305) $330,290,001
Summary
During 1993 to 1996, 32 U.S. companies reported entering into 173 new offset agreements,with foreign governments equal to $15.1 billion. They had an average term of 87 months, or 7.25years. The agreements supported $29.1 billion in export contracts, and were concluded with 28countries to complete the offsets. In the aggregate, the offset agreements represented more than52 percent of the export contract values.
A total of 34 U.S. companies reported 2,277 offset transactions valued at $9.2 billion, forwhich they received offset credits of $10.7 billion. These transactions were executed in 31countries. About 38 percent of the value of the transactions were direct offsets, 58 percentindirect, and 4 percent unspecified. About 73 percent of the transactions’ value weresubcontracting activity purchases, or technology transfer. Roughly two-thirds of the transactionsreferenced offset agreements that predated 1993; the remaining third were against agreementsstruck in 1993 or later.
Concentrated Nature of Offset Activity
Five U.S. companies accounted for over 78 percent of the value of new offset agreements,and nearly 82 percent of export contract values. More than 70 percent of the new agreements’value were concluded with just five countries, and about 80 percent with just eight countries. Thelargest 10 percent of new offset agreements represented 68.5 percent of the total value of all newagreements, while the top 10 percent of export contracts were 72.5 percent of total exportcontracts. In addition, just 10 of 103 weapon systems referred to in the export contracts accountedfor 65 percent of export contract values, and 64 percent of the value of new offset agreements.
Offset transactions are also concentrated. Five companies reported 80.5 percent of the totalvalue, and nine reported over 91 percent. Also, five (of 32) countries accounted for 58 percent ofall transactions, and eight for 72.5 percent. In addition, just five of the 150 different weapon
The DISAM Journal, Spring 1999 66
systems referenced in the offset transaction reports accounted for 53.4 percent of the totaltransaction value. The top 10 (of 922) offset recipients, including public and private entities,accounted for 24 percent of the value of total transactions.
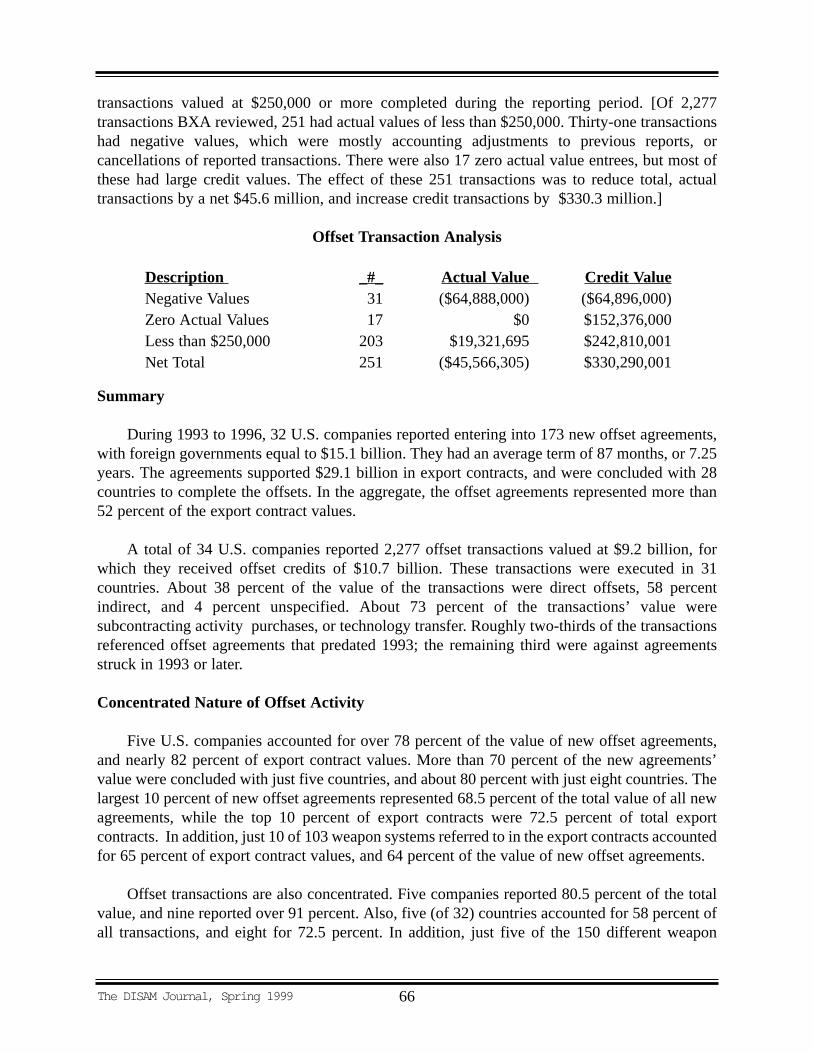
Chart 2 compares the largest 30 offset agreements to the remaining 143 agreements. Thenumber of agreements in each category is reflected on the x-axis and the dollar value (in $billions)on the y-axis. The top 30 agreements totaled $12.2 billion, or over 80 percent of all agreements.The other 143 agreements totaled $3.0 billion. Offsets as a percentage of export contracts wereabout the same for the two groups; 51.7 percent for the largest 30 agreements, and 53.3 percentfor the smaller 143 agreements.
Note to Chart 2Statistically, the mean of the 173 offset agreements was $87.6 million, but the distribution
has a very large average deviation of $110 million and even larger standard deviation of $236million. This raises the question of whether these agreements could better be described as separatecategories based on value as shown in Chart 2. Also, the median (or middle) value, between the86th and 87th agreement, was about $17.5 million, or only one-fifth of the mean, revealing theobvious: a very top-heavy distribution. If these parameters were based solely on the smaller 143agreement group, the average deviation would drop to about $15 million and the standarddeviation to $21 million. The mean would be just under $22 million, and the median $14.5million.
The DISAM Journal, Spring 199967
Chart 2. Dominance of Large Offset Agreements
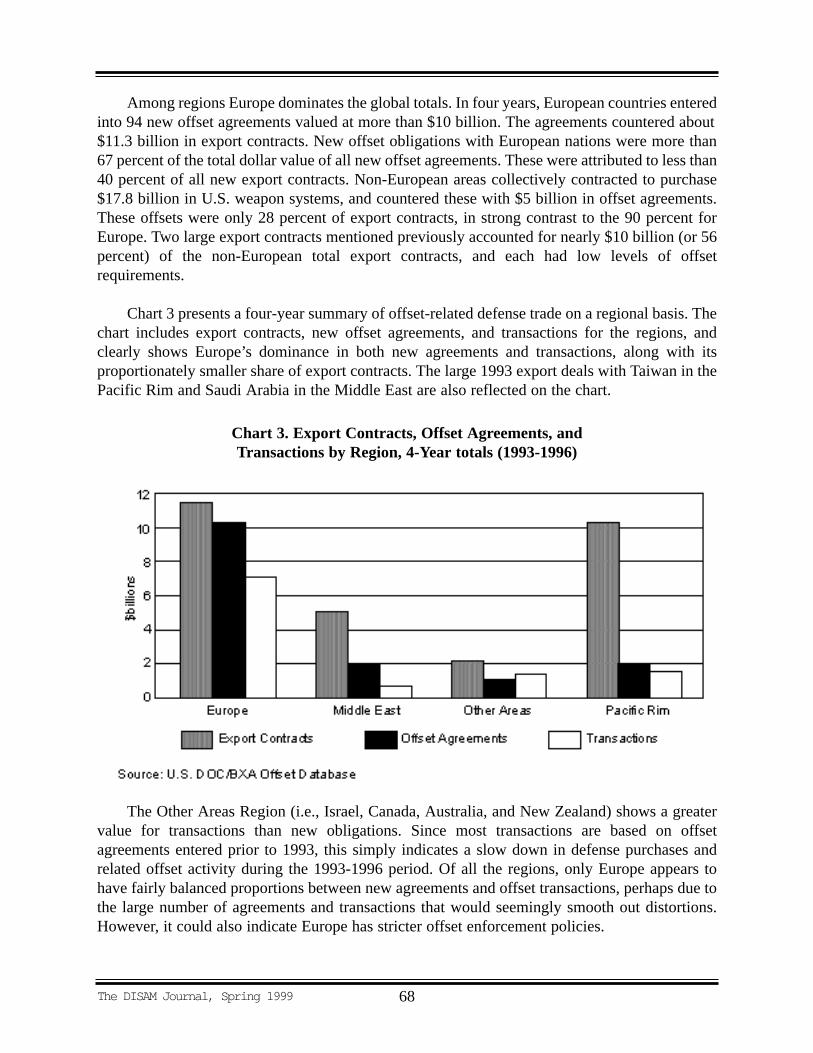
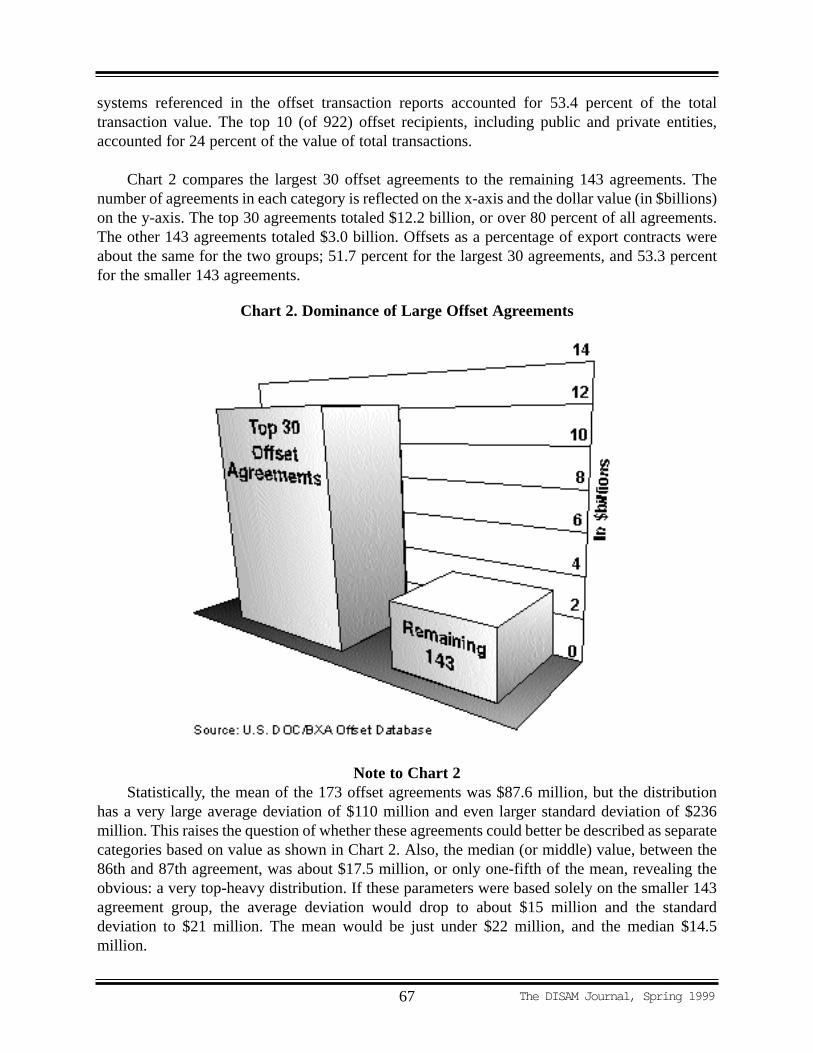
Among regions Europe dominates the global totals. In four years, European countries enteredinto 94 new offset agreements valued at more than $10 billion. The agreements countered about$11.3 billion in export contracts. New offset obligations with European nations were more than67 percent of the total dollar value of all new offset agreements. These were attributed to less than40 percent of all new export contracts. Non-European areas collectively contracted to purchase$17.8 billion in U.S. weapon systems, and countered these with $5 billion in offset agreements.These offsets were only 28 percent of export contracts, in strong contrast to the 90 percent forEurope. Two large export contracts mentioned previously accounted for nearly $10 billion (or 56percent) of the non-European total export contracts, and each had low levels of offsetrequirements.
Chart 3 presents a four-year summary of offset-related defense trade on a regional basis. Thechart includes export contracts, new offset agreements, and transactions for the regions, andclearly shows Europe’s dominance in both new agreements and transactions, along with itsproportionately smaller share of export contracts. The large 1993 export deals with Taiwan in thePacific Rim and Saudi Arabia in the Middle East are also reflected on the chart.
The Other Areas Region (i.e., Israel, Canada, Australia, and New Zealand) shows a greatervalue for transactions than new obligations. Since most transactions are based on offsetagreements entered prior to 1993, this simply indicates a slow down in defense purchases andrelated offset activity during the 1993-1996 period. Of all the regions, only Europe appears tohave fairly balanced proportions between new agreements and offset transactions, perhaps due tothe large number of agreements and transactions that would seemingly smooth out distortions.However, it could also indicate Europe has stricter offset enforcement policies.
The DISAM Journal, Spring 1999 68
Chart 3. Export Contracts, Offset Agreements, and Transactions by Region, 4-Year totals (1993-1996)

New Offset Agreements: Summary
Table 1 presents an annual summary of new offset agreements by region.
The DISAM Journal, Spring 199969
Table 1. New Offset Agreements, 1993 to 1996
Export OffsetContracts Agreements Terms
Region Deals $millions $millions % Offsets Months
1993Europe 14 2,985.0 2,338.1 78.3% 84Middle East 4 4,143.9 1,462.1 35.3% 96Other Areas 4 98.5 50.5 51.3% 83Pacific Rim 7 6,717.7 943.8 14.1% 78Total 29 13,945.0 4,794.4 34.4% 84
1994Europe 20 1,508.2 764.8 50.7% 88Middle East 6 819.2 417.3 50.9% 88Other Areas 14 549.5 358.4 65.2% 63Pacific Rim 9 1,915.4 508.1 26.5% 72Total 49 4,792.4 2,048.7 42.8% 78
1995Europe 26 4,944.3 5,159.2 104.4% 104Middle East 2 68.7 26.4 38.4% 72Other Areas 9 1,378.9 547.1 39.7% 76Pacific Rim 8 1,010.1 301.3 29.8% 80Total 45 7,402.0 6,034.1 81.5% 93
1996Europe 34 1,924.1 1,919.1 99.7% 104Middle East 1 50.0 25.0 50.0% 90Other Areas 8 206.6 106.6 51.6% 75Pacific Rim 7 807.1 220.0 27.3% 53Total 50 2,987.8 2,270.7 76.0% 92
4-Year TotalsEurope 94 11,361.8 10,181.3 89.6% 98Middle East 13 5,081.8 1,930.8 38.0% 88Other Areas 35 2,233.5 1,062.7 47.6% 71Pacific Rim 31 10,450.3 1,973.2 18.9% 71
Grand Total 173 29,127.3 15,147.9 52.0% 87
Source: U.S. DOC/BXA Offsets Data Base
The value of 1996 new offset agreements was down sharply from 1995, and well below thefour year averages. In 1996, reported new agreements of $2.27 billion supported $3 billion in newexport contracts. New offset agreements were down over 60 percent from the $6 billion reportedin 1995, and more than 40 percent below the (four-year) average of $3.8 billion. Europe was againthe dominant player, with $1.92 billion (or 85 percent) of the 1996 new agreement total. Europe’snew offset obligations represented almost 100 percent of the export contracts ($1.92 billion) theyreferenced. This percentage was down slightly from the 104 percent Europe logged in 1995. The1995 agreements’ data was unusual in that it was dominated by three very large offset agreementsU.S. firms negotiated with European nations. These three agreements alone were nearly two-thirds of that year’s total.
Worldwide, new offset agreements as a percent of export contract values fell to 76 percentfrom about 81 percent in 1995. The 1996 figure, however, is considerably higher than the four-year average of 52 percent. The 1995 and 1996 percentages of offsets to export contract valueswere the third and fourth highest levels recorded since 1980. The large differences in thesenumbers are explained in part by the major regional and national differences in offsetrequirements, combined with the apparent random occurrence of export sales to any of thoseplaces.
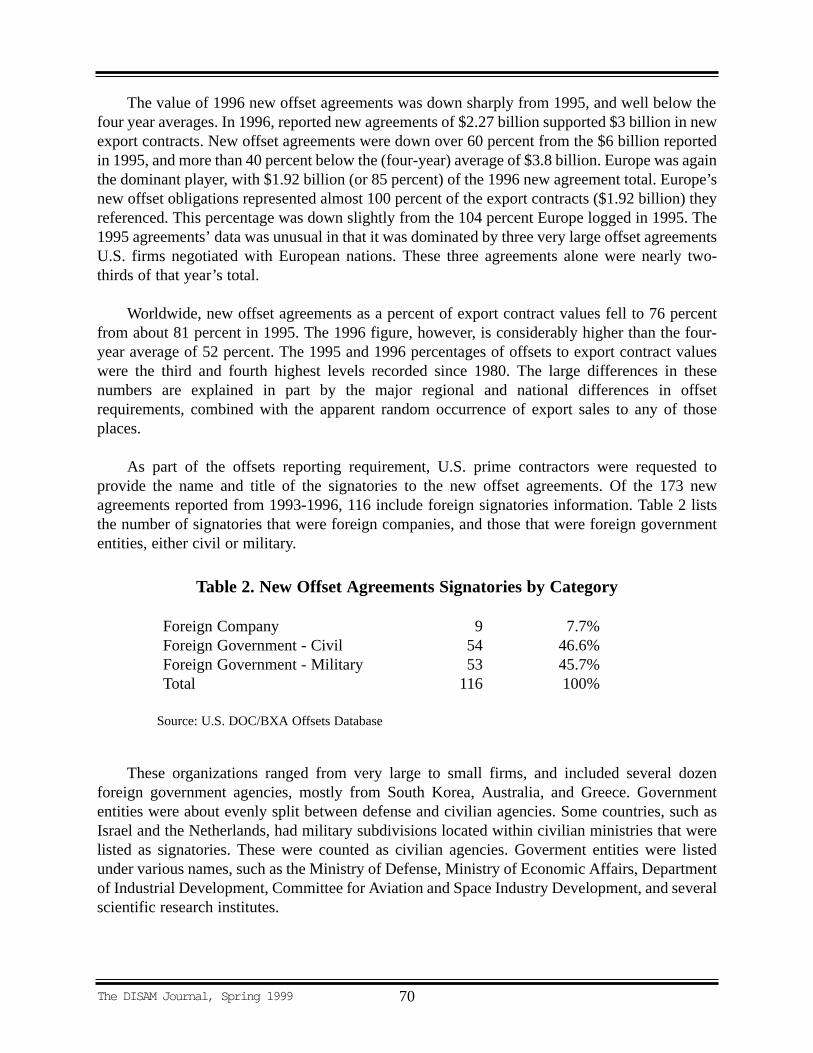
As part of the offsets reporting requirement, U.S. prime contractors were requested toprovide the name and title of the signatories to the new offset agreements. Of the 173 newagreements reported from 1993-1996, 116 include foreign signatories information. Table 2 liststhe number of signatories that were foreign companies, and those that were foreign governmententities, either civil or military.
These organizations ranged from very large to small firms, and included several dozenforeign government agencies, mostly from South Korea, Australia, and Greece. Governmententities were about evenly split between defense and civilian agencies. Some countries, such asIsrael and the Netherlands, had military subdivisions located within civilian ministries that werelisted as signatories. These were counted as civilian agencies. Goverment entities were listedunder various names, such as the Ministry of Defense, Ministry of Economic Affairs, Departmentof Industrial Development, Committee for Aviation and Space Industry Development, and severalscientific research institutes.
The DISAM Journal, Spring 1999 70
Table 2. New Offset Agreements Signatories by Category
Foreign Company 9 7.7%Foreign Government - Civil 54 46.6%Foreign Government - Military 53 45.7%Total 116 100%
Source: U.S. DOC/BXA Offsets Database
Military entities comprised 46 percent of the signatories while non-military signatoriestotaled 54 percent. The non-military entities were either foreign companies or civil governmententities. While the new agreements reports received by BXA did not include the split betweendirect and indirect offsets, based on country transactions data no correlation was evident betweenthe level of direct offsets and the foreign signatory’s affiliation to military or civilian governmentagencies.
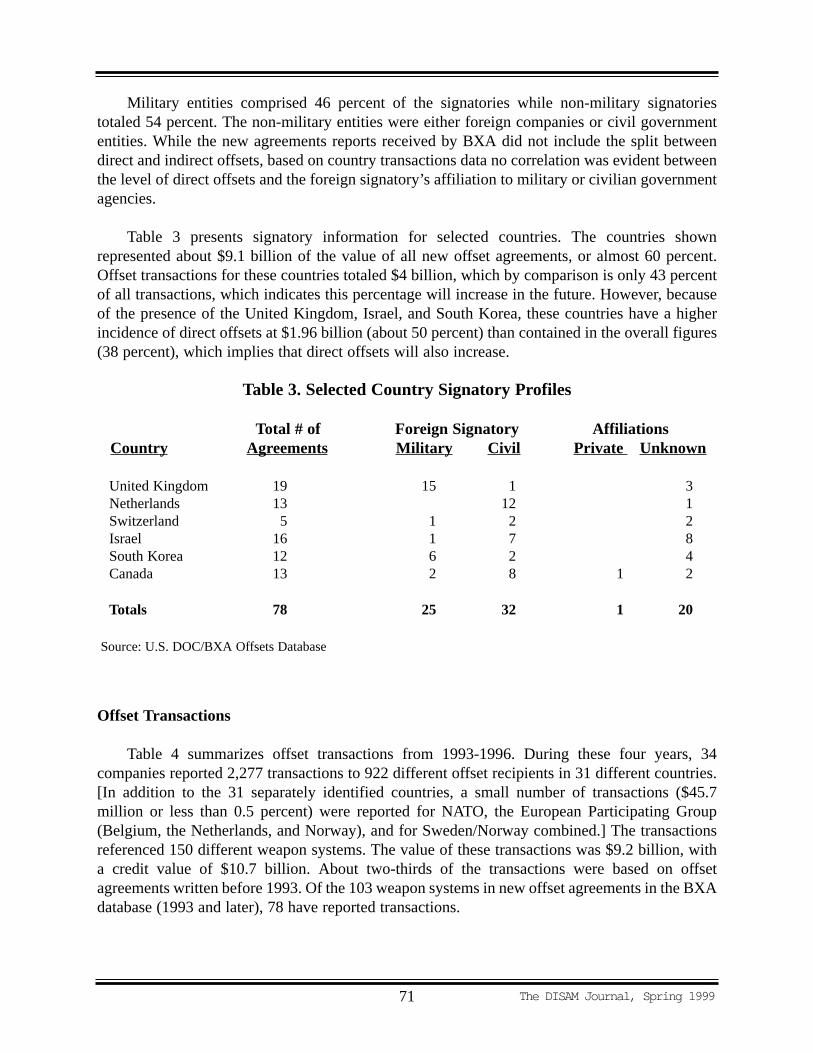
Table 3 presents signatory information for selected countries. The countries shownrepresented about $9.1 billion of the value of all new offset agreements, or almost 60 percent.Offset transactions for these countries totaled $4 billion, which by comparison is only 43 percentof all transactions, which indicates this percentage will increase in the future. However, becauseof the presence of the United Kingdom, Israel, and South Korea, these countries have a higherincidence of direct offsets at $1.96 billion (about 50 percent) than contained in the overall figures(38 percent), which implies that direct offsets will also increase.
Offset Transactions
Table 4 summarizes offset transactions from 1993-1996. During these four years, 34companies reported 2,277 transactions to 922 different offset recipients in 31 different countries.[In addition to the 31 separately identified countries, a small number of transactions ($45.7million or less than 0.5 percent) were reported for NATO, the European Participating Group(Belgium, the Netherlands, and Norway), and for Sweden/Norway combined.] The transactionsreferenced 150 different weapon systems. The value of these transactions was $9.2 billion, witha credit value of $10.7 billion. About two-thirds of the transactions were based on offsetagreements written before 1993. Of the 103 weapon systems in new offset agreements in the BXAdatabase (1993 and later), 78 have reported transactions.
The DISAM Journal, Spring 199971
Table 3. Selected Country Signatory Profiles
Total # of Foreign Signatory AffiliationsCountry Agreements Militar y Civil Private Unknown
United Kingdom 19 15 1 3Netherlands 13 12 1Switzerland 5 1 2 2Israel 16 1 7 8South Korea 12 6 2 4Canada 13 2 8 1 2
Totals 78 25 32 1 20
Source: U.S. DOC/BXA Offsets Database

European countries accounted for 64.2 percent of the actual value and 66.3 percent of thecredit value of total transactions. The top five European countries - Finland, United Kingdom,Switzerland, the Netherlands, and Spain - accounted for 51.3 percent the (actual value) world totaland almost 70 percent of the European total. Israel, South Korea, Turkey, Germany, and Canada,along with the five listed European nations, make up the top 10, and collectively account fornearly 80 percent of the world total. NATO countries accounted for $3.95 billion (43 percent) ofthe transactions value.
In 1996, a total of 621 offset transactions valued at $2.86 billion were reported, with a creditvalue of $3.07 billion. The 1996 values were the largest for transactions for the four years, andcapped off four years of steady increases. The 1996 value was almost 8 percent more than 1995values, although this was not as dramatic as the 40 percent increase observed between 1994 and1995.
The DISAM Journal, Spring 1999 72
Table 4. Offset Transactions Summary, 1993-19964-Year
Transaction Data 1993 1994 1995 1996 Total
# of Companies Reporting 23 21 20 21 34# Reported Offset Transactions 493 550 667 621 2,277# of Different Countries Reported 26 25 25 25 31# of Different weapon systems 63 61 73 78 150# of Different Transaction Recipients 259 318 373 367 922
Offset Transactions by Region
Europe 296 355 410 401 1,462Middle East 16 22 36 30 104Other Areas 82 94 161 126 463Pacific Rim 45 79 60 64 248
Offset Transactions by Region (in $millions)
Actual Values: Total $1,814.9 $1,891.1 $2,661.0 $2,862.4 $9,229.4Europe $1,377.1 $1,149.5 $1,767.2 $1,828.9 $6,122.7Middle East $53.3 $47.3 $135.5 $217.8 $453.9Other Areas $211.7 $282.3 $484.6 $357.9 $1,336.5Pacific Rim $172.8 $412.0 $273.7 $457.8 $1,316.3
Credit Values: Total $2,155.1 $2,161.5 $3,333.4 $3,066.9 $10,716.8Europe $1,609.1 $1,277.4 $2,076.1 $2,117.2 $7,079.8Middle Ease $116.7 $109.9 $159.3 $229.6 $615.5Other Areas $249.9 $283.6 $481.0 $358.2 $1,372.7Pacific Rim $179.4 $490.5 $616.9 $361.9 $1648.7
Source: U.S. DOC/BXA Offsets Database
European nations accounted for the bulk of the value of offset transactions for the fourthconsecutive year; in 1996 about 64 percent were with Europe. Direct offset transactions rose toabout 43 percent in 1996, up from the 40 percent recorded the prior year. This was largelyaccounted for by substantial increases in subcontractor activity in Europe, especially in the UnitedKingdom, and a very large jump in direct technology transfer to the Pacific Rim. The Europeanincreases in subcontractor activity were moderated somewhat by a large decrease in the “OtherAreas” region (Israel, Canada, and Australia).
The 1996 offset transactions reports were based on 78 different exported weapon systemsseven of which appeared for the first time.
Offset Transactions by Type
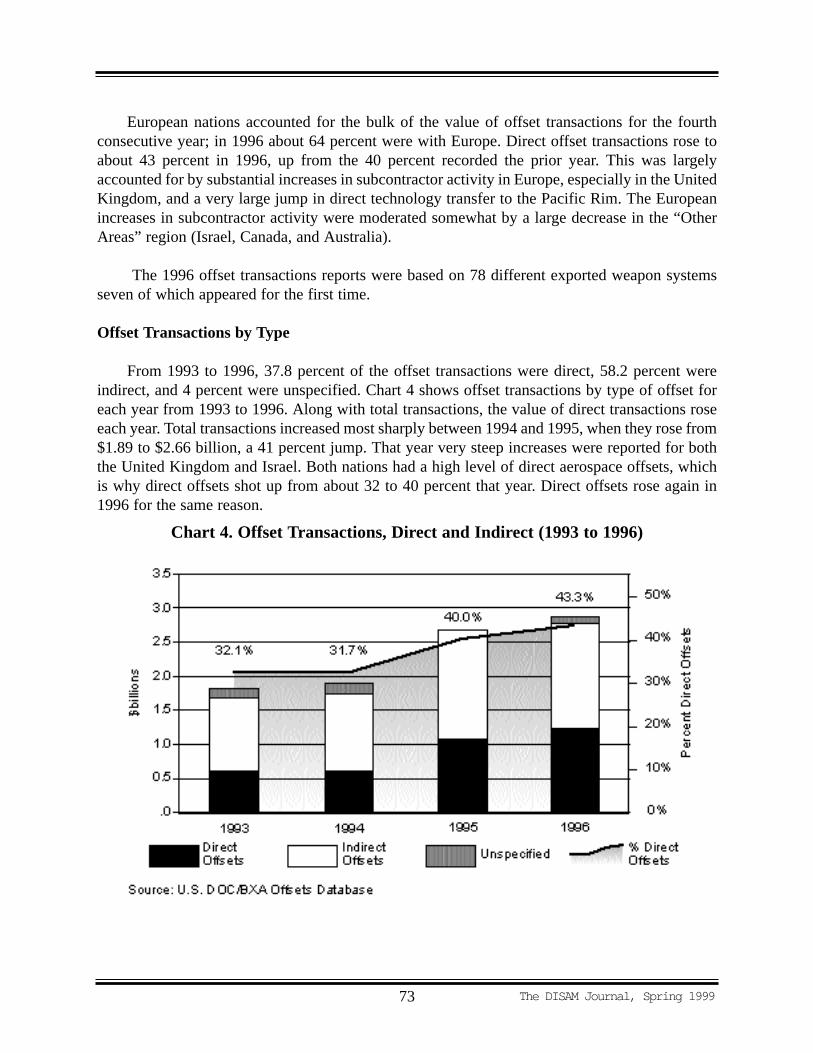
From 1993 to 1996, 37.8 percent of the offset transactions were direct, 58.2 percent wereindirect, and 4 percent were unspecified. Chart 4 shows offset transactions by type of offset foreach year from 1993 to 1996. Along with total transactions, the value of direct transactions roseeach year. Total transactions increased most sharply between 1994 and 1995, when they rose from$1.89 to $2.66 billion, a 41 percent jump. That year very steep increases were reported for boththe United Kingdom and Israel. Both nations had a high level of direct aerospace offsets, whichis why direct offsets shot up from about 32 to 40 percent that year. Direct offsets rose again in1996 for the same reason.
The DISAM Journal, Spring 199973
Chart 4. Offset Transactions, Direct and Indirect (1993 to 1996)
The absolute increase in 1995 in direct offset transactions was over $400 million ($600million to $1.06 billion), a 77 percent increase. Indirect offset transactions also rose by asubstantial amount from $1.13 to $1.6 billion (up 42 percent), which partly balanced out thedirect increases. The nearly $500 million jump in indirect offsets was due to large increases intransactions from Finland, Switzerland and Malaysia.
Countries varied widely in how offset transactions were allocated between direct andindirect. The allocation was often closely linked to the size of the country’s indigenous aerospacesector. Generally, countries with established aerospace sectors tended to fulfill offsets withaerospace and these were most often direct. In fact, almost two-thirds (63.1 percent) of allaerospace products, transactions ($3.13 of $4.96 billion) were direct offsets. Moreover, aerospaceproducts accounted for 90 percent of all direct offsets. This is entirely consistent with the 90percent plus exports of aerospace weapon systems that offset transactions refer back to.
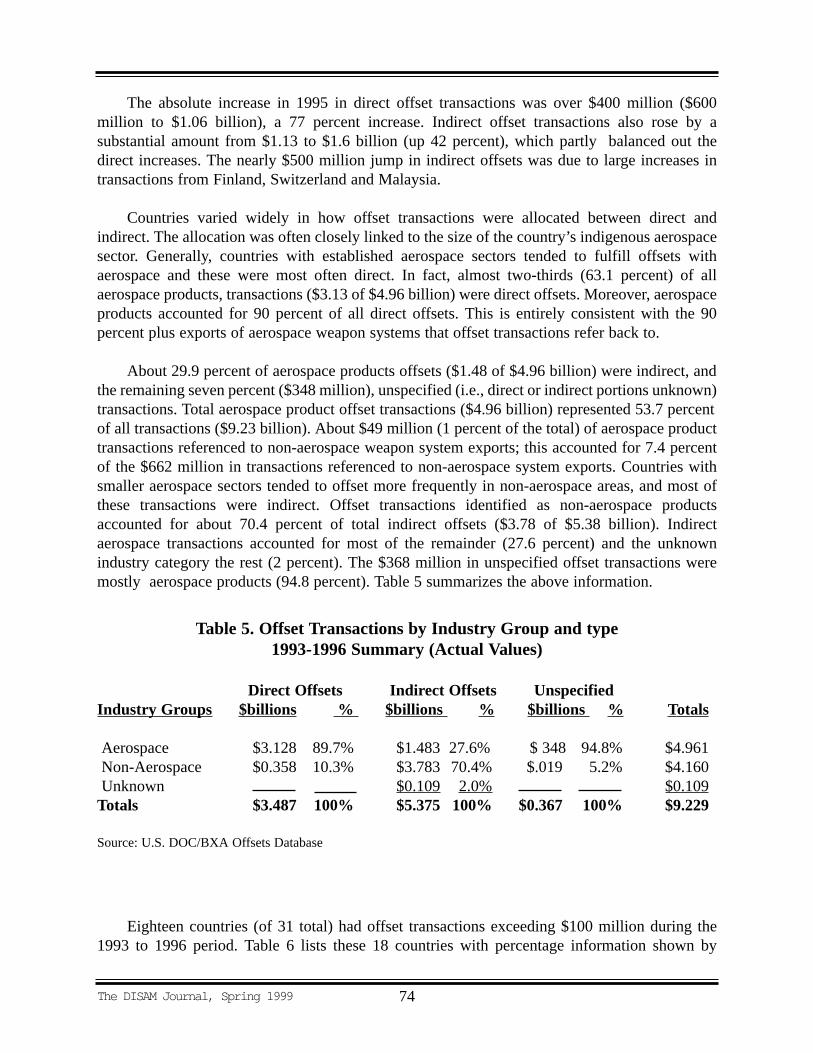
About 29.9 percent of aerospace products offsets ($1.48 of $4.96 billion) were indirect, andthe remaining seven percent ($348 million), unspecified (i.e., direct or indirect portions unknown)transactions. Total aerospace product offset transactions ($4.96 billion) represented 53.7 percentof all transactions ($9.23 billion). About $49 million (1 percent of the total) of aerospace producttransactions referenced to non-aerospace weapon system exports; this accounted for 7.4 percentof the $662 million in transactions referenced to non-aerospace system exports. Countries withsmaller aerospace sectors tended to offset more frequently in non-aerospace areas, and most ofthese transactions were indirect. Offset transactions identified as non-aerospace productsaccounted for about 70.4 percent of total indirect offsets ($3.78 of $5.38 billion). Indirectaerospace transactions accounted for most of the remainder (27.6 percent) and the unknownindustry category the rest (2 percent). The $368 million in unspecified offset transactions weremostly aerospace products (94.8 percent). Table 5 summarizes the above information.
Eighteen countries (of 31 total) had offset transactions exceeding $100 million during the1993 to 1996 period. Table 6 lists these 18 countries with percentage information shown by
The DISAM Journal, Spring 1999 74
Table 5. Offset Transactions by Industry Group and type1993-1996 Summary (Actual Values)
Direct Offsets Indirect Offsets UnspecifiedIndustr y Groups $billions % $billions % $billions % Totals
Aerospace $3.128 89.7% $1.483 27.6% $ 348 94.8% $4.961Non-Aerospace $0.358 10.3% $3.783 70.4% $.019 5.2% $4.160Unknown $0.109 2.0% $0.109Totals $3.487 100% $5.375 100% $0.367 100% $9.229
Source: U.S. DOC/BXA Offsets Database

industry category and type offset. These 18 countries accounted for 95.8 percent of totaltransactions ($8.84 of $9.23 billion). The five countries with the highest value of transactionFinland, Britain, Israel, South Korea, and Switzerland. The 18 countries are ranked on Table 6 bypercent aerospace transactions of total transactions. All 18 countries had aerospace transactions.Australia is ranked first with 87.2 percent of reported transactions in aerospace related products.
Note that 34 percent of Australia’s total transactions are direct transactions of aerospaceproducts. Another 11.3 percent of the Australia’s transactions are direct non-aerospace products,for a country total of 45.3 percent directs. Not all countries’ category totals add to 100 percent(Taiwan for example) because of the unknown industry category, which is not shown on Table 6.All unknown industry transactions, however, were indirect offsets and represented only 1.2percent of the total transactions.
The DISAM Journal, Spring 199975
Table 6. Offset Transactions by Type and CountryAerospace and Non-Aerospace, by Percent, 1993-1996
Aerospace Offset Transactions Non-Aerospace Transactions% % % Total % % % Total
Country Dir ect Indir ect Unspec. % Dir ect Indir ect Unspec. %
Australia 34.0 29.9 24.3 87.2 11.3 1.4 12.8Belgium 82.0 2.2 84.2 15.8 15.8Israel 56.6 7.3 14.9 78.7 0.1 20.8 21.0Taiwan 0.4 77.4 77.8 9.75 5.0 14.7Denmark 46.6 27.9 74.4 25.6 25.6U.K. 57.6 15.9 73.5 26.5 26.5Turkey 36.9 31.0 67.9 1.2 30.9 32.1France 21.3 43.6 65.0 35.1 35.1Spain 57.2 0.8 5.8 63.7 36.2 36.2S. Korea 34.3 25.8 3.3 63.5 33.2 3.2 0.1 36.6Canada 3.1 39.9 5.3 58.3 5.6 36.1 41.7Netherlands 34.2 4.5 18.8 57.4 0.1 42.5 42.6Germany 29.2 17.3 46.4 5.8 47.6 53.4Switzerland 26.6 11.8 38.3 59.0 59.0Norway 17.1 17.6 34.7 52.1 13.3 65.3Finland 20.9 9.4 30.2 68.5 68.5Greece 18.3 7.9 26.1 0.7 72.3 72.9Malaysia 12.8 12.8 2.4 68.6 70.9
All Countries 33.9 16.1 3.8 53.8 3.9 41.0 0.2 45.1
Source: U.S. DOC/BXA Offset Database
Twelve of the 18 countries had more than half the value of their offset transactions inaerospace products; 10 had more than 60 percent, including three of the top five; and sixcountries, including the United Kingdom and Israel of the top five, had more than 70 percent inaerospace. For all countries, including those not listed on the table, aerospace transactionsaveraged 53.8 percent.
The relative share of aerospace transactions was highest in 1994, when it exceeded 60percent. However, direct offsets were at a four-year low in 1994 at less than 32 percent. That yearBritain and Israel were not in the top five and Taiwan transactions rose rapidly due to the previousyear’s large export sale. The aerospace share of total offset transactions’ was about per 51 per centin 1993 and 1995, and rose to 53 percent in 1996. Direct offsets in the aerospace categoryrepresented 33.9 percent, compared with only 3.9 in the non-aerospace sector. Six countriesshowed less than half of their aerospace transactions as direct (Australia, Taiwan, France, Canada,Norway, and Malaysia).
Indirect credit values were generally higher relative to actual values than were credit valuesfor direct transactions. While indirect credit values were 24.4 percent higher than their reportedactual values, direct credit values were only 12.1 percent higher. Credit values for aerospaceindirects ($1.92 billion) were 29 percent higher than actual values, although most countries werewell below the 29 percent figure. Five countries - Taiwan, France, Norway, Portugal, and Israelaccounted for nearly all of the higher value. Credit values for direct aerospace transactions wereprimarily 1.3 percent higher than actual. Many countries showed credit values that were smallerthan actual values. In comparison, non-aerospace credit values were 23 percent higher than actualvalues for indirect transactions, while directs, from a very small base, were slightly more thantwice as large.
Direct Offsets May be Slightly Understated
Direct offsets may be slightly understated because of the hidden “unspecified” transactions,which could be mostly direct. About 95 percent of the unspecified offset transactions ($348 of atotal of $367 million) were aerospace products. About two-thirds of total aerospace transactionswere direct offsets. If the unspecified offsets follow this pattern, they would increase overalldirect transactions by 2 or 3 percent.
This does not negate assertions in the two previous BXA offset reports that indirect offsetshave increased. If the same logic is applied to the 1988 OMB report on offsets, it may actuallyreinforce the assertion. The OMB report stated that during the eight years (1980-1987) directoffsets were 36.8 percent; indirect were 41.3 percent; and unspecified were 21.9 percent. If thetwo-thirds rule is applied to the unspecified portion, then over 50 percent of the OMB totaltransactions would be direct. If the unspecified were simply made proportional to the knowndirect and indirect, the OMB direct transaction value would still be over 47 percent, while theBXA proportional split would be 39.3 percent.
Also, it appears logical that direct offsets should be declining. With falling defense budgetsand more countries shrinking their defense industries, the opportunities for direct offsets have
The DISAM Journal, Spring 1999 76

declined. Moreover, aerospace product exporters may prefer indirect offset transactions, whichare less disruptive to their companies.
Note: Co-production agreements with Japan and other countries are not included in the BXAdatabase. Co-production is direct and would increase the direct total substantially.
Offset Transactions by Description
Chart 5 shows the breakdown of offset transactions for 1993-1996 by method of fulfillment.Purchases, subcontracts, and technology transfer (in that order) dominated offset transactionactivity (actual values). Their combined values ($6.74 of $9.23 billion) represented 73.1 percentof the four-year total of offset transactions. Purchases ($3.36 billion), all indirect, were more thanone-third (36.5 percent) of total offsets, while subcontracts ($2.09 billion), all direct, were 22.7percent of the total. Technology transfer was $1.29 billion (14 percent of total). Credit transferstotaled $900 million and were just under 10 percent of the total.
Purchases accounted for more than half of the number of all transactions (1,209 of 2,277),averaging about $2.78 million per purchase. Individual purchase transactions could be bundles ofitems, such as cellular phones, or single items such as an oil rig. More expensive purchasesincluded computer software, a cable-laying vessel, and medical supplies. Some of the lessexpensive purchases were food stuffs and wire cutting equipment.
The DISAM Journal, Spring 199977
Chart 5. Offset Transaction Descriptions, 1993-1996
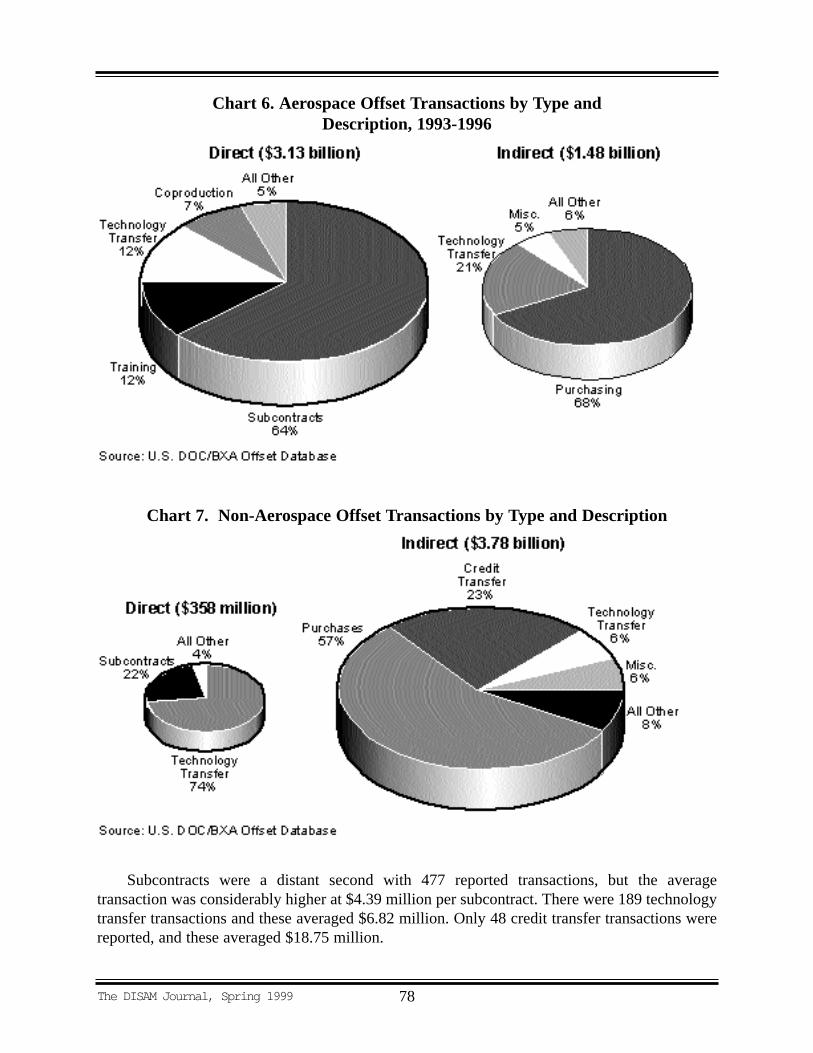
Subcontracts were a distant second with 477 reported transactions, but the averagetransaction was considerably higher at $4.39 million per subcontract. There were 189 technologytransfer transactions and these averaged $6.82 million. Only 48 credit transfer transactions werereported, and these averaged $18.75 million.
The DISAM Journal, Spring 1999 78
Chart 6. Aerospace Offset Transactions by Type and Description, 1993-1996
Chart 7. Non-Aerospace Offset Transactions by Type and Description
In terms of credit values, the profile by offset description is about the same, although the topthree categories are each somewhat less. The combined percentage of the top three credit valueswas 68.2 percent instead of the 73 percent recorded for actual values. The categories with thelargest differences between actual and credit value were investment (plus 99 percent),miscellaneous transactions, which included mostly marketing or business assistance (plus 61.5percent), and training (plus 43.5 percent). For all categories, credit transaction values were $1.49billion more than actual values, or about 16.1 percent higher. The three with the largest multiplesmentioned above represented about half the increase ($746 million), although their actual totalwas only 13.3 percent of overall actual transactions.
Charts 6 and 7 present offset transactions by type and description for the aerospace and non-aerospace sectors. Transactions not specified as either direct or indirect ($368 million) andtransactions of unknown industry sector ($109 million) are not included in the charts. Togetherthese transactions accounted for about 5 percent of the total.
Chart 6 shows direct and indirect aerospace transactions. About two-thirds of directaerospace offset transactions ($1.99 of $3.13 billion) were subcontracts. Subcontracts mayconceal the partial involvement of licensing, technical data exchange, training or know-howtransfer needed to establish qualified subcontractors. These additional costs vary from country tocountry and may be quite low for countries with strong aerospace infrastructures. The UnitedKingdom and Israel accounted for more than half the subcontracting activity, and both countrieshave strong aerospace subcontractors. Also, over 99 percent of both U.K. and Israel’s total directaerospace offsets were subcontracts. It appears these countries are motivated to maintain theirdefense infrastructures. Germany had over 83 percent of its direct transactions in subcontractsand France had 100 percent, although the French quantity was small relative to indirect offsets.Nineteen other countries had subcontract activity, but all were small quantities.
Other direct transactions included training and technology transfer, each about 12 percent.Training transactions $380 million. These were predominantly reported in Finland, South Korea,Turkey, and the U.A.E., which accounted for about 88 percent of the total. Eight other countriesshared the rest. Technology transfer totaled $367 million. Finland, Spain, and Switzerlandaccounted for about 77 percent of these offsets and nine others made up the rest.
Indirect aerospace offset transactions totaled $1.48 billion, slightly less than half of thedirects. Sixty-eight percent ($1 billion) were purchases, the indirect counterpart to directsubcontracts. Leading countries included Britain, South Korea, Canada, and Turkey. These fouraccounted for almost 48 percent of the total. An unknown portion of these were defense-related.Technology transfer was the only other significant offset among indirect aerospace transactions,making up 21 percent. Over 90 percent of reported technology transfer were accounted for byjust three countries: Taiwan, Finland, and South Korea.
Chart 7 shows non-aerospace transactions. The direct transactions were small at only $358million. These were predominantly technology transfer ($265 million) and subcontracts ($79million). South Korea was the major factor in the technology transfer offsets, while Australia,Taiwan, and Germany dominated the subcontracting activity.
The DISAM Journal, Spring 199979
The indirect non-aerospace transactions were more than ten times greater than the directs,and were valued at $3.78 billion. These were mostly purchases and credit transfers. The purchases($2.13 billion) included activity in nearly 30 countries. Finland, Switzerland, Greece, Germany,and Spain accounted for more the 60 percent of the total. Finland and the United Kingdomdominated credit transfers ($872 million). Technology transfers were a distant third at $239million. Finland, Malaysia, and the Netherlands dominated these.
EUROPE AND OFFSETSOverview
As cited earlier, Europe by far demands the most offsets on U.S. military exports. Europeancountries accounted for over two-thirds of all new offset agreements during the 1993-1996period. Just three European countries, the United Kingdom, the Netherlands, and Switzerland,accounted for 55 percent of all new agreements. And, in the final two years of the period, all ofEurope accounted for more than 85 percent of the total.
Why is Europe so dominant in offsets?Part of the answer is that European countries, amongthem our NATO allies, have long been the major purchasers of the newest and often mostexpensive weapon systems available from the United States. In addition, Europe has a largeoverall defense market and requirement for sophisticated weapon systems. Offsets also have ahistoric basis in this trade, and they seem to have a momentum of their own. Moreover, mostEuropean nations demand particularly high levels of offsets relative to the value of the importedweapon system. This is a common practice among more advanced economies. Offsets can makegood political sense by redirecting what would otherwise be large international outflows back intothe domestic economy. In so doing, they may also promote technology transfer, supplementdefense infrastructure, or provide commercial business opportunities. Almost all European (andother) countries have adopted formalized offset policies.
To better understand the motivation behind European offset demands, it is useful to examinethe political arena as well as the economics of the European defense industry. In the short run,over capacity in the European defense industry remains a dilemma. Despite reductions in defenseexpenditures, European public policies have maintained an unsustainable number of defensecompanies.
While consolidation of the defense sector proceeded quickly in the United States, itproceeded slowly in Europe. Only Britain appears to have downsized its defense industryextensively. However, Britain maintains a formal policy of 100 percent offsets, which they call“industrial participation.” The British policy appears primarily targeted at the United States, thechief source of its military imports. The policy’s implementation reflects an effort to get some ofthe subcontract business on purchased systems, as well as to balance bilateral defense trade withthe United States.
Britain is following the same approach as the United States and many other countries withlarge defense establishments that view exports of defense goods as a method to maintain defenseinfrastructure, and take pressure off scarce public expenditures. The persistent U.S. defense
The DISAM Journal, Spring 1999 80
surplus with Britain and other countries, and the fact that the United States has the world’ssingularly largest defense market, therefore, have long been points of contention.
Other European countries are driven by similar considerations, but have not followedBritain’s lead in downsizing. In many cases, political considerations stalled mergers. Defensecontractors remain under minimal pressure to merge or improve efficiency, either because theyare state owned or because government supporters keep business coming their way. In addition,job retention is a bigger issue in Europe than in the United States, and often receives governmentsupport or protection beyond its economic justification. National sovereignty issues and pridehave also inhibited cross-border cooperation.
These basic circumstances compel the Europeans to continue the practice of offsets innegotiating major weapon agreements. It has become increasingly difficult for U.S. companies tosell to the Europeans without some form of counter compensation. European governments havepressured each other in the past several years to purchase defense equipment from Europeancompanies before considering American or other options. Even countries that do not have largeindustrial bases are encouraged to purchase European defense equipment for the economic goodof the European Union.
In brief, the justification for offset demands by European nations can be condensed into fivebasic arguments:
1. the traditional national security argument;2. maintenance of domestic defense industrial infrastructure;3. redirection of large public disbursements for imported weapons back into domestic
economy;4. an American trade surplus in defense trade; and5. lack of international agreements governing defense trade.
These arguments will be discussed in more detail in the sub-sections that follow. On closeexamination, they are not entirely persuasive. In the final analysis, offsets in defense trade arepermissible under international trade rules, and therefore, they occur.
The National Security Argument
Do offsets promote national security?If offsets promote national security, why do nationsvary so much in their offset demands and percentage requirements? Why do some nations,including several with major external threats at their borders, require few offsets? Also, why dothresholds at which offsets kick in vary from less than $1 million to over $50 million for differentnations? Europe’s security is linked to the NATO alliance. How can offsets, which raise the pricetag of weaponry, create redundancies and inefficiencies, and distort trade, contribute to thisalliance?
The DISAM Journal, Spring 199981
A pillar of national security in today’s world is deterrence. Advanced weapon systems, whichprovide a technology edge over potential enemies, contribute to this deterrence regardless of theweapon’s origin. Nations that purchase American weapon systems obviously do so for thenational security benefit, not to book more offsets. Moreover, it is almost always cheaper for mostnations to import these systems than to develop and produce them domestically. Coproductionagreements have repeatedly demonstrated this fact.
Also, few nations can afford the cost or have the capability of maintaining a technologicaledge over their potential adversaries for a protracted period. This, along with other considerations,promotes collective security among friendly nations. It also promotes defense trade between alliesin advanced weapon systems as a cheaper alternative to doing everything domestically. Offsetsare clearly not needed to achieve this security, although in the eyes of the purchaser offsets maymake the import more attractive.
A case can also be made that offsets marginally reduce national security by misallocatingeconomic resources of both trading partners. This effectively lowers each nation’s totalpurchasing power, although these effects are not easily traceable and may be diluted across manyindustrial sectors.
Maintenance of Defense Infrastructure
How important is defense infrastructure, and should every country have one?The abilityto both produce and field advanced weapon systems has undeniable strategic advantages, but it isimpractical for every nation to have this capability. Geopolitical circumstances impose practicallimits on the size and cost of a nation’s potential defense infrastructure. The United States isespecially well endowed in this respect, with abundant natural resources, a skilled workforce,technically advanced manufacturing base, and the world’s largest economy. As a result, Americanallies have benefited from the strength of the large U.S. defense infrastructure.
Offsets were originally used to help arm allies and bolster their war-ravaged economies inthe early years of the Cold War. This work was accomplished long ago. Offsets are no longerneeded for this purpose. It can be argued that today direct offsets may contribute to the recipientnation’s defense infrastructure where they are applied, but diminish that of the donor nation.However, by increasing costs to both nations, it can also be argued, perhaps even morevehemently, that offsets stretch already lean defense budgets and actually reduce defenseinfrastructure in both nations.
When an expensive weapon system is imported as opposed to produced domestically, unlessthe offsets are 100 percent cooproduction, what is the net gain to the defense infrastructure? Thepurchasing nation will remain partly dependent on the United States for whatever was not offset.Additionally, subcontractor production in the offseting nation is not only more expensive, butmay have little real relationship to the core expertise of that nation and force scarce public fundsaway from more worthwhile projects. Moreover, once the specific production is finished, thenwhat? In the longer run the infrastructure is dependent on domestic spending. Will this kind ofbusiness be worth sustaining?
The DISAM Journal, Spring 1999 82
The primary sustainer of a nation’s defense infrastructure is its national defense budget.Military trade, which is financed out of national defense budgets, is currently less than 4 percentof world defense spending. Military trade could be much higher if cooperation between nationswere higher. As it is, trade contributes proportionately little quantitatively to defenseinfrastructure, although strategically it may contribute very significantly. Offsets, which generallyrange between 50 and 60 percent of this trade, may make an additive but much smallercontribution to the infrastructure. Moreover, in consideration that most offsets are not defense-related (indirect offsets), the possible contribution sinks to an even more modest level.
In the last decade, global defense trade actually contracted almost twice as fast as globaldefense spending. When global defense expenditures were at their zenith in 1987 ($1.36 trillionin 1995 dollars), defense trade was estimated at only $84.4 billion, or 6.1 percent. By 1995,global defense expenditures had retrenched 36.4 percent to $864.5 billion; however, globaldefense trade was down 62.2 percent to just $31.9 billion, or 3.7 percent of spending. With suchsmall beginning and ending percentages, defense trade (i.e., imports) is apparently far lessdesirable than domestic defense spending.
Redirecting Public Disbursements to Domestic Economy
Do offsets have net benefits to the offsetting nation?Offsets force spending in the homecountry, which is generally the first preference of national governments. This alone may be theprimary motive to engage in offsets, since the other justifications are of questionable value. Theoffset spending may take the form of investment, training, subcontracting, or any of the otherforms offsets take. Technology transfer often has commercial spin-offs and unforeseen futurepayoffs, or multiplier effects.
Economic benefits to the offsetting nation can include increased employment, improvedskills, educational benefits, investment in productivity enhancing equipment, and new exportingopportunities. Offsets may also strengthen or help preserve the offsetting nation’s defenseindustrial base, if that is the intention. Additionally, if exchange rate concerns are at issue, offsetsmay be structured to placate these concerns.
Political considerations also play a prominent role. Offsets help avoid the stigma of spendingtaxpayers’ money abroad. Also, offsets can be used to prop up financially troubled defense firms,or targeted industries, or even public works projects.
The answer to ”Do offsets have net benefits?” is, sometimes. Are benefitsmaximized for theprice paid for them? It is necessary to know if the benefits of the offsets exceed the benefits theforeign government could have received by spending the money (i.e., cost of the offsets)elsewhere, such as reducing taxes. First, technology transfer, training, and other offsets withmultipliers probably render more benefits than offsets without multipliers. The multiplier typeoffsets would have a net benefit if they were not already available in the offsetting nation. Second,offsets used to prop up domestic subcontractors are equivalent to subsidies. The gains inemployment are negated by losses in efficiency. Also, the apparent gain in employment is actuallya washout because of employment losses from reduced spending elsewhere. There probably is no
The DISAM Journal, Spring 199983
net benefit, and, in fact, there may actually be losses to the economy. Third, countertrade isprobably beneficial to the offsetting nation simple by financing and expediting the brokeringbetween buyers and sellers. This will probably lead to some long-term relationships and perhapsincreased future exports, a benefit. A problem arises, however, when sellers are not competitiveand must either take a loss on the sale or be subsidized.
American Defense Trade Surplus
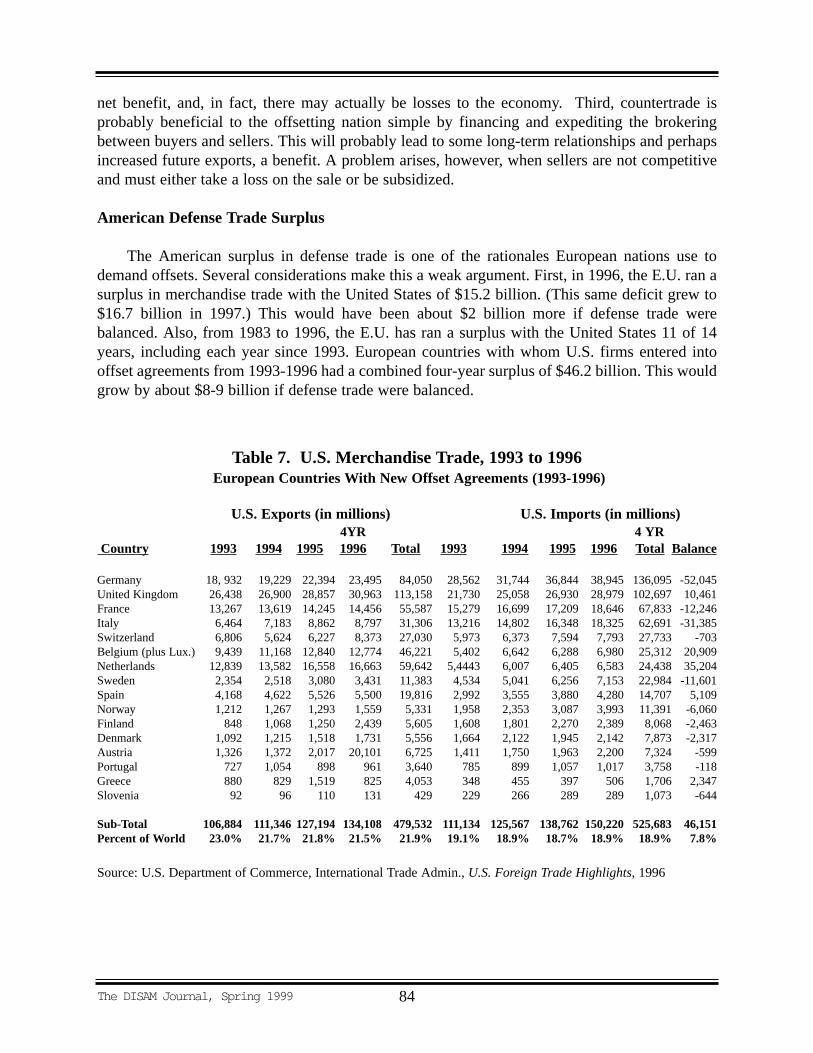
The American surplus in defense trade is one of the rationales European nations use todemand offsets. Several considerations make this a weak argument. First, in 1996, the E.U. ran asurplus in merchandise trade with the United States of $15.2 billion. (This same deficit grew to$16.7 billion in 1997.) This would have been about $2 billion more if defense trade werebalanced. Also, from 1983 to 1996, the E.U. has ran a surplus with the United States 11 of 14years, including each year since 1993. European countries with whom U.S. firms entered intooffset agreements from 1993-1996 had a combined four-year surplus of $46.2 billion. This wouldgrow by about $8-9 billion if defense trade were balanced.
The DISAM Journal, Spring 1999 84
Table 7. U.S. Merchandise Trade, 1993 to 1996European Countries With New Offset Agreements (1993-1996)
U.S. Exports (in millions) U.S. Imports (in millions)4YR 4 YR
Country 1993 1994 1995 1996 Total 1993 1994 1995 1996 Total Balance
Germany 18, 932 19,229 22,394 23,495 84,050 28,562 31,744 36,844 38,945 136,095 -52,045United Kingdom 26,438 26,900 28,857 30,963 113,158 21,730 25,058 26,930 28,979 102,697 10,461France 13,267 13,619 14,245 14,456 55,587 15,279 16,699 17,209 18,646 67,833 -12,246Italy 6,464 7,183 8,862 8,797 31,306 13,216 14,802 16,348 18,325 62,691 -31,385Switzerland 6,806 5,624 6,227 8,373 27,030 5,973 6,373 7,594 7,793 27,733 -703Belgium (plus Lux.) 9,439 11,168 12,840 12,774 46,221 5,402 6,642 6,288 6,980 25,312 20,909Netherlands 12,839 13,582 16,558 16,663 59,642 5,4443 6,007 6,405 6,583 24,438 35,204Sweden 2,354 2,518 3,080 3,431 11,383 4,534 5,041 6,256 7,153 22,984 -11,601Spain 4,168 4,622 5,526 5,500 19,816 2,992 3,555 3,880 4,280 14,707 5,109Norway 1,212 1,267 1,293 1,559 5,331 1,958 2,353 3,087 3,993 11,391 -6,060Finland 848 1,068 1,250 2,439 5,605 1,608 1,801 2,270 2,389 8,068 -2,463Denmark 1,092 1,215 1,518 1,731 5,556 1,664 2,122 1,945 2,142 7,873 -2,317Austria 1,326 1,372 2,017 20,101 6,725 1,411 1,750 1,963 2,200 7,324 -599Portugal 727 1,054 898 961 3,640 785 899 1,057 1,017 3,758 -118Greece 880 829 1,519 825 4,053 348 455 397 506 1,706 2,347Slovenia 92 96 110 131 429 229 266 289 289 1,073 -644
Sub-Total 106,884 111,346 127,194 134,108 479,532 111,134 125,567 138,762 150,220 525,683 46,151Percent of World 23.0% 21.7% 21.8% 21.5% 21.9% 19.1% 18.9% 18.7% 18.9% 18.9% 7.8%
Source: U.S. Department of Commerce, International Trade Admin., U.S. Foreign Trade Highlights, 1996
A review of 16 European countries that entered into offset agreements with U.S. companiesduring the BXA reporting period, shows the United States had a four-year accumulated deficit of$46.2 billion with these countries during the 1993-1996 period. The United States had deficitswith 11 of these countries and surpluses with five. Table 7 presents a list of these countries withmerchandise trade balances.
The largest merchandise trade deficits were with Germany, followed by Italy, France, andSweden. the total four-year deficit with these countries was $107.3 billion. These four nationsaccounted for $638 million (6.3 percent of European total) of the new offset agreements and $646million of the offset transactions (10.6 percent of European total).
The largest merchandise trade surpluses were with the Netherlands, followed by Belgium,the United Kingdom, and Spain. The total four-year surplus with these countries was $71.7billion. These four nations accounted for. $6.9 billion of new offset agreements (69 percent of theEuropean total) and $2.1 billion of the offset transactions (34 percent of European total).
Second, sectoral trade, of which defense trade is one example, is rarely balanced, and to adegree reflects the strengths and specialization differences among nations. To balance sector tradeby government mandate would nullify the gains from trade, and actually reduce potential GrossDomestic Products (GDPs) of both trading partners. Most sectors contain a diverse range ofproducts so that a two-way trade may occur within sectors. Also, government inputs influencetrade; these include R&D, infrastructure, subsidies, tariffs and other forms of protection, and thelegal environment. With that said, in 1996, the United States had surpluses in selected sectorswith the EC in:
Office Equipment, including Computers: $ 9.8 billion ($15 - 5.2 billion)Aircraft and Parts: $5.2 billion ($12.7 - 7.5 billion)Medical Instruments and Supplies: $2.5 billion ($4.9 - 2.4 billion)
And, Europe had surpluses in selected sectors in selected sectors in:
Motor Vehicles: $10.6 billion ($5.4 - 16 billion)Steel Mill Products: $4.2 billion ($0.4 - 4.6 billion)Pharmaceuticals: $3.0 billion ($4.5 - 7.5 billion)
Source: U.S. Department of Commerce, International Trade Admin., U.S. Foreign Trade Highlights, 1996
Third, military trade occurs for various reasons, such as special alliances, contiguousborders, regional instability, or foreign dependence, but a primary reason is the strategic value ofthe weapons traded. Only a few nations produce advanced weapon systems, and these nationstend to have military trade surpluses. Just about all other countries have military trade deficits.Notable surplus nations include the United States, France, the United Kingdom, and Germany.
U.S. military research and development expenditures are three times that of all Europeannations combined. This indicates the United States heads the list of countries likely to be counted
The DISAM Journal, Spring 199985
among surplus nations. Also, of the surplus nations, only the United States is truly capable ofmeeting virtually all defense requirements domestically. So, in addition to heading the surpluscategory, the United States also heads the list of countries least dependent on imports.
As cited previously, when defense budgets fell, defense trade fell even faster. Russiaregistered the greatest defense trade declines, from more than half the world’s total to only a smallfraction today. At the same time, the combined defense exports of the United States and Europealso declined somewhat in value, but grew from less than half the world total to over 80 percentcurrently. Imports into these two regions also declined, lessening the impact on the levels ofdefense trade surpluses.
Almost 80 percent of the U.S. military trade surplus with the world comes from countriesoutside of Europe. Over the years, the U.S. surplus with the rest of the world (excluding Europe)averages about three times the value of Europe’s surplus with the world (excluding the UnitedStates). This indicates the United States has a competitive edge over Europe in third-countrycompetitions.
Fourth, direct and defense-related indirect offsets themselves cancel out much of the U.S.defense surplus with Europe, particularly with countries such as the United Kingdom and theNetherlands, which demand 100 percent offsets on big ticket items. For example, from 1993-1995, the defense trade surplus with Europe was $7.1 billion. (Three years are used instead of fourbecause the final trade figures for 1996 are not available.) New offset agreements during the sameperiod totaled $8.3 billion, and offset transactions were $4.3 billion. About one-third of the offsettransactions were direct; however, about two-thirds were aerospace products, a large percentageof which were probably defense-related.
Table 8 presents European and U.S. military trade from 1987 to 1996. The United States andWestern European nations export roughly the same amount of military items and have overalltrade surpluses’ with the rest of the world. About 30 percent of Europe’s exports (and imports)are intra-European. However, this would not change Europe’s external defense surplus since bothexports and imports would be debited the same amount. The United States had a surplus withEurope each year, although the trend in both the magnitude of the trade and the surplus isdownward. U.S. imports from the world are not shown on the table, but estimates were made bythe U.S. Arms Control and Disarmament Agency to be roughly twice the value shown as theUnited States imported from Europe.
The Netherlands and the United Kingdom purchased major U.S. weapons systems over thelast five years even when European options were available. France has purchased major U.S.defense weapons systems only when no French or European option was available. The Frenchdefense procurement policy has been to buy equipment from French sources first, then to pursueEuropean cooperative solutions, and lastly to import a non-European item. This reflects a desireto retain a defense industrial base and maintain autonomy in national security matters.
The DISAM Journal, Spring 1999 86
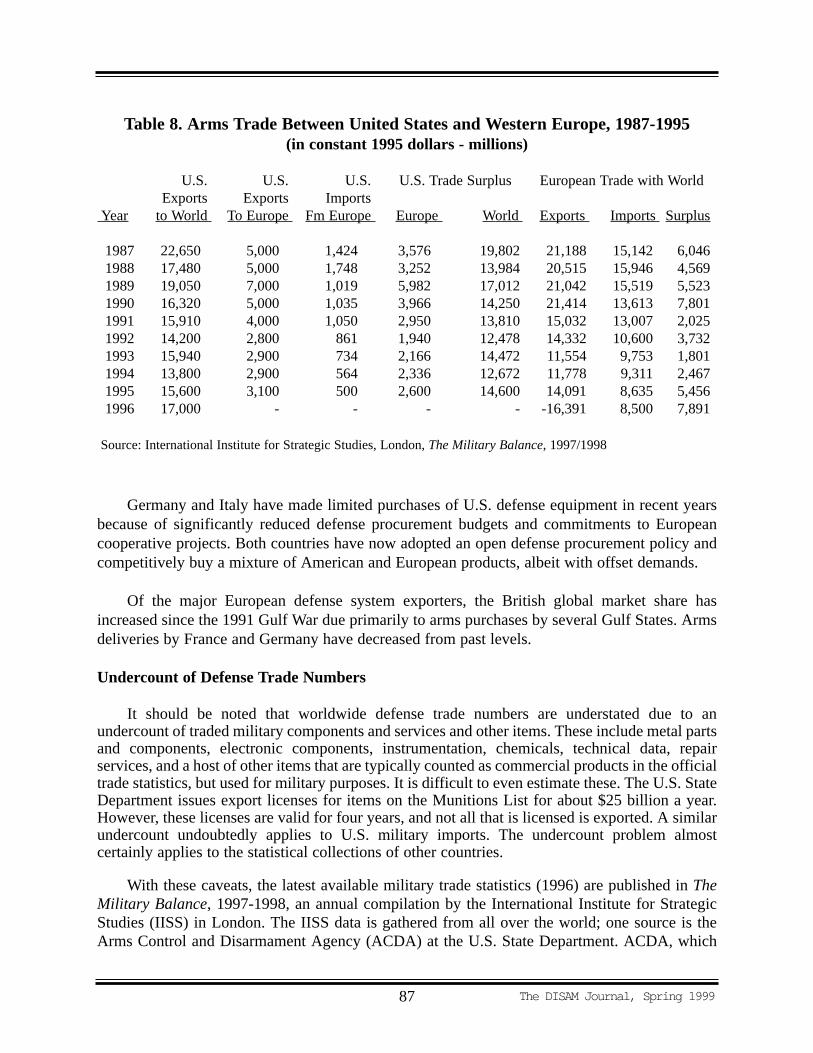
Germany and Italy have made limited purchases of U.S. defense equipment in recent yearsbecause of significantly reduced defense procurement budgets and commitments to Europeancooperative projects. Both countries have now adopted an open defense procurement policy andcompetitively buy a mixture of American and European products, albeit with offset demands.
Of the major European defense system exporters, the British global market share hasincreased since the 1991 Gulf War due primarily to arms purchases by several Gulf States. Armsdeliveries by France and Germany have decreased from past levels.
Undercount of Defense Trade Numbers
It should be noted that worldwide defense trade numbers are understated due to anundercount of traded military components and services and other items. These include metal partsand components, electronic components, instrumentation, chemicals, technical data, repairservices, and a host of other items that are typically counted as commercial products in the officialtrade statistics, but used for military purposes. It is difficult to even estimate these. The U.S. StateDepartment issues export licenses for items on the Munitions List for about $25 billion a year.However, these licenses are valid for four years, and not all that is licensed is exported. A similarundercount undoubtedly applies to U.S. military imports. The undercount problem almostcertainly applies to the statistical collections of other countries.
With these caveats, the latest available military trade statistics (1996) are published in TheMilitary Balance, 1997-1998, an annual compilation by the International Institute for StrategicStudies (IISS) in London. The IISS data is gathered from all over the world; one source is theArms Control and Disarmament Agency (ACDA) at the U.S. State Department. ACDA, which
The DISAM Journal, Spring 199987
Table 8. Arms Trade Between United States and Western Europe, 1987-1995(in constant 1995 dollars - millions)
U.S. U.S. U.S. U.S. Trade Surplus European Trade with WorldExports Exports Imports
Year to World To Europe Fm Europe Europe World Exports Imports Surplus
1987 22,650 5,000 1,424 3,576 19,802 21,188 15,142 6,0461988 17,480 5,000 1,748 3,252 13,984 20,515 15,946 4,5691989 19,050 7,000 1,019 5,982 17,012 21,042 15,519 5,5231990 16,320 5,000 1,035 3,966 14,250 21,414 13,613 7,8011991 15,910 4,000 1,050 2,950 13,810 15,032 13,007 2,0251992 14,200 2,800 861 1,940 12,478 14,332 10,600 3,7321993 15,940 2,900 734 2,166 14,472 11,554 9,753 1,8011994 13,800 2,900 564 2,336 12,672 11,778 9,311 2,4671995 15,600 3,100 500 2,600 14,600 14,091 8,635 5,4561996 17,000 - - - - -16,391 8,500 7,891
Source: International Institute for Strategic Studies, London, The Military Balance, 1997/1998

publishes world defense trade numbers also, is making an effort to improve accountability of theMunitions List licenses, which the Agency reports could increase the U.S. military exportnumbers significantly. At the time of this writing, however, a reliable method for tabulating orestimating these numbers had not been adopted. The U.S. export numbers reported in TheMilitary Balanceare primarily Foreign Military Sales deliveries reported by the U.S. DefenseSecurity Assistance [Cooperation] Agency. This is a separate publication, which is also providedto ACDA
Defense Trade Exemption from International Controls
Under the World Trade Organization (WTO), defense trade, including offsets, is one of thelast bastions of legitimate government market intervention. The practice of offsets in defensetrade is currently exempt under Article XXIII of the WTO from rules governing commercialtrade.
However, it is recognized that offsets result in trade distortions and inefficiencies under theeconomic principles on which WTO policies are based. Under Article XVI the WTO prohibits thepractice of offsets in government procurement of commercial items. Thus, if governments chooseto exercise the military exemption, in principle they are also willing to live with any tradedistortions and added costs associated with that option.
Contrasts in the U.S. and European Defense Industrial Bases
European defense expenditures are about two-thirds those of the United States. However,Europe has two to three times more suppliers. For example, the United States has three majorsuppliers in the military aircraft sector, while six European nations each have at least one majorsupplier.
In terms of defense revenue, U.S. companies tend to outpace their Europeancounterparts. In 1997, the United States had seven of the world’s top 10 defense firms (up fromsix in 1996), while Europe had the remaining three. The top 10 are shown in Table 9 with defenseand total revenues. The seven U.S. firms represent about three-fourths of both the defense andtotal revenues of the 10 firms shown.
Defense Budgets
European countries’ defense budgets in 1996 totaled $173 billion; this was about 65 percentof the U.S. total of $266 billion. France led European nations in defense spending at $47 billion.Germany was second at $39.2 billion and the United Kingdom third at $33.5 billion and Italywas fourth at $23.8 billion. These four countries represented about 71 percent of the Europeantotal in 1996.
Total 1996 procurement expenditures in Europe were $39.6 billion and research anddevelopment spending was $12.3 billion. This compares with U.S. procurement of $42.4 billionand $35 billion in R&D spending. The European total of $52 billion was about 30 percent of total
The DISAM Journal, Spring 1999 88
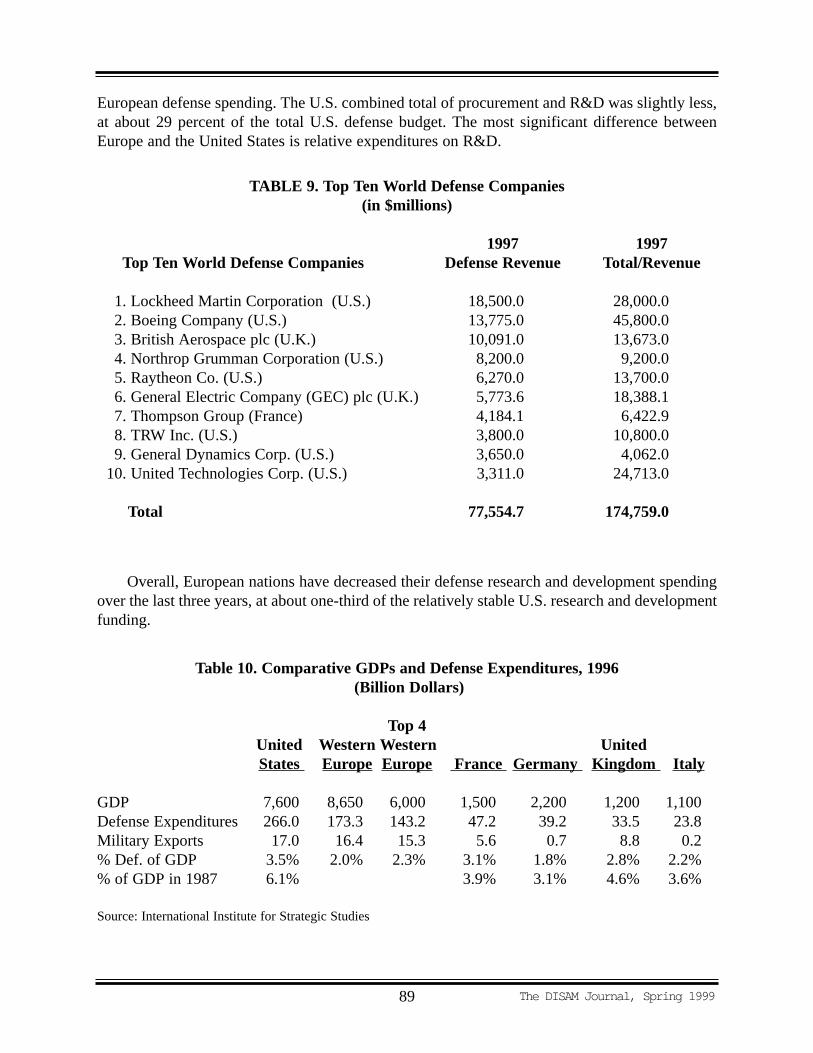
European defense spending. The U.S. combined total of procurement and R&D was slightly less,at about 29 percent of the total U.S. defense budget. The most significant difference betweenEurope and the United States is relative expenditures on R&D.
Overall, European nations have decreased their defense research and development spendingover the last three years, at about one-third of the relatively stable U.S. research and developmentfunding.
The DISAM Journal, Spring 199989
TABLE 9. Top Ten World Defense Companies(in $millions)
1997 1997Top Ten World Defense Companies Defense Revenue Total/Revenue
1. Lockheed Martin Corporation (U.S.) 18,500.0 28,000.02. Boeing Company (U.S.) 13,775.0 45,800.03. British Aerospace plc (U.K.) 10,091.0 13,673.04. Northrop Grumman Corporation (U.S.) 8,200.0 9,200.05. Raytheon Co. (U.S.) 6,270.0 13,700.06. General Electric Company (GEC) plc (U.K.) 5,773.6 18,388.17. Thompson Group (France) 4,184.1 6,422.98. TRW Inc. (U.S.) 3,800.0 10,800.09. General Dynamics Corp. (U.S.) 3,650.0 4,062.0
10. United Technologies Corp. (U.S.) 3,311.0 24,713.0
Total 77,554.7 174,759.0
Table 10. Comparative GDPs and Defense Expenditures, 1996(Billion Dollars)
Top 4United Western Western UnitedStates Europe Europe France Germany Kingdom Italy
GDP 7,600 8,650 6,000 1,500 2,200 1,200 1,100Defense Expenditures 266.0 173.3 143.2 47.2 39.2 33.5 23.8Military Exports 17.0 16.4 15.3 5.6 0.7 8.8 0.2% Def. of GDP 3.5% 2.0% 2.3% 3.1% 1.8% 2.8% 2.2%% of GDP in 1987 6.1% 3.9% 3.1% 4.6% 3.6%
Source: International Institute for Strategic Studies
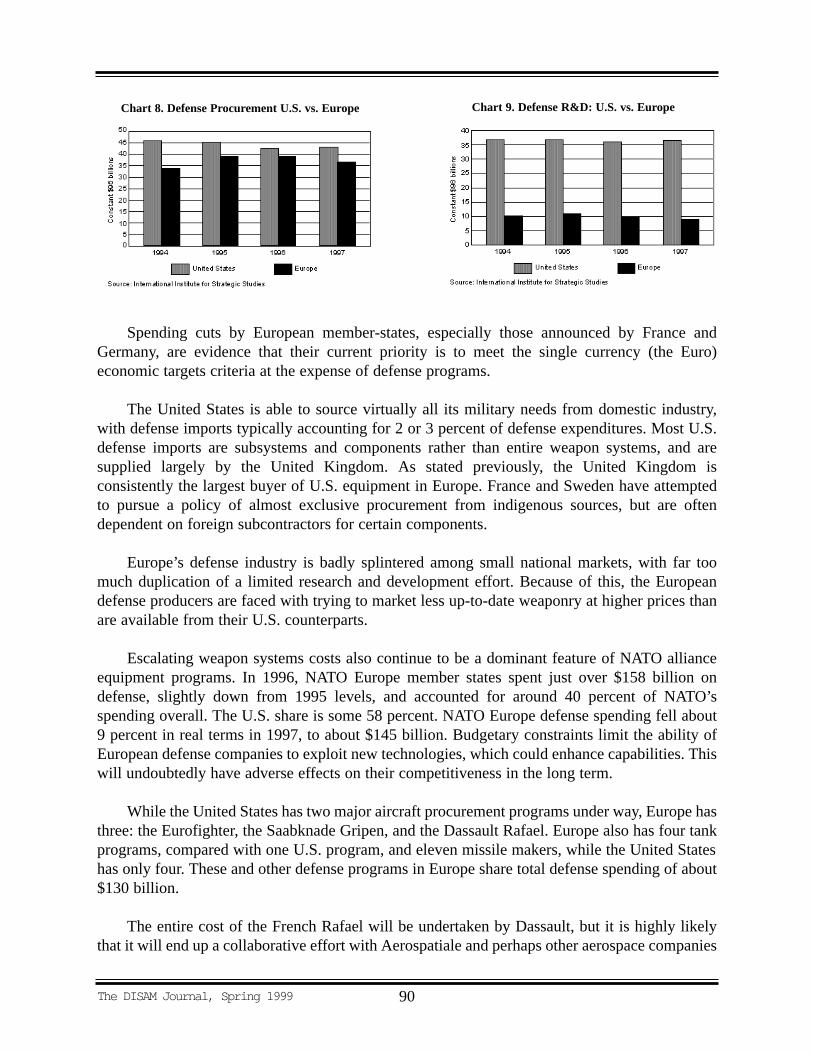
90
Spending cuts by European member-states, especially those announced by France andGermany, are evidence that their current priority is to meet the single currency (the Euro)economic targets criteria at the expense of defense programs.
The United States is able to source virtually all its military needs from domestic industry,with defense imports typically accounting for 2 or 3 percent of defense expenditures. Most U.S.defense imports are subsystems and components rather than entire weapon systems, and aresupplied largely by the United Kingdom. As stated previously, the United Kingdom isconsistently the largest buyer of U.S. equipment in Europe. France and Sweden have attemptedto pursue a policy of almost exclusive procurement from indigenous sources, but are oftendependent on foreign subcontractors for certain components.
Europe’s defense industry is badly splintered among small national markets, with far toomuch duplication of a limited research and development effort. Because of this, the Europeandefense producers are faced with trying to market less up-to-date weaponry at higher prices thanare available from their U.S. counterparts.
Escalating weapon systems costs also continue to be a dominant feature of NATO allianceequipment programs. In 1996, NATO Europe member states spent just over $158 billion ondefense, slightly down from 1995 levels, and accounted for around 40 percent of NATO’sspending overall. The U.S. share is some 58 percent. NATO Europe defense spending fell about9 percent in real terms in 1997, to about $145 billion. Budgetary constraints limit the ability ofEuropean defense companies to exploit new technologies, which could enhance capabilities. Thiswill undoubtedly have adverse effects on their competitiveness in the long term.
While the United States has two major aircraft procurement programs under way, Europe hasthree: the Eurofighter, the Saabknade Gripen, and the Dassault Rafael. Europe also has four tankprograms, compared with one U.S. program, and eleven missile makers, while the United Stateshas only four. These and other defense programs in Europe share total defense spending of about$130 billion.
The entire cost of the French Rafael will be undertaken by Dassault, but it is highly likelythat it will end up a collaborative effort with Aerospatiale and perhaps other aerospace companies
The DISAM Journal, Spring 1999
Chart 8. Defense Procurement U.S. vs. Europe Chart 9. Defense R&D: U.S. vs. Europe

outside of France. The JAS 39 Gripen, undertaken by Saab of Sweden, is actually a joint venturewith British Aerospace (BA). BA manufactures the wing assemblies and other items. Gripenfighters manufactured for export will be produced with a 50/50 share of revenue and profit withBA. The Gripen uses a derivative of a General Electric designed engine, the F404.
Defense Industry Employment
Defense employment in the United States and Western Europe has dropped significantlyalong with the declines in national defense budgets. During the nine year period from 1987 to1995, the U.S. workforce fell 47 percent, from 4.4 to 2.35 million, displacing more than 2 millionworkers. Europe also experienced a workforce decline, although to a lesser degree. In the sametime span, the European workforce fell from 2 to 1.2 million, a drop of 40 percent. The percentageof labor reductions for the top three European nations was uneven. The United Kingdom’sdefense industrial workforce fell 44 percent, while Germany’s workforce fell by 30 percent, andFrance experienced a 29 percent decline.
A paper titled The Effects of Offsets, Outsourcing and Foreign Competition on Output andEmployment in the U.S. Aerospace Industry,was submitted by Robert E. Scott of the EconomicPolicy Institute to the National Research Council’s Symposium onTrends and Challenges inAerospace Offsetsin January, 1998. The paper presented employment trends and analysis in theNorth American, European and Japanese aerospace industries. Dr. Scott showed that the UnitedStates experienced a much larger percentage and numerical drop in aerospace employmentbetween 1989 and 1995 than did the rest of world. The data combined military and civilianaerospace jobs. U.S. employment fell from 992,000 to 580,000, while that of the E.U. fell from485,740 to 348,061. In percentage terms the U.S. drop was 41.5 percent, compared with 28.3
The DISAM Journal, Spring 199991
Chart 10. Trends in Defense Industrial EmploymentU.S. and Europe, 1987-1995
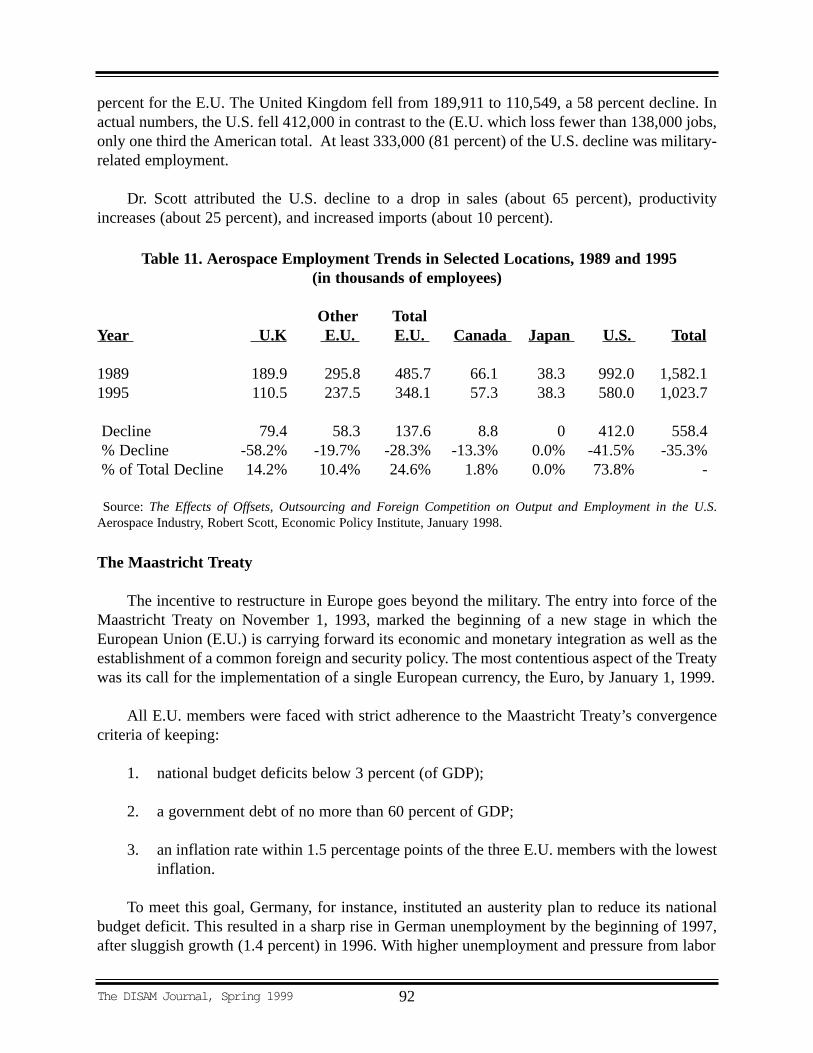
percent for the E.U. The United Kingdom fell from 189,911 to 110,549, a 58 percent decline. Inactual numbers, the U.S. fell 412,000 in contrast to the (E.U. which loss fewer than 138,000 jobs,only one third the American total. At least 333,000 (81 percent) of the U.S. decline was military-related employment.
Dr. Scott attributed the U.S. decline to a drop in sales (about 65 percent), productivityincreases (about 25 percent), and increased imports (about 10 percent).
The Maastricht Treaty
The incentive to restructure in Europe goes beyond the military. The entry into force of theMaastricht Treaty on November 1, 1993, marked the beginning of a new stage in which theEuropean Union (E.U.) is carrying forward its economic and monetary integration as well as theestablishment of a common foreign and security policy. The most contentious aspect of the Treatywas its call for the implementation of a single European currency, the Euro, by January 1, 1999.
All E.U. members were faced with strict adherence to the Maastricht Treaty’s convergencecriteria of keeping:
1. national budget deficits below 3 percent (of GDP);
2. a government debt of no more than 60 percent of GDP;
3. an inflation rate within 1.5 percentage points of the three E.U. members with the lowestinflation.
To meet this goal, Germany, for instance, instituted an austerity plan to reduce its nationalbudget deficit. This resulted in a sharp rise in German unemployment by the beginning of 1997,after sluggish growth (1.4 percent) in 1996. With higher unemployment and pressure from labor
The DISAM Journal, Spring 1999 92
Table 11. Aerospace Employment Trends in Selected Locations, 1989 and 1995(in thousands of employees)
Other TotalYear U.K E.U. E.U. Canada Japan U.S. Total
1989 189.9 295.8 485.7 66.1 38.3 992.0 1,582.11995 110.5 237.5 348.1 57.3 38.3 580.0 1,023.7
Decline 79.4 58.3 137.6 8.8 0 412.0 558.4% Decline -58.2% -19.7% -28.3% -13.3% 0.0% -41.5% -35.3%% of Total Decline 14.2% 10.4% 24.6% 1.8% 0.0% 73.8% -
Source:The Effects of Offsets, Outsourcing and Foreign Competition on Output and Employment in the U.S.Aerospace Industry, Robert Scott, Economic Policy Institute, January 1998.
unions, public spending in Germany increased, placing the 3 percent goal in jeopardy. However,growth increased to 2.2 percent for the year in 1997 and the goal was reached.
The Europeans hope to phase in monetary union over a three-year period beginning in 1999With average E.U. economic growth for 1996 at only 1.7 percent, reducing unemployment provedextremely difficult. While structural problems lay at the heart of the high unemployment, effortsto achieve the Maastricht criteria prevented public spending from stimulating demand.
The problem of meeting the Treaty terms was eased somewhat in 1997, when E.U. widegrowth increased to 2.6 percent. In early May 1998, 11 E.U. members, meeting the criteria, signedon to the European Monetary Union. Only Greece failed to meet the requirement, but may applyagain at a later date. Three other nations, Denmark, Sweden, and Britain, opted out of themonetary union for the time being.
The terms of the Maastricht Treaty have also caused govermnents to redirect resources outof the defense sector. This adds pressure on these governments to depend more on policies suchas offsets in international military trade. The problems may also jeopardize ongoing cooperativemilitary programs and/or discourage new ones. For example, the number of Eurofighters on orderhas fallen, and this circumstance could eventually cause the program to fail.
TRADE POLICIES AND OFFSETS
U.S. Foreign Military Financing Program
Current U.S. policy permits foreign governinents to demand offsets on U.S. military exportsales financed, or partly financed through the Foreign Military Financing Program (FMFP),which is primarily a loan program. The FMFP features lenient repayment terms to begin with, andCongress usually waives the loan, so it becomes a direct grant. During the four-year periodFY1993 to FY1996, $15.6 billion was funneled through this program. The U.S. program is uniquein that no other arms supplier provides a combination of grant aid and offsets. The policy shouldbe changed to limit or eliminate offsets as a condition of receiving FMFP funding.
The primary recipients of this aid have been Turkey, Greece, Egypt, and Israel. Since 1987,Israel and Egypt have received FMFP direct grants (repayment waived) valued at $1.8 and $1.3billion each year. Additionally, since 1991, Israel was authorized to spend $475 million of the$1.8, billion for procurement within Israel. Prior to 1993, Turkey and Greece received both FMFPgrants and loans. From FY1993 to FY1996 Turkey received about $1.5 billion in direct loansfrom DoD on liberal terms. Greece received over $1 billion in direct DoD loans.
All four nations have obtained offsets for FMFP sales of U.S. weapons. A 1994 GeneralAccounting Office study reported these countries demanded $4.7 billion in offsets in precedingyears. The study found that these FMFP recipients developed their own industrial bases and otheraspects of their economies through these offset requirements at U.S. taxpayer expense. Strongerprohibitions on offsets in these sales might reduce these subsidies to foreign governments inassociation with military exports.
The DISAM Journal, Spring 199993
Agreement on Government Procurement
The Agreement on Government Procurement opens markets and strengthens competitivebidding practices to governments. The underlying principle is that signatory governments musttreat products and services no less favorably than they treat their own domestic products, services,and suppliers. Criteria for making a contract award are the lowest price or the economically mostadvantageous tender based on various factors, such as quality, technical merit, delivery costs, andprice.
Article XVI of the World Trade Organization (WTO) Agreement on GovermnentProcurement prohibits offsets in reference to non-military items. Government entities covered bythe Agreement “shall not, in the qualification and selection of suppliers, products or services, orin the evaluation of tenders and award of contracts, impose, seek or consider offsets.” Countriesmay exempt certain types of procurement from coverage by the Agreement at the time theybecome signatories.
Article XVI
1. Entities shall not, in the qualification and selection of suppliers, products orservices, or in the evaluation of tenders and award of contracts, impose, seek orconsider offsets.
2. Nevertheless, having regard to general policy considerations, including thoserelating to development, a developing country may at the time of accessionnegotiate conditions for the use of offsets, such as requirements for theincorporation of domestic content. Such requirements shall be used only forqualification to participate in the procurement process and not as criteria forawarding contracts. Conditions shall be objective, clearly defined and non-discriminatory. They shall be set forth in the country’s Appendix I and may includeprecise limitations on the imposition of offsets in any contract subject to thisAgreement. The existence of such conditions shall be notified to the Committeeand included in the notice of intended procurement and other documentation.
Developing countries may negotiate, at the time of their accession, conditions for the use ofoffsets provided these are used only for the qualification to participate in the procurement processand not as criteria for awarding contracts. Signatories agreed that the granting of an offset or therequirement that technology be licensed as a condition for the award of a contract, although notforbidden outright, would be used only in a limited and nondiscriminatory manner.
Major defense agencies are entities generally covered under the Agreement. Governmentpurchases related to the protection of national security interests, however, are excluded underArticle XXIII. Therefore, the prohibitions against the use of offsets would not apply under such contracts. This clearly allows foreign governments to take exception to the agreement to protectnational security interests:
The DISAM Journal, Spring 1999 94
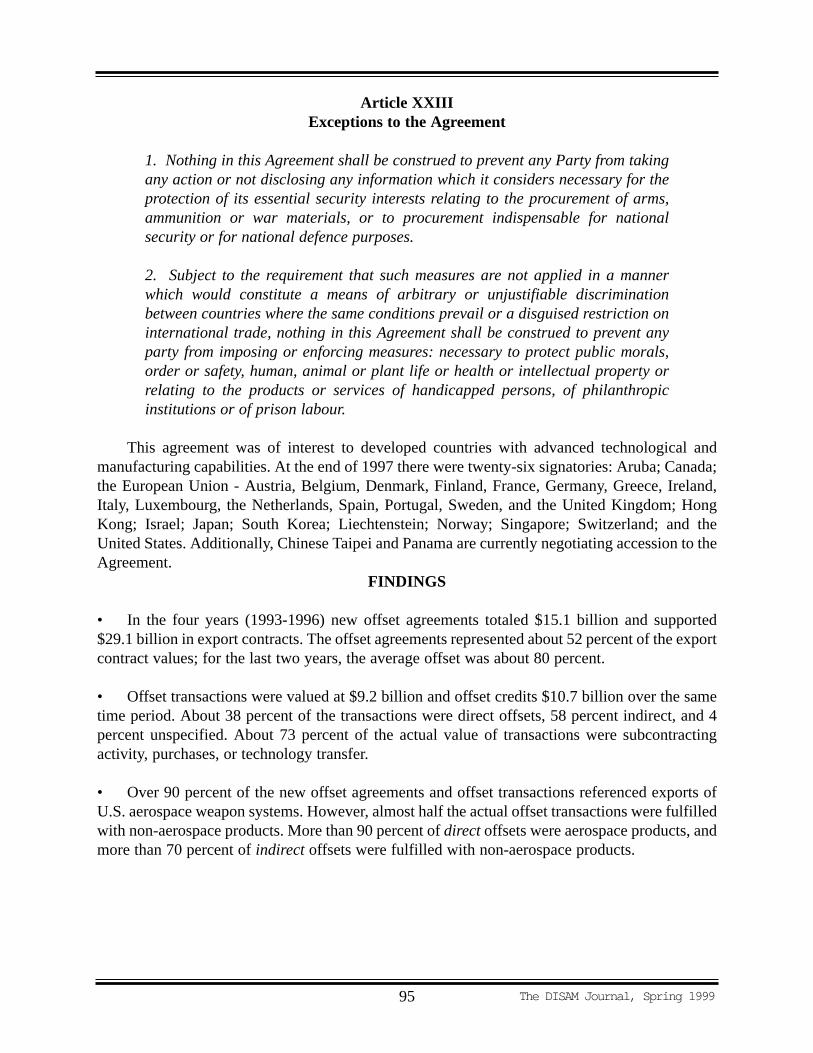
Article XXIII Exceptions to the Agreement
1. Nothing in this Agreement shall be construed to prevent any Party from takingany action or not disclosing any information which it considers necessary for theprotection of its essential security interests relating to the procurement of arms,ammunition or war materials, or to procurement indispensable for nationalsecurity or for national defence purposes.
2. Subject to the requirement that such measures are not applied in a mannerwhich would constitute a means of arbitrary or unjustifiable discriminationbetween countries where the same conditions prevail or a disguised restriction oninternational trade, nothing in this Agreement shall be construed to prevent anyparty from imposing or enforcing measures: necessary to protect public morals,order or safety, human, animal or plant life or health or intellectual property orrelating to the products or services of handicapped persons, of philanthropicinstitutions or of prison labour.
This agreement was of interest to developed countries with advanced technological andmanufacturing capabilities. At the end of 1997 there were twenty-six signatories: Aruba; Canada;the European Union - Austria, Belgium, Denmark, Finland, France, Germany, Greece, Ireland,Italy, Luxembourg, the Netherlands, Spain, Portugal, Sweden, and the United Kingdom; HongKong; Israel; Japan; South Korea; Liechtenstein; Norway; Singapore; Switzerland; and theUnited States. Additionally, Chinese Taipei and Panama are currently negotiating accession to theAgreement.
FINDINGS
• In the four years (1993-1996) new offset agreements totaled $15.1 billion and supported$29.1 billion in export contracts. The offset agreements represented about 52 percent of the exportcontract values; for the last two years, the average offset was about 80 percent.
• Offset transactions were valued at $9.2 billion and offset credits $10.7 billion over the sametime period. About 38 percent of the transactions were direct offsets, 58 percent indirect, and 4percent unspecified. About 73 percent of the actual value of transactions were subcontractingactivity, purchases, or technology transfer.
• Over 90 percent of the new offset agreements and offset transactions referenced exports ofU.S. aerospace weapon systems. However, almost half the actual offset transactions were fulfilledwith non-aerospace products. More than 90 percent of directoffsets were aerospace products, andmore than 70 percent of indirect offsets were fulfilled with non-aerospace products.
The DISAM Journal, Spring 199995

• Nearly 83 percent of the offset transactions were manufactured products. Three-fourths ofthe offset transactions fell into three major industry groupings:
1. SIC 37 - Transportation Equipment (48 percent); sub-group SIC 372 - Aircraft and Partsalone accounted for 33 percent;
2. SIC 36 - Electronic and Electrical Equipment (16 percent); and
3. SIC 35 - Industrial Machinery (9 percent).
• Thirty-two U.S. defense prime contractors reported entering into new offset agreementsduring 1993-1996 period. Five of these companies accounted for over 78 percent of the value ofnew offset agreements and nearly 82 percent of export contract values. Five countries - theUnited Kingdom, the Netherlands, Switzerland, Saudi Arabia, and Taiwan - accounted for 72percent of the value new offset agreements.
• From 1993 to 1996, an estimated 30-40 percent of the total value of military export contractswere negotiated with offset agreements. Most military export contracts are below countrythresholds for applying offsets, which average about $7.6 million, as well as BXA’s minimumdata reporting requirement. However, virtually all large aerospace export contracts includedoffsets.
• The motivation behind offset demands is primarily the desire to redirect public funds backinto the foreign purchaser’s economy. National security considerations play a diminished role inthe offset decision making process in the post-Cold War period.
• Offsets have the effect of increasing the cost of the exported weapon system, whichultimately must be passed on to the foreign purchaser. These increased costs are incurred whenshifting parts production to newly established overseas suppliers, and/or fees for transferringtechnology, or various other administrative expenses. Co-production is the most costly form ofoffset, as it typically involves the replication of an entire production or assembly facility toproduce a limited number of military items.
• The U.S. primes have become more competitive because of consolidation and downsizing.As stronger competitors, U.S. firms have increased their share of a smaller international defensemarket.
• As a measure to reduce the inefficiencies inherent in offsets, the development of expensiveweapon systems could be effectively accomplished through international partnering with allies.This would spread costs and benefits and reduce duplication. It would also provide addedincentives to market the weapon systems more widely. The Joint Strike Fighter program, withBritish, Dutch and Canadian participation, is an excellent example of this type of cooperation.
• The existing World Trade Organization agreements provide an exemption for nationalgovernments to demand offsets in military related trade. However, the 1992 U.S.-EU Agreement
The DISAM Journal, Spring 1999 96

on Trade in Large Civil Aircraft prohibits offsets in the trade of large civil aircraft. This could behelpful if any consideration is given to a future WTO agreement on military offsets.
• Europe’s ability produce state-of-the-art weaponry at a reasonable cost is ultimatelycontingent upon transnational cooperation and greater integration of the European defenseindustry. Meeting the economic targets of the Maastricht Treaty has caused Europeangovernments to redirect resources out of the defense sector. This adds pressure on thesegovernments to depend more on policies such as offsets to stimulate domestic economies. Thecontinued use of offsets is inhibiting European cooperation and integration.
• The United States spends three times more on military R&D than European nations,contributing to the U.S. lead in sophisticated weapon systems and competitiveness.
• From 1987 to 1995, the U.S. defense workforce fell 47 percent from 4.4 to 2.4 millionworkers, while the European workforce fell 40 percent from 2 to 1.2 million. This indicates thatthe U.S. has adapted more quickly to the declining world defense market. Overcapacity in theEuropean defense industry continues to plague the Europeans and pressures them to continue thepractice of demanding offsets.
• The U.S. has a positive but declining of defense trade balance with Europe, which has beencited by the European governments as a rationale for high levels of offsets. However, the U.S. hasa negative balance in merchandise trade with Europe, which includes both commercial andmilitary trade. The defense surplus has ranged from $2-3 billion since 1993, while themerchandise deficit was $15.2 billion in 1996 alone. (This same deficit grew to $16.7 billion in1997.) When offsets are included in the calculation, the U.S. defense trade surplus is effectivelycut in half.
The DISAM Journal, Spring 199997