offices at pacific station - net leased real properties
TRANSCRIPT

OFFICES AT PACIFIC STATIONENCINTAS, CALIFORNIA
FILE PHOTO
For More Information Contact:Paul Bonanno(760) 452-2402
OFFICES AT PACIFIC STATION ENCINITAS, CALIFORNIA
This information has been secured from sources we believe to be reliable, but we make no representations or warranties, expressed or implied, as to the accuracy of the information. References to square footage or age are approximate. Buyer must verify the information and bears all risk for any inaccuracies.
________________________________________________________________________________________________
TABLE OF CONTENTS Investment Overview….…………………………………………………………………………………….. Page 2 Financial Overview…………………………………………………………………………………………... Page 3 Rent Roll……………………………………………………………………………………………………… Page 4 Proforma Cash Flow Projections .………………………………………………………………………….. Pages 5 Tenant Overview……………………………………………………………………………………………... Page 6-7 Project History………………………………………………………………………………………………. Page 8 Area Overview……………………………………………………………………………………………….. Page 9 Maps………………………………………………………………………………………………………….. Page 10 Aerial…………………………………………………………………………………………………………. Page 11 Shopping Center Site Plans………………………………………………………………………………..... Pages 12-14 Office Floor Plans……………………………………………………………………………………………. Pages 15-16 Property Photographs……………………………………………………………………………………….. Pages 17-21 Demographics……………………………………………………………………………………………….... Pages 22-26

OFFICES AT PACIFIC STATION ENCINITAS, CALIFORNIA
This information has been secured from sources we believe to be reliable, but we make no representations or warranties, expressed or implied, as to the accuracy of the information. References to square footage or age are approximate. Buyer must verify the information and bears all risk for any inaccuracies.
________________________________________________________________________________________________
INVESTMENT OVERVIEW
Investment Highlights
Located within Encinitas' premier lifestyle destination, Pacific Station, anchored by Whole Foods and shops.
LEED Silver Certified Development
Prime location adjacent to Encinitas Coaster Station and blocks from I-5 Freeway providing easy access for commuters
83% of space occupied by one tenant, Tactel, U.S.
Leases have Annual increases
Located in the heart of Downtown Encinitas, a high income beach community in north San Diego County
Great exposure with heavy vehicle & pedestrian traffic on Coast Highway 101. Visible signage from commuter railway.
Underground Parking
Net Leased Real Properties is pleased to present for sale the Offices at Pacific Station. The subject property is a Class A, LEED Silver Certified office property located within Pacific Station, the newest mixed use development in Encinitas. Pacific Station is anchored by a new Whole Foods and boasts a roster of strong complimentary retail uses including Bliss 101, Solace Restaurant, and several boutique shops and salons catering to the lifestyle center's upscale clientele. Pacific Station also contains 47 residential units ranging in size from 600-2,400 square feet. Pacific Station's location on Coast Highway 101 in the heart of downtown Encinitas provides unmatched visibility and access. With very little comparable Class A office space in coastal North County and many barriers to entry including coastal commission and high cost of construction make this fully leased asset an attractive investment for the future.
Pacific Station creates a synergistic environment, combining the best of beach living, working and shopping. Residents and workers alike have easy access to I-5 Freeway, Moonlight Beach, Cottonwood Park, the Coaster train station, City Hall, the new public library and the many local shops and restaurants in the Downtown area.

OFFICES AT PACIFIC STATIONENCINITAS, CALIFORNIA
This information has been secured from sources we believe to be reliable, but we make no representations or warranties, expressed or implied, as to the accuracyof the information. References to square footage or age are approximate. Buyer must verify the information and bears all risk for any inaccuracies.
________________________________________________________________________________________________
FINANCIAL OVERVIEW
Location Operating Data687 South Coast Highway 101Encinitas, CA 92024
Price $5,075,000Cap Rate 6.22%Building Size 9,733 sfPrice/SF $539.40Year Built 2011
EXPENSES (2013 Estimate)Taxes $52,430Insurance $ 2,040Association Dues $46,128Management $ 6,931TOTAL $107,529
ESTIMATED 2013 OPERATING INCOME SUMMARYScheduled Rent $317,460 (with seller credit for vacancy)
Plus Expense Reimbursements $105,873Scheduled Gross Income $423,333Less Estimated Operating Expenses $107,529Net Operating Income $315,804

OFFICES AT PACIFIC STATION ENCINITAS, CALIFORNIA
This information has been secured from sources we believe to be reliable, but we make no representations or warranties, expressed or implied, as to the accuracy of the information. References to square footage or age are approximate. Buyer must verify the information and bears all risk for any inaccuracies.
________________________________________________________________________________________________
RENT ROLL
Rent/ Rent Increase Tenant Sq Ft Rent SqFt Lease Term Date New Rent Deposit Options Alli Sports (Ste 239) 1,633 $4,327.45 $2.65 10/24/12-10/23/14 10/24/13 $4,458.09 $8,654.90 One x 2 year @ 95% FMV
(Not to decrease) Tactel U.S. (Ste 240) 1,641 $4,348.65* $2.65 1/1/14-12/7/14/17 1/1/15 $4,479.11 $4,348.65 One x 3 year @ 95% FMV 1/1/16 $4,613.48 1/1/17 $4,751.89 Tactel U.S. (Ste 241) 1,530 $4,054.50 $2.65 4/1/13-7/14/17 4/1/14 $4,176.14 $4,054.50 One x 3 year @ 95% FMV 4/1/15 $4,301.42 4/1/16 $4,430.46 4/1/17 $4,563.38 Tactel U.S. (Ste 300) 4,929 $13,554.75 $2.75 7/15/12-7/14/17 7/15/14 $13,949.07 $13,554.75 One x 3 year @ 95% FMV 7/15/15 $14,392.68 7/15/16 $14,836.29 7/15/17 $15,279.90 *Seller to guaranty rent and CAM for the vacancy from close of escrow through rent commencement on 4/1/14 (Tenant has 3 months free rent commencing January 1, 2014) ** Tactel U.S. is doing business as ROOM 5
OFFICES AT PACIFIC STATIONENCINITAS, CALIFORNIA
This information has been secured from sources we believe to be reliable, but we make no representations or warranties, expressed or implied, as to the accuracyof the information. References to square footage or age are approximate. Buyer must verify the information and bears all risk for any inaccuracies.
________________________________________________________________________________________________
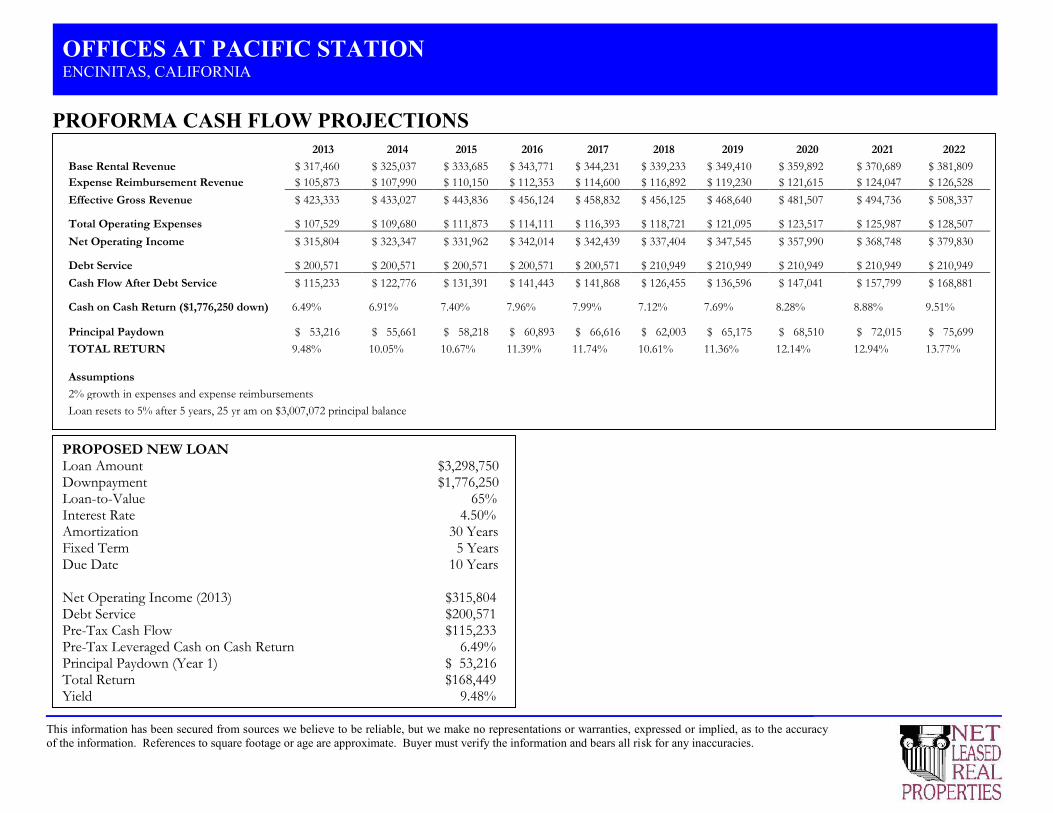
PROFORMA CASH FLOW PROJECTIONS
PROPOSED NEW LOANLoan Amount $3,298,750Downpayment $1,776,250Loan-to-Value 65%Interest Rate 4.50%Amortization 30 YearsFixed Term 5 YearsDue Date 10 Years
Net Operating Income (2013) $315,804Debt Service $200,571Pre-Tax Cash Flow $115,233Pre-Tax Leveraged Cash on Cash Return 6.49%Principal Paydown (Year 1) $ 53,216Total Return $168,449Yield 9.48%
2013 2014 2015 2016 2017 2018 2019 2020 2021 2022Base Rental Revenue $ 317,460 $ 325,037 $ 333,685 $ 343,771 $ 344,231 $ 339,233 $ 349,410 $ 359,892 $ 370,689 $ 381,809Expense Reimbursement Revenue $ 105,873 $ 107,990 $ 110,150 $ 112,353 $ 114,600 $ 116,892 $ 119,230 $ 121,615 $ 124,047 $ 126,528Effective Gross Revenue $ 423,333 $ 433,027 $ 443,836 $ 456,124 $ 458,832 $ 456,125 $ 468,640 $ 481,507 $ 494,736 $ 508,337
Total Operating Expenses $ 107,529 $ 109,680 $ 111,873 $ 114,111 $ 116,393 $ 118,721 $ 121,095 $ 123,517 $ 125,987 $ 128,507Net Operating Income $ 315,804 $ 323,347 $ 331,962 $ 342,014 $ 342,439 $ 337,404 $ 347,545 $ 357,990 $ 368,748 $ 379,830
Debt Service $ 200,571 $ 200,571 $ 200,571 $ 200,571 $ 200,571 $ 210,949 $ 210,949 $ 210,949 $ 210,949 $ 210,949Cash Flow After Debt Service $ 115,233 $ 122,776 $ 131,391 $ 141,443 $ 141,868 $ 126,455 $ 136,596 $ 147,041 $ 157,799 $ 168,881
Cash on Cash Return ($1,776,250 down) 6.49% 6.91% 7.40% 7.96% 7.99% 7.12% 7.69% 8.28% 8.88% 9.51%
Principal Paydown $ 53,216 $ 55,661 $ 58,218 $ 60,893 $ 66,616 $ 62,003 $ 65,175 $ 68,510 $ 72,015 $ 75,699TOTAL RETURN 9.48% 10.05% 10.67% 11.39% 11.74% 10.61% 11.36% 12.14% 12.94% 13.77%
Assumptions2% growth in expenses and expense reimbursementsLoan resets to 5% after 5 years, 25 yr am on $3,007,072 principal balance

OFFICES AT PACIFIC STATION ENCINITAS, CALIFORNIA
This information has been secured from sources we believe to be reliable, but we make no representations or warranties, expressed or implied, as to the accuracy of the information. References to square footage or age are approximate. Buyer must verify the information and bears all risk for any inaccuracies.
________________________________________________________________________________________________
TENANT OVERVIEW
Tenant Alli, Alliance of Action Sports Lease Guarantor Alli, Alliance of Action Sports, LLC
Tenant Alli, Alliance of Action Sports Square Feet 1,633 Lease Commencement Date July 20, 2012 Rent Commencement Date October 24, 2012 Lease Expiration Date October 23, 2014 Term Remaining on Lease 1+ years Lease Type Absolute NNN Roof and Structure Tenant Responsible Lease Term 2 Years Current Rent $52,190.68 Rent Increases Yes Renewal Options One x 2 Year

OFFICES AT PACIFIC STATIONENCINITAS, CALIFORNIA
This information has been secured from sources we believe to be reliable, but we make no representations or warranties, expressed or implied, as to the accuracyof the information. References to square footage or age are approximate. Buyer must verify the information and bears all risk for any inaccuracies.
________________________________________________________________________________________________
TENANT OVERVIEW
DBA
Tenant Tactel U.S.Lease Guarantor Tactel U.S., Inc.
Tenant Tactel U.S.Square Feet 8,100Lease Commencement Date March 2, 2012Rent Commencement Date July 15, 2012
April 1, 2013April 1, 2014
Lease Expiration Date July 14, 2017Term Remaining on Leases 4 yearsLease Type Absolute NNNRoof and Structure Tenant ResponsibleLease Term 3-5 YearsCurrent Rent $48,654
$52,184$164,431$265,269
Rent Increases YesRenewal Options One x 3 Year

OFFICES AT PACIFIC STATION ENCINITAS, CALIFORNIA
This information has been secured from sources we believe to be reliable, but we make no representations or warranties, expressed or implied, as to the accuracy of the information. References to square footage or age are approximate. Buyer must verify the information and bears all risk for any inaccuracies.
________________________________________________________________________________________________
PROJECT HISTORY
PACIFIC STATION
In addition, Pacific Station includes an innovative solar power system. In partnership with SDG&E through the utility’s Sustainable Communities Program, SDG&E worked with Pacific Station to install a 109-kilowatt SDG&E-owned solar panel array on the building’s roof that provides clean energy to the local community. At peak production, this solar array generates enough electricity to power 71 homes. The Sustainable Communities Program also requires all participating locations to meet rigorous energy efficiency and sustainability criteria in the facility’s design and construction, which Pacific Station achieved.
Pacific Station was designed by an architectural team consisting of John Maple/Maple Dell + McClellan Architects; Allard Jansen Architects, Inc.; and Architecture Illustrated. LEED Silver Certification
Pacific Station is Environmental Design certified. The LEED Green Building Rating System is a third-party certification program and the nationally accepted benchmark for the design, construction and operation of high performance green buildings. Project was given LEED Silver Designation by the US Green Building Council (USGBC). This award is for design and construction of a facility that includes elements for energy and water efficiency, resource efficiency and creating a healthy building to live and work in. Pacific Station is dedicated to being an example of thoughtful and creative development that is sustainable. Pacific Station is one of the first mixed use projects to achieve LEED certification in San Diego County.
Conceived as a “green” development featuring many environmentally responsible design features, Pacific Station is a mixed-use, transit-oriented, redevelopment project constructed on the formerly vacant, 1.4-acre site at 687 S. The 1960s-era metal warehouse that formerly occupied the site was disassembled and moved. Once serving as the offices of the Coast Dispatch newspaper, the building was donated to a church group in Mexicali, where it will was reassembled for use as a church and community center.
As part of the site grading, the project developer worked with the city of Encinitas to provide approximately 37,000 cubic yards of sand for restoration of Ponto Beach in northern Encinitas. Encinitas loses about 50,000 cubic yards of sand due to tidal and wave action each year. Beach erosion leads to eventual cliff erosion and also diminishes the habitat of a variety of animals and plants along the shore. The erosion also reduces the room for recreation on these beaches.

OFFICES AT PACIFIC STATION ENCINITAS, CALIFORNIA
This information has been secured from sources we believe to be reliable, but we make no representations or warranties, expressed or implied, as to the accuracy of the information. References to square footage or age are approximate. Buyer must verify the information and bears all risk for any inaccuracies.
________________________________________________________________________________________________
AREA OVERVIEW
Located along six miles of Pacific coastline in northern San Diego County, Encinitas has an approximate population of 60,000 and is characterized by coastal beaches, cliffs, flat-topped coastal areas, steep mesa bluffs and rolling hills. Our city was incorporated in 1986, drawing together the communities of New Encinitas, Old Encinitas, Cardiff-by-the-Sea, Olivenhain and Leucadia.
There is a significant flower growing industry in the City and many people claim that Encinitas is the Flower Growing Capital. As the City has
developed, it has grown up around the pre-existing flower growers. San Diego Botanical Gardens is a beautiful oasis to visit with an Amazon Rainforest and the largest display of bamboo in the world. The gardens of the Self Realization Center are beautiful and sit overlooking the ocean in a serene garden-like setting.
Golf enthusiasts will enjoy our Encinitas Ranch Golf Course, a championship 18 hole par 72 course with panoramic ocean views. This public
facility has five tees available and can be enjoyed by golfers of all abilities. Downtown 101 is a coastal shopping district over 100 years old featuring historic architecture, quaint shops, sidewalk cafes, and restaurants
framed by beautiful flower baskets. The organization Downtown Encinitas Merchants Association (DEMA) is a great resource for information on business in Encinitas.
The beaches in Encinitas are outstanding. There are many stretches of beach that lie between Cardiff-by-the-Sea and La Costa. The surfing is
unbeatable and many surf contests are held throughout the year in Encinitas. The San Elijo Lagoon Reserve is the largest coastal wetland in San Diego County and is home to nearly 300 different bird species throughout the year.
The natural beauty of our communities, along with temperatures between 40 and 85 degrees year-round make Encinitas a spectacular place to live.
Located along six miles of Pacific coastline in northern San Diego County, Encinitas has an approximate population of 60,000 and is characterized by coastal beaches, cliffs, flat-topped coastal areas, steep mesa bluffs and rolling hills. Our city was incorporated in 1986, drawing together the communities of New Encinitas, Old Encinitas, Cardiff-by-the-Sea, Olivenhain and Leucadia.
There is a significant flower growing industry in the City and many people claim that Encinitas is the Flower Growing Capital. As the City has
developed, it has grown up around the pre-existing flower growers. San Diego Botanical Gardens is a beautiful oasis to visit with an Amazon Rainforest and the largest display of bamboo in the world. The gardens of the Self Realization Center are beautiful and sit overlooking the ocean in a serene garden-like setting.
Golf enthusiasts will enjoy our Encinitas Ranch Golf Course, a championship 18 hole par 72 course with panoramic ocean views. This public
facility has five tees available and can be enjoyed by golfers of all abilities. Downtown 101 is a coastal shopping district over 100 years old featuring historic architecture, quaint shops, sidewalk cafes, and restaurants
framed by beautiful flower baskets. The organization Downtown Encinitas Merchants Association (DEMA) is a great resource for information on business in Encinitas.
The beaches in Encinitas are outstanding. There are many stretches of beach that lie between Cardiff-by-the-Sea and La Costa. The surfing is
unbeatable and many surf contests are held throughout the year in Encinitas. The San Elijo Lagoon Reserve is the largest coastal wetland in San Diego County and is home to nearly 300 different bird species throughout the year.
The natural beauty of our communities, along with temperatures between 40 and 85 degrees
year-round make Encinitas a spectacular place to live.
ENCINITAS, CALIFORNIA

OFFICES AT PACIFIC STATION ENCINITAS, CALIFORNIA
This information has been secured from sources we believe to be reliable, but we make no representations or warranties, expressed or implied, as to the accuracy of the information. References to square footage or age are approximate. Buyer must verify the information and bears all risk for any inaccuracies.
________________________________________________________________________________________________
MAPS
Regional Map
Local Map

OFFICES AT PACIFIC STATIONENCINITAS, CALIFORNIA
This information has been secured from sources we believe to be reliable, but we make no representations or warranties, expressed or implied, as to the accuracyof the information. References to square footage or age are approximate. Buyer must verify the information and bears all risk for any inaccuracies.
________________________________________________________________________________________________
AERIAL
Encinitas City Hall
Encinitas Public Library
OFFICES AT PACIFIC STATION ENCINITAS, CALIFORNIA
This information has been secured from sources we believe to be reliable, but we make no representations or warranties, expressed or implied, as to the accuracy of the information. References to square footage or age are approximate. Buyer must verify the information and bears all risk for any inaccuracies.
________________________________________________________________________________________________
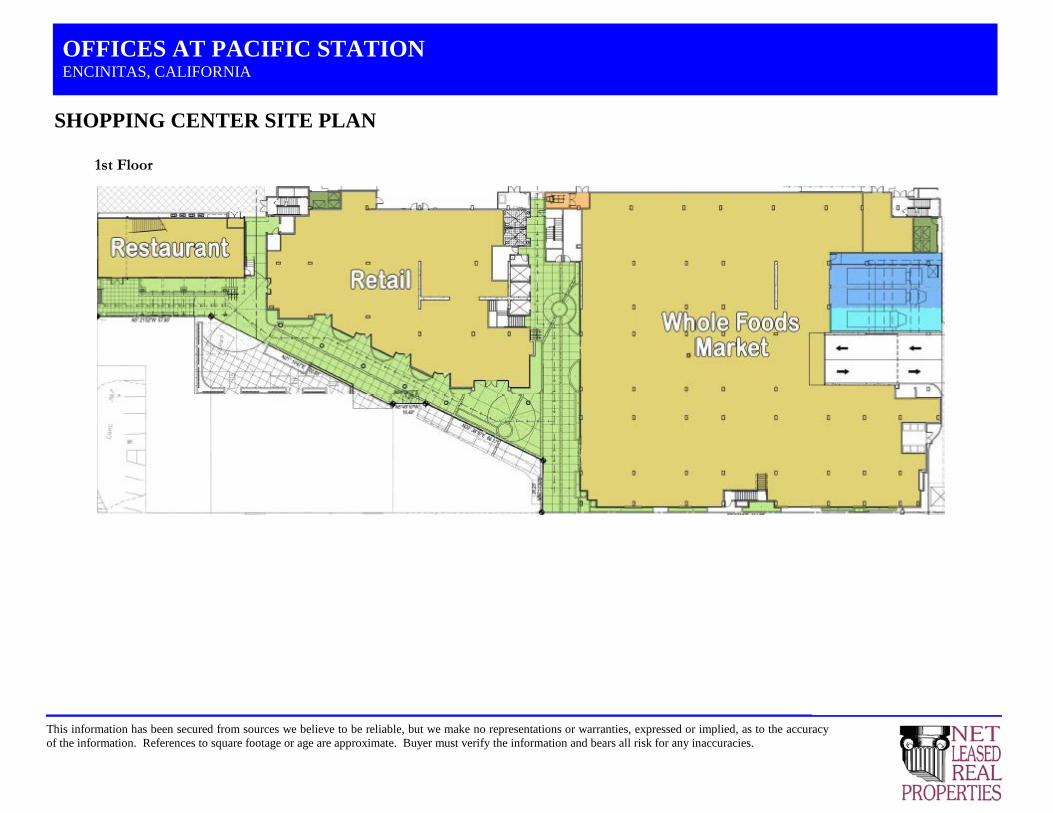
SHOPPING CENTER SITE PLAN 1st Floor

OFFICES AT PACIFIC STATION ENCINITAS, CALIFORNIA
This information has been secured from sources we believe to be reliable, but we make no representations or warranties, expressed or implied, as to the accuracy of the information. References to square footage or age are approximate. Buyer must verify the information and bears all risk for any inaccuracies.
________________________________________________________________________________________________
SHOPPING CENTER SITE PLAN 2nd Floor

OFFICES AT PACIFIC STATION ENCINITAS, CALIFORNIA
This information has been secured from sources we believe to be reliable, but we make no representations or warranties, expressed or implied, as to the accuracy of the information. References to square footage or age are approximate. Buyer must verify the information and bears all risk for any inaccuracies.
________________________________________________________________________________________________
SHOPPING CENTER SITE PLAN 3rd Floor

OFFICES AT PACIFIC STATIONENCINITAS, CALIFORNIA
This information has been secured from sources we believe to be reliable, but we make no representations or warranties, expressed or implied, as to the accuracyof the information. References to square footage or age are approximate. Buyer must verify the information and bears all risk for any inaccuracies.
________________________________________________________________________________________________
FLOOR PLANS
room5

OFFICES AT PACIFIC STATION ENCINITAS, CALIFORNIA
This information has been secured from sources we believe to be reliable, but we make no representations or warranties, expressed or implied, as to the accuracy of the information. References to square footage or age are approximate. Buyer must verify the information and bears all risk for any inaccuracies.
________________________________________________________________________________________________
FLOOR PLANS
Alli Sports
�

OFFICES AT PACIFIC STATION ENCINITAS, CALIFORNIA
This information has been secured from sources we believe to be reliable, but we make no representations or warranties, expressed or implied, as to the accuracy of the information. References to square footage or age are approximate. Buyer must verify the information and bears all risk for any inaccuracies.
________________________________________________________________________________________________
PROPERTY PHOTOGRAPHS

OFFICES AT PACIFIC STATIONENCINITAS, CALIFORNIA
This information has been secured from sources we believe to be reliable, but we make no representations or warranties, expressed or implied, as to the accuracyof the information. References to square footage or age are approximate. Buyer must verify the information and bears all risk for any inaccuracies.
________________________________________________________________________________________________
INTERIOR PHOTOGRAPHS
1

OFFICES AT PACIFIC STATION ENCINITAS, CALIFORNIA
This information has been secured from sources we believe to be reliable, but we make no representations or warranties, expressed or implied, as to the accuracy of the information. References to square footage or age are approximate. Buyer must verify the information and bears all risk for any inaccuracies.
________________________________________________________________________________________________
NEIGHBORING RETAIL

OFFICES AT PACIFIC STATION ENCINITAS, CALIFORNIA
This information has been secured from sources we believe to be reliable, but we make no representations or warranties, expressed or implied, as to the accuracy of the information. References to square footage or age are approximate. Buyer must verify the information and bears all risk for any inaccuracies.
________________________________________________________________________________________________
WORLD FAMOUS ENCINITAS
SWAMI'S BEACH MOONLIGHT BEACH

Site Map687 S Coast Highway 101, Encinitas, CA, 92024 Prepared by David StankaitisRing: 1, 3, 5 Miles Latitude: 33.0439
Longitude: -117.29358
May 15, 2013
©2013 Esri

Executive Summary687 S Coast Highway 101, Encinitas, CA, 92024 Prepared by David StankaitisRing: 1 mile radius Latitude: 33.043900488
Longitude: -117.2935799
1 mile 3 miles 5 milesPopulation
2000 Population 9,078 53,232 106,480
2010 Population 9,615 55,820 119,385
2012 Population 9,711 56,219 120,951
2017 Population 10,129 58,401 126,797
2000-2010 Annual Rate 0.58% 0.48% 1.15%
2010-2012 Annual Rate 0.44% 0.32% 0.58%
2012-2017 Annual Rate 0.85% 0.76% 0.95%2012 Male Population 51.0% 49.4% 49.0%2012 Female Population 49.0% 50.6% 51.0%2012 Median Age 40.7 42.2 42.9
In the identified area, the current year population is 120,951. In 2010, the Census count in the area was 119,385. The rate of change since2010 was 0.58% annually. The five-year projection for the population in the area is 126,797 representing a change of 0.95% annually from2012 to 2017. Currently, the population is 49.0% male and 51.0% female.
Median Age
The median age in this area is 42.9, compared to U.S. median age of 37.3.
Race and Ethnicity2012 White Alone 85.3% 85.1% 85.1%
2012 Black Alone 0.6% 0.6% 0.7%2012 American Indian/Alaska Native Alone 0.6% 0.5% 0.4%2012 Asian Alone 3.6% 4.0% 5.4%2012 Pacific Islander Alone 0.2% 0.2% 0.1%2012 Other Race 6.3% 6.1% 4.5%2012 Two or More Races 3.4% 3.5% 3.7%2012 Hispanic Origin (Any Race) 16.1% 14.8% 12.7%
Persons of Hispanic origin represent 12.7% of the population in the identified area compared to 16.9% of the U.S. population. Persons ofHispanic Origin may be of any race. The Diversity Index, which measures the probability that two people from the same area will be fromdifferent race/ethnic groups, is 43.5 in the identified area, compared to 61.4 for the U.S. as a whole.
Households
2000 Households 3,956 21,273 42,7382010 Households 4,270 23,085 48,1272012 Total Households 4,329 23,329 48,8532017 Total Households 4,518 24,217 51,0952000-2010 Annual Rate 0.77% 0.82% 1.19%2010-2012 Annual Rate 0.61% 0.47% 0.67%2012-2017 Annual Rate 0.86% 0.75% 0.90%2012 Average Household Size 2.19 2.38 2.46
The household count in this area has changed from 48,127 in 2010 to 48,853 in the current year, a change of 0.67% annually. The five-yearprojection of households is 51,095, a change of 0.90% annually from the current year total. Average household size is currently 2.46,compared to 2.47 in the year 2010. The number of families in the current year is 31,484 in the specified area.
May 15, 2013
©2013 Esri Page 1 of 2
Data Note: Income is expressed in current dollarsSource: U.S. Census Bureau, Census 2010 Summary File 1. Esri forecasts for 2012 and 2017. Esri converted Census 2000 data into 2010 geography.

Executive Summary687 S Coast Highway 101, Encinitas, CA, 92024 Prepared by David StankaitisRing: 5 mile radius Latitude: 33.043900488
Longitude: -117.2935799
1 mile 3 miles 5 milesMedian Household Income
2012 Median Household Income $80,036 $87,159 $101,7212017 Median Household Income $91,936 $97,299 $107,9762012-2017 Annual Rate 2.81% 2.23% 1.20%
Average Household Income
2012 Average Household Income $103,799 $108,510 $122,2712017 Average Household Income $121,209 $125,954 $142,8142012-2017 Annual Rate 3.15% 3.03% 3.15%
Per Capita Income
2012 Per Capita Income $45,078 $45,258 $49,6942017 Per Capita Income $52,463 $52,429 $57,8652012-2017 Annual Rate 3.08% 2.99% 3.09%
Households by Income
Current median household income is $101,721 in the area, compared to $50,157 for all U.S. households. Median household income isprojected to be $107,976 in five years, compared to $56,895 for all U.S. households
Current average household income is $122,271 in this area, compared to $68,162 for all U.S households. Average household income isprojected to be $142,814 in five years, compared to $77,137 for all U.S. households
Current per capita income is $49,694 in the area, compared to the U.S. per capita income of $26,409. The per capita income is projected tobe $57,865 in five years, compared to $29,882 for all U.S. households Housing
2000 Total Housing Units 4,219 22,262 45,5742000 Owner Occupied Housing Units 1,974 13,288 29,3872000 Owner Occupied Housing Units 1,982 7,985 13,3502000 Vacant Housing Units 263 989 2,837
2010 Total Housing Units 4,693 24,742 52,1772010 Owner Occupied Housing Units 2,168 13,923 31,9752010 Renter Occupied Housing Units 2,102 9,162 16,1522010 Vacant Housing Units 423 1,657 4,050
2012 Total Housing Units 4,723 24,988 52,7002012 Owner Occupied Housing Units 2,101 13,598 31,5932012 Renter Occupied Housing Units 2,228 9,732 17,2592012 Vacant Housing Units 394 1,659 3,847
2017 Total Housing Units 4,867 25,803 54,6382017 Owner Occupied Housing Units 2,246 14,402 33,6452017 Renter Occupied Housing Units 2,271 9,815 17,4502017 Vacant Housing Units 349 1,586 3,543
Currently, 59.9% of the 52,700 housing units in the area are owner occupied; 32.7%, renter occupied; and 7.3% are vacant. Currently, inthe U.S., 56.5% of the housing units in the area are owner occupied; 32.1% are renter occupied; and 11.4% are vacant. In 2010, therewere 52,177 housing units in the area - 61.3% owner occupied, 31.0% renter occupied, and 7.8% vacant. The annual rate of change inhousing units since 2010 is 0.44%. Median home value in the area is $555,023, compared to a median home value of $167,749 for the U.S.In five years, median value is projected to change by 1.89% annually to $609,518.
May 15, 2013
©2013 Esri Page 2 of 2
Data Note: Income is expressed in current dollarsSource: U.S. Census Bureau, Census 2010 Summary File 1. Esri forecasts for 2012 and 2017. Esri converted Census 2000 data into 2010 geography.

Census 2010 Summary Profile
687 S Coast Highway 101, Encinitas, CA, Prepared by David StankaitisRing: 1 mile radius Latitude: 33.043900488
Longitude: -117.2935799
2000-2010 2000 2010 Annual Rate
Population 9,078 9,615 0.58%Households 3,956 4,270 0.77%Housing Units 4,219 4,693 1.07%
Population by Race Number PercentTotal 9,616 100.0%
Population Reporting One Race 9,303 96.7%White 8,256 85.9%Black 54 0.6%American Indian 58 0.6%Asian 335 3.5%Pacific Islander 16 0.2%Some Other Race 584 6.1%
Population Reporting Two or More Races 313 3.3%
Total Hispanic Population 1,484 15.4%
Population by SexMale 4,892 50.9%Female 4,723 49.1%
Population by AgeTotal 9,616 100.0%
Age 0 - 4 518 5.4%Age 5 - 9 492 5.1%Age 10 - 14 437 4.5%Age 15 - 19 408 4.2%Age 20 - 24 438 4.6%Age 25 - 29 808 8.4%Age 30 - 34 867 9.0%Age 35 - 39 776 8.1%Age 40 - 44 730 7.6%Age 45 - 49 801 8.3%Age 50 - 54 745 7.7%Age 55 - 59 812 8.4%Age 60 - 64 618 6.4%Age 65 - 69 341 3.5%Age 70 - 74 212 2.2%Age 75 - 79 170 1.8%Age 80 - 84 158 1.6%Age 85+ 283 2.9%
Age 18+ 7,901 82.2%Age 65+ 1,164 12.1%
Median Age by Sex and Race/Hispanic OriginTotal Population 40.4
Male 39.5Female 41.4
White Alone 41.9Black Alone 41.5American Indian Alone 34.6Asian Alone 40.4Pacific Islander Alone 53.8Some Other Race Alone 31.1Two or More Races 23.8Hispanic Population 32.1
Data Note: Hispanic population can be of any race. Census 2010 medians are computed from reported data distributions.Source: U.S. Census Bureau, Census 2010 Summary File 1. Esri converted Census 2000 data into 2010 geography.
May 15, 2013
©2013 Esri Page 1 of 12

Census 2010 Summary Profile
687 S Coast Highway 101, Encinitas, CA, Prepared by David StankaitisRing: 1 mile radius Latitude: 33.043900488
Longitude: -117.2935799
Households by TypeTotal 4,270 100.0%
Households with 1 Person 1,336 31.3%Households with 2+ People 2,934 68.7%
Family Households 2,314 54.2%Husband-wife Families 1,828 42.8%
With Own Children 765 17.9%Other Family (No Spouse Present) 486 11.4%
With Own Children 226 5.3%Nonfamily Households 620 14.5%
All Households with Children 1,061 24.8%Multigenerational Households 84 2.0%Unmarried Partner Households 322 7.5%
Male-female 292 6.8%Same-sex 30 0.7%
Average Household Size 2.19
Family Households by Size
Total 2,314 100.0%
2 People 1,041 45.0%
3 People 555 24.0%
4 People 461 19.9%
5 People 151 6.5%
6 People 59 2.6%
7+ People 47 2.0%
Average Family Size 2.78
Nonfamily Households by SizeTotal 1,956 100.0%
1 Person 1,336 68.3%2 People 495 25.3%3 People 93 4.8%4 People 24 1.2%5 People 5 0.3%6 People 2 0.1%7+ People 1 0.1%
Average Nonfamily Size 1.35
Population by Relationship and Household TypeTotal 9,615 100.0%
In Households 9,366 97.4%In Family Households 6,725 69.9%
Householder 2,202 22.9%Spouse 1,737 18.1%Child 2,174 22.6%Other relative 312 3.2%Nonrelative 300 3.1%
In Nonfamily Households 2,640 27.5%In Group Quarters 249 2.6%
Institutionalized Population 178 1.9%Noninstitutionalized Population 72 0.7%
Data Note: Households with children include any households with people under age 18, related or not. Multigenerational households are families with 3 or moreparent-child relationships. Unmarried partner households are usually classified as nonfamily households unless there is another member of the household related to thehouseholder. Multigenerational and unmarried partner households are reported only to the tract level. Esri estimated block group data, which is used to estimate polygonsor non-standard geography. Average family size excludes nonrelatives.Source: U.S. Census Bureau, Census 2010 Summary File 1.
May 15, 2013
©2013 Esri Page 2 of 12

Census 2010 Summary Profile
687 S Coast Highway 101, Encinitas, CA, Prepared by David StankaitisRing: 1 mile radius Latitude: 33.043900488
Longitude: -117.2935799
Family Households by Age of HouseholderTotal 2,314 100.0%
Householder Age 15 - 44 868 37.5%Householder Age 45 - 54 565 24.4%Householder Age 55 - 64 531 22.9%Householder Age 65 - 74 203 8.8%Householder Age 75+ 147 6.4%
Nonfamily Households by Age of HouseholderTotal 1,955 100.0%
Householder Age 15 - 44 869 44.5%Householder Age 45 - 54 340 17.4%Householder Age 55 - 64 345 17.6%Householder Age 65 - 74 173 8.8%Householder Age 75+ 228 11.7%
Households by Race of HouseholderTotal 4,270 100.0%
Householder is White Alone 3,842 90.0%Householder is Black Alone 19 0.4%Householder is American Indian Alone 18 0.4%Householder is Asian Alone 139 3.3%Householder is Pacific Islander Alone 8 0.2%Householder is Some Other Race Alone 158 3.7%Householder is Two or More Races 86 2.0%
Households with Hispanic Householder 432 10.1%
Husband-wife Families by Race of HouseholderTotal 1,830 100.0%
Householder is White Alone 1,626 88.9%Householder is Black Alone 7 0.4%Householder is American Indian Alone 11 0.6%Householder is Asian Alone 73 4.0%Householder is Pacific Islander Alone 3 0.2%Householder is Some Other Race Alone 79 4.3%Householder is Two or More Races 31 1.7%
Husband-wife Families with Hispanic Householder 199 10.9%
Other Families (No Spouse) by Race of HouseholderTotal 487 100.0%
Householder is White Alone 408 83.8%Householder is Black Alone 2 0.4%Householder is American Indian Alone 4 0.8%Householder is Asian Alone 15 3.1%Householder is Pacific Islander Alone 1 0.2%Householder is Some Other Race Alone 41 8.4%Householder is Two or More Races 16 3.3%
Other Families with Hispanic Householder 96 19.8%
Nonfamily Households by Race of HouseholderTotal 1,956 100.0%
Householder is White Alone 1,808 92.4%Householder is Black Alone 10 0.5%Householder is American Indian Alone 3 0.2%Householder is Asian Alone 52 2.7%Householder is Pacific Islander Alone 4 0.2%Householder is Some Other Race Alone 39 2.0%Householder is Two or More Races 40 2.0%
Nonfamily Households with Hispanic Householder 136 7.0%Source: U.S. Census Bureau, Census 2010 Summary File 1.
May 15, 2013
©2013 Esri Page 3 of 12

Census 2010 Summary Profile
687 S Coast Highway 101, Encinitas, CA, Prepared by David StankaitisRing: 1 mile radius Latitude: 33.043900488
Longitude: -117.2935799
Total Housing Units by OccupancyTotal 4,659 100.0%
Occupied Housing Units 4,270 91.7%Vacant Housing Units
For Rent 98 2.1%Rented, not Occupied 12 0.3%For Sale Only 25 0.5%Sold, not Occupied 7 0.2%For Seasonal/Recreational/Occasional Use 195 4.2%For Migrant Workers 0 0.0%Other Vacant 52 1.1%
Total Vacancy Rate 9.0%
Households by Tenure and Mortgage StatusTotal 4,270 100.0%
Owner Occupied 2,168 50.8%Owned with a Mortgage/Loan 1,706 40.0%Owned Free and Clear 462 10.8%Average Household Size 2.44
Renter Occupied 2,102 49.2%Average Household Size 1.94
Owner-occupied Housing Units by Race of HouseholderTotal 2,169 100.0%
Householder is White Alone 1,988 91.7%Householder is Black Alone 6 0.3%Householder is American Indian Alone 7 0.3%Householder is Asian Alone 85 3.9%Householder is Pacific Islander Alone 2 0.1%Householder is Some Other Race Alone 51 2.4%Householder is Two or More Races 30 1.4%
Owner-occupied Housing Units with Hispanic Householder 171 7.9%
Renter-occupied Housing Units by Race of HouseholderTotal 2,103 100.0%
Householder is White Alone 1,854 88.2%Householder is Black Alone 14 0.7%Householder is American Indian Alone 11 0.5%Householder is Asian Alone 54 2.6%Householder is Pacific Islander Alone 6 0.3%Householder is Some Other Race Alone 107 5.1%Householder is Two or More Races 57 2.7%
Renter-occupied Housing Units with Hispanic Householder 261 12.4%
Average Household Size by Race/Hispanic Origin of HouseholderHouseholder is White Alone 2.12Householder is Black Alone 2.00Householder is American Indian Alone 2.78Householder is Asian Alone 2.16Householder is Pacific Islander Alone 2.25Householder is Some Other Race Alone 3.80Householder is Two or More Races 2.59Householder is Hispanic 3.19
Source: U.S. Census Bureau, Census 2010 Summary File 1.
May 15, 2013
©2013 Esri Page 4 of 12

Census 2010 Summary Profile
687 S Coast Highway 101, Encinitas, CA, Prepared by David StankaitisRing: 3 mile radius Latitude: 33.043900488
Longitude: -117.2935799
2000-2010 2000 2010 Annual Rate
Population 53,232 55,820 0.48%Households 21,273 23,085 0.82%Housing Units 22,262 24,742 1.06%
Population by Race Number PercentTotal 55,819 100.0%
Population Reporting One Race 53,930 96.6%White 47,828 85.7%Black 331 0.6%American Indian 284 0.5%Asian 2,171 3.9%Pacific Islander 89 0.2%Some Other Race 3,227 5.8%
Population Reporting Two or More Races 1,889 3.4%
Total Hispanic Population 7,845 14.1%
Population by SexMale 27,503 49.3%Female 28,317 50.7%
Population by AgeTotal 55,821 100.0%
Age 0 - 4 3,023 5.4%Age 5 - 9 3,120 5.6%Age 10 - 14 3,071 5.5%Age 15 - 19 2,873 5.1%Age 20 - 24 2,532 4.5%Age 25 - 29 3,752 6.7%Age 30 - 34 3,987 7.1%Age 35 - 39 4,104 7.4%Age 40 - 44 4,039 7.2%Age 45 - 49 4,467 8.0%Age 50 - 54 4,623 8.3%Age 55 - 59 4,498 8.1%Age 60 - 64 3,753 6.7%Age 65 - 69 2,138 3.8%Age 70 - 74 1,430 2.6%Age 75 - 79 1,206 2.2%Age 80 - 84 1,271 2.3%Age 85+ 1,934 3.5%
Age 18+ 44,696 80.1%Age 65+ 7,979 14.3%
Median Age by Sex and Race/Hispanic OriginTotal Population 41.8
Male 40.3Female 43.3
White Alone 43.7Black Alone 40.4American Indian Alone 35.0Asian Alone 41.8Pacific Islander Alone 40.6Some Other Race Alone 29.6Two or More Races 21.5Hispanic Population 31.6
Data Note: Hispanic population can be of any race. Census 2010 medians are computed from reported data distributions.Source: U.S. Census Bureau, Census 2010 Summary File 1. Esri converted Census 2000 data into 2010 geography.
May 15, 2013
©2013 Esri Page 5 of 12

Census 2010 Summary Profile
687 S Coast Highway 101, Encinitas, CA, Prepared by David StankaitisRing: 3 mile radius Latitude: 33.043900488
Longitude: -117.2935799
Households by TypeTotal 23,086 100.0%
Households with 1 Person 6,448 27.9%Households with 2+ People 16,638 72.1%
Family Households 13,972 60.5%Husband-wife Families 11,186 48.5%
With Own Children 4,687 20.3%Other Family (No Spouse Present) 2,786 12.1%
With Own Children 1,361 5.9%Nonfamily Households 2,666 11.5%
All Households with Children 6,408 27.8%Multigenerational Households 461 2.0%Unmarried Partner Households 1,479 6.4%
Male-female 1,317 5.7%Same-sex 162 0.7%
Average Household Size 2.39
Family Households by Size
Total 13,971 100.0%
2 People 6,211 44.5%
3 People 3,289 23.5%
4 People 2,961 21.2%
5 People 952 6.8%
6 People 312 2.2%
7+ People 246 1.8%
Average Family Size 2.95
Nonfamily Households by SizeTotal 9,114 100.0%
1 Person 6,448 70.7%2 People 2,112 23.2%3 People 401 4.4%4 People 110 1.2%5 People 25 0.3%6 People 11 0.1%7+ People 7 0.1%
Average Nonfamily Size 1.38
Population by Relationship and Household TypeTotal 55,820 100.0%
In Households 55,183 98.9%In Family Households 42,638 76.4%
Householder 13,926 24.9%Spouse 11,148 20.0%Child 14,331 25.7%Other relative 1,747 3.1%Nonrelative 1,487 2.7%
In Nonfamily Households 12,544 22.5%In Group Quarters 637 1.1%
Institutionalized Population 543 1.0%Noninstitutionalized Population 94 0.2%
Data Note: Households with children include any households with people under age 18, related or not. Multigenerational households are families with 3 or moreparent-child relationships. Unmarried partner households are usually classified as nonfamily households unless there is another member of the household related to thehouseholder. Multigenerational and unmarried partner households are reported only to the tract level. Esri estimated block group data, which is used to estimate polygonsor non-standard geography. Average family size excludes nonrelatives.Source: U.S. Census Bureau, Census 2010 Summary File 1.
May 15, 2013
©2013 Esri Page 6 of 12

Census 2010 Summary Profile
687 S Coast Highway 101, Encinitas, CA, Prepared by David StankaitisRing: 3 mile radius Latitude: 33.043900488
Longitude: -117.2935799
Family Households by Age of HouseholderTotal 13,970 100.0%
Householder Age 15 - 44 4,636 33.2%Householder Age 45 - 54 3,580 25.6%Householder Age 55 - 64 3,236 23.2%Householder Age 65 - 74 1,344 9.6%Householder Age 75+ 1,174 8.4%
Nonfamily Households by Age of HouseholderTotal 9,114 100.0%
Householder Age 15 - 44 3,273 35.9%Householder Age 45 - 54 1,530 16.8%Householder Age 55 - 64 1,661 18.2%Householder Age 65 - 74 929 10.2%Householder Age 75+ 1,721 18.9%
Households by Race of HouseholderTotal 23,086 100.0%
Householder is White Alone 20,830 90.2%Householder is Black Alone 118 0.5%Householder is American Indian Alone 100 0.4%Householder is Asian Alone 779 3.4%Householder is Pacific Islander Alone 43 0.2%Householder is Some Other Race Alone 774 3.4%Householder is Two or More Races 442 1.9%
Households with Hispanic Householder 2,130 9.2%
Husband-wife Families by Race of HouseholderTotal 11,186 100.0%
Householder is White Alone 10,035 89.7%Householder is Black Alone 49 0.4%Householder is American Indian Alone 47 0.4%Householder is Asian Alone 432 3.9%Householder is Pacific Islander Alone 16 0.1%Householder is Some Other Race Alone 414 3.7%Householder is Two or More Races 193 1.7%
Husband-wife Families with Hispanic Householder 1,082 9.7%
Other Families (No Spouse) by Race of HouseholderTotal 2,786 100.0%
Householder is White Alone 2,357 84.6%Householder is Black Alone 21 0.8%Householder is American Indian Alone 23 0.8%Householder is Asian Alone 90 3.2%Householder is Pacific Islander Alone 9 0.3%Householder is Some Other Race Alone 207 7.4%Householder is Two or More Races 79 2.8%
Other Families with Hispanic Householder 495 17.8%
Nonfamily Households by Race of HouseholderTotal 9,113 100.0%
Householder is White Alone 8,438 92.6%Householder is Black Alone 48 0.5%Householder is American Indian Alone 30 0.3%Householder is Asian Alone 257 2.8%Householder is Pacific Islander Alone 18 0.2%Householder is Some Other Race Alone 152 1.7%Householder is Two or More Races 170 1.9%
Nonfamily Households with Hispanic Householder 553 6.1%Source: U.S. Census Bureau, Census 2010 Summary File 1.
May 15, 2013
©2013 Esri Page 7 of 12

Census 2010 Summary Profile
687 S Coast Highway 101, Encinitas, CA, Prepared by David StankaitisRing: 3 mile radius Latitude: 33.043900488
Longitude: -117.2935799
Total Housing Units by OccupancyTotal 24,732 100.0%
Occupied Housing Units 23,085 93.3%Vacant Housing Units
For Rent 512 2.1%Rented, not Occupied 32 0.1%For Sale Only 175 0.7%Sold, not Occupied 45 0.2%For Seasonal/Recreational/Occasional Use 631 2.6%For Migrant Workers 0 0.0%Other Vacant 252 1.0%
Total Vacancy Rate 6.7%
Households by Tenure and Mortgage StatusTotal 23,085 100.0%
Owner Occupied 13,923 60.3%Owned with a Mortgage/Loan 10,963 47.5%Owned Free and Clear 2,960 12.8%Average Household Size 2.53
Renter Occupied 9,162 39.7%Average Household Size 2.18
Owner-occupied Housing Units by Race of HouseholderTotal 13,924 100.0%
Householder is White Alone 12,831 92.2%Householder is Black Alone 50 0.4%Householder is American Indian Alone 46 0.3%Householder is Asian Alone 521 3.7%Householder is Pacific Islander Alone 14 0.1%Householder is Some Other Race Alone 255 1.8%Householder is Two or More Races 207 1.5%
Owner-occupied Housing Units with Hispanic Householder 952 6.8%
Renter-occupied Housing Units by Race of HouseholderTotal 9,161 100.0%
Householder is White Alone 7,999 87.3%Householder is Black Alone 68 0.7%Householder is American Indian Alone 54 0.6%Householder is Asian Alone 258 2.8%Householder is Pacific Islander Alone 28 0.3%Householder is Some Other Race Alone 519 5.7%Householder is Two or More Races 235 2.6%
Renter-occupied Housing Units with Hispanic Householder 1,178 12.9%
Average Household Size by Race/Hispanic Origin of HouseholderHouseholder is White Alone 2.31Householder is Black Alone 2.39Householder is American Indian Alone 3.05Householder is Asian Alone 2.52Householder is Pacific Islander Alone 2.35Householder is Some Other Race Alone 4.16Householder is Two or More Races 2.77Householder is Hispanic 3.46
Source: U.S. Census Bureau, Census 2010 Summary File 1.
May 15, 2013
©2013 Esri Page 8 of 12

Census 2010 Summary Profile
687 S Coast Highway 101, Encinitas, CA, Prepared by David StankaitisRing: 5 mile radius Latitude: 33.043900488
Longitude: -117.2935799
2000-2010 2000 2010 Annual Rate
Population 106,480 119,385 1.15%Households 42,738 48,127 1.20%Housing Units 45,574 52,177 1.36%
Population by Race Number PercentTotal 119,385 100.0%
Population Reporting One Race 115,119 96.4%White 102,253 85.7%Black 858 0.7%American Indian 488 0.4%Asian 6,205 5.2%Pacific Islander 159 0.1%Some Other Race 5,156 4.3%
Population Reporting Two or More Races 4,266 3.6%
Total Hispanic Population 14,469 12.1%
Population by SexMale 58,395 48.9%Female 60,990 51.1%
Population by AgeTotal 119,388 100.0%
Age 0 - 4 6,413 5.4%Age 5 - 9 7,421 6.2%Age 10 - 14 7,746 6.5%Age 15 - 19 6,776 5.7%Age 20 - 24 4,815 4.0%Age 25 - 29 6,491 5.4%Age 30 - 34 7,249 6.1%Age 35 - 39 8,300 7.0%Age 40 - 44 8,975 7.5%Age 45 - 49 10,176 8.5%Age 50 - 54 10,105 8.5%Age 55 - 59 9,359 7.8%Age 60 - 64 7,999 6.7%Age 65 - 69 5,301 4.4%Age 70 - 74 3,523 3.0%Age 75 - 79 2,889 2.4%Age 80 - 84 2,593 2.2%Age 85+ 3,254 2.7%
Age 18+ 93,151 78.0%Age 65+ 17,560 14.7%
Median Age by Sex and Race/Hispanic OriginTotal Population 42.5
Male 41.3Female 43.6
White Alone 44.3Black Alone 39.0American Indian Alone 35.1Asian Alone 41.6Pacific Islander Alone 40.7Some Other Race Alone 29.8Two or More Races 18.4Hispanic Population 31.5
Data Note: Hispanic population can be of any race. Census 2010 medians are computed from reported data distributions.Source: U.S. Census Bureau, Census 2010 Summary File 1. Esri converted Census 2000 data into 2010 geography.
May 15, 2013
©2013 Esri Page 9 of 12
Census 2010 Summary Profile
687 S Coast Highway 101, Encinitas, CA, Prepared by David StankaitisRing: 5 mile radius Latitude: 33.043900488
Longitude: -117.2935799
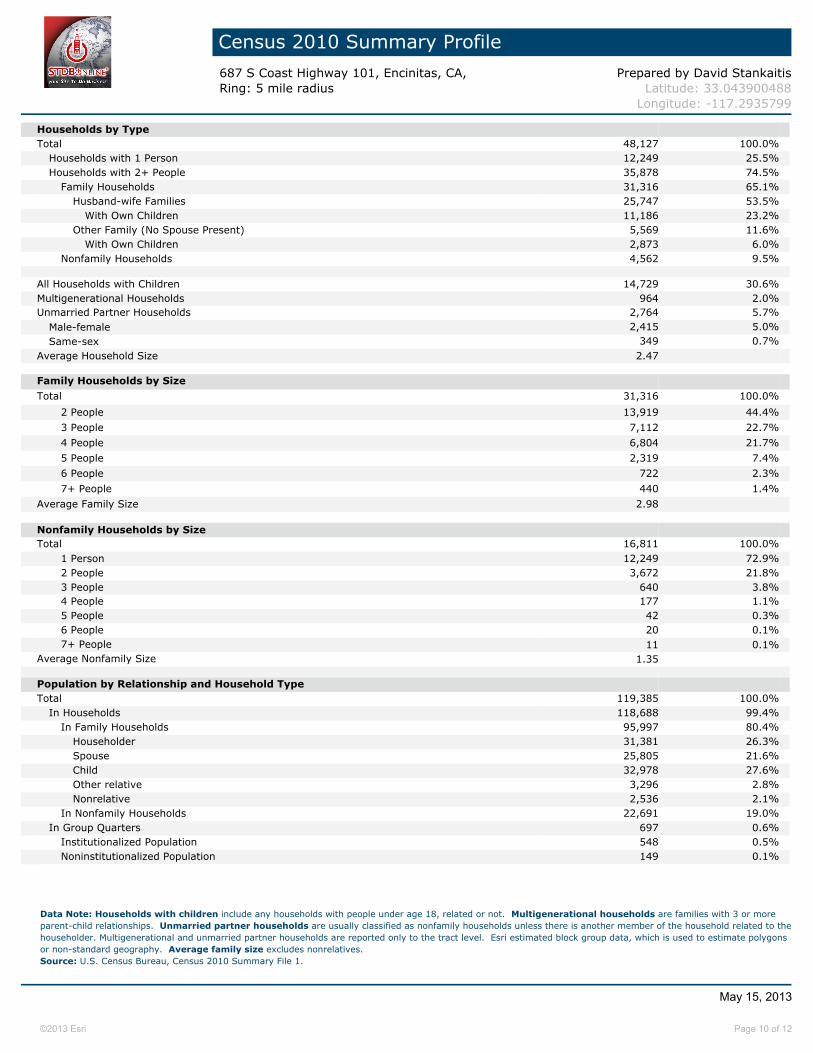
Households by TypeTotal 48,127 100.0%
Households with 1 Person 12,249 25.5%Households with 2+ People 35,878 74.5%
Family Households 31,316 65.1%Husband-wife Families 25,747 53.5%
With Own Children 11,186 23.2%Other Family (No Spouse Present) 5,569 11.6%
With Own Children 2,873 6.0%Nonfamily Households 4,562 9.5%
All Households with Children 14,729 30.6%Multigenerational Households 964 2.0%Unmarried Partner Households 2,764 5.7%
Male-female 2,415 5.0%Same-sex 349 0.7%
Average Household Size 2.47
Family Households by Size
Total 31,316 100.0%
2 People 13,919 44.4%
3 People 7,112 22.7%
4 People 6,804 21.7%
5 People 2,319 7.4%
6 People 722 2.3%
7+ People 440 1.4%
Average Family Size 2.98
Nonfamily Households by SizeTotal 16,811 100.0%
1 Person 12,249 72.9%2 People 3,672 21.8%3 People 640 3.8%4 People 177 1.1%5 People 42 0.3%6 People 20 0.1%7+ People 11 0.1%
Average Nonfamily Size 1.35
Population by Relationship and Household TypeTotal 119,385 100.0%
In Households 118,688 99.4%In Family Households 95,997 80.4%
Householder 31,381 26.3%Spouse 25,805 21.6%Child 32,978 27.6%Other relative 3,296 2.8%Nonrelative 2,536 2.1%
In Nonfamily Households 22,691 19.0%In Group Quarters 697 0.6%
Institutionalized Population 548 0.5%Noninstitutionalized Population 149 0.1%
Data Note: Households with children include any households with people under age 18, related or not. Multigenerational households are families with 3 or moreparent-child relationships. Unmarried partner households are usually classified as nonfamily households unless there is another member of the household related to thehouseholder. Multigenerational and unmarried partner households are reported only to the tract level. Esri estimated block group data, which is used to estimate polygonsor non-standard geography. Average family size excludes nonrelatives.Source: U.S. Census Bureau, Census 2010 Summary File 1.
May 15, 2013
©2013 Esri Page 10 of 12

Census 2010 Summary Profile
687 S Coast Highway 101, Encinitas, CA, Prepared by David StankaitisRing: 5 mile radius Latitude: 33.043900488
Longitude: -117.2935799
Family Households by Age of HouseholderTotal 31,316 100.0%
Householder Age 15 - 44 9,827 31.4%Householder Age 45 - 54 8,455 27.0%Householder Age 55 - 64 6,905 22.0%Householder Age 65 - 74 3,465 11.1%Householder Age 75+ 2,664 8.5%
Nonfamily Households by Age of HouseholderTotal 16,812 100.0%
Householder Age 15 - 44 5,511 32.8%Householder Age 45 - 54 2,884 17.2%Householder Age 55 - 64 3,249 19.3%Householder Age 65 - 74 2,043 12.2%Householder Age 75+ 3,125 18.6%
Households by Race of HouseholderTotal 48,127 100.0%
Householder is White Alone 43,199 89.8%Householder is Black Alone 330 0.7%Householder is American Indian Alone 171 0.4%Householder is Asian Alone 2,140 4.4%Householder is Pacific Islander Alone 71 0.1%Householder is Some Other Race Alone 1,285 2.7%Householder is Two or More Races 931 1.9%
Households with Hispanic Householder 3,933 8.2%
Husband-wife Families by Race of HouseholderTotal 25,748 100.0%
Householder is White Alone 22,935 89.1%Householder is Black Alone 159 0.6%Householder is American Indian Alone 87 0.3%Householder is Asian Alone 1,379 5.4%Householder is Pacific Islander Alone 30 0.1%Householder is Some Other Race Alone 683 2.7%Householder is Two or More Races 475 1.8%
Husband-wife Families with Hispanic Householder 2,081 8.1%
Other Families (No Spouse) by Race of HouseholderTotal 5,568 100.0%
Householder is White Alone 4,754 85.4%Householder is Black Alone 55 1.0%Householder is American Indian Alone 37 0.7%Householder is Asian Alone 210 3.8%Householder is Pacific Islander Alone 11 0.2%Householder is Some Other Race Alone 345 6.2%Householder is Two or More Races 156 2.8%
Other Families with Hispanic Householder 873 15.7%
Nonfamily Households by Race of HouseholderTotal 16,811 100.0%
Householder is White Alone 15,510 92.3%Householder is Black Alone 116 0.7%Householder is American Indian Alone 48 0.3%Householder is Asian Alone 550 3.3%Householder is Pacific Islander Alone 30 0.2%Householder is Some Other Race Alone 257 1.5%Householder is Two or More Races 300 1.8%
Nonfamily Households with Hispanic Householder 980 5.8%Source: U.S. Census Bureau, Census 2010 Summary File 1.
May 15, 2013
©2013 Esri Page 11 of 12

Census 2010 Summary Profile
687 S Coast Highway 101, Encinitas, CA, Prepared by David StankaitisRing: 5 mile radius Latitude: 33.043900488
Longitude: -117.2935799
Total Housing Units by OccupancyTotal 52,290 100.0%
Occupied Housing Units 48,127 92.0%Vacant Housing Units
For Rent 900 1.7%Rented, not Occupied 64 0.1%For Sale Only 406 0.8%Sold, not Occupied 136 0.3%For Seasonal/Recreational/Occasional Use 2,180 4.2%For Migrant Workers 1 0.0%Other Vacant 476 0.9%
Total Vacancy Rate 7.8%
Households by Tenure and Mortgage StatusTotal 48,127 100.0%
Owner Occupied 31,975 66.4%Owned with a Mortgage/Loan 25,452 52.9%Owned Free and Clear 6,523 13.6%Average Household Size 2.57
Renter Occupied 16,152 33.6%Average Household Size 2.27
Owner-occupied Housing Units by Race of HouseholderTotal 31,975 100.0%
Householder is White Alone 29,270 91.5%Householder is Black Alone 164 0.5%Householder is American Indian Alone 88 0.3%Householder is Asian Alone 1,531 4.8%Householder is Pacific Islander Alone 31 0.1%Householder is Some Other Race Alone 403 1.3%Householder is Two or More Races 488 1.5%
Owner-occupied Housing Units with Hispanic Householder 1,815 5.7%
Renter-occupied Housing Units by Race of HouseholderTotal 16,152 100.0%
Householder is White Alone 13,929 86.2%Householder is Black Alone 166 1.0%Householder is American Indian Alone 83 0.5%Householder is Asian Alone 609 3.8%Householder is Pacific Islander Alone 40 0.2%Householder is Some Other Race Alone 882 5.5%Householder is Two or More Races 443 2.7%
Renter-occupied Housing Units with Hispanic Householder 2,118 13.1%
Average Household Size by Race/Hispanic Origin of HouseholderHouseholder is White Alone 2.40Householder is Black Alone 2.53Householder is American Indian Alone 2.95Householder is Asian Alone 2.70Householder is Pacific Islander Alone 2.46Householder is Some Other Race Alone 3.94Householder is Two or More Races 2.83Householder is Hispanic 3.31
Source: U.S. Census Bureau, Census 2010 Summary File 1.
May 15, 2013
©2013 Esri Page 12 of 12