office of trade and labor affairs contract research program · office of trade and labor affairs...
TRANSCRIPT

U.S. Department of Labor
Bureau of International Labor Affairs
Office of Trade and Labor Affairs
Contract Research Program
Download this and other papers at
http://www.dol.gov/ilab/media/reports/otla/
The views expressed here are those of the author(s) and do not necessarily represent the views or official positions of the U.S. Government or the U.S. Department of Labor.

1
Trade in Services and U.S. Service Industry Employment and Wages
Robert E. Lipsey
Introduction
The purpose of this paper is to try to understand the implications of the apparent
expansions of U.S. export and import trade in services, the growth of U.S. firms’ service
production in foreign countries and foreign firms’ service production in the United States,
and the effects of these developments on the employment and wages of workers in the
service producing sector within the United States. It is an introduction to the problems of
interpreting the aggregate data on service trade that we hope to overcome later with the
use of individual firm data in the second stage of the study.
Much of the attention to this topic has isolated the “offshoring” of service
production as the only issue of interest, but we view the developments more broadly as
involving the evolution of production and consumption, transportation and
communication, in service industries. Geographical distances between producers and
consumers or between buyers and sellers, and the costs of bridging those distances, have
always been one of the determinants of trade and investment, in models and in history.
Great changes in the technology of transportation, one of the principal service industries,
reduced the cost of goods transportation in past centuries, and those reductions in costs
altered the geography of trade in goods. During the 19th Century, for example, the fall in
ocean transportation costs and the development of refrigerated transportation made the
United States the main supplier of grains and meats to Great Britain, driving continental
European suppliers out of the market despite their advantage in proximity. Among the
many ramifications of those developments was a rise in human migration. One grain

2
producer and former supplier to Great Britain, Sweden, lost to emigration to the United
States, during the late 19th and early 20th Centuries, about one and a half million people,
approximately a quarter of the average population of Sweden during those years
(Blomström, Lipsey, and Ohlsson, 1988, p. 5).
The fall in communication costs and the improvement in communications quality
in recent decades have probably been far larger than the earlier declines in transportation
costs on goods. For at least some services, communication costs are the equivalent of
transport costs on goods. The fall in communication costs may have similar implications
for many aspects of trade and production, widening the range of effects of differences in
factor proportions and factor prices for goods industries as well as service industries, but
especially the latter.
It is not only the data collection for service trade that is changing, but also the
organization of the production and sales of services. Articles in the Survey of Current
Business cite “…a continued shift of some affiliates’ activities away from manufacturing
and toward the provision of services, particularly in computer systems design and related
services...” Koncz and Flatness (2007, p. 108). In the other direction, Anderson (2008)
refers to “…the reorientation of some wholesale trade affiliates from importing
manufactured goods for sale in the United States to manufacturing goods at U.S.
facilities.” (p. 196, fn. 9).
Although there have been enormous improvements in the last few years in the
detail available for trade in services, the published data do not link the different types of
trade to the institutions carrying out the trade. Much of service trade involves, as actors,
firms operating mainly in other industries, and identified with those industries rather than

3
with service industries. That means that although our knowledge of the phenomenon of
trade in services has expanded, we cannot, without access to individual firm data, link the
activity of trade in services to the characteristics of the firms carrying out the trade or of
the workers whose employment and wages we wish to study. That will have to wait on
our ability to use, in the second part of the study, individual firm data that link the service
trade activity to the employment, wages, profits, and growth or decline of the firms
producing the services.
The United States in World Trade in Services
One way of describing the role of the United States in world trade in services is to
examine the trends in U.S. exports and imports of services, the cross-border trade
included in the balance of payments accounts, and the revealed comparative advantage of
the United States in that trade. Another way is to examine the provision of services to
foreign consumers by foreign affiliates of U.S. firms and the provision of services to U.S.
consumers by U.S. affiliates of foreign firms, much of which does not cross international
borders and is not reported in the balance of payments accounts, but is an alternative to
the cross-border trade.
For over a century, from the 1870s to the 1960s, the United States was more an
importer than an exporter of traded services. The largest identified elements of U.S.
exports and imports were transportation and travel services, except during the WW I and
WW II decades, when military expenditures overseas, which are considered imports of
services, were the largest service import. Transportation and travel services accounted
for about equal shares of imports, while transportation services dominated U.S. service

4
exports (U.S. Bureau of the Census, 1975, Series U 1-25). After that, the trend switched.
Exports began to surpass imports in the 1970s, and by increasing amounts through the
next few decades (Lipsey, 2009, Table 1A.2). In the period since 1990, after that year’s
recession, which reduced net exports sharply, they began to expand, growing from $66
billion in 2002 (Kornfeld, 2009, Table B) to $130 billion in 2007 and $144 billion in
2008, falling back to $136 billion in the twelve months ending in November 2009 (U.S.
Bureau of Economic Analysis, 2010).
One feature of U.S. trade in services, particularly technological service trade, is
that much of it takes place within firms. For several major categories of service trade,
intrafirm trade, or trade with affiliates, outweighs trade with unaffiliated firms. In the
case of royalties and license fees for industrial processes, trademarks, and computer
software, of $92 billion in receipts on exports from the United States in 2008, $56 billion
was from exports of technology by U.S. firms to their foreign affiliates, and another $ 4
billion from exports to their parent firms by U.S. affiliates of foreign firms. On
payments for imports of technology into the United States, out of $27 billion, U.S.
affiliates of foreign parents paid $15 billion to their foreign parents for technological
imports and U.S. parents paid $4 billion for such imports to their affiliates abroad (Koncz
–Bruner and Flatness, 2009, Table 4.2). Thus, of U.S. service trade in the form of
royalties and license fees, two-thirds of exports and about 70 percent of imports consisted
of intrafirm trade.
Among other U.S. service exports, Management, consulting, and public relations
services ($27 billion in 2008), Research, development, and testing services, ($17 billion),
and Advertising ($4 billion) were mostly intrafirm trade. Among U.S. service imports,

5
the same first two groups, along with Operational leasing and Installation, maintenance,
and repair of equipment, were mostly intrafirm trade. For that part of intrafirm service
trade that involves U.S. service industry firms and their foreign affiliates, we do have
some information about the actors and their labor forces, and we therefore concentrate
our attention on that part of the service trade universe.
It should also be noted that although we examine later some of the relationships
between the growth of U.S.-owned affiliates abroad and employment and wages in the
United States, the movement of the location of service activities is not a one way flow.
Although the data on foreign-owned service industry establishments in the United States
are not as full as on U.S. affiliates abroad, they do reveal a considerable amount of
service production in the United States by foreign-owned firms. In 2007, for example,
the value added in the United States by foreign-owned affiliates in several service
industries was not too far from the value added abroad by affiliates of U.S. firms (Table
1).
Table 1 Value Added by Affiliates in Selected Industries, 2007 By Industry of Affiliate ($ billion) _____________________________________________________________________ Nonbank Foreign Affiliates Majority-owned U.S. Affiliates
of U.S. Firms of Foreign Firms (MOFAs) (MOUSAs)
Wholesale Trade 152 96
Information 45 35
Finance & Insur.,exc. Dep. 52 51
Prof., Sci. & Technical 61 26
Other services 134 90 _____________________________________________________________________ Source: Barefoot and Mataloni (2009); Anderson and Zeile (2009).
6
U.S. firms did own somewhat larger operations abroad in terms of value added
than foreigners owned in the United States in these services, but the differences are not so
large as to justify ignoring the foreign-owned operations as a source of employment in
the United States. The one case for which the foreign-owned operations in the United
States are much smaller than U.S. firms’ service industry operations abroad, is the
category of Professional, Scientific, and Technical Services, as we might expect.
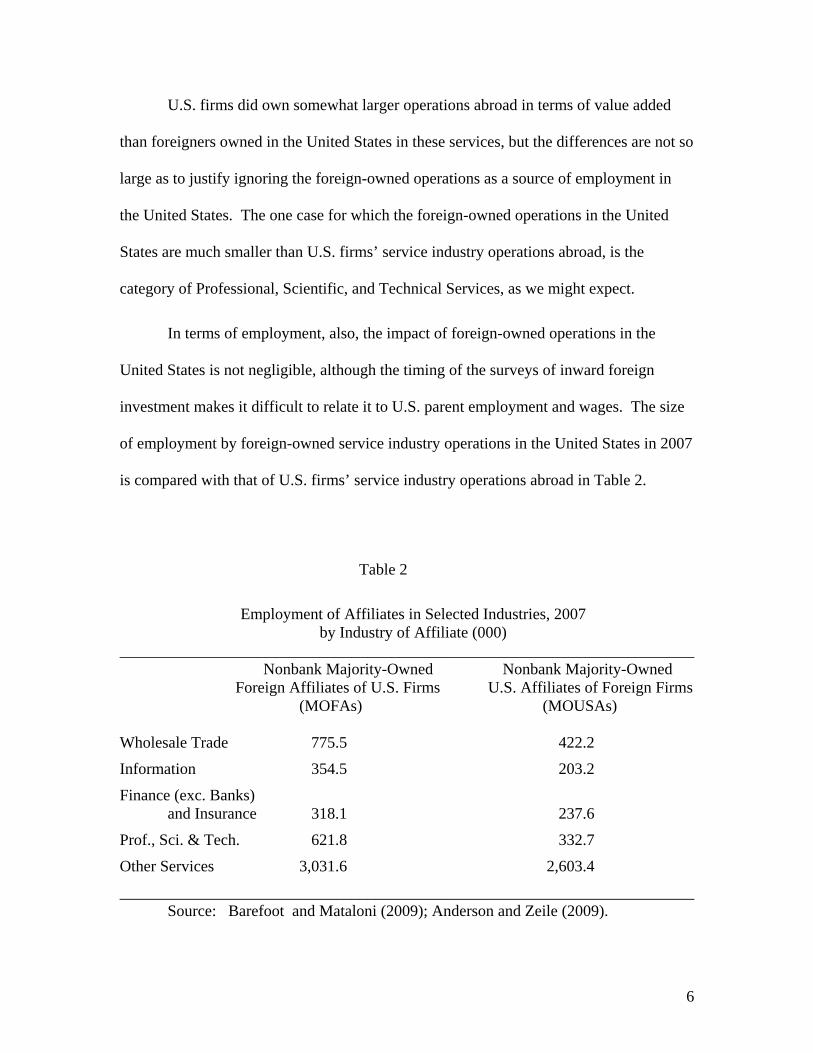
In terms of employment, also, the impact of foreign-owned operations in the
United States is not negligible, although the timing of the surveys of inward foreign
investment makes it difficult to relate it to U.S. parent employment and wages. The size
of employment by foreign-owned service industry operations in the United States in 2007
is compared with that of U.S. firms’ service industry operations abroad in Table 2.
Table 2
Employment of Affiliates in Selected Industries, 2007 by Industry of Affiliate (000)
________________________________________________________________________ Nonbank Majority-Owned Nonbank Majority-Owned Foreign Affiliates of U.S. Firms U.S. Affiliates of Foreign Firms (MOFAs) (MOUSAs) Wholesale Trade 775.5 422.2
Information 354.5 203.2
Finance (exc. Banks) and Insurance 318.1 237.6
Prof., Sci. & Tech. 621.8 332.7
Other Services 3,031.6 2,603.4
________________________________________________________________________ Source: Barefoot and Mataloni (2009); Anderson and Zeile (2009).

7
In the service industry sectors in which the United States and U.S. firms tend to be
leaders, Information and Professional, Scientific, and Technical services, and for which
fears of loss of U.S. leadership and U.S. employment are most often expressed, foreign
firms’ employment in the United States is a little over half as large as U.S. firms’
employment abroad. However, it is far from negligible, at close to one million
employees.
Comparative Advantage and U.S. Trade in Services
World production and consumption of services appear to be on a rising trend, but
the reasons for that trend are difficult to analyze because essential features of service
industries, such as production, consumption, prices, and trade are poorly covered by
statistical data. It is widely assumed that the growth of trade in services relative to
production of services and relative to trade in goods is partly accounted for by the decline
of communication costs. They play the same role in determining the size of service trade
that transportation costs play for the size of goods trade. Their role in the growth of
service trade in general will be discussed below.
A partial solution to the deficiencies of the data is to examine comparative trends
across countries, rather than absolute changes, in the hope that some of the defects of the
data are common across countries.
The U.S. share of world exports of a service reflects the suitability of the U.S. as a
site for production of that service. That suitability, in turn, reflects the efficiency with
which the service is produced in the United States, the prices of the factors of production
most used in producing it, and the demand for the service within the United States. These
factors, in combination, determine what is sometimes referred to as the “revealed
8
comparative advantage,” of the United States in that industry. The calculation is
explained more fully in Appendix A.
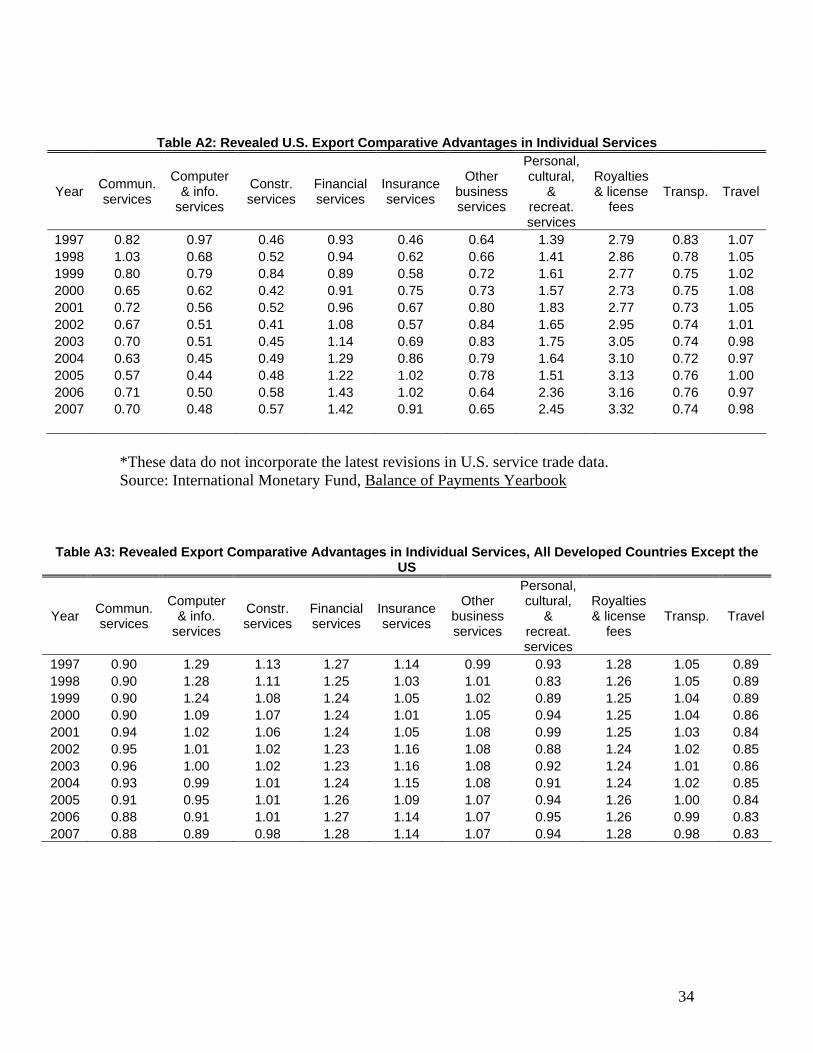
Some of the changes in U.S. revealed export comparative advantage have been
quite large in the ten years from 1997 through 2007, the most recent span of close to a
decade for fairly detailed export data covering a large part of the service exporting world.
The export comparative advantage of the United States in computer services fell by about
two thirds between 1997 and 2002, before stabilizing. In other words, the share of
Computer and Information Services in U.S. exports of services fell from about that of the
world, on average, to about half that of the world, and then remained roughly constant.
The shares that were in Finance (except depositary institutions), and especially in
insurance, increased substantially over the decade (Appendix A, Table A2), although the
next few years may present a different picture. Other services in which U.S. export
comparative advantage rose substantially were personal and cultural services, which
include education and medical services, and royalties, in both of which the U.S.
comparative advantage levels reached about 2&1/2 or 3. The largest comparative
advantage for the United States was in the item for royalties and license fees, principally
payments for exports to U.S. affiliates abroad, about half of which were for industrial
processes and most of the rest for trademarks and general use computer software. In
recent years, the U.S. share in exports of these services was more than three times the
overall U.S. share in exports of services.
The reported decline in the U.S. share of exports of computer services points to
the difficulty of measuring service exports and imports when the main input into
production is intangible. A newspaper story in 2005 reported that Microsoft had

9
transferred to an Irish affiliate in 1997 the ownership of software to be sold to European
customers (Wall Street Journal, November 7, 2005, p. 1). The story continued that the
subsidiary has “…a thin roster of employees…” and that the software was mainly
developed outside Ireland (Lipsey, 2006). The reported export data suggest that some
type of shift of ownership had taken place. Ireland, which had never reported exports of
computer services before, started reporting in 1998 with exports of over $5 billion, 40
percent higher than those of the United States. Ireland’s reported exports of computer
services reached $26 billion in 2007, more than twice those of the United States and its
export comparative advantage in computer services in the first year was over 15, while
that of the United States was about .98. A further curiosity appears in reported U.S.
imports of computer services, which jumped from $2 billion to $13 billion in 2006 after
eight years of gradual growth. It is unlikely that such an increase is genuine, and likely
that it represents either a corporate accounting change that transferred some technological
assets from a U.S. parent to a foreign affiliate or a change in the BEA’s treatment of
computer services.
The pattern of changes in export comparative advantage in services was not
uniform among developed countries, and it was quite different in the United States from
that in the other 26 developed countries as a group (Table A3). In computer services,
developed countries other than the United States showed a substantial, though decreasing
and eventually disappearing, export comparative advantage, with a peak at the beginning
of the period. Aside from computer services, other developed countries showed a
stronger position than the United States as exporters of construction services, and a
decline in comparative advantage in financial services while the United States was
10
advancing in that area, at least before the current financial crisis. Other developed
countries showed fairly stable export comparative advantages in transportation services,
in contrast to the U.S. comparative disadvantage. The United States was weak as an
exporter of Other business services, but showed strong and increasing export comparative
advantages in Personal and cultural services, which include education and health, and as
an exporter of technology, to judge by its strong comparative advantage in royalties.
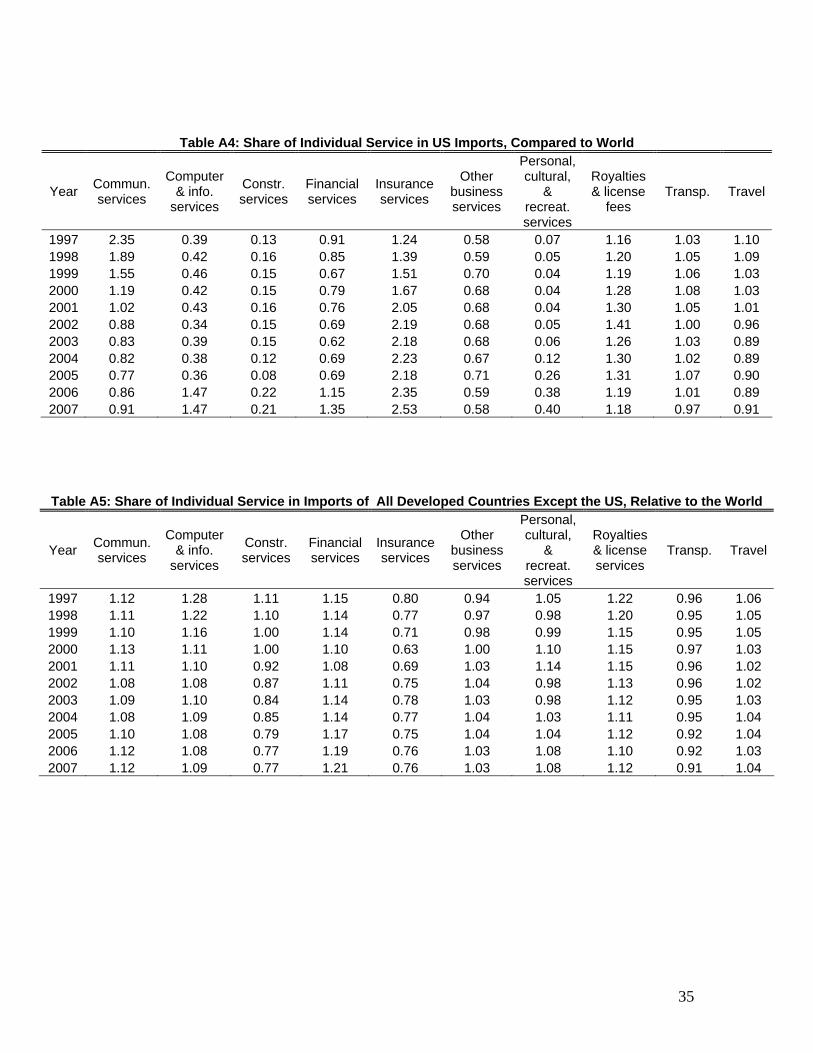
The United States was a particularly small importer of construction services and
of personal and cultural services compared to the rest of the world (Table A4). Its earlier
large share of communication services imports had disappeared by the end of the period
In computer services, there was a low level of imports until a suspicious jump in 2006
that is more likely to represent a corporate tax maneuver than a change in the source of
technology. The United States was a major importer of insurance services and a
somewhat smaller importer of technology, mainly payments to their parents by foreign-
owned affiliates in the United States.
Among developed countries outside the United States (Table A5), import shares
were somewhat high for communication services, computer services, financial services,
and technology, as represented by royalties. They declined from high to low levels in
construction services.
As might be expected, export comparative advantages in services for the 75 or so
developing countries for which we have data were very different from those of the
developed countries (Table A6). The strong comparative advantage in Communication
may reflect the growth of answering services, but the very large increase for computer
services may represent more of what future specialization may be like. Developing
11
countries have moved ahead as exporters of construction services and are also exporters
of personal and cultural services and of travel services, but hardly visible as exporters of
financial services. The high degree of specialization in insurance services may reflect the
nominal role of affiliates in low-tax countries, especially in reinsurance, although the
large role of Bermuda as an exporter to the United States is not visible in the Bermuda
trade data.
Aside from the changes in comparative advantage, which explain country shares
in the world’s exports and imports of services, a major explanation for the growth in
importance of service trade in general is the reduction in the cost of communication.
That is the cost of transportation of a service that applies to all producing countries. In
that case, the share of that service in every country’s exports and imports might rise, and
the share of that service in each country’s exports would be positively correlated with the
share in imports.
The detail on US service trade was very coarse until recently, but we can
compare, from the data in Koncz-Bruner and Flatness (2009), the correlation of changes
in export shares and changes in import shares for 11 services since 1997, 15 services
since 2001, and 27 services for the latest period, 2006 to 2008. For the two shorter
periods, there is no significant correlation between the share of a service in US exports of
services and the share in U.S. imports of services. However, for the longest period, since
1997, there is a significant positive correlation between the export and import shares. In
general, for the United States, if a service gained in its share in exports, it also gained it in
imports as well. That positive relationship suggests that changes in transport or
communications costs for the services, which affect exports and imports in the same

12
direction, rather than changes in the nature of US comparative advantage, were primarily
responsible for much of the growth of service trade. However, changes in measurement
and in definitions also produce parallel movements of export and import shares.
Another development that may explain some of the growth of service trade is the
increased effort to measure it. That increased effort is represented by the addition of
many new surveys in the United States, but also in parallel efforts in other countries.
Theoretically, the service trade not recorded specifically was nevertheless counted and
reported in catchall or miscellaneous categories, but it is likely that some of it was never
identified as services. There has also been an effort to identify service transactions
previously incorporated in measures of trade in goods, and move them to the service
category, although this affects mainly the measures of services supplied to foreigners by
U.S.-owned affiliates. One of the major changes has been the shift to treatment of
wholesale and retail trade services as a category of services supplied rather than burying
them as part of goods supplied. In 2007, for example, the calculation added $263 billion
in wholesale and retail trade services supplied to foreign residents through U.S. MOFAs
(Majority-Owned Foreign Affiliates) to previously estimated U.S. MOFA sales of
services to foreign residents of $701 billion in all services (Koncz-Bruner and Flatness,
2009, Table G). The same conceptual change on the side of services supplied to U.S.
residents through MOUSAs (Majority-Owned US Affiliates) of foreign firms added $202
billion to the former measure of sales of services to U.S. residents of $484 billion.
Changes in U.S. service trade and in U.S. service industry employment and wages
The linking of changes in U.S. service trade to changes in employment and wages
in the U.S. as a whole and in U.S. service industry firms is difficult. That is partly
13
because the measurement of service trade is uncertain and changing substantially, and
partly because comprehensive data on the U.S. labor force in services are difficult to
match with the trade data. One way to link the labor and trade changes is to trace them
within the firms that have played a large part in the changes in service trade, U.S. service
industry multinationals operating in the United States and foreign countries, and foreign-
owned service industry multinationals operating in their home countries and also in the
United States and other countries. Our reliance on these data is encouraged by the
judgment by the BEA that “…direct investment is the larger channel of delivery for both
U.S. sales and U.S. purchases of services in international markets…” (Koncz and
Flatness, 2008, p. 20).
The wage data available in BEA data are average wages, and employment is total
employment, not distinguished by type of labor in terms of skill, occupation, or
education. It is therefore not possible with these data to distinguish between changes in
the wage for given types of labor and changes in the composition of the labor force, a
distinction that would require matched employer-employee data that are not part of this
study and would require a separate project.
Employment in U.S. affiliates and in parent firms at home
One possible source of any impact on U.S. labor of U.S. multinational firm
(MNC) trade in services and production of services abroad is the competition in the world
market between services produced by the parent firms in the United States and services
produced by foreign affiliates of U.S. firms and sold in their host countries or exported to
the United States and to other countries. If we judge by employment, there are strong
indications that employment grew more quickly in the foreign affiliates than in the parent

14
companies in a majority of the service industries. One extreme exception was the
category of “Management of nonbank companies and enterprises,” which involved a
change in definition that added to “management and consulting services” allocated
expenses charged by a parent company to its affiliates for “general overhead and
stewardship” (Koncz and Flatness, 2008, p. 34). The management and consulting
services industry has been eliminated in all the regressions in the following tables
because the coverage of the category changes sharply between beginning and end years..
Aside from that one industry, there was only a positive, but weak relationship
between the growth of employment in the foreign affiliates of firms in an industry and
that in U.S. parent firms in the same industry (Table 3). The relationship was marginally
significant in the comparison of 2005-2007 to 1999-2001.
There was a general tendency for U.S. service industry firms to shift their
employment toward their foreign locations. The growth of employment by parent
companies in a U.S. service industry was positively related to the growth of employment
abroad in affiliates in that industry but the relationship was significant only at the 10
percent level (Table 3). Thus, across U.S. service industries, there is no evidence linking
faster growth in overseas employment in general to slower growth in home (U.S.)
employment and weak evidence that employment growth at home and abroad were
positively related.
Since most worries about the effects of overseas service production are about the
competition of overseas affiliates in low income countries, we crudely test this possibility
by dividing overseas service operation between those in developed (higher- income) and

15
Table 3
Regressions relating the growth of employment in U.S. parent firms in the United States to the growth of total employment in U.S. nonbank affiliates abroad,
and in developed and developing countries a
________________________________________________________________________ 28 service industries
2007/1999 Coefficient of affiliate employment & standard error .167(.189) Adj. RSQ & Prob. > F -.008(.388) Coefficients for developed and developing countries Developed -.123(.190) Developing -.063(.019) Adj. RSQ & Prob.> F .252(.010) 25 service industries (2005-2007)/(1999-2001) Coefficient of affiliate employment & standard error .198(.107) Adj. RSQ & Prob. > F .092(.077)
Coefficients for affiliate employment in developed and developing countries Developed .361(.187) Developing -.127(034) Adj. RSQ & Prob. > F .328(.004) ________________________________________________________________________ a These are approximate identifications. The country breakdowns in published BEA data permit only rough assignments to the two groups. Developed countries are defined here as Canada, Europe, Japan, and Australia, and all others are defined as developing.
those in developing (lower- income) countries. The test must be crude because we do not
have data for individual firms at present, as we will eventually, or complete country
distributions of affiliates. We must therefore rely on industry data to divide affiliates
between those industries in which affiliates are mostly located in developed countries and
those in which they are mostly located in developing countries.
The results of this test are that adding more employees in service industry
affiliates in developing countries is significantly associated with slower growth of

16
employment in the parent firm at home. Adding employees in affiliates in developed
countries seems to result in larger employment in the parent firm, although that
relationship is not as strong.
If we wish to include the growth of MOUSAs (Majority-Owned U.S. Affiliates)
of foreign firms in the United States in the explanation of changes in U.S. parent firm
employment and wages, many compromises must be made. For example, the dates of the
BEA’s inward investment surveys do not match the dates of the outward surveys, the
published industry breakdowns in the two surveys do not match, and some quantities
must be estimated by using midpoints of published ranges rather than exact measures.
Some rough calculations on the available data, incorporating the necessary compromises,
are shown in Table 4.
Table 4
The Relation of U.S. Service Industry Parent Employment to Employment in U.S. MOFAs in Developed and Developing Countries and
Foreign MOUSAs from Developed and Developing Countries* 1999-2007
12 service industries Coefficient of MOFA employment in, and standard error Developed countries .133 (.130) Developing countries -.034(.052) Coefficient of MOUSA employment from, and standard error Developed countries -.047 (.024) Developing countries -.0003 (.003) Adj. RSQ & Prob. > F .122 (.332) *See Table 3

17
As in the second set of equations in Table 3, increases in MOFA employment in
developed countries were associated with increases in parent employment, but increases
in employment in developing country MOFA employment were associated with
decreases at home. Neither coefficient is statistically significant. Increases in
employment in MOUSAs were a negative influence on U.S. parent employment,
although the only coefficient close to statistical significance was the one for affiliates of
developed country firms.
Employment in U.S. affiliates abroad and wages in parent firms at home
Another effect of producing abroad might be to reduce or hold back on increases
in the wage levels of workers in the United States, as firms expand their activities abroad.
Table 5 gives the results of a test of that possibility, relating the growth of affiliate
employment over the latest 5 years or so to the growth in parent wage levels.
We find no statistically significant relationships in these equations. The closest
seems to be that in industries in which overseas employment grew in developed
countries, parent firm wage levels tended to rise more than in other industries, but it
should be stressed that no statistically significant differences emerged.
The results for average wages are less definitive than those for parent
employment. There is no clear evidence that more rapid additions to employment in
affiliates, at least at the levels of such additions in this period, affected wages in the
parent firms, whether the employment was added in developed or developing countries.
Another possible influence of international investment on wages is through the
effect of foreign firms’ service industry operations in the United States on wages in U.S.

18
Table 5
Regressions between growth of employment in U.S. nonbank affiliates abroad and
growth in average wages in U.S. parent firms in the United States a
______________________________________________________________________ 29 service industries
2007/1999 Coefficient of affiliate employment and standard error -.083(.106) Adj. RSQ & Prob. >F -0.014(.437) Coefficients for Employment in Developed and Developing Countries Developed .091(.112) Developing -.004(.011) Adj. RSQ & Prob. > F -0.04(.655) 26 service industries (2005-2007)/(1999-2001) Coefficient of affiliate employment and standard error -.159(.088)
Adj. RSQ & Prob.>F .083(.084) Coefficients for Employment in Developed and Developing Countries Developed -.160(.113) Developing -.016(.021) Adj. RSQ & Prob.> F .065(.171)
______________________________________________________________________ a See Table 3.
parent service firms’ operations within the United States. That possible influence is
explored in Table 6.
The results for average wages are less definitive than those for parent
employment. There is no clear evidence that more rapid additions to employment in
affiliates, at least at the levels of such additions in this period, affected wages in the
parent firms, whether the employment was added in developed or developing countries.

19
Table 6
Regressions relating growth in average wages in U.S. parent firms in service industries to employment in U.S. service industry MOFAs and foreign MOUSAs
in the United States, 1999-2007* 12 service industries Coefficient of MOFA employment in, and standard error Developed countries .265 (.127) Developing countries -.122 (.051) Coefficient of MOUSA employment from, and standard error Developed countries .017 (.024) Developing countries .007 (.003) Adj. RSQ & Prob.> F .378 (.122) __________________________________________________________________
*See Table 3
Another possible influence of international investment on wages is through the
effect of foreign firms’ service industry operations in the United States on wages in U.S.
parent service firms’ operations within the United States. That possible influence is
explored in Table 6.
While these calculations should not be given great weight because of the
weakness of the data used, including the small number of service industries for which we
could roughly match inward and outward FDI data, they do tend to confirm some
impressions from other sources. In particular, they reinforce the suggestion that service
firms’ investments in developed countries have different functions and different
consequences from investments in developing countries. Additions to employment in
U.S. service industry affiliates in developed countries are associated with increases in
average parent wages in the United States. That increase might reflect a shift to higher-

20
skill services at home in the United States, as medium-skill services move to other
developed countries. It would also be compatible with the possibility that U.S. industries
expanding in developed countries abroad are the ones that are prospering and widening
their markets. On the other hand, growth of employment in developing countries was
associated with lower wages in the parent companies in the United States, as if the firms
that invest in low-income countries have abandoned some of their higher-skilled services
but are left with a core of immovable low-skill services. The growth of employment in
the United States of affiliates of developed-country firms does not have any visible
impact on U.S. parent wages but growth in employment in affiliates of developing-
country firms tends to raise average U.S. parent wages, as might be the case if these
affiliates tended to drive U.S. parents out of low-skill services.
These are speculations that can only be suggested by these inadequate data on
whole industries. They cannot yield strong conclusions, but do suggest possibilities to
check in the second phase of the study with individual firm data.
Some useful evidence on changes in the composition of the U.S. service sector
labor force as a whole is given in a recent paper by Ebenstein, Harrison, McMillan, and
Phillips (2009) based on the Census Bureau’s CPS data. They divide the Service sector
labor force from 1979 through 2002, by level of education, ranging from Less than high
school, the lowest level, through High-school degree, Some college, College degree, and
Advanced degree. The employment pattern shifted substantially among the groups, with
a large decline in the lowest education class, much of it concentrated in recessions, but
adding up to a substantial reduction in the share of that group in total employment over
the period. The share of high school graduates increased, with only minor fluctuations,
21
but the rate of increase diminished over time. The share of workers with college degrees
or advanced degrees increased at an accelerating rate. The sharp differences among the
trends in education groups’ shares of the service labor force as a whole suggest that any
findings about changes in average wages in particular industries or firms could reflect
changes in labor force composition. That was apparently the case for the service industry
labor force as a whole and could, therefore, be more important for some of the individual
industries in our wage calculations or for individual firms in our future calculations..
The advantage of comparing affiliate employment growth with parent
employment and wage growth is that the data are available for the same classification of
industries. A parallel analysis can be carried out for employment in foreign affiliates of
U.S. firms and employment and wages in all firms in the same industries in the United
States, but it is confined to the period 2002-2007 for an exact match of the industries in
the two data sets.
The relation between growth in U.S. affiliate employment abroad and growth in
the same industries in the United States is described in Table 7. In industries in which
U.S. multinational firms expanded their employment abroad within their affiliates in
high-income countries, U.S. domestic employment also rose. There is no indication from
the employment data that these overseas expansions in high-income county affiliates
came at the expense of employment in the same industries at home. The data suggest
instead the impact of rising demand for services of these industries in both the United
States and other high-income countries, combined with the comparative advantage of
U.S. multinationals in these industries on the employment of workers in these industries
both at home and abroad.

22
Table 7
Regression between growth of employment in U.S. nonbank affiliates abroad and growth of employment in the corresponding industries in the United States, 2002-2007 a
23 service industries
Coefficient of affiliate employment and standard error .147 (.038)
Adj. RSQ & Prob.>F 0.374 (.001)
Coefficients for employment in developed and developing countries
Developed .169 (.060)
Developing .002 (.006)
Adj. RSQ & Prob. > F .231 (.031)
__________________________________________________________________ a See Table 3.
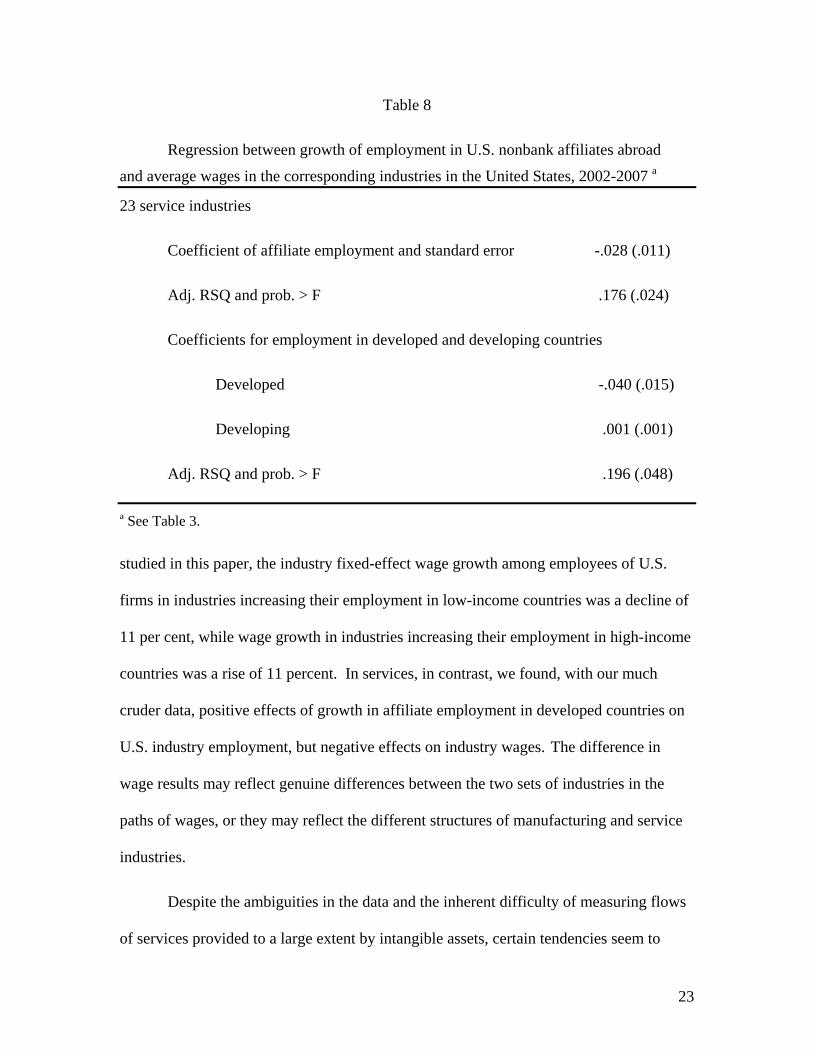
High growth of employment in U.S. service firms’ affiliates in developed
countries did correspond with low wage growth in the same industries at home, as if the
employment abroad competed with expansion at home in the industry as a whole, even if
not significantly with expansion of employment in the parent firms (Table 8).
A Comparison with the Results for Manufacturing
The Ebenstein et al. (2009) paper deals mostly with employment and wages in
manufacturing, but it is useful to compare some of the results with those we find in
service industries. Their paper finds strong relationships between a U.S. employee’s
predicted wage level growth and the growth of affiliate employment by the industry in
low-income and high-income countries. For 1997-2002, the period closest to the one
23
Table 8
Regression between growth of employment in U.S. nonbank affiliates abroad
and average wages in the corresponding industries in the United States, 2002-2007 a
23 service industries
Coefficient of affiliate employment and standard error -.028 (.011)
Adj. RSQ and prob. > F .176 (.024)
Coefficients for employment in developed and developing countries
Developed -.040 (.015)
Developing .001 (.001)
Adj. RSQ and prob. > F .196 (.048)
a See Table 3.
studied in this paper, the industry fixed-effect wage growth among employees of U.S.
firms in industries increasing their employment in low-income countries was a decline of
11 per cent, while wage growth in industries increasing their employment in high-income
countries was a rise of 11 percent. In services, in contrast, we found, with our much
cruder data, positive effects of growth in affiliate employment in developed countries on
U.S. industry employment, but negative effects on industry wages. The difference in
wage results may reflect genuine differences between the two sets of industries in the
paths of wages, or they may reflect the different structures of manufacturing and service
industries.
Despite the ambiguities in the data and the inherent difficulty of measuring flows
of services provided to a large extent by intangible assets, certain tendencies seem to

24
emerge, similar for services to what has been observed for goods. The role of technology
and worker skill levels in determining the preservation or enlargement of the number of
jobs is one, reflected in the types of services in which the United States has retained or
increased its comparative advantage. It is also reflected in the more positive effects on
parent employment of the parent’s production in developed countries.
The same implications of the skill bias of shifts in trade in services appear in a
study by Kierkegaard (2008), with an emphasis on IT services. “Low-wage/low-skilled
IT-related jobs are swiftly disappearing, while high-wage/high-skilled IT-related jobs
continue to be created at a brisk pace.” (p. 413).
While it may appear that parent production in high- and low-income countries are
two aspects of the same phenomenon, they may not be. Production in low-income
countries is more likely to represent a defensive reaction for the parent. It is a way of
exiting from a line of production no longer viable in the home country because of
changes in cost or technology, without losing all the capital, in terms of consumer good
will, brand names, consumer familiarity and confidence, and technological knowledge
that the firm has accumulated. Production in high-income countries is more likely to
represent an expansion of a successful continuing operation, still in the growing stage,
that has outgrown the limitations of the home market. One is intended as a substitution
of one production location for another and the other is intended as an expansion of
production.
In the current recession, trade in services has been much more resilient than trade
in goods (Borchert and Mattoo, 2009). It is less dependent than goods trade on financing,
since production and consumption are simultaneous, or close to it in many cases, it is not
25
subject to the fragmentation that tends to magnify the effects of goods trade declines by
counting the same products several times as they pass along a firm’s production chain,
and the demand for services is, in general, less income-elastic than demand for goods.
The authors fear that the contribution of service trade to recovery and growth is
threatened by the many protectionist moves incorporated into various countries’ stimulus
measures.
Concluding Remarks The uncertainties surrounding the data on trade in services and their relation to
data on the domestic economy make any conclusions about the effects of trade tentative
and subject to error, especially until the second part of the study, based on individual firm
data, has been completed. However, several aspects of the aggregate data seem to point
to at least a rough picture of the direction in which trade in services is moving the
economy.
Perhaps the strongest fear about the effects of trade in services, accentuated by the
shock of rising imports of relatively skill-intensive services, was that the large decline in
costs of communication was leading to a loss of domestic markets for worker skills,
formerly protected by high costs of communication, biases against foreign service
suppliers, and low skills in foreign labor forces. That anxiety produced a flood of studies
of “offshoring” or “foreign outsourcing” and of projections of possible future job and
wage losses for American workers. While the increase in foreign worker and foreign
firm skill levels continues, it appears that the consequences are more complex than
predicted at first.
26
Our own survey and analysis of the data suggests several aspects of service
industry trade and investment that indicate that the impacts on employment and wages
are, at least so far, not as unfavorable as has been projected. One is that the United States
has continued to enjoy a strong and so far increasing, comparative advantage in exports
of technology, as represented by royalties and license fees. Other comparative
advantages in exporting of services are in insurance and other financial services, and
particularly in personal, cultural, and recreational services. Most of these are high-skill
services and the lead of the United States over both other developed and developing
countries seems to be undisturbed. The main exception, computer and information
services, where the U.S. appears to export very little, seems to be affected by differences
between the United States and other countries in the way the data are classified and by
the tendency of U.S. multinational firms to transfer these assets to their affiliates in other
countries with lower corporate tax rates. The comparative advantage of the United States
in cross-border trade in high-skill services is magnified if the supply of services to
foreigners through affiliates of U.S. firms is included.
Our tests of effects of US firms’ foreign operations on domestic employment and
wages were inconclusive, but mostly suggested that high employee skill remains a basis
for the success of U.S. firms and their participation in trade in services. One indication of
this link is that the growth of affiliate employment in developed countries, presumably
relatively skilled, tends to be associated with increases in home employment, while
growth in developing countries, presumably lower skilled, is more frequently associated
with decreases in employment at home. Within the United States, it is the growth in
employment of firms from developed countries, presumably relatively skilled, that seems

27
to compete with U.S. parent employment. Wage relationships were weak, but there is
some indication that more employment in affiliates of developed country firms, was
associated with lower wages in U.S. parents, but higher wages in the whole U.S.
industries in which they operated.
One interpretation of the effects of U.S. firms’ operations is that expansions of
U.S. affiliates in developed countries are very different in motivation and effects from
expansions in developing countries. The former may be thought of as “aggressive”
expansions by firms that are prospering in the United States and want to exploit their firm
technologies or other firm-specific comparative advantages in wider markets. The latter
are “defensive” expansions that are by firms that no longer find it as profitable to produce
in the United States because of changes in costs or competition, but wish to continue to
produce where costs are more suitable in order to continue to exploit their capital in the
form of consumer loyalty, reputation for quality, or other firm-specific assets. Because
the motivations are different, the effects of an increase in foreign operations are different.
The firms that expand in high-income countries are expanding markets, not at the
expense of home production. The firms that expand in low-income countries are
replacing uneconomical home production with more economical foreign production, but
are not mainly expanding their markets.
We expect different responses of parent employment and wages in these two
cases. The results only sporadically fit the expectation, but rarely showed the opposite
relationships. We hope that the work with individual firm data will confirm or disprove
this speculation.

28
More broadly, we do not find that expansions of service production abroad
substitute for service production that would otherwise take place in the United States
Although we do not have direct indicators of employee skills, several of the other studies
cited do, and they point to the continued specialization of the United States in services
(and goods) embodying high skills, at least so far. The study of IT employment by
Kierkegaard emphasizes that dependence for the IT industry, but it is probably more
general than that. The crucial issue may be how to maintain and increase skill levels
rather than how to affect trade flows.

29
Appendix A: Data on Trade in Services
Any present study of the determinants and consequences of U.S. trade in services
must be a work in progress, because not only is the trade changing rapidly, but the data
available to study it are changing even faster. The main reason for the changes in data
availability is the growing number of surveys conducted by the Bureau of Economic
Analysis (BEA) of the U.S. Department of Commerce. The improvements in the BEA
data from 1990 through 2003 are summarized in Borga and Mann (2003), and subsequent
additions and improvements are described in the October articles on Service trade in later
years in the Survey of Current Business. That growth stemmed from the realization that
the basis for analysis of the implications of trade in services was very weak. As a result
of the expansion in knowledge, there have been large changes in the definitions and
measures of U.S. trade in various services and its attribution to producing industries. A
few of these recent changes and the problems they raise for analysis, are illustrated by
Table A1, which compares, for two types of service, the estimates of U.S. exports and
imports of services in 2006 between two recent BEA reports, the 2007 and 2008 annual
Survey of Current Business articles on trade in services.

30
Table A1
U.S. Exports and Imports of Selected Services, 2006, as Reported in 2007, 2008, and 2009
($ billion) ________________________________________________________________________ Reported in
2007 2008________2009 U.S. Exports of Services Royalties and License Fees $62 $72 $71 Financial Services 43 47 48 Bus., Prof., and Tech. Services 96 90 86 Management & Consulting Services 7 22 21 Operational Leasing 11 10 6 Other Bus, Prof.., Tech. Services 55 34 36 U.S. Imports of Services Bus., Prof., &Tech Services 58 61 61 Computer & Information Services 11 14 13 Management & Consulting Services 7 19 19 Other Bus., Prof., & Tech. Services 29 18 18 ________________________________________________________________________ Source: Koncz and Flatness, 2007 and 2008; Koncz-Bruner and Flatness, 2009. The largest changes, in management and consulting services, are attributed to a
recognition as international flows of services of parent firm charges to affiliates for
parent services to them.
The revisions in concepts of service trade also encompass the treatment of the
delivery of services to consumers in one country by affiliates of firms headquartered in
another country as a form of trade in services even though they do not appear in trade
data in the balance of payments. For many services provided to foreign consumers by
U.S. firms and to the United States by foreign-owned firms, delivery is mainly through
U.S.-owned affiliates in foreign countries and through foreign-owned affiliates in the
United States. For example, the earlier estimate of “sales of services” by U.S. majority-

31
owned affiliates to foreign countries in 2005 was $528 billion, while the later estimate of
“services supplied” was $725 billion (Koncz and Flatness, 2008, p. 38). The largest
additions were for wholesale and retail trade services, transferred from manufacturing,
where they had been hidden in the prices of manufactured goods. In the United States,
the largest increases from estimates of sales of services to services supplied by majority-
owned affiliates of foreign-owned firms was also for wholesale and retail trade, partly
offset by a reduction in the estimate of insurance services, adding up to a revision from
$388 billion to $527 billion (ibid.).
Although it is common to speak about exports and imports of services as
analogous to exports and imports of goods, the meaning of the terms “exports” and
“imports” is different in the goods and services universes, and the differences account for
many of the difficulties of measuring trade in services. The measurement of exports and
imports of goods has been governed by rules set forth in United Nations (2004) and by
the United Nations Statistical Commission, amplified by United Nations (2008), basing
the concepts on the event of the crossing of a national border. The measurement of goods
trade for the balance of payments is different in principle; it has as its objective the
measurement of changes in the ownership of goods between residents and non-residents
of a country. However, since the great majority of changes in ownership take place in
connection with the movement of goods across national borders, the distinction between
the two measures is not of great quantitative importance, aside from the separation of
insurance and freight costs from the prices of imported goods and their transfer to the
service accounts.

32
The story is very different for trade in services. Exports and imports of services
frequently cannot be observed crossing national borders, and in many cases, do not cross
national borders. They are part of the balance-of-payments universe, and many of the
difficulties of measurement arise from the fact that many service trades cannot be
observed. Since they cannot be observed, they are subject to manipulation to reduce
corporate income taxes. That is a subject on which there is an extensive literature
applying to the United States and many other countries, some of which is referred to in
Lipsey (2008), pp. 46-47.
The core problem of the measurement of output, and especially trade, in services
is that a large part of the input is either financial assets or intangible assets such as
production or distribution techniques, patents, copyrights, trademarks, corporate logos,
computer programs, designs, etc. The reported location of these assets can be shifted
around the world by the firms that own them, moving their reported location from where
they are produced, if that can even be identified, to locations in low tax countries. These
countries then appear in the data as the producers and exporters of the services from these
assets, although they did not create them and may contribute nothing to the production
from them except their low tax regimes.
The main sources for data on trade in services covering many countries are the
International Monetary Fund Balance of Payment Statistical Yearbooks and CD-ROM,
but many countries that report to the IMF do not report exports and imports of services.
In order to follow world trends, we construct a fixed panel of approximately 150
countries that have reported service exports and imports to the IMF for the period from
1997 through 2007. Not every country reports trade in every service category, even the

33
broad ones we use, and we can only assume that the countries that omit a category are not
major exporters in it. The categories reported by almost all respondents are travel and
transportation and “Other business services” aside from computer and information
services, financial services, and insurance. The smallest number of reported exporters is
for royalties.
We use the export distributions by type of service to calculate measures of
“revealed comparative advantage.” These are analogous to the measure for goods export
defined in Balassa (1965), except that these measures might be better described as
“revealed comparative advantage in exports of services,” since it is the share of a service
in a country’s exports of services compared to the share of that service in the service
exports of the roughly 150 countries that we treat as the world.. Table A2 through A6
report our calculations of revealed comparative advantage in service exports for several
groupings of countries and an analogous calculation for U.S. service imports. We treated
as developed, following the IMF World Economic Outlook, 27 entities, Australia,
Austria, Belgium, Canada, Cyprus, Denmark, Finland, France, Germany, Greece, Hong
Kong, Luxembourg, Netherlands, New Zealand, Norway, Portugal Singapore, Spain,
Sweden, Switzerland, The United Kingdom,.and the United States. The data for New
Zealand appeared to contain a large discontinuity in 2003 and were roughly adjusted to
eliminate it.
34
Table A2: Revealed U.S. Export Comparative Advantages in Individual Services
Year Commun. services
Computer & info.
services
Constr. services
Financial services
Insurance services
Other business services
Personal, cultural,
& recreat. services
Royalties & license
fees Transp. Travel
1997 0.82 0.97 0.46 0.93 0.46 0.64 1.39 2.79 0.83 1.07 1998 1.03 0.68 0.52 0.94 0.62 0.66 1.41 2.86 0.78 1.05 1999 0.80 0.79 0.84 0.89 0.58 0.72 1.61 2.77 0.75 1.02 2000 0.65 0.62 0.42 0.91 0.75 0.73 1.57 2.73 0.75 1.08 2001 0.72 0.56 0.52 0.96 0.67 0.80 1.83 2.77 0.73 1.05 2002 0.67 0.51 0.41 1.08 0.57 0.84 1.65 2.95 0.74 1.01 2003 0.70 0.51 0.45 1.14 0.69 0.83 1.75 3.05 0.74 0.98 2004 0.63 0.45 0.49 1.29 0.86 0.79 1.64 3.10 0.72 0.97 2005 0.57 0.44 0.48 1.22 1.02 0.78 1.51 3.13 0.76 1.00 2006 0.71 0.50 0.58 1.43 1.02 0.64 2.36 3.16 0.76 0.97 2007 0.70 0.48 0.57 1.42 0.91 0.65 2.45 3.32 0.74 0.98
*These data do not incorporate the latest revisions in U.S. service trade data. Source: International Monetary Fund, Balance of Payments Yearbook
Table A3: Revealed Export Comparative Advantages in Individual Services, All Developed Countries Except the
US
Year Commun. services
Computer & info.
services
Constr. services
Financial services
Insurance services
Other business services
Personal, cultural,
& recreat. services
Royalties & license
fees Transp. Travel
1997 0.90 1.29 1.13 1.27 1.14 0.99 0.93 1.28 1.05 0.89 1998 0.90 1.28 1.11 1.25 1.03 1.01 0.83 1.26 1.05 0.89 1999 0.90 1.24 1.08 1.24 1.05 1.02 0.89 1.25 1.04 0.89 2000 0.90 1.09 1.07 1.24 1.01 1.05 0.94 1.25 1.04 0.86 2001 0.94 1.02 1.06 1.24 1.05 1.08 0.99 1.25 1.03 0.84 2002 0.95 1.01 1.02 1.23 1.16 1.08 0.88 1.24 1.02 0.85 2003 0.96 1.00 1.02 1.23 1.16 1.08 0.92 1.24 1.01 0.86 2004 0.93 0.99 1.01 1.24 1.15 1.08 0.91 1.24 1.02 0.85 2005 0.91 0.95 1.01 1.26 1.09 1.07 0.94 1.26 1.00 0.84 2006 0.88 0.91 1.01 1.27 1.14 1.07 0.95 1.26 0.99 0.83 2007 0.88 0.89 0.98 1.28 1.14 1.07 0.94 1.28 0.98 0.83
35
Table A4: Share of Individual Service in US Imports, Compared to World
Year Commun. services
Computer & info.
services
Constr. services
Financial services
Insurance services
Other business services
Personal, cultural,
& recreat. services
Royalties & license
fees Transp. Travel
1997 2.35 0.39 0.13 0.91 1.24 0.58 0.07 1.16 1.03 1.10 1998 1.89 0.42 0.16 0.85 1.39 0.59 0.05 1.20 1.05 1.09 1999 1.55 0.46 0.15 0.67 1.51 0.70 0.04 1.19 1.06 1.03 2000 1.19 0.42 0.15 0.79 1.67 0.68 0.04 1.28 1.08 1.03 2001 1.02 0.43 0.16 0.76 2.05 0.68 0.04 1.30 1.05 1.01 2002 0.88 0.34 0.15 0.69 2.19 0.68 0.05 1.41 1.00 0.96 2003 0.83 0.39 0.15 0.62 2.18 0.68 0.06 1.26 1.03 0.89 2004 0.82 0.38 0.12 0.69 2.23 0.67 0.12 1.30 1.02 0.89 2005 0.77 0.36 0.08 0.69 2.18 0.71 0.26 1.31 1.07 0.90 2006 0.86 1.47 0.22 1.15 2.35 0.59 0.38 1.19 1.01 0.89 2007 0.91 1.47 0.21 1.35 2.53 0.58 0.40 1.18 0.97 0.91
Table A5: Share of Individual Service in Imports of All Developed Countries Except the US, Relative to the World
Year Commun. services
Computer & info.
services
Constr. services
Financial services
Insurance services
Other business services
Personal, cultural,
& recreat. services
Royalties & license services
Transp. Travel
1997 1.12 1.28 1.11 1.15 0.80 0.94 1.05 1.22 0.96 1.06 1998 1.11 1.22 1.10 1.14 0.77 0.97 0.98 1.20 0.95 1.05 1999 1.10 1.16 1.00 1.14 0.71 0.98 0.99 1.15 0.95 1.05 2000 1.13 1.11 1.00 1.10 0.63 1.00 1.10 1.15 0.97 1.03 2001 1.11 1.10 0.92 1.08 0.69 1.03 1.14 1.15 0.96 1.02 2002 1.08 1.08 0.87 1.11 0.75 1.04 0.98 1.13 0.96 1.02 2003 1.09 1.10 0.84 1.14 0.78 1.03 0.98 1.12 0.95 1.03 2004 1.08 1.09 0.85 1.14 0.77 1.04 1.03 1.11 0.95 1.04 2005 1.10 1.08 0.79 1.17 0.75 1.04 1.04 1.12 0.92 1.04 2006 1.12 1.08 0.77 1.19 0.76 1.03 1.08 1.10 0.92 1.03 2007 1.12 1.09 0.77 1.21 0.76 1.03 1.08 1.12 0.91 1.04

36
Table A6: Revealed Export Comparative Advantages in Individual Services: All Developing Countries
Year Commun. services
Computer & info.
services
Constr. services
Financial services
Insurance services
Other business services
Personal, cultural,
& recreat. services
Royalties & license
fees Transp. Travel
1997 1.30 0.14 0.60 0.20 0.59 1.03 1.19 0.17 0.85 1.33 1998 1.33 0.11 0.63 0.20 0.91 0.96 1.57 0.15 0.85 1.37 1999 1.34 0.17 0.72 0.18 0.83 0.93 1.39 0.14 0.86 1.40 2000 1.32 0.69 0.78 0.19 0.98 0.83 1.21 0.15 0.85 1.47 2001 1.20 0.92 0.80 0.20 0.82 0.72 1.02 0.14 0.89 1.53 2002 1.17 0.95 0.93 0.21 0.45 0.71 1.40 0.17 0.95 1.51 2003 1.15 1.01 0.94 0.20 0.44 0.73 1.27 0.16 0.97 1.49 2004 1.23 1.04 0.98 0.19 0.50 0.75 1.29 0.19 0.95 1.50 2005 1.27 1.16 0.98 0.19 0.73 0.77 1.18 0.19 1.00 1.49 2006 1.37 1.26 0.97 0.19 0.58 0.78 1.14 0.23 1.03 1.49 2007 1.35 1.31 1.07 0.20 0.60 0.81 1.18 0.18 1.05 1.47
37
Appendix B: Bibliographic Notes
The most comprehensive summary of current issues involving trade in services is
Mattoo, Stern, and Zanini, Edtors, A Handbook of International Trade in Services. Much
of the volume concentrates on issues involved in international negotiations on trade in
services, but there are also chapters on measuring trade in services, barriers to trade,
problems of measurement, and other general topics. There are also separate descriptions
of trends in China and Latin America and chapters dealing with individual service
sectors, such as transport, telecommunications, and health services. There is a
particularly informative chapter on “The Temporary Movement of Workers to Provide
Services (GATS mode 4).
The recent literature on U.S. service trade has continued to concentrate on
measuring the extent of, or predicting the future extent of “offshoring” or “offshore
outsourcing” by U.S. firms, and their effects on employment and wages in the United
States, particularly in goods- producing industries.
One service industry frequently mentioned as a candidate for offshoring is health
services, which has been described as vulnerable to foreign entry via what is called
“mode 1” in the GATS (General Agreement on Trade in Services) classification, cross-
border supply, in such areas as radiology, where contact between customer and supplier
is not necessary. A paper by Herman (2009) reviews the worldwide data on various types
of trade in health care services and concludes that cross-border trade is “minimal and
rather insignificant” (p. 5). However, trade in health services by modes 2 (consumption
abroad) and 4 (presence of natural persons) appears to be more significant, although the

38
data on both are somewhat ambiguous. The former may be affected by personal income
tax considerations and the latter by the difficulty of distinguishing it from migration.
A more general summary of the prospects for health services trade is offered in a
paper by Cattaneo (2009) which covers a wide range of services and of modes of supply.
It reviews the current state of trade in each of the four GATS modes and includes several
brief case studies of country policies and measures to promote both exports and imports
of health services. The conclusions are optimistic about prospects for future development
of health services trade and the potential benefits to exporters and importers.
A broader view, mainly concentrating on IT industries, is taken in a paper by
Kierkegaard (2008) that emphasizes the “rapidly deepening skill bias affecting these
types of employment” (p. 413) in the United States. The paper expresses some
skepticism about the elasticity of supply of highly skilled IT workers, even in India. The
paper suggests that the growth of the most successful service-exporting firms in foreign
countries will lead them to expand their own affiliate operations in the United States to
take advantage of the highest-skill workers.
Another analysis of the consequences of the growth of service exports on the
exporting country is the paper by Ahmed (2009) on service exports from India. The
simulations project large wage increases in the wages of skilled workers as a
consequence of the growth in the service export sector, confirming Kiekegard’s
expectations about wages in the IT sector. The simulations also project losses for capital
in manufacturing and agriculture.
A recent (unpublished and undated) study of IT workers based on two surveys
(Tambe and Hitt, n.d.), one of human resource managers and one of workers, concluded
39
that IT work was “…the most commonly offshored type of work,” leading to
displacement rates of 1-2% per year. The study found that jobs not requiring
“interpersonal skills” were particularly subject to displacement.
An analysis of the impact of service exports from India by Ahmed (2009) found,
in agreement with Kierkegaard’s analysis, discussed in the text, that the growth of India’s
service exports had significantly increased skilled labor wages and skilled, relative to
unskilled labor, wages. It had also reduced returns to capital in agriculture and
manufacturing.
The impact of foreign-owned service affiliates in Italy on locally-owned
manufacturing firms is analyzed in Nicolini et al., which finds that the entrance of foreign
MNEs in service sectors has a positive influence on local firms’ total factor productivity
through forward linkage.
A paper by Ebenstein, Harrison, McMillan, and Phillips (2009) deals mainly with
effects of trade and offshoring on manufacturing workers, but also contains useful
information from the Current Population surveys on the service sector. That includes
data on the education level of the service industry labor force. In manufacturing, the
industries in which firms expanded employment in high-income countries showed
average wage increases in the United States, while industries expanding in low-income
countries showed average wage decreases in the United States.

40
References
Ahmed, S. Amer (2009), “The Impact of Trade in Services on Factor Incomes: Results
from a Global Simulation Model,” Policy Research Working Paper
5155,Washington, DC, The World Bank Development Research Gtoup, Trade
and Integration Team, December.
Anderson, Thomas (2008), “U.S. Affiliates of Foreign Companies: Operations in 2006,”
Survey of Current Business, Vol. 88, No. 8, August, pp. 186-203.
_______________ , and William J. Zeile (2009), “Operations of U.S. Affiliates of
Foreign Companies: Preliminary Results From the 2007 Benchmark Survey,”
Survey of Current Business, Vol. 89, No. 11, November, pp. 43-65.
Balassa, Bela (1965), “Trade Liberalization and Revealed Comparative Advantage,” The
Manchester School of Economic and Social Studies, Vol. 33, Issue 2, pp. 99-123.
Barefoot, Kevin, and Raymond J. Mataloni, Jr.,(2009), “U.S. Multinational Companies:
Operations in the United States and Abroad in 2007,” Survey of Current Business,
Vol. 89, No. 8, pp. 63-87.
Bensidoun, Isabelle, and Deniz Unal-Kesenci (2008), “Globalization in Services: From
Measurement To Analysis,” Paris, OECD Working papers, March.
Blomström, Magnus, Robert E. Lipsey, and Lennart Ohlsson (1988), Economic Relations
between the United States and Sweden, Stockholm, Svenska Handelsbanken and
The Federation of Swedish Industries.
Borchert, Ingo, and Aaditya Mattoo (2009), “The Crisis-Resilience of Services Trade,”
Washington, DC, World Bank Policy Research Working Paper, April.

41
Borga, Maria, and Michael Mann (2002), “U.S. International Services: Cross-Border
Trade in 2001 and Sales Through Affiliates in 2000,” Survey of Current Business,
Vol. 82, No. 10, October, pp. 67-83.
___________________________ (2003), “U.S. International Services: Cross-Border
Trade in 2002 and Sales Through Affiliates in 2001,” Survey of Current Business,
Vol. 83, No. 10, October, pp. 58-118.
Cattaneo, Olivier (2009), “Trade in Health Services: What’s in it for Developing
Countries?, World Bank Policy Research Working Paper 5115, Washington, DC,
The World Bank, November.
Ebenstein, Avraham, Ann Harrison, Margaret McMillan, and Shannon Phillips (2009),
“Estimating the Impact of Trade and Offshoring on American Workers Using the
Current Population Surveys,” NBER Working Paper 15107, Cambridge, MA,
NBER, June.
Herman, Lior (2009), “Assessing International Trade in Healthcare Services,” ECIPE
Working Paper No. 03/2009, Brussels, European Centre for International Political
Economy.
International Monetary Fund (IMF), (2009), Balance of Payments Yearbook,
Washington, D.C., September.
Kirkegaard, Jacob F (2008), “Offshoring, Outsourcing, and Production Relocation—
Labor Market Effects in the OECD and Developing Asia,” The Singapore
Economic Review, Vol.53, No. 3, pp. 371-418.
42
Koncz, Jennifer, and Ann Flatness (2007), “U.S. International Services: Cross-Border
Trade in 2006 and Sales Through Affiliates in 2005,” Survey of Current Business,
Vol. 87, No. 10, October, pp. 94-146.
___________________________ (2008), “U.S. International Services: Cross-Border
Trade in 2007 and Services Supplied Through Affiliates in 2006,” Survey of
Current Business, Vol. 88, No. 10, October, pp. 16-62.
Koncz-Bruner, Jennifer, and Anne Flatness (2009), “U.S. International Trade in Services:
Cross-Border Trade in 2008 and Services Supplied Through Affiliates in 2007,
Survey of Current Business, Vol. 89, Number 10, October, pp. 22-64.
Kornfeld, Robert (2009), “Initial Results of the 2009 Comprehensive Revision of the
National Income and Product Accounts,” Survey of Current Business, Vol. 89,
Number 8, August, pp. 6-49.
Lipsey, Robert E. (2006) Cambridge, MA “Measuring International Trade in Services,”
NBER Working Paper 12271.
______________ (2008), “Measuring the Location of Production in a World of
Intangible Productive Assets, FDI, and Intrafirm Trade,” Cambridge, MA, NBER
Working Paper, 14121, June.
______________ (2009), “Measuring International Trade in Services,” in Marshall
Reinsdorf and Matthew J. Slaughter, Editors, International Trade in Services and
Intangibles in the Era of Globalization, Studies in Income and Wealth, Vol. 69,
Chicago, University of Chicago Press, pp. 27-70.
Mattoo, Aaditya, Robert M. Stern, and Gianni Zanini, Editors (2008), A Handbook of
International Trade in Services, Oxford University Press.
43
Nicolini, Marcella, Sergio Mariotti, and Lucia Piscitello (2009), “The impact of foreign
MNEs in service sectors on productivity of local manufacturing firms: Vertical
linkages and spillovers,” Unpublished paper available from
http://ssrn.com/abstract=1534587.
United Nations (2004), International Merchandise Trade Statistics Compilers Manual,
Department of Economic and Social Affairs, Statistics Division, New York,
United Nations.
____________ (2008), International Merchandise Trade Statistics: Supplement to the
Compilers Manual, Department of Economic and Social Affairs, Statistics
Divison, United Nations.
U.S., Bureau of the Census (1975), Historical Statistics of the United States, Colonial
Times to 1970, Bicentennial Edition, Washington, DC.
U.S., Bureau of Economic Analysis (2010), “U.S. International Trade in Goods and
Services, November 2009” BEA News Release, Washington, DC, January 12,
2010.