office of the actuary - welcome to nyc.gov | city … s. chan gasb 67/68 report for the city of new...
TRANSCRIPT

GASB 67/68 REPORT FOR
THE CITY OF NEW YORK AND
THE NEW YORK CITY RETIREMENT SYSTEMS
FOR FISCAL YEAR ENDED JUNE 30, 2016
October 11, 2016
OFFICE OF THE ACTUARY
255 GREENWICH STREET • 9TH FLOOR NEW YORK, NY 10007
(212) 442-5775 • FAX: (212) 442-5777
SHERRY S. CHAN CHIEF ACTUARY

OFFICE OF THE ACTUARY
255 GREENWICH STREET • 9TH FLOOR NEW YORK, NY 10007
(212) 442-5775 • FAX: (212) 442-5777
SHERRY S. CHAN CHIEF ACTUARY
October 11, 2016 Honorable Scott M. Stringer Comptroller The City of New York Municipal Building, Room 530 One Centre Street New York, NY 10007 Re: REVISED GASB67/68 Report for Fiscal Year Ended June 30, 2016 Dear Comptroller Stringer:
This REVISED GASB67/68 Report for the City of New York and the New York City
Retirement Systems1 (NYCRS) for Fiscal Year Ended June 30, 2016 (Report) presents information requested in a letter from Ms. Michele Mark Levine dated June 14, 2016 and updates the report dated September 30, 2016 primarily to reflect changes to the asset values of NYCERS and BERS that were provided to the Office of the Actuary (OA) subsequent to the issuance of the initial report. Executive Summary 1. This Report presents information, intended for use by the City of New York for accounting
and financial reporting under Governmental Accounting Standards Board Statement No. 68, as amended by GASB Statement No. 71 (GASB71), for Fiscal Year 2016 (i.e., July 1, 2015 to June 30, 2016).
2. This Report also presents information, intended for use by each System for accounting and
financial reporting under Governmental Accounting Standards Board Statement No. 67, for Fiscal Year 2016 (i.e., July 1, 2015 to June 30, 2016).
___________________________ 1 New York City Employees’ Retirement System (NYCERS)
New York City Teachers’ Retirement System (TRS) New York City Board of Education Retirement System (BERS) New York City Police Pension Fund (POLICE) New York Fire Department Pension Fund (FIRE)

Honorable Scott M. Stringer October 11, 2016 Page 2 3. The following Table provides a summary of the principal GASB67/68 results for Fiscal Year
2016, by System and in total. Detailed results including results for participating employers (Obligors), if applicable, are provided in Appendices A-E.
SUMMARY OF PRINCIPAL GASB67/68 RESULTS FOR FISCAL YEAR 2016
QUALIFIED PENSION PLAN ONLY UNLESS OTHERWISE STATED
($ Millions)
NYCERS* TRS BERS POLICE* FIRE* TOTAL
Total Pension Liability (TPL)
$79,839.1
$70,000.8
$4,800.7
$51,140.7
$20,643.8
$226,425.1
Plan Fiduciary Net Position (PFNP)
$55,542.3
$43,629.5
$3,416.4
$35,502.3
$11,738.1
$149,828.6
Net Pension Liability (NPL)
$24,296.8
$26,371.3
$1,384.3
$15,638.4
$ 8,905.7
$ 76,596.5
PFNP as a % of TPL
69.6%
62.3%
71.2%
69.4%
56.9%
66.2%
Pension Expense
$ 3,119.3
$ 3,889.1
$ 302.3
$ 2,213.2
$ 1,139.1
$ 10,663.0
* Includes Variable Supplements Funds (VSFs)
4. The New York City Off-Track Betting Corporation (OTB) is shown herein as an Obligor. It
is unclear at this time whether OTB’s pension costs, liabilities and allocated assets are to be reported by the City.
5. Some of the Obligors operate on a fiscal year that is different from the City’s fiscal year.
Those Obligors should consult with their auditors to determine how to apply the results shown in this Report in their individual financial statements.
6. The results contained herein are based upon the OA’s interpretation of GASB67, GASB68,
and GASB71, in consultation with the New York City Office of the Comptroller (OC) and Grant Thorton, LLP and Marks Paneth, LLP, the City’s auditors. The results are based upon an actuarial valuation date of June 30, 2014 and a Measurement Date of June 30, 2016 for Fiscal Year 2016. A Measurement Date of June 30, 2015 was used for Fiscal Year 2015 items.

Honorable Scott M. Stringer October 11, 2016 Page 3 7. The Fiscal Year 2016 results are based on the same actuarial assumptions as used for Fiscal
Year 2015 with the exception of the assumption for post-retirement mortality. The tables of post-retirement mortality have been updated based primarily on the experience of each System and the application of Mortality Improvement Scale MP-2015 published by the Society of Actuaries in October 2015. Scale MP-2015, applied on a generational basis, replaced Mortality Improvement Scale AA, which was applied on a static projection basis.
8. The Report reflects, for the first time, costs and liabilities for POLICE and FIRE associated
with the Special Accidental Death Benefits (SADB) payable under Section 208-f of the General Municipal Law. These benefits are paid to eligible beneficiaries of certain employees of the City of New York who died as a natural and proximate result of an accident sustained in the performance of duty.
Additionally, based on the City’s decision to restate their Financial Statements for Fiscal
Year Ended June 30, 2015, the Report contains revised Fiscal Year 2015 results for POLICE and FIRE to include each respective System’s additional costs and liabilities attributable to the SADB.
9. The results contained herein are for accounting and financial reporting purposes only.
Therefore, these results are not to be relied upon for other purposes, including but not limited to, funding of the NYCRS, investment decisions and plan design.
Conclusion
This Report is intended to present the accounting and financial reporting information required under GASB67 and GASB68 as of the Measurement Date of June 30, 2016 and the Reporting Date of June 30, 2016 for the City of New York, for certain Obligors and for the New York City Retirement Systems. This Report also presents Fiscal Year 2015 results.
All costs, liabilities and actuarial present values have been determined in accordance with
generally accepted actuarial principles and procedures. The Table of Contents, which immediately follows, outlines in more detail the contents
of this report.

Honorable Scott M. Stringer October 11, 2016 Page 4
I, Sherry S. Chan, am the Chief Actuary for, and independent of, the New York City Pension Funds and Retirement Systems. I am a Fellow of the Society of Actuaries, a Fellow of the Conference of Consulting Actuaries and a Member of the American Academy of Actuaries. I meet the Qualification Standards of the American Academy of Actuaries to render the actuarial opinion contained herein. To the best of my knowledge, the results contained herein have been prepared in accordance with generally accepted actuarial principles and procedures and with the Actuarial Standards of Practice issued by the Actuarial Standards Board.
Best Regards, Sherry S. Chan, FSA, FCA, MAAA Chief Actuary
SSC:eh cc: New York City Office of the Actuary
Mr. Sam Rumley Mr. Michael Samet Component Units Mr. Robert Balducci - WFA Mr. Dan Frydberg - New York City Housing Authority Ms. Miriam Katowitz - City University of New York Mr. James Linhart - New York City Health and Hospitals Corporation Mr. Jeffrey Pagelson - New York City Housing Authority Mr. Aaron Stern - New York City Transit Authority Ms. Yi-Wen Wang - School Construction Authority

New York City Office of the Comptroller
Ms. Susan Cornwall Mr. David Jeter Ms. Berta Lara Ms. Michele Levine Ms. Jackie Thompson
Marks Paneth Ms. Hope Goldstein Mr. Michael Kaplan Grant Thorton Ms. Marla Hummel Mr. Ben Kohnle Mr. Cosmo Saginario New York City Office of Management and Budget
Ms. Nicole Fleming Mr. Dean Fuleihan
Mr. John Grathwol New York City Retirement Systems
Ms. Sunny Bavakutty - New York City Police Pension Fund Mr. Albert Connolly - New York Fire Department Pension Fund Ms. Diane D’Alessandro - New York City Employees’ Retirement System Ms. Maureen Dale - New York Fire Department Pension Fund Mr. Jean-Daniel Desmornes - New York City Board of Education Retirement System Mr. Michael Goldson - New York City Employees’ Retirement System Mr. John Hartman - New York City Employees’ Retirement System Mr. Kevin Holloran - New York City Police Pension Fund Mr. Paul Raucci - New York City Teachers’ Retirement System Ms. Patricia Reilly - New York City Teachers’ Retirement System Mr. Sanford Rich- New York City Board of Education Retirement System 2347L&R:eh

TABLE OF CONTENTS
SECTION ITEM PAGE
I Census Data 1
II Assets 3
III Actuarial Assumptions and Methods 4
IV Summary of Plan Provisions 8
V Roll-Forward Methodology 9
VI Allocation Methodology 10
VII Subsequent Events 11
VIII Sensitivity Analysis 12
APPENDIX
A Detailed Results for NYCERS
B Detailed Results for TRS
C Detailed Results for BERS
D Detailed Results for POLICE
E Detailed Results for FIRE

SECTION I
CENSUS DATA
The census data used in the development of the GASB67/68 results contained herein is the census data used in the June 30, 2014 (Lag) actuarial valuations of the New York City Retirement Systems1 (NYCRS or Systems) to determine the final Fiscal Year 2016 employer pension contributions.
The Office of the Actuary (OA) and Buck Consultants, LLC (Buck) performed tests on
this data and, on the basis of these tests, the Chief Actuary of the New York City Retirement Systems (the Actuary) believes the data is sufficiently complete and appropriate for developing the GASB67/68 results contained in this Report.
The following Table I-1 presents a summary of the census data used in the June 30, 2014
(Lag) actuarial valuations to determine the final Fiscal Year 2016 employer pension contributions. Further detail can be found in the Comprehensive Annual Financial Report (CAFR) for each System.
Table I-1
SUMMARY OF CENSUS DATA USED IN THE JUNE 30, 2014 (LAG) ACTUARIAL VLUATIONS
GROUP NYCERS TRS BERS POLICE FIRE TOTAL
Active 184,762 111,726 25,182 34,402 10,319 366,391
Active/Inactive 16,527 8,702 4,005 1,369 16 30,619
Deferred Vested 9,674 12,349 195 572 40 22,830
Retired 142,095 80,419 15,995 48,212 16,763 303,484
Total 353,058 213,196 45,377 84,555 27,138 723,324
___________________________ 1 New York City Employees’ Retirement System (NYCERS)
New York City Teachers’ Retirement System (TRS) New York City Board of Education Retirement System (BERS) New York City Police Pension Fund (POLICE) New York Fire Department Pension Fund (FIRE)

Page 2
The following Table I-2 presents the salaries of the active members shown in Table I-1 at June 30, 2014, projected to June 30, 2015 and projected to December 31, 2015. The employer contributions for Fiscal Year 2016 were based on projected covered payroll at December 31, 2015.
Table I-2
SALARIES OF ACTIVE MEMBERS
System
June 30, 2014
June 30, 2015
December 31, 2015
NYCERS $12,672,386,846 $12,336,979,280 $12,229,775,391
TRS $ 8,274,685,657 $ 8,256,100,227 $ 8,274,238,841
BERS $ 1,045,187,738 $ 1,008,055,944 $ 998,021,643
POLICE $ 3,618,095,284 $ 3,540,326,198 $ 3,502,090,756
FIRE $ 1,150,389,645 $ 1,129,469,957 $ 1,120,951,027
Total $26,760,745,170 $26,270,931,606 $26,125,077,658
The census data used in the June 30, 2014 (Lag) actuarial valuation contains either the negotiated retroactive wage increases or an estimate of any anticipated settlements (pattern bargaining).

Page 3
SECTION II
ASSETS
Asset values for each NYCRS, for the Variable Supplements Funds (VSFs) and for the Tax-Deferred Annuity (TDA) Programs are prepared by the Chief Accountants of each System on the basis of information provided by the investment managers of the respective System and by the Office of the Comptroller of the City of New York (the Comptroller or the OC).
The Board of Trustees of each System establishes an overall Investment Policy and has
ultimate authority for the assets of the System. By statute, the Comptroller is the custodian for each System’s investments and also
serves as an Investment Advisor to each System’s Board of Trustees. For purposes of developing the results contained in this Report, asset information was
provided to the OA by the Office of the Comptroller and the Systems. For all Systems, the Plan Fiduciary Net Positions at June 30, 2016, as well as income items and cash flow items, have been confirmed as final. However, certain categories of assets are subject to revision. Any revision to the amounts shown in this report should have a de minimis impact on the Fiscal Year 2016 GASB67 and/or GASB68 results.
The assets of the NYCERS QPP as of June 30, 2014, shown in the Comprehensive
Annual Financial Reports (CAFR) of the City and of NYCERS differ from the assets of the NYCERS QPP used in the development of the Fiscal Year 2014 GASB67 and GASB68 results shown herein.
The differences are due to adjustments identified during audit, totaling ($351,463,000). Therefore, in developing the Fiscal Year 2015 Net Pension Liability an adjustment has
been reflected in the Changes in Plan Fiduciary Net Position during Fiscal Year 2015, reflected in Other Changes, and recognized immediately.
The amounts shown as of June 30, 2015 in the NYCERS Statement of Fiduciary Net
Position (Appendix A, Page 7a) and the NYCERS Statement of Changes in Fiduciary Net Position (Appendix A, Page 8a) are the amounts shown in the Fiscal Year 2015 City CAFR and the Fiscal Year 2015 NYCERS CAFR.
The assets of BERS as of June 30, 2014 were restated. The impact of that change is
reflected in this report.
Page 4
SECTION III
ACTUARIAL ASSUMPTIONS AND METHODS
The tables of post-retirement mortality have been updated for Fiscal Year 2016 based primarily on the experience of each system and the application of Mortality Improved Scale MP-2015 published by the Society of the Actuaries in October 2015. Scale MP-2015, applied on a generational basis, replaced Mortality Improvement Scale AA, which was applied on a static projection basis.
All other actuarial assumptions and methods used to value the NYCRS are unchanged
from those used in the prior valuation and are provided in the following five reports (the Silver Books), dated February 10, 2012:
• Proposed Changes in Actuarial Assumptions and Methods for Determining Employer Contributions for Fiscal Years Beginning on and after July 1, 2011 for the New York City Employees’ Retirement System.
• Proposed Changes in Actuarial Assumptions and Methods for Determining Employer Contributions for Fiscal Years Beginning on and after July 1, 2011 for the New York City Teachers’ Retirement System.
• Proposed Changes in Actuarial Assumptions and Methods for Determining Employer Contributions for Fiscal Years Beginning on and after July 1, 2011 for the New York City Board of Education Retirement System.
• Proposed Changes in Actuarial Assumptions and Methods for Determining Employer Contributions for Fiscal Year Beginning on and after July 1, 2011 for the New York City Police Pension Fund.
• Proposed Changes in Actuarial Assumptions and Methods for Determining Employer Contributions for Fiscal Years Beginning on and after July 1, 2011 for the New York City Fire Department Pension Fund.
Electronic versions of the Silver Books are available on the OA website
(www.nyc.gov/actuary) under Pension Information.
Those assumptions requiring Board approval were adopted by each Board of Trustees. The New York State Legislature and Governor enacted those Silver Book assumptions and methods requiring State legislation as Chapter 3 of the Laws of 2014 (Chapter 3/13), with revisions proposed by the Actuary and adopted by each NYCRS’ Board of Trustees in Fiscal Year 2016.

Page 5 Actuarial Asset Valuation Method
The Plan Fiduciary Net Positions are based on the Market Values of Assets at the Measurement Dates with certain adjustments made to reflect the Actuary’s understanding of the accruals within and the transfers between the QPP and the VSFs for NYCERS, POLICE and FIRE. Actuarial Cost Method
The Entry Age Actuarial Cost Method, as set forth in Paragraph 46 of GASB67 and Paragraph 32 of GASB68, is used to determine the results contained in this Report. Discount Rate
The discount rate used to measure the Total Pension Liability (TPL) was 7.0% per annum. The projection of cash flows used to determine the discount rate assumed that each participating employer (Obligor) would contribute the actuarially-determined contribution each year. On this basis, the Plan Fiduciary Net Position (PFNP) of each System was projected to be sufficient to pay all benefits when due.
For all of the VSFs, including, in particular, the NYCERS VSFs, liabilities are also
discounted at 7.0% per annum, consistent with the assumptions and methodology used to determine employer contributions.
Additionally, in TRS and in BERS, Variable Fund liabilities have been developed
consistent with Variable Fund investment earnings for Fiscal Years 2015 and 2016. Long-Term Expected Rate of Return
The Long-Term Expected Rate of Return (LTEROR) on the investments of the NYCRS was determined using a Building-Block method as described in each respective System’s Silver Book.
The Building-Block methodology develops total investment return by combining
expected future inflation with an expected future Real Rate of Return (RROR) on plan assets. For purposes of GASB67/68, the target asset allocation and estimates of arithmetic
RROR for each major asset class were provided by the Comptroller and are summarized in the Appendix for each respective System.

Page 6 Liability Loads
In developing the results of the June 30, 2014 (Lag) actuarial valuations of the NYCRS, the Actuary included adjustments for liabilities and benefit payments related to the benefits provided by the World Trade Center laws and for certain other benefits payable to members of each System, if any.

Page 7
The following Table III-1 provides a brief description of the significant assumptions used in the June 30, 2014 (Lag) actuarial valuation to determine the Final Fiscal Year 2016 Employer Contributions:
Table III-1
ACTUARIAL ASSUMPTIONS USED FOR DETERMINING
FINAL FISCAL YEAR 2016 EMPLOYER CONTRIBUTIONS
ITEM
FINAL FISCAL YEAR 2016
EMPLOYER CONTRIBUTIONS1
Valuation Date
June 30, 2014 (Lag).
Assumed Rate of Return on Investments2
7.0% per annum, net of Investment Expenses. Actual return for Variable Funds.
Post-Retirement Mortality
Tables adopted by the Boards of Trustees during Fiscal Year 20163.
Active Service: Withdrawal, Death, Disability
Tables adopted by the Boards of Trustees during Fiscal Year 20124.
Retirement
Tables adopted by the Boards of Trustees during Fiscal Year 20124.
World Trade Center Benefits
Estimates of Certain Obligations.
Salary Increases2
Tables adopted by the Boards of Trustees during Fiscal Year 20124. In general, Merit and Promotion Increases plus assumed General Wage Increase of 3.0% per year.
Assumed Cost-of-Living Adjustments2
1.5% per year for Tier I, Tier II, Tier IV and certain Tier III and Tier VI retirees. 2.5% per year for certain Tier III and Tier VI retirees.
Liability Loads
Estimates of Certain Obligations.
1 Based on actuarial assumptions and methods proposed by the Actuary during Fiscal Year 2012, adopted by the
Boards of Trustees and enacted into law as Chapter 3/13 with revisions proposed by the Actuary and adopted by the Boards of Trustees in Fiscal Year 2016.
2 Developed using a long-term Consumer Price Inflation (CPI) assumption of 2.5% per year. 3 See December 2015 memoranda to the Boards of Trustees. 4 See the Reports entitled “Proposed Changes in Actuarial Assumptions and Methods for Determining Employer
Contributions for Fiscal Years Beginning on and After July 1, 2011” dated February 10, 2012 (the Silver Books).

Page 8
SECTION IV
SUMMARY OF PLAN PROVISIONS
A summary of the benefits is contained in the June 30, 2014 and the June 30, 2015 Comprehensive Annual Financial Reports of each NYCRS.

Page 9
SECTION V
ROLL-FORWARD METHODOLOGY
In accordance with Paragraph 22 of GASB68, the Total Pension Liability should be determined by:
(a) an actuarial valuation as of the Measurement Date (i.e., June 30, 2016), or (b) the use of update procedures to roll forward to the Measurement Date amounts
from an actuarial valuation as of a date no more than 30 months and 1 day earlier than the employer’s fiscal year-end.
Actuarial valuations of the NYCRS are performed annually using a June 30, XX-2
actuarial valuation date to determine Fiscal Year XX employer contributions (e.g., June 30, 2014 (Lag) actuarial valuations are used to determine Fiscal Year 2016 employer contributions). This is referred to as One-Year Lag Methodology (OYLM).
Due to the time needed to prepare June 30, 2016 actuarial valuations, primarily related to
the collection of census data, the Actuary has developed the TPL at June 30, 2015 and June 30, 2016 by rolling-forward certain results of the June 30, 2014 actuarial valuations of the NYCRS that were used to determine Final Fiscal Year 2016 employer contributions.
Entry Age Accrued Liabilities and Total Normal Costs are beginning-of-year amounts.
Actual Benefit Payments are assumed to be made mid-year. The June 30, 2015 Normal Costs are projected from June 30, 2014 on an expected basis. Except for the Variable Funds of TRS and BERS, all roll-forward amounts assume compound interest at 7.0% per annum.
For TRS and BERS, all Fixed Fund liabilities were determined consistent with the
methodology used for the other NYCRS. For TRS and BERS, Variable Fund liabilities were rolled forward using actual Variable Fund asset earnings.
The development of the Total Pension Liability (TPL) under the methodology described
herein is shown as follows for each System, in total:
NYCERS - Appendix A, Page 2
TRS - Appendix B, Page 2
BERS - Appendix C, Page 2
POLICE - Appendix D, Page 2
FIRE - Appendix E, Page 2

Page 10
SECTION VI
ALLOCATION METHODOLOGY
Three of the NYCRS (i.e., NYCERS, TRS and BERS) are cost-sharing, multiple-employer Public Employee Retirement Systems (PERS). For these Systems, all GASB67/68 results were first determined, in total, as of the Measurement Date.
For each Obligor, a proportionate share of the Net Pension Liability, Pension Expense,
Deferred Outflows of Resources and Deferred Inflows of Resources (the Collective Pension Amounts) were determined in accordance with GASB68 Paragraphs 48-55 and in accordance with a February 2014 whitepaper published by the State and Local Government Expert Panel (SLGEP) of the American Institute of Certified Public Accountants (AICPA).
The Collective Pension Amounts were allocated consistent with the manner in which
total employer contributions to each System were determined. Each respective System’s Appendix contains the development of the allocation percentage for each Obligor. This percentage is based on Fiscal Year 20XX employer contributions which, under OYLM, is based on a June 30, 20XX-2 actuarial valuation date (see Paragraph 50 of GASB68).
The components of Pension Expense were allocated ratably for each Obligor. Although
these component allocations produce results for some Obligors that appear illogical (e.g., a Service Cost for OTB and for the VSFs of HP and TP despite there being no active members), it is the understanding of the Actuary that this methodology is permitted for purposes of determining GASB68 results and that the components (as opposed to the total) are relatively unimportant for developing the key financial reporting results.

Page 11
SECTION VII
SUBSEQUENT EVENTS
The Fiscal Year 2016 GASB67/68 results contained herein are based on June 30, 2014 actuarial valuations of each of the New York City Retirement Systems used to develop Final Fiscal Year 2016 employer contributions under One-Year Lag Methodology (OYLM). As described in Section V, these June 30, 2014 actuarial valuation results have been rolled-forward to the Measurement Date of June 30, 2016.

Page 12
SECTION VIII
SENSITIVITY ANALYSIS
The following Table VIII-1 presents the Net Pension Liability of each System, calculated as of the Measurement Date of June 30, 2016, using the Discount Rate of 7.0% per annum (the Current Rate). The Table also shows what each System’s Net Pension Liability would be if it were calculated using a Discount Rate that is 1-percentage-point lower (i.e., 6.0% per annum) or 1-percentage-point higher (i.e., 8.0% per annum) than the Current Rate.
Table VII-1
SENSITIVITY ANALYSIS
NET PENSION LIABILITY AS OF JUNE 30, 2016
System 1% Decrease
(6.0%) Current Rate
(7.0%) 1% Increase
(8.0%)
NYCERS $ 33,313,433,767 $24,296,821,898 $16,744,858,681
TRS $ 33,701,230,107 $26,371,232,108 $20,244,351,800
BERS $ 1,948,548,421 $ 1,384,265,288 $ 911,335,563
POLICE $ 21,343,531,667 $15,638,472,394 $10,900,096,118
FIRE $ 11,202,958,999 $ 8,905,697,528 $ 6,981,293,710
Total $101,509,702,961 $76,596,489,216 $55,781,935,872
2347L&R:eh

APPENDIX A

NYC Office of the Actuary October 11, 2016
Page 1a - Market Value of AssetsPage 1b - Development of Asset (Gain) / Loss - June 30, 2015Page 1c - Development of Asset (Gain) / Loss - June 30, 2016
Page 2 - Roll-Forward of Entry Age Actuarial Accrued Liabilities
Page 3a - Changes in Net Pension Liability by Source - June 30, 2015Page 3b - Changes in Net Pension Liability by Source - June 30, 2016Page 3c - Changes in Net Pension Liability by Source - June 30, 2015 - SummaryPage 3d - Changes in Net Pension Liability by Source - June 30, 2016 - Summary
Page 4a - Components of Pension Expense - June 30, 2015Page 4b - Components of Pension Expense - June 30, 2016Page 4c - Components of Pension Expense - June 30, 2015 - SummaryPage 4d - Components of Pension Expense - June 30, 2016 - Summary
Page 5a - Pension Expense, Total Deferred Inflows/Outflows of Resources @ June 30, 2013Page 5b - Pension Expense, Deferred Inflows/Outflows of Resources for June 30, 2014Page 5c - Pension Expense, Deferred Inflows/Outflows of Resources for June 30, 2015Page 5d - Pension Expense, Deferred Inflows/Outflows of Resources for June 30, 2016Page 5e - Pension Expense, Total Deferred Inflows/Outflows of Resources @ June 30, 2016
Page 6 - Schedule of Employer Contributions
Page 7a - Statement of Fiduciary Net Position - NYCERSPage 7b - Statement of Fiduciary Net Position - COVSFPage 7c - Statement of Fiduciary Net Position - HPOVSFPage 7d - Statement of Fiduciary Net Position - HPSOVSFPage 7e - Statement of Fiduciary Net Position - TPOVSFPage 7f - Statement of Fiduciary Net Position - TPSOVSF
Page 8a - Statement of Changes in Fiduciary Net Position - NYCERSPage 8b - Statement of Changes in Fiduciary Net Position - COVSFPage 8c - Statement of Changes in Fiduciary Net Position - HPOVSFPage 8d - Statement of Changes in Fiduciary Net Position - HPSOVSFPage 8e - Statement of Changes in Fiduciary Net Position - TPOVSFPage 8f - Statement of Changes in Fiduciary Net Position - TPSOVSF
Page 9 - Long-Term Expected Rate of Return
Page 10a - Schedule of Employer Allocations - June 30, 2015Page 10b - Schedule of Employer Allocations - June 30, 2016
Page 11a - Increase (Decrease) in Pension Expense Arising from the Recognition of Differences between Projected and Actual Earnings on Pension Plan Investments
Page 11b - Increase (Decrease) in Pension Expense Arising from the Recognition of Differences between Expected and Actual Experience
Page 11c - Increase (Decrease) in Pension Expense Arising from the Recognition of Changes in Assumptions
Page 12a - Changes in Proportionate Share - June 30, 2015Page 12b - Changes in Proportionate Share - June 30, 2016
Page 13a - Schedule of Pension Amounts by Employer - June 30, 2015Page 13b - Schedule of Pension Amounts by Employer - June 30, 2016Page 13c - Schedule of Collective Pension Amounts - June 30, 2016
Page 14 - Schedule of Changes in Net Pension Liability and Related Ratios
Page 15 - Average Expected Remaining Service Lives
APPENDIX A
NEW YORK CITY EMPLOYEES' RETIREMENT SYSTEM (NYCERS)

Appendix APage 1a
NYC Office of the Actuary October 11, 2016
QPP COVSF HPOVSF HPSOVSF TPOVSF TPSOVSF Total1. Plan Net Position @ 6/30/2014 54,611,958,000$ 35,983,000$ 0$ 0$ 0$ 0$ 54,647,941,000$ 2. Net Accrued Benefits Payable 6,026,000 0 13,000 35,000 23,000 26,000 6,123,0003. Accrued Transfers from NYCERS to COVSF (190,000,000) 190,000,000 0 0 0 0 04. Adjusted Market Value @ 6/30/2014 54,427,984,000$ 225,983,000$ 13,000$ 35,000$ 23,000$ 26,000$ 54,654,064,000$
5. Changes for the year:a. ER Contributions 3,160,258,000 0 0 0 0 0 3,160,258,000b. EE Contributions 467,129,000 0 0 0 0 0 467,129,000c. Net Investment Income 1,175,099,000 10,000 0 0 0 0 1,175,109,000d. Benefit Payments 1 (4,235,644,000) (76,606,000) (2,083,000) (2,682,000) (4,047,000) (3,073,000) (4,324,135,000)e. Payments to Other Retirement Systems (7,142,000) 0 0 0 0 0 (7,142,000)f. Transfers to Variable Supplements Funds (11,918,000) 12,000 2,100,000 2,686,000 4,040,000 3,080,000 0g. Administrative Expenses (54,635,000) 0 0 0 0 0 (54,635,000)h. Other 4,140,000 0 0 0 0 0 4,140,000i. Net Changes 497,287,000$ (76,584,000)$ 17,000$ 4,000$ (7,000)$ 7,000$ 420,724,000$
6. Plan Net Position @ 6/30/2015 54,919,324,000$ 149,399,000$ 0$ 0$ 0$ 0$ 55,068,723,000$ 7. Net Accrued Benefits Payable 5,947,000 0 30,000 39,000 16,000 33,000 6,065,0008. Accrued Transfers from NYCERS to COVSF (30,000,000) 30,000,000 0 0 0 0 09. Adjusted Market Value @ 6/30/2015 54,895,271,000$ 179,399,000$ 30,000$ 39,000$ 16,000$ 33,000$ 55,074,788,000$
10. Changes for the year:a. ER Contributions 3,365,454,000 0 0 0 0 0 3,365,454,000b. EE Contributions 485,508,000 0 0 0 0 0 485,508,000c. Net Investment Income 1,171,720,000 184,000 0 0 0 0 1,171,904,000d. Benefit Payments 2 (4,402,729,000) (79,917,000) (1,968,000) (2,643,000) (3,932,000) (2,957,000) (4,494,146,000)e. Payments to Other Retirement Systems (7,440,000) 0 0 0 0 0 (7,440,000)f. Transfers to Variable Supplements Funds (11,525,000) 0 1,968,000 2,648,000 3,945,000 2,964,000 0g. Administrative Expenses (56,683,000) 0 0 0 0 0 (56,683,000)h. Other 2,928,000 0 0 0 0 0 2,928,000i. Net Changes 547,233,000$ (79,733,000)$ 0$ 5,000$ 13,000$ 7,000$ 467,525,000$
11. Plan Net Position @ 6/30/2016 55,436,780,000$ 99,666,000$ 0$ 0$ 0$ 0$ 55,536,446,000$ 12. Net Accrued Benefits Payable 5,724,000 0 30,000 44,000 29,000 40,000 5,867,00013. Accrued Transfers from NYCERS to COVSF 52,724,000 (52,724,000) 0 0 0 0 014. Adjusted Market Value @ 6/30/2016 55,495,228,000$ 46,942,000$ 30,000$ 44,000$ 29,000$ 40,000$ 55,542,313,000$
1 Includes Net Accrued Benefits Payable of $(79,000) for QPP,$1,679,000 for COVSF, $17,000 for HPOVSF, $4,000 for HPSOVSF, $(7,000) for TPOVSF and $7,000 for TPSOVSF.2 Includes Net Accrued Benefits Payable of $(223,000) for QPP, $2,232,000 for COVSF, $0 for HPOVSF, $5,000 for HPSOVSF, $13,000 for TPOVSF and $7,000 for TPSOVSF.
NEW YORK CITY EMPLOYEES' RETIREMENT SYSTEM (NYCERS)
Governmental Accounting Standards Board Statements No. 67 and No. 68 (GASB 67/68)
Market Values of Assets

Appendix APage 1b
NYC Office of the Actuary October 11, 2016
QPP COVSF HPOVSF HPSOVSF TPOVSF TPSOVSF Total
1. Assets
a. Market Value 6/30/2014* 54,617,984,000$ 35,983,000$ 13,000$ 35,000$ 23,000$ 26,000$ 54,654,064,000$
b. 2014 Accrued Transfers from NYCERS to COVSF (190,000,000) 190,000,000 0 0 0 0 0
c. Adjusted Market Value @6/30/2014 54,427,984,000 225,983,000 13,000 35,000 23,000 26,000 54,654,064,000
d. Market Value 6/30/2015** 54,925,271,000 149,399,000 30,000 39,000 16,000 33,000 55,074,788,000
e. 2015 Accrued Transfers from NYCERS to COVSF (30,000,000) 30,000,000 0 0 0 0 0
f. Adjusted Market Value @6/30/2015 54,895,271,000 179,399,000 30,000 39,000 16,000 33,000 55,074,788,000
2. Net Investment Income 1,175,099,000 10,000 0 0 0 0 1,175,109,000
3. Cash Flow (867,812,000) 113,406,000 17,000 4,000 (7,000) 7,000 (754,385,000)(1.d. - 1.a. - 2.)
4. Expected Earnings 3,793,397,469 6,421,110 1,495 2,588 1,369 2,061 3,799,826,092(7% * 1.a. + 3.441% * 3.)
5. (Gain) / Loss 2,618,298,469 6,411,110 1,495 2,588 1,369 2,061 2,624,717,092(4. - 2.)
6. Recognition Period 5 Years 5 Years 5 Years 5 Years 5 Years 5 Years 5 Years
7. Amount Recognized in Pension Expense 523,659,694 1,282,222 299 518 274 412 524,943,419(5. / 6.)
8. Deferred (Inflow) / Outflow of Resources 2,094,638,775$ 5,128,888$ 1,196$ 2,070$ 1,095$ 1,649$ 2,099,773,673$ (5. - 7.)
* Before Reflecting 2014 Accrued Transfers to VSFs. Reflects QPP Post-Publication Adjustment.
** Before Reflecting 2015 Accrued Transfers to VSFs.
NEW YORK CITY EMPLOYEES' RETIREMENT SYSTEM (NYCERS)
Governmental Accounting Standards Board Statements No. 67 and No. 68 (GASB 67/68)
Development of Asset (Gain) / LossJune 30, 2015

Appendix APage 1c
NYC Office of the Actuary October 11, 2016
QPP COVSF HPOVSF HPSOVSF TPOVSF TPSOVSF Total
1. Assets
a. Market Value 6/30/2015* 54,925,271,000$ 149,399,000$ 30,000$ 39,000$ 16,000$ 33,000$ 55,074,788,000$
b. 2015 Accrued Transfers from NYCERS to COVSF (30,000,000) 30,000,000 0 0 0 0 0
c. Adjusted Market Value @6/30/2015 54,895,271,000 179,399,000 30,000 39,000 16,000 33,000 55,074,788,000
d. Market Value 6/30/2016** 55,442,504,000 99,666,000 30,000 44,000 29,000 40,000 55,542,313,000
e. 2016 Accrued Transfers from NYCERS to COVSF 52,724,000 (52,724,000) 0 0 0 0 0
f. Adjusted Market Value @6/30/2016 55,495,228,000 46,942,000 30,000 44,000 29,000 40,000 55,542,313,000
2. Net Investment Income 1,171,720,000 184,000 0 0 0 0 1,171,904,000
3. Cash Flow (654,487,000) (49,917,000) 0 5,000 13,000 7,000 (704,379,000)(1.d. - 1.a. - 2.)
4. Expected Earnings 3,822,248,072 8,740,286 2,100 2,902 1,567 2,551 3,830,997,478(7% * 1.a. + 3.441% * 3.)
5. (Gain) / Loss 2,650,528,072 8,556,286 2,100 2,902 1,567 2,551 2,659,093,478(4. - 2.)
6. Recognition Period 5 Years 5 Years 5 Years 5 Years 5 Years 5 Years 5 Years
7. Amount Recognized in Pension Expense 530,105,614 1,711,257 420 580 313 510 531,818,694(5. / 6.)
8. Deferred (Inflow) / Outflow of Resources 2,120,422,458$ 6,845,029$ 1,680$ 2,322$ 1,254$ 2,041$ 2,127,274,784$ (5. - 7.)
* Before Reflecting 2015 Accrued Transfers to VSFs.
** Before Reflecting 2016 Accrued Transfers to VSFs.
NEW YORK CITY EMPLOYEES' RETIREMENT SYSTEM (NYCERS)
Governmental Accounting Standards Board Statements No. 67 and No. 68 (GASB 67/68)
Development of Asset (Gain) / LossJune 30, 2016

Appendix APage 2
NYC Office of the Actuary October 11, 2016
QPP COVSF HPOVSF HPSOVSF TPOVSF TPSOVSF Total1. Entry Age Accrued Liability (EAAL) at 6/30/2014 72,985,324,356$ 1,263,842,624$ 18,201,582$ 24,540,624$ 35,777,435$ 27,295,188$ 74,354,981,809$ 2. Entry Age Normal Cost at 6/30/2014 1,821,328,906 23,325,864 0 0 0 0 1,844,654,7703. Benefit Payments-FY15 4,235,644,000 76,606,000 2,083,000 2,682,000 4,047,000 3,073,000 4,324,135,0004. Interest 5,090,717,218 87,465,782 1,202,435 1,625,556 2,365,163 1,804,921 5,185,181,075
5. Roll-Forward EAAL at 6/30/2015 75,661,726,480$ 1,298,028,270$ 17,321,017$ 23,484,180$ 34,095,598$ 26,027,109$ 77,060,682,654$
6. Entry Age Normal Cost at 6/30/2015 1,875,968,773 24,025,640 0 0 0 0 1,899,994,4137. Benefit Payments-FY16 4,402,729,000 79,917,000 1,968,000 2,643,000 3,932,000 2,957,000 4,494,146,0008. Interest 5,276,140,763 89,793,830 1,144,752 1,552,947 2,251,392 1,720,147 5,372,603,831
9. Roll-Forward EAAL at 6/30/2016 78,411,107,016$ 1,331,930,740$ 16,497,769$ 22,394,127$ 32,414,990$ 24,790,256$ 79,839,134,898$
1 VSFs liabilities are discounted at 7.0% per annum, consistent with the Assumptions and Methodology used to determine employer contributions.
NEW YORK CITY EMPLOYEES' RETIREMENT SYSTEM (NYCERS)
Governmental Accounting Standards Board Statements No. 67 and No. 68 (GASB 67/68)
Roll-Forward of Entry Age Actuarial Accrued Liabilities1

Appendix APage 3a(1)
NYC Office of the Actuary October 11, 2016
NEW YORK CITY EMPLOYEES' RETIREMENT SYSTEM (NYCERS)
Governmental Accounting Standards Board Statements No. 67 and No. 68 (GASB 67/68)
Changes in Net Pension Liability (NPL) by Source
Total Pension Plan Fiduciary Net PensionLiability Net Position1 Liability
(a) (b) (a) - (b)1. Balances at June 30, 2014 73,024,794,147$ 55,005,527,000$ 18,019,267,147$
2. Changes for the Year:a. Service Cost 1,832,487,270 0 1,832,487,270b. Interest 5,071,014,309 0 5,071,014,309c. Differences b/t Expected and Actual Experience (288,598,641) 0 (288,598,641)d. Contributions - Employer 0 3,160,258,000 (3,160,258,000)e. Contributions - Employee 0 467,129,000 (467,129,000)f. Net Investment Income 0 1,175,109,000 (1,175,109,000)g. Benefit Payments (4,324,135,000) (4,324,135,000) 0h. Payments to Other Retirement Systems 0 (7,142,000) 7,142,000i. Transfers to Variable Supplements Funds 0 0 0j. Administrative Expenses 0 (54,635,000) 54,635,000k. Other Changes2 0 (347,323,000) 347,323,000
Net Changes 2,290,767,938$ 69,261,000$ 2,221,506,938$
3. Balances at June 30, 2015 75,315,562,085$ 55,074,788,000$ 20,240,774,085$
1 Balance at 6/30/2014 is before $(351,463,000) Post-Publication Adjustment.Balance at 6/30/2015 is Adjusted Market Value - See Page 1a.
2 Includes $(351,463,000) Post-Publication Adjustment to June 30, 2014 Assets.
Balances at June 30, 2015

Appendix APage 3a(2)
NYC Office of the Actuary October 11, 2016
NEW YORK CITY EMPLOYEES' RETIREMENT SYSTEM (NYCERS)
Governmental Accounting Standards Board Statements No. 67 and No. 68 (GASB 67/68)
Changes in Net Pension Liability (NPL) by Source
Total Pension Plan Fiduciary Net PensionLiability Net Position Liability
(a) (b) (a) - (b)1. Balances at June 30, 2014 19.501% 14,240,565,107$ 10,726,627,821$ 3,513,937,286$
2. Changes for the Year:a. Service Cost 345,240,602 0 345,240,602b. Interest 955,379,096 0 955,379,096c. Differences b/t Expected and Actual Experience (54,371,984) 0 (54,371,984)d. Contributions - Employer 0 595,392,607 (595,392,607)e. Contributions - Employee 0 88,007,104 (88,007,104)f. Net Investment Income 0 221,390,536 (221,390,536)g. Benefit Payments (814,667,034) (814,667,034) 0h. Payments to Other Retirement Systems 0 (1,345,553) 1,345,553i. Transfers to Variable Supplements Funds 0 0 0j. Administrative Expenses 0 (10,293,234) 10,293,234k. Other Changes 0 (65,435,653) 65,435,653
Net Changes 431,580,680$ 13,048,773$ 418,531,907$
3. SubTotal 14,672,145,787$ 10,739,676,594$ 3,932,469,193$
4. Changes in Proportionate Share (482,693,890) (363,586,535) (119,107,355)
5. Balances at June 30, 2015 18.840% 14,189,451,897$ 10,376,090,059$ 3,813,361,838$
Transit OperatingBalances at June 30, 2015

Appendix APage 3a(3)
NYC Office of the Actuary October 11, 2016
NEW YORK CITY EMPLOYEES' RETIREMENT SYSTEM (NYCERS)
Governmental Accounting Standards Board Statements No. 67 and No. 68 (GASB 67/68)
Changes in Net Pension Liability (NPL) by Source
Total Pension Plan Fiduciary Net PensionLiability Net Position Liability
(a) (b) (a) - (b)1. Balances at June 30, 2014 2.497% 1,823,429,109$ 1,373,488,009$ 449,941,100$
2. Changes for the Year:a. Service Cost 51,529,542 0 51,529,542b. Interest 142,596,922 0 142,596,922c. Differences b/t Expected and Actual Experience (8,115,394) 0 (8,115,394)d. Contributions - Employer 0 88,866,455 (88,866,455)e. Contributions - Employee 0 13,135,667 (13,135,667)f. Net Investment Income 0 33,044,065 (33,044,065)g. Benefit Payments (121,594,676) (121,594,676) 0h. Payments to Other Retirement Systems 0 (200,833) 200,833i. Transfers to Variable Supplements Funds 0 0 0j. Administrative Expenses 0 (1,536,336) 1,536,336k. Other Changes 0 (9,766,723) 9,766,723
Net Changes 64,416,394$ 1,947,619$ 62,468,775$
3. SubTotal 1,887,845,503$ 1,375,435,628$ 512,409,875$
4. Changes in Proportionate Share 230,028,103 173,267,411 56,760,692
5. Balances at June 30, 2015 2.812% 2,117,873,606$ 1,548,703,039$ 569,170,567$
Transit Non-OperatingBalances at June 30, 2015

Appendix APage 3a(4)
NYC Office of the Actuary October 11, 2016
NEW YORK CITY EMPLOYEES' RETIREMENT SYSTEM (NYCERS)
Governmental Accounting Standards Board Statements No. 67 and No. 68 (GASB 67/68)
Changes in Net Pension Liability (NPL) by Source
Total Pension Plan Fiduciary Net PensionLiability Net Position Liability
(a) (b) (a) - (b)1. Balances at June 30, 2014 0.645% 471,009,922$ 354,785,647$ 116,224,275$
2. Changes for the Year:a. Service Cost 12,094,416 0 12,094,416b. Interest 33,468,694 0 33,468,694c. Differences b/t Expected and Actual Experience (1,904,751) 0 (1,904,751)d. Contributions - Employer 0 20,857,703 (20,857,703)e. Contributions - Employee 0 3,083,051 (3,083,051)f. Net Investment Income 0 7,755,719 (7,755,719)g. Benefit Payments (28,539,291) (28,539,291) 0h. Payments to Other Retirement Systems 0 (47,137) 47,137i. Transfers to Variable Supplements Funds 0 0 0j. Administrative Expenses 0 (360,591) 360,591k. Other Changes 0 (2,292,332) 2,292,332
Net Changes 15,119,068$ 457,122$ 14,661,946$
3. SubTotal 486,128,990$ 355,242,769$ 130,886,221$
4. Changes in Proportionate Share 10,953,720 8,250,832 2,702,888
5. Balances at June 30, 2015 0.660% 497,082,710$ 363,493,601$ 133,589,109$
TA TPBalances at June 30, 2015

Appendix APage 3a(5)
NYC Office of the Actuary October 11, 2016
NEW YORK CITY EMPLOYEES' RETIREMENT SYSTEM (NYCERS)
Governmental Accounting Standards Board Statements No. 67 and No. 68 (GASB 67/68)
Changes in Net Pension Liability (NPL) by Source
Total Pension Plan Fiduciary Net PensionLiability Net Position Liability
(a) (b) (a) - (b)1. Balances at June 30, 2014 0.770% 562,290,913$ 423,542,558$ 138,748,355$
2. Changes for the Year:a. Service Cost 13,340,507 0 13,340,507b. Interest 36,916,984 0 36,916,984c. Differences b/t Expected and Actual Experience (2,100,998) 0 (2,100,998)d. Contributions - Employer 0 23,006,678 (23,006,678)e. Contributions - Employee 0 3,400,699 (3,400,699)f. Net Investment Income 0 8,554,794 (8,554,794)g. Benefit Payments (31,479,703) (31,479,703) 0h. Payments to Other Retirement Systems 0 (51,994) 51,994i. Transfers to Variable Supplements Funds 0 0 0j. Administrative Expenses 0 (397,743) 397,743k. Other Changes 0 (2,528,511) 2,528,511
Net Changes 16,676,790$ 504,220$ 16,172,570$
3. SubTotal 578,967,703$ 424,046,778$ 154,920,925$
4. Changes in Proportionate Share (30,670,411) (23,102,321) (7,568,090)
5. Balances at June 30, 2015 0.728% 548,297,292$ 400,944,457$ 147,352,835$
TA CP EngineersBalances at June 30, 2015

Appendix APage 3a(6)
NYC Office of the Actuary October 11, 2016
NEW YORK CITY EMPLOYEES' RETIREMENT SYSTEM (NYCERS)
Governmental Accounting Standards Board Statements No. 67 and No. 68 (GASB 67/68)
Changes in Net Pension Liability (NPL) by Source
Total Pension Plan Fiduciary Net PensionLiability Net Position Liability
(a) (b) (a) - (b)1. Balances at June 30, 2014 4.714% 3,442,388,797$ 2,592,960,544$ 849,428,253$
2. Changes for the Year:a. Service Cost 87,409,643 0 87,409,643b. Interest 241,887,383 0 241,887,383c. Differences b/t Expected and Actual Experience (13,766,155) 0 (13,766,155)d. Contributions - Employer 0 150,744,307 (150,744,307)e. Contributions - Employee 0 22,282,053 (22,282,053)f. Net Investment Income 0 56,052,699 (56,052,699)g. Benefit Payments (206,261,240) (206,261,240) 0h. Payments to Other Retirement Systems 0 (340,673) 340,673i. Transfers to Variable Supplements Funds 0 0 0j. Administrative Expenses 0 (2,606,090) 2,606,090k. Other Changes 0 (16,567,307) 16,567,307
Net Changes 109,269,631$ 3,303,749$ 105,965,882$
3. SubTotal 3,551,658,428$ 2,596,264,293$ 955,394,135$
4. Changes in Proportionate Share 40,893,884 30,803,095 10,090,789
5. Balances at June 30, 2015 4.770% 3,592,552,312$ 2,627,067,388$ 965,484,924$
HA RegularBalances at June 30, 2015

Appendix APage 3a(7)
NYC Office of the Actuary October 11, 2016
NEW YORK CITY EMPLOYEES' RETIREMENT SYSTEM (NYCERS)
Governmental Accounting Standards Board Statements No. 67 and No. 68 (GASB 67/68)
Changes in Net Pension Liability (NPL) by Source
Total Pension Plan Fiduciary Net PensionLiability Net Position Liability
(a) (b) (a) - (b)1. Balances at June 30, 2014 0.307% 224,186,118$ 168,866,966$ 55,319,152$
2. Changes for the Year:a. Service Cost 5,534,112 0 5,534,112b. Interest 15,314,463 0 15,314,463c. Differences b/t Expected and Actual Experience (871,568) 0 (871,568)d. Contributions - Employer 0 9,543,979 (9,543,979)e. Contributions - Employee 0 1,410,730 (1,410,730)f. Net Investment Income 0 3,548,829 (3,548,829)g. Benefit Payments (13,058,888) (13,058,888) 0h. Payments to Other Retirement Systems 0 (21,569) 21,569i. Transfers to Variable Supplements Funds 0 0 0j. Administrative Expenses 0 (164,998) 164,998k. Other Changes 0 (1,048,915) 1,048,915
Net Changes 6,918,119$ 209,168$ 6,708,951$
3. SubTotal 231,104,237$ 169,076,134$ 62,028,103$
4. Changes in Proportionate Share (3,651,239) (2,750,274) (900,965)
5. Balances at June 30, 2015 0.302% 227,452,998$ 166,325,860$ 61,127,138$
HA HPBalances at June 30, 2015

Appendix APage 3a(8)
NYC Office of the Actuary October 11, 2016
NEW YORK CITY EMPLOYEES' RETIREMENT SYSTEM (NYCERS)
Governmental Accounting Standards Board Statements No. 67 and No. 68 (GASB 67/68)
Changes in Net Pension Liability (NPL) by Source
Total Pension Plan Fiduciary Net PensionLiability Net Position Liability
(a) (b) (a) - (b)1. Balances at June 30, 2014 13.991% 10,216,898,949$ 7,695,823,284$ 2,521,075,665$
2. Changes for the Year:a. Service Cost 257,097,964 0 257,097,964b. Interest 711,463,308 0 711,463,308c. Differences b/t Expected and Actual Experience (40,490,389) 0 (40,490,389)d. Contributions - Employer 0 443,384,197 (443,384,197)e. Contributions - Employee 0 65,538,199 (65,538,199)f. Net Investment Income 0 164,867,793 (164,867,793)g. Benefit Payments (606,676,141) (606,676,141) 0h. Payments to Other Retirement Systems 0 (1,002,023) 1,002,023i. Transfers to Variable Supplements Funds 0 0 0j. Administrative Expenses 0 (7,665,291) 7,665,291k. Other Changes 0 (48,729,417) 48,729,417
Net Changes 321,394,742$ 9,717,317$ 311,677,425$
3. SubTotal 10,538,293,691$ 7,705,540,601$ 2,832,753,090$
4. Changes in Proportionate Share 28,479,669 21,452,155 7,027,514
5. Balances at June 30, 2015 14.030% 10,566,773,360$ 7,726,992,756$ 2,839,780,604$
HHCBalances at June 30, 2015

Appendix APage 3a(9)
NYC Office of the Actuary October 11, 2016
NEW YORK CITY EMPLOYEES' RETIREMENT SYSTEM (NYCERS)
Governmental Accounting Standards Board Statements No. 67 and No. 68 (GASB 67/68)
Changes in Net Pension Liability (NPL) by Source
Total Pension Plan Fiduciary Net PensionLiability Net Position Liability
(a) (b) (a) - (b)1. Balances at June 30, 2014 0.344% 251,205,291$ 189,219,013$ 61,986,278$
2. Changes for the Year:a. Service Cost 6,633,604 0 6,633,604b. Interest 18,357,072 0 18,357,072c. Differences b/t Expected and Actual Experience (1,044,727) 0 (1,044,727)d. Contributions - Employer 0 11,440,134 (11,440,134)e. Contributions - Employee 0 1,691,007 (1,691,007)f. Net Investment Income 0 4,253,895 (4,253,895)g. Benefit Payments (15,653,369) (15,653,369) 0h. Payments to Other Retirement Systems 0 (25,854) 25,854i. Transfers to Variable Supplements Funds 0 0 0j. Administrative Expenses 0 (197,779) 197,779k. Other Changes 0 (1,257,309) 1,257,309
Net Changes 8,292,580$ 250,725$ 8,041,855$
3. SubTotal 259,497,871$ 189,469,738$ 70,028,133$
4. Changes in Proportionate Share 13,144,464 9,900,995 3,243,469
5. Balances at June 30, 2015 0.362% 272,642,335$ 199,370,733$ 73,271,602$
OTBBalances at June 30, 2015

Appendix APage 3a(10)
NYC Office of the Actuary October 11, 2016
NEW YORK CITY EMPLOYEES' RETIREMENT SYSTEM (NYCERS)
Governmental Accounting Standards Board Statements No. 67 and No. 68 (GASB 67/68)
Changes in Net Pension Liability (NPL) by Source
Total Pension Plan Fiduciary Net PensionLiability Net Position Liability
(a) (b) (a) - (b)1. Balances at June 30, 2014 0.054% 39,433,388$ 29,702,985$ 9,730,403$
2. Changes for the Year:a. Service Cost 971,218 0 971,218b. Interest 2,687,638 0 2,687,638c. Differences b/t Expected and Actual Experience (152,957) 0 (152,957)d. Contributions - Employer 0 1,674,937 (1,674,937)e. Contributions - Employee 0 247,578 (247,578)f. Net Investment Income 0 622,808 (622,808)g. Benefit Payments (2,291,792) (2,291,792) 0h. Payments to Other Retirement Systems 0 (3,785) 3,785i. Transfers to Variable Supplements Funds 0 0 0j. Administrative Expenses 0 (28,957) 28,957k. Other Changes 0 (184,081) 184,081
Net Changes 1,214,107$ 36,708$ 1,177,399$
3. SubTotal 40,647,495$ 29,739,693$ 10,907,802$
4. Changes in Proportionate Share (730,247) (550,055) (180,192)
5. Balances at June 30, 2015 0.053% 39,917,248$ 29,189,638$ 10,727,610$
HDC/REMICBalances at June 30, 2015

Appendix APage 3a(11)
NYC Office of the Actuary October 11, 2016
NEW YORK CITY EMPLOYEES' RETIREMENT SYSTEM (NYCERS)
Governmental Accounting Standards Board Statements No. 67 and No. 68 (GASB 67/68)
Changes in Net Pension Liability (NPL) by Source
Total Pension Plan Fiduciary Net PensionLiability Net Position Liability
(a) (b) (a) - (b)1. Balances at June 30, 2014 0.034% 24,828,429$ 18,701,879$ 6,126,550$
2. Changes for the Year:a. Service Cost 586,396 0 586,396b. Interest 1,622,725 0 1,622,725c. Differences b/t Expected and Actual Experience (92,352) 0 (92,352)d. Contributions - Employer 0 1,011,283 (1,011,283)e. Contributions - Employee 0 149,481 (149,481)f. Net Investment Income 0 376,035 (376,035)g. Benefit Payments (1,383,723) (1,383,723) 0h. Payments to Other Retirement Systems 0 (2,285) 2,285i. Transfers to Variable Supplements Funds 0 0 0j. Administrative Expenses 0 (17,483) 17,483k. Other Changes 0 (111,143) 111,143
Net Changes 733,046$ 22,165$ 710,881$
3. SubTotal 25,561,475$ 18,724,044$ 6,837,431$
4. Changes in Proportionate Share (1,460,495) (1,100,112) (360,383)
5. Balances at June 30, 2015 0.032% 24,100,980$ 17,623,932$ 6,477,048$
Balances at June 30, 2015State Courts

Appendix APage 3a(12)
NYC Office of the Actuary October 11, 2016
NEW YORK CITY EMPLOYEES' RETIREMENT SYSTEM (NYCERS)
Governmental Accounting Standards Board Statements No. 67 and No. 68 (GASB 67/68)
Changes in Net Pension Liability (NPL) by Source
Total Pension Plan Fiduciary Net PensionLiability Net Position Liability
(a) (b) (a) - (b)1. Balances at June 30, 2014 0.048% 35,051,901$ 26,402,654$ 8,649,247$
2. Changes for the Year:a. Service Cost 769,645 0 769,645b. Interest 2,129,826 0 2,129,826c. Differences b/t Expected and Actual Experience (121,211) 0 (121,211)d. Contributions - Employer 0 1,327,308 (1,327,308)e. Contributions - Employee 0 196,194 (196,194)f. Net Investment Income 0 493,546 (493,546)g. Benefit Payments (1,816,137) (1,816,137) 0h. Payments to Other Retirement Systems 0 (3,000) 3,000i. Transfers to Variable Supplements Funds 0 0 0j. Administrative Expenses 0 (22,947) 22,947k. Other Changes 0 (145,876) 145,876
Net Changes 962,123$ 29,088$ 933,035$
3. SubTotal 36,014,024$ 26,431,742$ 9,582,282$
4. Changes in Proportionate Share (4,381,488) (3,300,331) (1,081,157)
5. Balances at June 30, 2015 0.042% 31,632,536$ 23,131,411$ 8,501,125$
SCABalances at June 30, 2015

Appendix APage 3a(13)
NYC Office of the Actuary October 11, 2016
NEW YORK CITY EMPLOYEES' RETIREMENT SYSTEM (NYCERS)
Governmental Accounting Standards Board Statements No. 67 and No. 68 (GASB 67/68)
Changes in Net Pension Liability (NPL) by Source
Total Pension Plan Fiduciary Net PensionLiability Net Position Liability
(a) (b) (a) - (b)1. Balances at June 30, 2014 0.005% 3,651,240$ 2,750,275$ 900,965$
2. Changes for the Year:a. Service Cost 91,624 0 91,624b. Interest 253,551 0 253,551c. Differences b/t Expected and Actual Experience (14,430) 0 (14,430)d. Contributions - Employer 0 158,013 (158,013)e. Contributions - Employee 0 23,356 (23,356)f. Net Investment Income 0 58,755 (58,755)g. Benefit Payments (216,207) (216,207) 0h. Payments to Other Retirement Systems 0 (357) 357i. Transfers to Variable Supplements Funds 0 0 0j. Administrative Expenses 0 (2,732) 2,732k. Other Changes 0 (17,366) 17,366
Net Changes 114,538$ 3,462$ 111,076$
3. SubTotal 3,765,778$ 2,753,737$ 1,012,041$
4. Changes in Proportionate Share 0 2 (2)
5. Balances at June 30, 2015 0.005% 3,765,778$ 2,753,739$ 1,012,039$
WFABalances at June 30, 2015

Appendix APage 3a(14)
NYC Office of the Actuary October 11, 2016
NEW YORK CITY EMPLOYEES' RETIREMENT SYSTEM (NYCERS)
Governmental Accounting Standards Board Statements No. 67 and No. 68 (GASB 67/68)
Changes in Net Pension Liability (NPL) by Source
Total Pension Plan Fiduciary Net PensionLiability Net Position Liability
(a) (b) (a) - (b)1. Balances at June 30, 2014 1.151% 840,515,381$ 633,113,616$ 207,401,765$
2. Changes for the Year:a. Service Cost 22,374,670 0 22,374,670b. Interest 61,917,085 0 61,917,085c. Differences b/t Expected and Actual Experience (3,523,789) 0 (3,523,789)d. Contributions - Employer 0 38,586,750 (38,586,750)e. Contributions - Employee 0 5,703,645 (5,703,645)f. Net Investment Income 0 14,348,081 (14,348,081)g. Benefit Payments (52,797,688) (52,797,688) 0h. Payments to Other Retirement Systems 0 (87,204) 87,204i. Transfers to Variable Supplements Funds 0 0 0j. Administrative Expenses 0 (667,093) 667,093k. Other Changes 0 (4,240,814) 4,240,814
Net Changes 27,970,278$ 845,677$ 27,124,601$
3. SubTotal 868,485,659$ 633,959,293$ 234,526,366$
4. Changes in Proportionate Share 51,117,354 38,503,868 12,613,486
5. Balances at June 30, 2015 1.221% 919,603,013$ 672,463,161$ 247,139,852$
Senior CollegesBalances at June 30, 2015

Appendix APage 3a(15)
NYC Office of the Actuary October 11, 2016
NEW YORK CITY EMPLOYEES' RETIREMENT SYSTEM (NYCERS)
Governmental Accounting Standards Board Statements No. 67 and No. 68 (GASB 67/68)
Changes in Net Pension Liability (NPL) by Source
Total Pension Plan Fiduciary Net PensionLiability Net Position Liability
(a) (b) (a) - (b)1. Balances at June 30, 2014 1.090% 795,970,256$ 599,560,245$ 196,410,011$
2. Changes for the Year:a. Service Cost 22,081,472 0 22,081,472b. Interest 61,105,722 0 61,105,722c. Differences b/t Expected and Actual Experience (3,477,614) 0 (3,477,614)d. Contributions - Employer 0 38,081,109 (38,081,109)e. Contributions - Employee 0 5,628,904 (5,628,904)f. Net Investment Income 0 14,160,063 (14,160,063)g. Benefit Payments (52,105,827) (52,105,827) 0h. Payments to Other Retirement Systems 0 (86,061) 86,061i. Transfers to Variable Supplements Funds 0 0 0j. Administrative Expenses 0 (658,352) 658,352k. Other Changes 0 (4,185,242) 4,185,242
Net Changes 27,603,753$ 834,594$ 26,769,159$
3. SubTotal 823,574,009$ 600,394,839$ 223,179,170$
4. Changes in Proportionate Share 83,978,514 63,256,356 20,722,158
5. Balances at June 30, 2015 1.205% 907,552,523$ 663,651,195$ 243,901,328$
Balances at June 30, 2015TBTA

Appendix APage 3a(16)
NYC Office of the Actuary October 11, 2016
NEW YORK CITY EMPLOYEES' RETIREMENT SYSTEM (NYCERS)
Governmental Accounting Standards Board Statements No. 67 and No. 68 (GASB 67/68)
Changes in Net Pension Liability (NPL) by Source
Total Pension Plan Fiduciary Net PensionLiability Net Position Liability
(a) (b) (a) - (b)1. Balances at June 30, 2014 54.849% 40,053,369,346$ 30,169,981,504$ 9,883,387,842$
2. Changes for the Year:a. Service Cost 1,006,731,855 0 1,006,731,855b. Interest 2,785,913,840 0 2,785,913,840c. Differences b/t Expected and Actual Experience (158,550,322) 0 (158,550,322)d. Contributions - Employer 0 1,736,182,540 (1,736,182,540)e. Contributions - Employee 0 256,631,332 (256,631,332)f. Net Investment Income 0 645,581,382 (645,581,382)g. Benefit Payments (2,375,593,284) (2,375,593,284) 0h. Payments to Other Retirement Systems 0 (3,923,672) 3,923,672i. Transfers to Variable Supplements Funds 0 0 0j. Administrative Expenses 0 (30,015,374) 30,015,374k. Other Changes 0 (190,812,311) 190,812,311
Net Changes 1,258,502,089$ 38,050,613$ 1,220,451,476$
3. SubTotal 41,311,871,435$ 30,208,032,117$ 11,103,839,318$
4. Changes in Proportionate Share 64,992,062 48,954,914 16,037,148
5. Balances at June 30, 2015 54.938% 41,376,863,497$ 30,256,987,031$ 11,119,876,466$
City TotalBalances at June 30, 2015

Appendix APage 3b(1)
NYC Office of the Actuary October 11, 2016
NEW YORK CITY EMPLOYEES' RETIREMENT SYSTEM (NYCERS)
Governmental Accounting Standards Board Statements No. 67 and No. 68 (GASB 67/68)
Changes in Net Pension Liability (NPL) by Source
Total Pension Plan Fiduciary Net PensionLiability Net Position1 Liability
(a) (b) (a) - (b)1. Balances at June 30, 2015 75,315,562,085$ 55,074,788,000$ 20,240,774,085$
2. Changes for the Year:a. Service Cost 1,899,994,413 0 1,899,994,413b. Interest 5,372,603,831 0 5,372,603,831c. Differences b/t Expected and Actual Experience (817,971,278) 0 (817,971,278)d. Changes of Assumptions 2,563,091,847 0 2,563,091,847e. Contributions - Employer 0 3,365,454,000 (3,365,454,000)f. Contributions - Employee 0 485,508,000 (485,508,000)g. Net Investment Income 0 1,171,904,000 (1,171,904,000)h. Benefit Payments (4,494,146,000) (4,494,146,000) 0i. Payments to Other Retirement Systems 0 (7,440,000) 7,440,000j. Transfers to Variable Supplements Funds 0 0 0k. Administrative Expenses 0 (56,683,000) 56,683,000l. Other Changes 0 2,928,000 (2,928,000)
Net Changes 4,523,572,813$ 467,525,000$ 4,056,047,813$
3. Balances at June 30, 2016 79,839,134,898$ 55,542,313,000$ 24,296,821,898$
1 Balances at 6/30/2015 and 6/30/2016 are Adjusted Market Values - See Page 1a.
Balances at June 30, 2016

Appendix APage 3b(2)
NYC Office of the Actuary October 11, 2016
NEW YORK CITY EMPLOYEES' RETIREMENT SYSTEM (NYCERS)
Governmental Accounting Standards Board Statements No. 67 and No. 68 (GASB 67/68)
Changes in Net Pension Liability (NPL) by Source
Total Pension Plan Fiduciary Net PensionLiability Net Position Liability
(a) (b) (a) - (b)1. Balances at June 30, 2015 18.840% 14,189,451,897$ 10,376,090,059$ 3,813,361,838$
2. Changes for the Year:a. Service Cost 347,926,977 0 347,926,977b. Interest 983,831,214 0 983,831,214c. Differences b/t Expected and Actual Experience (149,786,900) 0 (149,786,900)d. Changes of Assumptions 469,353,379 0 469,353,379e. Contributions - Employer 0 616,281,936 (616,281,936)f. Contributions - Employee 0 88,906,225 (88,906,225)g. Net Investment Income 0 214,599,060 (214,599,060)h. Benefit Payments (822,968,016) (822,968,016) 0i. Payments to Other Retirement Systems 0 (1,362,413) 1,362,413j. Transfers to Variable Supplements Funds 0 0 0k. Administrative Expenses 0 (10,379,791) 10,379,791l. Other Changes 0 536,175 (536,175)
Net Changes 828,356,654$ 85,613,176$ 742,743,478$
3. SubTotal 15,017,808,551$ 10,461,703,235$ 4,556,105,316$
4. Changes in Proportionate Share (397,666,166) (290,794,878) (106,871,288)
5. Balances at June 30, 2016 18.312% 14,620,142,385$ 10,170,908,357$ 4,449,234,028$
Transit OperatingBalances at June 30, 2016

Appendix APage 3b(3)
NYC Office of the Actuary October 11, 2016
NEW YORK CITY EMPLOYEES' RETIREMENT SYSTEM (NYCERS)
Governmental Accounting Standards Board Statements No. 67 and No. 68 (GASB 67/68)
Changes in Net Pension Liability (NPL) by Source
Total Pension Plan Fiduciary Net PensionLiability Net Position Liability
(a) (b) (a) - (b)1. Balances at June 30, 2015 2.812% 2,117,873,606$ 1,548,703,039$ 569,170,567$
2. Changes for the Year:a. Service Cost 60,400,822 0 60,400,822b. Interest 170,795,076 0 170,795,076c. Differences b/t Expected and Actual Experience (26,003,307) 0 (26,003,307)d. Changes of Assumptions 81,480,690 0 81,480,690e. Contributions - Employer 0 106,987,783 (106,987,783)f. Contributions - Employee 0 15,434,299 (15,434,299)g. Net Investment Income 0 37,254,828 (37,254,828)h. Benefit Payments (142,868,901) (142,868,901) 0i. Payments to Other Retirement Systems 0 (236,518) 236,518j. Transfers to Variable Supplements Funds 0 0 0k. Administrative Expenses 0 (1,801,953) 1,801,953l. Other Changes 0 93,081 (93,081)
Net Changes 143,804,380$ 14,862,619$ 128,941,761$
3. SubTotal 2,261,677,986$ 1,563,565,658$ 698,112,328$
4. Changes in Proportionate Share 276,408,113 202,124,472 74,283,641
5. Balances at June 30, 2016 3.179% 2,538,086,099$ 1,765,690,130$ 772,395,969$
Transit Non-OperatingBalances at June 30, 2016

Appendix APage 3b(4)
NYC Office of the Actuary October 11, 2016
NEW YORK CITY EMPLOYEES' RETIREMENT SYSTEM (NYCERS)
Governmental Accounting Standards Board Statements No. 67 and No. 68 (GASB 67/68)
Changes in Net Pension Liability (NPL) by Source
Total Pension Plan Fiduciary Net PensionLiability Net Position Liability
(a) (b) (a) - (b)1. Balances at June 30, 2015 0.660% 497,082,710$ 363,493,601$ 133,589,109$
2. Changes for the Year:a. Service Cost 12,767,962 0 12,767,962b. Interest 36,103,898 0 36,103,898c. Differences b/t Expected and Actual Experience (5,496,767) 0 (5,496,767)d. Changes of Assumptions 17,223,977 0 17,223,977e. Contributions - Employer 0 22,615,851 (22,615,851)f. Contributions - Employee 0 3,262,614 (3,262,614)g. Net Investment Income 0 7,875,195 (7,875,195)h. Benefit Payments (30,200,661) (30,200,661) 0i. Payments to Other Retirement Systems 0 (49,997) 49,997j. Transfers to Variable Supplements Funds 0 0 0k. Administrative Expenses 0 (380,910) 380,910l. Other Changes 0 19,676 (19,676)
Net Changes 30,398,409$ 3,141,768$ 27,256,641$
3. SubTotal 527,481,119$ 366,635,369$ 160,845,750$
4. Changes in Proportionate Share 9,037,867 6,608,974 2,428,893
5. Balances at June 30, 2016 0.672% 536,518,986$ 373,244,343$ 163,274,643$
Balances at June 30, 2016TA TP

Appendix APage 3b(5)
NYC Office of the Actuary October 11, 2016
NEW YORK CITY EMPLOYEES' RETIREMENT SYSTEM (NYCERS)
Governmental Accounting Standards Board Statements No. 67 and No. 68 (GASB 67/68)
Changes in Net Pension Liability (NPL) by Source
Total Pension Plan Fiduciary Net PensionLiability Net Position Liability
(a) (b) (a) - (b)1. Balances at June 30, 2015 0.728% 548,297,292$ 400,944,457$ 147,352,835$
2. Changes for the Year:a. Service Cost 13,983,959 0 13,983,959b. Interest 39,542,364 0 39,542,364c. Differences b/t Expected and Actual Experience (6,020,269) 0 (6,020,269)d. Changes of Assumptions 18,864,356 0 18,864,356e. Contributions - Employer 0 24,769,741 (24,769,741)f. Contributions - Employee 0 3,573,339 (3,573,339)g. Net Investment Income 0 8,625,213 (8,625,213)h. Benefit Payments (33,076,915) (33,076,915) 0i. Payments to Other Retirement Systems 0 (54,758) 54,758j. Transfers to Variable Supplements Funds 0 0 0k. Administrative Expenses 0 (417,187) 417,187l. Other Changes 0 21,550 (21,550)
Net Changes 33,293,495$ 3,440,983$ 29,852,512$
3. SubTotal 581,590,787$ 404,385,440$ 177,205,347$
4. Changes in Proportionate Share 6,025,246 4,405,984 1,619,262
5. Balances at June 30, 2016 0.736% 587,616,033$ 408,791,424$ 178,824,609$
TA CP EngineersBalances at June 30, 2016

Appendix APage 3b(6)
NYC Office of the Actuary October 11, 2016
NEW YORK CITY EMPLOYEES' RETIREMENT SYSTEM (NYCERS)
Governmental Accounting Standards Board Statements No. 67 and No. 68 (GASB 67/68)
Changes in Net Pension Liability (NPL) by Source
Total Pension Plan Fiduciary Net PensionLiability Net Position Liability
(a) (b) (a) - (b)1. Balances at June 30, 2015 4.770% 3,592,552,312$ 2,627,067,388$ 965,484,924$
2. Changes for the Year:a. Service Cost 89,356,737 0 89,356,737b. Interest 252,673,558 0 252,673,558c. Differences b/t Expected and Actual Experience (38,469,189) 0 (38,469,189)d. Changes of Assumptions 120,542,210 0 120,542,210e. Contributions - Employer 0 158,277,302 (158,277,302)f. Contributions - Employee 0 22,833,441 (22,833,441)g. Net Investment Income 0 55,114,645 (55,114,645)h. Benefit Payments (211,359,686) (211,359,686) 0i. Payments to Other Retirement Systems 0 (349,903) 349,903j. Transfers to Variable Supplements Funds 0 0 0k. Administrative Expenses 0 (2,665,801) 2,665,801l. Other Changes 0 137,704 (137,704)
Net Changes 212,743,630$ 21,987,702$ 190,755,928$
3. SubTotal 3,805,295,942$ 2,649,055,090$ 1,156,240,852$
4. Changes in Proportionate Share (50,461,429) (36,900,110) (13,561,319)
5. Balances at June 30, 2016 4.703% 3,754,834,513$ 2,612,154,980$ 1,142,679,533$
HA RegularBalances at June 30, 2016

Appendix APage 3b(7)
NYC Office of the Actuary October 11, 2016
NEW YORK CITY EMPLOYEES' RETIREMENT SYSTEM (NYCERS)
Governmental Accounting Standards Board Statements No. 67 and No. 68 (GASB 67/68)
Changes in Net Pension Liability (NPL) by Source
Total Pension Plan Fiduciary Net PensionLiability Net Position Liability
(a) (b) (a) - (b)1. Balances at June 30, 2015 0.302% 227,452,998$ 166,325,860$ 61,127,138$
2. Changes for the Year:a. Service Cost 5,585,984 0 5,585,984b. Interest 15,795,455 0 15,795,455c. Differences b/t Expected and Actual Experience (2,404,836) 0 (2,404,836)d. Changes of Assumptions 7,535,490 0 7,535,490e. Contributions - Employer 0 9,894,435 (9,894,435)f. Contributions - Employee 0 1,427,394 (1,427,394)g. Net Investment Income 0 3,445,398 (3,445,398)h. Benefit Payments (13,212,789) (13,212,789) 0i. Payments to Other Retirement Systems 0 (21,874) 21,874j. Transfers to Variable Supplements Funds 0 0 0k. Administrative Expenses 0 (166,648) 166,648l. Other Changes 0 8,608 (8,608)
Net Changes 13,299,304$ 1,374,524$ 11,924,780$
3. SubTotal 240,752,302$ 167,700,384$ 73,051,918$
4. Changes in Proportionate Share (6,025,245) (4,405,983) (1,619,262)
5. Balances at June 30, 2016 0.294% 234,727,057$ 163,294,401$ 71,432,656$
Balances at June 30, 2016HA HP

Appendix APage 3b(8)
NYC Office of the Actuary October 11, 2016
NEW YORK CITY EMPLOYEES' RETIREMENT SYSTEM (NYCERS)
Governmental Accounting Standards Board Statements No. 67 and No. 68 (GASB 67/68)
Changes in Net Pension Liability (NPL) by Source
Total Pension Plan Fiduciary Net PensionLiability Net Position Liability
(a) (b) (a) - (b)1. Balances at June 30, 2015 14.030% 10,566,773,360$ 7,726,992,756$ 2,839,780,604$
2. Changes for the Year:a. Service Cost 280,990,174 0 280,990,174b. Interest 794,554,381 0 794,554,381c. Differences b/t Expected and Actual Experience (120,969,772) 0 (120,969,772)d. Changes of Assumptions 379,055,653 0 379,055,653e. Contributions - Employer 0 497,716,992 (497,716,992)f. Contributions - Employee 0 71,801,778 (71,801,778)g. Net Investment Income 0 173,312,883 (173,312,883)h. Benefit Payments (664,639,252) (664,639,252) 0i. Payments to Other Retirement Systems 0 (1,100,302) 1,100,302j. Transfers to Variable Supplements Funds 0 0 0k. Administrative Expenses 0 (8,382,849) 8,382,849l. Other Changes 0 433,022 (433,022)
Net Changes 668,991,184$ 69,142,272$ 599,848,912$
3. SubTotal 11,235,764,544$ 7,796,135,028$ 3,439,629,516$
4. Changes in Proportionate Share 571,645,117 418,017,642 153,627,475
5. Balances at June 30, 2016 14.789% 11,807,409,661$ 8,214,152,670$ 3,593,256,991$
HHCBalances at June 30, 2016

Appendix APage 3b(9)
NYC Office of the Actuary October 11, 2016
NEW YORK CITY EMPLOYEES' RETIREMENT SYSTEM (NYCERS)
Governmental Accounting Standards Board Statements No. 67 and No. 68 (GASB 67/68)
Changes in Net Pension Liability (NPL) by Source
Total Pension Plan Fiduciary Net PensionLiability Net Position Liability
(a) (b) (a) - (b)1. Balances at June 30, 2015 0.362% 272,642,335$ 199,370,733$ 73,271,602$
2. Changes for the Year:a. Service Cost 11,646,966 0 11,646,966b. Interest 32,934,061 0 32,934,061c. Differences b/t Expected and Actual Experience (5,014,164) 0 (5,014,164)d. Changes of Assumptions 15,711,753 0 15,711,753e. Contributions - Employer 0 20,630,233 (20,630,233)f. Contributions - Employee 0 2,976,164 (2,976,164)g. Net Investment Income 0 7,183,772 (7,183,772)h. Benefit Payments (27,549,115) (27,549,115) 0i. Payments to Other Retirement Systems 0 (45,607) 45,607j. Transfers to Variable Supplements Funds 0 0 0k. Administrative Expenses 0 (347,467) 347,467l. Other Changes 0 17,949 (17,949)
Net Changes 27,729,501$ 2,865,929$ 24,863,572$
3. SubTotal 300,371,836$ 202,236,662$ 98,135,174$
4. Changes in Proportionate Share 189,042,060 138,237,717 50,804,343
5. Balances at June 30, 2016 0.613% 489,413,896$ 340,474,379$ 148,939,517$
OTBBalances at June 30, 2016

Appendix APage 3b(10)
NYC Office of the Actuary October 11, 2016
NEW YORK CITY EMPLOYEES' RETIREMENT SYSTEM (NYCERS)
Governmental Accounting Standards Board Statements No. 67 and No. 68 (GASB 67/68)
Changes in Net Pension Liability (NPL) by Source
Total Pension Plan Fiduciary Net PensionLiability Net Position Liability
(a) (b) (a) - (b)1. Balances at June 30, 2015 0.053% 39,917,248$ 29,189,638$ 10,727,610$
2. Changes for the Year:a. Service Cost 1,006,997 0 1,006,997b. Interest 2,847,480 0 2,847,480c. Differences b/t Expected and Actual Experience (433,525) 0 (433,525)d. Changes of Assumptions 1,358,439 0 1,358,439e. Contributions - Employer 0 1,783,691 (1,783,691)f. Contributions - Employee 0 257,319 (257,319)g. Net Investment Income 0 621,109 (621,109)h. Benefit Payments (2,381,897) (2,381,897) 0i. Payments to Other Retirement Systems 0 (3,943) 3,943j. Transfers to Variable Supplements Funds 0 0 0k. Administrative Expenses 0 (30,042) 30,042l. Other Changes 0 1,552 (1,552)
Net Changes 2,397,494$ 247,789$ 2,149,705$
3. SubTotal 42,314,742$ 29,437,427$ 12,877,315$
4. Changes in Proportionate Share (1) (1) 0
5. Balances at June 30, 2016 0.053% 42,314,741$ 29,437,426$ 12,877,315$
HDC/REMICBalances at June 30, 2016

Appendix APage 3b(11)
NYC Office of the Actuary October 11, 2016
NEW YORK CITY EMPLOYEES' RETIREMENT SYSTEM (NYCERS)
Governmental Accounting Standards Board Statements No. 67 and No. 68 (GASB 67/68)
Changes in Net Pension Liability (NPL) by Source
Total Pension Plan Fiduciary Net PensionLiability Net Position Liability
(a) (b) (a) - (b)1. Balances at June 30, 2015 0.032% 24,100,980$ 17,623,932$ 6,477,048$
2. Changes for the Year:a. Service Cost 588,998 0 588,998b. Interest 1,665,507 0 1,665,507c. Differences b/t Expected and Actual Experience (253,571) 0 (253,571)d. Changes of Assumptions 794,558 0 794,558e. Contributions - Employer 0 1,043,291 (1,043,291)f. Contributions - Employee 0 150,507 (150,507)g. Net Investment Income 0 363,290 (363,290)h. Benefit Payments (1,393,185) (1,393,185) 0i. Payments to Other Retirement Systems 0 (2,306) 2,306j. Transfers to Variable Supplements Funds 0 0 0k. Administrative Expenses 0 (17,572) 17,572l. Other Changes 0 908 (908)
Net Changes 1,402,307$ 144,933$ 1,257,374$
3. SubTotal 25,503,287$ 17,768,865$ 7,734,422$
4. Changes in Proportionate Share (753,156) (550,748) (202,408)
5. Balances at June 30, 2016 0.031% 24,750,131$ 17,218,117$ 7,532,014$
State CourtsBalances at June 30, 2016

Appendix APage 3b(12)
NYC Office of the Actuary October 11, 2016
NEW YORK CITY EMPLOYEES' RETIREMENT SYSTEM (NYCERS)
Governmental Accounting Standards Board Statements No. 67 and No. 68 (GASB 67/68)
Changes in Net Pension Liability (NPL) by Source
Total Pension Plan Fiduciary Net PensionLiability Net Position Liability
(a) (b) (a) - (b)1. Balances at June 30, 2015 0.042% 31,632,536$ 23,131,411$ 8,501,125$
2. Changes for the Year:a. Service Cost 1,044,997 0 1,044,997b. Interest 2,954,932 0 2,954,932c. Differences b/t Expected and Actual Experience (449,884) 0 (449,884)d. Changes of Assumptions 1,409,701 0 1,409,701e. Contributions - Employer 0 1,851,000 (1,851,000)f. Contributions - Employee 0 267,029 (267,029)g. Net Investment Income 0 644,547 (644,547)h. Benefit Payments (2,471,780) (2,471,780) 0i. Payments to Other Retirement Systems 0 (4,092) 4,092j. Transfers to Variable Supplements Funds 0 0 0k. Administrative Expenses 0 (31,176) 31,176l. Other Changes 0 1,610 (1,610)
Net Changes 2,487,966$ 257,138$ 2,230,828$
3. SubTotal 34,120,502$ 23,388,549$ 10,731,953$
4. Changes in Proportionate Share 9,791,024 7,159,723 2,631,301
5. Balances at June 30, 2016 0.055% 43,911,526$ 30,548,272$ 13,363,254$
Balances at June 30, 2016SCA

Appendix APage 3b(13)
NYC Office of the Actuary October 11, 2016
NEW YORK CITY EMPLOYEES' RETIREMENT SYSTEM (NYCERS)
Governmental Accounting Standards Board Statements No. 67 and No. 68 (GASB 67/68)
Changes in Net Pension Liability (NPL) by Source
Total Pension Plan Fiduciary Net PensionLiability Net Position Liability
(a) (b) (a) - (b)1. Balances at June 30, 2015 0.005% 3,765,778$ 2,753,739$ 1,012,039$
2. Changes for the Year:a. Service Cost 95,000 0 95,000b. Interest 268,630 0 268,630c. Differences b/t Expected and Actual Experience (40,899) 0 (40,899)d. Changes of Assumptions 128,155 0 128,155e. Contributions - Employer 0 168,273 (168,273)f. Contributions - Employee 0 24,275 (24,275)g. Net Investment Income 0 58,595 (58,595)h. Benefit Payments (224,707) (224,707) 0i. Payments to Other Retirement Systems 0 (372) 372j. Transfers to Variable Supplements Funds 0 0 0k. Administrative Expenses 0 (2,834) 2,834l. Other Changes 0 146 (146)
Net Changes 226,179$ 23,376$ 202,803$
3. SubTotal 3,991,957$ 2,777,115$ 1,214,842$
4. Changes in Proportionate Share 1 1 0
5. Balances at June 30, 2016 0.005% 3,991,958$ 2,777,116$ 1,214,842$
WFABalances at June 30, 2016

Appendix APage 3b(14)
NYC Office of the Actuary October 11, 2016
NEW YORK CITY EMPLOYEES' RETIREMENT SYSTEM (NYCERS)
Governmental Accounting Standards Board Statements No. 67 and No. 68 (GASB 67/68)
Changes in Net Pension Liability (NPL) by Source
Total Pension Plan Fiduciary Net PensionLiability Net Position Liability
(a) (b) (a) - (b)1. Balances at June 30, 2015 1.221% 919,603,013$ 672,463,161$ 247,139,852$
2. Changes for the Year:a. Service Cost 23,692,930 0 23,692,930b. Interest 66,996,370 0 66,996,370c. Differences b/t Expected and Actual Experience (10,200,102) 0 (10,200,102)d. Changes of Assumptions 31,961,755 0 31,961,755e. Contributions - Employer 0 41,967,211 (41,967,211)f. Contributions - Employee 0 6,054,285 (6,054,285)g. Net Investment Income 0 14,613,643 (14,613,643)h. Benefit Payments (56,042,001) (56,042,001) 0i. Payments to Other Retirement Systems 0 (92,777) 92,777j. Transfers to Variable Supplements Funds 0 0 0k. Administrative Expenses 0 (706,837) 706,837l. Other Changes 0 36,512 (36,512)
Net Changes 56,408,952$ 5,830,036$ 50,578,916$
3. SubTotal 976,011,965$ 678,293,197$ 297,718,768$
4. Changes in Proportionate Share 19,582,047 14,319,446 5,262,601
5. Balances at June 30, 2016 1.247% 995,594,012$ 692,612,643$ 302,981,369$
Senior CollegesBalances at June 30, 2016

Appendix APage 3b(15)
NYC Office of the Actuary October 11, 2016
NEW YORK CITY EMPLOYEES' RETIREMENT SYSTEM (NYCERS)
Governmental Accounting Standards Board Statements No. 67 and No. 68 (GASB 67/68)
Changes in Net Pension Liability (NPL) by Source
Total Pension Plan Fiduciary Net PensionLiability Net Position Liability
(a) (b) (a) - (b)1. Balances at June 30, 2015 1.205% 907,552,523$ 663,651,195$ 243,901,328$
2. Changes for the Year:a. Service Cost 24,053,929 0 24,053,929b. Interest 68,017,165 0 68,017,165c. Differences b/t Expected and Actual Experience (10,355,516) 0 (10,355,516)d. Changes of Assumptions 32,448,743 0 32,448,743e. Contributions - Employer 0 42,606,648 (42,606,648)f. Contributions - Employee 0 6,146,531 (6,146,531)g. Net Investment Income 0 14,836,305 (14,836,305)h. Benefit Payments (56,895,888) (56,895,888) 0i. Payments to Other Retirement Systems 0 (94,190) 94,190j. Transfers to Variable Supplements Funds 0 0 0k. Administrative Expenses 0 (717,607) 717,607l. Other Changes 0 37,068 (37,068)
Net Changes 57,268,433$ 5,918,867$ 51,349,566$
3. SubTotal 964,820,956$ 669,570,062$ 295,250,894$
4. Changes in Proportionate Share 45,942,493 33,595,621 12,346,872
5. Balances at June 30, 2016 1.266% 1,010,763,449$ 703,165,683$ 307,597,766$
TBTABalances at June 30, 2016

Appendix APage 3b(16)
NYC Office of the Actuary October 11, 2016
NEW YORK CITY EMPLOYEES' RETIREMENT SYSTEM (NYCERS)
Governmental Accounting Standards Board Statements No. 67 and No. 68 (GASB 67/68)
Changes in Net Pension Liability (NPL) by Source
Total Pension Plan Fiduciary Net PensionLiability Net Position Liability
(a) (b) (a) - (b)1. Balances at June 30, 2015 54.938% 41,376,863,497$ 30,256,987,031$ 11,119,876,466$
2. Changes for the Year:a. Service Cost 1,026,851,981 0 1,026,851,981b. Interest 2,903,623,740 0 2,903,623,740c. Differences b/t Expected and Actual Experience (442,072,577) 0 (442,072,577)d. Changes of Assumptions 1,385,222,988 0 1,385,222,988e. Contributions - Employer 0 1,818,859,613 (1,818,859,613)f. Contributions - Employee 0 262,392,800 (262,392,800)g. Net Investment Income 0 633,355,517 (633,355,517)h. Benefit Payments (2,428,861,207) (2,428,861,207) 0i. Payments to Other Retirement Systems 0 (4,020,948) 4,020,948j. Transfers to Variable Supplements Funds 0 0 0k. Administrative Expenses 0 (30,634,326) 30,634,326l. Other Changes 0 1,582,439 (1,582,439)
Net Changes 2,444,764,925$ 252,673,888$ 2,192,091,037$
3. SubTotal 43,821,628,422$ 30,509,660,919$ 13,311,967,503$
4. Changes in Proportionate Share (672,567,971) (491,817,860) (180,750,111)
5. Balances at June 30, 2016 54.045% 43,149,060,451$ 30,017,843,059$ 13,131,217,392$
Balances at June 30, 2016City Total

Appendix APage 3c
NYC Office of the Actuary October 11, 2016
Transit TA Non- TA CP Senior Operating Operating TA TP Engineers HA Regular HA HP HHC OTB HDC/REMIC State Courts SCA WFA Colleges TBTA City Total Total
Balances at June 30, 2014 14,240,565,107$ 1,823,429,109$ 471,009,922$ 562,290,913$ 3,442,388,797$ 224,186,118$ 10,216,898,949$ 251,205,291$ 39,433,388$ 24,828,429$ 35,051,901$ 3,651,240$ 840,515,381$ 795,970,256$ 40,053,369,346$ 73,024,794,147$
Changes for the Year:Service Cost 345,240,602 51,529,542 12,094,416 13,340,507 87,409,643 5,534,112 257,097,964 6,633,604 971,218 586,396 769,645 91,624 22,374,670 22,081,472 1,006,731,855 1,832,487,270Interest 955,379,096 142,596,922 33,468,694 36,916,984 241,887,383 15,314,463 711,463,308 18,357,072 2,687,638 1,622,725 2,129,826 253,551 61,917,085 61,105,722 2,785,913,840 5,071,014,309Differences b/t Expected and Actual Experience (54,371,984) (8,115,394) (1,904,751) (2,100,998) (13,766,155) (871,568) (40,490,389) (1,044,727) (152,957) (92,352) (121,211) (14,430) (3,523,789) (3,477,614) (158,550,322) (288,598,641)Benefit Payments (814,667,034) (121,594,676) (28,539,291) (31,479,703) (206,261,240) (13,058,888) (606,676,141) (15,653,369) (2,291,792) (1,383,723) (1,816,137) (216,207) (52,797,688) (52,105,827) (2,375,593,284) (4,324,135,000)
Net Changes 431,580,680$ 64,416,394$ 15,119,068$ 16,676,790$ 109,269,631$ 6,918,119$ 321,394,742$ 8,292,580$ 1,214,107$ 733,046$ 962,123$ 114,538$ 27,970,278$ 27,603,753$ 1,258,502,089$ 2,290,767,938$
SubTotal 14,672,145,787$ 1,887,845,503$ 486,128,990$ 578,967,703$ 3,551,658,428$ 231,104,237$ 10,538,293,691$ 259,497,871$ 40,647,495$ 25,561,475$ 36,014,024$ 3,765,778$ 868,485,659$ 823,574,009$ 41,311,871,435$ 75,315,562,085$
Changes in Proportionate Share (482,693,890) 230,028,103 10,953,720 (30,670,411) 40,893,884 (3,651,239) 28,479,669 13,144,464 (730,247) (1,460,495) (4,381,488) 0 51,117,354 83,978,514 64,992,062 0
Balances at June 30, 2015 14,189,451,897$ 2,117,873,606$ 497,082,710$ 548,297,292$ 3,592,552,312$ 227,452,998$ 10,566,773,360$ 272,642,335$ 39,917,248$ 24,100,980$ 31,632,536$ 3,765,778$ 919,603,013$ 907,552,523$ 41,376,863,497$ 75,315,562,085$
Transit TA Non- TA CP Senior Operating Operating TA TP Engineers HA Regular HA HP HHC OTB HDC/REMIC State Courts SCA WFA Colleges TBTA City Total Total
Balances at June 30, 2014 10,726,627,821$ 1,373,488,009$ 354,785,647$ 423,542,558$ 2,592,960,544$ 168,866,966$ 7,695,823,284$ 189,219,013$ 29,702,985$ 18,701,879$ 26,402,654$ 2,750,275$ 633,113,616$ 599,560,245$ 30,169,981,504$ 55,005,527,000$
Changes for the Year:Contributions - Employer 595,392,607 88,866,455 20,857,703 23,006,678 150,744,307 9,543,979 443,384,197 11,440,134 1,674,937 1,011,283 1,327,308 158,013 38,586,750 38,081,109 1,736,182,540 3,160,258,000Contributions - Employee 88,007,104 13,135,667 3,083,051 3,400,699 22,282,053 1,410,730 65,538,199 1,691,007 247,578 149,481 196,194 23,356 5,703,645 5,628,904 256,631,332 467,129,000Net Investment Income 221,390,536 33,044,065 7,755,719 8,554,794 56,052,699 3,548,829 164,867,793 4,253,895 622,808 376,035 493,546 58,755 14,348,081 14,160,063 645,581,382 1,175,109,000Benefit Payments (814,667,034) (121,594,676) (28,539,291) (31,479,703) (206,261,240) (13,058,888) (606,676,141) (15,653,369) (2,291,792) (1,383,723) (1,816,137) (216,207) (52,797,688) (52,105,827) (2,375,593,284) (4,324,135,000)Payments to Other Retirement Systems (1,345,553) (200,833) (47,137) (51,994) (340,673) (21,569) (1,002,023) (25,854) (3,785) (2,285) (3,000) (357) (87,204) (86,061) (3,923,672) (7,142,000)Transfers to Variable Supplements Funds 0 0 0 0 0 0 0 0 0 0 0 0 0 0 0 0Administrative Expenses (10,293,234) (1,536,336) (360,591) (397,743) (2,606,090) (164,998) (7,665,291) (197,779) (28,957) (17,483) (22,947) (2,732) (667,093) (658,352) (30,015,374) (54,635,000)Other Changes2 (65,435,653) (9,766,723) (2,292,332) (2,528,511) (16,567,307) (1,048,915) (48,729,417) (1,257,309) (184,081) (111,143) (145,876) (17,366) (4,240,814) (4,185,242) (190,812,311) (347,323,000)
Net Changes 13,048,773$ 1,947,619$ 457,122$ 504,220$ 3,303,749$ 209,168$ 9,717,317$ 250,725$ 36,708$ 22,165$ 29,088$ 3,462$ 845,677$ 834,594$ 38,050,613$ 69,261,000$
SubTotal 10,739,676,594$ 1,375,435,628$ 355,242,769$ 424,046,778$ 2,596,264,293$ 169,076,134$ 7,705,540,601$ 189,469,738$ 29,739,693$ 18,724,044$ 26,431,742$ 2,753,737$ 633,959,293$ 600,394,839$ 30,208,032,117$ 55,074,788,000$
Changes in Proportionate Share (363,586,535) 173,267,411 8,250,832 (23,102,321) 30,803,095 (2,750,274) 21,452,155 9,900,995 (550,055) (1,100,112) (3,300,331) 2 38,503,868 63,256,356 48,954,914 0
Balances at June 30, 2015 10,376,090,059$ 1,548,703,039$ 363,493,601$ 400,944,457$ 2,627,067,388$ 166,325,860$ 7,726,992,756$ 199,370,733$ 29,189,638$ 17,623,932$ 23,131,411$ 2,753,739$ 672,463,161$ 663,651,195$ 30,256,987,031$ 55,074,788,000$
Transit TA Non- TA CP Senior Operating Operating TA TP Engineers HA Regular HA HP HHC OTB HDC/REMIC State Courts SCA WFA Colleges TBTA City Total Total
Balances at June 30, 2014 3,513,937,286$ 449,941,100$ 116,224,275$ 138,748,355$ 849,428,253$ 55,319,152$ 2,521,075,665$ 61,986,278$ 9,730,403$ 6,126,550$ 8,649,247$ 900,965$ 207,401,765$ 196,410,011$ 9,883,387,842$ 18,019,267,147$
Changes for the Year:Service Cost 345,240,602 51,529,542 12,094,416 13,340,507 87,409,643 5,534,112 257,097,964 6,633,604 971,218 586,396 769,645 91,624 22,374,670 22,081,472 1,006,731,855 1,832,487,270Interest 955,379,096 142,596,922 33,468,694 36,916,984 241,887,383 15,314,463 711,463,308 18,357,072 2,687,638 1,622,725 2,129,826 253,551 61,917,085 61,105,722 2,785,913,840 5,071,014,309Differences b/t Expected and Actual Experience (54,371,984) (8,115,394) (1,904,751) (2,100,998) (13,766,155) (871,568) (40,490,389) (1,044,727) (152,957) (92,352) (121,211) (14,430) (3,523,789) (3,477,614) (158,550,322) (288,598,641)Contributions - Employer (595,392,607) (88,866,455) (20,857,703) (23,006,678) (150,744,307) (9,543,979) (443,384,197) (11,440,134) (1,674,937) (1,011,283) (1,327,308) (158,013) (38,586,750) (38,081,109) (1,736,182,540) (3,160,258,000)Contributions - Employee (88,007,104) (13,135,667) (3,083,051) (3,400,699) (22,282,053) (1,410,730) (65,538,199) (1,691,007) (247,578) (149,481) (196,194) (23,356) (5,703,645) (5,628,904) (256,631,332) (467,129,000)Net Investment Income (221,390,536) (33,044,065) (7,755,719) (8,554,794) (56,052,699) (3,548,829) (164,867,793) (4,253,895) (622,808) (376,035) (493,546) (58,755) (14,348,081) (14,160,063) (645,581,382) (1,175,109,000)Benefit Payments 0 0 0 0 0 0 0 0 0 0 0 0 0 0 0 0Payments to Other Retirement Systems 1,345,553 200,833 47,137 51,994 340,673 21,569 1,002,023 25,854 3,785 2,285 3,000 357 87,204 86,061 3,923,672 7,142,000Transfers to Variable Supplements Funds 0 0 0 0 0 0 0 0 0 0 0 0 0 0 0 0Administrative Expenses 10,293,234 1,536,336 360,591 397,743 2,606,090 164,998 7,665,291 197,779 28,957 17,483 22,947 2,732 667,093 658,352 30,015,374 54,635,000Other Changes2 65,435,653 9,766,723 2,292,332 2,528,511 16,567,307 1,048,915 48,729,417 1,257,309 184,081 111,143 145,876 17,366 4,240,814 4,185,242 190,812,311 347,323,000
Net Changes 418,531,907$ 62,468,775$ 14,661,946$ 16,172,570$ 105,965,882$ 6,708,951$ 311,677,425$ 8,041,855$ 1,177,399$ 710,881$ 933,035$ 111,076$ 27,124,601$ 26,769,159$ 1,220,451,476$ 2,221,506,938$
SubTotal 3,932,469,193$ 512,409,875$ 130,886,221$ 154,920,925$ 955,394,135$ 62,028,103$ 2,832,753,090$ 70,028,133$ 10,907,802$ 6,837,431$ 9,582,282$ 1,012,041$ 234,526,366$ 223,179,170$ 11,103,839,318$ 20,240,774,085$
Changes in Proportionate Share (119,107,355) 56,760,692 2,702,888 (7,568,090) 10,090,789 (900,965) 7,027,514 3,243,469 (180,192) (360,383) (1,081,157) (2) 12,613,486 20,722,158 16,037,148 0
Balances at June 30, 2015 3,813,361,838$ 569,170,567$ 133,589,109$ 147,352,835$ 965,484,924$ 61,127,138$ 2,839,780,604$ 73,271,602$ 10,727,610$ 6,477,048$ 8,501,125$ 1,012,039$ 247,139,852$ 243,901,328$ 11,119,876,466$ 20,240,774,085$
1 Balance at 6/30/2014 is before $(351,463,000) Post-Publication Adjustment. Balance at 6/30/2015 is Adjusted Market Value - See Page 1a.2 Includes $(351,463,000) Post-Publication Adjustment to June 30, 2014 Assets.
Net Pension Liability
NEW YORK CITY EMPLOYEES' RETIREMENT SYSTEM (NYCERS)
Governmental Accounting Standards Board Statements No. 67 and No. 68 (GASB 67/68)
Changes in Net Pension Liability (NPL) by Source - By Obligor
Total Pension Liability
Plan Fiduciary Net Position1

Appendix APage 3d
NYC Office of the Actuary October 11, 2016
TRANSIT TA NON- TA CP Senior OPERATING OPERATING TA TP Engineers HA Regular HA HP HHC OTB HDC/REMIC State Courts SCA WFA Colleges TBTA City Total TOTAL
Balances at June 30, 2015 14,189,451,897$ 2,117,873,606$ 497,082,710$ 548,297,292$ 3,592,552,312$ 227,452,998$ 10,566,773,360$ 272,642,335$ 39,917,248$ 24,100,980$ 31,632,536$ 3,765,778$ 919,603,013$ 907,552,523$ 41,376,863,497$ 75,315,562,085$
Changes for the Year:Service Cost 347,926,977 60,400,822 12,767,962 13,983,959 89,356,737 5,585,984 280,990,174 11,646,966 1,006,997 588,998 1,044,997 95,000 23,692,930 24,053,929 1,026,851,981 1,899,994,413Interest 983,831,214 170,795,076 36,103,898 39,542,364 252,673,558 15,795,455 794,554,381 32,934,061 2,847,480 1,665,507 2,954,932 268,630 66,996,370 68,017,165 2,903,623,740 5,372,603,831Differences b/t Expected and Actual Experience (149,786,900) (26,003,307) (5,496,767) (6,020,269) (38,469,189) (2,404,836) (120,969,772) (5,014,164) (433,525) (253,571) (449,884) (40,899) (10,200,102) (10,355,516) (442,072,577) (817,971,278)Changes of Assumptions 469,353,379 81,480,690 17,223,977 18,864,356 120,542,210 7,535,490 379,055,653 15,711,753 1,358,439 794,558 1,409,701 128,155 31,961,755 32,448,743 1,385,222,988 2,563,091,847Benefit Payments (822,968,016) (142,868,901) (30,200,661) (33,076,915) (211,359,686) (13,212,789) (664,639,252) (27,549,115) (2,381,897) (1,393,185) (2,471,780) (224,707) (56,042,001) (56,895,888) (2,428,861,207) (4,494,146,000)
Net Changes 828,356,654$ 143,804,380$ 30,398,409$ 33,293,495$ 212,743,630$ 13,299,304$ 668,991,184$ 27,729,501$ 2,397,494$ 1,402,307$ 2,487,966$ 226,179$ 56,408,952$ 57,268,433$ 2,444,764,925$ 4,523,572,813$
SubTotal 15,017,808,551$ 2,261,677,986$ 527,481,119$ 581,590,787$ 3,805,295,942$ 240,752,302$ 11,235,764,544$ 300,371,836$ 42,314,742$ 25,503,287$ 34,120,502$ 3,991,957$ 976,011,965$ 964,820,956$ 43,821,628,422$ 79,839,134,898$
Changes in Proportionate Share (397,666,166) 276,408,113 9,037,867 6,025,246 (50,461,429) (6,025,245) 571,645,117 189,042,060 (1) (753,156) 9,791,024 1 19,582,047 45,942,493 (672,567,971) 0
Balances at June 30, 2016 14,620,142,385$ 2,538,086,099$ 536,518,986$ 587,616,033$ 3,754,834,513$ 234,727,057$ 11,807,409,661$ 489,413,896$ 42,314,741$ 24,750,131$ 43,911,526$ 3,991,958$ 995,594,012$ 1,010,763,449$ 43,149,060,451$ 79,839,134,898$
TRANSIT TA NON- TA CP Senior OPERATING OPERATING TA TP Engineers HA Regular HA HP HHC OTB HDC/REMIC State Courts SCA WFA Colleges TBTA CITY Total TOTAL
Balances at June 30, 2015 10,376,090,059$ 1,548,703,039$ 363,493,601$ 400,944,457$ 2,627,067,388$ 166,325,860$ 7,726,992,756$ 199,370,733$ 29,189,638$ 17,623,932$ 23,131,411$ 2,753,739$ 672,463,161$ 663,651,195$ 30,256,987,031$ 55,074,788,000$
Changes for the Year:Contributions - Employer 616,281,936 106,987,783 22,615,851 24,769,741 158,277,302 9,894,435 497,716,992 20,630,233 1,783,691 1,043,291 1,851,000 168,273 41,967,211 42,606,648 1,818,859,613 3,365,454,000Contributions - Employee 88,906,225 15,434,299 3,262,614 3,573,339 22,833,441 1,427,394 71,801,778 2,976,164 257,319 150,507 267,029 24,275 6,054,285 6,146,531 262,392,800 485,508,000Net Investment Income 214,599,060 37,254,828 7,875,195 8,625,213 55,114,645 3,445,398 173,312,883 7,183,772 621,109 363,290 644,547 58,595 14,613,643 14,836,305 633,355,517 1,171,904,000Benefit Payments (822,968,016) (142,868,901) (30,200,661) (33,076,915) (211,359,686) (13,212,789) (664,639,252) (27,549,115) (2,381,897) (1,393,185) (2,471,780) (224,707) (56,042,001) (56,895,888) (2,428,861,207) (4,494,146,000)Payments to Other Retirement Systems (1,362,413) (236,518) (49,997) (54,758) (349,903) (21,874) (1,100,302) (45,607) (3,943) (2,306) (4,092) (372) (92,777) (94,190) (4,020,948) (7,440,000)Transfers to Variable Supplements Funds 0 0 0 0 0 0 0 0 0 0 0 0 0 0 0 0Administrative Expenses (10,379,791) (1,801,953) (380,910) (417,187) (2,665,801) (166,648) (8,382,849) (347,467) (30,042) (17,572) (31,176) (2,834) (706,837) (717,607) (30,634,326) (56,683,000)Other Changes 536,175 93,081 19,676 21,550 137,704 8,608 433,022 17,949 1,552 908 1,610 146 36,512 37,068 1,582,439 2,928,000
Net Changes 85,613,176$ 14,862,619$ 3,141,768$ 3,440,983$ 21,987,702$ 1,374,524$ 69,142,272$ 2,865,929$ 247,789$ 144,933$ 257,138$ 23,376$ 5,830,036$ 5,918,867$ 252,673,888$ 467,525,000$
SubTotal 10,461,703,235$ 1,563,565,658$ 366,635,369$ 404,385,440$ 2,649,055,090$ 167,700,384$ 7,796,135,028$ 202,236,662$ 29,437,427$ 17,768,865$ 23,388,549$ 2,777,115$ 678,293,197$ 669,570,062$ 30,509,660,919$ 55,542,313,000$
Changes in Proportionate Share (290,794,878) 202,124,472 6,608,974 4,405,984 (36,900,110) (4,405,983) 418,017,642 138,237,717 (1) (550,748) 7,159,723 1 14,319,446 33,595,621 (491,817,860) 0
Balances at June 30, 2016 10,170,908,357$ 1,765,690,130$ 373,244,343$ 408,791,424$ 2,612,154,980$ 163,294,401$ 8,214,152,670$ 340,474,379$ 29,437,426$ 17,218,117$ 30,548,272$ 2,777,116$ 692,612,643$ 703,165,683$ 30,017,843,059$ 55,542,313,000$
TRANSIT TA NON- TA CP Senior OPERATING OPERATING TA TP Engineers HA Regular HA HP HHC OTB HDC/REMIC State Courts SCA WFA Colleges TBTA CITY Total TOTAL
Balances at June 30, 2015 3,813,361,838$ 569,170,567$ 133,589,109$ 147,352,835$ 965,484,924$ 61,127,138$ 2,839,780,604$ 73,271,602$ 10,727,610$ 6,477,048$ 8,501,125$ 1,012,039$ 247,139,852$ 243,901,328$ 11,119,876,466$ 20,240,774,085$
Changes for the Year:Service Cost 347,926,977 60,400,822 12,767,962 13,983,959 89,356,737 5,585,984 280,990,174 11,646,966 1,006,997 588,998 1,044,997 95,000 23,692,930 24,053,929 1,026,851,981 1,899,994,413Interest 983,831,214 170,795,076 36,103,898 39,542,364 252,673,558 15,795,455 794,554,381 32,934,061 2,847,480 1,665,507 2,954,932 268,630 66,996,370 68,017,165 2,903,623,740 5,372,603,831Differences b/t Expected and Actual experience (149,786,900) (26,003,307) (5,496,767) (6,020,269) (38,469,189) (2,404,836) (120,969,772) (5,014,164) (433,525) (253,571) (449,884) (40,899) (10,200,102) (10,355,516) (442,072,577) (817,971,278)Changes of Assumptions 469,353,379 81,480,690 17,223,977 18,864,356 120,542,210 7,535,490 379,055,653 15,711,753 1,358,439 794,558 1,409,701 128,155 31,961,755 32,448,743 1,385,222,988 2,563,091,847Contributions - Employer (616,281,936) (106,987,783) (22,615,851) (24,769,741) (158,277,302) (9,894,435) (497,716,992) (20,630,233) (1,783,691) (1,043,291) (1,851,000) (168,273) (41,967,211) (42,606,648) (1,818,859,613) (3,365,454,000)Contributions - Employee (88,906,225) (15,434,299) (3,262,614) (3,573,339) (22,833,441) (1,427,394) (71,801,778) (2,976,164) (257,319) (150,507) (267,029) (24,275) (6,054,285) (6,146,531) (262,392,800) (485,508,000)Net Investment Income (214,599,060) (37,254,828) (7,875,195) (8,625,213) (55,114,645) (3,445,398) (173,312,883) (7,183,772) (621,109) (363,290) (644,547) (58,595) (14,613,643) (14,836,305) (633,355,517) (1,171,904,000)Benefit Payments 0 0 0 0 0 0 0 0 0 0 0 0 0 0 0 0Payments to Other Retirement Systems 1,362,413 236,518 49,997 54,758 349,903 21,874 1,100,302 45,607 3,943 2,306 4,092 372 92,777 94,190 4,020,948 7,440,000Transfers to Variable Supplements Funds 0 0 0 0 0 0 0 0 0 0 0 0 0 0 0 0Administrative Expenses 10,379,791 1,801,953 380,910 417,187 2,665,801 166,648 8,382,849 347,467 30,042 17,572 31,176 2,834 706,837 717,607 30,634,326 56,683,000Other Changes (536,175) (93,081) (19,676) (21,550) (137,704) (8,608) (433,022) (17,949) (1,552) (908) (1,610) (146) (36,512) (37,068) (1,582,439) (2,928,000)
Net Changes 742,743,478$ 128,941,761$ 27,256,641$ 29,852,512$ 190,755,928$ 11,924,780$ 599,848,912$ 24,863,572$ 2,149,705$ 1,257,374$ 2,230,828$ 202,803$ 50,578,916$ 51,349,566$ 2,192,091,037$ 4,056,047,813$
SubTotal 4,556,105,316$ 698,112,328$ 160,845,750$ 177,205,347$ 1,156,240,852$ 73,051,918$ 3,439,629,516$ 98,135,174$ 12,877,315$ 7,734,422$ 10,731,953$ 1,214,842$ 297,718,768$ 295,250,894$ 13,311,967,503$ 24,296,821,898$
Changes in Proportionate Share (106,871,288) 74,283,641 2,428,893 1,619,262 (13,561,319) (1,619,262) 153,627,475 50,804,343 0 (202,408) 2,631,301 0 5,262,601 12,346,872 (180,750,111) 0
Balances at June 30, 2016 4,449,234,028$ 772,395,969$ 163,274,643$ 178,824,609$ 1,142,679,533$ 71,432,656$ 3,593,256,991$ 148,939,517$ 12,877,315$ 7,532,014$ 13,363,254$ 1,214,842$ 302,981,369$ 307,597,766$ 13,131,217,392$ 24,296,821,898$
1 Balances at 6/30/2015 and 6/30/2016 are Adjusted Market Values - See Page 1a.
Net Pension Liability
NEW YORK CITY EMPLOYEES' RETIREMENT SYSTEM (NYCERS)
Governmental Accounting Standards Board Statements No. 67 and No. 68 (GASB 67/68)
Changes in Net Pension Liability (NPL) by Source - By Obligor
Total Pension Liability
Plan Fiduciary Net Position1

Appendix APage 4a(1)
NYC Office of the Actuary October 11, 2016
NEW YORK CITY EMPLOYEES' RETIREMENT SYSTEM (NYCERS)
Components of Pension Expense for the Fiscal Year Ended June 30, 2015
Component Amount
a. Service Cost 1,832,487,270$ b. Interest on the Total Pension Liability 5,071,014,309c. Changes of Assumptions 0d. Differences between Expected and Actual Experience (85,637,579)e. Employee Contributions (467,129,000)f. Projected Earnings on Pension Plan Investments (3,799,826,092)g. Differences between Projected and Actual Earnings on Plan Investments (868,227,630)h. Pension Plan Administrative Expenses 54,635,000i. Other Changes in Fiduciary Net Position* 354,465,000
Total Pension Expense 2,091,781,278$
* Includes Payments to Other Retirement Systems and $(351,463,000) Post-Publication Adjustment.
Governmental Accounting Standards Board Statements No. 67 and No. 68 (GASB 67/68)

Appendix APage 4a(2)
NYC Office of the Actuary October 11, 2016
NEW YORK CITY EMPLOYEES' RETIREMENT SYSTEM (NYCERS)
Components of Pension Expense for the Fiscal Year Ended June 30, 2015
Component Amount
a. Service Cost 345,240,602$ b. Interest on the Total Pension Liability 955,379,096c. Changes of Assumptions 0d. Differences between Expected and Actual Experience (16,134,120)e. Employee Contributions (88,007,104)f. Projected Earnings on Pension Plan Investments (715,887,236)g. Differences between Projected and Actual Earnings on Plan Investments (163,574,085)h. Pension Plan Administrative Expenses 10,293,234i. Other Changes in Fiduciary Net Position 66,781,206
SubTotal 394,091,593$
k. Changes in Proportionate Share (45,492,023)
Total Pension Expense 348,599,570$
Governmental Accounting Standards Board Statements No. 67 and No. 68 (GASB 67/68)
Transit Operating

Appendix APage 4a(3)
NYC Office of the Actuary October 11, 2016
NEW YORK CITY EMPLOYEES' RETIREMENT SYSTEM (NYCERS)
Components of Pension Expense for the Fiscal Year Ended June 30, 2015
Component Amount
a. Service Cost 51,529,542$ b. Interest on the Total Pension Liability 142,596,922c. Changes of Assumptions 0d. Differences between Expected and Actual Experience (2,408,129)e. Employee Contributions (13,135,667)f. Projected Earnings on Pension Plan Investments (106,851,110)g. Differences between Projected and Actual Earnings on Plan Investments (24,414,561)h. Pension Plan Administrative Expenses 1,536,336i. Other Changes in Fiduciary Net Position 9,967,556
SubTotal 58,820,889$
k. Changes in Proportionate Share 21,679,254
Total Pension Expense 80,500,143$
Governmental Accounting Standards Board Statements No. 67 and No. 68 (GASB 67/68)
Transit Non-Operating

Appendix APage 4a(4)
NYC Office of the Actuary October 11, 2016
NEW YORK CITY EMPLOYEES' RETIREMENT SYSTEM (NYCERS)
Components of Pension Expense for the Fiscal Year Ended June 30, 2015
Component Amount
a. Service Cost 12,094,416$ b. Interest on the Total Pension Liability 33,468,694c. Changes of Assumptions 0d. Differences between Expected and Actual Experience (565,208)e. Employee Contributions (3,083,051)f. Projected Earnings on Pension Plan Investments (25,078,852)g. Differences between Projected and Actual Earnings on Plan Investments (5,730,302)h. Pension Plan Administrative Expenses 360,591i. Other Changes in Fiduciary Net Position 2,339,469
SubTotal 13,805,757$
k. Changes in Proportionate Share 1,032,346
Total Pension Expense 14,838,103$
TA TP
Governmental Accounting Standards Board Statements No. 67 and No. 68 (GASB 67/68)

Appendix APage 4a(5)
NYC Office of the Actuary October 11, 2016
NEW YORK CITY EMPLOYEES' RETIREMENT SYSTEM (NYCERS)
Components of Pension Expense for the Fiscal Year Ended June 30, 2015
Component Amount
a. Service Cost 13,340,507$ b. Interest on the Total Pension Liability 36,916,984c. Changes of Assumptions 0d. Differences between Expected and Actual Experience (623,442)e. Employee Contributions (3,400,699)f. Projected Earnings on Pension Plan Investments (27,662,734)g. Differences between Projected and Actual Earnings on Plan Investments (6,320,697)h. Pension Plan Administrative Expenses 397,743i. Other Changes in Fiduciary Net Position 2,580,505
SubTotal 15,228,167$
k. Changes in Proportionate Share (2,890,567)
Total Pension Expense 12,337,600$
Governmental Accounting Standards Board Statements No. 67 and No. 68 (GASB 67/68)
TA CP Engineers

Appendix APage 4a(6)
NYC Office of the Actuary October 11, 2016
NEW YORK CITY EMPLOYEES' RETIREMENT SYSTEM (NYCERS)
Components of Pension Expense for the Fiscal Year Ended June 30, 2015
Component Amount
a. Service Cost 87,409,643$ b. Interest on the Total Pension Liability 241,887,383c. Changes of Assumptions 0d. Differences between Expected and Actual Experience (4,084,913)e. Employee Contributions (22,282,053)f. Projected Earnings on Pension Plan Investments (181,251,705)g. Differences between Projected and Actual Earnings on Plan Investments (41,414,458)h. Pension Plan Administrative Expenses 2,606,090i. Other Changes in Fiduciary Net Position 16,907,981
SubTotal 99,777,968$
k. Changes in Proportionate Share 3,854,090
Total Pension Expense 103,632,058$
Governmental Accounting Standards Board Statements No. 67 and No. 68 (GASB 67/68)
HA Regular

Appendix APage 4a(7)
NYC Office of the Actuary October 11, 2016
NEW YORK CITY EMPLOYEES' RETIREMENT SYSTEM (NYCERS)
Components of Pension Expense for the Fiscal Year Ended June 30, 2015
Component Amount
a. Service Cost 5,534,112$ b. Interest on the Total Pension Liability 15,314,463c. Changes of Assumptions 0d. Differences between Expected and Actual Experience (258,625)e. Employee Contributions (1,410,730)f. Projected Earnings on Pension Plan Investments (11,475,475)g. Differences between Projected and Actual Earnings on Plan Investments (2,622,047)h. Pension Plan Administrative Expenses 164,998i. Other Changes in Fiduciary Net Position 1,070,484
SubTotal 6,317,180$
k. Changes in Proportionate Share (344,115)
Total Pension Expense 5,973,065$
Governmental Accounting Standards Board Statements No. 67 and No. 68 (GASB 67/68)
HA HP

Appendix APage 4a(8)
NYC Office of the Actuary October 11, 2016
NEW YORK CITY EMPLOYEES' RETIREMENT SYSTEM (NYCERS)
Components of Pension Expense for the Fiscal Year Ended June 30, 2015
Component Amount
a. Service Cost 257,097,964$ b. Interest on the Total Pension Liability 711,463,308c. Changes of Assumptions 0d. Differences between Expected and Actual Experience (12,014,952)e. Employee Contributions (65,538,199)f. Projected Earnings on Pension Plan Investments (533,115,601)g. Differences between Projected and Actual Earnings on Plan Investments (121,812,336)h. Pension Plan Administrative Expenses 7,665,291i. Other Changes in Fiduciary Net Position 49,731,440
SubTotal 293,476,915$
k. Changes in Proportionate Share 2,684,098
Total Pension Expense 296,161,013$
HHC
Governmental Accounting Standards Board Statements No. 67 and No. 68 (GASB 67/68)

Appendix APage 4a(9)
NYC Office of the Actuary October 11, 2016
NEW YORK CITY EMPLOYEES' RETIREMENT SYSTEM (NYCERS)
Components of Pension Expense for the Fiscal Year Ended June 30, 2015
Component Amount
a. Service Cost 6,633,604$ b. Interest on the Total Pension Liability 18,357,072c. Changes of Assumptions 0d. Differences between Expected and Actual Experience (310,008)e. Employee Contributions (1,691,007)f. Projected Earnings on Pension Plan Investments (13,755,370)g. Differences between Projected and Actual Earnings on Plan Investments (3,142,984)h. Pension Plan Administrative Expenses 197,779i. Other Changes in Fiduciary Net Position 1,283,163
SubTotal 7,572,249$
k. Changes in Proportionate Share 1,238,814
Total Pension Expense 8,811,063$
Governmental Accounting Standards Board Statements No. 67 and No. 68 (GASB 67/68)
OTB

Appendix APage 4a(10)
NYC Office of the Actuary October 11, 2016
NEW YORK CITY EMPLOYEES' RETIREMENT SYSTEM (NYCERS)
Components of Pension Expense for the Fiscal Year Ended June 30, 2015
Component Amount
a. Service Cost 971,218$ b. Interest on the Total Pension Liability 2,687,638c. Changes of Assumptions 0d. Differences between Expected and Actual Experience (45,388)e. Employee Contributions (247,578)f. Projected Earnings on Pension Plan Investments (2,013,908)g. Differences between Projected and Actual Earnings on Plan Investments (460,161)h. Pension Plan Administrative Expenses 28,957i. Other Changes in Fiduciary Net Position 187,866
SubTotal 1,108,644$
k. Changes in Proportionate Share (68,822)
Total Pension Expense 1,039,822$
Governmental Accounting Standards Board Statements No. 67 and No. 68 (GASB 67/68)
HDC/REMIC

Appendix APage 4a(11)
NYC Office of the Actuary October 11, 2016
NEW YORK CITY EMPLOYEES' RETIREMENT SYSTEM (NYCERS)
Components of Pension Expense for the Fiscal Year Ended June 30, 2015
Component Amount
a. Service Cost 586,396$ b. Interest on the Total Pension Liability 1,622,725c. Changes of Assumptions 0d. Differences between Expected and Actual Experience (27,404)e. Employee Contributions (149,481)f. Projected Earnings on Pension Plan Investments (1,215,944)g. Differences between Projected and Actual Earnings on Plan Investments (277,833)h. Pension Plan Administrative Expenses 17,483i. Other Changes in Fiduciary Net Position 113,429
SubTotal 669,371$
k. Changes in Proportionate Share (137,646)
Total Pension Expense 531,725$
Governmental Accounting Standards Board Statements No. 67 and No. 68 (GASB 67/68)
State Courts

Appendix APage 4a(12)
NYC Office of the Actuary October 11, 2016
NEW YORK CITY EMPLOYEES' RETIREMENT SYSTEM (NYCERS)
Components of Pension Expense for the Fiscal Year Ended June 30, 2015
Component Amount
a. Service Cost 769,645$ b. Interest on the Total Pension Liability 2,129,826c. Changes of Assumptions 0d. Differences between Expected and Actual Experience (35,968)e. Employee Contributions (196,194)f. Projected Earnings on Pension Plan Investments (1,595,927)g. Differences between Projected and Actual Earnings on Plan Investments (364,656)h. Pension Plan Administrative Expenses 22,947i. Other Changes in Fiduciary Net Position 148,875
SubTotal 878,548$
k. Changes in Proportionate Share (412,938)
Total Pension Expense 465,610$
Governmental Accounting Standards Board Statements No. 67 and No. 68 (GASB 67/68)
SCA

Appendix APage 4a(13)
NYC Office of the Actuary October 11, 2016
NEW YORK CITY EMPLOYEES' RETIREMENT SYSTEM (NYCERS)
Components of Pension Expense for the Fiscal Year Ended June 30, 2015
Component Amount
a. Service Cost 91,624$ b. Interest on the Total Pension Liability 253,551c. Changes of Assumptions 0d. Differences between Expected and Actual Experience (4,282)e. Employee Contributions (23,356)f. Projected Earnings on Pension Plan Investments (189,991)g. Differences between Projected and Actual Earnings on Plan Investments (43,411)h. Pension Plan Administrative Expenses 2,732i. Other Changes in Fiduciary Net Position 17,723
SubTotal 104,590$
k. Changes in Proportionate Share 0
Total Pension Expense 104,590$
WFA
Governmental Accounting Standards Board Statements No. 67 and No. 68 (GASB 67/68)

Appendix APage 4a(14)
NYC Office of the Actuary October 11, 2016
NEW YORK CITY EMPLOYEES' RETIREMENT SYSTEM (NYCERS)
Components of Pension Expense for the Fiscal Year Ended June 30, 2015
Component Amount
a. Service Cost 22,374,670$ b. Interest on the Total Pension Liability 61,917,085c. Changes of Assumptions 0d. Differences between Expected and Actual Experience (1,045,635)e. Employee Contributions (5,703,645)f. Projected Earnings on Pension Plan Investments (46,395,877)g. Differences between Projected and Actual Earnings on Plan Investments (10,601,059)h. Pension Plan Administrative Expenses 667,093i. Other Changes in Fiduciary Net Position 4,328,018
SubTotal 25,540,650$
k. Changes in Proportionate Share 4,817,612
Total Pension Expense 30,358,262$
Governmental Accounting Standards Board Statements No. 67 and No. 68 (GASB 67/68)
Senior Colleges

Appendix APage 4a(15)
NYC Office of the Actuary October 11, 2016
NEW YORK CITY EMPLOYEES' RETIREMENT SYSTEM (NYCERS)
Components of Pension Expense for the Fiscal Year Ended June 30, 2015
Component Amount
a. Service Cost 22,081,472$ b. Interest on the Total Pension Liability 61,105,722c. Changes of Assumptions 0d. Differences between Expected and Actual Experience (1,031,933)e. Employee Contributions (5,628,904)f. Projected Earnings on Pension Plan Investments (45,787,904)g. Differences between Projected and Actual Earnings on Plan Investments (10,462,143)h. Pension Plan Administrative Expenses 658,352i. Other Changes in Fiduciary Net Position 4,271,303
SubTotal 25,205,965$
k. Changes in Proportionate Share 7,914,648
Total Pension Expense 33,120,613$
Governmental Accounting Standards Board Statements No. 67 and No. 68 (GASB 67/68)
TBTA

Appendix APage 4a(16)
NYC Office of the Actuary October 11, 2016
NEW YORK CITY EMPLOYEES' RETIREMENT SYSTEM (NYCERS)
Components of Pension Expense for the Fiscal Year Ended June 30, 2015
Component Amount
a. Service Cost 1,006,731,855$ b. Interest on the Total Pension Liability 2,785,913,840c. Changes of Assumptions 0d. Differences between Expected and Actual Experience (47,047,572)e. Employee Contributions (256,631,332)f. Projected Earnings on Pension Plan Investments (2,087,548,458)g. Differences between Projected and Actual Earnings on Plan Investments (476,986,897)h. Pension Plan Administrative Expenses 30,015,374i. Other Changes in Fiduciary Net Position 194,735,982
SubTotal 1,149,182,792$
k. Changes in Proportionate Share 6,125,249
Total Pension Expense 1,155,308,041$
Governmental Accounting Standards Board Statements No. 67 and No. 68 (GASB 67/68)
City Total

Appendix APage 4b(1)
NYC Office of the Actuary October 11, 2016
NEW YORK CITY EMPLOYEES' RETIREMENT SYSTEM (NYCERS)
Components of Pension Expense for the Fiscal Year Ended June 30, 2016
Component Amount
a. Service Cost 1,899,994,413$ b. Interest on the Total Pension Liability 5,372,603,831c. Differences between Expected and Actual Experience (331,274,599)d. Changes of Assumptions 769,697,251e. Employee Contributions (485,508,000)f. Projected Earnings on Pension Plan Investments (3,830,997,478)g. Differences between Projected and Actual Earnings on Plan Investments (336,408,936)h. Pension Plan Administrative Expenses 56,683,000i. Other Changes in Fiduciary Net Position* 4,512,000
Total Pension Expense 3,119,301,482$
* Includes Payments to Other Retirement Systems.
Governmental Accounting Standards Board Statements No. 67 and No. 68 (GASB 67/68)
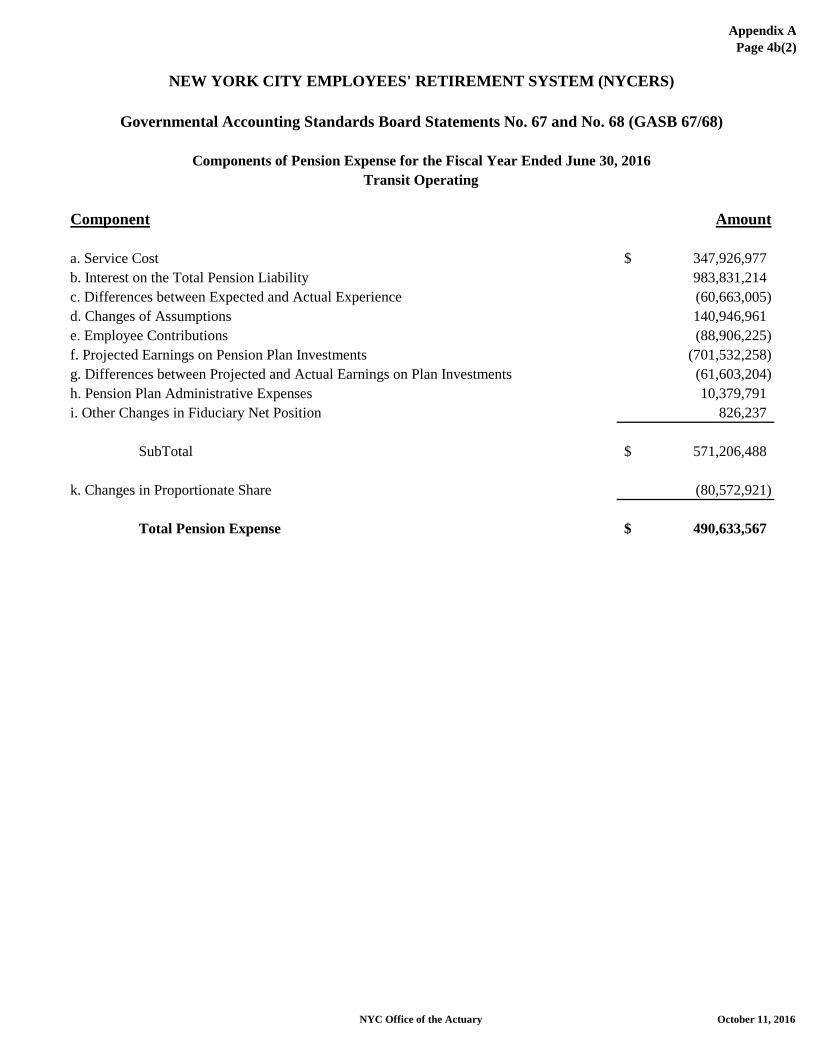
Appendix APage 4b(2)
NYC Office of the Actuary October 11, 2016
NEW YORK CITY EMPLOYEES' RETIREMENT SYSTEM (NYCERS)
Components of Pension Expense for the Fiscal Year Ended June 30, 2016
Component Amount
a. Service Cost 347,926,977$ b. Interest on the Total Pension Liability 983,831,214c. Differences between Expected and Actual Experience (60,663,005)d. Changes of Assumptions 140,946,961e. Employee Contributions (88,906,225)f. Projected Earnings on Pension Plan Investments (701,532,258)g. Differences between Projected and Actual Earnings on Plan Investments (61,603,204)h. Pension Plan Administrative Expenses 10,379,791i. Other Changes in Fiduciary Net Position 826,237
SubTotal 571,206,488$
k. Changes in Proportionate Share (80,572,921)
Total Pension Expense 490,633,567$
Governmental Accounting Standards Board Statements No. 67 and No. 68 (GASB 67/68)
Transit Operating

Appendix APage 4b(3)
NYC Office of the Actuary October 11, 2016
NEW YORK CITY EMPLOYEES' RETIREMENT SYSTEM (NYCERS)
Components of Pension Expense for the Fiscal Year Ended June 30, 2016
Component Amount
a. Service Cost 60,400,822$ b. Interest on the Total Pension Liability 170,795,076c. Differences between Expected and Actual Experience (10,531,220)d. Changes of Assumptions 24,468,676e. Employee Contributions (15,434,299)f. Projected Earnings on Pension Plan Investments (121,787,410)g. Differences between Projected and Actual Earnings on Plan Investments (10,694,440)h. Pension Plan Administrative Expenses 1,801,953i. Other Changes in Fiduciary Net Position 143,436
SubTotal 99,162,594$
k. Changes in Proportionate Share 46,063,136
Total Pension Expense 145,225,730$
Governmental Accounting Standards Board Statements No. 67 and No. 68 (GASB 67/68)
Transit Non-Operating

Appendix APage 4b(4)
NYC Office of the Actuary October 11, 2016
NEW YORK CITY EMPLOYEES' RETIREMENT SYSTEM (NYCERS)
Components of Pension Expense for the Fiscal Year Ended June 30, 2016
Component Amount
a. Service Cost 12,767,962$ b. Interest on the Total Pension Liability 36,103,898c. Differences between Expected and Actual Experience (2,226,165)d. Changes of Assumptions 5,172,366e. Employee Contributions (3,262,614)f. Projected Earnings on Pension Plan Investments (25,744,303)g. Differences between Projected and Actual Earnings on Plan Investments (2,260,668)h. Pension Plan Administrative Expenses 380,910i. Other Changes in Fiduciary Net Position 30,321
SubTotal 20,961,707$
k. Changes in Proportionate Share 1,829,638
Total Pension Expense 22,791,345$
Governmental Accounting Standards Board Statements No. 67 and No. 68 (GASB 67/68)
TA TP

Appendix APage 4b(5)
NYC Office of the Actuary October 11, 2016
NEW YORK CITY EMPLOYEES' RETIREMENT SYSTEM (NYCERS)
Components of Pension Expense for the Fiscal Year Ended June 30, 2016
Component Amount
a. Service Cost 13,983,959$ b. Interest on the Total Pension Liability 39,542,364c. Differences between Expected and Actual Experience (2,438,181)d. Changes of Assumptions 5,664,972e. Employee Contributions (3,573,339)f. Projected Earnings on Pension Plan Investments (28,196,141)g. Differences between Projected and Actual Earnings on Plan Investments (2,475,970)h. Pension Plan Administrative Expenses 417,187i. Other Changes in Fiduciary Net Position 33,208
SubTotal 22,958,059$
k. Changes in Proportionate Share (2,359,038)
Total Pension Expense 20,599,021$
Governmental Accounting Standards Board Statements No. 67 and No. 68 (GASB 67/68)
TA CP Engineers

Appendix APage 4b(6)
NYC Office of the Actuary October 11, 2016
NEW YORK CITY EMPLOYEES' RETIREMENT SYSTEM (NYCERS)
Components of Pension Expense for the Fiscal Year Ended June 30, 2016
Component Amount
a. Service Cost 89,356,737$ b. Interest on the Total Pension Liability 252,673,558c. Differences between Expected and Actual Experience (15,579,844)d. Changes of Assumptions 36,198,862e. Employee Contributions (22,833,441)f. Projected Earnings on Pension Plan Investments (180,171,811)g. Differences between Projected and Actual Earnings on Plan Investments (15,821,312)h. Pension Plan Administrative Expenses 2,665,801i. Other Changes in Fiduciary Net Position 212,199
SubTotal 146,700,749$
k. Changes in Proportionate Share (597,463)
Total Pension Expense 146,103,286$
Governmental Accounting Standards Board Statements No. 67 and No. 68 (GASB 67/68)
HA Regular

Appendix APage 4b(7)
NYC Office of the Actuary October 11, 2016
NEW YORK CITY EMPLOYEES' RETIREMENT SYSTEM (NYCERS)
Components of Pension Expense for the Fiscal Year Ended June 30, 2016
Component Amount
a. Service Cost 5,585,984$ b. Interest on the Total Pension Liability 15,795,455c. Differences between Expected and Actual Experience (973,947)d. Changes of Assumptions 2,262,910e. Employee Contributions (1,427,394)f. Projected Earnings on Pension Plan Investments (11,263,133)g. Differences between Projected and Actual Earnings on Plan Investments (989,042)h. Pension Plan Administrative Expenses 166,648i. Other Changes in Fiduciary Net Position 13,265
SubTotal 9,170,746$
k. Changes in Proportionate Share (875,644)
Total Pension Expense 8,295,102$
HA HP
Governmental Accounting Standards Board Statements No. 67 and No. 68 (GASB 67/68)

Appendix APage 4b(8)
NYC Office of the Actuary October 11, 2016
NEW YORK CITY EMPLOYEES' RETIREMENT SYSTEM (NYCERS)
Components of Pension Expense for the Fiscal Year Ended June 30, 2016
Component Amount
a. Service Cost 280,990,174$ b. Interest on the Total Pension Liability 794,554,381c. Differences between Expected and Actual Experience (48,992,200)d. Changes of Assumptions 113,830,526e. Employee Contributions (71,801,778)f. Projected Earnings on Pension Plan Investments (566,566,217)g. Differences between Projected and Actual Earnings on Plan Investments (49,751,518)h. Pension Plan Administrative Expenses 8,382,849i. Other Changes in Fiduciary Net Position 667,280
SubTotal 461,313,497$
k. Changes in Proportionate Share 53,112,888
Total Pension Expense 514,426,385$
Governmental Accounting Standards Board Statements No. 67 and No. 68 (GASB 67/68)
HHC
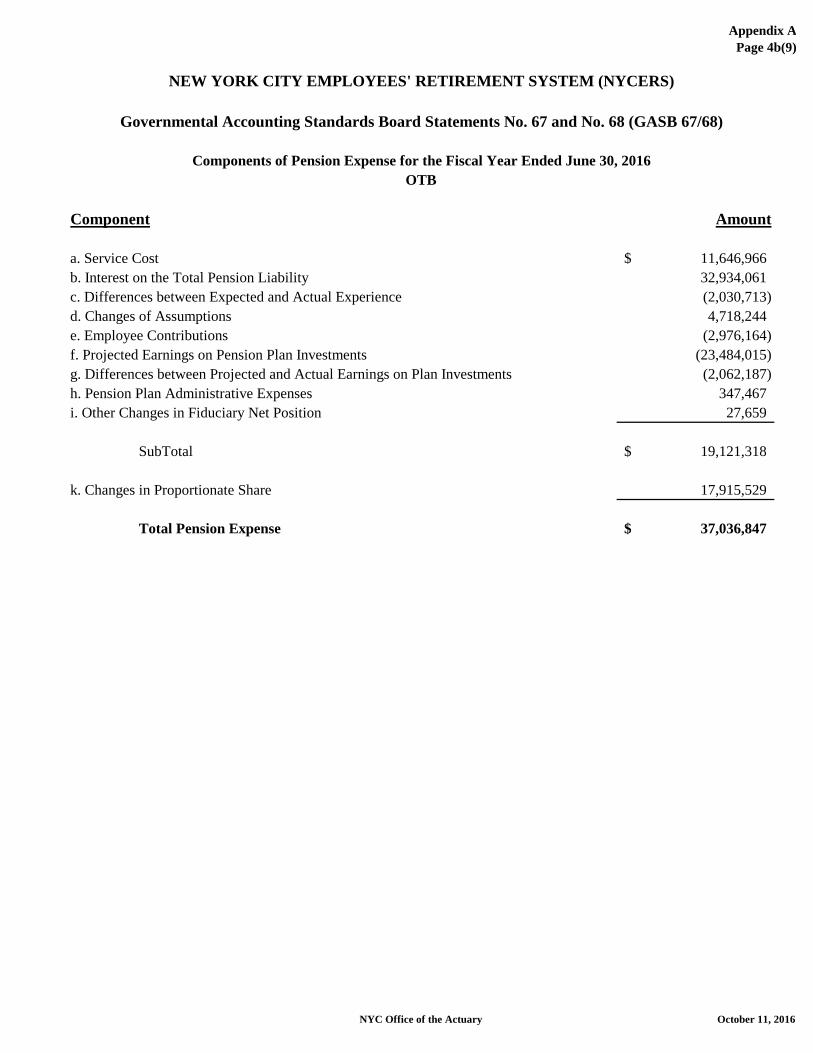
Appendix APage 4b(9)
NYC Office of the Actuary October 11, 2016
NEW YORK CITY EMPLOYEES' RETIREMENT SYSTEM (NYCERS)
Components of Pension Expense for the Fiscal Year Ended June 30, 2016
Component Amount
a. Service Cost 11,646,966$ b. Interest on the Total Pension Liability 32,934,061c. Differences between Expected and Actual Experience (2,030,713)d. Changes of Assumptions 4,718,244e. Employee Contributions (2,976,164)f. Projected Earnings on Pension Plan Investments (23,484,015)g. Differences between Projected and Actual Earnings on Plan Investments (2,062,187)h. Pension Plan Administrative Expenses 347,467i. Other Changes in Fiduciary Net Position 27,659
SubTotal 19,121,318$
k. Changes in Proportionate Share 17,915,529
Total Pension Expense 37,036,847$
Governmental Accounting Standards Board Statements No. 67 and No. 68 (GASB 67/68)
OTB

Appendix APage 4b(10)
NYC Office of the Actuary October 11, 2016
NEW YORK CITY EMPLOYEES' RETIREMENT SYSTEM (NYCERS)
Components of Pension Expense for the Fiscal Year Ended June 30, 2016
Component Amount
a. Service Cost 1,006,997$ b. Interest on the Total Pension Liability 2,847,480c. Differences between Expected and Actual Experience (175,576)d. Changes of Assumptions 407,940e. Employee Contributions (257,319)f. Projected Earnings on Pension Plan Investments (2,030,429)g. Differences between Projected and Actual Earnings on Plan Investments (178,297)h. Pension Plan Administrative Expenses 30,042i. Other Changes in Fiduciary Net Position 2,391
SubTotal 1,653,229$
k. Changes in Proportionate Share (68,822)
Total Pension Expense 1,584,407$
Governmental Accounting Standards Board Statements No. 67 and No. 68 (GASB 67/68)
HDC/REMIC

Appendix APage 4b(11)
NYC Office of the Actuary October 11, 2016
NEW YORK CITY EMPLOYEES' RETIREMENT SYSTEM (NYCERS)
Components of Pension Expense for the Fiscal Year Ended June 30, 2016
Component Amount
a. Service Cost 588,998$ b. Interest on the Total Pension Liability 1,665,507c. Differences between Expected and Actual Experience (102,695)d. Changes of Assumptions 238,606e. Employee Contributions (150,507)f. Projected Earnings on Pension Plan Investments (1,187,609)g. Differences between Projected and Actual Earnings on Plan Investments (104,287)h. Pension Plan Administrative Expenses 17,572i. Other Changes in Fiduciary Net Position 1,399
SubTotal 966,984$
k. Changes in Proportionate Share (204,087)
Total Pension Expense 762,897$
Governmental Accounting Standards Board Statements No. 67 and No. 68 (GASB 67/68)
State Courts

Appendix APage 4b(12)
NYC Office of the Actuary October 11, 2016
NEW YORK CITY EMPLOYEES' RETIREMENT SYSTEM (NYCERS)
Components of Pension Expense for the Fiscal Year Ended June 30, 2016
Component Amount
a. Service Cost 1,044,997$ b. Interest on the Total Pension Liability 2,954,932c. Differences between Expected and Actual Experience (182,201)d. Changes of Assumptions 423,333e. Employee Contributions (267,029)f. Projected Earnings on Pension Plan Investments (2,107,049)g. Differences between Projected and Actual Earnings on Plan Investments (185,025)h. Pension Plan Administrative Expenses 31,176i. Other Changes in Fiduciary Net Position 2,482
SubTotal 1,715,616$
k. Changes in Proportionate Share 450,796
Total Pension Expense 2,166,412$
Governmental Accounting Standards Board Statements No. 67 and No. 68 (GASB 67/68)
SCA
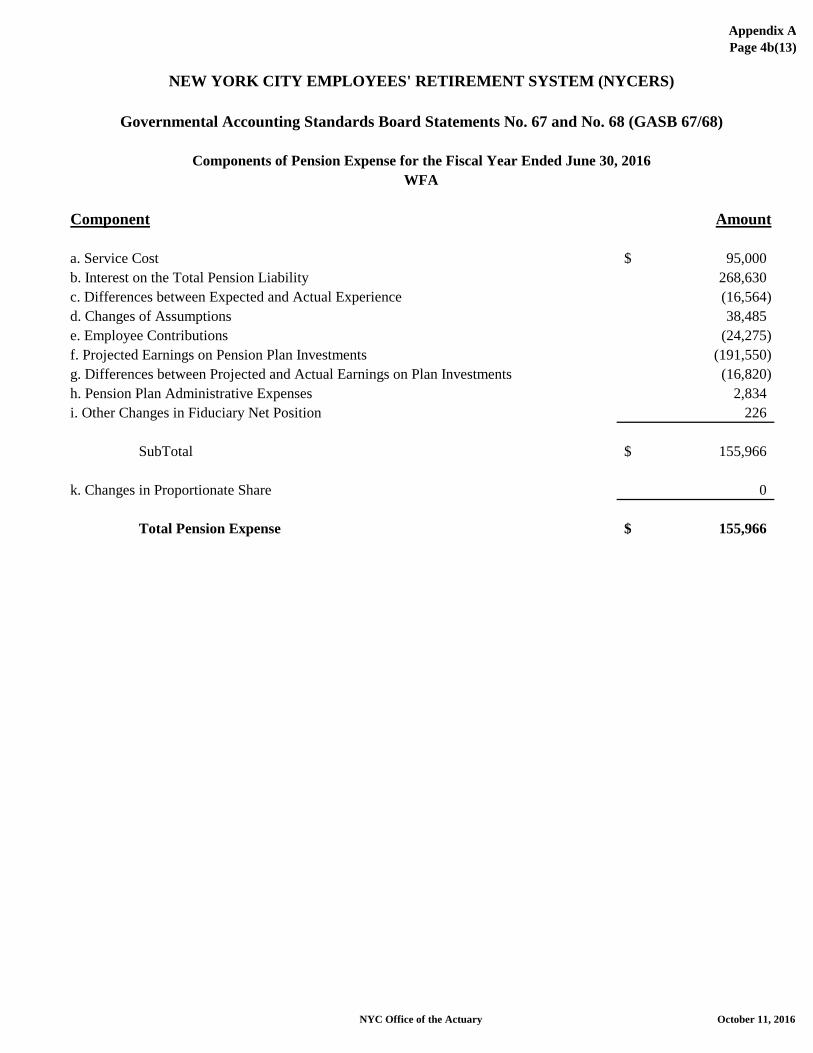
Appendix APage 4b(13)
NYC Office of the Actuary October 11, 2016
NEW YORK CITY EMPLOYEES' RETIREMENT SYSTEM (NYCERS)
Components of Pension Expense for the Fiscal Year Ended June 30, 2016
Component Amount
a. Service Cost 95,000$ b. Interest on the Total Pension Liability 268,630c. Differences between Expected and Actual Experience (16,564)d. Changes of Assumptions 38,485e. Employee Contributions (24,275)f. Projected Earnings on Pension Plan Investments (191,550)g. Differences between Projected and Actual Earnings on Plan Investments (16,820)h. Pension Plan Administrative Expenses 2,834i. Other Changes in Fiduciary Net Position 226
SubTotal 155,966$
k. Changes in Proportionate Share 0
Total Pension Expense 155,966$
WFA
Governmental Accounting Standards Board Statements No. 67 and No. 68 (GASB 67/68)

Appendix APage 4b(14)
NYC Office of the Actuary October 11, 2016
NEW YORK CITY EMPLOYEES' RETIREMENT SYSTEM (NYCERS)
Components of Pension Expense for the Fiscal Year Ended June 30, 2016
Component Amount
a. Service Cost 23,692,930$ b. Interest on the Total Pension Liability 66,996,370c. Differences between Expected and Actual Experience (4,130,994)d. Changes of Assumptions 9,598,125e. Employee Contributions (6,054,285)f. Projected Earnings on Pension Plan Investments (47,772,539)g. Differences between Projected and Actual Earnings on Plan Investments (4,195,019)h. Pension Plan Administrative Expenses 706,837i. Other Changes in Fiduciary Net Position 56,265
SubTotal 38,897,690$
k. Changes in Proportionate Share 6,545,081
Total Pension Expense 45,442,771$
Governmental Accounting Standards Board Statements No. 67 and No. 68 (GASB 67/68)
Senior Colleges

Appendix APage 4b(15)
NYC Office of the Actuary October 11, 2016
NEW YORK CITY EMPLOYEES' RETIREMENT SYSTEM (NYCERS)
Components of Pension Expense for the Fiscal Year Ended June 30, 2016
Component Amount
a. Service Cost 24,053,929$ b. Interest on the Total Pension Liability 68,017,165c. Differences between Expected and Actual Experience (4,193,936)d. Changes of Assumptions 9,744,367e. Employee Contributions (6,146,531)f. Projected Earnings on Pension Plan Investments (48,500,428)g. Differences between Projected and Actual Earnings on Plan Investments (4,258,937)h. Pension Plan Administrative Expenses 717,607i. Other Changes in Fiduciary Net Position 57,122
SubTotal 39,490,358$
k. Changes in Proportionate Share 11,967,554
Total Pension Expense 51,457,912$
Governmental Accounting Standards Board Statements No. 67 and No. 68 (GASB 67/68)
TBTA

Appendix APage 4b(16)
NYC Office of the Actuary October 11, 2016
NEW YORK CITY EMPLOYEES' RETIREMENT SYSTEM (NYCERS)
Components of Pension Expense for the Fiscal Year Ended June 30, 2016
Component Amount
a. Service Cost 1,026,851,981$ b. Interest on the Total Pension Liability 2,903,623,740c. Differences between Expected and Actual Experience (179,037,358)d. Changes of Assumptions 415,982,878e. Employee Contributions (262,392,800)f. Projected Earnings on Pension Plan Investments (2,070,462,586)g. Differences between Projected and Actual Earnings on Plan Investments (181,812,210)h. Pension Plan Administrative Expenses 30,634,326i. Other Changes in Fiduciary Net Position 2,438,510
SubTotal 1,685,826,481$
k. Changes in Proportionate Share (53,206,647)
Total Pension Expense 1,632,619,834$
City Total
Governmental Accounting Standards Board Statements No. 67 and No. 68 (GASB 67/68)

Appendix APage 4c
NYC Office of the Actuary October 11, 2016
Transit TA Non- TA CPComponent Operating Operating TA TP Engineers HA Regular HA HP
a. Service Cost 345,240,602$ 51,529,542$ 12,094,416$ 13,340,507$ 87,409,643$ 5,534,112$ b. Interest on the Total Pension Liability 955,379,096 142,596,922 33,468,694 36,916,984 241,887,383 15,314,463c. Changes of Assumptions 0 0 0 0 0 0d. Differences between Expected and Actual Experience (16,134,120) (2,408,129) (565,208) (623,442) (4,084,913) (258,625)e. Employee Contributions (88,007,104) (13,135,667) (3,083,051) (3,400,699) (22,282,053) (1,410,730)f. Projected Earnings on Pension Plan Investments (715,887,236) (106,851,110) (25,078,852) (27,662,734) (181,251,705) (11,475,475)g. Differences between Projected and Actual Earnings on Plan Investments (163,574,085) (24,414,561) (5,730,302) (6,320,697) (41,414,458) (2,622,047)h. Pension Plan Administrative Expenses 10,293,234 1,536,336 360,591 397,743 2,606,090 164,998i. Other Changes in Fiduciary Net Position* 66,781,206 9,967,556 2,339,469 2,580,505 16,907,981 1,070,484k. Changes in Proportionate Share (45,492,023) 21,679,254 1,032,346 (2,890,567) 3,854,090 (344,115)
Total Pension Expense 348,599,570$ 80,500,143$ 14,838,103$ 12,337,600$ 103,632,058$ 5,973,065$
Component HHC OTB HDC/REMIC State Courts SCA WFA
a. Service Cost 257,097,964$ 6,633,604$ 971,218$ 586,396$ 769,645$ 91,624$ b. Interest on the Total Pension Liability 711,463,308 18,357,072 2,687,638 1,622,725 2,129,826 253,551c. Changes of Assumptions 0 0 0 0 0 0d. Differences between Expected and Actual Experience (12,014,952) (310,008) (45,388) (27,404) (35,968) (4,282)e. Employee Contributions (65,538,199) (1,691,007) (247,578) (149,481) (196,194) (23,356)f. Projected Earnings on Pension Plan Investments (533,115,601) (13,755,370) (2,013,908) (1,215,944) (1,595,927) (189,991)g. Differences between Projected and Actual Earnings on Plan Investments (121,812,336) (3,142,984) (460,161) (277,833) (364,656) (43,411)h. Pension Plan Administrative Expenses 7,665,291 197,779 28,957 17,483 22,947 2,732i. Other Changes in Fiduciary Net Position* 49,731,440 1,283,163 187,866 113,429 148,875 17,723k. Changes in Proportionate Share 2,684,098 1,238,814 (68,822) (137,646) (412,938) 0
Total Pension Expense 296,161,013$ 8,811,063$ 1,039,822$ 531,725$ 465,610$ 104,590$
Senior Component Colleges TBTA City Total Total
a. Service Cost 22,374,670$ 22,081,472$ 1,006,731,855$ 1,832,487,270$ b. Interest on the Total Pension Liability 61,917,085 61,105,722 2,785,913,840 5,071,014,309c. Changes of Assumptions 0 0 0 0d. Differences between Expected and Actual Experience (1,045,635) (1,031,933) (47,047,572) (85,637,579)e. Employee Contributions (5,703,645) (5,628,904) (256,631,332) (467,129,000)f. Projected Earnings on Pension Plan Investments (46,395,877) (45,787,904) (2,087,548,458) (3,799,826,092)g. Differences between Projected and Actual Earnings on Plan Investments (10,601,059) (10,462,143) (476,986,897) (868,227,630)h. Pension Plan Administrative Expenses 667,093 658,352 30,015,374 54,635,000i. Other Changes in Fiduciary Net Position* 4,328,018 4,271,303 194,735,982 354,465,000k. Changes in Proportionate Share 4,817,612 7,914,648 6,125,249 0
Total Pension Expense 30,358,262$ 33,120,613$ 1,155,308,041$ 2,091,781,278$
* Includes Payments to Other Retirement Systems and $(351,463,000) Post-Publication Adjustment.
NEW YORK CITY EMPLOYEES' RETIREMENT SYSTEM (NYCERS)
Governmental Accounting Standards Board Statements No. 67 and No. 68 (GASB 67/68)
Components of Pension Expense for the Fiscal Year Ended June 30, 2015 - By Obligor

Appendix APage 4d
NYC Office of the Actuary October 11, 2016
Transit TA Non- TA CPComponent Operating Operating TA TP Engineers HA Regular HA HP
a. Service Cost 347,926,977$ 60,400,822$ 12,767,962$ 13,983,959$ 89,356,737$ 5,585,984$ b. Interest on the Total Pension Liability 983,831,214 170,795,076 36,103,898 39,542,364 252,673,558 15,795,455c. Differences between Expected and Actual Experience (60,663,005) (10,531,220) (2,226,165) (2,438,181) (15,579,844) (973,947)d. Changes of Assumptions 140,946,961 24,468,676 5,172,366 5,664,972 36,198,862 2,262,910e. Employee Contributions (88,906,225) (15,434,299) (3,262,614) (3,573,339) (22,833,441) (1,427,394)f. Projected Earnings on Pension Plan Investments (701,532,258) (121,787,410) (25,744,303) (28,196,141) (180,171,811) (11,263,133)g. Differences between Projected and Actual Earnings on Plan Investments (61,603,204) (10,694,440) (2,260,668) (2,475,970) (15,821,312) (989,042)h. Pension Plan Administrative Expenses 10,379,791 1,801,953 380,910 417,187 2,665,801 166,648i. Other Changes in Fiduciary Net Position* 826,237 143,436 30,321 33,208 212,199 13,265k. Changes in Proportionate Share (80,572,921) 46,063,136 1,829,638 (2,359,038) (597,463) (875,644)
Total Pension Expense 490,633,567$ 145,225,730$ 22,791,345$ 20,599,021$ 146,103,286$ 8,295,102$
Component HHC OTB HDC/REMIC State Courts SCA WFA
a. Service Cost 280,990,174$ 11,646,966$ 1,006,997$ 588,998$ 1,044,997$ 95,000$ b. Interest on the Total Pension Liability 794,554,381 32,934,061 2,847,480 1,665,507 2,954,932 268,630c. Differences between Expected and Actual Experience (48,992,200) (2,030,713) (175,576) (102,695) (182,201) (16,564)d. Changes of Assumptions 113,830,526 4,718,244 407,940 238,606 423,333 38,485e. Employee Contributions (71,801,778) (2,976,164) (257,319) (150,507) (267,029) (24,275)f. Projected Earnings on Pension Plan Investments (566,566,217) (23,484,015) (2,030,429) (1,187,609) (2,107,049) (191,550)g. Differences between Projected and Actual Earnings on Plan Investments (49,751,518) (2,062,187) (178,297) (104,287) (185,025) (16,820)h. Pension Plan Administrative Expenses 8,382,849 347,467 30,042 17,572 31,176 2,834i. Other Changes in Fiduciary Net Position* 667,280 27,659 2,391 1,399 2,482 226k. Changes in Proportionate Share 53,112,888 17,915,529 (68,822) (204,087) 450,796 0
Total Pension Expense 514,426,385$ 37,036,847$ 1,584,407$ 762,897$ 2,166,412$ 155,966$
Senior Component Colleges TBTA CITY Total Total
a. Service Cost 23,692,930$ 24,053,929$ 1,026,851,981$ 1,899,994,413$ b. Interest on the Total Pension Liability 66,996,370 68,017,165 2,903,623,740 5,372,603,831c. Differences between Expected and Actual Experience (4,130,994) (4,193,936) (179,037,358) (331,274,599)d. Changes of Assumptions 9,598,125 9,744,367 415,982,878 769,697,251e. Employee Contributions (6,054,285) (6,146,531) (262,392,800) (485,508,000)f. Projected Earnings on Pension Plan Investments (47,772,539) (48,500,428) (2,070,462,586) (3,830,997,478)g. Differences between Projected and Actual Earnings on Plan Investments (4,195,019) (4,258,937) (181,812,210) (336,408,936)h. Pension Plan Administrative Expenses 706,837 717,607 30,634,326 56,683,000i. Other Changes in Fiduciary Net Position* 56,265 57,122 2,438,510 4,512,000k. Changes in Proportionate Share 6,545,081 11,967,554 (53,206,647) 0
Total Pension Expense 45,442,771$ 51,457,912$ 1,632,619,834$ 3,119,301,482$
* Includes Payments to Other Retirement Systems.
NEW YORK CITY EMPLOYEES' RETIREMENT SYSTEM (NYCERS)
Governmental Accounting Standards Board Statements No. 67 and No. 68 (GASB 67/68)
Components of Pension Expense for the Fiscal Year Ended June 30, 2016 - By Obligor

Appendix APage 5a
NYC Office of the Actuary October 11, 2016
For the Fiscal Year ended June 30, 2013, the Obligors recognized Pension Expense for NYCERS of $2,721,031,010.
At June 30, 2013, the Obligors reported total Deferred Outflows of Resources and Deferred Inflows of Resources related to pensions for NYCERS from the following sources:
Deferred DeferredOutflows Inflows
of Resources of Resources
Differences between Expected and Actual Experience 0$ 0$
Changes of Assumptions 0 0
Net Difference between Projected and Actual Earnings on Pension Plan Investments 0 1,594,361,522
Total 0$ 1,594,361,522$
Amounts reported as Deferred Outflows of Resources and Deferred Inflows of Resources related to pensions for NYCERS will be recognized in Pension Expense as follows:
Fiscal YearEnded June 30 Amount2013 (398,590,379)$ 2014 (398,590,379) 2015 (398,590,379) 2016 (398,590,379) 2017 (398,590,385)
NEW YORK CITY EMPLOYEES' RETIREMENT SYSTEM (NYCERS)
Governmental Accounting Standards Board Statements No. 67 and No. 68 (GASB 67/68)
Pension Expense, Deferred Outflows of Resources, Deferred Inflows of Resources

Appendix APage 5b
NYC Office of the Actuary October 11, 2016
For the Fiscal Year ended June 30, 2014, the Obligors recognized Pension Expense for NYCERS of $1,639,856,352.
For June 30, 2014, the Obligors determined Deferred Outflows of Resources and Deferred Inflows of Resources related to Pensions for NYCERS from the following sources:
Deferred DeferredOutflows Inflows
of Resources of Resources
Differences between Expected and Actual Experience 0$ 0$
Changes of Assumptions 0 0
Net Difference between Projected and Actual Earnings on Pension Plan Investments 0 3,978,322,676
Total 0$ 3,978,322,676$
Amounts reported as Deferred Outflows of Resources and Deferred Inflows of Resources related to pensions for NYCERS will be recognized in Pension Expense as follows:
Fiscal YearEnded June 30 Amount2014 (994,580,670)$ 2015 (994,580,670) 2016 (994,580,670) 2017 (994,580,670) 2018 (994,580,666)
NEW YORK CITY EMPLOYEES' RETIREMENT SYSTEM (NYCERS)
Governmental Accounting Standards Board Statements No. 67 and No. 68 (GASB 67/68)
Pension Expense, Deferred Outflows of Resources, Deferred Inflows of Resources

Appendix APage 5c
NYC Office of the Actuary October 11, 2016
For the Fiscal Year ended June 30, 2015, the Obligors recognized Pension Expense for NYCERS of $2,091,781,278.
For June 30, 2015, the Obligors determined Deferred Outflows of Resources and Deferred Inflows of Resources related to Pensions for NYCERS from the following sources:
Deferred DeferredOutflows Inflows
of Resources of Resources
Differences between Expected and Actual Experience 0$ 202,961,062$
Changes of Assumptions 0 0
Net Difference between Projected and Actual Earnings on Pension Plan Investments 2,099,773,673 0
Total 2,099,773,673$ 202,961,062$
Amounts reported as Deferred Outflows of Resources and Deferred Inflows of Resources related to pensions for NYCERS will be recognized in Pension Expense as follows:
Fiscal YearEnded June 30 Amount2015 439,305,840$ 2016 439,305,840 2017 439,305,840 2018 493,257,515 2019 524,943,416
Pension Expense, Deferred Outflows of Resources, Deferred Inflows of Resources
Governmental Accounting Standards Board Statements No. 67 and No. 68 (GASB 67/68)
NEW YORK CITY EMPLOYEES' RETIREMENT SYSTEM (NYCERS)

Appendix APage 5d
NYC Office of the Actuary October 11, 2016
For the Fiscal Year ended June 30, 2016, the Obligors recognized Pension Expense for NYCERS of $3,119,301,482.
For June 30, 2016, the Obligors determined Deferred Outflows of Resources and Deferred Inflows of Resources related to Pensions for NYCERS from the following sources:
Deferred DeferredOutflows Inflows
of Resources of Resources
Differences between Expected and Actual Experience 0$ 572,334,258$
Changes of Assumptions 1,793,394,596 0
Net Difference between Projected and Actual Earnings on Pension Plan Investments 2,127,274,784 0
Total 3,920,669,380$ 572,334,258$
Amounts reported as Deferred Outflows of Resources and Deferred Inflows of Resources related to pensions for NYCERS will be recognized in Pension Expense as follows:
Fiscal YearEnded June 30 Amount2016 1,055,878,925$ 2017 1,055,878,925 2018 1,055,878,925 2019 704,758,570 2020 531,818,702
NEW YORK CITY EMPLOYEES' RETIREMENT SYSTEM (NYCERS)
Governmental Accounting Standards Board Statements No. 67 and No. 68 (GASB 67/68)
Pension Expense, Deferred Outflows of Resources, Deferred Inflows of Resources

Appendix APage 5e
NYC Office of the Actuary October 11, 2016
For the Fiscal Year ended June 30, 2016, the Obligors recognized Pension Expense for NYCERS of $3,119,301,482.
At June 30, 2016, the Obligors reported total Deferred Outflows of Resources and Deferred Inflows of Resources related to Pensions for NYCERS from the following sources:
Deferred DeferredOutflows Inflows
of Resources of Resources
Differences between Expected and Actual Experience 0$ 689,657,741$
Changes of Assumptions 1,793,394,596 0
Net Difference between Projected and Actual Earnings on Pension Plan Investments 3,702,105,038 2,387,751,721
Total 5,495,499,634$ 3,077,409,462$
Amounts reported as Deferred Outflows of Resources and Deferred Inflows of Resources related to pensions for NYCERS will be recognized in Pension Expense as follows:
Fiscal YearEnded June 30 Amount2016 102,013,716$ 2017 102,013,710 2018 554,555,774 2019 1,229,701,986 2020 531,818,702
NEW YORK CITY EMPLOYEES' RETIREMENT SYSTEM (NYCERS)
Governmental Accounting Standards Board Statements No. 67 and No. 68 (GASB 67/68)
Pension Expense, Deferred Outflows of Resources, Deferred Inflows of Resources

Appendix APage 6
NYC Office of the Actuary October 11, 2016
Fiscal Year Ended June 30 2016 2015 2014 2013 2012 2011 2010 2009 2008 2007
Actuarially Determined Contribution 3,365,454$ 3,160,258$ 3,114,068$ 3,046,845$ 3,017,004$ 2,387,216$ 2,197,717$ 2,150,438$ 1,874,242$ 1,471,030$
Contributions in relation to the Actuarially Determined Contribution 3,365,454$ 3,160,258$ 3,114,068$ 3,046,845$ 3,017,004$ 2,387,216$ 2,197,717$ 2,150,438$ 1,874,242$ 1,471,030$
Contribution Deficency (Excess) 0 0 0 0 0 0 0 0 0 0
Contributions as a percentage of Covered employee payroll1 27.279% 25.662% 25.561% 25.486% 25.540% 20.820% 20.020% 20.570% 19.001% 15.556%
1 The Employer Rate of Contribution equals the Statutory Contribution as a percentage of the salaries of members who were on payroll or projected to be on payroll (under One-Year Lag Methodology) as of the preceding June 30 increased to reflect overtime earnings and adjusted, where applicable, to be consistent with collective bargaining agreements estimated to be achieved.
NEW YORK CITY EMPLOYEES' RETIREMENT SYSTEM (NYCERS)
Governmental Accounting Standards Board Statements No. 67 and No. 68 (GASB 67/68)
Schedule of Employer Contributions ($ in thousands)

Appendix APage 7a
NYC Office of the Actuary October 11, 2016
NEW YORK CITY EMPLOYEES' RETIREMENT SYSTEM (NYCERS)
Governmental Accounting Standards Board Statements No. 67 and No. 68 (GASB 67/68)
Statement of Fiduciary Net PositionJune 30, 2016 and June 30, 2015
(Dollar amounts in thousands)
June 30, 2016 June 30, 2015ASSETS
Cash 165,685$ 40,548$
Receivables:Investment securities sold 1,413,529 1,639,525Member loans 1,081,783 1,027,069Transferable earnings due from QPP to VSFs (3,000) (19,000)Accrued interest and dividends 280,740 267,570Other receivables 0 0Receivables due from NYCERS 0 0
Total receivables 2,773,052$ 2,915,164$
Investments - at fair valueShort-term investments:
U.S. treasury bills and agencies 11,073 393,360Commercial paper 739,639 831,425Short-term investment fund 760,635 810,547Discount notes 59,860 486,281Short term - Hedge Fund 0 25,500
Debt securities:U.S. Government and agency 4,289,153 5,368,727Corporate and other 7,157,423 6,862,950Promissory notes 0 0Equity securities 18,523,033 18,188,567Alternative investments 9,873,044 9,824,907
Collective trust funds:International equity 9,220,895 9,501,921Domestic equity 0 0Mortgage debt securities 607,685 492,104Treasury inflation protected securities 2,448,307 1,760,761Fixed income 1,022,145 1,006,025Collateral from securities lending 5,267,092 4,789,313
Total investments 59,979,984$ 60,342,388$
Other assets 84,632 140,813
Total assets 63,003,353$ 63,438,913$
LIABILITIESAccounts payable 177,887 142,067Payables for investment securities purchased 1,794,940 3,368,991Accrued benefits payable 266,616 211,517Amount due to Variable Supplements Funds 5,724 5,947Due to other retirement systems 1,590 1,754Securities lending 5,267,092 4,789,313Accrued Transfers to VSFs 0 30,000
Total liabilities 7,513,849$ 8,549,589$
PLAN NET POSITION HELD IN TRUST FOR BENEFITS 55,489,504$ 54,889,324$

Appendix APage 7b
NYC Office of the Actuary October 11, 2016
NEW YORK CITY CORRECTION OFFICERS' VARIABLE SUPPLEMENTS FUND
Governmental Accounting Standards Board Statements No. 67 and No. 68 (GASB 67/68)
Statement of Fiduciary Net PositionJune 30, 2016 and June 30, 2015
(Dollar amounts in thousands)
June 30, 2016 June 30, 2015ASSETS
Cash 213$ 3,631$
Receivables:Accrued interest 25 2Transferable earnings due from QPP to VSFs 3,000 19,000Miscellaneous 11 10
Total receivables 3,036$ 19,012$
Investments - at fair value:Short-term investment fund 43,693$ 126,756$
Accrued Transfer from QPP 0$ 30,000$
Total assets 46,942$ 179,399$
LIABILITIESAccounts Payable 41,925$ 39,693$
Total Liabilities 41,925$ 39,693$
Plan Net Position held in Trust for Benefits 5,017$ 139,706$

Appendix APage 7c
NYC Office of the Actuary October 11, 2016
NEW YORK CITY HOUSING POLICE OFFICERS' VARIABLE SUPPLEMENTS FUND
Governmental Accounting Standards Board Statements No. 67 and No. 68 (GASB 67/68)
Statement of Fiduciary Net PositionJune 30, 2016 and June 30, 2015
(Dollar amounts in thousands)
June 30, 2016 June 30, 2015ASSETS
Cash 30$ 30$
Receivable - due from NYCERS 991 1,044
Total assets 1,021$ 1,074$
LIABILITIESAccrued benefits payable 1,021$ 1,074$
Total Liabilities 1,021$ 1,074$
Plan Net Position held in Trust for Benefits 0$ 0$

Appendix APage 7d
NYC Office of the Actuary October 11, 2016
Governmental Accounting Standards Board Statements No. 67 and No. 68 (GASB 67/68)
Statement of Fiduciary Net PositionJune 30, 2016 and June 30, 2015
(Dollar amounts in thousands)
June 30, 2016 June 30, 2015ASSETS
Cash 44$ 38$
Receivables:Receivable - due from NYCERS 1,318 1,354Accounts Receivable 0 1
Total receivables 1,318$ 1,355$
Total assets 1,362$ 1,393$
LIABILITIESAccrued benefits payable 1,362$ 1,393$
Total Liabilities 1,362$ 1,393$
Plan Net Position held in Trust for Benefits 0$ 0$
NEW YORK CITY HOUSING POLICE SUPERIOR OFFICERS' VARIABLE SUPPLEMENTS FUND

Appendix APage 7e
NYC Office of the Actuary October 11, 2016
NEW YORK CITY TRANSIT POLICE OFFICERS' VARIABLE SUPPLEMENTS FUND
Governmental Accounting Standards Board Statements No. 67 and No. 68 (GASB 67/68)
Statement of Fiduciary Net PositionJune 30, 2016 and June 30, 2015
(Dollar amounts in thousands)
June 30, 2016 June 30, 2015ASSETS
Cash 29$ 16$
Receivables:Receivable - due from NYCERS 1,967 2,019Accounts Receivable 0 0
Total receivables 1,967$ 2,019$
Total assets 1,996$ 2,035$
LIABILITIESAccount payable 22$ 21$ Accrued benefits payable 1,974 2,014
Total Liabilities 1,996$ 2,035$
Plan Net Position held in Trust for Benefits 0$ 0$

Appendix APage 7f
NYC Office of the Actuary October 11, 2016
Governmental Accounting Standards Board Statements No. 67 and No. 68 (GASB 67/68)
Statement of Fiduciary Net PositionJune 30, 2016 and June 30, 2015
(Dollar amounts in thousands)
June 30, 2016 June 30, 2015ASSETS
Cash 40$ 33$
Receivable - due from NYCERS 1,448 1,530
Total assets 1,488$ 1,563$
LIABILITIESAccrued benefits payable 1,488$ 1,563$
Total Liabilities 1,488$ 1,563$
Plan Net Position held in Trust for Benefits 0$ 0$
NEW YORK CITYTRANSIT POLICE SUPERIOR OFFICERS' VARIABLE SUPPLEMENTS FUND

Appendix APage 8a
NYC Office of the Actuary October 11, 2016
Governmental Accounting Standards Board Statements No. 67 and No. 68 (GASB 67/68)
Statement of Changes in Fiduciary Net PositionJune 30, 2016 and June 30, 2015
(Dollar amounts in thousands)
June 30, 2016 June 30, 2015ADDITIONS
Contributions:Member Contributions 485,508$ 467,129$ Employer Contributions 3,365,454 3,160,258
Total contributions 3,850,962$ 3,627,387$
Investment income:Interest income 692,773 635,747Dividend income 836,490 795,259Net appreciation (depreciation) in fair value (174,204) (50,658)
Total investment income 1,355,059$ 1,380,348$
Less:Investment expenses 212,996 231,760
Net income 1,142,063 1,148,588
Securities lending transactions:Securities lending income 31,719 28,196Securities lending fees 2,062 1,685
Net securities lending income 29,657 26,511
Net investment income 1,171,720 1,175,099Other:
Other Income 2,928 4,140
Total additions 5,025,610$ 4,806,626$
DEDUCTIONSBenefit payments and withdrawals 4,402,506 4,235,565Payments to other retirement systems 7,440 7,142Amount due to Variable Supplements Fund 11,525 11,918Accrued Transfer to VSFs (52,724) 30,000Administrative expenses 56,683 54,635
Total deductions 4,425,430$ 4,339,260$
INCREASE IN PLAN NET POSITION 600,180 467,366
PLAN NET POSITION HELD IN TRUST FOR BENEFITS:Beginning of year 54,889,324$ 54,421,958$
End of year 55,489,504$ 54,889,324$
NEW YORK CITY EMPLOYEES' RETIREMENT SYSTEM (NYCERS)

Appendix APage 8b
NYC Office of the Actuary October 11, 2016
Governmental Accounting Standards Board Statements No. 67 and No. 68 (GASB 67/68)
Statement of Changes in Fiduciary Net PositionJune 30, 2016 and June 30, 2015
(Dollar amounts in thousands)
June 30, 2016 June 30, 2015ADDITIONS
Investment income:Interest income 184$ 10$
Total investment income 184$ 10$
Reimbursement of benefit payments from NYCERS 0 12
Accrued Transfer from QPP (52,724) 30,000
Total additions (52,540)$ 30,022$
DEDUCTIONSBenefit payments and withdrawals 82,149 78,285
Total deductions 82,149$ 78,285$
INCREASE IN PLAN NET POSITION (134,689) (48,263)
PLAN NET POSITION HELD IN TRUST FOR BENEFITS:Beginning of year 139,706$ 187,969$
End of year 5,017$ 139,706$
NEW YORK CITY CORRECTION OFFICERS' VARIABLE SUPPLEMENTS FUND

Appendix APage 8c
NYC Office of the Actuary October 11, 2016
Governmental Accounting Standards Board Statements No. 67 and No. 68 (GASB 67/68)
Statement of Changes in Fiduciary Net PositionJune 30, 2016 and June 30, 2015
(Dollar amounts in thousands)
June 30, 2016 June 30, 2015ADDITIONS
Investment income:Interest income 0$ 0$
Total investment income 0$ 0$
Reimbursement of benefit payments from NYCERS 1,968 2,100
Total additions 1,968$ 2,100$
DEDUCTIONSBenefit payments 1,968 2,100Miscellaneous Expenses 0 0
Total deductions 1,968$ 2,100$
INCREASE IN PLAN NET POSITION 0 0
PLAN NET POSITION HELD IN TRUST FOR BENEFITS:Beginning of year 0 0
End of year 0 0
NEW YORK CITY HOUSING POLICE OFFICERS' VARIABLE SUPPLEMENTS FUND

Appendix APage 8d
NYC Office of the Actuary October 11, 2016
Governmental Accounting Standards Board Statements No. 67 and No. 68 (GASB 67/68)
Statement of Changes in Fiduciary Net PositionJune 30, 2016 and June 30, 2015
(Dollar amounts in thousands)
June 30, 2016 June 30, 2015ADDITIONS
Investment income:Interest income 0$ 0$
Total investment income 0$ 0$
Reimbursement of benefit payments from NYCERS 2,648 2,686
Total additions 2,648$ 2,686$
DEDUCTIONSBenefit payments 2,648 2,686Miscellaneous Expenses 0 0
Total deductions 2,648$ 2,686$
INCREASE IN PLAN NET POSITION 0 0
PLAN NET POSITION HELD IN TRUST FOR BENEFITS:Beginning of year 0 0
End of year 0 0
HOUSING POLICE SUPERIOR OFFICERS' VARIABLE SUPPLEMENTS FUNDNEW YORK CITY

Appendix APage 8e
NYC Office of the Actuary October 11, 2016
Governmental Accounting Standards Board Statements No. 67 and No. 68 (GASB 67/68)
Statement of Changes in Fiduciary Net PositionJune 30, 2016 and June 30, 2015
(Dollar amounts in thousands)
June 30, 2016 June 30, 2015ADDITIONS
Investment income:Interest income 0$ 0$
Total investment income 0$ 0$
Reimbursement of benefit payments from NYCERS 3,945 4,040
Total additions 3,945$ 4,040$
DEDUCTIONSBenefit payments 3,945 4,040Miscellaneous Expenses 0 0
Total deductions 3,945$ 4,040$
INCREASE IN PLAN NET POSITION 0 0
PLAN NET POSITION HELD IN TRUST FOR BENEFITS:Beginning of year 0 0
End of year 0 0
NEW YORK CITY TRANSIT POLICE OFFICERS' VARIABLE SUPPLEMENTS FUND

Appendix APage 8f
NYC Office of the Actuary October 11, 2016
Governmental Accounting Standards Board Statements No. 67 and No. 68 (GASB 67/68)
Statement of Changes in Fiduciary Net PositionJune 30, 2016 and June 30, 2015
(Dollar amounts in thousands)
June 30, 2016 June 30, 2015ADDITIONS
Investment income:Interest income 0$ 0$
Total investment income 0$ 0$
Reimbursement of benefit payments from NYCERS 2,964 3,080
Total additions 2,964$ 3,080$
DEDUCTIONSBenefit payments 2,964 3,080Miscellaneous Expenses 0 0
Total deductions 2,964$ 3,080$
INCREASE IN PLAN NET POSITION 0 0
PLAN NET POSITION HELD IN TRUST FOR BENEFITS:Beginning of year 0 0
End of year 0 0
NEW YORK CITYTRANSIT POLICE SUPERIOR OFFICERS' VARIABLE SUPPLEMENTS FUND
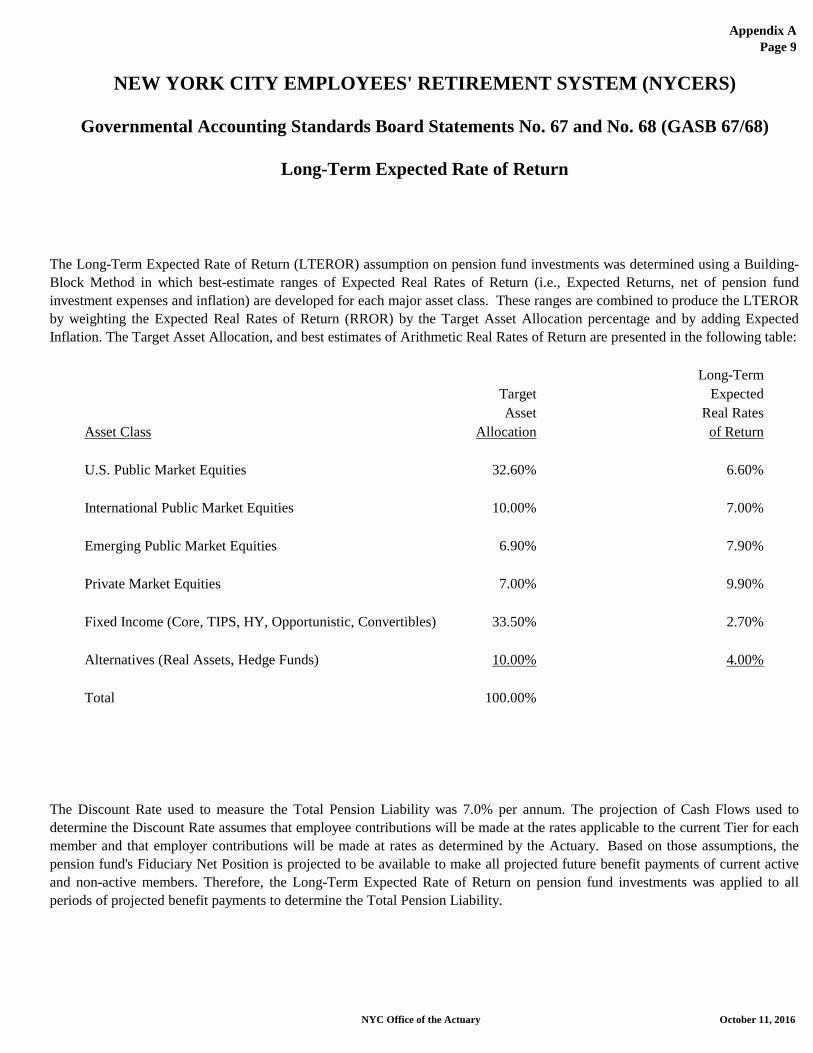
Appendix APage 9
NYC Office of the Actuary October 11, 2016
Long-TermTarget ExpectedAsset Real Rates
Asset Class Allocation of Return
U.S. Public Market Equities 32.60% 6.60%
International Public Market Equities 10.00% 7.00%
Emerging Public Market Equities 6.90% 7.90%
Private Market Equities 7.00% 9.90%
Fixed Income (Core, TIPS, HY, Opportunistic, Convertibles) 33.50% 2.70%
Alternatives (Real Assets, Hedge Funds) 10.00% 4.00%
Total 100.00%
The Discount Rate used to measure the Total Pension Liability was 7.0% per annum. The projection of Cash Flows used todetermine the Discount Rate assumes that employee contributions will be made at the rates applicable to the current Tier for eachmember and that employer contributions will be made at rates as determined by the Actuary. Based on those assumptions, thepension fund's Fiduciary Net Position is projected to be available to make all projected future benefit payments of current activeand non-active members. Therefore, the Long-Term Expected Rate of Return on pension fund investments was applied to allperiods of projected benefit payments to determine the Total Pension Liability.
NEW YORK CITY EMPLOYEES' RETIREMENT SYSTEM (NYCERS)
Governmental Accounting Standards Board Statements No. 67 and No. 68 (GASB 67/68)
Long-Term Expected Rate of Return
The Long-Term Expected Rate of Return (LTEROR) assumption on pension fund investments was determined using a Building-Block Method in which best-estimate ranges of Expected Real Rates of Return (i.e., Expected Returns, net of pension fundinvestment expenses and inflation) are developed for each major asset class. These ranges are combined to produce the LTERORby weighting the Expected Real Rates of Return (RROR) by the Target Asset Allocation percentage and by adding ExpectedInflation. The Target Asset Allocation, and best estimates of Arithmetic Real Rates of Return are presented in the following table:

Appendix APage 10a
NYC Office of the Actuary October 11, 2016
2015Actual Employer
Employer AllocationEmployer Contributions Percentage
Transit Operating 595,378,888$ 18.840%
Transit Non-Operating 88,881,536 2.812%
Transit Authority Transit Police 20,854,044 0.660%
Transit Authority CP Engineers 22,997,294 0.728%
Housing Authority Regular 150,731,645 4.770%
Housing Authority Housing Police 9,535,010 0.302%
Health and Hospitals Corporation 443,385,717 14.030%
Off-Track Betting 11,449,532 0.362%
Housing Development Corporation / REMIC 1,689,159 0.053%
State Courts 1,004,182 0.032%
School Construction Authority 1,320,167 0.042%
Water Finance Authority 160,537 0.005%
Senior Colleges 38,572,365 1.221%
Triborough Bridge and Tunnel Authority 38,094,352 1.205%
City 1,736,203,440 54.938%
Total 3,160,257,868$ 100.000%
NEW YORK CITY EMPLOYEES' RETIREMENT SYSTEM (NYCERS)
Governmental Accounting Standards Board Statements No. 67 and No. 68 (GASB 67/68)
Schedule of Employer AllocationsJune 30, 2015

Appendix APage 10b
NYC Office of the Actuary October 11, 2016
2016Actual Employer
Employer AllocationEmployer Contributions Percentage
Transit Operating 616,269,330$ 18.312%
Transit Non-Operating 106,977,528 3.179%
Transit Authority Transit Police 22,624,851 0.672%
Transit Authority CP Engineers 24,780,369 0.736%
Housing Authority Regular 158,272,429 4.703%
Housing Authority Housing Police 9,887,882 0.294%
Health and Hospitals Corporation 497,715,274 14.789%
Off-Track Betting 20,630,774 0.613%
Housing Development Corporation / REMIC 1,780,625 0.053%
State Courts 1,057,613 0.031%
School Construction Authority 1,855,423 0.055%
Water Finance Authority 170,056 0.005%
Senior Colleges 41,979,719 1.247%
Triborough Bridge and Tunnel Authority 42,608,624 1.266%
City 1,818,843,715 54.045%
Total 3,365,454,212$ 100.000%
NEW YORK CITY EMPLOYEES' RETIREMENT SYSTEM (NYCERS)
Governmental Accounting Standards Board Statements No. 67 and No. 68 (GASB 67/68)
Schedule of Employer AllocationsJune 30, 2016

Appendix APage 11a
NYC Office of the Actuary October 11, 2016
NEW YORK CITY EMPLOYEES' RETIREMENT SYSTEM (NYCERS)
Governmental Accounting Standards Board Statements No. 67 and No. 68 (GASB 67/68)
Increase (Decrease) in Pension Expense Arising from the Recognition of Differencesbetween Projected and Actual Earnings on Pension Plan Investments
Differencesbetween Projected
and ActualEarnings on RecognitionPension Plan Period
Year Investments (Years) 2013 2014 2015 2016 2017 2018 2019 20202013 (1,992,951,901)$ 5 (398,590,379) (398,590,379) (398,590,379) (398,590,379) (398,590,385)2014 (4,972,903,346)$ 5 (994,580,670) (994,580,670) (994,580,670) (994,580,670) (994,580,666)2015 2,624,717,092$ 5 524,943,419 524,943,419 524,943,419 524,943,419 524,943,4162016 2,659,093,478$ 5 531,818,694 531,818,694 531,818,694 531,818,694 531,818,7022017201820192020
Net increase (decrease) in Pension Expense (398,590,379)$ (1,393,171,049)$ (868,227,630)$ (336,408,936)$ (336,408,942)$ 62,181,447$ 1,056,762,110$ 531,818,702$

Appendix APage 11b
NYC Office of the Actuary October 11, 2016
NEW YORK CITY EMPLOYEES' RETIREMENT SYSTEM (NYCERS)
Governmental Accounting Standards Board Statements No. 67 and No. 68 (GASB 67/68)
Increase (Decrease) in Pension Expense Arising from the Recognition of Differencesbetween Expected and Actual Experience
Differencesbetween Expected Recognition
and Actual PeriodYear Expereince (Years) 2015 2016 2017 2018 2019 20202015 (288,598,641)$ 3.37 (85,637,579) (85,637,579) (85,637,579) (31,685,904) 0 02016 (817,971,278)$ 3.33 (245,637,020) (245,637,020) (245,637,020) (81,060,218) 02017201820192020
Net increase (decrease) in Pension Expense (85,637,579)$ (331,274,599)$ (331,274,599)$ (277,322,924)$ (81,060,218)$ 0$

Appendix APage 11c
NYC Office of the Actuary October 11, 2016
NEW YORK CITY EMPLOYEES' RETIREMENT SYSTEM (NYCERS)
Governmental Accounting Standards Board Statements No. 67 and No. 68 (GASB 67/68)
Increase (Decrease) in Pension Expense Arising from the Recognition ofChanges in Assumptions
RecognitionChanges in Period
Year Assumptions (Years) 2016 2017 2018 2019 20202016 2,563,091,847$ 3.33 769,697,251 769,697,251 769,697,251 254,000,094 020172018201920202021
Net increase (decrease) in Pension Expense 769,697,251$ 769,697,251$ 769,697,251$ 254,000,094$ 0$

Appendix APage 12a(1)
NYC Office of the Actuary October 11, 2016
NEW YORK CITY EMPLOYEES' RETIREMENT SYSTEM (NYCERS)
Governmental Accounting Standards Board Statements No. 67 and No. 68 (GASB 67/68)
Changes in Proportionate Share at 6/30/2015
Transit Operating (1) (2) (3) (3) - (2)Proportionate Proportionate
Collective Share Share Change in RecognitionAmount at 6/30/2014 at 6/30/2015 Proportionate Period
at 6/30/2014 19.501% 18.840% Share (Years) 2015 2016 2017 2018Deferred Outflows
of Resources 0 0 0 0 3.37 0 0 0 0
Deferred Inflowsof Resources (5,174,093,819) (1,009,000,036) (974,799,275) 34,200,761 3.37 10,148,594 10,148,594 10,148,594 3,754,979
Net Pension Liability (18,019,267,147) (3,513,937,286) (3,394,829,930) 119,107,356 3.37 35,343,429 35,343,429 35,343,429 13,077,069
Total (23,193,360,966) (4,522,937,322) (4,369,629,205) 153,308,117 45,492,023 45,492,023 45,492,023 16,832,048
TA Non-Operating (1) (2) (3) (3) - (2)Proportionate Proportionate
Collective Share Share Change in RecognitionAmount at 6/30/2014 at 6/30/2015 Proportionate Period
at 6/30/2014 2.497% 2.812% Share (Years) 2015 2016 2017 2018Deferred Outflows
of Resources 0 0 0 0 3.37 0 0 0 0
Deferred Inflowsof Resources (5,174,093,819) (129,197,123) (145,495,518) (16,298,395) 3.37 (4,836,319) (4,836,319) (4,836,319) (1,789,438)
Net Pension Liability (18,019,267,147) (449,941,101) (506,701,792) (56,760,691) 3.37 (16,842,935) (16,842,935) (16,842,935) (6,231,886)
Total (23,193,360,966) (579,138,224) (652,197,310) (73,059,086) (21,679,254) (21,679,254) (21,679,254) (8,021,324)
TA TP (1) (2) (3) (3) - (2)Proportionate Proportionate
Collective Share Share Change in RecognitionAmount at 6/30/2014 at 6/30/2015 Proportionate Period
at 6/30/2014 0.645% 0.660% Share (Years) 2015 2016 2017 2018Deferred Outflows
of Resources 0 0 0 0 3.37 0 0 0 0
Deferred Inflowsof Resources (5,174,093,819) (33,372,905) (34,149,019) (776,114) 3.37 (230,301) (230,301) (230,301) (85,211)
Net Pension Liability (18,019,267,147) (116,224,273) (118,927,163) (2,702,890) 3.37 (802,045) (802,045) (802,045) (296,755)
Total (23,193,360,966) (149,597,178) (153,076,182) (3,479,004) (1,032,346) (1,032,346) (1,032,346) (381,966)
TA CP Engineers (1) (2) (3) (3) - (2)Proportionate Proportionate
Collective Share Share Change in RecognitionAmount at 6/30/2014 at 6/30/2015 Proportionate Period
at 6/30/2014 0.770% 0.728% Share (Years) 2015 2016 2017 2018Deferred Outflows
of Resources 0 0 0 0 3.37 0 0 0 0
Deferred Inflowsof Resources (5,174,093,819) (39,840,522) (37,667,403) 2,173,119 3.37 644,842 644,842 644,842 238,593
Net Pension Liability (18,019,267,147) (138,748,357) (131,180,265) 7,568,092 3.37 2,245,725 2,245,725 2,245,725 830,917
Total (23,193,360,966) (178,588,879) (168,847,668) 9,741,211 2,890,567 2,890,567 2,890,567 1,069,510
Amount to Recognize in Pension ExpenseFor the Fiscal Year Ended June 30
For the Fiscal Year Ended June 30
Amount to Recognize in Pension ExpenseFor the Fiscal Year Ended June 30
Amount to Recognize in Pension ExpenseFor the Fiscal Year Ended June 30
Amount to Recognize in Pension Expense

Appendix APage 12a(2)
NYC Office of the Actuary October 11, 2016
NEW YORK CITY EMPLOYEES' RETIREMENT SYSTEM (NYCERS)
Governmental Accounting Standards Board Statements No. 67 and No. 68 (GASB 67/68)
Changes in Proportionate Share at 6/30/2015
HA Regular (1) (2) (3) (3) - (2)Proportionate Proportionate
Collective Share Share Change in RecognitionAmount at 6/30/2014 at 6/30/2015 Proportionate Period
at 6/30/2014 4.714% 4.770% Share (Years) 2015 2016 2017 2018Deferred Outflows
of Resources 0 0 0 0 3.37 0 0 0 0
Deferred Inflowsof Resources (5,174,093,819) (243,906,783) (246,804,275) (2,897,492) 3.37 (859,790) (859,790) (859,790) (318,122)
Net Pension Liability (18,019,267,147) (849,428,253) (859,519,043) (10,090,790) 3.37 (2,994,300) (2,994,300) (2,994,300) (1,107,890)
Total (23,193,360,966) (1,093,335,036) (1,106,323,318) (12,988,282) (3,854,090) (3,854,090) (3,854,090) (1,426,012)
HA HP (1) (2) (3) (3) - (2)Proportionate Proportionate
Collective Share Share Change in RecognitionAmount at 6/30/2014 at 6/30/2015 Proportionate Period
at 6/30/2014 0.307% 0.302% Share (Years) 2015 2016 2017 2018Deferred Outflows
of Resources 0 0 0 0 3.37 0 0 0 0
Deferred Inflowsof Resources (5,174,093,819) (15,884,468) (15,625,763) 258,705 3.37 76,767 76,767 76,767 28,404
Net Pension Liability (18,019,267,147) (55,319,150) (54,418,187) 900,963 3.37 267,348 267,348 267,348 98,919
Total (23,193,360,966) (71,203,618) (70,043,950) 1,159,668 344,115 344,115 344,115 127,323
HHC (1) (2) (3) (3) - (2)Proportionate Proportionate
Collective Share Share Change in RecognitionAmount at 6/30/2014 at 6/30/2015 Proportionate Period
at 6/30/2014 13.991% 14.030% Share (Years) 2015 2016 2017 2018Deferred Outflows
of Resources 0 0 0 0 3.37 0 0 0 0
Deferred Inflowsof Resources (5,174,093,819) (723,907,466) (725,925,363) (2,017,897) 3.37 (598,782) (598,782) (598,782) (221,551)
Net Pension Liability (18,019,267,147) (2,521,075,667) (2,528,103,181) (7,027,514) 3.37 (2,085,316) (2,085,316) (2,085,316) (771,566)
Total (23,193,360,966) (3,244,983,133) (3,254,028,544) (9,045,411) (2,684,098) (2,684,098) (2,684,098) (993,117)
OTB (1) (2) (3) (3) - (2)Proportionate Proportionate
Collective Share Share Change in RecognitionAmount at 6/30/2014 at 6/30/2015 Proportionate Period
at 6/30/2014 0.344% 0.362% Share (Years) 2015 2016 2017 2018Deferred Outflows
of Resources 0 0 0 0 3.37 0 0 0 0
Deferred Inflowsof Resources (5,174,093,819) (17,798,883) (18,730,220) (931,337) 3.37 (276,361) (276,361) (276,361) (102,254)
Net Pension Liability (18,019,267,147) (61,986,279) (65,229,747) (3,243,468) 3.37 (962,453) (962,453) (962,453) (356,109)
Total (23,193,360,966) (79,785,162) (83,959,967) (4,174,805) (1,238,814) (1,238,814) (1,238,814) (458,363)
Amount to Recognize in Pension ExpenseFor the Fiscal Year Ended June 30
Amount to Recognize in Pension ExpenseFor the Fiscal Year Ended June 30
Amount to Recognize in Pension ExpenseFor the Fiscal Year Ended June 30
Amount to Recognize in Pension ExpenseFor the Fiscal Year Ended June 30
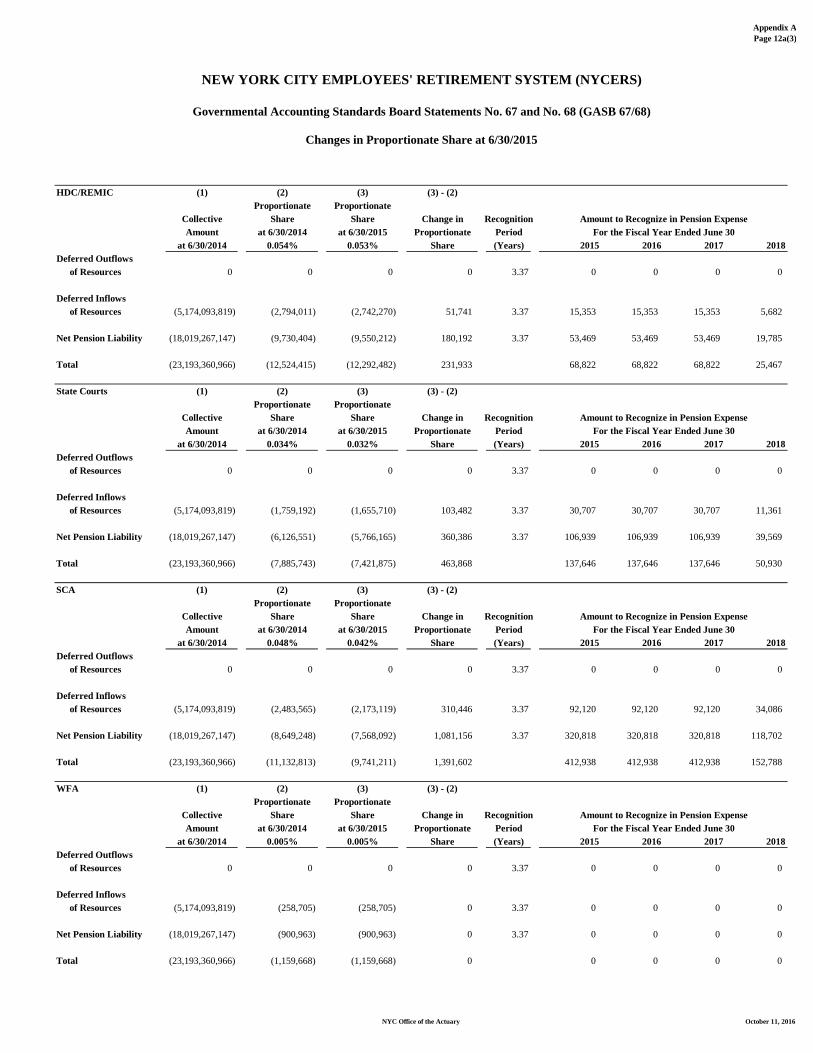
Appendix APage 12a(3)
NYC Office of the Actuary October 11, 2016
NEW YORK CITY EMPLOYEES' RETIREMENT SYSTEM (NYCERS)
Governmental Accounting Standards Board Statements No. 67 and No. 68 (GASB 67/68)
Changes in Proportionate Share at 6/30/2015
HDC/REMIC (1) (2) (3) (3) - (2)Proportionate Proportionate
Collective Share Share Change in RecognitionAmount at 6/30/2014 at 6/30/2015 Proportionate Period
at 6/30/2014 0.054% 0.053% Share (Years) 2015 2016 2017 2018Deferred Outflows
of Resources 0 0 0 0 3.37 0 0 0 0
Deferred Inflowsof Resources (5,174,093,819) (2,794,011) (2,742,270) 51,741 3.37 15,353 15,353 15,353 5,682
Net Pension Liability (18,019,267,147) (9,730,404) (9,550,212) 180,192 3.37 53,469 53,469 53,469 19,785
Total (23,193,360,966) (12,524,415) (12,292,482) 231,933 68,822 68,822 68,822 25,467
State Courts (1) (2) (3) (3) - (2)Proportionate Proportionate
Collective Share Share Change in RecognitionAmount at 6/30/2014 at 6/30/2015 Proportionate Period
at 6/30/2014 0.034% 0.032% Share (Years) 2015 2016 2017 2018Deferred Outflows
of Resources 0 0 0 0 3.37 0 0 0 0
Deferred Inflowsof Resources (5,174,093,819) (1,759,192) (1,655,710) 103,482 3.37 30,707 30,707 30,707 11,361
Net Pension Liability (18,019,267,147) (6,126,551) (5,766,165) 360,386 3.37 106,939 106,939 106,939 39,569
Total (23,193,360,966) (7,885,743) (7,421,875) 463,868 137,646 137,646 137,646 50,930
SCA (1) (2) (3) (3) - (2)Proportionate Proportionate
Collective Share Share Change in RecognitionAmount at 6/30/2014 at 6/30/2015 Proportionate Period
at 6/30/2014 0.048% 0.042% Share (Years) 2015 2016 2017 2018Deferred Outflows
of Resources 0 0 0 0 3.37 0 0 0 0
Deferred Inflowsof Resources (5,174,093,819) (2,483,565) (2,173,119) 310,446 3.37 92,120 92,120 92,120 34,086
Net Pension Liability (18,019,267,147) (8,649,248) (7,568,092) 1,081,156 3.37 320,818 320,818 320,818 118,702
Total (23,193,360,966) (11,132,813) (9,741,211) 1,391,602 412,938 412,938 412,938 152,788
WFA (1) (2) (3) (3) - (2)Proportionate Proportionate
Collective Share Share Change in RecognitionAmount at 6/30/2014 at 6/30/2015 Proportionate Period
at 6/30/2014 0.005% 0.005% Share (Years) 2015 2016 2017 2018Deferred Outflows
of Resources 0 0 0 0 3.37 0 0 0 0
Deferred Inflowsof Resources (5,174,093,819) (258,705) (258,705) 0 3.37 0 0 0 0
Net Pension Liability (18,019,267,147) (900,963) (900,963) 0 3.37 0 0 0 0
Total (23,193,360,966) (1,159,668) (1,159,668) 0 0 0 0 0
Amount to Recognize in Pension ExpenseFor the Fiscal Year Ended June 30
Amount to Recognize in Pension ExpenseFor the Fiscal Year Ended June 30
Amount to Recognize in Pension ExpenseFor the Fiscal Year Ended June 30
For the Fiscal Year Ended June 30Amount to Recognize in Pension Expense

Appendix APage 12a(4)
NYC Office of the Actuary October 11, 2016
NEW YORK CITY EMPLOYEES' RETIREMENT SYSTEM (NYCERS)
Governmental Accounting Standards Board Statements No. 67 and No. 68 (GASB 67/68)
Changes in Proportionate Share at 6/30/2015
Senior College (1) (2) (3) (3) - (2)Proportionate Proportionate
Collective Share Share Change in RecognitionAmount at 6/30/2014 at 6/30/2015 Proportionate Period
at 6/30/2014 1.151% 1.221% Share (Years) 2015 2016 2017 2018Deferred Outflows
of Resources 0 0 0 0 3.37 0 0 0 0
Deferred Inflowsof Resources (5,174,093,819) (59,553,820) (63,175,686) (3,621,866) 3.37 (1,074,738) (1,074,738) (1,074,738) (397,652)
Net Pension Liability (18,019,267,147) (207,401,765) (220,015,252) (12,613,487) 3.37 (3,742,874) (3,742,874) (3,742,874) (1,384,865)
Total (23,193,360,966) (266,955,585) (283,190,938) (16,235,353) (4,817,612) (4,817,612) (4,817,612) (1,782,517)
TBTA (1) (2) (3) (3) - (2)Proportionate Proportionate
Collective Share Share Change in RecognitionAmount at 6/30/2014 at 6/30/2015 Proportionate Period
at 6/30/2014 1.090% 1.205% Share (Years) 2015 2016 2017 2018Deferred Outflows
of Resources 0 0 0 0 3.37 0 0 0 0
Deferred Inflowsof Resources (5,174,093,819) (56,397,623) (62,347,831) (5,950,208) 3.37 (1,765,640) (1,765,640) (1,765,640) (653,288)
Net Pension Liability (18,019,267,147) (196,410,012) (217,132,169) (20,722,157) 3.37 (6,149,008) (6,149,008) (6,149,008) (2,275,133)
Total (23,193,360,966) (252,807,635) (279,480,000) (26,672,365) (7,914,648) (7,914,648) (7,914,648) (2,928,421)
City (1) (2) (3) (3) - (2)Proportionate Proportionate
Collective Share Share Change in RecognitionAmount at 6/30/2014 at 6/30/2015 Proportionate Period
at 6/30/2014 54.849% 54.938% Share (Years) 2015 2016 2017 2018Deferred Outflows
of Resources 0 0 0 0 3.37 0 0 0 0
Deferred Inflowsof Resources (5,174,093,819) (2,837,938,718) (2,842,543,663) (4,604,945) 3.37 (1,366,452) (1,366,452) (1,366,452) (505,589)
Net Pension Liability (18,019,267,147) (9,883,387,837) (9,899,424,985) (16,037,148) 3.37 (4,758,797) (4,758,797) (4,758,797) (1,760,757)
Total (23,193,360,966) (12,721,326,555) (12,741,968,648) (20,642,093) (6,125,249) (6,125,249) (6,125,249) (2,266,346)
For the Fiscal Year Ended June 30
Amount to Recognize in Pension ExpenseFor the Fiscal Year Ended June 30
Amount to Recognize in Pension ExpenseFor the Fiscal Year Ended June 30
Amount to Recognize in Pension Expense

Appendix APage 12b(1)
NYC Office of the Actuary October 11, 2016
NEW YORK CITY EMPLOYEES' RETIREMENT SYSTEM (NYCERS)
Governmental Accounting Standards Board Statements No. 67 and No. 68 (GASB 67/68)
Changes in Proportionate Share at 6/30/2016
Transit Operating (1) (2) (3) (3) - (2)Proportionate Proportionate
Collective Share Share Change in RecognitionAmount at 6/30/2015 at 6/30/2016 Proportionate Period
at 6/30/2015 18.840% 18.312% Share (Years) 2016 2017 2018 2019Deferred Outflows
of Resources 2,099,773,673 395,597,360 384,510,555 (11,086,805) 3.33 (3,329,371) (3,329,371) (3,329,371) (1,098,692)
Deferred Inflowsof Resources (3,983,883,832) (750,563,714) (729,528,807) 21,034,907 3.33 6,316,789 6,316,789 6,316,789 2,084,540
Net Pension Liability (20,240,774,085) (3,813,361,838) (3,706,490,550) 106,871,288 3.33 32,093,480 32,093,480 32,093,480 10,590,848
Total (22,124,884,244) (4,168,328,192) (4,051,508,802) 116,819,390 35,080,898 35,080,898 35,080,898 11,576,696
TA Non-Operating (1) (2) (3) (3) - (2)Proportionate Proportionate
Collective Share Share Change in RecognitionAmount at 6/30/2015 at 6/30/2016 Proportionate Period
at 6/30/2015 2.812% 3.179% Share (Years) 2016 2017 2018 2019Deferred Outflows
of Resources 2,099,773,673 59,045,636 66,751,805 7,706,169 3.33 2,314,165 2,314,165 2,314,165 763,674
Deferred Inflowsof Resources (3,983,883,832) (112,026,813) (126,647,667) (14,620,854) 3.33 (4,390,647) (4,390,647) (4,390,647) (1,448,913)
Net Pension Liability (20,240,774,085) (569,170,567) (643,454,208) (74,283,641) 3.33 (22,307,400) (22,307,400) (22,307,400) (7,361,441)
Total (22,124,884,244) (622,151,744) (703,350,070) (81,198,326) (24,383,882) (24,383,882) (24,383,882) (8,046,680)
TA TP (1) (2) (3) (3) - (2)Proportionate Proportionate
Collective Share Share Change in RecognitionAmount at 6/30/2015 at 6/30/2016 Proportionate Period
at 6/30/2015 0.660% 0.672% Share (Years) 2016 2017 2018 2019Deferred Outflows
of Resources 2,099,773,673 13,858,506 14,110,479 251,973 3.33 75,668 75,668 75,668 24,969
Deferred Inflowsof Resources (3,983,883,832) (26,293,633) (26,771,699) (478,066) 3.33 (143,563) (143,563) (143,563) (47,377)
Net Pension Liability (20,240,774,085) (133,589,109) (136,018,002) (2,428,893) 3.33 (729,397) (729,397) (729,397) (240,702)
Total (22,124,884,244) (146,024,236) (148,679,222) (2,654,986) (797,292) (797,292) (797,292) (263,110)
TA CP Engineers (1) (2) (3) (3) - (2)Proportionate Proportionate
Collective Share Share Change in RecognitionAmount at 6/30/2015 at 6/30/2016 Proportionate Period
at 6/30/2015 0.728% 0.736% Share (Years) 2016 2017 2018 2019Deferred Outflows
of Resources 2,099,773,673 15,286,352 15,454,334 167,982 3.33 50,445 50,445 50,445 16,647
Deferred Inflowsof Resources (3,983,883,832) (29,002,674) (29,321,385) (318,711) 3.33 (95,709) (95,709) (95,709) (31,584)
Net Pension Liability (20,240,774,085) (147,352,835) (148,972,097) (1,619,262) 3.33 (486,265) (486,265) (486,265) (160,467)
Total (22,124,884,244) (161,069,157) (162,839,148) (1,769,991) (531,529) (531,529) (531,529) (175,404)
Amount to Recognize in Pension Expense
Amount to Recognize in Pension Expense
Amount to Recognize in Pension Expense
Amount to Recognize in Pension ExpenseFor the Fiscal Year Ended June 30
For the Fiscal Year Ended June 30
For the Fiscal Year Ended June 30
For the Fiscal Year Ended June 30

Appendix APage 12b(2)
NYC Office of the Actuary October 11, 2016
NEW YORK CITY EMPLOYEES' RETIREMENT SYSTEM (NYCERS)
Governmental Accounting Standards Board Statements No. 67 and No. 68 (GASB 67/68)
Changes in Proportionate Share at 6/30/2016
HA Regular (1) (2) (3) (3) - (2)Proportionate Proportionate
Collective Share Share Change in RecognitionAmount at 6/30/2015 at 6/30/2016 Proportionate Period
at 6/30/2015 4.770% 4.703% Share (Years) 2016 2017 2018 2019Deferred Outflows
of Resources 2,099,773,673 100,159,204 98,752,356 (1,406,848) 3.33 (422,477) (422,477) (422,477) (139,417)
Deferred Inflowsof Resources (3,983,883,832) (190,031,259) (187,362,057) 2,669,202 3.33 801,562 801,562 801,562 264,516
Net Pension Liability (20,240,774,085) (965,484,924) (951,923,605) 13,561,319 3.33 4,072,468 4,072,468 4,072,468 1,343,915
Total (22,124,884,244) (1,055,356,979) (1,040,533,306) 14,823,673 4,451,553 4,451,553 4,451,553 1,469,014
HA HP (1) (2) (3) (3) - (2)Proportionate Proportionate
Collective Share Share Change in RecognitionAmount at 6/30/2015 at 6/30/2016 Proportionate Period
at 6/30/2015 0.302% 0.294% Share (Years) 2016 2017 2018 2019Deferred Outflows
of Resources 2,099,773,673 6,341,316 6,173,335 (167,981) 3.33 (50,445) (50,445) (50,445) (16,646)
Deferred Inflowsof Resources (3,983,883,832) (12,031,329) (11,712,618) 318,711 3.33 95,709 95,709 95,709 31,584
Net Pension Liability (20,240,774,085) (61,127,138) (59,507,876) 1,619,262 3.33 486,265 486,265 486,265 160,467
Total (22,124,884,244) (66,817,151) (65,047,159) 1,769,992 531,529 531,529 531,529 175,405
HHC (1) (2) (3) (3) - (2)Proportionate Proportionate
Collective Share Share Change in RecognitionAmount at 6/30/2015 at 6/30/2016 Proportionate Period
at 6/30/2015 14.030% 14.789% Share (Years) 2016 2017 2018 2019Deferred Outflows
of Resources 2,099,773,673 294,598,246 310,535,528 15,937,282 3.33 4,785,971 4,785,971 4,785,971 1,579,369
Deferred Inflowsof Resources (3,983,883,832) (558,938,902) (589,176,580) (30,237,678) 3.33 (9,080,384) (9,080,384) (9,080,384) (2,996,526)
Net Pension Liability (20,240,774,085) (2,839,780,604) (2,993,408,079) (153,627,475) 3.33 (46,134,377) (46,134,377) (46,134,377) (15,224,344)
Total (22,124,884,244) (3,104,121,260) (3,272,049,131) (167,927,871) (50,428,790) (50,428,790) (50,428,790) (16,641,501)
OTB (1) (2) (3) (3) - (2)Proportionate Proportionate
Collective Share Share Change in RecognitionAmount at 6/30/2015 at 6/30/2016 Proportionate Period
at 6/30/2015 0.362% 0.613% Share (Years) 2016 2017 2018 2019Deferred Outflows
of Resources 2,099,773,673 7,601,181 12,871,613 5,270,432 3.33 1,582,712 1,582,712 1,582,712 522,296
Deferred Inflowsof Resources (3,983,883,832) (14,421,659) (24,421,208) (9,999,549) 3.33 (3,002,868) (3,002,868) (3,002,868) (990,945)
Net Pension Liability (20,240,774,085) (73,271,602) (124,075,945) (50,804,343) 3.33 (15,256,559) (15,256,559) (15,256,559) (5,034,666)
Total (22,124,884,244) (80,092,080) (135,625,540) (55,533,460) (16,676,715) (16,676,715) (16,676,715) (5,503,315)
Amount to Recognize in Pension Expense
Amount to Recognize in Pension Expense
Amount to Recognize in Pension Expense
Amount to Recognize in Pension Expense
For the Fiscal Year Ended June 30
For the Fiscal Year Ended June 30
For the Fiscal Year Ended June 30
For the Fiscal Year Ended June 30

Appendix APage 12b(3)
NYC Office of the Actuary October 11, 2016
NEW YORK CITY EMPLOYEES' RETIREMENT SYSTEM (NYCERS)
Governmental Accounting Standards Board Statements No. 67 and No. 68 (GASB 67/68)
Changes in Proportionate Share at 6/30/2016
HDC/REMIC (1) (2) (3) (3) - (2)Proportionate Proportionate
Collective Share Share Change in RecognitionAmount at 6/30/2015 at 6/30/2016 Proportionate Period
at 6/30/2015 0.053% 0.053% Share (Years) 2016 2017 2018 2019Deferred Outflows
of Resources 2,099,773,673 1,112,880 1,112,880 0 3.33 0 0 0 0
Deferred Inflowsof Resources (3,983,883,832) (2,111,458) (2,111,458) 0 3.33 0 0 0 0
Net Pension Liability (20,240,774,085) (10,727,610) (10,727,610) 0 3.33 0 0 0 0
Total (22,124,884,244) (11,726,188) (11,726,188) 0 0 0 0 0
State Courts (1) (2) (3) (3) - (2)Proportionate Proportionate
Collective Share Share Change in RecognitionAmount at 6/30/2015 at 6/30/2016 Proportionate Period
at 6/30/2015 0.032% 0.031% Share (Years) 2016 2017 2018 2019Deferred Outflows
of Resources 2,099,773,673 671,928 650,930 (20,998) 3.33 (6,306) (6,306) (6,306) (2,080)
Deferred Inflowsof Resources (3,983,883,832) (1,274,843) (1,235,004) 39,839 3.33 11,964 11,964 11,964 3,947
Net Pension Liability (20,240,774,085) (6,477,048) (6,274,640) 202,408 3.33 60,783 60,783 60,783 20,059
Total (22,124,884,244) (7,079,963) (6,858,714) 221,249 66,441 66,441 66,441 21,926
SCA (1) (2) (3) (3) - (2)Proportionate Proportionate
Collective Share Share Change in RecognitionAmount at 6/30/2015 at 6/30/2016 Proportionate Period
at 6/30/2015 0.042% 0.055% Share (Years) 2016 2017 2018 2019Deferred Outflows
of Resources 2,099,773,673 881,905 1,154,876 272,971 3.33 81,973 81,973 81,973 27,052
Deferred Inflowsof Resources (3,983,883,832) (1,673,231) (2,191,136) (517,905) 3.33 (155,527) (155,527) (155,527) (51,324)
Net Pension Liability (20,240,774,085) (8,501,125) (11,132,426) (2,631,301) 3.33 (790,180) (790,180) (790,180) (260,761)
Total (22,124,884,244) (9,292,451) (12,168,686) (2,876,235) (863,734) (863,734) (863,734) (285,033)
WFA (1) (2) (3) (3) - (2)Proportionate Proportionate
Collective Share Share Change in RecognitionAmount at 6/30/2015 at 6/30/2016 Proportionate Period
at 6/30/2015 0.005% 0.005% Share (Years) 2016 2017 2018 2019Deferred Outflows
of Resources 2,099,773,673 104,989 104,989 0 3.33 0 0 0 0
Deferred Inflowsof Resources (3,983,883,832) (199,194) (199,194) 0 3.33 0 0 0 0
Net Pension Liability (20,240,774,085) (1,012,039) (1,012,039) 0 3.33 0 0 0 0
Total (22,124,884,244) (1,106,244) (1,106,244) 0 0 0 0 0
Amount to Recognize in Pension Expense
Amount to Recognize in Pension Expense
Amount to Recognize in Pension Expense
Amount to Recognize in Pension Expense
For the Fiscal Year Ended June 30
For the Fiscal Year Ended June 30
For the Fiscal Year Ended June 30
For the Fiscal Year Ended June 30

Appendix APage 12b(4)
NYC Office of the Actuary October 11, 2016
NEW YORK CITY EMPLOYEES' RETIREMENT SYSTEM (NYCERS)
Governmental Accounting Standards Board Statements No. 67 and No. 68 (GASB 67/68)
Changes in Proportionate Share at 6/30/2016
Senior College (1) (2) (3) (3) - (2)Proportionate Proportionate
Collective Share Share Change in RecognitionAmount at 6/30/2015 at 6/30/2016 Proportionate Period
at 6/30/2015 1.221% 1.247% Share (Years) 2016 2017 2018 2019Deferred Outflows
of Resources 2,099,773,673 25,638,237 26,184,178 545,941 3.33 163,946 163,946 163,946 54,103
Deferred Inflowsof Resources (3,983,883,832) (48,643,222) (49,679,031) (1,035,809) 3.33 (311,054) (311,054) (311,054) (102,647)
Net Pension Liability (20,240,774,085) (247,139,852) (252,402,453) (5,262,601) 3.33 (1,580,361) (1,580,361) (1,580,361) (521,518)
Total (22,124,884,244) (270,144,837) (275,897,306) (5,752,469) (1,727,469) (1,727,469) (1,727,469) (570,062)
TBTA (1) (2) (3) (3) - (2)Proportionate Proportionate
Collective Share Share Change in RecognitionAmount at 6/30/2015 at 6/30/2016 Proportionate Period
at 6/30/2015 1.205% 1.266% Share (Years) 2016 2017 2018 2019Deferred Outflows
of Resources 2,099,773,673 25,302,273 26,583,135 1,280,862 3.33 384,643 384,643 384,643 126,933
Deferred Inflowsof Resources (3,983,883,832) (48,005,800) (50,435,969) (2,430,169) 3.33 (729,780) (729,780) (729,780) (240,829)
Net Pension Liability (20,240,774,085) (243,901,328) (256,248,200) (12,346,872) 3.33 (3,707,769) (3,707,769) (3,707,769) (1,223,565)
Total (22,124,884,244) (266,604,855) (280,101,034) (13,496,179) (4,052,906) (4,052,906) (4,052,906) (1,337,461)
City (1) (2) (3) (3) - (2)Proportionate Proportionate
Collective Share Share Change in RecognitionAmount at 6/30/2015 at 6/30/2016 Proportionate Period
at 6/30/2015 54.938% 54.045% Share (Years) 2016 2017 2018 2019Deferred Outflows
of Resources 2,099,773,673 1,153,573,660 1,134,822,680 (18,750,980) 3.33 (5,630,924) (5,630,924) (5,630,924) (1,858,208)
Deferred Inflowsof Resources (3,983,883,832) (2,188,666,100) (2,153,090,018) 35,576,082 3.33 10,683,508 10,683,508 10,683,508 3,525,558
Net Pension Liability (20,240,774,085) (11,119,876,467) (10,939,126,356) 180,750,111 3.33 54,279,312 54,279,312 54,279,312 17,912,175
Total (22,124,884,244) (12,154,968,907) (11,957,393,694) 197,575,213 59,331,896 59,331,896 59,331,896 19,579,525
Amount to Recognize in Pension Expense
Amount to Recognize in Pension Expense
Amount to Recognize in Pension Expense
For the Fiscal Year Ended June 30
For the Fiscal Year Ended June 30
For the Fiscal Year Ended June 30

Appendix APage 13a
NYC Office of the Actuary October 11, 2016
NEW YORK CITY EMPLOYEES' RETIREMENT SYSTEM (NYCERS)
Governmental Accounting Standards Board Statements No. 67 and No. 68 (GASB 67/68)
Schedule of Pension Amounts by EmployerAs of and for the year ended June 30, 2015
Net Amortization ofDeferred Amounts
Changes in Changes in from Changes inNet Difference Proportion Net Difference Proportion Proportion
Between and Differences Between and Differences and DifferencesProjected Between Projected Between Between
Differences and Actual Employer Total Differences and Actual Employer Total Proportionate EmployerBetween Investment Contributions Deferred Between Investment Contributions Deferred Share of Contributions TotalExpected Earnings on and Proportionate Outflows Expected Earnings on and Proportionate Inflows Plan and Proportionate Employer
Net Pension and Actual Pension Plan Change of Share of of and Actual Pension Plan Change of Share of of Pension Share of PensionEntity* Liability Experience Investments Assumptions Contributions Resources Experience Investments Assumptions Contributions Resources Expense Contributions Expense
Transit Operating 3,813,361,838$ 0$ 395,597,360$ 0$ (107,816,094)$ 287,781,266$ 38,237,864$ 712,325,850$ 0$ 0$ 750,563,714$ 394,091,593$ (45,492,023)$ 348,599,570$
TA Non-Operating 569,170,567 0 59,045,636 0 51,379,832 110,425,468 5,707,265 106,319,548 0 0 112,026,813 58,820,889 21,679,254 80,500,143
TA TP 133,589,109 0 13,858,506 0 2,446,658 16,305,164 1,339,543 24,954,090 0 0 26,293,633 13,805,757 1,032,346 14,838,103
TA CP Engineers 147,352,835 0 15,286,352 0 (6,850,644) 8,435,708 1,477,557 27,525,118 0 0 29,002,675 15,228,167 (2,890,567) 12,337,600
HA Regular 965,484,924 0 100,159,204 0 9,134,192 109,293,396 9,681,243 180,350,016 0 0 190,031,259 99,777,968 3,854,090 103,632,058
HA HP 61,127,138 0 6,341,316 0 (815,553) 5,525,763 612,942 11,418,387 0 0 12,031,329 6,317,180 (344,115) 5,973,065
HHC 2,839,780,604 0 294,598,246 0 6,361,313 300,959,559 28,475,437 530,463,465 0 0 558,938,902 293,476,915 2,684,098 296,161,013
OTB 73,271,602 0 7,601,181 0 2,935,991 10,537,172 734,719 13,686,940 0 0 14,421,659 7,572,249 1,238,814 8,811,063
HDC/REMIC 10,727,610 0 1,112,880 0 (163,111) 949,769 107,569 2,003,889 0 0 2,111,458 1,108,644 (68,822) 1,039,822
State Courts 6,477,048 0 671,928 0 (326,222) 345,706 64,948 1,209,895 0 0 1,274,843 669,371 (137,646) 531,725
SCA 8,501,125 0 881,905 0 (978,664) (96,759) 85,244 1,587,988 0 0 1,673,232 878,548 (412,938) 465,610
WFA 1,012,039 0 104,989 0 0 104,989 10,148 189,046 0 0 199,194 104,590 0 104,590
Senior Colleges 247,139,852 0 25,638,237 0 11,417,741 37,055,978 2,478,155 46,165,067 0 0 48,643,222 25,540,650 4,817,612 30,358,262
TBTA 243,901,328 0 25,302,273 0 18,757,717 44,059,990 2,445,681 45,560,119 0 0 48,005,800 25,205,965 7,914,648 33,120,613
City 11,119,876,466 0 1,153,573,660 0 14,516,844 1,168,090,504 111,502,747 2,077,163,352 0 0 2,188,666,099 1,149,182,792 6,125,249 1,155,308,041
Total 20,240,774,085$ 0$ 2,099,773,673$ 0$ 0$ 2,099,773,673$ 202,961,062$ 3,780,922,770$ 0$ 0$ 3,983,883,832$ 2,091,781,278$ 0$ 2,091,781,278$
* Transit Operating - Transit Authority Operating TA Non-Operating - Transit Authority Non-Operating TA TP - Transit Authority / Transit Police TA CP Engineers - Transit Authority Capital Project Engineers HA Regular - Housing Authority Regular HA HP - Housing Authority / Housing Police HHC - Health and Hospitals Corporation OTB - Off-Track Betting HDC/REMIC - Housing Development Corporation / REMIC State Courts - State Courts SCA - School Construction Authority WFA - Water Finance Authority Senior Colleges - Senior Colleges TBTA - Triborough Bridge and Tunnel Authority City - City of New York
Deferred Outflows of Resources Deferred Inflows of Resources Pension Expense

Appendix APage 13b
NYC Office of the Actuary October 11, 2016
NEW YORK CITY EMPLOYEES' RETIREMENT SYSTEM (NYCERS)
Governmental Accounting Standards Board Statements No. 67 and No. 68 (GASB 67/68)
Schedule of Pension Amounts by EmployerAs of and for the year ended June 30, 2016
Net Amortization ofDeferred Amounts
Changes in Changes in from Changes inNet Difference Proportion Net Difference Proportion Proportion
Between and Differences Between and Differences and DifferencesProjected Between Projected Between Between
Differences and Actual Employer Total Differences and Actual Employer Total Proportionate EmployerBetween Investment Contributions Deferred Between Investment Contributions Deferred Share of Contributions TotalExpected Earnings on and Proportionate Outflows Expected Earnings on and Proportionate Inflows Plan and Proportionate Employer
Net Pension and Actual Pension Plan Change of Share of of and Actual Pension Plan Change of Share of of Pension Share of PensionEntity* Liability Experience Investments Assumptions Contributions Resources Experience Investments Assumptions Contributions Resources Expense Contributions Expense
Transit Operating 4,449,234,028$ 0$ 677,929,475$ 328,406,418$ (151,819,997)$ 854,515,896$ 126,290,126$ 437,245,095$ 0$ (7,757,434)$ 555,777,787$ 571,206,488$ (80,572,921)$ 490,633,567$
TA Non-Operating 772,395,969 0 117,689,919 57,012,014 91,907,026 266,608,959 21,924,220 75,906,627 0 5,392,004 103,222,851 99,162,594 46,063,136 145,225,730
TA TP 163,274,643 0 24,878,146 12,051,612 3,448,311 40,378,069 4,634,500 16,045,692 0 176,305 20,856,497 20,961,707 1,829,638 22,791,345
TA CP Engineers 178,824,609 0 27,247,493 13,199,384 (2,604,078) 37,842,799 5,075,881 17,573,853 0 117,537 22,767,271 22,958,059 (2,359,038) 20,599,021
HA Regular 1,142,679,533 0 174,110,000 84,343,348 (6,076,389) 252,376,959 32,434,604 112,295,963 0 (984,371) 143,746,196 146,700,749 (597,463) 146,103,286
HA HP 71,432,656 0 10,884,189 5,272,580 (1,827,437) 14,329,332 2,027,594 7,019,990 0 (117,536) 8,930,048 9,170,746 (875,644) 8,295,102
HHC 3,593,256,991 0 547,504,314 265,225,127 132,327,607 945,057,048 101,993,483 353,124,602 0 11,151,311 466,269,396 461,313,497 53,112,888 514,426,385
OTB 148,939,517 0 22,693,904 10,993,509 44,241,642 77,929,055 4,227,602 14,636,918 0 3,687,720 22,552,240 19,121,318 17,915,529 37,036,847
HDC/REMIC 12,877,315 0 1,962,116 950,499 (94,289) 2,818,326 365,519 1,265,508 0 0 1,631,027 1,653,229 (68,822) 1,584,407
State Courts 7,532,014 0 1,147,653 555,952 (358,076) 1,345,529 213,794 740,203 0 (14,692) 939,305 966,984 (204,087) 762,897
SCA 13,363,254 0 2,036,158 986,367 1,637,773 4,660,298 379,312 1,313,263 0 190,998 1,883,573 1,715,616 450,796 2,166,412
WFA 1,214,842 0 185,105 89,670 0 274,775 34,483 119,388 0 0 153,871 155,966 0 155,966
Senior Colleges 302,981,369 0 46,165,250 22,363,631 11,007,124 79,536,005 8,600,032 29,775,264 0 381,995 38,757,291 38,897,690 6,545,081 45,442,771
TBTA 307,597,766 0 46,868,650 22,704,376 21,182,561 90,755,587 8,731,067 30,228,937 0 896,219 39,856,223 39,490,358 11,967,554 51,457,912
City 13,131,217,392 0 2,000,802,666 969,240,109 (142,971,778) 2,827,070,997 372,725,524 1,290,460,418 0 (13,120,056) 1,650,065,886 1,685,826,481 (53,206,647) 1,632,619,834
Total 24,296,821,898$ 0$ 3,702,105,038$ 1,793,394,596$ 0$ 5,495,499,634$ 689,657,741$ 2,387,751,721$ 0$ 0$ 3,077,409,462$ 3,119,301,482$ 0$ 3,119,301,482$
* Transit Operating - Transit Authority Operating TA Non-Operating - Transit Authority Non-Operating TA TP - Transit Authority / Transit Police TA CP Engineers - Transit Authority Capital Project Engineers HA Regular - Housing Authority Regular HA HP - Housing Authority / Housing Police HHC - Health and Hospitals Corporation OTB - Off-Track Betting HDC/REMIC - Housing Development Corporation / REMIC State Courts - State Courts SCA - School Construction Authority WFA - Water Finance Authority Senior Colleges - Senior Colleges TBTA - Triborough Bridge and Tunnel Authority City - City of New York
Deferred Outflows of Resources Deferred Inflows of Resources Pension Expense

Appendix APage 13c
NYC Office of the Actuary October 11, 2016
Net Difference Total Net Difference TotalBetween Deferred Between DeferredProjected Outflows of Projected Inflows of
Differences and Actual Resources Differences and Actual ResourcesBetween Investment Excluding Between Investment ExcludingExpected Earnings on Employer Expected Earnings on Employer Plan
Net Pension and Actual Pension Plan Change of Specific and Actual Pension Plan Change of Specific PensionLiability Experience Investments Assumptions Amounts Experience Investments Assumptions Amounts Expense
24,296,821,898$ 0$ 3,702,105,038$ 1,793,394,596$ 5,495,499,634$ 689,657,741$ 2,387,751,721$ 0$ 3,077,409,462$ 3,119,301,482$
NEW YORK CITY EMPLOYEES' RETIREMENT SYSTEM (NYCERS)
Governmental Accounting Standards Board Statements No. 67 and No. 68 (GASB 67/68)
Schedule of Collective Pension AmountsAs of and for the year ended June 30, 2016
Deferred Outflows of Resources Deferred Inflows of Resources

Appendix APage 14
NYC Office of the Actuary October 11, 2016
2016 20151. Total Pension Liability
a. Service Cost 1,899,994,413$ 1,832,487,270$ b. Interest 5,372,603,831 5,071,014,309c. Changes of Benefit Terms 0 0d. Differences b/t Expected and Actual Experience (817,971,278) (288,598,641)e. Changes of Assumptions 2,563,091,847 0f. Benefit Payments (4,494,146,000) (4,324,135,000)g. Net Changes in Total Pension Liability 4,523,572,813$ 2,290,767,938$
2. Total Pension Liability - Beginning 75,315,562,085$ 73,024,794,147$ 3. Total Pension Liability - Ending 79,839,134,898$ 75,315,562,085$
4. Plan Fiduciary Net Positiona. Contributions - Employer 3,365,454,000$ 3,160,258,000$ b. Contributions - Employee 485,508,000 467,129,000c. Net Investment Income 1,171,904,000 1,175,109,000d. Benefit Payments (4,494,146,000) (4,324,135,000)e. Payments to Other Retirement Systems (7,440,000) (7,142,000)f. Transfers to Variable Supplements Fund 0 0g. Administrative Expenses (56,683,000) (54,635,000)h. Other Changes 2,928,000 (347,323,000)i. Net Changes in Fiduciary Net Position 467,525,000$ 69,261,000$
5. Plan Fiduciary Net Position - Beginning 55,074,788,000$ 55,005,527,000$ 6. Plan Fiduciary Net Position - Ending 55,542,313,000$ 55,074,788,000$
7. NYCERS' Net Pension Liability 24,296,821,898$ 20,240,774,085$
8. Plan Fiduciary Net Position as a Percentageof Total Pension Liability 69.6% 73.1%
9. Covered Employee Payroll 1 12,336,979,280$ 12,314,958,283$
10. NYCERS' Net Pension Liability as a Percentageof Covered Employee Payroll 196.9% 164.4%
1 Projected Employee Payroll at Time 1.0 under One-Year Lag Methodology.
Schedule of Changes in Net Pension Liability and Related Ratios
NEW YORK CITY EMPLOYEES' RETIREMENT SYSTEM (NYCERS)
Governmental Accounting Standards Board Statements No. 67 and No. 68 (GASB 67/68)

Appendix APage 15
NYC Office of the Actuary October 11, 2016
PV of Future Average Expected Average ExpectedWorkLife Remaining Service Life Remaining Service Life
Group # Count @ 6/30/2014 @ 6/30/2014 @ 6/30/2015Active 184,762 1,281,353 6.94 6.36Active/Inactive 16,527 0 0 0Term Vested 9,674 0 0 0Retired 142,095 0 0 0 Total 353,058 1,281,353 3.63 3.33
NEW YORK CITY EMPLOYEES' RETIREMENT SYSTEM (NYCERS)
Governmental Accounting Standards Board Statements No. 67 and No. 68 (GASB 67/68)
Average Expected Remaining Service Lives

APPENDIX B

NYC Office of the Actuary October 11, 2016
Page 1a - Market Value of AssetsPage 1b - Development of Asset (Gain) / Loss - June 30, 2015Page 1c - Development of Asset (Gain) / Loss - June 30, 2016
Page 2 - Roll-Forward of Entry Age Actuarial Accrued Liabilities
Page 3a - Changes in Net Pension Liability by Source - June 30, 2015Page 3b - Changes in Net Pension Liability by Source - June 30, 2016Page 3c - Changes in Net Pension Liability by Source - June 30, 2015 - SummaryPage 3d - Changes in Net Pension Liability by Source - June 30, 2016 - Summary
Page 4a - Components of Pension Expense - June 30, 2015Page 4b - Components of Pension Expense - June 30, 2016Page 4c - Components of Pension Expense - June 30, 2015 - SummaryPage 4d - Components of Pension Expense - June 30, 2016 - Summary
Page 5a - Pension Expense, Total Deferred Inflows/Outflows of Resources @ June 30, 2013Page 5b - Pension Expense, Deferred Inflows/Outflows of Resources for June 30, 2014Page 5c - Pension Expense, Deferred Inflows/Outflows of Resources for June 30, 2015Page 5d - Pension Expense, Deferred Inflows/Outflows of Resources for June 30, 2016Page 5e - Pension Expense, Total Deferred Inflows/Outflows of Resources @ June 30, 2016
Page 6 - Schedule of Employer Contributions
Page 7 - Statement of Fiduciary Net Position
Page 8 - Statement of Changes in Fiduciary Net Position
Page 9 - Long-Term Expected Rate of Return
Page 10a - Schedule of Employer Allocations - June 30, 2015Page 10b - Schedule of Employer Allocations - June 30, 2016
Page 11a - Increase (Decrease) in Pension Expense Arising from the Recognition of Differences between Projected and Actual Earnings on Pension Plan Investments
Page 11b - Increase (Decrease) in Pension Expense Arising from the Recognition of Differences between Expected and Actual Experience
Page 11c - Increase (Decrease) in Pension Expense Arising from the Recognition of changes in Assumptions
Page 12a - Changes in Proportionate Share - June 30, 2015Page 12b - Changes in Proportionate Share - June 30, 2016
Page 13a - Schedule of Pension Amounts by Employer - June 30, 2015Page 13b - Schedule of Pension Amounts by Employer - June 30, 2016Page 13c - Schedule of Collective Pension Amounts - June 30, 2016
Page 14 - Schedule of Changes in Net Pension Liability and Related Ratios
Page 15 - Average Expected Remaining Service Lives
APPENDIX B
NEW YORK CITY TEACHERS' RETIREMENT SYSTEM (TRS)

Appendix BPage 1a
NYC Office of the Actuary October 11, 2016
Fixed Variable Total1. Plan Net Position @ 6/30/2014 41,199,954,000$ 3,289,985,000$ 44,489,939,000$
2. Changes for the year:a. ER Contributions 3,325,474,000 54,000 3,325,528,000b. EE Contributions 158,124,000 466,000 158,590,000c. Net Investment Income 1,457,155,000 154,774,000 1,611,929,000d. Benefit Payments (3,423,816,000) (600,456,000) (4,024,272,000)e. Payment of Interest on TDA Fixed Funds (1,248,988,000) 0 (1,248,988,000)f. Administrative Expenses (46,243,000) (12,148,000) (58,391,000)g. Other 30,386,000 (30,057,000) 329,000h. Net Changes 252,092,000 (487,367,000) (235,275,000)
3. Plan Net Position @ 6/30/2015 41,452,046,000$ 2,802,618,000$ 44,254,664,000$
4. Changes for the year:a. ER Contributions 3,760,674,000 40,000 3,760,714,000b. EE Contributions 173,287,000 409,000 173,696,000c. Net Investment Income 981,059,000 (20,792,000) 960,267,000d. Benefit Payments (3,551,588,000) (555,867,000) (4,107,455,000)e. Payment of Interest on TDA Fixed Funds (1,354,207,000) 0 (1,354,207,000)f. Administrative Expenses (47,583,000) (11,784,000) (59,367,000)g. Other 26,768,000 (25,535,000) 1,233,000h. Net Changes (11,590,000)$ (613,529,000)$ (625,119,000)$
5. Plan Net Position @ 6/30/2016 41,440,456,000$ 2,189,089,000$ 43,629,545,000$
NEW YORK CITY TEACHERS' RETIREMENT SYSTEM (TRS)
Governmental Accounting Standards Board Statements No. 67 and No. 68 (GASB 67/68)
Market Values of Assets - QPP Only
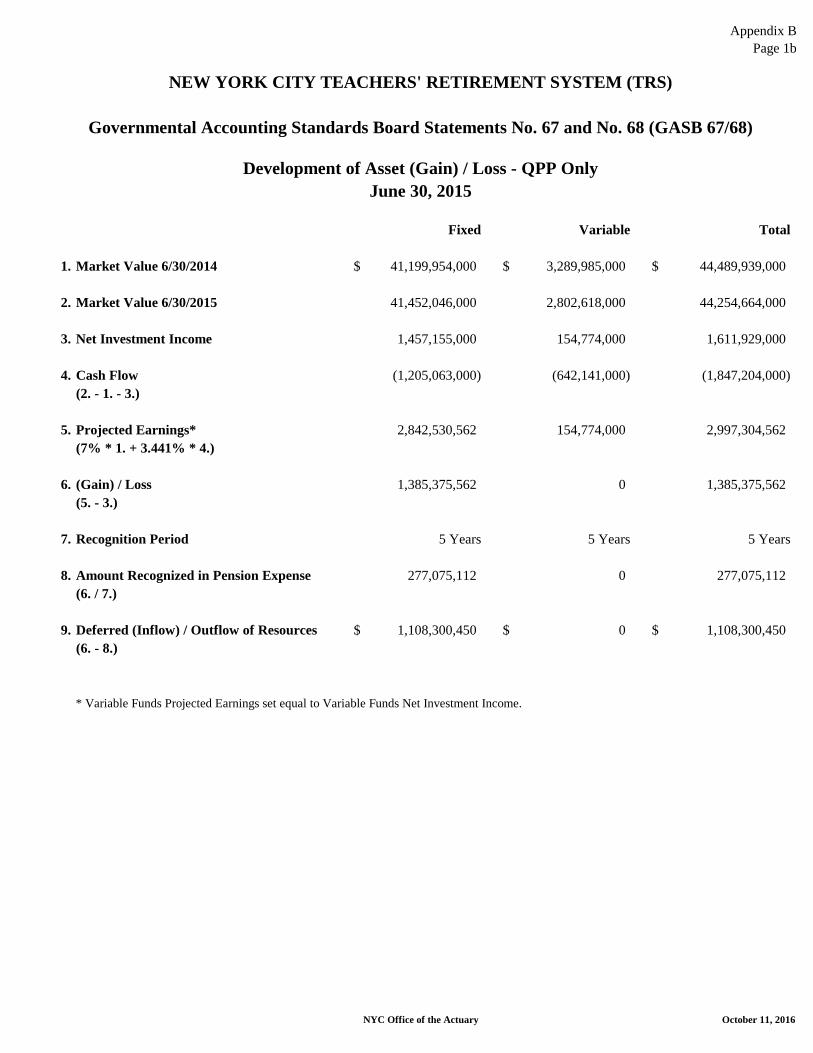
Appendix BPage 1b
NYC Office of the Actuary October 11, 2016
Fixed Variable Total
1. Market Value 6/30/2014 41,199,954,000$ 3,289,985,000$ 44,489,939,000$
2. Market Value 6/30/2015 41,452,046,000 2,802,618,000 44,254,664,000
3. Net Investment Income 1,457,155,000 154,774,000 1,611,929,000
4. Cash Flow (1,205,063,000) (642,141,000) (1,847,204,000)(2. - 1. - 3.)
5. Projected Earnings* 2,842,530,562 154,774,000 2,997,304,562 (7% * 1. + 3.441% * 4.)
6. (Gain) / Loss 1,385,375,562 0 1,385,375,562(5. - 3.)
7. Recognition Period 5 Years 5 Years 5 Years
8. Amount Recognized in Pension Expense 277,075,112 0 277,075,112(6. / 7.)
9. Deferred (Inflow) / Outflow of Resources 1,108,300,450$ 0$ 1,108,300,450$ (6. - 8.)
* Variable Funds Projected Earnings set equal to Variable Funds Net Investment Income.
NEW YORK CITY TEACHERS' RETIREMENT SYSTEM (TRS)
Governmental Accounting Standards Board Statements No. 67 and No. 68 (GASB 67/68)
Development of Asset (Gain) / Loss - QPP OnlyJune 30, 2015

Appendix BPage 1c
NYC Office of the Actuary October 11, 2016
Fixed Variable Total
1. Market Value 6/30/2015 41,452,046,000$ 2,802,618,000$ 44,254,664,000$
2. Market Value 6/30/2016 41,440,456,000 2,189,089,000 43,629,545,000
3. Net Investment Income 981,059,000 (20,792,000) 960,267,000
4. Cash Flow (992,649,000) (592,737,000) (1,585,386,000)(2. - 1. - 3.)
5. Projected Earnings* 2,867,486,168 (20,792,000) 2,846,694,168 (7% * 1. + 3.441% * 4.)
6. (Gain) / Loss 1,886,427,168 0 1,886,427,168(5. - 3.)
7. Recognition Period 5 Years 5 Years 5 Years
8. Amount Recognized in Pension Expense 377,285,434 0 377,285,434(6. / 7.)
9. Deferred (Inflow) / Outflow of Resources 1,509,141,734$ 0$ 1,509,141,734$ (6. - 8.)
* Variable Funds Projected Earnings set equal to Variable Funds Net Investment Income.
NEW YORK CITY TEACHERS' RETIREMENT SYSTEM (TRS)
Governmental Accounting Standards Board Statements No. 67 and No. 68 (GASB 67/68)
Development of Asset (Gain) / Loss - QPP OnlyJune 30, 2016
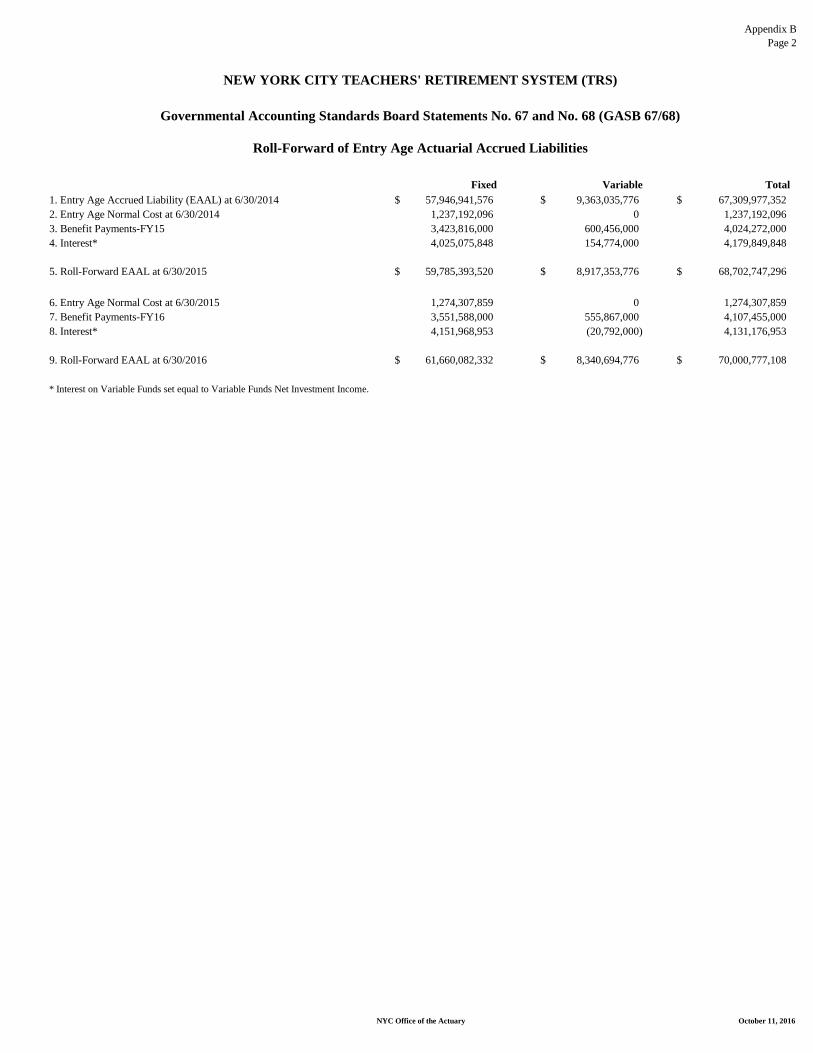
Appendix BPage 2
NYC Office of the Actuary October 11, 2016
Fixed Variable Total1. Entry Age Accrued Liability (EAAL) at 6/30/2014 57,946,941,576$ 9,363,035,776$ 67,309,977,352$ 2. Entry Age Normal Cost at 6/30/2014 1,237,192,096 0 1,237,192,0963. Benefit Payments-FY15 3,423,816,000 600,456,000 4,024,272,0004. Interest* 4,025,075,848 154,774,000 4,179,849,848
5. Roll-Forward EAAL at 6/30/2015 59,785,393,520$ 8,917,353,776$ 68,702,747,296$
6. Entry Age Normal Cost at 6/30/2015 1,274,307,859 0 1,274,307,8597. Benefit Payments-FY16 3,551,588,000 555,867,000 4,107,455,0008. Interest* 4,151,968,953 (20,792,000) 4,131,176,953
9. Roll-Forward EAAL at 6/30/2016 61,660,082,332$ 8,340,694,776$ 70,000,777,108$
* Interest on Variable Funds set equal to Variable Funds Net Investment Income.
NEW YORK CITY TEACHERS' RETIREMENT SYSTEM (TRS)
Governmental Accounting Standards Board Statements No. 67 and No. 68 (GASB 67/68)
Roll-Forward of Entry Age Actuarial Accrued Liabilities

Appendix BPage 3a(1)
NYC Office of the Actuary October 11, 2016
Total Pension Plan Fiduciary Net PensionLiability Net Position Liability
(a) (b) (a) - (b)1. Balances at June 30, 2014 62,306,379,111$ 44,489,939,000$ 17,816,440,111$
2. Changes for the Year:a. Service Cost 1,223,157,877 0 1,223,157,877b. Interest 4,027,138,338 0 4,027,138,338c. Differences b/t expected and actual experience 1,507,964,351 0 1,507,964,351d. Contributions - employer 0 3,325,528,000 (3,325,528,000)e. Contributions - employee 0 158,590,000 (158,590,000)f. Net Investment Income 0 1,611,929,000 (1,611,929,000)g. Benefit payments (4,024,272,000) (4,024,272,000) 0h. Payment of Interest on TDA Fixed Funds 0 (1,248,988,000) 1,248,988,000i. Administrative expenses 0 (58,391,000) 58,391,000j. Other changes 0 329,000 (329,000)k. Net Changes 2,733,988,566$ (235,275,000)$ 2,969,263,566$
3. Balances at June 30, 2015 65,040,367,677$ 44,254,664,000$ 20,785,703,677$
NEW YORK CITY TEACHERS' RETIREMENT SYSTEM (TRS)
Governmental Accounting Standards Board Statements No. 67 and No. 68 (GASB 67/68)
Changes in Net Pension Liability (NPL) by SourceBalances at June 30, 2015

Appendix BPage 3a(2)
NYC Office of the Actuary October 11, 2016
Total Pension Plan Fiduciary Net PensionLiability Net Position Liability
(a) (b) (a) - (b)1. Balances at June 30, 2014 96.354% 60,034,688,526$ 42,867,835,825$ 17,166,852,701$
2. Changes for the Year:a. Service Cost 1,178,463,689 0 1,178,463,689b. Interest 3,879,986,703 0 3,879,986,703c. Differences b/t expected and actual experience 1,452,863,333 0 1,452,863,333d. Contributions - employer 0 3,204,013,207 (3,204,013,207)e. Contributions - employee 0 152,795,122 (152,795,122)f. Net Investment Income 0 1,553,029,113 (1,553,029,113)g. Benefit payments (3,877,225,101) (3,877,225,101) 0h. Payment of Interest on TDA Fixed Funds 0 (1,203,349,978) 1,203,349,978i. Administrative expenses 0 (56,257,394) 56,257,394j. Other changes 0 316,977 (316,977)k. Net Changes 2,634,088,624$ (226,678,054)$ 2,860,766,678$
3. SubTotal 62,668,777,150$ 42,641,157,771$ 20,027,619,379$
4. Changes in Proportionate Share (4,984,509)$ (3,559,195)$ (1,425,314)$
5. Balances at June 30, 2015 96.346% 62,663,792,641$ 42,637,598,576$ 20,026,194,065$
NEW YORK CITY TEACHERS' RETIREMENT SYSTEM (TRS)
Governmental Accounting Standards Board Statements No. 67 and No. 68 (GASB 67/68)
Changes in Net Pension Liability (NPL) by SourceDepartment of EducationBalances at June 30, 2015

Appendix BPage 3a(3)
NYC Office of the Actuary October 11, 2016
Total Pension Plan Fiduciary Net PensionLiability Net Position Liability
(a) (b) (a) - (b)1. Balances at June 30, 2014 2.502% 1,558,905,606$ 1,113,138,272$ 445,767,334$
2. Changes for the Year:a. Service Cost 31,068,210 0 31,068,210b. Interest 102,289,314 0 102,289,314c. Differences b/t expected and actual experience 38,302,295 0 38,302,295d. Contributions - employer 0 84,468,411 (84,468,411)e. Contributions - employee 0 4,028,186 (4,028,186)f. Net Investment Income 0 40,942,997 (40,942,997)g. Benefit payments (102,216,509) (102,216,509) 0h. Payment of Interest on TDA Fixed Funds 0 (31,724,295) 31,724,295i. Administrative expenses 0 (1,483,131) 1,483,131j. Other changes 0 8,359 (8,359)k. Net Changes 69,443,310$ (5,975,982)$ 75,419,292$
3. SubTotal 1,628,348,916$ 1,107,162,290$ 521,186,626$
4. Changes in Proportionate Share 23,676,423$ 16,906,176$ 6,770,247$
5. Balances at June 30, 2015 2.540% 1,652,025,339$ 1,124,068,466$ 527,956,873$
CUNY Senior CollegesBalances at June 30, 2015
Changes in Net Pension Liability (NPL) by Source
NEW YORK CITY TEACHERS' RETIREMENT SYSTEM (TRS)
Governmental Accounting Standards Board Statements No. 67 and No. 68 (GASB 67/68)

Appendix BPage 3a(4)
NYC Office of the Actuary October 11, 2016
CUNY Community Colleges
Total Pension Plan Fiduciary Net PensionLiability Net Position Liability
(a) (b) (a) - (b)1. Balances at June 30, 2014 0.921% 573,841,752$ 409,752,339$ 164,089,413$
2. Changes for the Year:a. Service Cost 11,350,905 0 11,350,905b. Interest 37,371,844 0 37,371,844c. Differences b/t expected and actual experience 13,993,909 0 13,993,909d. Contributions - employer 0 30,860,900 (30,860,900)e. Contributions - employee 0 1,471,715 (1,471,715)f. Net Investment Income 0 14,958,701 (14,958,701)g. Benefit payments (37,345,244) (37,345,244) 0h. Payment of Interest on TDA Fixed Funds 0 (11,590,609) 11,590,609i. Administrative expenses 0 (541,868) 541,868j. Other changes 0 3,053 (3,053)k. Net Changes 25,371,414$ (2,183,352)$ 27,554,766$
3. SubTotal 599,213,166$ 407,568,987$ 191,644,179$
4. Changes in Proportionate Share 4,361,446$ 3,114,295$ 1,247,151$
5. Balances at June 30, 2015 0.928% 603,574,612$ 410,683,282$ 192,891,330$
NEW YORK CITY TEACHERS' RETIREMENT SYSTEM (TRS)
Governmental Accounting Standards Board Statements No. 67 and No. 68 (GASB 67/68)
Changes in Net Pension Liability (NPL) by Source
Balances at June 30, 2015

Appendix BPage 3a(5)
NYC Office of the Actuary October 11, 2016
Beginning with Children Charter School
Total Pension Plan Fiduciary Net PensionLiability Net Position Liability
(a) (b) (a) - (b)1. Balances at June 30, 2014 0.018% 11,215,147$ 8,008,188$ 3,206,959$
2. Changes for the Year:a. Service Cost 207,937 0 207,937b. Interest 684,614 0 684,614c. Differences b/t expected and actual experience 256,354 0 256,354d. Contributions - employer 0 565,340 (565,340)e. Contributions - employee 0 26,960 (26,960)f. Net Investment Income 0 274,028 (274,028)g. Benefit payments (684,126) (684,126) 0h. Payment of Interest on TDA Fixed Funds 0 (212,328) 212,328i. Administrative expenses 0 (9,926) 9,926j. Other changes 0 56 (56)k. Net Changes 464,779$ (39,996)$ 504,775$
3. SubTotal 11,679,926$ 7,968,192$ 3,711,734$
4. Changes in Proportionate Share (623,063)$ (444,899)$ (178,164)$
5. Balances at June 30, 2015 0.017% 11,056,863$ 7,523,293$ 3,533,570$
NEW YORK CITY TEACHERS' RETIREMENT SYSTEM (TRS)
Governmental Accounting Standards Board Statements No. 67 and No. 68 (GASB 67/68)
Changes in Net Pension Liability (NPL) by Source
Balances at June 30, 2015

Appendix BPage 3a(6)
NYC Office of the Actuary October 11, 2016
Future Leaders Charter School
Total Pension Plan Fiduciary Net PensionLiability Net Position Liability
(a) (b) (a) - (b)1. Balances at June 30, 2014 0.009% 5,607,574$ 4,004,095$ 1,603,479$
2. Changes for the Year:a. Service Cost 73,389 0 73,389b. Interest 241,628 0 241,628c. Differences b/t expected and actual experience 90,478 0 90,478d. Contributions - employer 0 199,532 (199,532)e. Contributions - employee 0 9,515 (9,515)f. Net Investment Income 0 96,716 (96,716)g. Benefit payments (241,456) (241,456) 0h. Payment of Interest on TDA Fixed Funds 0 (74,939) 74,939i. Administrative expenses 0 (3,503) 3,503j. Other changes 0 17 (17)k. Net Changes 164,039$ (14,118)$ 178,157$
3. SubTotal 5,771,613$ 3,989,977$ 1,781,636$
4. Changes in Proportionate Share (1,869,191)$ (1,334,697)$ (534,494)$
5. Balances at June 30, 2015 0.006% 3,902,422$ 2,655,280$ 1,247,142$
Changes in Net Pension Liability (NPL) by Source
Balances at June 30, 2015
Governmental Accounting Standards Board Statements No. 67 and No. 68 (GASB 67/68)
NEW YORK CITY TEACHERS' RETIREMENT SYSTEM (TRS)

Appendix BPage 3a(7)
NYC Office of the Actuary October 11, 2016
Harriet Tubman Charter School
Total Pension Plan Fiduciary Net PensionLiability Net Position Liability
(a) (b) (a) - (b)1. Balances at June 30, 2014 0.012% 7,476,766$ 5,338,792$ 2,137,974$
2. Changes for the Year:a. Service Cost 122,316 0 122,316b. Interest 402,714 0 402,714c. Differences b/t expected and actual experience 150,796 0 150,796d. Contributions - employer 0 332,553 (332,553)e. Contributions - employee 0 15,859 (15,859)f. Net Investment Income 0 161,193 (161,193)g. Benefit payments (402,427) (402,427) 0h. Payment of Interest on TDA Fixed Funds 0 (124,899) 124,899i. Administrative expenses 0 (5,839) 5,839j. Other changes 0 34 (34)k. Net Changes 273,399$ (23,526)$ 296,925$
3. SubTotal 7,750,165$ 5,315,266$ 2,434,899$
4. Changes in Proportionate Share (1,246,129)$ (889,800)$ (356,329)$
5. Balances at June 30, 2015 0.010% $6,504,036 $4,425,466 $2,078,570
NEW YORK CITY TEACHERS' RETIREMENT SYSTEM (TRS)
Governmental Accounting Standards Board Statements No. 67 and No. 68 (GASB 67/68)
Changes in Net Pension Liability (NPL) by Source
Balances at June 30, 2015
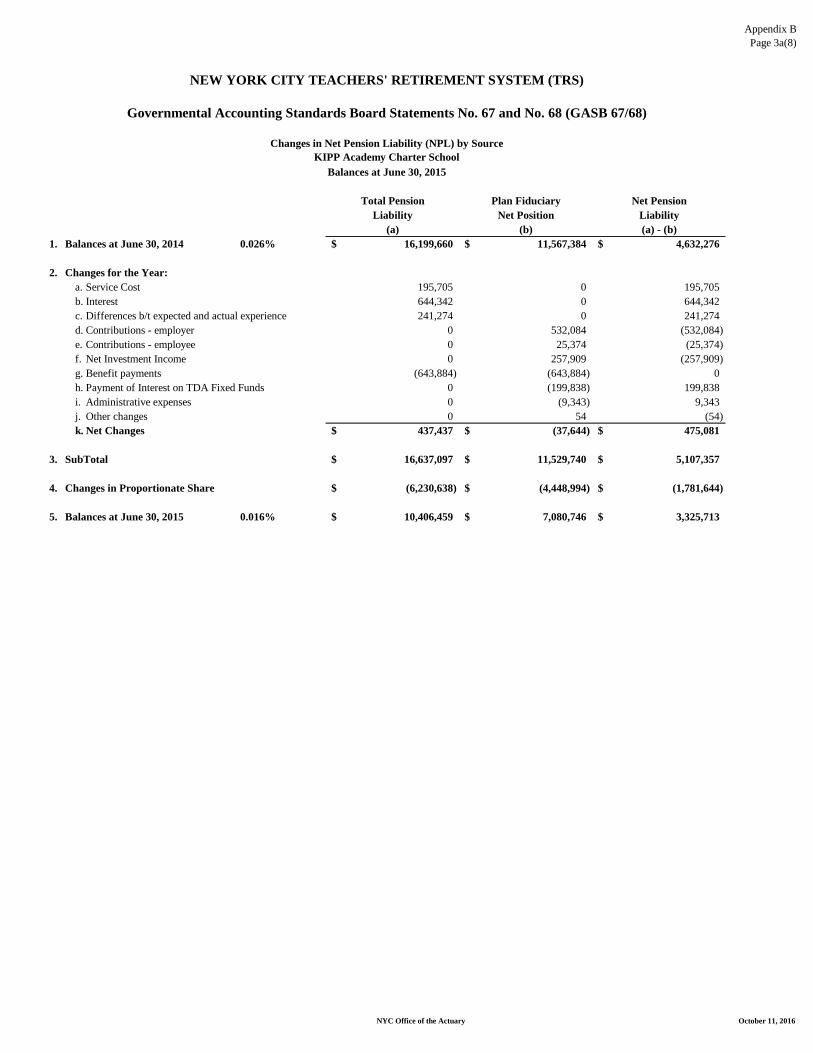
Appendix BPage 3a(8)
NYC Office of the Actuary October 11, 2016
KIPP Academy Charter School
Total Pension Plan Fiduciary Net PensionLiability Net Position Liability
(a) (b) (a) - (b)1. Balances at June 30, 2014 0.026% 16,199,660$ 11,567,384$ 4,632,276$
2. Changes for the Year:a. Service Cost 195,705 0 195,705b. Interest 644,342 0 644,342c. Differences b/t expected and actual experience 241,274 0 241,274d. Contributions - employer 0 532,084 (532,084)e. Contributions - employee 0 25,374 (25,374)f. Net Investment Income 0 257,909 (257,909)g. Benefit payments (643,884) (643,884) 0h. Payment of Interest on TDA Fixed Funds 0 (199,838) 199,838i. Administrative expenses 0 (9,343) 9,343j. Other changes 0 54 (54)k. Net Changes 437,437$ (37,644)$ 475,081$
3. SubTotal 16,637,097$ 11,529,740$ 5,107,357$
4. Changes in Proportionate Share (6,230,638)$ (4,448,994)$ (1,781,644)$
5. Balances at June 30, 2015 0.016% 10,406,459$ 7,080,746$ 3,325,713$
NEW YORK CITY TEACHERS' RETIREMENT SYSTEM (TRS)
Governmental Accounting Standards Board Statements No. 67 and No. 68 (GASB 67/68)
Changes in Net Pension Liability (NPL) by Source
Balances at June 30, 2015

Appendix BPage 3a(9)
NYC Office of the Actuary October 11, 2016
KIPP AMP Charter School
Total Pension Plan Fiduciary Net PensionLiability Net Position Liability
(a) (b) (a) - (b)1. Balances at June 30, 2014 0.004% 2,492,255$ 1,779,596$ 712,659$
2. Changes for the Year:a. Service Cost 12,232 0 12,232b. Interest 40,271 0 40,271c. Differences b/t expected and actual experience 15,080 0 15,080d. Contributions - employer 0 33,255 (33,255)e. Contributions - employee 0 1,586 (1,586)f. Net Investment Income 0 16,119 (16,119)g. Benefit payments (40,243) (40,243) 0h. Payment of Interest on TDA Fixed Funds 0 (12,490) 12,490i. Administrative expenses 0 (584) 584j. Other changes 0 5 (5)k. Net Changes 27,340$ (2,352)$ 29,692$
3. SubTotal 2,519,595$ 1,777,244$ 742,351$
4. Changes in Proportionate Share (1,869,191)$ (1,334,697)$ (534,494)$
5. Balances at June 30, 2015 0.001% 650,404$ 442,547$ 207,857$
Changes in Net Pension Liability (NPL) by Source
Balances at June 30, 2015
Governmental Accounting Standards Board Statements No. 67 and No. 68 (GASB 67/68)
NEW YORK CITY TEACHERS' RETIREMENT SYSTEM (TRS)

Appendix BPage 3a(10)
NYC Office of the Actuary October 11, 2016
KIPP Infinity Charter School
Total Pension Plan Fiduciary Net PensionLiability Net Position Liability
(a) (b) (a) - (b)1. Balances at June 30, 2014 0.028% 17,445,787$ 12,457,183$ 4,988,604$
2. Changes for the Year:a. Service Cost 220,168 0 220,168b. Interest 724,885 0 724,885c. Differences b/t expected and actual experience 271,434 0 271,434d. Contributions - employer 0 598,595 (598,595)e. Contributions - employee 0 28,546 (28,546)f. Net Investment Income 0 290,147 (290,147)g. Benefit payments (724,369) (724,369) 0h. Payment of Interest on TDA Fixed Funds 0 (224,818) 224,818i. Administrative expenses 0 (10,510) 10,510j. Other changes 0 60 (60)k. Net Changes 492,118$ (42,349)$ 534,467$
3. SubTotal 17,937,905$ 12,414,834$ 5,523,071$
4. Changes in Proportionate Share (6,230,638)$ (4,448,994)$ (1,781,644)$
5. Balances at June 30, 2015 0.018% 11,707,267$ 7,965,840$ 3,741,427$
NEW YORK CITY TEACHERS' RETIREMENT SYSTEM (TRS)
Governmental Accounting Standards Board Statements No. 67 and No. 68 (GASB 67/68)
Changes in Net Pension Liability (NPL) by Source
Balances at June 30, 2015
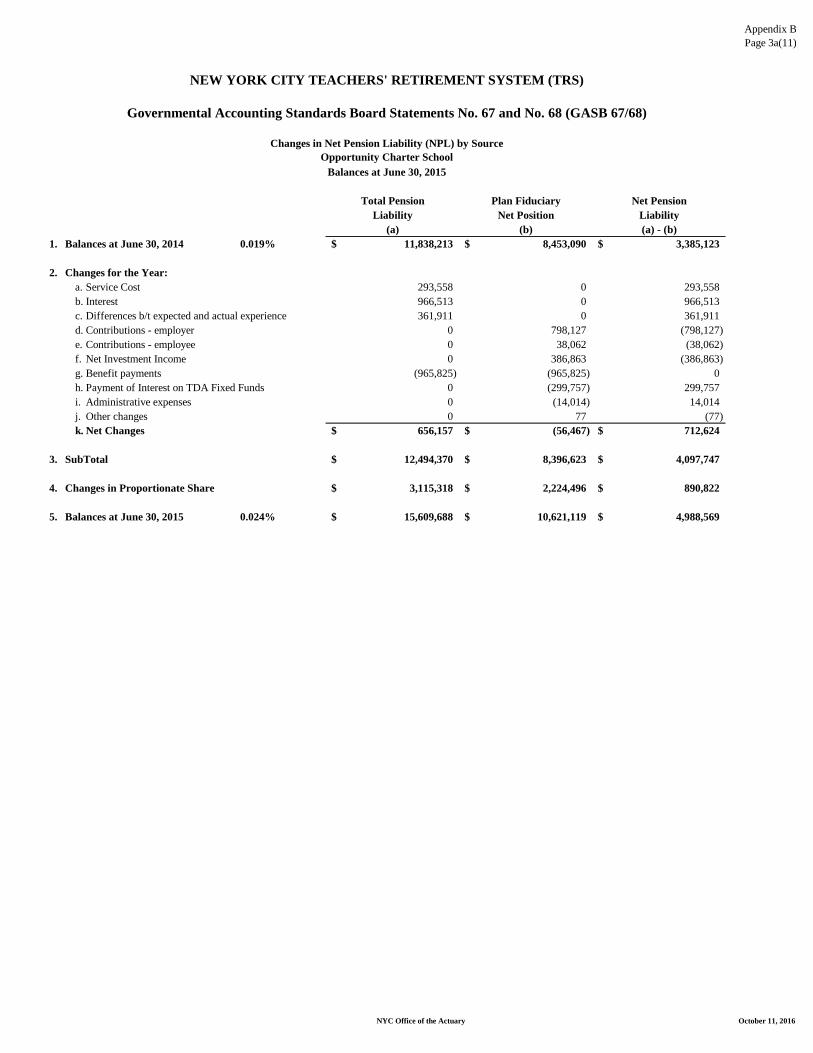
Appendix BPage 3a(11)
NYC Office of the Actuary October 11, 2016
Opportunity Charter School
Total Pension Plan Fiduciary Net PensionLiability Net Position Liability
(a) (b) (a) - (b)1. Balances at June 30, 2014 0.019% 11,838,213$ 8,453,090$ 3,385,123$
2. Changes for the Year:a. Service Cost 293,558 0 293,558b. Interest 966,513 0 966,513c. Differences b/t expected and actual experience 361,911 0 361,911d. Contributions - employer 0 798,127 (798,127)e. Contributions - employee 0 38,062 (38,062)f. Net Investment Income 0 386,863 (386,863)g. Benefit payments (965,825) (965,825) 0h. Payment of Interest on TDA Fixed Funds 0 (299,757) 299,757i. Administrative expenses 0 (14,014) 14,014j. Other changes 0 77 (77)k. Net Changes 656,157$ (56,467)$ 712,624$
3. SubTotal 12,494,370$ 8,396,623$ 4,097,747$
4. Changes in Proportionate Share 3,115,318$ 2,224,496$ 890,822$
5. Balances at June 30, 2015 0.024% 15,609,688$ 10,621,119$ 4,988,569$
NEW YORK CITY TEACHERS' RETIREMENT SYSTEM (TRS)
Governmental Accounting Standards Board Statements No. 67 and No. 68 (GASB 67/68)
Changes in Net Pension Liability (NPL) by Source
Balances at June 30, 2015

Appendix BPage 3a(12)
NYC Office of the Actuary October 11, 2016
Renaissance Charter School
Total Pension Plan Fiduciary Net PensionLiability Net Position Liability
(a) (b) (a) - (b)1. Balances at June 30, 2014 0.025% 15,576,596$ 11,122,484$ 4,454,112$
2. Changes for the Year:a. Service Cost 281,326 0 281,326b. Interest 926,242 0 926,242c. Differences b/t expected and actual experience 346,832 0 346,832d. Contributions - employer 0 764,871 (764,871)e. Contributions - employee 0 36,476 (36,476)f. Net Investment Income 0 370,744 (370,744)g. Benefit payments (925,583) (925,583) 0h. Payment of Interest on TDA Fixed Funds 0 (287,267) 287,267i. Administrative expenses 0 (13,430) 13,430j. Other changes 0 77 (77)k. Net Changes 628,817$ (54,112)$ 682,929$
3. SubTotal 16,205,413$ 11,068,372$ 5,137,041$
4. Changes in Proportionate Share (1,246,128)$ (889,799)$ (356,329)$
5. Balances at June 30, 2015 0.023% 14,959,285$ 10,178,573$ 4,780,712$
Changes in Net Pension Liability (NPL) by Source
Balances at June 30, 2015
Governmental Accounting Standards Board Statements No. 67 and No. 68 (GASB 67/68)
NEW YORK CITY TEACHERS' RETIREMENT SYSTEM (TRS)

Appendix BPage 3a(13)
NYC Office of the Actuary October 11, 2016
Total Pension Plan Fiduciary Net PensionLiability Net Position Liability
(a) (b) (a) - (b)1. Balances at June 30, 2014 0.042% 26,168,679$ 18,685,775$ 7,482,904$
2. Changes for the Year:a. Service Cost 415,874 0 415,874b. Interest 1,369,227 0 1,369,227c. Differences b/t expected and actual experience 512,708 0 512,708d. Contributions - employer 0 1,130,680 (1,130,680)e. Contributions - employee 0 53,921 (53,921)f. Net Investment Income 0 548,056 (548,056)g. Benefit payments (1,368,252) (1,368,252) 0h. Payment of Interest on TDA Fixed Funds 0 (424,656) 424,656i. Administrative expenses 0 (19,853) 19,853j. Other changes 0 111 (111)k. Net Changes 929,557$ (79,993)$ 1,009,550$
3. SubTotal 27,098,236$ 18,605,782$ 8,492,454$
4. Changes in Proportionate Share (4,984,511)$ (3,559,196)$ (1,425,315)$
5. Balances at June 30, 2015 0.034% 22,113,725$ 15,046,586$ 7,067,139$
NEW YORK CITY TEACHERS' RETIREMENT SYSTEM (TRS)
Governmental Accounting Standards Board Statements No. 67 and No. 68 (GASB 67/68)
Changes in Net Pension Liability (NPL) by SourceUFT Charter School
Balances at June 30, 2015

Appendix BPage 3a(14)
NYC Office of the Actuary October 11, 2016
Total Pension Plan Fiduciary Net PensionLiability Net Position Liability
(a) (b) (a) - (b)1. Balances at June 30, 2014 0.018% 11,215,147$ 8,008,188$ 3,206,959$
2. Changes for the Year:a. Service Cost 195,705 0 195,705b. Interest 644,342 0 644,342c. Differences b/t expected and actual experience 241,274 0 241,274d. Contributions - employer 0 532,084 (532,084)e. Contributions - employee 0 25,374 (25,374)f. Net Investment Income 0 257,909 (257,909)g. Benefit payments (643,884) (643,884) 0h. Payment of Interest on TDA Fixed Funds 0 (199,838) 199,838i. Administrative expenses 0 (9,343) 9,343j. Other changes 0 52 (52)k. Net Changes 437,437$ (37,646)$ 475,083$
3. SubTotal 11,652,584$ 7,970,542$ 3,682,042$
4. Changes in Proportionate Share (1,246,125)$ (889,796)$ (356,329)$
5. Balances at June 30, 2015 0.016% 10,406,459$ 7,080,746$ 3,325,713$
Balances at June 30, 2015
NEW YORK CITY TEACHERS' RETIREMENT SYSTEM (TRS)
Governmental Accounting Standards Board Statements No. 67 and No. 68 (GASB 67/68)
Changes in Net Pension Liability (NPL) by SourceUniversity Prep Charter High School

Appendix BPage 3a(15)
NYC Office of the Actuary October 11, 2016
Voice Charter School
Total Pension Plan Fiduciary Net PensionLiability Net Position Liability
(a) (b) (a) - (b)1. Balances at June 30, 2014 0.009% 5,607,574$ 4,004,095$ 1,603,479$
2. Changes for the Year:a. Service Cost 110,084 0 110,084b. Interest 362,442 0 362,442c. Differences b/t expected and actual experience 135,717 0 135,717d. Contributions - employer 0 299,298 (299,298)e. Contributions - employee 0 14,273 (14,273)f. Net Investment Income 0 145,074 (145,074)g. Benefit payments (362,184) (362,184) 0h. Payment of Interest on TDA Fixed Funds 0 (112,409) 112,409i. Administrative expenses 0 (5,255) 5,255j. Other changes 0 28 (28)k. Net Changes 246,059$ (21,175)$ 267,234$
3. SubTotal 5,853,633$ 3,982,920$ 1,870,713$
4. Changes in Proportionate Share 0$ 0$ 0$
5. Balances at June 30, 2015 0.009% 5,853,633$ 3,982,920$ 1,870,713$
NEW YORK CITY TEACHERS' RETIREMENT SYSTEM (TRS)
Governmental Accounting Standards Board Statements No. 67 and No. 68 (GASB 67/68)
Changes in Net Pension Liability (NPL) by Source
Balances at June 30, 2015

Appendix BPage 3a(16)
NYC Office of the Actuary October 11, 2016
Wildcat Charter School
Total Pension Plan Fiduciary Net PensionLiability Net Position Liability
(a) (b) (a) - (b)1. Balances at June 30, 2014 0.013% 8,099,829$ 5,783,694$ 2,316,135$
2. Changes for the Year:a. Service Cost 146,779 0 146,779b. Interest 483,257 0 483,257c. Differences b/t expected and actual experience 180,956 0 180,956d. Contributions - employer 0 399,063 (399,063)e. Contributions - employee 0 19,031 (19,031)f. Net Investment Income 0 193,431 (193,431)g. Benefit payments (482,913) (482,913) 0h. Payment of Interest on TDA Fixed Funds 0 (149,879) 149,879i. Administrative expenses 0 (7,007) 7,007j. Other changes 0 40 (40)k. Net Changes 328,079$ (28,234)$ 356,313$
3. SubTotal 8,427,908$ 5,755,460$ 2,672,448$
4. Changes in Proportionate Share (623,064)$ (444,900)$ (178,164)$
5. Balances at June 30, 2015 0.012% 7,804,844$ 5,310,560$ 2,494,284$
Changes in Net Pension Liability (NPL) by Source
Balances at June 30, 2015
NEW YORK CITY TEACHERS' RETIREMENT SYSTEM (TRS)
Governmental Accounting Standards Board Statements No. 67 and No. 68 (GASB 67/68)

Appendix BPage 3b(1)
NYC Office of the Actuary October 11, 2016
Total Pension Plan Fiduciary Net PensionLiability Net Position Liability
(a) (b) (a) - (b)1. Balances at June 30, 2015 65,040,367,677$ 44,254,664,000$ 20,785,703,677$
2. Changes for the Year:a. Service Cost 1,274,307,859 0 1,274,307,859b. Interest 4,131,176,953 0 4,131,176,953c. Differences b/t expected and actual experience 1,229,501,602 0 1,229,501,602d. Change of Assumptions 2,432,878,017 0 2,432,878,017e. Contributions - employer 0 3,760,714,000 (3,760,714,000)f. Contributions - employee 0 173,696,000 (173,696,000)g. Net Investment Income 0 960,267,000 (960,267,000)h. Benefit payments (4,107,455,000) (4,107,455,000) 0i. Payment of Interest on TDA Fixed Funds 0 (1,354,207,000) 1,354,207,000j. Administrative expenses 0 (59,367,000) 59,367,000k. Other changes 0 1,233,000 (1,233,000)l. Net Changes 4,960,409,431$ (625,119,000)$ 5,585,528,431$
3. Balances at June 30, 2016 70,000,777,108$ 43,629,545,000$ 26,371,232,108$
NEW YORK CITY TEACHERS' RETIREMENT SYSTEM (TRS)
Changes in Net Pension Liability (NPL) by SourceBalances at June 30, 2016
Governmental Accounting Standards Board Statements No. 67 and No. 68 (GASB 67/68)

Appendix BPage 3b(2)
NYC Office of the Actuary October 11, 2016
Total Pension Plan Fiduciary Net PensionLiability Net Position Liability
(a) (b) (a) - (b)1. Balances at June 30, 2015 96.346% 62,663,792,641$ 42,637,598,576$ 20,026,194,065$
2. Changes for the Year:a. Service Cost 1,223,577,662 0 1,223,577,662b. Interest 3,966,714,798 0 3,966,714,798c. Differences b/t expected and actual experience 1,180,555,145 0 1,180,555,145d. Change of Assumptions 2,336,025,145 0 2,336,025,145e. Contributions - employer 0 3,610,999,976 (3,610,999,976)f. Contributions - employee 0 166,781,161 (166,781,161)g. Net Investment Income 0 922,038,770 (922,038,770)h. Benefit payments (3,943,937,215) (3,943,937,215) 0i. Payment of Interest on TDA Fixed Funds 0 (1,300,296,019) 1,300,296,019j. Administrative expenses 0 (57,003,599) 57,003,599k. Other changes 0 1,183,915 (1,183,915)l. Net Changes 4,762,935,535$ (600,233,011)$ 5,363,168,546$
3. SubTotal 67,426,728,176$ 42,037,365,565$ 25,389,362,611$
4. Changes in Proportionate Share (212,682,009)$ (144,712,752)$ (67,969,257)$
5. Balances at June 30, 2016 96.019% 67,214,046,167$ 41,892,652,813$ 25,321,393,354$
NEW YORK CITY TEACHERS' RETIREMENT SYSTEM (TRS)
Changes in Net Pension Liability (NPL) by Source
Balances at June 30, 2016Department of Education
Governmental Accounting Standards Board Statements No. 67 and No. 68 (GASB 67/68)

Appendix BPage 3b(3)
NYC Office of the Actuary October 11, 2016
Total Pension Plan Fiduciary Net PensionLiability Net Position Liability
(a) (b) (a) - (b)1. Balances at June 30, 2015 2.540% 1,652,025,339$ 1,124,068,466$ 527,956,873$
2. Changes for the Year:a. Service Cost 35,413,015 0 35,413,015b. Interest 114,805,408 0 114,805,408c. Differences b/t expected and actual experience 34,167,850 0 34,167,850d. Change of Assumptions 67,609,680 0 67,609,680e. Contributions - employer 0 104,510,242 (104,510,242)f. Contributions - employee 0 4,827,012 (4,827,012)g. Net Investment Income 0 26,685,820 (26,685,820)h. Benefit payments (114,146,174) (114,146,174) 0i. Payment of Interest on TDA Fixed Funds 0 (37,633,413) 37,633,413j. Administrative expenses 0 (1,649,809) 1,649,809k. Other changes 0 34,265 (34,265)l. Net Changes 137,849,779$ (17,372,057)$ 155,221,836$
3. SubTotal 1,789,875,118$ 1,106,696,409$ 683,178,709$
4. Changes in Proportionate Share 155,446,478$ 105,768,647$ 49,677,831$
5. Balances at June 30, 2016 2.779% 1,945,321,596$ 1,212,465,056$ 732,856,540$
Governmental Accounting Standards Board Statements No. 67 and No. 68 (GASB 67/68)
CUNY Senior Colleges
NEW YORK CITY TEACHERS' RETIREMENT SYSTEM (TRS)
Changes in Net Pension Liability (NPL) by Source
Balances at June 30, 2016

Appendix BPage 3b(4)
NYC Office of the Actuary October 11, 2016
Total Pension Plan Fiduciary Net PensionLiability Net Position Liability
(a) (b) (a) - (b)1. Balances at June 30, 2015 0.928% 603,574,612$ 410,683,282$ 192,891,330$
2. Changes for the Year:a. Service Cost 13,456,691 0 13,456,691b. Interest 43,625,229 0 43,625,229c. Differences b/t expected and actual experience 12,983,537 0 12,983,537d. Change of Assumptions 25,691,192 0 25,691,192e. Contributions - employer 0 39,713,140 (39,713,140)f. Contributions - employee 0 1,834,230 (1,834,230)g. Net Investment Income 0 10,140,420 (10,140,420)h. Benefit payments (43,374,725) (43,374,725) 0i. Payment of Interest on TDA Fixed Funds 0 (14,300,426) 14,300,426j. Administrative expenses 0 (626,916) 626,916k. Other changes 0 13,020 (13,020)l. Net Changes 52,381,924$ (6,601,257)$ 58,983,181$
3. SubTotal 655,956,536$ 404,082,025$ 251,874,511$
4. Changes in Proportionate Share 83,251,670$ 56,645,970$ 26,605,700$
5. Balances at June 30, 2016 1.056% 739,208,206$ 460,727,995$ 278,480,211$
Governmental Accounting Standards Board Statements No. 67 and No. 68 (GASB 67/68)
CUNY Community Colleges
NEW YORK CITY TEACHERS' RETIREMENT SYSTEM (TRS)
Changes in Net Pension Liability (NPL) by Source
Balances at June 30, 2016

Appendix BPage 3b(5)
NYC Office of the Actuary October 11, 2016
Total Pension Plan Fiduciary Net PensionLiability Net Position Liability
(a) (b) (a) - (b)1. Balances at June 30, 2015 0.017% 11,056,863$ 7,523,293$ 3,533,570$
.2. Changes for the Year:
a. Service Cost 101,945 0 101,945b. Interest 330,494 0 330,494c. Differences b/t expected and actual experience 98,360 0 98,360d. Change of Assumptions 194,630 0 194,630e. Contributions - employer 0 300,857 (300,857)f. Contributions - employee 0 13,896 (13,896)g. Net Investment Income 0 76,821 (76,821)h. Benefit payments (328,596) (328,596) 0i. Payment of Interest on TDA Fixed Funds 0 (108,337) 108,337j. Administrative expenses 0 (4,749) 4,749k. Other changes 0 99 (99)l. Net Changes 396,833$ (50,009)$ 446,842$
3. SubTotal 11,453,696$ 7,473,284$ 3,980,412$
4. Changes in Proportionate Share (5,853,633)$ (3,982,920)$ (1,870,713)$
5. Balances at June 30, 2016 0.008% 5,600,063$ 3,490,364$ 2,109,699$
Governmental Accounting Standards Board Statements No. 67 and No. 68 (GASB 67/68)
Beginning with Children Charter School
NEW YORK CITY TEACHERS' RETIREMENT SYSTEM (TRS)
Changes in Net Pension Liability (NPL) by Source
Balances at June 30, 2016

Appendix BPage 3b(6)
NYC Office of the Actuary October 11, 2016
Total Pension Plan Fiduciary Net PensionLiability Net Position Liability
(a) (b) (a) - (b)1. Balances at June 30, 2015 0.006% 3,902,422$ 2,655,280$ 1,247,142$
2. Changes for the Year:a. Service Cost 89,202 0 89,202b. Interest 289,182 0 289,182c. Differences b/t expected and actual experience 86,065 0 86,065d. Change of Assumptions 170,301 0 170,301e. Contributions - employer 0 263,250 (263,250)f. Contributions - employee 0 12,159 (12,159)g. Net Investment Income 0 67,219 (67,219)h. Benefit payments (287,522) (287,522) 0i. Payment of Interest on TDA Fixed Funds 0 (94,794) 94,794j. Administrative expenses 0 (4,156) 4,156k. Other changes 0 86 (86)l. Net Changes 347,228$ (43,758)$ 390,986$
3. SubTotal 4,249,650$ 2,611,522$ 1,638,128$
4. Changes in Proportionate Share 650,404$ 442,546$ 207,858$
5. Balances at June 30, 2016 0.007% 4,900,054$ 3,054,068$ 1,845,986$
Governmental Accounting Standards Board Statements No. 67 and No. 68 (GASB 67/68)
NEW YORK CITY TEACHERS' RETIREMENT SYSTEM (TRS)
Changes in Net Pension Liability (NPL) by Source
Balances at June 30, 2016Future Leaders Charter School

Appendix BPage 3b(7)
NYC Office of the Actuary October 11, 2016
Total Pension Plan Fiduciary Net PensionLiability Net Position Liability
(a) (b) (a) - (b)1. Balances at June 30, 2015 0.010% 6,504,036$ 4,425,466$ 2,078,570$
2. Changes for the Year:a. Service Cost 127,431 0 127,431b. Interest 413,118 0 413,118c. Differences b/t expected and actual experience 122,950 0 122,950d. Change of Assumptions 243,288 0 243,288e. Contributions - employer 0 376,071 (376,071)f. Contributions - employee 0 17,370 (17,370)g. Net Investment Income 0 96,027 (96,027)h. Benefit payments (410,746) (410,746) 0i. Payment of Interest on TDA Fixed Funds 0 (135,421) 135,421j. Administrative expenses 0 (5,937) 5,937k. Other changes 0 123 (123)l. Net Changes 496,041$ (62,513)$ 558,554$
3. SubTotal 7,000,077$ 4,362,953$ 2,637,124$
4. Changes in Proportionate Share -$ -$ -$
5. Balances at June 30, 2016 0.010% $7,000,077 $4,362,953 $2,637,124
Governmental Accounting Standards Board Statements No. 67 and No. 68 (GASB 67/68)
Harriet Tubman Charter SchoolChanges in Net Pension Liability (NPL) by Source
Balances at June 30, 2016
NEW YORK CITY TEACHERS' RETIREMENT SYSTEM (TRS)

Appendix BPage 3b(8)
NYC Office of the Actuary October 11, 2016
Total Pension Plan Fiduciary Net PensionLiability Net Position Liability
(a) (b) (a) - (b)1. Balances at June 30, 2015 0.016% 10,406,459$ 7,080,746$ 3,325,713$
2. Changes for the Year:a. Service Cost 229,375 0 229,375b. Interest 743,612 0 743,612c. Differences b/t expected and actual experience 221,310 0 221,310d. Change of Assumptions 437,918 0 437,918e. Contributions - employer 0 676,929 (676,929)f. Contributions - employee 0 31,265 (31,265)g. Net Investment Income 0 172,848 (172,848)h. Benefit payments (739,342) (739,342) 0i. Payment of Interest on TDA Fixed Funds 0 (243,757) 243,757j. Administrative expenses 0 (10,686) 10,686k. Other changes 0 222 (222)l. Net Changes 892,873$ (112,521)$ 1,005,394$
3. SubTotal 11,299,332$ 6,968,225$ 4,331,107$
4. Changes in Proportionate Share 1,300,808$ 885,093$ 415,715$
5. Balances at June 30, 2016 0.018% 12,600,140$ 7,853,318$ 4,746,822$
KIPP Academy Charter School
Governmental Accounting Standards Board Statements No. 67 and No. 68 (GASB 67/68)
NEW YORK CITY TEACHERS' RETIREMENT SYSTEM (TRS)
Changes in Net Pension Liability (NPL) by Source
Balances at June 30, 2016

Appendix BPage 3b(9)
NYC Office of the Actuary October 11, 2016
Total Pension Plan Fiduciary Net PensionLiability Net Position Liability
(a) (b) (a) - (b)1. Balances at June 30, 2015 0.001% 650,404$ 442,547$ 207,857$
2. Changes for the Year:a. Service Cost 12,743 0 12,743b. Interest 41,312 0 41,312c. Differences b/t expected and actual experience 12,295 0 12,295d. Change of Assumptions 24,329 0 24,329e. Contributions - employer 0 37,607 (37,607)f. Contributions - employee 0 1,737 (1,737)g. Net Investment Income 0 9,603 (9,603)h. Benefit payments (41,075) (41,075) 0i. Payment of Interest on TDA Fixed Funds 0 (13,542) 13,542j. Administrative expenses 0 (594) 594k. Other changes 0 12 (12)l. Net Changes 49,604$ (6,252)$ 55,856$
3. SubTotal 700,008$ 436,295$ 263,713$
4. Changes in Proportionate Share -$ -$ -$
5. Balances at June 30, 2016 0.001% 700,008$ 436,295$ 263,713$
KIPP AMP Charter School
Governmental Accounting Standards Board Statements No. 67 and No. 68 (GASB 67/68)
NEW YORK CITY TEACHERS' RETIREMENT SYSTEM (TRS)
Changes in Net Pension Liability (NPL) by Source
Balances at June 30, 2016

Appendix BPage 3b(10)
NYC Office of the Actuary October 11, 2016
Total Pension Plan Fiduciary Net PensionLiability Net Position Liability
(a) (b) (a) - (b)1. Balances at June 30, 2015 0.018% 11,707,267$ 7,965,840$ 3,741,427$
2. Changes for the Year:a. Service Cost 216,632 0 216,632b. Interest 702,300 0 702,300c. Differences b/t expected and actual experience 209,015 0 209,015d. Change of Assumptions 413,589 0 413,589e. Contributions - employer 0 639,321 (639,321)f. Contributions - employee 0 29,528 (29,528)g. Net Investment Income 0 163,245 (163,245)h. Benefit payments (698,267) (698,267) 0i. Payment of Interest on TDA Fixed Funds 0 (230,215) 230,215j. Administrative expenses 0 (10,092) 10,092k. Other changes 0 210 (210)l. Net Changes 843,269$ (106,270)$ 949,539$
3. SubTotal 12,550,536$ 7,859,570$ 4,690,966$
4. Changes in Proportionate Share (650,404)$ (442,547)$ (207,857)$
5. Balances at June 30, 2016 0.017% 11,900,132$ 7,417,023$ 4,483,109$
KIPP Infinity Charter School
Governmental Accounting Standards Board Statements No. 67 and No. 68 (GASB 67/68)
Balances at June 30, 2016
NEW YORK CITY TEACHERS' RETIREMENT SYSTEM (TRS)
Changes in Net Pension Liability (NPL) by Source

Appendix BPage 3b(11)
NYC Office of the Actuary October 11, 2016
Total Pension Plan Fiduciary Net PensionLiability Net Position Liability
(a) (b) (a) - (b)1. Balances at June 30, 2015 0.024% 15,609,688$ 10,621,119$ 4,988,569$
2. Changes for the Year:a. Service Cost 165,660 0 165,660b. Interest 537,053 0 537,053c. Differences b/t expected and actual experience 159,835 0 159,835d. Change of Assumptions 316,274 0 316,274e. Contributions - employer 0 488,893 (488,893)f. Contributions - employee 0 22,580 (22,580)g. Net Investment Income 0 124,835 (124,835)h. Benefit payments (533,969) (533,969) 0i. Payment of Interest on TDA Fixed Funds 0 (176,047) 176,047j. Administrative expenses 0 (7,718) 7,718k. Other changes 0 160 (160)l. Net Changes 644,853$ (81,266)$ 726,119$
3. SubTotal 16,254,541$ 10,539,853$ 5,714,688$
4. Changes in Proportionate Share (7,154,440)$ (4,868,012)$ (2,286,428)$
5. Balances at June 30, 2016 0.013% 9,100,101$ 5,671,841$ 3,428,260$
Opportunity Charter School
Governmental Accounting Standards Board Statements No. 67 and No. 68 (GASB 67/68)
Changes in Net Pension Liability (NPL) by Source
Balances at June 30, 2016
NEW YORK CITY TEACHERS' RETIREMENT SYSTEM (TRS)

Appendix BPage 3b(12)
NYC Office of the Actuary October 11, 2016
Total Pension Plan Fiduciary Net PensionLiability Net Position Liability
(a) (b) (a) - (b)1. Balances at June 30, 2015 0.023% 14,959,285$ 10,178,573$ 4,780,712$
2. Changes for the Year:a. Service Cost 267,605 0 267,605b. Interest 867,547 0 867,547c. Differences b/t expected and actual experience 258,195 0 258,195d. Change of Assumptions 510,904 0 510,904e. Contributions - employer 0 789,750 (789,750)f. Contributions - employee 0 36,476 (36,476)g. Net Investment Income 0 201,656 (201,656)h. Benefit payments (862,566) (862,566) 0i. Payment of Interest on TDA Fixed Funds 0 (284,383) 284,383j. Administrative expenses 0 (12,467) 12,467k. Other changes 0 259 (259)l. Net Changes 1,041,685$ (131,275)$ 1,172,960$
3. SubTotal 16,000,970$ 10,047,298$ 5,953,672$
4. Changes in Proportionate Share (1,300,805)$ (885,093)$ (415,712)$
5. Balances at June 30, 2016 0.021% 14,700,165$ 9,162,205$ 5,537,960$
Renaissance Charter School
NEW YORK CITY TEACHERS' RETIREMENT SYSTEM (TRS)
Changes in Net Pension Liability (NPL) by Source
Balances at June 30, 2016
Governmental Accounting Standards Board Statements No. 67 and No. 68 (GASB 67/68)

Appendix BPage 3b(13)
NYC Office of the Actuary October 11, 2016
Total Pension Plan Fiduciary Net PensionLiability Net Position Liability
(a) (b) (a) - (b)1. Balances at June 30, 2015 0.034% 22,113,725$ 15,046,586$ 7,067,139$
2. Changes for the Year:a. Service Cost 267,605 0 267,605b. Interest 867,547 0 867,547c. Differences b/t expected and actual experience 258,195 0 258,195d. Change of Assumptions 510,904 0 510,904e. Contributions - employer 0 789,750 (789,750)f. Contributions - employee 0 36,476 (36,476)g. Net Investment Income 0 201,656 (201,656)h. Benefit payments (862,566) (862,566) 0i. Payment of Interest on TDA Fixed Funds 0 (284,383) 284,383j. Administrative expenses 0 (12,467) 12,467k. Other changes 0 259 (259)l. Net Changes 1,041,685$ (131,275)$ 1,172,960$
3. SubTotal 23,155,410$ 14,915,311$ 8,240,099$
4. Changes in Proportionate Share (8,455,245)$ (5,753,106)$ (2,702,139)$
5. Balances at June 30, 2016 0.021% 14,700,165$ 9,162,205$ 5,537,960$
NEW YORK CITY TEACHERS' RETIREMENT SYSTEM (TRS)
UFT Charter SchoolChanges in Net Pension Liability (NPL) by Source
Balances at June 30, 2016
Governmental Accounting Standards Board Statements No. 67 and No. 68 (GASB 67/68)

Appendix BPage 3b(14)
NYC Office of the Actuary October 11, 2016
Total Pension Plan Fiduciary Net PensionLiability Net Position Liability
(a) (b) (a) - (b)1. Balances at June 30, 2015 0.016% 10,406,459$ 7,080,746$ 3,325,713$
2. Changes for the Year:a. Service Cost 152,917 0 152,917b. Interest 495,741 0 495,741c. Differences b/t expected and actual experience 147,540 0 147,540d. Change of Assumptions 291,945 0 291,945e. Contributions - employer 0 451,286 (451,286)f. Contributions - employee 0 20,844 (20,844)g. Net Investment Income 0 115,232 (115,232)h. Benefit payments (492,895) (492,895) 0i. Payment of Interest on TDA Fixed Funds 0 (162,505) 162,505j. Administrative expenses 0 (7,124) 7,124k. Other changes 0 148 (148)l. Net Changes 595,248$ (75,014)$ 670,262$
3. SubTotal 11,001,707$ 7,005,732$ 3,995,975$
4. Changes in Proportionate Share (2,601,614)$ (1,770,187)$ (831,427)$
5. Balances at June 30, 2016 0.012% 8,400,093$ 5,235,545$ 3,164,548$
Balances at June 30, 2016University Prep Charter High School
NEW YORK CITY TEACHERS' RETIREMENT SYSTEM (TRS)
Changes in Net Pension Liability (NPL) by Source
Governmental Accounting Standards Board Statements No. 67 and No. 68 (GASB 67/68)

Appendix BPage 3b(15)
NYC Office of the Actuary October 11, 2016
Total Pension Plan Fiduciary Net PensionLiability Net Position Liability
(a) (b) (a) - (b)1. Balances at June 30, 2015 0.009% 5,853,633$ 3,982,920$ 1,870,713$
2. Changes for the Year:a. Service Cost 101,945 0 101,945b. Interest 330,494 0 330,494c. Differences b/t expected and actual experience 98,360 0 98,360d. Change of Assumptions 194,630 0 194,630e. Contributions - employer 0 300,857 (300,857)f. Contributions - employee 0 13,896 (13,896)g. Net Investment Income 0 76,821 (76,821)h. Benefit payments (328,596) (328,596) 0i. Payment of Interest on TDA Fixed Funds 0 (108,337) 108,337j. Administrative expenses 0 (4,749) 4,749k. Other changes 0 99 (99)l. Net Changes 396,833$ (50,009)$ 446,842$
3. SubTotal 6,250,466$ 3,932,911$ 2,317,555$
4. Changes in Proportionate Share (650,403)$ (442,547)$ (207,856)$
5. Balances at June 30, 2016 0.008% 5,600,063$ 3,490,364$ 2,109,699$
NEW YORK CITY TEACHERS' RETIREMENT SYSTEM (TRS)
Changes in Net Pension Liability (NPL) by Source
Balances at June 30, 2016
Governmental Accounting Standards Board Statements No. 67 and No. 68 (GASB 67/68)
Voice Charter School

Appendix BPage 3b(16)
NYC Office of the Actuary October 11, 2016
Total Pension Plan Fiduciary Net PensionLiability Net Position Liability
(a) (b) (a) - (b)1. Balances at June 30, 2015 0.012% 7,804,844$ 5,310,560$ 2,494,284$
2. Changes for the Year:a. Service Cost 127,431 0 127,431b. Interest 413,118 0 413,118c. Differences b/t expected and actual experience 122,950 0 122,950d. Change of Assumptions 243,288 0 243,288e. Contributions - employer 0 376,071 (376,071)f. Contributions - employee 0 17,370 (17,370)g. Net Investment Income 0 96,027 (96,027)h. Benefit payments (410,746) (410,746) 0i. Payment of Interest on TDA Fixed Funds 0 (135,421) 135,421j. Administrative expenses 0 (5,937) 5,937k. Other changes 0 123 (123)l. Net Changes 496,041$ (62,513)$ 558,554$
3. SubTotal 8,300,885$ 5,248,047$ 3,052,838$
4. Changes in Proportionate Share (1,300,807)$ (885,092)$ (415,715)$
5. Balances at June 30, 2016 0.010% 7,000,078$ 4,362,955$ 2,637,123$
Governmental Accounting Standards Board Statements No. 67 and No. 68 (GASB 67/68)
NEW YORK CITY TEACHERS' RETIREMENT SYSTEM (TRS)
Changes in Net Pension Liability (NPL) by Source
Balances at June 30, 2016Wildcat Charter School

Appendix BPage 3c
NYC Office of the Actuary October 11, 2016
DEPT. OF ED. SENIOR COLL. COMM. COLL. BWC FUT. LEAD. H. TUBMAN KIPP ACAD. KIPP AMP KIPP INF. OPPOR. REN. UFT UNIV PREP VOICE WILDCAT TOTAL1. Balances at June 30, 2014 60,034,688,526$ 1,558,905,606$ 573,841,752$ 11,215,147$ 5,607,574$ 7,476,766$ 16,199,660$ 2,492,255$ 17,445,787$ 11,838,213$ 15,576,596$ 26,168,679$ 11,215,147$ 5,607,574$ 8,099,829$ 62,306,379,111$
2. Changes for the Year:a. Service Cost 1,178,463,689 31,068,210 11,350,905 207,937 73,389 122,316 195,705 12,232 220,168 293,558 281,326 415,874 195,705 110,084 146,779 1,223,157,877b. Interest 3,879,986,703 102,289,314 37,371,844 684,614 241,628 402,714 644,342 40,271 724,885 966,513 926,242 1,369,227 644,342 362,442 483,257 4,027,138,338c. Differences b/t expected and actual experience 1,452,863,333 38,302,295 13,993,909 256,354 90,478 150,796 241,274 15,080 271,434 361,911 346,832 512,708 241,274 135,717 180,956 1,507,964,351d. Benefit payments (3,877,225,101) (102,216,509) (37,345,244) (684,126) (241,456) (402,427) (643,884) (40,243) (724,369) (965,825) (925,583) (1,368,252) (643,884) (362,184) (482,913) (4,024,272,000)e. Net Changes 2,634,088,624$ 69,443,310$ 25,371,414$ 464,779$ 164,039$ 273,399$ 437,437$ 27,340$ 492,118$ 656,157$ 628,817$ 929,557$ 437,437$ 246,059$ 328,079$ 2,733,988,566$
3. SubTotal 62,668,777,150$ 1,628,348,916$ 599,213,166$ 11,679,926$ 5,771,613$ 7,750,165$ 16,637,097$ 2,519,595$ 17,937,905$ 12,494,370$ 16,205,413$ 27,098,236$ 11,652,584$ 5,853,633$ 8,427,908$ 65,040,367,677$
4. Changes in Proportionate Share (4,984,509)$ 23,676,423$ 4,361,446$ (623,063)$ (1,869,191)$ (1,246,129)$ (6,230,638)$ (1,869,191)$ (6,230,638)$ 3,115,318$ (1,246,128)$ (4,984,511)$ (1,246,125)$ 0$ (623,064)$ 0$
5. Balances at June 30, 2015 62,663,792,641$ 1,652,025,339$ 603,574,612$ 11,056,863$ 3,902,422$ 6,504,036$ 10,406,459$ 650,404$ 11,707,267$ 15,609,688$ 14,959,285$ 22,113,725$ 10,406,459$ 5,853,633$ 7,804,844$ 65,040,367,677$
DEPT. OF ED. SENIOR COLL. COMM. COLL. BWC FUT. LEAD. H. TUBMAN KIPP ACAD. KIPP AMP KIPP INF. OPPOR. REN. UFT UNIV PREP VOICE WILDCAT TOTAL1. Balances at June 30, 2014 42,867,835,825$ 1,113,138,272$ 409,752,339$ 8,008,188$ 4,004,095$ 5,338,792$ 11,567,384$ 1,779,596$ 12,457,183$ 8,453,090$ 11,122,484$ 18,685,775$ 8,008,188$ 4,004,095$ 5,783,694$ 44,489,939,000$
2. Changes for the Year:a. Contributions - Employer 3,204,013,207 84,468,411 30,860,900 565,340 199,532 332,553 532,084 33,255 598,595 798,127 764,871 1,130,680 532,084 299,298 399,063 3,325,528,000b. Contributions - Employee 152,795,122 4,028,186 1,471,715 26,960 9,515 15,859 25,374 1,586 28,546 38,062 36,476 53,921 25,374 14,273 19,031 158,590,000c. Net Investment Income 1,553,029,113 40,942,997 14,958,701 274,028 96,716 161,193 257,909 16,119 290,147 386,863 370,744 548,056 257,909 145,074 193,431 1,611,929,000d. Benefit Payments (3,877,225,101) (102,216,509) (37,345,244) (684,126) (241,456) (402,427) (643,884) (40,243) (724,369) (965,825) (925,583) (1,368,252) (643,884) (362,184) (482,913) (4,024,272,000)e. Payment of Interest on TDA Fixed Funds (1,203,349,978) (31,724,295) (11,590,609) (212,328) (74,939) (124,899) (199,838) (12,490) (224,818) (299,757) (287,267) (424,656) (199,838) (112,409) (149,879) (1,248,988,000)f. Administrative Expenses (56,257,394) (1,483,131) (541,868) (9,926) (3,503) (5,839) (9,343) (584) (10,510) (14,014) (13,430) (19,853) (9,343) (5,255) (7,007) (58,391,000)g. Other Changes 316,977 8,359 3,053 56 17 34 54 5 60 77 77 111 52 28 40 329,000h. Net Changes (226,678,054)$ (5,975,982)$ (2,183,352)$ (39,996)$ (14,118)$ (23,526)$ (37,644)$ (2,352)$ (42,349)$ (56,467)$ (54,112)$ (79,993)$ (37,646)$ (21,175)$ (28,234)$ (235,275,000)$
3. SubTotal 42,641,157,771$ 1,107,162,290$ 407,568,987$ 7,968,192$ 3,989,977$ 5,315,266$ 11,529,740$ 1,777,244$ 12,414,834$ 8,396,623$ 11,068,372$ 18,605,782$ 7,970,542$ 3,982,920$ 5,755,460$ 44,254,664,000$
4. Changes in Proportionate Share (3,559,195)$ 16,906,176$ 3,114,295$ (444,899)$ (1,334,697)$ (889,800)$ (4,448,994)$ (1,334,697)$ (4,448,994)$ 2,224,496$ (889,799)$ (3,559,196)$ (889,796)$ 0$ (444,900)$ 0$
5. Balances at June 30, 2015 42,637,598,576$ 1,124,068,466$ 410,683,282$ 7,523,293$ 2,655,280$ 4,425,466$ 7,080,746$ 442,547$ 7,965,840$ 10,621,119$ 10,178,573$ 15,046,586$ 7,080,746$ 3,982,920$ 5,310,560$ 44,254,664,000$
DEPT. OF ED. SENIOR COLL. COMM. COLL. BWC FUT. LEAD. H. TUBMAN KIPP ACAD. KIPP AMP KIPP INF. OPPOR. REN. UFT UNIV PREP VOICE WILDCAT TOTAL1. Balances at June 30, 2014 17,166,852,701$ 445,767,334$ 164,089,413$ 3,206,959$ 1,603,479$ 2,137,974$ 4,632,276$ 712,659$ 4,988,604$ 3,385,123$ 4,454,112$ 7,482,904$ 3,206,959$ 1,603,479$ 2,316,135$ 17,816,440,111$
2. Changes for the Year:a. Service Cost 1,178,463,689 31,068,210 11,350,905 207,937 73,389 122,316 195,705 12,232 220,168 293,558 281,326 415,874 195,705 110,084 146,779 1,223,157,877b. Interest 3,879,986,703 102,289,314 37,371,844 684,614 241,628 402,714 644,342 40,271 724,885 966,513 926,242 1,369,227 644,342 362,442 483,257 4,027,138,338c. Differences b/t Expected and Actual Experience 1,452,863,333 38,302,295 13,993,909 256,354 90,478 150,796 241,274 15,080 271,434 361,911 346,832 512,708 241,274 135,717 180,956 1,507,964,351d. Contributions - Employer (3,204,013,207) (84,468,411) (30,860,900) (565,340) (199,532) (332,553) (532,084) (33,255) (598,595) (798,127) (764,871) (1,130,680) (532,084) (299,298) (399,063) (3,325,528,000)e. Contributions - Employee (152,795,122) (4,028,186) (1,471,715) (26,960) (9,515) (15,859) (25,374) (1,586) (28,546) (38,062) (36,476) (53,921) (25,374) (14,273) (19,031) (158,590,000)f. Net Investment Income (1,553,029,113) (40,942,997) (14,958,701) (274,028) (96,716) (161,193) (257,909) (16,119) (290,147) (386,863) (370,744) (548,056) (257,909) (145,074) (193,431) (1,611,929,000)g. Benefit Payments 0 0 0 0 0 0 0 0 0 0 0 0 0 0 0 0h. Payment of Interest on TDA Fixed Funds 1,203,349,978 31,724,295 11,590,609 212,328 74,939 124,899 199,838 12,490 224,818 299,757 287,267 424,656 199,838 112,409 149,879 1,248,988,000i. Administrative Expenses 56,257,394 1,483,131 541,868 9,926 3,503 5,839 9,343 584 10,510 14,014 13,430 19,853 9,343 5,255 7,007 58,391,000j. Other Changes (316,977) (8,359) (3,053) (56) (17) (34) (54) (5) (60) (77) (77) (111) (52) (28) (40) (329,000)k. Net Changes 2,860,766,678$ 75,419,292$ 27,554,766$ 504,775$ 178,157$ 296,925$ 475,081$ 29,692$ 534,467$ 712,624$ 682,929$ 1,009,550$ 475,083$ 267,234$ 356,313$ 2,969,263,566$
3. SubTotal 20,027,619,379$ 521,186,626$ 191,644,179$ 3,711,734$ 1,781,636$ 2,434,899$ 5,107,357$ 742,351$ 5,523,071$ 4,097,747$ 5,137,041$ 8,492,454$ 3,682,042$ 1,870,713$ 2,672,448$ 20,785,703,677$
4. Changes in Proportionate Share (1,425,314)$ 6,770,247$ 1,247,151$ (178,164)$ (534,494)$ (356,329)$ (1,781,644)$ (534,494)$ (1,781,644)$ 890,822$ (356,329)$ (1,425,315)$ (356,329)$ 0$ (178,164)$ 0$
5. Balances at June 30, 2015 20,026,194,065$ 527,956,873$ 192,891,330$ 3,533,570$ 1,247,142$ 2,078,570$ 3,325,713$ 207,857$ 3,741,427$ 4,988,569$ 4,780,712$ 7,067,139$ 3,325,713$ 1,870,713$ 2,494,284$ 20,785,703,677$
Total Pension Liability
Plan Fiduciary Net Position
Net Pension Liability
NEW YORK CITY TEACHERS' RETIREMENT SYSTEM (TRS)
Governmental Accounting Standards Board Statements No. 67 and No. 68 (GASB 67/68)
Changes in Net Pension Liability (NPL) by Source - By ObligorBalances at June 30, 2015

Appendix BPage 3d
NYC Office of the Actuary October 11, 2016
DEPT. OF ED. SENIOR COLL. COMM. COLL. BWC FUT. LEAD. H. TUBMAN KIPP ACAD. KIPP AMP KIPP INF. OPPOR. REN. UFT UNIV PREP VOICE WILDCAT TOTAL1. Balances at June 30, 2015 62,663,792,641$ 1,652,025,339$ 603,574,612$ 11,056,863$ 3,902,422$ 6,504,036$ 10,406,459$ 650,404$ 11,707,267$ 15,609,688$ 14,959,285$ 22,113,725$ 10,406,459$ 5,853,633$ 7,804,844$ 65,040,367,677$
2. Changes for the Year:a. Service Cost 1,223,577,662 35,413,015 13,456,691 101,945 89,202 127,431 229,375 12,743 216,632 165,660 267,605 267,605 152,917 101,945 127,431 1,274,307,859b. Interest 3,966,714,798 114,805,408 43,625,229 330,494 289,182 413,118 743,612 41,312 702,300 537,053 867,547 867,547 495,741 330,494 413,118 4,131,176,953c. Differences b/t Expected and Actual Experience 1,180,555,145 34,167,850 12,983,537 98,360 86,065 122,950 221,310 12,295 209,015 159,835 258,195 258,195 147,540 98,360 122,950 1,229,501,602d. Changes of Assumptions 2,336,025,145 67,609,680 25,691,192 194,630 170,301 243,288 437,918 24,329 413,589 316,274 510,904 510,904 291,945 194,630 243,288 2,432,878,017e. Benefit Payments (3,943,937,215) (114,146,174) (43,374,725) (328,596) (287,522) (410,746) (739,342) (41,075) (698,267) (533,969) (862,566) (862,566) (492,895) (328,596) (410,746) (4,107,455,000)f. Net Changes 4,762,935,535$ 137,849,779$ 52,381,924$ 396,833$ 347,228$ 496,041$ 892,873$ 49,604$ 843,269$ 644,853$ 1,041,685$ 1,041,685$ 595,248$ 396,833$ 496,041$ 4,960,409,431$
3. SubTotal 67,426,728,176$ 1,789,875,118$ 655,956,536$ 11,453,696$ 4,249,650$ 7,000,077$ 11,299,332$ 700,008$ 12,550,536$ 16,254,541$ 16,000,970$ 23,155,410$ 11,001,707$ 6,250,466$ 8,300,885$ 70,000,777,108$
4. Changes in Proportionate Share (212,682,009)$ 155,446,478$ 83,251,670$ (5,853,633)$ 650,404$ -$ 1,300,808$ -$ (650,404)$ (7,154,440)$ (1,300,805)$ (8,455,245)$ (2,601,614)$ (650,403)$ (1,300,807)$ -$
5. Balances at June 30, 2016 67,214,046,167$ 1,945,321,596$ 739,208,206$ 5,600,063$ 4,900,054$ 7,000,077$ 12,600,140$ 700,008$ 11,900,132$ 9,100,101$ 14,700,165$ 14,700,165$ 8,400,093$ 5,600,063$ 7,000,078$ 70,000,777,108$
DEPT. OF ED. SENIOR COLL. COMM. COLL. BWC FUT. LEAD. H. TUBMAN KIPP ACAD. KIPP AMP KIPP INF. OPPOR. REN. UFT UNIV PREP VOICE WILDCAT TOTAL1. Balances at June 30, 2015 42,637,598,576$ 1,124,068,466$ 410,683,282$ 7,523,293$ 2,655,280$ 4,425,466$ 7,080,746$ 442,547$ 7,965,840$ 10,621,119$ 10,178,573$ 15,046,586$ 7,080,746$ 3,982,920$ 5,310,560$ 44,254,664,000$
2. Changes for the Year:a. Contributions - Employer 3,610,999,976 104,510,242 39,713,140 300,857 263,250 376,071 676,929 37,607 639,321 488,893 789,750 789,750 451,286 300,857 376,071 3,760,714,000b. Contributions - Employee 166,781,161 4,827,012 1,834,230 13,896 12,159 17,370 31,265 1,737 29,528 22,580 36,476 36,476 20,844 13,896 17,370 173,696,000c. Net Investment Income 922,038,770 26,685,820 10,140,420 76,821 67,219 96,027 172,848 9,603 163,245 124,835 201,656 201,656 115,232 76,821 96,027 960,267,000d. Benefit Payments (3,943,937,215) (114,146,174) (43,374,725) (328,596) (287,522) (410,746) (739,342) (41,075) (698,267) (533,969) (862,566) (862,566) (492,895) (328,596) (410,746) (4,107,455,000)e. Payment of Interest on TDA Fixed Funds (1,300,296,019) (37,633,413) (14,300,426) (108,337) (94,794) (135,421) (243,757) (13,542) (230,215) (176,047) (284,383) (284,383) (162,505) (108,337) (135,421) (1,354,207,000)f. Administrative Expenses (57,003,599) (1,649,809) (626,916) (4,749) (4,156) (5,937) (10,686) (594) (10,092) (7,718) (12,467) (12,467) (7,124) (4,749) (5,937) (59,367,000)g. Other Changes 1,183,915 34,265 13,020 99 86 123 222 12 210 160 259 259 148 99 123 1,233,000h. Net Changes (600,233,011)$ (17,372,057)$ (6,601,257)$ (50,009)$ (43,758)$ (62,513)$ (112,521)$ (6,252)$ (106,270)$ (81,266)$ (131,275)$ (131,275)$ (75,014)$ (50,009)$ (62,513)$ (625,119,000)$
3. SubTotal 42,037,365,565$ 1,106,696,409$ 404,082,025$ 7,473,284$ 2,611,522$ 4,362,953$ 6,968,225$ 436,295$ 7,859,570$ 10,539,853$ 10,047,298$ 14,915,311$ 7,005,732$ 3,932,911$ 5,248,047$ 43,629,545,000$
4. Changes in Proportionate Share (144,712,752)$ 105,768,647$ 56,645,970$ (3,982,920)$ 442,546$ -$ 885,093$ -$ (442,547)$ (4,868,012)$ (885,093)$ (5,753,106)$ (1,770,187)$ (442,547)$ (885,092)$ -$
5. Balances at June 30, 2016 41,892,652,813$ 1,212,465,056$ 460,727,995$ 3,490,364$ 3,054,068$ 4,362,953$ 7,853,318$ 436,295$ 7,417,023$ 5,671,841$ 9,162,205$ 9,162,205$ 5,235,545$ 3,490,364$ 4,362,955$ 43,629,545,000$
DEPT. OF ED. SENIOR COLL. COMM. COLL. BWC FUT. LEAD. H. TUBMAN KIPP ACAD. KIPP AMP KIPP INF. OPPOR. REN. UFT UNIV PREP VOICE WILDCAT TOTAL1. Balances at June 30, 2015 20,026,194,065$ 527,956,873$ 192,891,330$ 3,533,570$ 1,247,142$ 2,078,570$ 3,325,713$ 207,857$ 3,741,427$ 4,988,569$ 4,780,712$ 7,067,139$ 3,325,713$ 1,870,713$ 2,494,284$ 20,785,703,677$
2. Changes for the Year:a. Service Cost 1,223,577,662 35,413,015 13,456,691 101,945 89,202 127,431 229,375 12,743 216,632 165,660 267,605 267,605 152,917 101,945 127,431 1,274,307,859b. Interest 3,966,714,798 114,805,408 43,625,229 330,494 289,182 413,118 743,612 41,312 702,300 537,053 867,547 867,547 495,741 330,494 413,118 4,131,176,953c. Differences b/t Expected and Actual Experience 1,180,555,145 34,167,850 12,983,537 98,360 86,065 122,950 221,310 12,295 209,015 159,835 258,195 258,195 147,540 98,360 122,950 1,229,501,602d. Changes of Assumptions 2,336,025,145 67,609,680 25,691,192 194,630 170,301 243,288 437,918 24,329 413,589 316,274 510,904 510,904 291,945 194,630 243,288 2,432,878,017e. Contributions - Employer (3,610,999,976) (104,510,242) (39,713,140) (300,857) (263,250) (376,071) (676,929) (37,607) (639,321) (488,893) (789,750) (789,750) (451,286) (300,857) (376,071) (3,760,714,000)f. Contributions - Employee (166,781,161) (4,827,012) (1,834,230) (13,896) (12,159) (17,370) (31,265) (1,737) (29,528) (22,580) (36,476) (36,476) (20,844) (13,896) (17,370) (173,696,000)g. Net Investment Income (922,038,770) (26,685,820) (10,140,420) (76,821) (67,219) (96,027) (172,848) (9,603) (163,245) (124,835) (201,656) (201,656) (115,232) (76,821) (96,027) (960,267,000)h. Benefit Payments 0 0 0 0 0 0 0 0 0 0 0 0 0 0 0 0i. Payment of Interest on TDA Fixed Funds 1,300,296,019 37,633,413 14,300,426 108,337 94,794 135,421 243,757 13,542 230,215 176,047 284,383 284,383 162,505 108,337 135,421 1,354,207,000j. Administrative Expenses 57,003,599 1,649,809 626,916 4,749 4,156 5,937 10,686 594 10,092 7,718 12,467 12,467 7,124 4,749 5,937 59,367,000k. Other Changes (1,183,915) (34,265) (13,020) (99) (86) (123) (222) (12) (210) (160) (259) (259) (148) (99) (123) (1,233,000)l. Net Changes 5,363,168,546$ 155,221,836$ 58,983,181$ 446,842$ 390,986$ 558,554$ 1,005,394$ 55,856$ 949,539$ 726,119$ 1,172,960$ 1,172,960$ 670,262$ 446,842$ 558,554$ 5,585,528,431$
3. SubTotal 25,389,362,611$ 683,178,709$ 251,874,511$ 3,980,412$ 1,638,128$ 2,637,124$ 4,331,107$ 263,713$ 4,690,966$ 5,714,688$ 5,953,672$ 8,240,099$ 3,995,975$ 2,317,555$ 3,052,838$ 26,371,232,108$
4. Changes in Proportionate Share (67,969,257)$ 49,677,831$ 26,605,700$ (1,870,713)$ 207,858$ -$ 415,715$ -$ (207,857)$ (2,286,428)$ (415,712)$ (2,702,139)$ (831,427)$ (207,856)$ (415,715)$ -$
5. Balances at June 30, 2016 25,321,393,354$ 732,856,540$ 278,480,211$ 2,109,699$ 1,845,986$ 2,637,124$ 4,746,822$ 263,713$ 4,483,109$ 3,428,260$ 5,537,960$ 5,537,960$ 3,164,548$ 2,109,699$ 2,637,123$ 26,371,232,108$
Plan Fiduciary Net Position
Net Pension Liability
NEW YORK CITY TEACHERS' RETIREMENT SYSTEM (TRS)
Governmental Accounting Standards Board Statements No. 67 and No. 68 (GASB 67/68)
Changes in Net Pension Liability (NPL) by Source - by ObligorBalances at June 30, 2016
Total Pension Liability

Appendix BPage 4a(1)
NYC Office of the Actuary October 11, 2016
Component Amount
a. Service Cost 1,223,157,877$ b. Interest on the Total Pension Liability 4,027,138,338c. Differences between Expected and Actual Experience 388,650,606d. Changes of Assumptions 0e. Employee Contributions (158,590,000)f. Projected Earnings on Pension Plan Investments (2,997,304,562)g. Differences between Projected and Actual Earnings on Plan Investments (1,628,049,766)h. Pension Plan Administrative Expenses 58,391,000i. Payment of Interest on TDA Fixed Funds 1,248,988,000j. Other Changes in Fiduciary Net Position (329,000)
Total Pension Expense 2,162,052,493$
NEW YORK CITY TEACHERS' RETIREMENT SYSTEM (TRS)
Governmental Accounting Standards Board Statements No. 67 and No. 68 (GASB 67/68)
Components of Pension Expense for the Fiscal Year Ended June 30, 2015
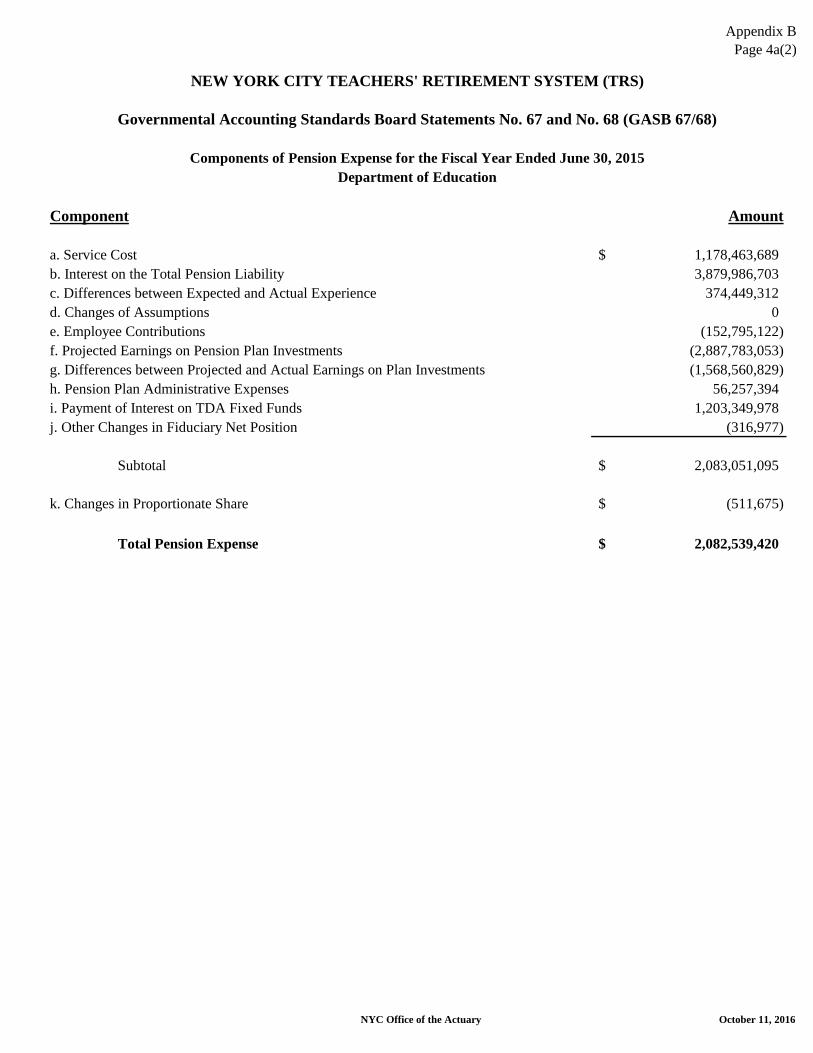
Appendix BPage 4a(2)
NYC Office of the Actuary October 11, 2016
Component Amount
a. Service Cost 1,178,463,689$ b. Interest on the Total Pension Liability 3,879,986,703c. Differences between Expected and Actual Experience 374,449,312d. Changes of Assumptions 0e. Employee Contributions (152,795,122)f. Projected Earnings on Pension Plan Investments (2,887,783,053)g. Differences between Projected and Actual Earnings on Plan Investments (1,568,560,829)h. Pension Plan Administrative Expenses 56,257,394i. Payment of Interest on TDA Fixed Funds 1,203,349,978j. Other Changes in Fiduciary Net Position (316,977)
Subtotal 2,083,051,095$
k. Changes in Proportionate Share (511,675)$
Total Pension Expense 2,082,539,420$
Department of EducationComponents of Pension Expense for the Fiscal Year Ended June 30, 2015
NEW YORK CITY TEACHERS' RETIREMENT SYSTEM (TRS)
Governmental Accounting Standards Board Statements No. 67 and No. 68 (GASB 67/68)

Appendix BPage 4a(3)
NYC Office of the Actuary October 11, 2016
Component Amount
a. Service Cost 31,068,210$ b. Interest on the Total Pension Liability 102,289,314c. Differences between Expected and Actual Experience 9,871,725d. Changes of Assumptions 0e. Employee Contributions (4,028,186)f. Projected Earnings on Pension Plan Investments (76,131,536)g. Differences between Projected and Actual Earnings on Plan Investments (41,352,464)h. Pension Plan Administrative Expenses 1,483,131i. Payment of Interest on TDA Fixed Funds 31,724,295j. Other Changes in Fiduciary Net Position (8,357)
Subtotal 54,916,132$
k. Changes in Proportionate Share 2,430,456$
Total Pension Expense 57,346,588$
NEW YORK CITY TEACHERS' RETIREMENT SYSTEM (TRS)
Governmental Accounting Standards Board Statements No. 67 and No. 68 (GASB 67/68)
Components of Pension Expense for the Fiscal Year Ended June 30, 2015CUNY Senior Colleges

Appendix BPage 4a(4)
NYC Office of the Actuary October 11, 2016
Component Amount
a. Service Cost 11,350,905$ b. Interest on the Total Pension Liability 37,371,844c. Differences between Expected and Actual Experience 3,606,678d. Changes of Assumptions 0e. Employee Contributions (1,471,715)f. Projected Earnings on Pension Plan Investments (27,814,986)g. Differences between Projected and Actual Earnings on Plan Investments (15,108,302)h. Pension Plan Administrative Expenses 541,868i. Payment of Interest on TDA Fixed Funds 11,590,609j. Other Changes in Fiduciary Net Position (3,053)
Subtotal 20,063,848$
k. Changes in Proportionate Share 447,716$
Total Pension Expense 20,511,564$
NEW YORK CITY TEACHERS' RETIREMENT SYSTEM (TRS)
Governmental Accounting Standards Board Statements No. 67 and No. 68 (GASB 67/68)
Components of Pension Expense for the Fiscal Year Ended June 30, 2015CUNY Community Colleges

Appendix BPage 4a(5)
NYC Office of the Actuary October 11, 2016
Component Amount
a. Service Cost 207,937$ b. Interest on the Total Pension Liability 684,614c. Differences between Expected and Actual Experience 66,071d. Changes of Assumptions 0e. Employee Contributions (26,960)f. Projected Earnings on Pension Plan Investments (509,542)g. Differences between Projected and Actual Earnings on Plan Investments (276,768)h. Pension Plan Administrative Expenses 9,926i. Payment of Interest on TDA Fixed Funds 212,328j. Other Changes in Fiduciary Net Position (56)
Subtotal 367,550$
k. Changes in Proportionate Share (63,960)$
Total Pension Expense 303,590$
Beginning with Children Charter SchoolComponents of Pension Expense for the Fiscal Year Ended June 30, 2015
NEW YORK CITY TEACHERS' RETIREMENT SYSTEM (TRS)
Governmental Accounting Standards Board Statements No. 67 and No. 68 (GASB 67/68)

Appendix BPage 4a(6)
NYC Office of the Actuary October 11, 2016
Component Amount
a. Service Cost 73,389$ b. Interest on the Total Pension Liability 241,628c. Differences between Expected and Actual Experience 23,319d. Changes of Assumptions 0e. Employee Contributions (9,515)f. Projected Earnings on Pension Plan Investments (179,838)g. Differences between Projected and Actual Earnings on Plan Investments (97,683)h. Pension Plan Administrative Expenses 3,503i. Payment of Interest on TDA Fixed Funds 74,939j. Other Changes in Fiduciary Net Position (20)
Subtotal 129,722$
k. Changes in Proportionate Share (191,878)$
Total Pension Expense (62,156)$
NEW YORK CITY TEACHERS' RETIREMENT SYSTEM (TRS)
Governmental Accounting Standards Board Statements No. 67 and No. 68 (GASB 67/68)
Components of Pension Expense for the Fiscal Year Ended June 30, 2015Future Leaders Charter School

Appendix BPage 4a(7)
NYC Office of the Actuary October 11, 2016
Component Amount
a. Service Cost 122,316$ b. Interest on the Total Pension Liability 402,714c. Differences between Expected and Actual Experience 38,865d. Changes of Assumptions 0e. Employee Contributions (15,859)f. Projected Earnings on Pension Plan Investments (299,730)g. Differences between Projected and Actual Earnings on Plan Investments (162,805)h. Pension Plan Administrative Expenses 5,839i. Payment of Interest on TDA Fixed Funds 124,899j. Other Changes in Fiduciary Net Position (33)
Subtotal 216,206$
k. Changes in Proportionate Share (127,918)$
Total Pension Expense 88,288$
NEW YORK CITY TEACHERS' RETIREMENT SYSTEM (TRS)
Governmental Accounting Standards Board Statements No. 67 and No. 68 (GASB 67/68)
Components of Pension Expense for the Fiscal Year Ended June 30, 2015Harriet Tubman Charter School

Appendix BPage 4a(8)
NYC Office of the Actuary October 11, 2016
Component Amount
a. Service Cost 195,705$ b. Interest on the Total Pension Liability 644,342c. Differences between Expected and Actual Experience 62,184d. Changes of Assumptions 0e. Employee Contributions (25,374)f. Projected Earnings on Pension Plan Investments (479,569)g. Differences between Projected and Actual Earnings on Plan Investments (260,488)h. Pension Plan Administrative Expenses 9,343i. Payment of Interest on TDA Fixed Funds 199,838j. Other Changes in Fiduciary Net Position (53)
Subtotal 345,928$
k. Changes in Proportionate Share (639,594)$
Total Pension Expense (293,666)$
KIPP Academy Charter SchoolComponents of Pension Expense for the Fiscal Year Ended June 30, 2015
NEW YORK CITY TEACHERS' RETIREMENT SYSTEM (TRS)
Governmental Accounting Standards Board Statements No. 67 and No. 68 (GASB 67/68)

Appendix BPage 4a(9)
NYC Office of the Actuary October 11, 2016
Component Amount
a. Service Cost 12,232$ b. Interest on the Total Pension Liability 40,271c. Differences between Expected and Actual Experience 3,887d. Changes of Assumptions 0e. Employee Contributions (1,586)f. Projected Earnings on Pension Plan Investments (29,973)g. Differences between Projected and Actual Earnings on Plan Investments (16,280)h. Pension Plan Administrative Expenses 584i. Payment of Interest on TDA Fixed Funds 12,490j. Other Changes in Fiduciary Net Position (3)
Subtotal 21,622$
k. Changes in Proportionate Share (191,878)$
Total Pension Expense (170,256)$
NEW YORK CITY TEACHERS' RETIREMENT SYSTEM (TRS)
Governmental Accounting Standards Board Statements No. 67 and No. 68 (GASB 67/68)
Components of Pension Expense for the Fiscal Year Ended June 30, 2015KIPP AMP Charter School

Appendix BPage 4a(10)
NYC Office of the Actuary October 11, 2016
Component Amount
a. Service Cost 220,168$ b. Interest on the Total Pension Liability 724,885c. Differences between Expected and Actual Experience 69,957d. Changes of Assumptions 0e. Employee Contributions (28,546)f. Projected Earnings on Pension Plan Investments (539,515)g. Differences between Projected and Actual Earnings on Plan Investments (293,049)h. Pension Plan Administrative Expenses 10,510i. Payment of Interest on TDA Fixed Funds 224,818j. Other Changes in Fiduciary Net Position (59)
Subtotal 389,169$
k. Changes in Proportionate Share (639,594)$
Total Pension Expense (250,425)$
NEW YORK CITY TEACHERS' RETIREMENT SYSTEM (TRS)
Governmental Accounting Standards Board Statements No. 67 and No. 68 (GASB 67/68)
Components of Pension Expense for the Fiscal Year Ended June 30, 2015KIPP Infinity Charter School

Appendix BPage 4a(11)
NYC Office of the Actuary October 11, 2016
Component Amount
a. Service Cost 293,558$ b. Interest on the Total Pension Liability 966,513c. Differences between Expected and Actual Experience 93,276d. Changes of Assumptions 0e. Employee Contributions (38,062)f. Projected Earnings on Pension Plan Investments (719,353)g. Differences between Projected and Actual Earnings on Plan Investments (390,732)h. Pension Plan Administrative Expenses 14,014i. Payment of Interest on TDA Fixed Funds 299,757j. Other Changes in Fiduciary Net Position (79)
Subtotal 518,892$
k. Changes in Proportionate Share 319,796$
Total Pension Expense 838,688$
Opportunity Charter SchoolComponents of Pension Expense for the Fiscal Year Ended June 30, 2015
NEW YORK CITY TEACHERS' RETIREMENT SYSTEM (TRS)
Governmental Accounting Standards Board Statements No. 67 and No. 68 (GASB 67/68)

Appendix BPage 4a(12)
NYC Office of the Actuary October 11, 2016
Component Amount
a. Service Cost 281,326$ b. Interest on the Total Pension Liability 926,242c. Differences between Expected and Actual Experience 89,390d. Changes of Assumptions 0e. Employee Contributions (36,476)f. Projected Earnings on Pension Plan Investments (689,380)g. Differences between Projected and Actual Earnings on Plan Investments (374,451)h. Pension Plan Administrative Expenses 13,430i. Payment of Interest on TDA Fixed Funds 287,267j. Other Changes in Fiduciary Net Position (76)
Subtotal 497,272$
k. Changes in Proportionate Share (127,918)$
Total Pension Expense 369,354$
NEW YORK CITY TEACHERS' RETIREMENT SYSTEM (TRS)
Governmental Accounting Standards Board Statements No. 67 and No. 68 (GASB 67/68)
Components of Pension Expense for the Fiscal Year Ended June 30, 2015Renaissance Charter School

Appendix BPage 4a(13)
NYC Office of the Actuary October 11, 2016
Component Amount
a. Service Cost 415,874$ b. Interest on the Total Pension Liability 1,369,227c. Differences between Expected and Actual Experience 132,141d. Changes of Assumptions 0e. Employee Contributions (53,921)f. Projected Earnings on Pension Plan Investments (1,019,084)g. Differences between Projected and Actual Earnings on Plan Investments (553,537)h. Pension Plan Administrative Expenses 19,853i. Payment of Interest on TDA Fixed Funds 424,656j. Other Changes in Fiduciary Net Position (112)
Subtotal 735,097$
k. Changes in Proportionate Share (511,675)$
Total Pension Expense 223,422$
NEW YORK CITY TEACHERS' RETIREMENT SYSTEM (TRS)
Governmental Accounting Standards Board Statements No. 67 and No. 68 (GASB 67/68)
Components of Pension Expense for the Fiscal Year Ended June 30, 2015UFT Charter School

Appendix BPage 4a(14)
NYC Office of the Actuary October 11, 2016
Component Amount
a. Service Cost 195,705$ b. Interest on the Total Pension Liability 644,342c. Differences between Expected and Actual Experience 62,184d. Changes of Assumptions 0e. Employee Contributions (25,374)f. Projected Earnings on Pension Plan Investments (479,569)g. Differences between Projected and Actual Earnings on Plan Investments (260,488)h. Pension Plan Administrative Expenses 9,343i. Payment of Interest on TDA Fixed Funds 199,838j. Other Changes in Fiduciary Net Position (53)
Subtotal 345,928$
k. Changes in Proportionate Share (127,918)$
Total Pension Expense 218,010$
University Prep Charter High SchoolComponents of Pension Expense for the Fiscal Year Ended June 30, 2015
NEW YORK CITY TEACHERS' RETIREMENT SYSTEM (TRS)
Governmental Accounting Standards Board Statements No. 67 and No. 68 (GASB 67/68)

Appendix BPage 4a(15)
NYC Office of the Actuary October 11, 2016
Component Amount
a. Service Cost 110,084$ b. Interest on the Total Pension Liability 362,442c. Differences between Expected and Actual Experience 34,979d. Changes of Assumptions 0e. Employee Contributions (14,273)f. Projected Earnings on Pension Plan Investments (269,757)g. Differences between Projected and Actual Earnings on Plan Investments (146,524)h. Pension Plan Administrative Expenses 5,255i. Payment of Interest on TDA Fixed Funds 112,409j. Other Changes in Fiduciary Net Position (30)
Subtotal 194,585$
k. Changes in Proportionate Share 0$
Total Pension Expense 194,585$
NEW YORK CITY TEACHERS' RETIREMENT SYSTEM (TRS)
Governmental Accounting Standards Board Statements No. 67 and No. 68 (GASB 67/68)
Components of Pension Expense for the Fiscal Year Ended June 30, 2015Voice Charter School

Appendix BPage 4a(16)
NYC Office of the Actuary October 11, 2016
Component Amount
a. Service Cost 146,779$ b. Interest on the Total Pension Liability 483,257c. Differences between Expected and Actual Experience 46,638d. Changes of Assumptions 0e. Employee Contributions (19,031)f. Projected Earnings on Pension Plan Investments (359,677)g. Differences between Projected and Actual Earnings on Plan Investments (195,366)h. Pension Plan Administrative Expenses 7,007i. Payment of Interest on TDA Fixed Funds 149,879j. Other Changes in Fiduciary Net Position (39)
Subtotal 259,447$
k. Changes in Proportionate Share (63,960)$
Total Pension Expense 195,487$
Governmental Accounting Standards Board Statements No. 67 and No. 68 (GASB 67/68)
Components of Pension Expense for the Fiscal Year Ended June 30, 2015Wildcat Charter School
NEW YORK CITY TEACHERS' RETIREMENT SYSTEM (TRS)

Appendix BPage 4b(1)
NYC Office of the Actuary October 11, 2016
Component Amount
a. Service Cost 1,274,307,859$ b. Interest on the Total Pension Liability 4,131,176,953c. Differences between Expected and Actual Experience 708,833,315d. Changes of Assumptions 633,561,984e. Employee Contributions (173,696,000)f. Projected Earnings on Pension Plan Investments (2,846,694,168)g. Differences between Projected and Actual Earnings on Plan Investments (1,250,764,332)h. Pension Plan Administrative Expenses 59,367,000i. Payment of Interest on TDA Fixed Funds 1,354,207,000j. Other Changes in Fiduciary Net Position (1,233,000)
Total Pension Expense 3,889,066,611$
NEW YORK CITY TEACHERS' RETIREMENT SYSTEM (TRS)
Governmental Accounting Standards Board Statements No. 67 and No. 68 (GASB 67/68)
Components of Pension Expense for the Fiscal Year Ended June 30, 2016

Appendix BPage 4b(2)
NYC Office of the Actuary October 11, 2016
Component Amount
a. Service Cost 1,223,577,662$ b. Interest on the Total Pension Liability 3,966,714,798c. Differences between Expected and Actual Experience 680,614,661d. Changes of Assumptions 608,339,881e. Employee Contributions (166,781,161)f. Projected Earnings on Pension Plan Investments (2,733,367,273)g. Differences between Projected and Actual Earnings on Plan Investments (1,200,971,403)h. Pension Plan Administrative Expenses 57,003,599i. Payment of Interest on TDA Fixed Funds 1,300,296,019j. Other Changes in Fiduciary Net Position (1,183,915)
Subtotal 3,734,242,868
k. Changes in Proportionate Share (20,653,473)
Total Pension Expense 3,713,589,395$
Components of Pension Expense for the Fiscal Year Ended June 30, 2016
NEW YORK CITY TEACHERS' RETIREMENT SYSTEM (TRS)
Governmental Accounting Standards Board Statements No. 67 and No. 68 (GASB 67/68)
Department of Education
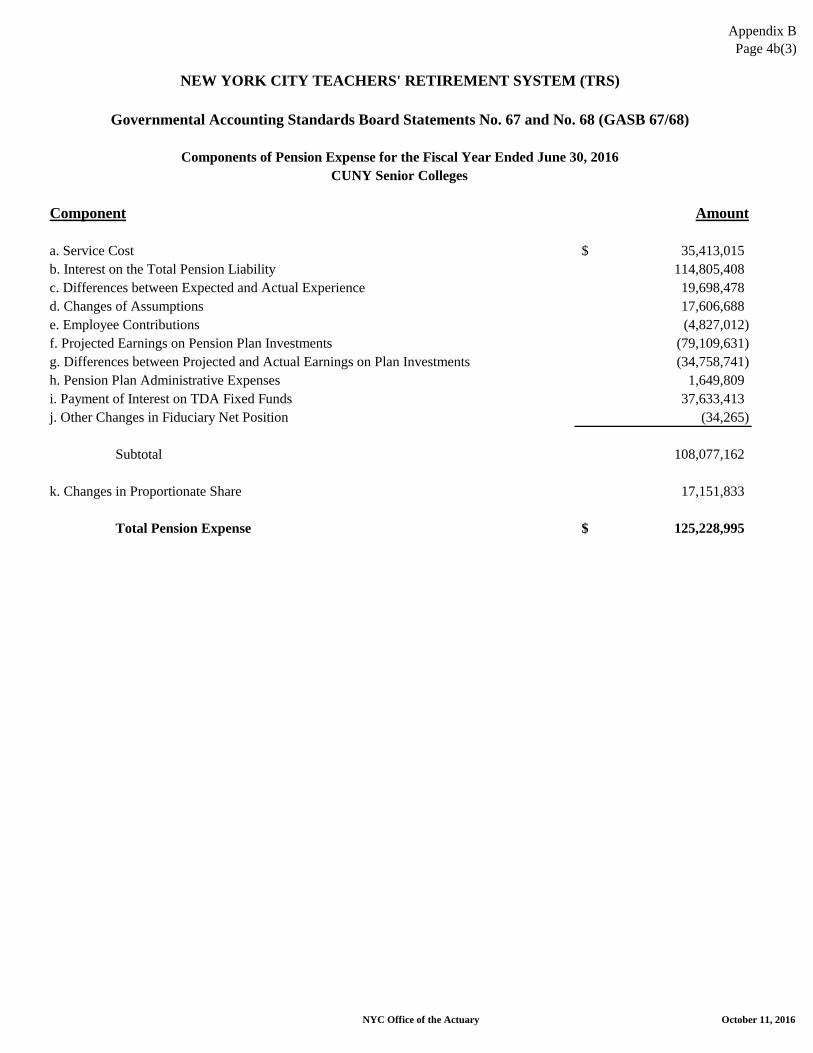
Appendix BPage 4b(3)
NYC Office of the Actuary October 11, 2016
Component Amount
a. Service Cost 35,413,015$ b. Interest on the Total Pension Liability 114,805,408c. Differences between Expected and Actual Experience 19,698,478d. Changes of Assumptions 17,606,688e. Employee Contributions (4,827,012)f. Projected Earnings on Pension Plan Investments (79,109,631)g. Differences between Projected and Actual Earnings on Plan Investments (34,758,741)h. Pension Plan Administrative Expenses 1,649,809i. Payment of Interest on TDA Fixed Funds 37,633,413j. Other Changes in Fiduciary Net Position (34,265)
Subtotal 108,077,162
k. Changes in Proportionate Share 17,151,833
Total Pension Expense 125,228,995$
NEW YORK CITY TEACHERS' RETIREMENT SYSTEM (TRS)
Governmental Accounting Standards Board Statements No. 67 and No. 68 (GASB 67/68)
Components of Pension Expense for the Fiscal Year Ended June 30, 2016CUNY Senior Colleges

Appendix BPage 4b(4)
NYC Office of the Actuary October 11, 2016
Component Amount
a. Service Cost 13,456,691$ b. Interest on the Total Pension Liability 43,625,229c. Differences between Expected and Actual Experience 7,485,280d. Changes of Assumptions 6,690,415e. Employee Contributions (1,834,230)f. Projected Earnings on Pension Plan Investments (30,061,090)g. Differences between Projected and Actual Earnings on Plan Investments (13,208,071)h. Pension Plan Administrative Expenses 626,916i. Payment of Interest on TDA Fixed Funds 14,300,426j. Other Changes in Fiduciary Net Position (13,020)
Subtotal 41,068,546
k. Changes in Proportionate Share 8,331,968
Total Pension Expense 49,400,514$
NEW YORK CITY TEACHERS' RETIREMENT SYSTEM (TRS)
Governmental Accounting Standards Board Statements No. 67 and No. 68 (GASB 67/68)
Components of Pension Expense for the Fiscal Year Ended June 30, 2016CUNY Community Colleges

Appendix BPage 4b(5)
NYC Office of the Actuary October 11, 2016
Component Amount
a. Service Cost 101,945$ b. Interest on the Total Pension Liability 330,494c. Differences between Expected and Actual Experience 56,707d. Changes of Assumptions 50,685e. Employee Contributions (13,896)f. Projected Earnings on Pension Plan Investments (227,736)g. Differences between Projected and Actual Earnings on Plan Investments (100,061)h. Pension Plan Administrative Expenses 4,749i. Payment of Interest on TDA Fixed Funds 108,337j. Other Changes in Fiduciary Net Position (99)
Subtotal 311,125
k. Changes in Proportionate Share (618,322)
Total Pension Expense (307,197)$
Components of Pension Expense for the Fiscal Year Ended June 30, 2016
NEW YORK CITY TEACHERS' RETIREMENT SYSTEM (TRS)
Governmental Accounting Standards Board Statements No. 67 and No. 68 (GASB 67/68)
Beginning with Children Charter School

Appendix BPage 4b(6)
NYC Office of the Actuary October 11, 2016
Component Amount
a. Service Cost 89,202$ b. Interest on the Total Pension Liability 289,182c. Differences between Expected and Actual Experience 49,618d. Changes of Assumptions 44,349e. Employee Contributions (12,159)f. Projected Earnings on Pension Plan Investments (199,269)g. Differences between Projected and Actual Earnings on Plan Investments (87,554)h. Pension Plan Administrative Expenses 4,156i. Payment of Interest on TDA Fixed Funds 94,794j. Other Changes in Fiduciary Net Position (86)
Subtotal 272,233
k. Changes in Proportionate Share (130,283)
Total Pension Expense 141,950$
NEW YORK CITY TEACHERS' RETIREMENT SYSTEM (TRS)
Governmental Accounting Standards Board Statements No. 67 and No. 68 (GASB 67/68)
Components of Pension Expense for the Fiscal Year Ended June 30, 2016Future Leaders Charter School
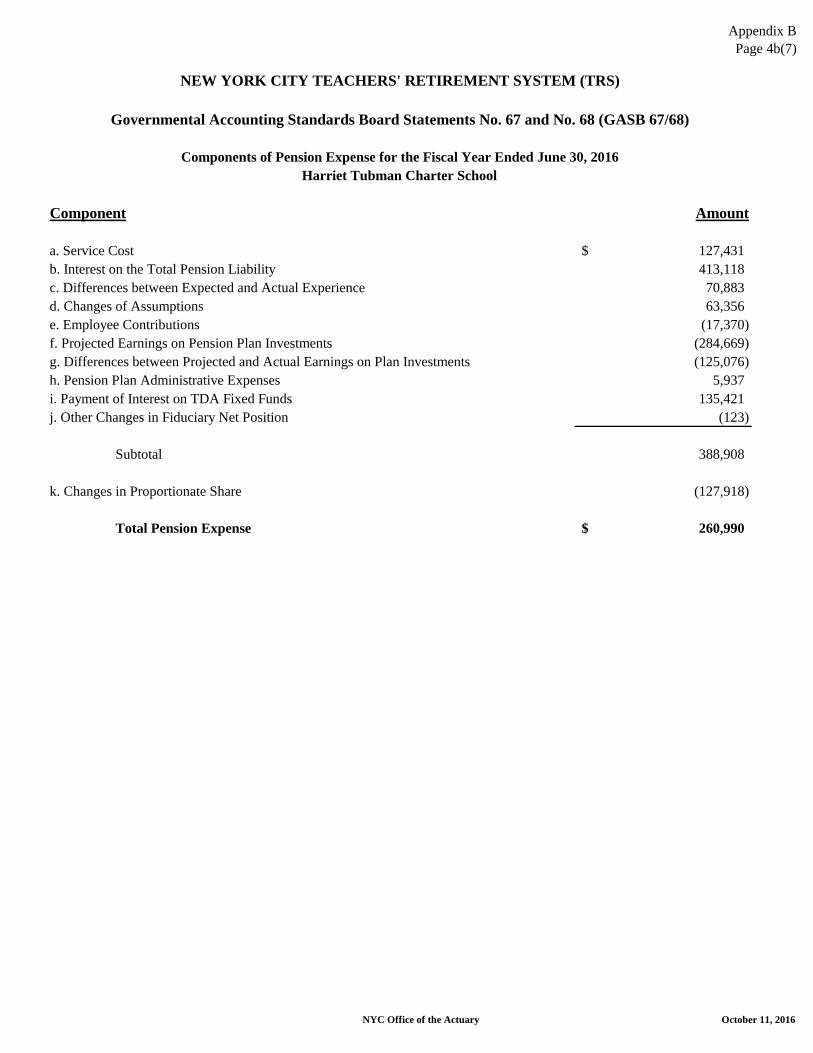
Appendix BPage 4b(7)
NYC Office of the Actuary October 11, 2016
Component Amount
a. Service Cost 127,431$ b. Interest on the Total Pension Liability 413,118c. Differences between Expected and Actual Experience 70,883d. Changes of Assumptions 63,356e. Employee Contributions (17,370)f. Projected Earnings on Pension Plan Investments (284,669)g. Differences between Projected and Actual Earnings on Plan Investments (125,076)h. Pension Plan Administrative Expenses 5,937i. Payment of Interest on TDA Fixed Funds 135,421j. Other Changes in Fiduciary Net Position (123)
Subtotal 388,908
k. Changes in Proportionate Share (127,918)
Total Pension Expense 260,990$
NEW YORK CITY TEACHERS' RETIREMENT SYSTEM (TRS)
Governmental Accounting Standards Board Statements No. 67 and No. 68 (GASB 67/68)
Components of Pension Expense for the Fiscal Year Ended June 30, 2016Harriet Tubman Charter School

Appendix BPage 4b(8)
NYC Office of the Actuary October 11, 2016
Component Amount
a. Service Cost 229,375$ b. Interest on the Total Pension Liability 743,612c. Differences between Expected and Actual Experience 127,590d. Changes of Assumptions 114,041e. Employee Contributions (31,265)f. Projected Earnings on Pension Plan Investments (512,405)g. Differences between Projected and Actual Earnings on Plan Investments (225,138)h. Pension Plan Administrative Expenses 10,686i. Payment of Interest on TDA Fixed Funds 243,757j. Other Changes in Fiduciary Net Position (222)
Subtotal 700,031
k. Changes in Proportionate Share (516,402)
Total Pension Expense 183,629$
Components of Pension Expense for the Fiscal Year Ended June 30, 2016
NEW YORK CITY TEACHERS' RETIREMENT SYSTEM (TRS)
Governmental Accounting Standards Board Statements No. 67 and No. 68 (GASB 67/68)
KIPP Academy Charter School

Appendix BPage 4b(9)
NYC Office of the Actuary October 11, 2016
Component Amount
a. Service Cost 12,743$ b. Interest on the Total Pension Liability 41,312c. Differences between Expected and Actual Experience 7,088d. Changes of Assumptions 6,336e. Employee Contributions (1,737)f. Projected Earnings on Pension Plan Investments (28,467)g. Differences between Projected and Actual Earnings on Plan Investments (12,508)h. Pension Plan Administrative Expenses 594i. Payment of Interest on TDA Fixed Funds 13,542j. Other Changes in Fiduciary Net Position (12)
Subtotal 38,891
k. Changes in Proportionate Share (191,878)
Total Pension Expense (152,987)$
NEW YORK CITY TEACHERS' RETIREMENT SYSTEM (TRS)
Governmental Accounting Standards Board Statements No. 67 and No. 68 (GASB 67/68)
Components of Pension Expense for the Fiscal Year Ended June 30, 2016KIPP AMP Charter School

Appendix BPage 4b(10)
NYC Office of the Actuary October 11, 2016
Component Amount
a. Service Cost 216,632$ b. Interest on the Total Pension Liability 702,300c. Differences between Expected and Actual Experience 120,502d. Changes of Assumptions 107,706e. Employee Contributions (29,528)f. Projected Earnings on Pension Plan Investments (483,938)g. Differences between Projected and Actual Earnings on Plan Investments (212,630)h. Pension Plan Administrative Expenses 10,092i. Payment of Interest on TDA Fixed Funds 230,215j. Other Changes in Fiduciary Net Position (210)
Subtotal 661,141
k. Changes in Proportionate Share (701,189)
Total Pension Expense (40,048)$
NEW YORK CITY TEACHERS' RETIREMENT SYSTEM (TRS)
Governmental Accounting Standards Board Statements No. 67 and No. 68 (GASB 67/68)
Components of Pension Expense for the Fiscal Year Ended June 30, 2016KIPP Infinity Charter School

Appendix BPage 4b(11)
NYC Office of the Actuary October 11, 2016
Component Amount
a. Service Cost 165,660$ b. Interest on the Total Pension Liability 537,053c. Differences between Expected and Actual Experience 92,148d. Changes of Assumptions 82,363e. Employee Contributions (22,580)f. Projected Earnings on Pension Plan Investments (370,070)g. Differences between Projected and Actual Earnings on Plan Investments (162,599)h. Pension Plan Administrative Expenses 7,718i. Payment of Interest on TDA Fixed Funds 176,047j. Other Changes in Fiduciary Net Position (160)
Subtotal 505,580
k. Changes in Proportionate Share (357,757)
Total Pension Expense 147,823$
Components of Pension Expense for the Fiscal Year Ended June 30, 2016
NEW YORK CITY TEACHERS' RETIREMENT SYSTEM (TRS)
Governmental Accounting Standards Board Statements No. 67 and No. 68 (GASB 67/68)
Opportunity Charter School

Appendix BPage 4b(12)
NYC Office of the Actuary October 11, 2016
Component Amount
a. Service Cost 267,605$ b. Interest on the Total Pension Liability 867,547c. Differences between Expected and Actual Experience 148,855d. Changes of Assumptions 133,048e. Employee Contributions (36,476)f. Projected Earnings on Pension Plan Investments (597,806)g. Differences between Projected and Actual Earnings on Plan Investments (262,661)h. Pension Plan Administrative Expenses 12,467i. Payment of Interest on TDA Fixed Funds 284,383j. Other Changes in Fiduciary Net Position (259)
Subtotal 816,703
k. Changes in Proportionate Share (251,110)
Total Pension Expense 565,593$
NEW YORK CITY TEACHERS' RETIREMENT SYSTEM (TRS)
Governmental Accounting Standards Board Statements No. 67 and No. 68 (GASB 67/68)
Components of Pension Expense for the Fiscal Year Ended June 30, 2016Renaissance Charter School

Appendix BPage 4b(13)
NYC Office of the Actuary October 11, 2016
UFT Charter School
Component Amount
a. Service Cost 267,605$ b. Interest on the Total Pension Liability 867,547c. Differences between Expected and Actual Experience 148,855d. Changes of Assumptions 133,048e. Employee Contributions (36,476)f. Projected Earnings on Pension Plan Investments (597,806)g. Differences between Projected and Actual Earnings on Plan Investments (262,661)h. Pension Plan Administrative Expenses 12,467i. Payment of Interest on TDA Fixed Funds 284,383j. Other Changes in Fiduciary Net Position (259)
Subtotal 816,703
k. Changes in Proportionate Share (1,312,420)
Total Pension Expense (495,717)$
NEW YORK CITY TEACHERS' RETIREMENT SYSTEM (TRS)
Governmental Accounting Standards Board Statements No. 67 and No. 68 (GASB 67/68)
Components of Pension Expense for the Fiscal Year Ended June 30, 2016

Appendix BPage 4b(14)
NYC Office of the Actuary October 11, 2016
University Prep Charter High School
Component Amount
a. Service Cost 152,917$ b. Interest on the Total Pension Liability 495,741c. Differences between Expected and Actual Experience 85,060d. Changes of Assumptions 76,027e. Employee Contributions (20,844)f. Projected Earnings on Pension Plan Investments (341,603)g. Differences between Projected and Actual Earnings on Plan Investments (150,092)h. Pension Plan Administrative Expenses 7,124i. Payment of Interest on TDA Fixed Funds 162,505j. Other Changes in Fiduciary Net Position (148)
Subtotal 466,687
k. Changes in Proportionate Share (374,302)
Total Pension Expense 92,385$
Components of Pension Expense for the Fiscal Year Ended June 30, 2016
NEW YORK CITY TEACHERS' RETIREMENT SYSTEM (TRS)
Governmental Accounting Standards Board Statements No. 67 and No. 68 (GASB 67/68)

Appendix BPage 4b(15)
NYC Office of the Actuary October 11, 2016
Component Amount
a. Service Cost 101,945$ b. Interest on the Total Pension Liability 330,494c. Differences between Expected and Actual Experience 56,707d. Changes of Assumptions 50,685e. Employee Contributions (13,896)f. Projected Earnings on Pension Plan Investments (227,736)g. Differences between Projected and Actual Earnings on Plan Investments (100,061)h. Pension Plan Administrative Expenses 4,749i. Payment of Interest on TDA Fixed Funds 108,337j. Other Changes in Fiduciary Net Position (99)
Subtotal 311,125
k. Changes in Proportionate Share (61,595)
Total Pension Expense 249,530$
NEW YORK CITY TEACHERS' RETIREMENT SYSTEM (TRS)
Governmental Accounting Standards Board Statements No. 67 and No. 68 (GASB 67/68)
Components of Pension Expense for the Fiscal Year Ended June 30, 2016Voice Charter School

Appendix BPage 4b(16)
NYC Office of the Actuary October 11, 2016
Component Amount
a. Service Cost 127,431$ b. Interest on the Total Pension Liability 413,118c. Differences between Expected and Actual Experience 70,883d. Changes of Assumptions 63,356e. Employee Contributions (17,370)f. Projected Earnings on Pension Plan Investments (284,669)g. Differences between Projected and Actual Earnings on Plan Investments (125,076)h. Pension Plan Administrative Expenses 5,937i. Payment of Interest on TDA Fixed Funds 135,421j. Other Changes in Fiduciary Net Position (123)
Subtotal 388,908
k. Changes in Proportionate Share (187,152)
Total Pension Expense 201,756$
Governmental Accounting Standards Board Statements No. 67 and No. 68 (GASB 67/68)
Components of Pension Expense for the Fiscal Year Ended June 30, 2016Wildcat Charter School
NEW YORK CITY TEACHERS' RETIREMENT SYSTEM (TRS)

Appendix BPage 4c
NYC Office of the Actuary October 11, 2016
Component DEPT. OF ED. SENIOR COLL. COMM. COLL. BWC FUT. LEAD. H. TUBMAN
a. Service Cost 1,178,463,689$ 31,068,210$ 11,350,905$ 207,937$ 73,389$ 122,316$ b. Interest on the Total Pension Liability 3,879,986,703 102,289,314 37,371,844 684,614 241,628 402,714c. Differences between Expected and Actual Experience 374,449,312 9,871,725 3,606,678 66,071 23,319 38,865d. Changes of Assumptions 0 0 0 0 0 0e. Employee Contributions (152,795,122) (4,028,186) (1,471,715) (26,960) (9,515) (15,859)f. Projected Earnings on Pension Plan Investments (2,887,783,053) (76,131,536) (27,814,986) (509,542) (179,838) (299,730)g. Differences between Projected and Actual Earnings on Plan Investments (1,568,560,829) (41,352,464) (15,108,302) (276,768) (97,683) (162,805)h. Pension Plan Administrative Expenses 56,257,394 1,483,131 541,868 9,926 3,503 5,839i. Payment of Interest on TDA Fixed Funds 1,203,349,978 31,724,295 11,590,609 212,328 74,939 124,899j. Other Changes in Fiduciary Net Position (316,977) (8,357) (3,053) (56) (20) (33)k. Changes in Proportionate Share (511,675) 2,430,456 447,716 (63,960) (191,878) (127,918)
Total Pension Expense 2,082,539,420$ 57,346,588$ 20,511,564$ 303,590$ (62,156)$ 88,288$
Component KIPP ACAD. KIPP AMP KIPP INF. OPPOR. REN. UFT
a. Service Cost 195,705$ 12,232$ 220,168$ 293,558$ 281,326$ 415,874$ b. Interest on the Total Pension Liability 644,342 40,271 724,885 966,513 926,242 1,369,227c. Differences between Expected and Actual Experience 62,184 3,887 69,957 93,276 89,390 132,141d. Changes of Assumptions 0 0 0 0 0 0e. Employee Contributions (25,374) (1,586) (28,546) (38,062) (36,476) (53,921)f. Projected Earnings on Pension Plan Investments (479,569) (29,973) (539,515) (719,353) (689,380) (1,019,084)g. Differences between Projected and Actual Earnings on Plan Investments (260,488) (16,280) (293,049) (390,732) (374,451) (553,537)h. Pension Plan Administrative Expenses 9,343 584 10,510 14,014 13,430 19,853i. Payment of Interest on TDA Fixed Funds 199,838 12,490 224,818 299,757 287,267 424,656j. Other Changes in Fiduciary Net Position (53) (3) (59) (79) (76) (112)k. Changes in Proportionate Share (639,594) (191,878) (639,594) 319,796 (127,918) (511,675)
Total Pension Expense (293,666)$ (170,256)$ (250,425)$ 838,688$ 369,354$ 223,422$
Component UNIV PREP VOICE WILDCAT Total
a. Service Cost 195,705$ 110,084$ 146,779$ 1,223,157,877$ b. Interest on the Total Pension Liability 644,342 362,442 483,257 4,027,138,338c. Differences between Expected and Actual Experience 62,184 34,979 46,638 388,650,606d. Changes of Assumptions 0 0 0 0e. Employee Contributions (25,374) (14,273) (19,031) (158,590,000)f. Projected Earnings on Pension Plan Investments (479,569) (269,757) (359,677) (2,997,304,562)g. Differences between Projected and Actual Earnings on Plan Investments (260,488) (146,524) (195,366) (1,628,049,766)h. Pension Plan Administrative Expenses 9,343 5,255 7,007 58,391,000i. Payment of Interest on TDA Fixed Funds 199,838 112,409 149,879 1,248,988,000j. Other Changes in Fiduciary Net Position (53) (30) (39) (329,000)k. Changes in Proportionate Share (127,918) 0 (63,960) 0
Total Pension Expense 218,010$ 194,585$ 195,487$ 2,162,052,493$
NEW YORK CITY TEACHERS' RETIREMENT SYSTEM (TRS)
Governmental Accounting Standards Board Statements No. 67 and No. 68 (GASB 67/68)
Components of Pension Expense for the Fiscal Year Ended June 30, 2015 - By Obligor

Appendix BPage 4d
NYC Office of the Actuary October 11, 2016
Component DEPT. OF ED. SENIOR COLL. COMM. COLL. BWC FUT. LEAD. H. TUBMAN
a. Service Cost 1,223,577,662$ 35,413,015$ 13,456,691$ 101,945$ 89,202$ 127,431$ b. Interest on the Total Pension Liability 3,966,714,798 114,805,408 43,625,229 330,494 289,182 413,118c. Differences between Expected and Actual Experience 680,614,661 19,698,478 7,485,280 56,707 49,618 70,883d. Changes of Assumptions 608,339,881 17,606,688 6,690,415 50,685 44,349 63,356e. Employee Contributions (166,781,161) (4,827,012) (1,834,230) (13,896) (12,159) (17,370)f. Projected Earnings on Pension Plan Investments (2,733,367,273) (79,109,631) (30,061,090) (227,736) (199,269) (284,669)g. Differences between Projected and Actual Earnings on Plan Investments (1,200,971,403) (34,758,741) (13,208,071) (100,061) (87,554) (125,076)h. Pension Plan Administrative Expenses 57,003,599 1,649,809 626,916 4,749 4,156 5,937i. Payment of Interest on TDA Fixed Funds 1,300,296,019 37,633,413 14,300,426 108,337 94,794 135,421j. Other Changes in Fiduciary Net Position (1,183,915) (34,265) (13,020) (99) (86) (123)k. Changes in Proportionate Share (20,653,473) 17,151,833 8,331,968 (618,322) (130,283) (127,918)
Total Pension Expense 3,713,589,395$ 125,228,995$ 49,400,514$ (307,197)$ 141,950$ 260,990$
Component KIPP ACAD. KIPP AMP KIPP INF. OPPOR. REN. UFT
a. Service Cost 229,375$ 12,743$ 216,632$ 165,660$ 267,605$ 267,605$ b. Interest on the Total Pension Liability 743,612 41,312 702,300 537,053 867,547 867,547c. Differences between Expected and Actual Experience 127,590 7,088 120,502 92,148 148,855 148,855d. Changes of Assumptions 114,041 6,336 107,706 82,363 133,048 133,048e. Employee Contributions (31,265) (1,737) (29,528) (22,580) (36,476) (36,476)f. Projected Earnings on Pension Plan Investments (512,405) (28,467) (483,938) (370,070) (597,806) (597,806)g. Differences between Projected and Actual Earnings on Plan Investments (225,138) (12,508) (212,630) (162,599) (262,661) (262,661)h. Pension Plan Administrative Expenses 10,686 594 10,092 7,718 12,467 12,467i. Payment of Interest on TDA Fixed Funds 243,757 13,542 230,215 176,047 284,383 284,383j. Other Changes in Fiduciary Net Position (222) (12) (210) (160) (259) (259)k. Changes in Proportionate Share (516,402) (191,878) (701,189) (357,757) (251,110) (1,312,420)
Total Pension Expense 183,629$ (152,987)$ (40,048)$ 147,823$ 565,593$ (495,717)$
Component UNIV PREP VOICE WILDCAT Total
a. Service Cost 152,917$ 101,945$ 127,431$ 1,274,307,859$ b. Interest on the Total Pension Liability 495,741 330,494 413,118 4,131,176,953c. Differences between Expected and Actual Experience 85,060 56,707 70,883 708,833,315d. Changes of Assumptions 76,027 50,685 63,356 633,561,984e. Employee Contributions (20,844) (13,896) (17,370) (173,696,000)f. Projected Earnings on Pension Plan Investments (341,603) (227,736) (284,669) (2,846,694,168)g. Differences between Projected and Actual Earnings on Plan Investments (150,092) (100,061) (125,076) (1,250,764,332)h. Pension Plan Administrative Expenses 7,124 4,749 5,937 59,367,000i. Payment of Interest on TDA Fixed Funds 162,505 108,337 135,421 1,354,207,000j. Other Changes in Fiduciary Net Position (148) (99) (123) (1,233,000)k. Changes in Proportionate Share (374,302) (61,595) (187,152) 0
Total Pension Expense 92,385$ 249,530$ 201,756$ 3,889,066,611$
NEW YORK CITY TEACHERS' RETIREMENT SYSTEM (TRS)
Governmental Accounting Standards Board Statements No. 67 and No. 68 (GASB 67/68)
Components of Pension Expense for the Fiscal Year Ended June 30, 2016 - By Obligor

Appendix BPage 5a
NYC Office of the Actuary October 11, 2016
For the Fiscal Year ended June 30, 2013, the Obligors recognized Pension Expense for TRS of $3,041,839,656.
At June 30, 2013, the Obligors reported total Deferred Outflows of Resources and Deferred Inflows of Resources related to pensions for TRS from the following sources:
Deferred DeferredOutflows Inflows
of Resources of Resources
Differences between Expected and Actual Experience 0$ 0$
Changes of Assumptions 0 0
Net Difference between Projected and Actual Earnings on Pension Plan Investments 0 2,482,827,189
Total 0$ 2,482,827,189$
Amounts reported as Deferred Outflows of Resources and Deferred Inflows of Resources related to Pensions for TRS will be recognized in Pension Expense as follows:
Fiscal YearEnded June 30 Amount2013 (620,706,797)$ 2014 (620,706,797)2015 (620,706,797)2016 (620,706,797)2017 (620,706,798)
NEW YORK CITY TEACHERS' RETIREMENT SYSTEM (TRS)
Governmental Accounting Standards Board Statements No. 67 and No. 68 (GASB 67/68)
Pension Expense, Deferred Outflows of Resources, Deferred Inflows of Resources

Appendix BPage 5b
NYC Office of the Actuary October 11, 2016
For the Fiscal Year ended June 30, 2014, the Obligors recognized Pension Expense for TRS of $1,733,023,169.
For June 30, 2014, the Obligors determined Deferred Outflows of Resources and Deferred Inflows of Resources related to pensions for TRS from the following sources:
Deferred DeferredOutflows Inflows
of Resources of Resources
Differences between Expected and Actual Experience 0$ 0$
Changes of Assumptions 0 0
Net Difference between Projected and Actual Earnings on Pension Plan Investments 0 5,137,672,325
Total 0$ 5,137,672,325$
Amounts reported as Deferred Outflows of Resources and Deferred Inflows of Resources related to Pensions for TRS will be recognized in Pension Expense as follows:
Fiscal YearEnded June 30 Amount2014 (1,284,418,081)$ 2015 (1,284,418,081)2016 (1,284,418,081)2017 (1,284,418,081)2018 (1,284,418,082)
NEW YORK CITY TEACHERS' RETIREMENT SYSTEM (TRS)
Governmental Accounting Standards Board Statements No. 67 and No. 68 (GASB 67/68)
Pension Expense, Deferred Outflows of Resources, Deferred Inflows of Resources

Appendix BPage 5c
NYC Office of the Actuary October 11, 2016
For the Fiscal Year ended June 30, 2015, the Obligors recognized Pension Expense for TRS of $2,162,052,493
For June 30, 2015, the Obligors determined Deferred Outflows of Resources and Deferred Inflows of Resources related to pensions for TRS from the following sources:
Deferred DeferredOutflows Inflows
of Resources of Resources
Differences between Expected and Actual Experience 1,119,313,745$ 0$
Changes of Assumptions 0 0
Net Difference between Projected and Actual Earnings on Pension Plan Investments 1,108,300,450 0
Total 2,227,614,195$ 0$
Amounts reported as Deferred Outflows of Resources and Deferred Inflows of Resources related to Pensions for TRS will be recognized in Pension Expense as follows:
Fiscal YearEnded June 30 Amount2015 665,725,718$ 2016 665,725,718$ 2017 665,725,718$ 2018 619,087,645$ 2019 277,075,114$
NEW YORK CITY TEACHERS' RETIREMENT SYSTEM (TRS)
Governmental Accounting Standards Board Statements No. 67 and No. 68 (GASB 67/68)
Pension Expense, Deferred Outflows of Resources, Deferred Inflows of Resources

Appendix BPage 5d
NYC Office of the Actuary October 11, 2016
For the Fiscal Year ended June 30, 2016, the Obligors recognized Pension Expense for TRS of $3,889,066,611.
For June 30, 2016, the Obligors determined Deferred Outflows of Resources and Deferred Inflows of Resources related to pensions for TRS from the following sources:
Deferred DeferredOutflows Inflows
of Resources of Resources
Differences between Expected and Actual Experience 909,318,893$ 0$
Changes of Assumptions 1,799,316,033 0
Net Difference between Projected and Actual Earnings on Pension Plan Investments 1,509,141,734 0
Total 4,217,776,660$ 0$
Amounts reported as Deferred Outflows of Resources and Deferred Inflows of Resources related to Pensions for TRS will be recognized in Pension Expense as follows:
Fiscal YearEnded June 30 Amount2016 1,331,030,127$ 2017 1,331,030,127$ 2018 1,331,030,127$ 2019 1,178,430,974$ 2020 377,285,432$
NEW YORK CITY TEACHERS' RETIREMENT SYSTEM (TRS)
Governmental Accounting Standards Board Statements No. 67 and No. 68 (GASB 67/68)
Pension Expense, Deferred Outflows of Resources, Deferred Inflows of Resources

Appendix BPage 5e
NYC Office of the Actuary October 11, 2016
For the Fiscal Year ended June 30, 2016, the Obligors recognized Pension Expense for TRS of $3,889,066,611.
At June 30, 2016, the Obligors reported total Deferred Outflows of Resources and Deferred Inflows of Resources related to pensions for TRS from the following sources:
Deferred DeferredOutflows Inflows
of Resources of Resources
Differences between Expected and Actual Experience 1,639,982,032$ 0$
Changes of Assumptions 1,799,316,033$ 0
Net Difference between Projected and Actual Earnings on Pension Plan Investments 2,340,367,072$ 3,189,542,961
Total 5,779,665,137$ 3,189,542,961$
Amounts reported as Deferred Outflows of Resources and Deferred Inflows of Resources related to Pensions for TRS will be recognized in Pension Expense as follows:
Fiscal YearEnded June 30 Amount2016 91,630,967$ 2017 91,630,966$ 2018 665,699,690$ 2019 1,455,506,088$ 2020 377,285,432$
NEW YORK CITY TEACHERS' RETIREMENT SYSTEM (TRS)
Governmental Accounting Standards Board Statements No. 67 and No. 68 (GASB 67/68)
Pension Expense, Deferred Outflows of Resources, Deferred Inflows of Resources
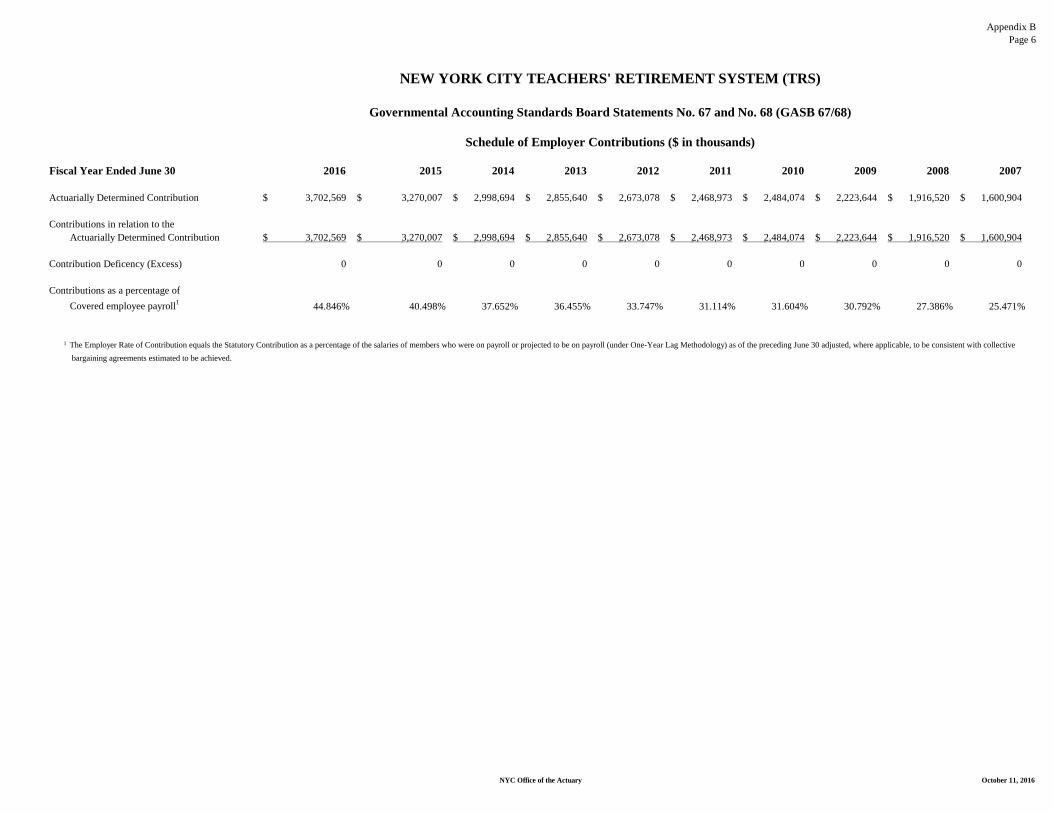
Appendix BPage 6
NYC Office of the Actuary October 11, 2016
NEW YORK CITY TEACHERS' RETIREMENT SYSTEM (TRS)
Governmental Accounting Standards Board Statements No. 67 and No. 68 (GASB 67/68)
Schedule of Employer Contributions ($ in thousands)
Fiscal Year Ended June 30 2016 2015 2014 2013 2012 2011 2010 2009 2008 2007
Actuarially Determined Contribution 3,702,569$ 3,270,007$ 2,998,694$ 2,855,640$ 2,673,078$ 2,468,973$ 2,484,074$ 2,223,644$ 1,916,520$ 1,600,904$
Contributions in relation to the Actuarially Determined Contribution 3,702,569$ 3,270,007$ 2,998,694$ 2,855,640$ 2,673,078$ 2,468,973$ 2,484,074$ 2,223,644$ 1,916,520$ 1,600,904$
Contribution Deficency (Excess) 0 0 0 0 0 0 0 0 0 0
Contributions as a percentage of Covered employee payroll1 44.846% 40.498% 37.652% 36.455% 33.747% 31.114% 31.604% 30.792% 27.386% 25.471%
1 The Employer Rate of Contribution equals the Statutory Contribution as a percentage of the salaries of members who were on payroll or projected to be on payroll (under One-Year Lag Methodology) as of the preceding June 30 adjusted, where applicable, to be consistent with collective bargaining agreements estimated to be achieved.

Appendix BPage 7
NYC Office of the Actuary October 11, 2016
NEW YORK CITY TEACHERS' RETIREMENT SYSTEM (TRS)
Governmental Accounting Standards Board Statements No. 67 and No. 68 (GASB 67/68)
Statement of Fiduciary Net Position - QPP OnlyJune 30, 2016 and June 30, 2015
(Dollar amounts in thousands)
June 30, 2016 June 30, 2015ASSETS
Cash 5,157$ 22,674$
Receivables:Investment securities sold 1,772,521 2,766,976Member loans 275,704 257,043Accrued interest and dividends 151,330 145,968Other 0 0
Total receivables 2,199,555$ 3,169,987$
Investments - at fair valuePooled NYC Pension Fund Assets (Fixed-Return Fund):
Short-term investments:Short-term investment fund 1,025,446 1,240,601Commercial paper 1,070,574 1,557,628Discount notes 83,294 980,831U.S. Treasury bills and agencies 0 24,960
Debt securities:U.S. Government 5,924,318 6,932,469Corporate 8,730,691 8,003,971Yankee bonds 0 0Foreign 0 0
Equities:Domestic 22,284,584 21,988,143Private equity 6,872,850 6,002,260Private equity real estate 0 0
Mutual Funds:International equity 11,507,149 11,615,671Fixed investment 1,691,577 1,656,668Domestic equity 0 0Mortgage debt security 485,191 406,054Treasury inflation protected securities 2,399,270 1,393,516Promissory Notes 0 0
Diversified Equity Funds:Short-term investments 29,570 33,499Equity Securities 2,206,416 2,798,742Corporate Bonds 50,541 62,026
Bond Funds:Short-term investments 432 673Corporate Bonds 24,393 35,113
Internation Equity Funds:Short-term investments 75 124Equity Securities 8,012 10,669
Inflation Protection Funds:Short-term investments 12 10Equity Securities 3,960 4,791
Socially Responsive Equity Funds:Short-term investments 24 461Equity Securities 7,650 7,576International - equity 158 233
Collateral from securities lending (Fixed and Variable-Return Funds) 1,858,682 1,863,922
Total Investments 66,264,869$ 66,620,611$
Other assets 49,873 27,855
Total assets 68,519,454$ 69,841,127$
LIABILITIESAccounts payable 417,408 391,945Payables for investment securities purchased 2,308,523 4,616,284Accrued benefits payable 12,563 14,979Due to TDA Program 20,292,733 18,699,332Securities lending 1,858,682 1,863,923
Total liabilities 24,889,909$ 25,586,463$
Plan Net Position Held in Trust for Benefits 43,629,545$ 44,254,664$

Appendix BPage 8
NYC Office of the Actuary October 11, 2016
NEW YORK CITY TEACHERS' RETIREMENT SYSTEM (TRS)
Governmental Accounting Standards Board Statements No. 67 and No. 68 (GASB 67/68)
Statement of Changes in Fiduciary Net Position - QPP OnlyJune 30, 2016 and June 30, 2015
(Dollar amounts in thousands)
Fixed Variable Fixed VariableADDITIONS
Contributions:Member Contributions 173,287$ 409$ 158,124$ 466$ Employer Contributions 3,760,674 40 3,325,474 54
Total contributions 3,933,961$ 449$ 3,483,598$ 520$
Investment income:Interest income 857,408 2,815 755,597 2,929Dividend income 829,050 67,158 820,415 68,816Net appreciation (depreciation) in fair value (505,410) (93,033) 64,567 82,266
Total investment income 1,181,048$ (23,060)$ 1,640,579$ 154,011$
Less:Investment expenses 216,240 (1,172) 202,504 457
Net income 964,808 (21,888) 1,438,075 153,554
Securities lending transactions:Securities lending income 17,530 1,212 20,359 1,354Securities lending fees (1,279) (116) (1,279) (134)
Net securities lending income 16,251 1,096 19,080 1,220
Net investment income 981,059 (20,792) 1,457,155 154,774Other:
Net receipts from other retirement systems 1,233 0 329 0Transfers between Funds 25,535 (25,535) 30,057 (30,057)Litigation income 0 0 0 0
Total additions 4,941,788$ (45,878)$ 4,971,139$ 125,237$
DEDUCTIONSBenefit payments and withdrawals 3,551,588 555,867 3,423,816 600,456Interest to TDA Fixed Funds 1,354,207 0 1,248,988 0Administrative expenses 47,583 11,784 46,243 12,148
Total deductions 4,953,378$ 567,651$ 4,719,047$ 612,604$
INCREASE IN PLAN NET POSITION (11,590) (613,529) 252,092 (487,367)
PLAN NET POSITION HELD IN TRUST FOR BENEFITS:Beginning of year 41,452,046$ 2,802,618$ 41,199,954$ 3,289,985$
End of year 41,440,456$ 2,189,089$ 41,452,046$ 2,802,618$
June 30, 2016 June 30, 2015

Appendix BPage 9
NYC Office of the Actuary October 11, 2016
Long-Term Expected Rate of Return
Long-TermTarget ExpectedAsset Real Rate
Asset Class Allocation of Return
U.S. Public Market Equities 34.00% 6.60%
International Public Market Equities 9.00% 7.00%
Emerging Public Market Equities 8.00% 7.90%
Private Market Equities 6.00% 9.90%
Fixed Income (Core, TIPS, HY, Opportunistic, Convertibles) 37.00% 2.70%
Alternatives (Real Assets, Hedge Funds) 6.00% 4.00%
Total 100.0%
NEW YORK CITY TEACHERS' RETIREMENT SYSTEM (TRS)
Governmental Accounting Standards Board Statements No. 67 and No. 68 (GASB 67/68)
The Long-Term Expected Rate of Return (LTEROR) assumption on pension fund investments was determined using a Building-Block Method in which best-estimate ranges of Expected Real Rates of Return (i.e., Expected Returns, net of pension fundinvestment expenses and inflation) are developed for each major asset class. These ranges are combined to produce the LTERORby weighting the Expected Real Rates of Return (RROR) by the Target Asset Allocation percentage and by adding ExpectedInflation. The Target Asset Allocation and best estimates of Arithmetic Real Rates of Return for each major asset class aresummarized in the following table:
The Discount Rate used to measure the Total Pension Liability was 7.0% per annum. The projection of Cash Flows used todetermine the Discount Rate assumes that employee contributions will be made at the rates applicable to the current Tier for eachmember and that employer contributions will be made at rates as determined by the Actuary. Based on those assumptions, thepension fund's Fiduciary Net Position is projected to be available to make all projected future benefit payments of current activeand non-active members. Therefore, the Long-Term Expected Rate of Return on pension fund investments was applied to allperiods of projected benefit payments to determine the Total Pension Liability.

Appendix BPage 10a
NYC Office of the Actuary October 11, 2016
2015Actual Employer
Employer AllocationEmployer Contributions Percentage
Department of Education 3,150,517,734$ 96.346%
CUNY Senior Colleges 83,042,543 2.540%
CUNY Community Colleges 30,346,848 0.928%
Beginning with Children Charter School 558,630 0.017%
Future Leaders Charter School 211,787 0.006%
Harriet Tubman Charter School 338,413 0.010%
KIPP Academy Charter School 521,231 0.016%
KIPP AMP Charter School 17,503 0.001%
KIPP Infinity Charter School 591,142 0.018%
Opportunity Charter School 777,022 0.024%
Renaissance Charter School 766,772 0.023%
UFT Charter School 1,095,508 0.034%
University Prep Charter High School 532,089 0.016%
Voice Charter School 281,686 0.009%
Wildcat Charter School 408,012 0.012%
Total 3,270,006,920$ 100.0000%
NEW YORK CITY TEACHERS' RETIREMENT SYSTEM (TRS)
Governmental Accounting Standards Board Statements No. 67 and No. 68 (GASB 67/68)
Schedule of Employer AllocationsJune 30, 2015

Appendix BPage 10b
NYC Office of the Actuary October 11, 2016
2014Actual Employer
Employer AllocationEmployer Contributions Percentage
Department of Education 3,555,209,676$ 96.019%
CUNY Senior Colleges 102,884,499 2.779%
CUNY Community Colleges 39,091,625 1.056%
Beginning with Children Charter School 304,651 0.008%
Future Leaders Charter School 244,310 0.007%
Harriet Tubman Charter School 357,001 0.010%
KIPP Academy Charter School 657,607 0.018%
KIPP AMP Charter School 28,955 0.001%
KIPP Infinity Charter School 635,937 0.017%
Opportunity Charter School 472,731 0.013%
Renaissance Charter School 793,034 0.021%
UFT Charter School 770,823 0.021%
University Prep Charter High School 450,478 0.012%
Voice Charter School 313,675 0.008%
Wildcat Charter School 354,100 0.010%
Total 3,702,569,102$ 100.0000%
NEW YORK CITY TEACHERS' RETIREMENT SYSTEM (TRS)
Governmental Accounting Standards Board Statements No. 67 and No. 68 (GASB 67/68)
Schedule of Employer AllocationsJune 30, 2016

Appendix BPage 11a
NYC Office of the Actuary October 11, 2016
NEW YORK CITY TEACHERS' RETIREMENT SYSTEM (TRS)
Governmental Accounting Standards Board Statements No. 67 and No. 68 (GASB 67/68)
Increase (Decrease) in Pension Expense Arising from the Recognition of Differencesbetween Projected and Actual Earnings on Pension Plan Investments
Differencesbetween Projected
and ActualEarnings on RecognitionPension Plan Period
Year Investments (Years) 2013 2014 2015 2016 2017 2018 2019 20202013 (3,103,533,986)$ 5 (620,706,797) (620,706,797) (620,706,797) (620,706,797) (620,706,798)2014 (6,422,090,406)$ 5 (1,284,418,081) (1,284,418,081) (1,284,418,081) (1,284,418,081) (1,284,418,082)2015 1,385,375,562$ 5 277,075,112 277,075,112 277,075,112 277,075,112 277,075,1142016 1,886,427,168 5 377,285,434 377,285,434 377,285,434 377,285,434 377,285,432201720182019
Net increase (decrease) in Pension Expense (620,706,797)$ (1,905,124,878)$ (1,628,049,766)$ (1,250,764,332)$ (1,250,764,333)$ (630,057,536)$ 654,360,548$ 377,285,432$

Appendix BPage 11b
NYC Office of the Actuary October 11, 2016
NEW YORK CITY TEACHERS' RETIREMENT SYSTEM (TRS)
Governmental Accounting Standards Board Statements No. 67 and No. 68 (GASB 67/68)
Increase (Decrease) in Pension Expense Arising from the Recognition of Differencesbetween Expected and Actual Experience
Differencesbetween Expected Recognition
and Actual PeriodYear Experience (Years) 2015 2016 2017 2018 20192015 1,507,964,351$ 3.88 388,650,606 388,650,606 388,650,606 342,012,533 02016 1,229,501,602$ 3.84 320,182,709 320,182,709 320,182,709 268,953,475 2017201820192020
Net increase (decrease) in Pension Expense 388,650,606$ 708,833,315$ 708,833,315$ 662,195,242$ 268,953,475$

Appendix BPage 11c
NYC Office of the Actuary October 11, 2016
NEW YORK CITY TEACHERS' RETIREMENT SYSTEM (TRS)
Governmental Accounting Standards Board Statements No. 67 and No. 68 (GASB 67/68)
Increase (Decrease) in Pension Expense Arising from the Recognition ofChanges in Assumptions
Differencesbetween Expected Recognition
and Actual PeriodYear Experience (Years) 2016 2017 2018 2019 20202016 2,432,878,017$ 3.84 633,561,984 633,561,984 633,561,984 532,192,065 - 2017201820192020
Net increase (decrease) in Pension Expense 633,561,984$ 633,561,984$ 633,561,984$ 532,192,065$ -$
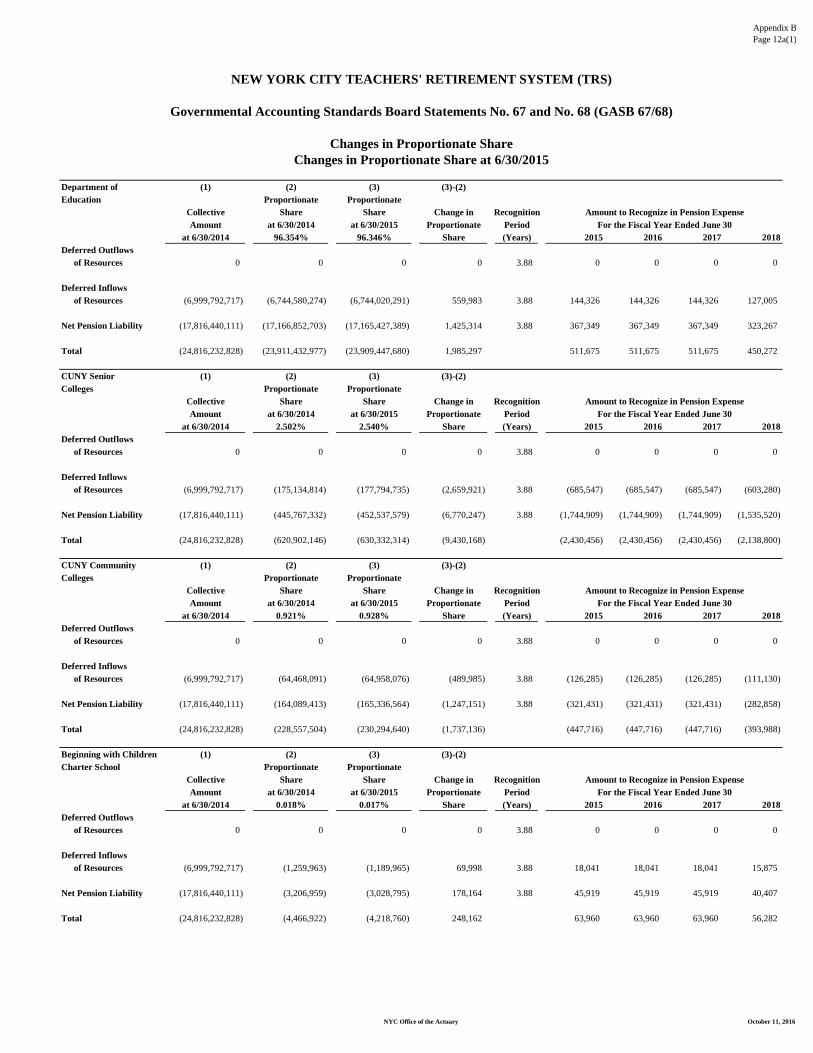
Appendix BPage 12a(1)
NYC Office of the Actuary October 11, 2016
Department of (1) (2) (3) (3)-(2)Education Proportionate Proportionate
Collective Share Share Change in RecognitionAmount at 6/30/2014 at 6/30/2015 Proportionate Period
at 6/30/2014 96.354% 96.346% Share (Years) 2015 2016 2017 2018Deferred Outflows
of Resources 0 0 0 0 3.88 0 0 0 0
Deferred Inflowsof Resources (6,999,792,717) (6,744,580,274) (6,744,020,291) 559,983 3.88 144,326 144,326 144,326 127,005
Net Pension Liability (17,816,440,111) (17,166,852,703) (17,165,427,389) 1,425,314 3.88 367,349 367,349 367,349 323,267
Total (24,816,232,828) (23,911,432,977) (23,909,447,680) 1,985,297 511,675 511,675 511,675 450,272
CUNY Senior (1) (2) (3) (3)-(2)Colleges Proportionate Proportionate
Collective Share Share Change in RecognitionAmount at 6/30/2014 at 6/30/2015 Proportionate Period
at 6/30/2014 2.502% 2.540% Share (Years) 2015 2016 2017 2018Deferred Outflows
of Resources 0 0 0 0 3.88 0 0 0 0
Deferred Inflowsof Resources (6,999,792,717) (175,134,814) (177,794,735) (2,659,921) 3.88 (685,547) (685,547) (685,547) (603,280)
Net Pension Liability (17,816,440,111) (445,767,332) (452,537,579) (6,770,247) 3.88 (1,744,909) (1,744,909) (1,744,909) (1,535,520)
Total (24,816,232,828) (620,902,146) (630,332,314) (9,430,168) (2,430,456) (2,430,456) (2,430,456) (2,138,800)
CUNY Community (1) (2) (3) (3)-(2)Colleges Proportionate Proportionate
Collective Share Share Change in RecognitionAmount at 6/30/2014 at 6/30/2015 Proportionate Period
at 6/30/2014 0.921% 0.928% Share (Years) 2015 2016 2017 2018Deferred Outflows
of Resources 0 0 0 0 3.88 0 0 0 0
Deferred Inflowsof Resources (6,999,792,717) (64,468,091) (64,958,076) (489,985) 3.88 (126,285) (126,285) (126,285) (111,130)
Net Pension Liability (17,816,440,111) (164,089,413) (165,336,564) (1,247,151) 3.88 (321,431) (321,431) (321,431) (282,858)
Total (24,816,232,828) (228,557,504) (230,294,640) (1,737,136) (447,716) (447,716) (447,716) (393,988)
Beginning with Children (1) (2) (3) (3)-(2)Charter School Proportionate Proportionate
Collective Share Share Change in RecognitionAmount at 6/30/2014 at 6/30/2015 Proportionate Period
at 6/30/2014 0.018% 0.017% Share (Years) 2015 2016 2017 2018Deferred Outflows
of Resources 0 0 0 0 3.88 0 0 0 0
Deferred Inflowsof Resources (6,999,792,717) (1,259,963) (1,189,965) 69,998 3.88 18,041 18,041 18,041 15,875
Net Pension Liability (17,816,440,111) (3,206,959) (3,028,795) 178,164 3.88 45,919 45,919 45,919 40,407
Total (24,816,232,828) (4,466,922) (4,218,760) 248,162 63,960 63,960 63,960 56,282
Changes in Proportionate Share at 6/30/2015
For the Fiscal Year Ended June 30
Amount to Recognize in Pension ExpenseFor the Fiscal Year Ended June 30
Amount to Recognize in Pension ExpenseFor the Fiscal Year Ended June 30
Amount to Recognize in Pension Expense
NEW YORK CITY TEACHERS' RETIREMENT SYSTEM (TRS)
Governmental Accounting Standards Board Statements No. 67 and No. 68 (GASB 67/68)
Changes in Proportionate Share
Amount to Recognize in Pension ExpenseFor the Fiscal Year Ended June 30

Appendix BPage 12a(2)
NYC Office of the Actuary October 11, 2016
Changes in Proportionate Share at 6/30/2015
NEW YORK CITY TEACHERS' RETIREMENT SYSTEM (TRS)
Governmental Accounting Standards Board Statements No. 67 and No. 68 (GASB 67/68)
Changes in Proportionate Share
Future Leaders (1) (2) (3) (3)-(2)Charter School Proportionate Proportionate
Collective Share Share Change in RecognitionAmount at 6/30/2014 at 6/30/2015 Proportionate Period
at 6/30/2014 0.009% 0.006% Share (Years) 2015 2016 2017 2018Deferred Outflows
of Resources 0 0 0 0 3.88 0 0 0 0
Deferred Inflowsof Resources (6,999,792,717) (629,981) (419,988) 209,993 3.88 54,122 54,122 54,122 47,627
Net Pension Liability (17,816,440,111) (1,603,480) (1,068,986) 534,494 3.88 137,756 137,756 137,756 121,226
Total (24,816,232,828) (2,233,461) (1,488,974) 744,487 191,878 191,878 191,878 168,853
Harriet Tubman (1) (2) (3) (3)-(2)Charter School Proportionate Proportionate
Collective Share Share Change in RecognitionAmount at 6/30/2014 at 6/30/2015 Proportionate Period
at 6/30/2014 0.012% 0.010% Share (Years) 2015 2016 2017 2018Deferred Outflows
of Resources 0 0 0 0 3.88 0 0 0 0
Deferred Inflowsof Resources (6,999,792,717) (839,975) (699,979) 139,996 3.88 36,081 36,081 36,081 31,753
Net Pension Liability (17,816,440,111) (2,137,973) (1,781,644) 356,329 3.88 91,837 91,837 91,837 80,818
Total (24,816,232,828) (2,977,948) (2,481,623) 496,325 127,918 127,918 127,918 112,571
KIPP Academy (1) (2) (3) (3)-(2)Charter School Proportionate Proportionate
Collective Share Share Change in RecognitionAmount at 6/30/2014 at 6/30/2015 Proportionate Period
at 6/30/2014 0.026% 0.016% Share (Years) 2015 2016 2017 2018Deferred Outflows
of Resources 0 0 0 0 3.88 0 0 0 0
Deferred Inflowsof Resources (6,999,792,717) (1,819,946) (1,119,967) 699,979 3.88 180,407 180,407 180,407 158,758
Net Pension Liability (17,816,440,111) (4,632,274) (2,850,630) 1,781,644 3.88 459,187 459,187 459,187 404,083
Total (24,816,232,828) (6,452,220) (3,970,597) 2,481,623 639,594 639,594 639,594 562,841
KIPP AMP (1) (2) (3) (3)-(2)Charter School Proportionate Proportionate
Collective Share Share Change in RecognitionAmount at 6/30/2014 at 6/30/2015 Proportionate Period
at 6/30/2014 0.004% 0.001% Share (Years) 2015 2016 2017 2018Deferred Outflows
of Resources 0 0 0 0 3.88 0 0 0 0
Deferred Inflowsof Resources (6,999,792,717) (279,992) (69,998) 209,994 3.88 54,122 54,122 54,122 47,628
Net Pension Liability (17,816,440,111) (712,658) (178,164) 534,494 3.88 137,756 137,756 137,756 121,226
Total (24,816,232,828) (992,650) (248,162) 744,488 191,878 191,878 191,878 168,854
For the Fiscal Year Ended June 30Amount to Recognize in Pension Expense
Amount to Recognize in Pension ExpenseFor the Fiscal Year Ended June 30
Amount to Recognize in Pension ExpenseFor the Fiscal Year Ended June 30
Amount to Recognize in Pension ExpenseFor the Fiscal Year Ended June 30

Appendix BPage 12a(3)
NYC Office of the Actuary October 11, 2016
Changes in Proportionate Share at 6/30/2015
NEW YORK CITY TEACHERS' RETIREMENT SYSTEM (TRS)
Governmental Accounting Standards Board Statements No. 67 and No. 68 (GASB 67/68)
Changes in Proportionate Share
KIPP Infinity (1) (2) (3) (3)-(2)Charter School Proportionate Proportionate
Collective Share Share Change in RecognitionAmount at 6/30/2014 at 6/30/2015 Proportionate Period
at 6/30/2014 0.028% 0.018% Share (Years) 2015 2016 2017 2018Deferred Outflows
of Resources 0 0 0 0 3.88 0 0 0 0
Deferred Inflowsof Resources (6,999,792,717) (1,959,942) (1,259,963) 699,979 3.88 180,407 180,407 180,407 158,758
Net Pension Liability (17,816,440,111) (4,988,603) (3,206,959) 1,781,644 3.88 459,187 459,187 459,187 404,083
Total (24,816,232,828) (6,948,545) (4,466,922) 2,481,623 639,594 639,594 639,594 562,841
Opportunity (1) (2) (3) (3)-(2)Charter School Proportionate Proportionate
Collective Share Share Change in RecognitionAmount at 6/30/2014 at 6/30/2015 Proportionate Period
at 6/30/2014 0.019% 0.024% Share (Years) 2015 2016 2017 2018Deferred Outflows
of Resources 0 0 0 0 3.88 0 0 0 0
Deferred Inflowsof Resources (6,999,792,717) (1,329,961) (1,679,950) (349,989) 3.88 (90,203) (90,203) (90,203) (79,380)
Net Pension Liability (17,816,440,111) (3,385,124) (4,275,946) (890,822) 3.88 (229,593) (229,593) (229,593) (202,043)
Total (24,816,232,828) (4,715,085) (5,955,896) (1,240,811) (319,796) (319,796) (319,796) (281,423)
Renaissance (1) (2) (3) (3)-(2)Charter School Proportionate Proportionate
Collective Share Share Change in RecognitionAmount at 6/30/2014 at 6/30/2015 Proportionate Period
at 6/30/2014 0.025% 0.023% Share (Years) 2015 2016 2017 2018Deferred Outflows
of Resources 0 0 0 0 3.88 0 0 0 0
Deferred Inflowsof Resources (6,999,792,717) (1,749,948) (1,609,952) 139,996 3.88 36,081 36,081 36,081 31,753
Net Pension Liability (17,816,440,111) (4,454,110) (4,097,781) 356,329 3.88 91,837 91,837 91,837 80,818
Total (24,816,232,828) (6,204,058) (5,707,733) 496,325 127,918 127,918 127,918 112,571
UFT (1) (2) (3) (3)-(2)Charter School Proportionate Proportionate
Collective Share Share Change in RecognitionAmount at 6/30/2014 at 6/30/2015 Proportionate Period
at 6/30/2014 0.042% 0.034% Share (Years) 2015 2016 2017 2018Deferred Outflows
of Resources 0 0 0 0 3.88 0 0 0 0
Deferred Inflowsof Resources (6,999,792,717) (2,939,913) (2,379,930) 559,983 3.88 144,326 144,326 144,326 127,005
Net Pension Liability (17,816,440,111) (7,482,905) (6,057,590) 1,425,315 3.88 367,349 367,349 367,349 323,268
Total (24,816,232,828) (10,422,818) (8,437,520) 1,985,298 511,675 511,675 511,675 450,273
For the Fiscal Year Ended June 30
Amount to Recognize in Pension ExpenseFor the Fiscal Year Ended June 30
Amount to Recognize in Pension ExpenseFor the Fiscal Year Ended June 30
Amount to Recognize in Pension ExpenseFor the Fiscal Year Ended June 30
Amount to Recognize in Pension Expense

Appendix BPage 12a(4)
NYC Office of the Actuary October 11, 2016
Changes in Proportionate Share at 6/30/2015
NEW YORK CITY TEACHERS' RETIREMENT SYSTEM (TRS)
Governmental Accounting Standards Board Statements No. 67 and No. 68 (GASB 67/68)
Changes in Proportionate Share
University Prep (1) (2) (3) (3)-(2)Charter High School Proportionate Proportionate
Collective Share Share Change in RecognitionAmount at 6/30/2014 at 6/30/2015 Proportionate Period
at 6/30/2014 0.018% 0.016% Share (Years) 2015 2016 2017 2018Deferred Outflows
of Resources 0 0 0 0 3.88 0 0 0 0
Deferred Inflowsof Resources (6,999,792,717) (1,259,963) (1,119,967) 139,996 3.88 36,081 36,081 36,081 31,753
Net Pension Liability (17,816,440,111) (3,206,959) (2,850,630) 356,329 3.88 91,837 91,837 91,837 80,818
Total (24,816,232,828) (4,466,922) (3,970,597) 496,325 127,918 127,918 127,918 112,571
Voice (1) (2) (3) (3)-(2)Charter School Proportionate Proportionate
Collective Share Share Change in RecognitionAmount at 6/30/2014 at 6/30/2015 Proportionate Period
at 6/30/2014 0.009% 0.009% Share (Years) 2015 2016 2017 2018Deferred Outflows
of Resources 0 0 0 0 3.88 0 0 0 0
Deferred Inflowsof Resources (6,999,792,717) (629,981) (629,981) 0 3.88 0 0 0 0
Net Pension Liability (17,816,440,111) (1,603,480) (1,603,480) 0 3.88 0 0 0 0
Total (24,816,232,828) (2,233,461) (2,233,461) 0 0 0 0 0
Wildcat (1) (2) (3) (3)-(2)Charter School Proportionate Proportionate
Collective Share Share Change in RecognitionAmount at 6/30/2014 at 6/30/2015 Proportionate Period
at 6/30/2014 0.013% 0.012% Share (Years) 2015 2016 2017 2018Deferred Outflows
of Resources 0 0 0 0 3.88 0 0 0 0
Deferred Inflowsof Resources (6,999,792,717) (909,973) (839,975) 69,998 3.88 18,041 18,041 18,041 15,875
Net Pension Liability (17,816,440,111) (2,316,137) (2,137,973) 178,164 3.88 45,919 45,919 45,919 40,407
Total (24,816,232,828) (3,226,110) (2,977,948) 248,162 63,960 63,960 63,960 56,282
For the Fiscal Year Ended June 30
Amount to Recognize in Pension ExpenseFor the Fiscal Year Ended June 30
Amount to Recognize in Pension ExpenseFor the Fiscal Year Ended June 30
Amount to Recognize in Pension Expense

Appendix BPage 12b(1)
NYC Office of the Actuary October 11, 2016
Department of (1) (2) (3) (3)-(2)Education Proportionate Proportionate
Collective Share Share Change in RecognitionAmount at 6/30/2015 at 6/30/2016 Proportionate Period
at 6/30/2015 96.346% 96.019% Share (Years) 2016 2017 2018 2019Deferred Outflows
of Resources 2,227,614,195 2,146,217,172 2,138,932,874 (7,284,298) 3.84 (1,896,953) (1,896,953) (1,896,953) (1,593,439)
Deferred Inflowsof Resources (5,094,667,839) (4,908,508,675) (4,891,849,112) 16,659,563 3.84 4,338,427 4,338,427 4,338,427 3,644,282
Net Pension Liability (20,785,703,677) (20,026,194,063) (19,958,224,814) 67,969,249 3.84 17,700,324 17,700,324 17,700,324 14,868,277
Total (23,652,757,321) (22,788,485,566) (22,711,141,052) 77,344,514 20,141,798 20,141,798 20,141,798 16,919,120
CUNY Senior (1) (2) (3) (3)-(2)Colleges Proportionate Proportionate
Collective Share Share Change in RecognitionAmount at 6/30/2015 at 6/30/2016 Proportionate Period
at 6/30/2015 2.540% 2.779% Share (Years) 2016 2017 2018 2019Deferred Outflows
of Resources 2,227,614,195 56,581,401 61,905,398 5,323,997 3.84 1,386,458 1,386,458 1,386,458 1,164,623
Deferred Inflowsof Resources (5,094,667,839) (129,404,563) (141,580,819) (12,176,256) 3.84 (3,170,900) (3,170,900) (3,170,900) (2,663,556)
Net Pension Liability (20,785,703,677) (527,956,873) (577,634,705) (49,677,832) 3.84 (12,936,935) (12,936,935) (12,936,935) (10,867,027)
Total (23,652,757,321) (600,780,035) (657,310,126) (56,530,091) (14,721,377) (14,721,377) (14,721,377) (12,365,960)
CUNY Community (1) (2) (3) (3)-(2)Colleges Proportionate Proportionate
Collective Share Share Change in RecognitionAmount at 6/30/2015 at 6/30/2016 Proportionate Period
at 6/30/2015 0.928% 1.056% Share (Years) 2016 2017 2018 2019Deferred Outflows
of Resources 2,227,614,195 20,672,260 23,523,606 2,851,346 3.84 742,538 742,538 742,538 623,732
Deferred Inflowsof Resources (5,094,667,839) (47,278,518) (53,799,692) (6,521,174) 3.84 (1,698,222) (1,698,222) (1,698,222) (1,426,508)
Net Pension Liability (20,785,703,677) (192,891,330) (219,497,031) (26,605,701) 3.84 (6,928,568) (6,928,568) (6,928,568) (5,819,997)
Total (23,652,757,321) (219,497,588) (249,773,117) (30,275,529) (7,884,252) (7,884,252) (7,884,252) (6,622,773)
Beginning with Children (1) (2) (3) (3)-(2)Charter School Proportionate Proportionate
Collective Share Share Change in RecognitionAmount at 6/30/2015 at 6/30/2016 Proportionate Period
at 6/30/2015 0.017% 0.008% Share (Years) 2016 2017 2018 2019Deferred Outflows
of Resources 2,227,614,195 378,694 178,209 (200,485) 3.84 (52,210) (52,210) (52,210) (43,855)
Deferred Inflowsof Resources (5,094,667,839) (866,094) (407,573) 458,521 3.84 119,407 119,407 119,407 100,300
Net Pension Liability (20,785,703,677) (3,533,570) (1,662,856) 1,870,714 3.84 487,165 487,165 487,165 409,219
Total (23,652,757,321) (4,020,970) (1,892,220) 2,128,750 554,362 554,362 554,362 465,664
Amount to Recognize in Pension Expense
Changes in Proportionate Share at 6/30/2016
NEW YORK CITY TEACHERS' RETIREMENT SYSTEM (TRS)
Governmental Accounting Standards Board Statements No. 67 and No. 68 (GASB 67/68)
Changes in Proportionate Share
Amount to Recognize in Pension Expense
For the Fiscal Year Ended June 30
For the Fiscal Year Ended June 30
For the Fiscal Year Ended June 30
For the Fiscal Year Ended June 30
Amount to Recognize in Pension Expense
Amount to Recognize in Pension Expense

Appendix BPage 12b(2)
NYC Office of the Actuary October 11, 2016
Changes in Proportionate Share at 6/30/2016
NEW YORK CITY TEACHERS' RETIREMENT SYSTEM (TRS)
Governmental Accounting Standards Board Statements No. 67 and No. 68 (GASB 67/68)
Changes in Proportionate Share
Future Leaders (1) (2) (3) (3)-(2)Charter School Proportionate Proportionate
Collective Share Share Change in RecognitionAmount at 6/30/2015 at 6/30/2016 Proportionate Period
at 6/30/2015 0.006% 0.007% Share (Years) 2016 2017 2018 2019Deferred Outflows
of Resources 2,227,614,195 133,657 155,933 22,276 3.84 5,801 5,801 5,801 4,873
Deferred Inflowsof Resources (5,094,667,839) (305,680) (356,627) (50,947) 3.84 (13,267) (13,267) (13,267) (11,146)
Net Pension Liability (20,785,703,677) (1,247,142) (1,454,999) (207,857) 3.84 (54,129) (54,129) (54,129) (45,470)
Total (23,652,757,321) (1,419,165) (1,655,693) (236,528) (61,595) (61,595) (61,595) (51,743)
Harriet Tubman (1) (2) (3) (3)-(2)Charter School Proportionate Proportionate
Collective Share Share Change in RecognitionAmount at 6/30/2015 at 6/30/2016 Proportionate Period
at 6/30/2015 0.010% 0.010% Share (Years) 2016 2017 2018 2019Deferred Outflows
of Resources 2,227,614,195 222,761 222,761 0 3.84 0 0 0 0
Deferred Inflowsof Resources (5,094,667,839) (509,467) (509,467) 0 3.84 0 0 0 0
Net Pension Liability (20,785,703,677) (2,078,570) (2,078,570) 0 3.84 0 0 0 0
Total (23,652,757,321) (2,365,276) (2,365,276) 0 0 0 0 0
KIPP Academy (1) (2) (3) (3)-(2)Charter School Proportionate Proportionate
Collective Share Share Change in RecognitionAmount at 6/30/2015 at 6/30/2016 Proportionate Period
at 6/30/2015 0.016% 0.018% Share (Years) 2016 2017 2018 2019Deferred Outflows
of Resources 2,227,614,195 356,418 400,971 44,553 3.84 11,602 11,602 11,602 9,747
Deferred Inflowsof Resources (5,094,667,839) (815,147) (917,040) (101,893) 3.84 (26,535) (26,535) (26,535) (22,288)
Net Pension Liability (20,785,703,677) (3,325,713) (3,741,427) (415,714) 3.84 (108,259) (108,259) (108,259) (90,937)
Total (23,652,757,321) (3,784,442) (4,257,496) (473,054) (123,192) (123,192) (123,192) (103,478)
KIPP AMP (1) (2) (3) (3)-(2)Charter School Proportionate Proportionate
Collective Share Share Change in RecognitionAmount at 6/30/2015 at 6/30/2016 Proportionate Period
at 6/30/2015 0.001% 0.001% Share (Years) 2016 2017 2018 2019Deferred Outflows
of Resources 2,227,614,195 22,276 22,276 0 3.84 0 0 0 0
Deferred Inflowsof Resources (5,094,667,839) (50,947) (50,947) 0 3.84 0 0 0 0
Net Pension Liability (20,785,703,677) (207,857) (207,857) 0 3.84 0 0 0 0
Total (23,652,757,321) (236,528) (236,528) 0 0 0 0 0
Amount to Recognize in Pension Expense
Amount to Recognize in Pension Expense
For the Fiscal Year Ended June 30Amount to Recognize in Pension Expense
For the Fiscal Year Ended June 30
For the Fiscal Year Ended June 30
For the Fiscal Year Ended June 30
Amount to Recognize in Pension Expense

Appendix BPage 12b(3)
NYC Office of the Actuary October 11, 2016
Changes in Proportionate Share at 6/30/2016
NEW YORK CITY TEACHERS' RETIREMENT SYSTEM (TRS)
Governmental Accounting Standards Board Statements No. 67 and No. 68 (GASB 67/68)
Changes in Proportionate Share
KIPP Infinity (1) (2) (3) (3)-(2)Charter School Proportionate Proportionate
Collective Share Share Change in RecognitionAmount at 6/30/2015 at 6/30/2016 Proportionate Period
at 6/30/2015 0.018% 0.017% Share (Years) 2016 2017 2018 2019Deferred Outflows
of Resources 2,227,614,195 400,971 378,694 (22,277) 3.84 (5,801) (5,801) (5,801) (4,874)
Deferred Inflowsof Resources (5,094,667,839) (917,040) (866,094) 50,946 3.84 13,267 13,267 13,267 11,145
Net Pension Liability (20,785,703,677) (3,741,427) (3,533,570) 207,857 3.84 54,129 54,129 54,129 45,470
Total (23,652,757,321) (4,257,496) (4,020,970) 236,526 61,595 61,595 61,595 51,741
Opportunity (1) (2) (3) (3)-(2)Charter School Proportionate Proportionate
Collective Share Share Change in RecognitionAmount at 6/30/2015 at 6/30/2016 Proportionate Period
at 6/30/2015 0.024% 0.013% Share (Years) 2016 2017 2018 2019Deferred Outflows
of Resources 2,227,614,195 534,627 289,590 (245,037) 3.84 (63,812) (63,812) (63,812) (53,601)
Deferred Inflowsof Resources (5,094,667,839) (1,222,720) (662,307) 560,413 3.84 145,941 145,941 145,941 122,590
Net Pension Liability (20,785,703,677) (4,988,569) (2,702,141) 2,286,428 3.84 595,424 595,424 595,424 500,156
Total (23,652,757,321) (5,676,662) (3,074,858) 2,601,804 677,553 677,553 677,553 569,145
Renaissance (1) (2) (3) (3)-(2)Charter School Proportionate Proportionate
Collective Share Share Change in RecognitionAmount at 6/30/2015 at 6/30/2016 Proportionate Period
at 6/30/2015 0.023% 0.021% Share (Years) 2016 2017 2018 2019Deferred Outflows
of Resources 2,227,614,195 512,351 467,799 (44,552) 3.84 (11,602) (11,602) (11,602) (9,746)
Deferred Inflowsof Resources (5,094,667,839) (1,171,774) (1,069,880) 101,894 3.84 26,535 26,535 26,535 22,289
Net Pension Liability (20,785,703,677) (4,780,712) (4,364,998) 415,714 3.84 108,259 108,259 108,259 90,937
Total (23,652,757,321) (5,440,135) (4,967,079) 473,056 123,192 123,192 123,192 103,480
UFT (1) (2) (3) (3)-(2)Charter School Proportionate Proportionate
Collective Share Share Change in RecognitionAmount at 6/30/2015 at 6/30/2016 Proportionate Period
at 6/30/2015 0.034% 0.021% Share (Years) 2016 2017 2018 2019Deferred Outflows
of Resources 2,227,614,195 757,389 467,799 (289,590) 3.84 (75,414) (75,414) (75,414) (63,348)
Deferred Inflowsof Resources (5,094,667,839) (1,732,187) (1,069,880) 662,307 3.84 172,476 172,476 172,476 144,879
Net Pension Liability (20,785,703,677) (7,067,139) (4,364,998) 2,702,141 3.84 703,683 703,683 703,683 591,092
Total (23,652,757,321) (8,041,937) (4,967,079) 3,074,858 800,745 800,745 800,745 672,623
For the Fiscal Year Ended June 30
For the Fiscal Year Ended June 30
For the Fiscal Year Ended June 30
For the Fiscal Year Ended June 30
Amount to Recognize in Pension Expense
Amount to Recognize in Pension Expense
Amount to Recognize in Pension Expense
Amount to Recognize in Pension Expense

Appendix BPage 12b(4)
NYC Office of the Actuary October 11, 2016
Changes in Proportionate Share at 6/30/2016
NEW YORK CITY TEACHERS' RETIREMENT SYSTEM (TRS)
Governmental Accounting Standards Board Statements No. 67 and No. 68 (GASB 67/68)
Changes in Proportionate Share
University Prep (1) (2) (3) (3)-(2)Charter High School Proportionate Proportionate
Collective Share Share Change in RecognitionAmount at 6/30/2015 at 6/30/2016 Proportionate Period
at 6/30/2015 0.016% 0.012% Share (Years) 2016 2017 2018 2019Deferred Outflows
of Resources 2,227,614,195 356,418 267,314 (89,104) 3.84 (23,204) (23,204) (23,204) (19,492)
Deferred Inflowsof Resources (5,094,667,839) (815,147) (611,360) 203,787 3.84 53,070 53,070 53,070 44,577
Net Pension Liability (20,785,703,677) (3,325,713) (2,494,284) 831,429 3.84 216,518 216,518 216,518 181,875
Total (23,652,757,321) (3,784,442) (2,838,330) 946,112 246,384 246,384 246,384 206,960
Voice (1) (2) (3) (3)-(2)Charter School Proportionate Proportionate
Collective Share Share Change in RecognitionAmount at 6/30/2015 at 6/30/2016 Proportionate Period
at 6/30/2015 0.009% 0.008% Share (Years) 2016 2017 2018 2019Deferred Outflows
of Resources 2,227,614,195 200,485 178,209 (22,276) 3.84 (5,801) (5,801) (5,801) (4,873)
Deferred Inflowsof Resources (5,094,667,839) (458,520) (407,573) 50,947 3.84 13,267 13,267 13,267 11,146
Net Pension Liability (20,785,703,677) (1,870,713) (1,662,856) 207,857 3.84 54,129 54,129 54,129 45,470
Total (23,652,757,321) (2,128,748) (1,892,220) 236,528 61,595 61,595 61,595 51,743
Wildcat (1) (2) (3) (3)-(2)Charter School Proportionate Proportionate
Collective Share Share Change in RecognitionAmount at 6/30/2015 at 6/30/2016 Proportionate Period
at 6/30/2015 0.012% 0.010% Share (Years) 2016 2017 2018 2019Deferred Outflows
of Resources 2,227,614,195 267,314 222,761 (44,553) 3.84 (11,602) (11,602) (11,602) (9,747)
Deferred Inflowsof Resources (5,094,667,839) (611,360) (509,467) 101,893 3.84 26,535 26,535 26,535 22,288
Net Pension Liability (20,785,703,677) (2,494,284) (2,078,570) 415,714 3.84 108,259 108,259 108,259 90,937
Total (23,652,757,321) (2,838,330) (2,365,276) 473,054 123,192 123,192 123,192 103,478
For the Fiscal Year Ended June 30
Amount to Recognize in Pension ExpenseFor the Fiscal Year Ended June 30
For the Fiscal Year Ended June 30Amount to Recognize in Pension Expense
Amount to Recognize in Pension Expense

Appendix BPage 13a
NYC Office of the Actuary October 11, 2016
NEW YORK CITY TEACHERS' RETIREMENT SYSTEM (TRS)
Governmental Accounting Standards Board Statements No. 67 and No. 68 (GASB 67/68)
Schedule of Pension Amounts by EmployerAs of and for the year ended June 30, 2015
Net Amortization ofDeferred Amounts
Changes in Changes in from Changes inNet Difference Proportion Net Difference Proportion Proportion
Between and Differences Between and Differences and DifferencesProjected Between Projected Between Between
Differences and Actual Employer Total Differences and Actual Employer Total Proportionate EmployerBetween Investment Contributions Deferred Between Investment Contributions Deferred Share of Contributions TotalExpected Earnings on and Proportionate Outflows Expected Earnings on and Proportionate Inflows Plan and Proportionate Employer
Net Pension and Actual Pension Plan Change of Share of of and Actual Pension Plan Change of Share of of Pension Share of PensionEntity* Liability Experience Investments Assumptions Contributions Resources Experience Investments Assumptions Contributions Resources Expense Contributions Expense
DOE 20,026,194,065$ 1,078,414,022$ 1,067,803,153$ 0$ (1,473,622)$ 2,144,743,553$ 0$ 4,908,508,675$ 0$ 0$ 4,908,508,675$ 2,083,051,095$ (511,675)$ 2,082,539,420$
CSC 527,956,873 28,430,569 28,150,831 0 6,999,712 63,581,112 0 129,404,563 0 0 129,404,563 54,916,132 2,430,456 57,346,588
CCC 192,891,330 10,387,232 10,285,028 0 1,289,420 21,961,680 0 47,278,518 0 0 47,278,518 20,063,848 447,716 20,511,564
BwC 3,533,570 190,283 188,411 0 (184,202) 194,492 0 866,094 0 0 866,094 367,550 (63,960) 303,590
Fut Lead 1,247,142 67,159 66,498 0 (552,609) (418,952) 0 305,680 0 0 305,680 129,722 (191,878) (62,156)
H Tubman 2,078,570 111,931 110,830 0 (368,407) (145,646) 0 509,467 0 0 509,467 216,206 (127,918) 88,288
KIPP 3,325,713 179,090 177,328 0 (1,842,029) (1,485,611) 0 815,147 0 0 815,147 345,928 (639,594) (293,666)
KIPP AMP 207,857 11,193 11,083 0 (552,610) (530,334) 0 50,947 0 0 50,947 21,622 (191,878) (170,256)
KIPP Infinity 3,741,427 201,476 199,494 0 (1,842,029) (1,441,059) 0 917,040 0 0 917,040 389,169 (639,594) (250,425)
Opp 4,988,569 268,635 265,992 0 921,015 1,455,642 0 1,222,720 0 0 1,222,720 518,892 319,796 838,688
Ren 4,780,712 257,442 254,909 0 (368,407) 143,944 0 1,171,774 0 0 1,171,774 497,272 (127,918) 369,354
UFT 7,067,139 380,567 376,822 0 (1,473,623) (716,234) 0 1,732,187 0 0 1,732,187 735,097 (511,675) 223,422
Univ Prep 3,325,713 179,090 177,328 0 (368,407) (11,989) 0 815,147 0 0 815,147 345,928 (127,918) 218,010
Voice 1,870,713 100,738 99,747 0 0 200,485 0 458,520 0 0 458,520 194,585 0 194,585
Wildcat 2,494,284 134,318 132,996 0 (184,202) 83,112 0 611,360 0 0 611,360 259,447 (63,960) 195,487
Total 20,785,703,677$ 1,119,313,745$ 1,108,300,450$ 0$ 0$ 2,227,614,195$ 0$ 5,094,667,839$ 0$ 0$ 5,094,667,839$ 2,162,052,493$ 0$ 2,162,052,493$
* DOE - Department of Education CSC - CUNY Senior Colleges CCC - CUNY Community Colleges BwC - Beginning with Children Charter School Fut Lead - Future Leaders Charter School H Tubman - Harriet Tubman Charter School KIPP - KIPP Academy Charter School KIPP AMP - KIPP AMP Charter School KIPP Infinity - KIPP Infinity Charter School Opp - Opportunity Charter School Ren - Renaissance Charter School UFT - UFT Charter School Univ Prep - University Prep Charter High School Voice - Voice Charter School Wildcat - Wildcat Charter School
Deferred Outflows of Resources Deferred Inflows of Resources Pension Expense

Appendix BPage 13b
NYC Office of the Actuary October 11, 2016
NEW YORK CITY TEACHERS' RETIREMENT SYSTEM (TRS)
Governmental Accounting Standards Board Statements No. 67 and No. 68 (GASB 67/68)
Schedule of Pension Amounts by EmployerAs of and for the year ended June 30, 2016
Net Amortization ofDeferred Amounts
Changes in Changes in from Changes inNet Difference Proportion Net Difference Proportion Proportion
Between and Differences Between and Differences and DifferencesProjected Between Projected Between Between
Differences and Actual Employer Total Differences and Actual Employer Total Proportionate EmployerBetween Investment Contributions Deferred Between Investment Contributions Deferred Share of Contributions TotalExpected Earnings on and Proportionate Outflows Expected Earnings on and Proportionate Inflows Plan and Proportionate Employer
Net Pension and Actual Pension Plan Change of Share of of and Actual Pension Plan Change of Share of of Pension Share of PensionEntity* Liability Experience Investments Assumptions Contributions Resources Experience Investments Assumptions Contributions Resources Expense Contributions Expense
DOE 25,321,393,354$ 1,574,694,346$ 2,247,197,059$ 1,727,685,262$ (63,552,008)$ 5,486,024,659$ 0$ 3,062,567,257$ 0$ (5,387,345)$ 3,057,179,912$ 3,734,242,868$ (20,653,473)$ 3,713,589,395$
CSC 732,856,540 45,575,101 65,038,801 50,002,993 50,315,509 210,932,404 0 88,637,399 0 3,937,539 92,574,938 108,077,162 17,151,833 125,228,995
CCC 278,480,211 17,318,210 24,714,276 19,000,777 25,341,789 86,375,052 0 33,681,574 0 2,108,808 35,790,382 41,068,546 8,331,968 49,400,514
BwC 2,109,699 131,199 187,229 143,945 (1,842,905) (1,380,532) 0 255,163 0 (148,275) 106,888 311,125 (618,322) (307,197)
Fut Lead 1,845,986 114,799 163,826 125,952 (169,323) 235,254 0 223,268 0 16,475 239,743 272,233 (130,283) 141,950
H Tubman 2,637,124 163,998 234,037 179,932 (240,489) 337,478 0 318,954 0 0 318,954 388,908 (127,918) 260,990
KIPP 4,746,822 295,197 421,266 323,877 (819,622) 220,718 0 574,118 0 32,951 607,069 700,031 (516,402) 183,629
KIPP AMP 263,713 16,400 23,404 17,993 (360,732) (302,935) 0 31,895 0 0 31,895 38,891 (191,878) (152,987)
KIPP Infinity 4,483,109 278,797 397,862 305,884 (1,393,842) (411,299) 0 542,222 0 (16,476) 525,746 661,141 (701,189) (40,048)
Opp 3,428,260 213,198 304,248 233,911 (1,504,257) (752,900) 0 414,641 0 (181,225) 233,416 505,580 (357,757) 147,823
Ren 5,537,960 344,396 491,477 377,856 (623,303) 590,426 0 669,804 0 (32,950) 636,854 816,703 (251,110) 565,593
UFT 5,537,960 344,396 491,477 377,856 (3,450,237) (2,236,508) 0 669,804 0 (214,176) 455,628 816,703 (1,312,420) (495,717)
Univ Prep 3,164,548 196,798 280,844 215,918 (1,006,117) (312,557) 0 382,745 0 (65,900) 316,845 466,687 (374,302) 92,385
Voice 2,109,699 131,199 187,229 143,945 (191,408) 270,965 0 255,163 0 (16,475) 238,688 311,125 (61,595) 249,530
Wildcat 2,637,123 163,998 234,037 179,932 (503,055) 74,912 0 318,954 0 (32,951) 286,003 388,908 (187,152) 201,756
Total 26,371,232,108$ 1,639,982,032$ 2,340,367,072$ 1,799,316,033$ 0$ 5,779,665,137$ 0$ 3,189,542,961$ 0$ 0$ 3,189,542,961$ 3,889,066,611$ 0$ 3,889,066,611$
* DOE - Department of Education CSC - CUNY Senior Colleges CCC - CUNY Community Colleges BwC - Beginning with Children Charter School Fut Lead - Future Leaders Charter School H Tubman - Harriet Tubman Charter School KIPP - KIPP Academy Charter School KIPP AMP - KIPP AMP Charter School KIPP Infinity - KIPP Infinity Charter School Opp - Opportunity Charter School Ren - Renaissance Charter School UFT - UFT Charter School Univ Prep - University Prep Charter High School Voice - Voice Charter School Wildcat - Wildcat Charter School
Deferred Outflows of Resources Deferred Inflows of Resources Pension Expense
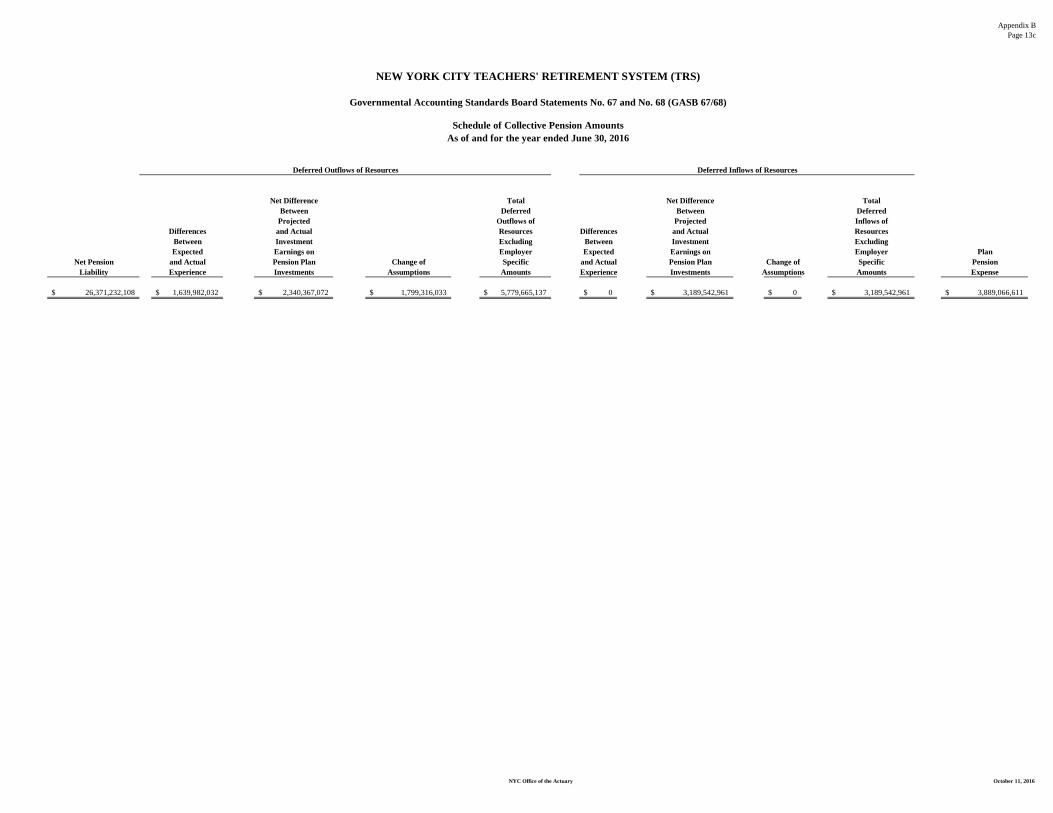
Appendix BPage 13c
NYC Office of the Actuary October 11, 2016
Net Difference Total Net Difference TotalBetween Deferred Between Deferred
Projected Outflows of Projected Inflows ofDifferences and Actual Resources Differences and Actual Resources
Between Investment Excluding Between Investment ExcludingExpected Earnings on Employer Expected Earnings on Employer Plan
Net Pension and Actual Pension Plan Change of Specific and Actual Pension Plan Change of Specific PensionLiability Experience Investments Assumptions Amounts Experience Investments Assumptions Amounts Expense
26,371,232,108$ 1,639,982,032$ 2,340,367,072$ 1,799,316,033$ 5,779,665,137$ 0$ 3,189,542,961$ 0$ 3,189,542,961$ 3,889,066,611$
Deferred Outflows of Resources Deferred Inflows of Resources
NEW YORK CITY TEACHERS' RETIREMENT SYSTEM (TRS)
Governmental Accounting Standards Board Statements No. 67 and No. 68 (GASB 67/68)
Schedule of Collective Pension AmountsAs of and for the year ended June 30, 2016

Appendix BPage 14
NYC Office of the Actuary October 11, 2016
2016 20151. Total Pension Liability
a. Service Cost 1,274,307,859$ $1,223,157,877b. Interest 4,131,176,953$ 4,027,138,338c. Changes of Benefit Terms 0 0d. Differences b/t Expected and Actual Experience 1,229,501,602$ 1,507,964,351e. Changes of Assumptions 2,432,878,017$ 0f. Benefit Payments (4,107,455,000)$ (4,024,272,000)g. Net Changes in Total Pension Liability 4,960,409,431$ 2,733,988,566$
2. Total Pension Liability - Beginning 65,040,367,677$ 62,306,379,111$ 3. Total Pension Liability - Ending 70,000,777,108$ 65,040,367,677$
4. Plan Fiduciary Net Positiona. Contributions - Employer 3,760,714,000$ $3,325,528,000b. Contributions - Employee 173,696,000$ 158,590,000c. Net Investment Income 960,267,000$ 1,611,929,000d. Benefit Payments (4,107,455,000)$ (4,024,272,000)e. Payment of Interest on TDA Fixed Funds (1,354,207,000)$ (1,248,988,000)f. Administrative Expenses (59,367,000)$ (58,391,000)g. Other Changes 1,233,000$ 329,000h. Net Changes in Fiduciary Net Position (625,119,000)$ (235,275,000)$
5. Plan Fiduciary Net Position - Beginning 44,254,664,000$ 44,489,939,000$ 6. Plan Fiduciary Net Position - Ending 43,629,545,000$ 44,254,664,000$
7. TRS' Net Pension Liability 26,371,232,108$ 20,785,703,677$
8. Plan Fiduciary Net Position as a Percentageof Total Pension Liability 62.3% 68.0%
9. Covered Employee Payroll 1 8,256,100,227$ 8,074,522,271$
10. TRS' Net Pension Liability as a Percentageof Covered Employee Payroll 319.4% 257.4%
1 Projected Employee Payroll at Time 1.0 under One-Year Lag Methodology.
NEW YORK CITY TEACHERS' RETIREMENT SYSTEM (TRS)
Governmental Accounting Standards Board Statements No. 67 and No. 68 (GASB 67/68)
Schedule of Changes in Net Pension Liability and Related Ratios

Appendix BPage 15
NYC Office of the Actuary October 11, 2016
PV of Future Average Expected Average ExpectedWorkLife Remaining Service Life Remaining Service Life
Group #Count @ 6/30/2014 @ 6/30/2014 @ 6/30/2015Active 111,726 877,480 7.85 7.33Active/Inactive 8,702 0 0 0Term Vested 12,349 0 0 0Retired 80,419 0 0 0 Total 213,196 877,480 4.12 3.84
Average Expected Remaining Service Lives
NEW YORK CITY TEACHERS' RETIREMENT SYSTEM (TRS)
Governmental Accounting Standards Board Statements No. 67 and No. 68 (GASB 67/68)

APPENDIX C

NYC Office of the Actuary October 11, 2016
Page 1a - Market Value of AssetsPage 1b - Development of Asset (Gain) / Loss - June 30, 2015 (Revised)Page 1c - Development of Asset (Gain) / Loss - June 30, 2016
Page 2 - Roll-Forward of Entry Age Actuarial Accrued Liabilities
Page 3a - Changes in Net Pension Liability by Source - June 30, 2015 (Revised)Page 3b - Changes in Net Pension Liability by Source - June 30, 2016Page 3c - Changes in Net Pension Liability by Source - June 30, 2015 - Summary (Revised)Page 3d - Changes in Net Pension Liability by Source - June 30, 2016 - Summary
Page 4a - Components of Pension Expense - June 30, 2015 (Revised)Page 4b - Components of Pension Expense - June 30, 2016Page 4c - Components of Pension Expense - June 30, 2015 - Summary (Revised)Page 4d - Components of Pension Expense - June 30, 2016 - Summary
Page 5a - Pension Expense, Total Deferred Inflows/Outflows of Resources @ June 30, 2013Page 5b - Pension Expense, Deferred Inflows/Outflows of Resources for June 30, 2014Page 5c - Pension Expense, Deferred Inflows/Outflows of Resources for June 30, 2015 (Revised)Page 5d - Pension Expense, Deferred Inflows/Outflows of Resources for June 30, 2016Page 5e - Pension Expense, Total Deferred Inflows/Outflows of Resources @ June 30, 2016
Page 6 - Schedule of Employer Contributions
Page 7 - Statement of Fiduciary Net Position
Page 8 - Statement of Changes in Fiduciary Net Position
Page 9 - Long-Term Expected Rate of Return
Page 10a - Schedule of Employer Allocations - June 30, 2015Page 10b - Schedule of Employer Allocations - June 30, 2016
Page 11a - Increase (Decrease) in Pension Expense Arising from the Recognition of Differences between Projected and Actual Earnings on Pension Plan Investments (Revised)
Page 11b - Increase (Decrease) in Pension Expense Arising from the Recognition of Differences between Expected and Actual Experience
Page 11c - Increase (Decrease) in Pension Expense Arising from the Recognition of Changes in Assumptions
Page 12a - Changes in Proportionate Share - June 30, 2015 (Revised)Page 12b - Changes in Proportionate Share - June 30, 2016
Page 13a - Schedule of Pension Amounts by Employer - June 30, 2015 (Revised)Page 13b - Schedule of Pension Amounts by Employer - June 30, 2016Page 13c - Schedule of Collective Pension Amounts - June 30, 2016
Page 14 - Schedule of Changes in Net Pension Liability and Related Ratios (Revised)
Page 15 - Average Expected Remaining Service Lives
APPENDIX C
NEW YORK CITY BOARD OF EDUCATION RETIREMENT SYSTEM (BERS)

Appendix CPage 1a
NYC Office of the Actuary October 11, 2016
Fixed Variable Total1. Plan Net Position @ 6/30/2014 3,231,711,000$ 47,554,000$ 3,279,265,000$ 2. Post-Publication Adjustment 71,240,000 0 71,240,0003. Post-Publication Plan Net Position @ 6/30/20141 3,302,951,000$ 47,554,000$ 3,350,505,000$
4. Changes for the year:a. ER Contributions 258,099,000 0 258,099,000b. EE Contributions 39,542,000 22,000 39,564,000c. Net Investment Income 174,776,000 2,390,000 177,166,000d. Benefit Payments (219,570,000) (3,674,000) (223,244,000)e. Payment of Interest on TDA Fixed Funds2 (85,104,000) 0 (85,104,000)f. Administrative Expenses (10,956,000) 0 (10,956,000)g. Other2 (52,021,000) 0 (52,021,000)h. Net Changes 104,766,000$ (1,262,000)$ 103,504,000$
5. Plan Net Position @ 6/30/20152 3,407,717,000$ 46,292,000$ 3,454,009,000$
6. Changes for the year:a. ER Contributions 265,532,000 0 265,532,000b. EE Contributions 38,563,000 18,000 38,581,000c. Net Investment Income 164,346,000 (202,000) 164,144,000d. Benefit Payments (237,206,000) (3,521,000) (240,727,000)e. Payment of Interest on TDA Fixed Funds (94,789,000) 0 (94,789,000)f. Administrative Expenses (12,818,000) 0 (12,818,000)g. Other (157,499,000) 0 (157,499,000)h. Net Changes (33,871,000)$ (3,705,000)$ (37,576,000)$
7. Plan Net Position @ 6/30/2016 3,373,846,000$ 42,587,000$ 3,416,433,000$
1 Post-Publication Adjustment.2 Restated from Prior Year.
Market Values of Assets - QPP Only
NEW YORK CITY BOARD OF EDUCATION RETIREMENT SYSTEM (BERS)
Governmental Accounting Standards Board Statements No. 67 and No. 68 (GASB 67/68)

Appendix CPage 1b
NYC Office of the Actuary October 11, 2016
Fixed Variable Total
1. Market Value 6/30/20141 3,302,951,000$ 47,554,000$ 3,350,505,000$
2. Market Value 6/30/20152 3,407,717,000 46,292,000 3,454,009,000
3. Net Investment Income 174,776,000 2,390,000 177,166,000
4. Cash Flow (70,010,000) (3,652,000) (73,662,000)(2. - 1. - 3.)
5. Projected Earnings3 228,797,526 2,390,000 231,187,526 (7% * 1. + 3.441% * 4.)
6. (Gain) / Loss 54,021,526 0 54,021,526(5. - 3.)
7. Recognition Period 5 Years 5 Years 5 Years
8. Amount Recognized in Pension Expense 10,804,305 0 10,804,305(6. / 7.)
9. Deferred (Inflow) / Outflow of Resources 43,217,221$ 0$ 43,217,221$ (6. - 8.)
1 Reflects Post-Publication Adjustment.2 Restated from Prior Year.3 Variable Funds Projected Earnings set equal to Variable Funds Net Investment Income.
NEW YORK CITY BOARD OF EDUCATION RETIREMENT SYSTEM (BERS)
Governmental Accounting Standards Board Statements No. 67 and No. 68 (GASB 67/68)
Development of Asset (Gain) / Loss - QPP OnlyJune 30, 2015 (Revised)

Appendix CPage 1c
NYC Office of the Actuary October 11, 2016
Fixed Variable Total
1. Market Value 6/30/20151 3,407,717,000$ 46,292,000$ 3,454,009,000$
2. Market Value 6/30/2016 3,373,846,000 42,587,000 3,416,433,000
3. Net Investment Income 164,346,000 (202,000) 164,144,000
4. Cash Flow (198,217,000) (3,503,000) (201,720,000)(2. - 1. - 3.)
5. Projected Earnings2 231,719,543 (202,000) 231,517,543 (7% * 1. + 3.441% * 4.)
6. (Gain) / Loss 67,373,543 0 67,373,543(5. - 3.)
7. Recognition Period 5 Years 5 Years 5 Years
8. Amount Recognized in Pension Expense 13,474,709 0 13,474,709(6. / 7.)
9. Deferred (Inflow) / Outflow of Resources 53,898,834$ 0$ 53,898,834$ (6. - 8.)
1 Restated from Prior Year.2 Variable Funds Projected Earnings set equal to Variable Funds Net Investment Income.
NEW YORK CITY BOARD OF EDUCATION RETIREMENT SYSTEM (BERS)
Governmental Accounting Standards Board Statements No. 67 and No. 68 (GASB 67/68)
Development of Asset (Gain) / Loss - QPP OnlyJune 30, 2016
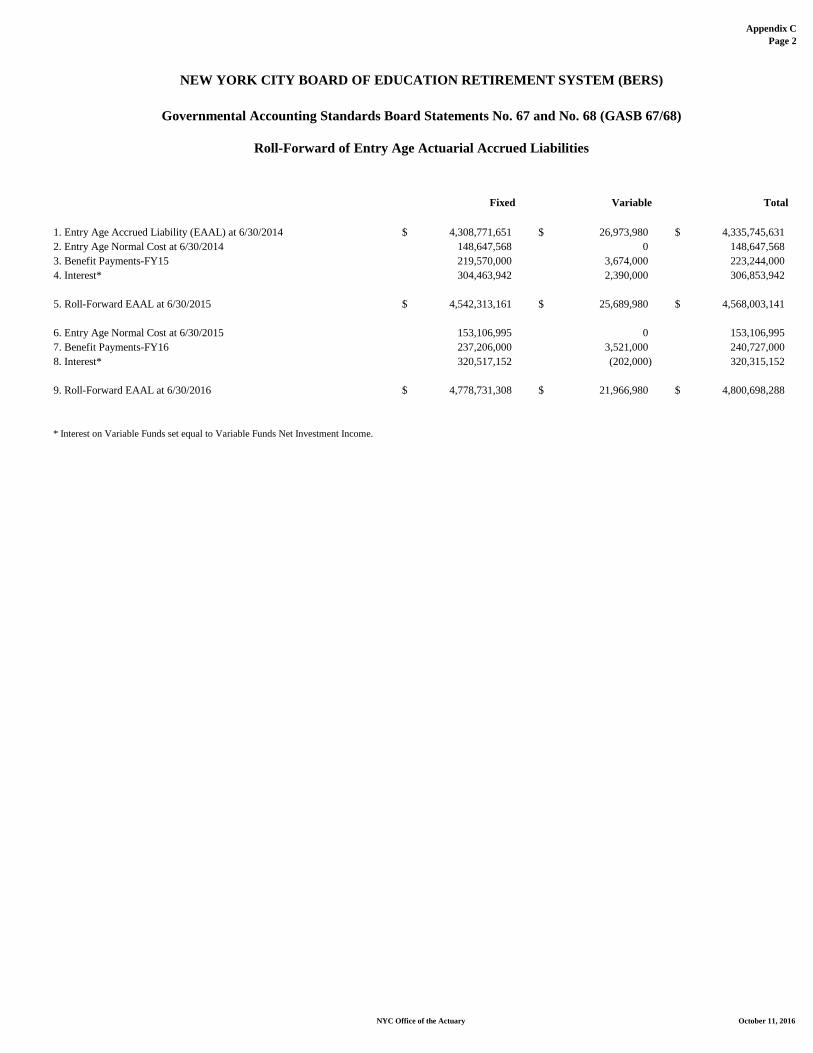
Appendix CPage 2
NYC Office of the Actuary October 11, 2016
Fixed Variable Total
1. Entry Age Accrued Liability (EAAL) at 6/30/2014 4,308,771,651$ 26,973,980$ 4,335,745,631$ 2. Entry Age Normal Cost at 6/30/2014 148,647,568 0 148,647,5683. Benefit Payments-FY15 219,570,000 3,674,000 223,244,0004. Interest* 304,463,942 2,390,000 306,853,942
5. Roll-Forward EAAL at 6/30/2015 4,542,313,161$ 25,689,980$ 4,568,003,141$
6. Entry Age Normal Cost at 6/30/2015 153,106,995 0 153,106,9957. Benefit Payments-FY16 237,206,000 3,521,000 240,727,0008. Interest* 320,517,152 (202,000) 320,315,152
9. Roll-Forward EAAL at 6/30/2016 4,778,731,308$ 21,966,980$ 4,800,698,288$
* Interest on Variable Funds set equal to Variable Funds Net Investment Income.
NEW YORK CITY BOARD OF EDUCATION RETIREMENT SYSTEM (BERS)
Governmental Accounting Standards Board Statements No. 67 and No. 68 (GASB 67/68)
Roll-Forward of Entry Age Actuarial Accrued Liabilities

Appendix CPage 3a(1)
NYC Office of the Actuary October 11, 2016
Total Pension Plan Fiduciary Net PensionLiability Net Position Liability
(a) (b) (a) - (b)1a. Balances at June 30, 2014 4,185,838,562$ 3,279,265,000$ 906,573,562$ 1b. Post-Publication Adjustment to Assets 0 71,240,000 (71,240,000)1c. Revised Balances at June 30, 2014 4,185,838,562$ 3,350,505,000$ 835,333,562$
2. Changes for the Year:a. Service Cost 147,898,591 0 147,898,591b. Interest 299,591,999 0 299,591,999c. Differences b/t Expected and Actual Experience 50,147,724 0 50,147,724d. Contributions - Employer 0 258,099,000 (258,099,000)e. Contributions - Employee 0 39,564,000 (39,564,000)f. Net Investment Income 0 177,166,000 (177,166,000)g. Benefit Payments (223,244,000) (223,244,000) 0h. Administrative Expenses 0 (10,956,000) 10,956,000i. Payment of Interest on TDA Fixed Funds 0 (85,104,000) 85,104,000j. Other Changes 0 (52,021,000) 52,021,000k. Net Changes 274,394,314$ 103,504,000$ 170,890,314$
3. Balances at June 30, 2015 4,460,232,876$ 3,454,009,000$ 1,006,223,876$
1 Post-Publication Adjustment to Assets at June 30, 2014 and Restated Assets at June 30, 2015.
NEW YORK CITY BOARD OF EDUCATION RETIREMENT SYSTEM (BERS)
Governmental Accounting Standards Board Statements No. 67 and No. 68 (GASB 67/68)
Changes in Net Pension Liability (NPL) by SourceBalances at June 30, 2015 (Revised)1

Appendix CPage 3a(2)
NYC Office of the Actuary October 11, 2016
Total Pension Plan Fiduciary Net PensionLiability Net Position Liability
(a) (b) (a) - (b)1a. Balances at June 30, 2014 95.9638% 4,016,889,745$ 3,146,907,307$ 869,982,438$ 1b. Post-Publication Adjustment to Assets 0 68,364,611 (68,364,611)1c. Revised Balances at June 30, 2014 4,016,889,745$ 3,215,271,918$ 801,617,827$
2. Changes for the Year:a. Service Cost 142,829,220 0 142,829,220b. Interest 289,323,184 0 289,323,184c. Differences b/t Expected and Actual Experience 48,428,861 0 48,428,861d. Contributions - Employer 0 249,252,399 (249,252,399)e. Contributions - Employee 0 38,207,905 (38,207,905)f. Net Investment Income 0 171,093,459 (171,093,459)g. Benefit Payments (215,592,088) (215,592,088) 0h. Administrative Expenses 0 (10,580,473) 10,580,473i. Payment of Interest on TDA Fixed Funds 0 (82,186,975) 82,186,975j. Other Changes 0 (50,237,928) 50,237,928k. Net Changes 264,989,177$ 99,956,299$ 165,032,878$
3. SubTotal 4,281,878,922$ 3,315,228,217$ 966,650,705$
4. Changes in Proportionate Share 25,475,010 20,391,170 5,083,840
5. Balances at June 30, 2015 96.5724% 4,307,353,932$ 3,335,619,387$ 971,734,545$
1 Post-Publication Adjustment to Assets at June 30, 2014 and Restated Assets at June 30, 2015.
NEW YORK CITY BOARD OF EDUCATION RETIREMENT SYSTEM (BERS)
Governmental Accounting Standards Board Statements No. 67 and No. 68 (GASB 67/68)
Changes in Net Pension Liability (NPL) by SourceDepartment of Education
Balances at June 30, 2015 (Revised)1

Appendix CPage 3a(3)
NYC Office of the Actuary October 11, 2016
Total Pension Plan Fiduciary Net PensionLiability Net Position Liability
(a) (b) (a) - (b)1a. Balances at June 30, 2014 4.0287% 168,634,877$ 132,111,748$ 36,523,129$ 1b. Post-Publication Adjustment to Assets 0 2,870,046 (2,870,046)1c. Revised Balances at June 30, 2014 168,634,877$ 134,981,794$ 33,653,083$
2. Changes for the Year:a. Service Cost 5,044,081 0 5,044,081b. Interest 10,217,585 0 10,217,585c. Differences b/t Expected and Actual Experience 1,710,288 0 1,710,288d. Contributions - Employer 0 8,802,466 (8,802,466)e. Contributions - Employee 0 1,349,330 (1,349,330)f. Net Investment Income 0 6,042,246 (6,042,246)g. Benefit Payments (7,613,737) (7,613,737) 0h. Administrative Expenses 0 (373,654) 373,654i. Payment of Interest on TDA Fixed Funds 0 (2,902,472) 2,902,472j. Other Changes 0 (1,774,177) 1,774,177k. Net Changes 9,358,217$ 3,530,002$ 5,828,215
3. SubTotal 177,993,094$ 138,511,796$ 39,481,298
4. Changes in Proportionate Share (25,876,851) (20,712,819) (5,164,032)
5. Balances at June 30, 2015 3.4105% 152,116,243$ 117,798,977$ 34,317,266
1 Post-Publication Adjustment to Assets at June 30, 2014 and Restated Assets at June 30, 2015.
School Construction AuthorityBalances at June 30, 2015 (Revised)1
Changes in Net Pension Liability (NPL) by Source
NEW YORK CITY BOARD OF EDUCATION RETIREMENT SYSTEM (BERS)
Governmental Accounting Standards Board Statements No. 67 and No. 68 (GASB 67/68)

Appendix CPage 3a(4)
NYC Office of the Actuary October 11, 2016
Total Pension Plan Fiduciary Net PensionLiability Net Position Liability
(a) (b) (a) - (b)1a. Balances at June 30, 2014 0.0071% 297,195$ 232,828$ 64,367$ 1b. Post-Publication Adjustment to Assets 0 5,058 (5,058)1c. Revised Balances at June 30, 2014 297,195$ 237,886$ 59,309$
2. Changes for the Year:a. Service Cost 11,832 0 11,832b. Interest 23,967 0 23,967c. Differences b/t Expected and Actual Experience 4,012 0 4,012d. Contributions - Employer 0 20,648 (20,648)e. Contributions - Employee 0 3,165 (3,165)f. Net Investment Income 0 14,173 (14,173)g. Benefit Payments (17,860) (17,860) 0h. Administrative Expenses 0 (876) 876i. Payment of Interest on TDA Fixed Funds 0 (6,808) 6,808j. Other Changes 0 (4,162) 4,162k. Net Changes 21,951$ 8,280$ 13,671$
3. SubTotal 319,146$ 246,166$ 72,980$
4. Changes in Proportionate Share 37,673 30,155 7,518
5. Balances at June 30, 2015 0.0080% 356,819$ 276,321$ 80,498$
1 Post-Publication Adjustment to Assets at June 30, 2014 and Restated Assets at June 30, 2015.
NEW YORK CITY BOARD OF EDUCATION RETIREMENT SYSTEM (BERS)
Governmental Accounting Standards Board Statements No. 67 and No. 68 (GASB 67/68)
Changes in Net Pension Liability (NPL) by SourceBeginning with Children Charter School
Balances at June 30, 2015 (Revised)1

Appendix CPage 3a(5)
NYC Office of the Actuary October 11, 2016
Total Pension Plan Fiduciary Net PensionLiability Net Position Liability
(a) (b) (a) - (b)1a. Balances at June 30, 2014 0.0004% 16,745$ 13,117$ 3,628$ 1b. Post-Publication Adjustment to Assets 0 285 (285)1c. Revised Balances at June 30, 2014 16,745$ 13,402$ 3,343$
2. Changes for the Year:a. Service Cost 12,423 0 12,423b. Interest 25,166 0 25,166c. Differences b/t Expected and Actual Experience 4,212 0 4,212d. Contributions - Employer 0 21,680 (21,680)e. Contributions - Employee 0 3,323 (3,323)f. Net Investment Income 0 14,882 (14,882)g. Benefit Payments (18,752) (18,752) 0h. Administrative Expenses 0 (920) 920i. Payment of Interest on TDA Fixed Funds 0 (7,149) 7,149j. Other Changes 0 (4,369) 4,369k. Net Changes 23,049$ 8,695$ 14,354$
3. SubTotal 39,794$ 22,097$ 17,697$
4. Changes in Proportionate Share 334,867 268,040 66,827
5. Balances at June 30, 2015 0.0084% 374,661$ 290,137$ 84,524$
1 Post-Publication Adjustment to Assets at June 30, 2014 and Restated Assets at June 30, 2015.
Balances at June 30, 2015 (Revised)1
NEW YORK CITY BOARD OF EDUCATION RETIREMENT SYSTEM (BERS)
Governmental Accounting Standards Board Statements No. 67 and No. 68 (GASB 67/68)
Changes in Net Pension Liability (NPL) by SourceRenaissance Charter School

Appendix CPage 3a(6)
NYC Office of the Actuary October 11, 2016
Total Pension Plan Fiduciary Net PensionLiability Net Position Liability
(a) (b) (a) - (b)1a. Balances at June 30, 2014 0.0000% 0$ 0$ 0$ 1b. Post-Publication Adjustment to Assets 0 0 01c. Revised Balances at June 30, 2014 0$ 0$ 0$
2. Changes for the Year:a. Service Cost 1,035 0 1,035b. Interest 2,097 0 2,097c. Differences b/t Expected and Actual Experience 351 0 351d. Contributions - Employer 0 1,807 (1,807)e. Contributions - Employee 0 277 (277)f. Net Investment Income 0 1,240 (1,240)g. Benefit Payments (1,563) (1,563) 0h. Administrative Expenses 0 (77) 77i. Payment of Interest on TDA Fixed Funds 0 (596) 596j. Other Changes 0 (364) 364k. Net Changes 1,920$ 724$ 1,196$
3. SubTotal 1,920$ 724$ 1,196$
4. Changes in Proportionate Share 29,301 23,454 5,847
5. Balances at June 30, 2015 0.0007% 31,221$ 24,178$ 7,043$
1 Post-Publication Adjustment to Assets at June 30, 2014 and Restated Assets at June 30, 2015.
NEW YORK CITY BOARD OF EDUCATION RETIREMENT SYSTEM (BERS)
Governmental Accounting Standards Board Statements No. 67 and No. 68 (GASB 67/68)
Changes in Net Pension Liability (NPL) by SourceKIPP Charter School
Balances at June 30, 2015 (Revised)1

Appendix CPage 3b(1)
NYC Office of the Actuary October 11, 2016
Total Pension Plan Fiduciary Net PensionLiability Net Position1 Liability
(a) (b) (a) - (b)1. Balances at June 30, 2015 4,460,232,876$ 3,454,009,000$ 1,006,223,876$
2. Changes for the Year:a. Service Cost 153,106,995 0 153,106,995b. Interest 320,315,152 0 320,315,152c. Differences b/t Expected and Actual Experience (75,906,864) 0 (75,906,864)d. Changes of Assumptions 183,677,129 0 183,677,129e. Contributions - Employer 0 265,532,000 (265,532,000)f. Contributions - Employee 0 38,581,000 (38,581,000)g. Net Investment Income 0 164,144,000 (164,144,000)h. Benefit Payments (240,727,000) (240,727,000) 0i. Administrative Expenses 0 (12,818,000) 12,818,000j. Payment of Interest on TDA Fixed Funds 0 (94,789,000) 94,789,000k. Other Changes 0 (157,499,000) 157,499,000l. Net Changes 340,465,412$ (37,576,000)$ 378,041,412$
3. Balances at June 30, 2016 4,800,698,288$ 3,416,433,000$ 1,384,265,288$
1 Restated from Prior Year.
NEW YORK CITY BOARD OF EDUCATION RETIREMENT SYSTEM (BERS)
Governmental Accounting Standards Board Statements No. 67 and No. 68 (GASB 67/68)
Changes in Net Pension Liability (NPL) by SourceBalances at June 30, 2016

Appendix CPage 3b(2)
NYC Office of the Actuary October 11, 2016
Total Pension Plan Fiduciary Net PensionLiability Net Position1 Liability
(a) (b) (a) - (b)1. Balances at June 30, 2015 96.5724% 4,307,353,932$ 3,335,619,387$ 971,734,545$
2. Changes for the Year:a. Service Cost 148,219,819 0 148,219,819b. Interest 310,090,692 0 310,090,692c. Differences b/t Expected and Actual Experience (73,483,917) 0 (73,483,917)d. Changes of Assumptions 177,814,156 0 177,814,156e. Contributions - Employer 0 257,056,218 (257,056,218)f. Contributions - Employee 0 37,349,495 (37,349,495)g. Net Investment Income 0 158,904,523 (158,904,523)h. Benefit Payments (233,042,994) (233,042,994) 0i. Administrative Expenses 0 (12,408,849) 12,408,849j. Payment of Interest on TDA Fixed Funds 0 (91,763,335) 91,763,335k. Other Changes 0 (152,471,633) 152,471,633l. Net Changes 329,597,756$ (36,376,575)$ 365,974,331$
3. SubTotal 4,636,951,688$ 3,299,242,812$ 1,337,708,876$
4. Changes in Proportionate Share 10,508,314 8,137,648 2,370,666
5. Balances at June 30, 2016 96.8080% 4,647,460,002$ 3,307,380,460$ 1,340,079,542$
1 Restated from Prior Year.
Governmental Accounting Standards Board Statements No. 67 and No. 68 (GASB 67/68)
Changes in Net Pension Liability (NPL) by SourceDepartment of EducationBalances at June 30, 2016
NEW YORK CITY BOARD OF EDUCATION RETIREMENT SYSTEM (BERS)

Appendix CPage 3b(3)
NYC Office of the Actuary October 11, 2016
Total Pension Plan Fiduciary Net PensionLiability Net Position1 Liability
(a) (b) (a) - (b)1. Balances at June 30, 2015 3.4105% 152,116,243$ 117,798,977$ 34,317,266$
2. Changes for the Year:a. Service Cost 4,866,812 0 4,866,812b. Interest 10,181,858 0 10,181,858c. Differences b/t Expected and Actual Experience (2,412,851) 0 (2,412,851)d. Changes of Assumptions 5,838,545 0 5,838,545e. Contributions - Employer 0 8,440,466 (8,440,466)f. Contributions - Employee 0 1,226,374 (1,226,374)g. Net Investment Income 0 5,217,645 (5,217,645)h. Benefit Payments (7,651,989) (7,651,989) 0i. Administrative Expenses 0 (407,446) 407,446j. Payment of Interest on TDA Fixed Funds 0 (3,013,058) 3,013,058k. Other Changes 0 (5,006,421) 5,006,421l. Net Changes 10,822,375$ (1,194,429)$ 12,016,804
3. SubTotal 162,938,618$ 116,604,548$ 46,334,070
4. Changes in Proportionate Share (10,338,821) (8,006,393) (2,332,428)
5. Balances at June 30, 2016 3.1787% 152,599,797$ 108,598,155$ 44,001,642
1 Restated from Prior Year.
Governmental Accounting Standards Board Statements No. 67 and No. 68 (GASB 67/68)
Changes in Net Pension Liability (NPL) by SourceSchool Construction Authority
NEW YORK CITY BOARD OF EDUCATION RETIREMENT SYSTEM (BERS)
Balances at June 30, 2016
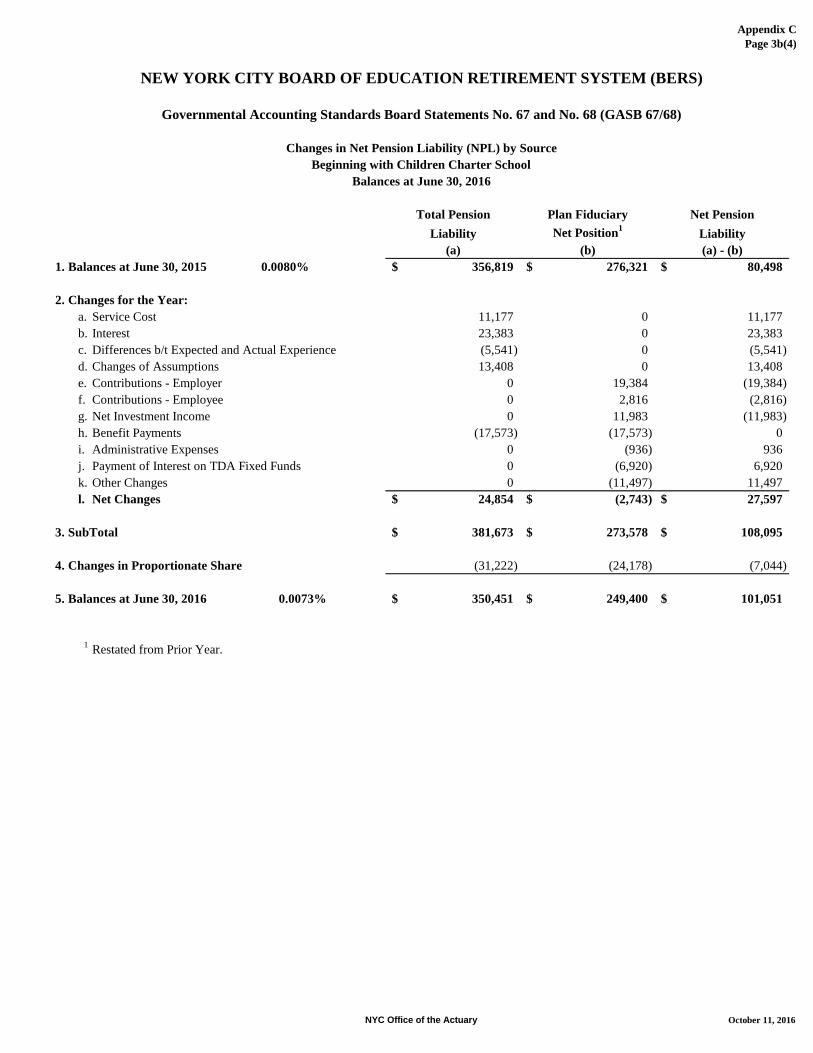
Appendix CPage 3b(4)
NYC Office of the Actuary October 11, 2016
Total Pension Plan Fiduciary Net PensionLiability Net Position1 Liability
(a) (b) (a) - (b)1. Balances at June 30, 2015 0.0080% 356,819$ 276,321$ 80,498$
2. Changes for the Year:a. Service Cost 11,177 0 11,177b. Interest 23,383 0 23,383c. Differences b/t Expected and Actual Experience (5,541) 0 (5,541)d. Changes of Assumptions 13,408 0 13,408e. Contributions - Employer 0 19,384 (19,384)f. Contributions - Employee 0 2,816 (2,816)g. Net Investment Income 0 11,983 (11,983)h. Benefit Payments (17,573) (17,573) 0i. Administrative Expenses 0 (936) 936j. Payment of Interest on TDA Fixed Funds 0 (6,920) 6,920k. Other Changes 0 (11,497) 11,497l. Net Changes 24,854$ (2,743)$ 27,597$
3. SubTotal 381,673$ 273,578$ 108,095$
4. Changes in Proportionate Share (31,222) (24,178) (7,044)
5. Balances at June 30, 2016 0.0073% 350,451$ 249,400$ 101,051$
1 Restated from Prior Year.
NEW YORK CITY BOARD OF EDUCATION RETIREMENT SYSTEM (BERS)
Governmental Accounting Standards Board Statements No. 67 and No. 68 (GASB 67/68)
Changes in Net Pension Liability (NPL) by SourceBeginning with Children Charter School
Balances at June 30, 2016
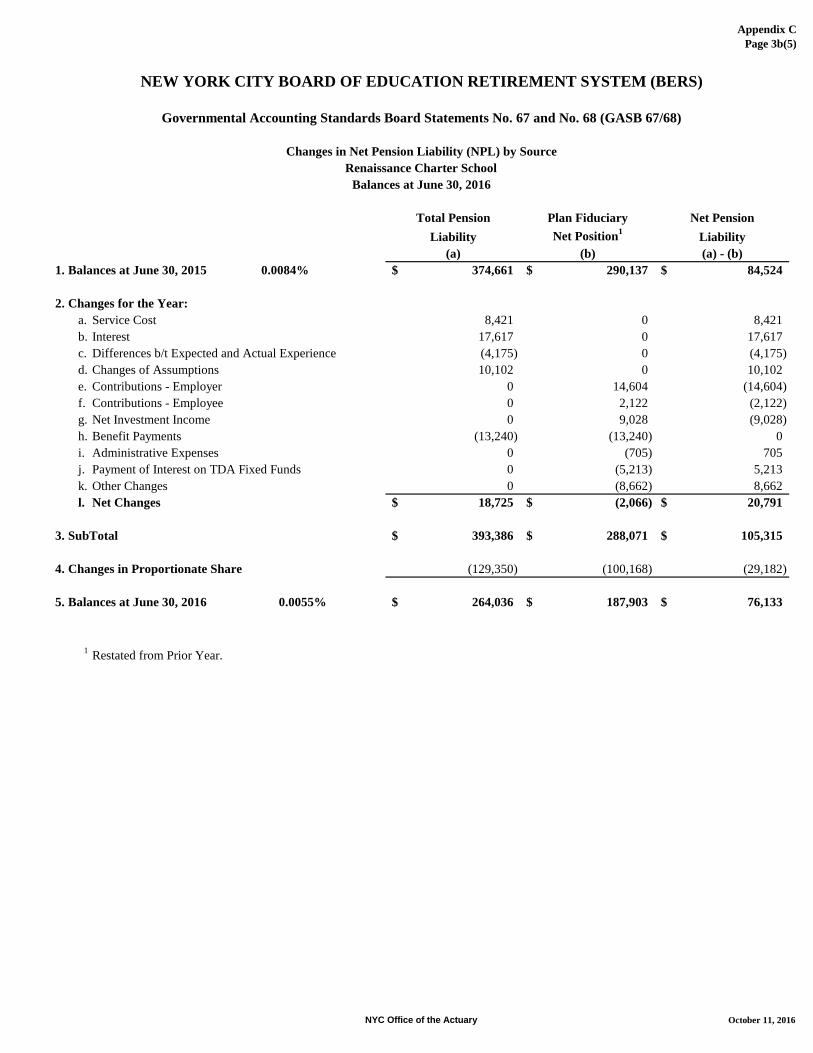
Appendix CPage 3b(5)
NYC Office of the Actuary October 11, 2016
Total Pension Plan Fiduciary Net PensionLiability Net Position1 Liability
(a) (b) (a) - (b)1. Balances at June 30, 2015 0.0084% 374,661$ 290,137$ 84,524$
2. Changes for the Year:a. Service Cost 8,421 0 8,421b. Interest 17,617 0 17,617c. Differences b/t Expected and Actual Experience (4,175) 0 (4,175)d. Changes of Assumptions 10,102 0 10,102e. Contributions - Employer 0 14,604 (14,604)f. Contributions - Employee 0 2,122 (2,122)g. Net Investment Income 0 9,028 (9,028)h. Benefit Payments (13,240) (13,240) 0i. Administrative Expenses 0 (705) 705j. Payment of Interest on TDA Fixed Funds 0 (5,213) 5,213k. Other Changes 0 (8,662) 8,662l. Net Changes 18,725$ (2,066)$ 20,791$
3. SubTotal 393,386$ 288,071$ 105,315$
4. Changes in Proportionate Share (129,350) (100,168) (29,182)
5. Balances at June 30, 2016 0.0055% 264,036$ 187,903$ 76,133$
1 Restated from Prior Year.
Balances at June 30, 2016
NEW YORK CITY BOARD OF EDUCATION RETIREMENT SYSTEM (BERS)
Governmental Accounting Standards Board Statements No. 67 and No. 68 (GASB 67/68)
Changes in Net Pension Liability (NPL) by SourceRenaissance Charter School

Appendix CPage 3b(6)
NYC Office of the Actuary October 11, 2016
Total Pension Plan Fiduciary Net PensionLiability Net Position1 Liability
(a) (b) (a) - (b)1. Balances at June 30, 2015 0.0007% 31,221$ 24,178$ 7,043$
2. Changes for the Year:a. Service Cost 766 0 766b. Interest 1,602 0 1,602c. Differences b/t Expected and Actual Experience (380) 0 (380)d. Changes of Assumptions 918 0 918e. Contributions - Employer 0 1,328 (1,328)f. Contributions - Employee 0 193 (193)g. Net Investment Income 0 821 (821)h. Benefit Payments (1,204) (1,204) 0i. Administrative Expenses 0 (64) 64j. Payment of Interest on TDA Fixed Funds 0 (474) 474k. Other Changes 0 (787) 787l. Net Changes 1,702$ (187)$ 1,889$
3. SubTotal 32,923$ 23,991$ 8,932$
4. Changes in Proportionate Share (8,921) (6,909) (2,012)
5. Balances at June 30, 2016 0.0005% 24,002$ 17,082$ 6,920$
1 Restated from Prior Year.
NEW YORK CITY BOARD OF EDUCATION RETIREMENT SYSTEM (BERS)
Governmental Accounting Standards Board Statements No. 67 and No. 68 (GASB 67/68)
Changes in Net Pension Liability (NPL) by SourceKIPP Charter School
Balances at June 30, 2016

Appendix CPage 3c
NYC Office of the Actuary October 11, 2016
DOE SCA BWCCS REN KIPP TOTAL1. Balances at June 30, 2014 4,016,889,745$ 168,634,877$ 297,195$ 16,745$ 0$ 4,185,838,562$
2. Changes for the Year:a. Service Cost 142,829,220 5,044,081 11,832 12,423 1,035 147,898,591b. Interest 289,323,184 10,217,585 23,967 25,166 2,097 299,591,999c. Differences b/t Expected and Actual Experience 48,428,861 1,710,288 4,012 4,212 351 50,147,724d. Benefit Payments (215,592,088) (7,613,737) (17,860) (18,752) (1,563) (223,244,000)e. Net Changes 264,989,177$ 9,358,217$ 21,951$ 23,049$ 1,920$ 274,394,314$
3. SubTotal 4,281,878,922$ 177,993,094$ 319,146$ 39,794$ 1,920$ 4,460,232,876$
4. Changes in Proportionate Share 25,475,010$ (25,876,851)$ 37,673$ 334,867$ 29,301$ 0$
5. Balances at June 30, 2015 4,307,353,932$ 152,116,243$ 356,819$ 374,661$ 31,221$ 4,460,232,876$
DOE SCA BWCCS REN KIPP TOTAL6a. Balances at June 30, 2014 3,146,907,307$ 132,111,748$ 232,828$ 13,117$ 0$ 3,279,265,000$ 6b. Post-Publication Adjustment to Assets 68,364,611 2,870,046 5,058 285 0 71,240,0006c. Revised Balances at June 30, 2014 3,215,271,918$ 134,981,794$ 237,886$ 13,402$ 0$ 3,350,505,000$
7. Changes for the Year:a. Contributions - Employer 249,252,399 8,802,466 20,648 21,680 1,807 258,099,000b. Contributions - Employee 38,207,905 1,349,330 3,165 3,323 277 39,564,000c. Net Investment Income 171,093,459 6,042,246 14,173 14,882 1,240 177,166,000d. Benefit Payments (215,592,088) (7,613,737) (17,860) (18,752) (1,563) (223,244,000)e. Administrative Expenses (10,580,473) (373,654) (876) (920) (77) (10,956,000)f. Payment of Interest on TDA Fixed Funds (82,186,975) (2,902,472) (6,808) (7,149) (596) (85,104,000)g. Other Changes (50,237,928) (1,774,177) (4,162) (4,369) (364) (52,021,000)h. Net Changes 99,956,299$ 3,530,002$ 8,280$ 8,695$ 724$ 103,504,000$
8. SubTotal 3,315,228,217$ 138,511,796$ 246,166$ 22,097$ 724$ 3,454,009,000$
9. Changes in Proportionate Share 20,391,170$ (20,712,819)$ 30,155$ 268,040$ 23,454$ 0$
10. Balances at June 30, 2015 3,335,619,387$ 117,798,977$ 276,321$ 290,137$ 24,178$ 3,454,009,000$
DOE SCA BWCCS REN KIPP TOTAL11a. Balances at June 30, 2014 869,982,438$ 36,523,129$ 64,367$ 3,628$ 0$ 906,573,562$ 11b. Post-Publication Adjustment to Assets (68,364,611) (2,870,046) (5,058) (285) 0 (71,240,000)11c. Revised Balances at June 30, 2014 801,617,827$ 33,653,083$ 59,309$ 3,343$ 0$ 835,333,562$
12. Changes for the Year:a. Service Cost 142,829,220 5,044,081 11,832 12,423 1,035 147,898,591b. Interest 289,323,184 10,217,585 23,967 25,166 2,097 299,591,999c. Differences b/t Expected and Actual Experience 48,428,861 1,710,288 4,012 4,212 351 50,147,724d. Contributions - Employer (249,252,399) (8,802,466) (20,648) (21,680) (1,807) (258,099,000)e. Contributions - Employee (38,207,905) (1,349,330) (3,165) (3,323) (277) (39,564,000)f. Net Investment Income (171,093,459) (6,042,246) (14,173) (14,882) (1,240) (177,166,000)g. Benefit Payments 0 0 0 0 0 0h. Administrative Expenses 10,580,473 373,654 876 920 77 10,956,000i. Payment of Interest on TDA Fixed Funds 82,186,975 2,902,472 6,808 7,149 596 85,104,000j. Other Changes 50,237,928 1,774,177 4,162 4,369 364 52,021,000k. Net Changes 165,032,878$ 5,828,215$ 13,671$ 14,354$ 1,196$ 170,890,314$
13. SubTotal 966,650,705$ 39,481,298$ 72,980$ 17,697$ 1,196$ 1,006,223,876$
14. Changes in Proportionate Share 5,083,840$ (5,164,032)$ 7,518$ 66,827$ 5,847$ 0$
15. Balances at June 30, 2015 971,734,545$ 34,317,266$ 80,498$ 84,524$ 7,043$ 1,006,223,876$
1 Post-Publication Adjustment to Assets at June 30, 2014 and Restated Assets at June 30, 2015.
Net Pension Liablility
NEW YORK CITY BOARD OF EDUCATION RETIREMENT SYSTEM (BERS)
Governmental Accounting Standards Board Statements No. 67 and No. 68 (GASB 67/68)
Changes in Net Pension Liability (NPL) by Source - By ObligorBalances as of June 30, 2015 (Revised)1
Total Pension Liability
Plan Fiduciary Net Position
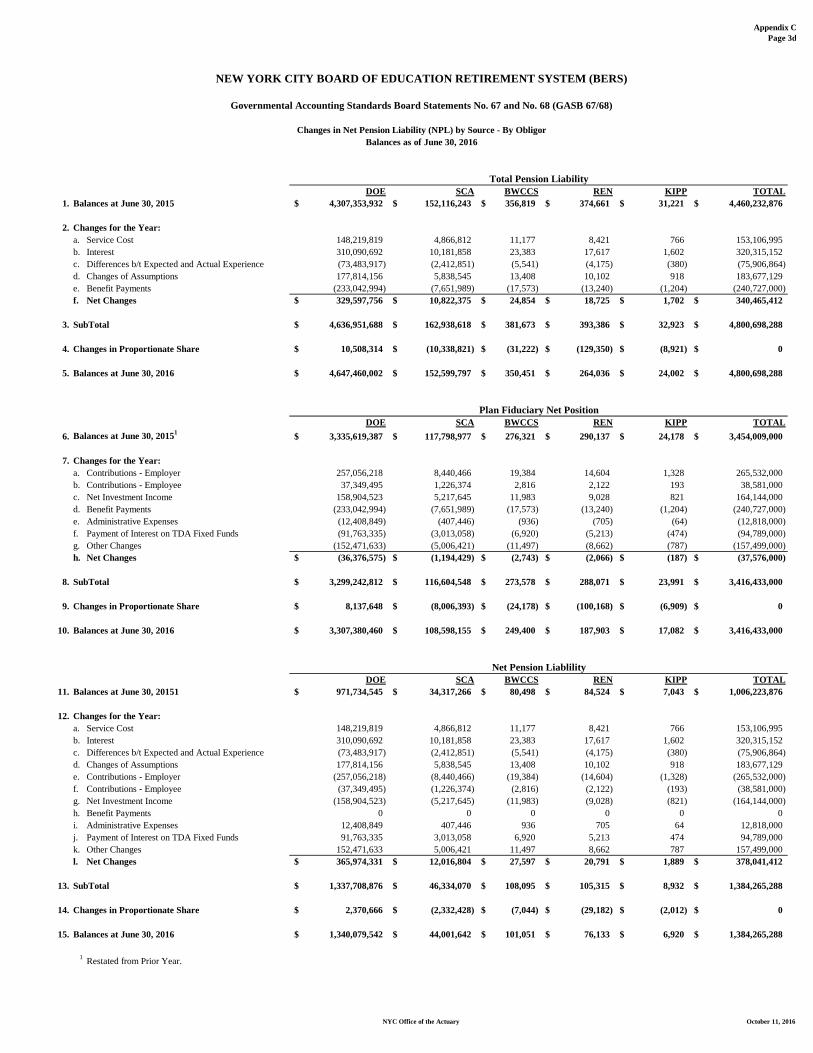
Appendix CPage 3d
NYC Office of the Actuary October 11, 2016
DOE SCA BWCCS REN KIPP TOTAL1. Balances at June 30, 2015 4,307,353,932$ 152,116,243$ 356,819$ 374,661$ 31,221$ 4,460,232,876$
2. Changes for the Year:a. Service Cost 148,219,819 4,866,812 11,177 8,421 766 153,106,995b. Interest 310,090,692 10,181,858 23,383 17,617 1,602 320,315,152c. Differences b/t Expected and Actual Experience (73,483,917) (2,412,851) (5,541) (4,175) (380) (75,906,864)d. Changes of Assumptions 177,814,156 5,838,545 13,408 10,102 918 183,677,129e. Benefit Payments (233,042,994) (7,651,989) (17,573) (13,240) (1,204) (240,727,000)f. Net Changes 329,597,756$ 10,822,375$ 24,854$ 18,725$ 1,702$ 340,465,412$
3. SubTotal 4,636,951,688$ 162,938,618$ 381,673$ 393,386$ 32,923$ 4,800,698,288$
4. Changes in Proportionate Share 10,508,314$ (10,338,821)$ (31,222)$ (129,350)$ (8,921)$ 0$
5. Balances at June 30, 2016 4,647,460,002$ 152,599,797$ 350,451$ 264,036$ 24,002$ 4,800,698,288$
DOE SCA BWCCS REN KIPP TOTAL6. Balances at June 30, 20151 3,335,619,387$ 117,798,977$ 276,321$ 290,137$ 24,178$ 3,454,009,000$
7. Changes for the Year:a. Contributions - Employer 257,056,218 8,440,466 19,384 14,604 1,328 265,532,000b. Contributions - Employee 37,349,495 1,226,374 2,816 2,122 193 38,581,000c. Net Investment Income 158,904,523 5,217,645 11,983 9,028 821 164,144,000d. Benefit Payments (233,042,994) (7,651,989) (17,573) (13,240) (1,204) (240,727,000)e. Administrative Expenses (12,408,849) (407,446) (936) (705) (64) (12,818,000)f. Payment of Interest on TDA Fixed Funds (91,763,335) (3,013,058) (6,920) (5,213) (474) (94,789,000)g. Other Changes (152,471,633) (5,006,421) (11,497) (8,662) (787) (157,499,000)h. Net Changes (36,376,575)$ (1,194,429)$ (2,743)$ (2,066)$ (187)$ (37,576,000)$
8. SubTotal 3,299,242,812$ 116,604,548$ 273,578$ 288,071$ 23,991$ 3,416,433,000$
9. Changes in Proportionate Share 8,137,648$ (8,006,393)$ (24,178)$ (100,168)$ (6,909)$ 0$
10. Balances at June 30, 2016 3,307,380,460$ 108,598,155$ 249,400$ 187,903$ 17,082$ 3,416,433,000$
DOE SCA BWCCS REN KIPP TOTAL11. Balances at June 30, 20151 971,734,545$ 34,317,266$ 80,498$ 84,524$ 7,043$ 1,006,223,876$
12. Changes for the Year:a. Service Cost 148,219,819 4,866,812 11,177 8,421 766 153,106,995b. Interest 310,090,692 10,181,858 23,383 17,617 1,602 320,315,152c. Differences b/t Expected and Actual Experience (73,483,917) (2,412,851) (5,541) (4,175) (380) (75,906,864)d. Changes of Assumptions 177,814,156 5,838,545 13,408 10,102 918 183,677,129e. Contributions - Employer (257,056,218) (8,440,466) (19,384) (14,604) (1,328) (265,532,000)f. Contributions - Employee (37,349,495) (1,226,374) (2,816) (2,122) (193) (38,581,000)g. Net Investment Income (158,904,523) (5,217,645) (11,983) (9,028) (821) (164,144,000)h. Benefit Payments 0 0 0 0 0 0i. Administrative Expenses 12,408,849 407,446 936 705 64 12,818,000j. Payment of Interest on TDA Fixed Funds 91,763,335 3,013,058 6,920 5,213 474 94,789,000k. Other Changes 152,471,633 5,006,421 11,497 8,662 787 157,499,000l. Net Changes 365,974,331$ 12,016,804$ 27,597$ 20,791$ 1,889$ 378,041,412$
13. SubTotal 1,337,708,876$ 46,334,070$ 108,095$ 105,315$ 8,932$ 1,384,265,288$
14. Changes in Proportionate Share 2,370,666$ (2,332,428)$ (7,044)$ (29,182)$ (2,012)$ 0$
15. Balances at June 30, 2016 1,340,079,542$ 44,001,642$ 101,051$ 76,133$ 6,920$ 1,384,265,288$
1 Restated from Prior Year.
Total Pension Liability
Plan Fiduciary Net Position
Net Pension Liablility
NEW YORK CITY BOARD OF EDUCATION RETIREMENT SYSTEM (BERS)
Governmental Accounting Standards Board Statements No. 67 and No. 68 (GASB 67/68)
Changes in Net Pension Liability (NPL) by Source - By ObligorBalances as of June 30, 2016
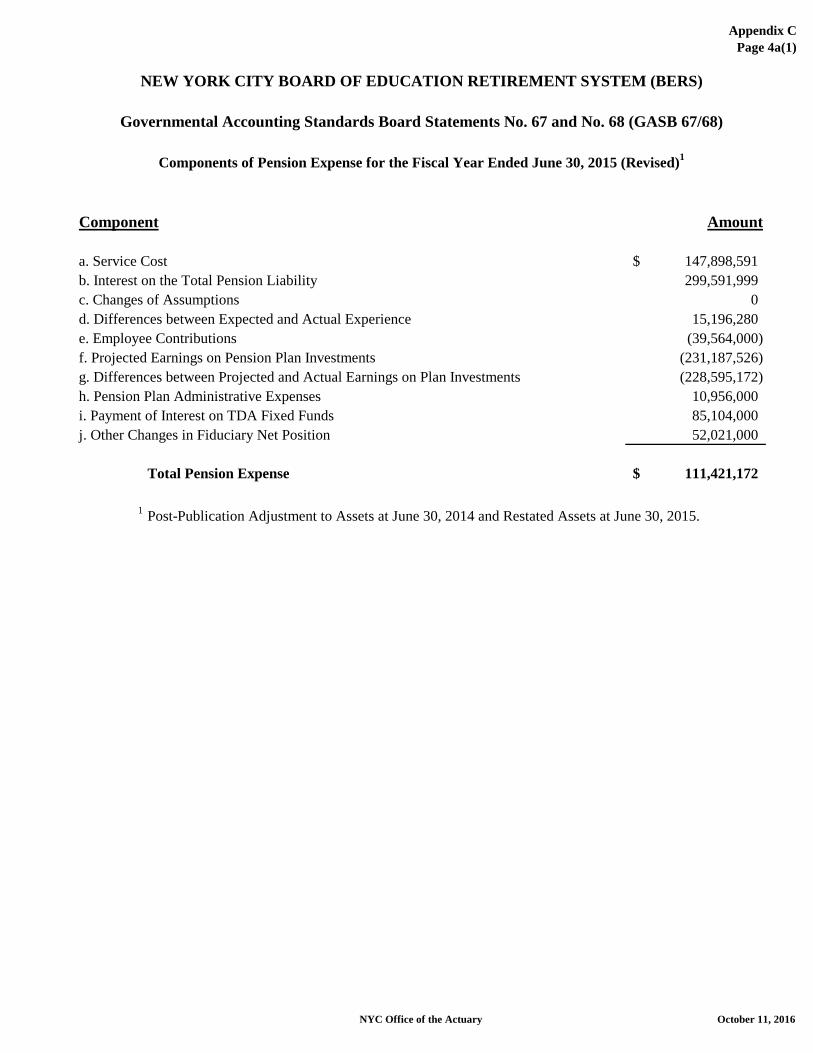
Appendix CPage 4a(1)
NYC Office of the Actuary October 11, 2016
NEW YORK CITY BOARD OF EDUCATION RETIREMENT SYSTEM (BERS)
Components of Pension Expense for the Fiscal Year Ended June 30, 2015 (Revised)1
Component Amount
a. Service Cost 147,898,591$ b. Interest on the Total Pension Liability 299,591,999c. Changes of Assumptions 0d. Differences between Expected and Actual Experience 15,196,280e. Employee Contributions (39,564,000)f. Projected Earnings on Pension Plan Investments (231,187,526)g. Differences between Projected and Actual Earnings on Plan Investments (228,595,172)h. Pension Plan Administrative Expenses 10,956,000i. Payment of Interest on TDA Fixed Funds 85,104,000j. Other Changes in Fiduciary Net Position 52,021,000
Total Pension Expense 111,421,172$
1 Post-Publication Adjustment to Assets at June 30, 2014 and Restated Assets at June 30, 2015.
Governmental Accounting Standards Board Statements No. 67 and No. 68 (GASB 67/68)

Appendix CPage 4a(2)
NYC Office of the Actuary October 11, 2016
NEW YORK CITY BOARD OF EDUCATION RETIREMENT SYSTEM (BERS)
Components of Pension Expense for the Fiscal Year Ended June 30, 2015 (Revised)1
Component Amount
a. Service Cost 142,829,220$ b. Interest on the Total Pension Liability 289,323,184c. Changes of Assumptions 0d. Differences between Expected and Actual Experience 14,675,413e. Employee Contributions (38,207,905)f. Projected Earnings on Pension Plan Investments (223,263,342)g. Differences between Projected and Actual Earnings on Plan Investments (220,759,844)h. Pension Plan Administrative Expenses 10,580,473i. Payment of Interest on TDA Fixed Funds 82,186,975j. Other Changes in Fiduciary Net Position 50,237,928
SubTotal 107,602,102$
k. Changes in Proportionate Share 3,120,188
Total Pension Expense 110,722,290$
1 Post-Publication Adjustment to Assets at June 30, 2014 and Restated Assets at June 30, 2015.
Governmental Accounting Standards Board Statements No. 67 and No. 68 (GASB 67/68)
Department of Education

Appendix CPage 4a(3)
NYC Office of the Actuary October 11, 2016
NEW YORK CITY BOARD OF EDUCATION RETIREMENT SYSTEM (BERS)
Components of Pension Expense for the Fiscal Year Ended June 30, 2015 (Revised)1
Component Amount
a. Service Cost 5,044,081$ b. Interest on the Total Pension Liability 10,217,585c. Changes of Assumptions 0d. Differences between Expected and Actual Experience 518,269e. Employee Contributions (1,349,330)f. Projected Earnings on Pension Plan Investments (7,884,651)g. Differences between Projected and Actual Earnings on Plan Investments (7,796,238)h. Pension Plan Administrative Expenses 373,654i. Payment of Interest on TDA Fixed Funds 2,902,472j. Other Changes in Fiduciary Net Position 1,774,176
SubTotal 3,800,018$
k. Changes in Proportionate Share (3,169,406)
Total Pension Expense 630,612$
1 Post-Publication Adjustment to Assets at June 30, 2014 and Restated Assets at June 30, 2015.
Governmental Accounting Standards Board Statements No. 67 and No. 68 (GASB 67/68)
School Construction Authority

Appendix CPage 4a(4)
NYC Office of the Actuary October 11, 2016
NEW YORK CITY BOARD OF EDUCATION RETIREMENT SYSTEM (BERS)
Components of Pension Expense for the Fiscal Year Ended June 30, 2015 (Revised)1
Component Amount
a. Service Cost 11,832$ b. Interest on the Total Pension Liability 23,967c. Changes of Assumptions 0d. Differences between Expected and Actual Experience 1,216e. Employee Contributions (3,165)f. Projected Earnings on Pension Plan Investments (18,495)g. Differences between Projected and Actual Earnings on Plan Investments (18,288)h. Pension Plan Administrative Expenses 876i. Payment of Interest on TDA Fixed Funds 6,808j. Other Changes in Fiduciary Net Position 4,162
SubTotal 8,913$
k. Changes in Proportionate Share 4,614
Total Pension Expense 13,527$
1 Post-Publication Adjustment to Assets at June 30, 2014 and Restated Assets at June 30, 2015.
Beginning with Children
Governmental Accounting Standards Board Statements No. 67 and No. 68 (GASB 67/68)

Appendix CPage 4a(5)
NYC Office of the Actuary October 11, 2016
NEW YORK CITY BOARD OF EDUCATION RETIREMENT SYSTEM (BERS)
Components of Pension Expense for the Fiscal Year Ended June 30, 2015 (Revised)1
Component Amount
a. Service Cost 12,423$ b. Interest on the Total Pension Liability 25,166c. Changes of Assumptions 0d. Differences between Expected and Actual Experience 1,276e. Employee Contributions (3,323)f. Projected Earnings on Pension Plan Investments (19,420)g. Differences between Projected and Actual Earnings on Plan Investments (19,202)h. Pension Plan Administrative Expenses 920i. Payment of Interest on TDA Fixed Funds 7,149j. Other Changes in Fiduciary Net Position 4,370
SubTotal 9,359$
k. Changes in Proportionate Share 41,015
Total Pension Expense 50,374$
1 Post-Publication Adjustment to Assets at June 30, 2014 and Restated Assets at June 30, 2015.
Governmental Accounting Standards Board Statements No. 67 and No. 68 (GASB 67/68)
Renaissance

Appendix CPage 4a(6)
NYC Office of the Actuary October 11, 2016
NEW YORK CITY BOARD OF EDUCATION RETIREMENT SYSTEM (BERS)
Components of Pension Expense for the Fiscal Year Ended June 30, 2015 (Revised)1
Component Amount
a. Service Cost 1,035$ b. Interest on the Total Pension Liability 2,097c. Changes of Assumptions 0d. Differences between Expected and Actual Experience 106e. Employee Contributions (277)f. Projected Earnings on Pension Plan Investments (1,618)g. Differences between Projected and Actual Earnings on Plan Investments (1,600)h. Pension Plan Administrative Expenses 77i. Payment of Interest on TDA Fixed Funds 596j. Other Changes in Fiduciary Net Position 364
SubTotal 780$
k. Changes in Proportionate Share 3,589
Total Pension Expense 4,369$
1 Post-Publication Adjustment to Assets at June 30, 2014 and Restated Assets at June 30, 2015.
Governmental Accounting Standards Board Statements No. 67 and No. 68 (GASB 67/68)
KIPP

Appendix CPage 4b(1)
NYC Office of the Actuary October 11, 2016
NEW YORK CITY BOARD OF EDUCATION RETIREMENT SYSTEM (BERS)
Components of Pension Expense for the Fiscal Year Ended June 30, 2016
Component Amount
a. Service Cost 153,106,995$ b. Interest on the Total Pension Liability 320,315,152c. Differences between Expected and Actual Experience (8,598,975)d. Changes of Assumptions 57,579,037e. Employee Contributions (38,581,000)f. Projected Earnings on Pension Plan Investments (231,517,543)g. Differences between Projected and Actual Earnings on Plan Investments (215,120,463)h. Pension Plan Administrative Expenses 12,818,000i. Payment of Interest on TDA Fixed Funds 94,789,000j. Other Changes in Fiduciary Net Position 157,499,000
Total Pension Expense 302,289,203$
Governmental Accounting Standards Board Statements No. 67 and No. 68 (GASB 67/68)

Appendix CPage 4b(2)
NYC Office of the Actuary October 11, 2016
NEW YORK CITY BOARD OF EDUCATION RETIREMENT SYSTEM (BERS)
Components of Pension Expense for the Fiscal Year Ended June 30, 2016
Component Amount
a. Service Cost 148,219,819$ b. Interest on the Total Pension Liability 310,090,692c. Differences between Expected and Actual Experience (8,324,495)d. Changes of Assumptions 55,741,114e. Employee Contributions (37,349,495)f. Projected Earnings on Pension Plan Investments (224,127,503)g. Differences between Projected and Actual Earnings on Plan Investments (208,253,817)h. Pension Plan Administrative Expenses 12,408,849i. Payment of Interest on TDA Fixed Funds 91,763,335j. Other Changes in Fiduciary Net Position 152,471,633
SubTotal 292,640,132$
k. Changes in Proportionate Share 4,261,390
Total Pension Expense 296,901,522$
Department of Education
Governmental Accounting Standards Board Statements No. 67 and No. 68 (GASB 67/68)

Appendix CPage 4b(3)
NYC Office of the Actuary October 11, 2016
NEW YORK CITY BOARD OF EDUCATION RETIREMENT SYSTEM (BERS)
Components of Pension Expense for the Fiscal Year Ended June 30, 2016
Component Amount
a. Service Cost 4,866,812$ b. Interest on the Total Pension Liability 10,181,858c. Differences between Expected and Actual Experience (273,336)d. Changes of Assumptions 1,830,265e. Employee Contributions (1,226,374)f. Projected Earnings on Pension Plan Investments (7,359,248)g. Differences between Projected and Actual Earnings on Plan Investments (6,838,034)h. Pension Plan Administrative Expenses 407,446i. Payment of Interest on TDA Fixed Funds 3,013,058j. Other Changes in Fiduciary Net Position 5,006,421
SubTotal 9,608,868$
k. Changes in Proportionate Share (4,292,201)
Total Pension Expense 5,316,667$
School Construction Authority
Governmental Accounting Standards Board Statements No. 67 and No. 68 (GASB 67/68)

Appendix CPage 4b(4)
NYC Office of the Actuary October 11, 2016
NEW YORK CITY BOARD OF EDUCATION RETIREMENT SYSTEM (BERS)
Components of Pension Expense for the Fiscal Year Ended June 30, 2016
Component Amount
a. Service Cost 11,177$ b. Interest on the Total Pension Liability 23,383c. Differences between Expected and Actual Experience (628)d. Changes of Assumptions 4,203e. Employee Contributions (2,816)f. Projected Earnings on Pension Plan Investments (16,901)g. Differences between Projected and Actual Earnings on Plan Investments (15,704)h. Pension Plan Administrative Expenses 936i. Payment of Interest on TDA Fixed Funds 6,920j. Other Changes in Fiduciary Net Position 11,497
SubTotal 22,067$
k. Changes in Proportionate Share 1,223
Total Pension Expense 23,290$
Beginning with Children
Governmental Accounting Standards Board Statements No. 67 and No. 68 (GASB 67/68)

Appendix CPage 4b(5)
NYC Office of the Actuary October 11, 2016
NEW YORK CITY BOARD OF EDUCATION RETIREMENT SYSTEM (BERS)
Components of Pension Expense for the Fiscal Year Ended June 30, 2016
Component Amount
a. Service Cost 8,421$ b. Interest on the Total Pension Liability 17,617c. Differences between Expected and Actual Experience (473)d. Changes of Assumptions 3,167e. Employee Contributions (2,122)f. Projected Earnings on Pension Plan Investments (12,733)g. Differences between Projected and Actual Earnings on Plan Investments (11,832)h. Pension Plan Administrative Expenses 705i. Payment of Interest on TDA Fixed Funds 5,213j. Other Changes in Fiduciary Net Position 8,662
SubTotal 16,625$
k. Changes in Proportionate Share 26,968
Total Pension Expense 43,593$
Renaissance
Governmental Accounting Standards Board Statements No. 67 and No. 68 (GASB 67/68)

Appendix CPage 4b(6)
NYC Office of the Actuary October 11, 2016
NEW YORK CITY BOARD OF EDUCATION RETIREMENT SYSTEM (BERS)
Components of Pension Expense for the Fiscal Year Ended June 30, 2016
Component Amount
a. Service Cost 766$ b. Interest on the Total Pension Liability 1,602c. Differences between Expected and Actual Experience (43)d. Changes of Assumptions 288e. Employee Contributions (193)f. Projected Earnings on Pension Plan Investments (1,158)g. Differences between Projected and Actual Earnings on Plan Investments (1,076)h. Pension Plan Administrative Expenses 64i. Payment of Interest on TDA Fixed Funds 474j. Other Changes in Fiduciary Net Position 787
SubTotal 1,511$
k. Changes in Proportionate Share 2,620
Total Pension Expense 4,131$
Governmental Accounting Standards Board Statements No. 67 and No. 68 (GASB 67/68)
KIPP

Appendix CPage 4c
NYC Office of the Actuary October 11, 2016
Component DOE SCA BWCCS REN KIPP Total
a. Service Cost 142,829,220$ 5,044,081$ 11,832$ 12,423$ 1,035$ 147,898,591$ b. Interest on the Total Pension Liability 289,323,184 10,217,585 23,967 25,166 2,097 299,591,999c. Changes of Assumptions 0 0 0 0 0 0d. Differences between Expected and Actual Experience 14,675,413 518,269 1,216 1,276 106 15,196,280e. Employee Contributions (38,207,905) (1,349,330) (3,165) (3,323) (277) (39,564,000)f. Projected Earnings on Pension Plan Investments (223,263,342) (7,884,651) (18,495) (19,420) (1,618) (231,187,526)g. Differences between Projected and Actual Earnings on Plan Investments (220,759,844) (7,796,238) (18,288) (19,202) (1,600) (228,595,172)h. Pension Plan Administrative Expenses 10,580,473 373,654 876 920 77 10,956,000i. Payment of Interest on TDA Fixed Funds 82,186,975 2,902,472 6,808 7,149 596 85,104,000j. Other Changes in Fiduciary Net Position 50,237,928 1,774,176 4,162 4,370 364 52,021,000k. Changes in Proportionate Share 3,120,188 (3,169,406) 4,614 41,015 3,589 0
Total Pension Expense 110,722,290$ 630,612$ 13,527$ 50,374$ 4,369$ 111,421,172$
1 Post-Publication Adjustment to Assets at June 30, 2014 and Restated Assets at June 30, 2015.
NEW YORK CITY BOARD OF EDUCATION RETIREMENT SYSTEM (BERS)
Governmental Accounting Standards Board Statements No. 67 and No. 68 (GASB 67/68)
Components of Pension Expense for the Fiscal Year Ended June 30, 2015 - By Obligor (Revised)1

Appendix CPage 4d
NYC Office of the Actuary October 11, 2016
Component DOE SCA BWCCS REN KIPP Total
a. Service Cost 148,219,819$ 4,866,812$ 11,177$ 8,421$ 766$ 153,106,995$ b. Interest on the Total Pension Liability 310,090,692 10,181,858 23,383 17,617 1,602 320,315,152c. Differences between Expected and Actual Experience (8,324,495) (273,336) (628) (473) (43) (8,598,975)d. Changes of Assumptions 55,741,114 1,830,265 4,203 3,167 288 57,579,037e. Employee Contributions (37,349,495) (1,226,374) (2,816) (2,122) (193) (38,581,000)f. Projected Earnings on Pension Plan Investments (224,127,503) (7,359,248) (16,901) (12,733) (1,158) (231,517,543)g. Differences between Projected and Actual Earnings on Plan Investments (208,253,817) (6,838,034) (15,704) (11,832) (1,076) (215,120,463)h. Pension Plan Administrative Expenses 12,408,849 407,446 936 705 64 12,818,000i. Payment of Interest on TDA Fixed Funds 91,763,335 3,013,058 6,920 5,213 474 94,789,000j. Other Changes in Fiduciary Net Position 152,471,633 5,006,421 11,497 8,662 787 157,499,000k. Changes in Proportionate Share 4,261,390 (4,292,201) 1,223 26,968 2,620 0
Total Pension Expense 296,901,522$ 5,316,667$ 23,290$ 43,593$ 4,131$ 302,289,203$
NEW YORK CITY BOARD OF EDUCATION RETIREMENT SYSTEM (BERS)
Governmental Accounting Standards Board Statements No. 67 and No. 68 (GASB 67/68)
Components of Pension Expense for the Fiscal Year Ended June 30, 2016 - By Obligor

Appendix CPage 5a
NYC Office of the Actuary October 11, 2016
For the Fiscal Year ended June 30, 2013, the Obligors recognized Pension Expense for BERS of $463,678,552.
At June 30, 2013, the Obligors reported total Deferred Outflows of Resources and Deferred Inflows of Resources related to pensions for BERS from the following sources:
Deferred DeferredOutflows Inflows
of Resources of Resources
Differences between Expected and Actual Experience 0$ 0$
Changes of Assumptions 0 0
Net Difference between Projected and Actual Earnings on Pension Plan Investments 0 404,309,763
Total 0$ 404,309,763$
Amounts reported as Deferred Outflows of Resources and Deferred Inflows of Resources related to Pensions for BERS will be recognized in Pension Expense as follows:
Fiscal YearEnded June 30 Amount2013 (101,077,441)$ 2014 (101,077,441)2015 (101,077,441)2016 (101,077,441)2017 (101,077,440)
NEW YORK CITY BOARD OF EDUCATION RETIREMENT SYSTEM (BERS)
Governmental Accounting Standards Board Statements No. 67 and No. 68 (GASB 67/68)
Pension Expense, Deferred Outflows of Resources, Deferred Inflows of Resources

Appendix CPage 5b
NYC Office of the Actuary October 11, 2016
For the Fiscal Year ended June 30, 2014, the Obligors recognized Pension Expense for BERS of $257,720,131.
For June 30, 2014, the Obligors determined Deferred Outflows of Resources and Deferred Inflows of Resources related to pensions for BERS from the following sources:
Deferred DeferredOutflows Inflows
of Resources of Resources
Differences between Expected and Actual Experience 0$ 0$
Changes of Assumptions 0 0
Net Difference between Projected and Actual Earnings on Pension Plan Investments 0 553,288,146
Total 0$ 553,288,146$
Amounts reported as Deferred Outflows of Resources and Deferred Inflows of Resources related to Pensions for BERS will be recognized in Pension Expense as follows:
Fiscal YearEnded June 30 Amount2014 (138,322,036)$ 2015 (138,322,036)2016 (138,322,036)2017 (138,322,036)2018 (138,322,038)
NEW YORK CITY BOARD OF EDUCATION RETIREMENT SYSTEM (BERS)
Governmental Accounting Standards Board Statements No. 67 and No. 68 (GASB 67/68)
Pension Expense, Deferred Outflows of Resources, Deferred Inflows of Resources

Appendix CPage 5c
NYC Office of the Actuary October 11, 2016
For the Fiscal Year ended June 30, 2015, the Obligors recognized Pension Expense for BERS of $111,421,172.
For June 30, 2015, the Obligors determined Deferred Outflows of Resources and Deferred Inflows of Resources related to pensions for BERS from the following sources:
Deferred DeferredOutflows Inflows
of Resources of Resources
Differences between Expected and Actual Experience 34,951,444$ 0$
Changes of Assumptions 0 0
Net Difference between Projected and Actual Earnings on Pension Plan Investments 43,217,221 0
Total 78,168,665$ 0$
Amounts reported as Deferred Outflows of Resources and Deferred Inflows of Resources related to Pensions for BERS will be recognized in Pension Expense as follows:
Fiscal YearEnded June 30 Amount2015 26,000,585$ 2016 26,000,5852017 26,000,5852018 15,363,1892019 10,804,306
1 Post-Publication Adjustment to Assets at June 30, 2014 and Restated Assets at June 30, 2015.
NEW YORK CITY BOARD OF EDUCATION RETIREMENT SYSTEM (BERS)
Governmental Accounting Standards Board Statements No. 67 and No. 68 (GASB 67/68)
Pension Expense, Deferred Outflows of Resources, Deferred Inflows of Resources (Revised)1

Appendix CPage 5d
NYC Office of the Actuary October 11, 2016
For the Fiscal Year ended June 30, 2016, the Obligors recognized Pension Expense for BERS of $302,289,203.
For June 30, 2016, the Obligors determined Deferred Outflows of Resources and Deferred Inflows of Resources related to pensions for BERS from the following sources:
Deferred DeferredOutflows Inflows
of Resources of Resources
Differences between Expected and Actual Experience 0$ 52,111,609$
Changes of Assumptions 126,098,092 0
Net Difference between Projected and Actual Earnings on Pension Plan Investments 53,898,834 0
Total 179,996,926$ 52,111,609$
Amounts reported as Deferred Outflows of Resources and Deferred Inflows of Resources related to Pensions for BERS will be recognized in Pension Expense as follows:
Fiscal YearEnded June 30 Amount2016 47,258,491$ 2017 47,258,4912018 47,258,4912019 19,893,6282020 13,474,707
NEW YORK CITY BOARD OF EDUCATION RETIREMENT SYSTEM (BERS)
Governmental Accounting Standards Board Statements No. 67 and No. 68 (GASB 67/68)
Pension Expense, Deferred Outflows of Resources, Deferred Inflows of Resources
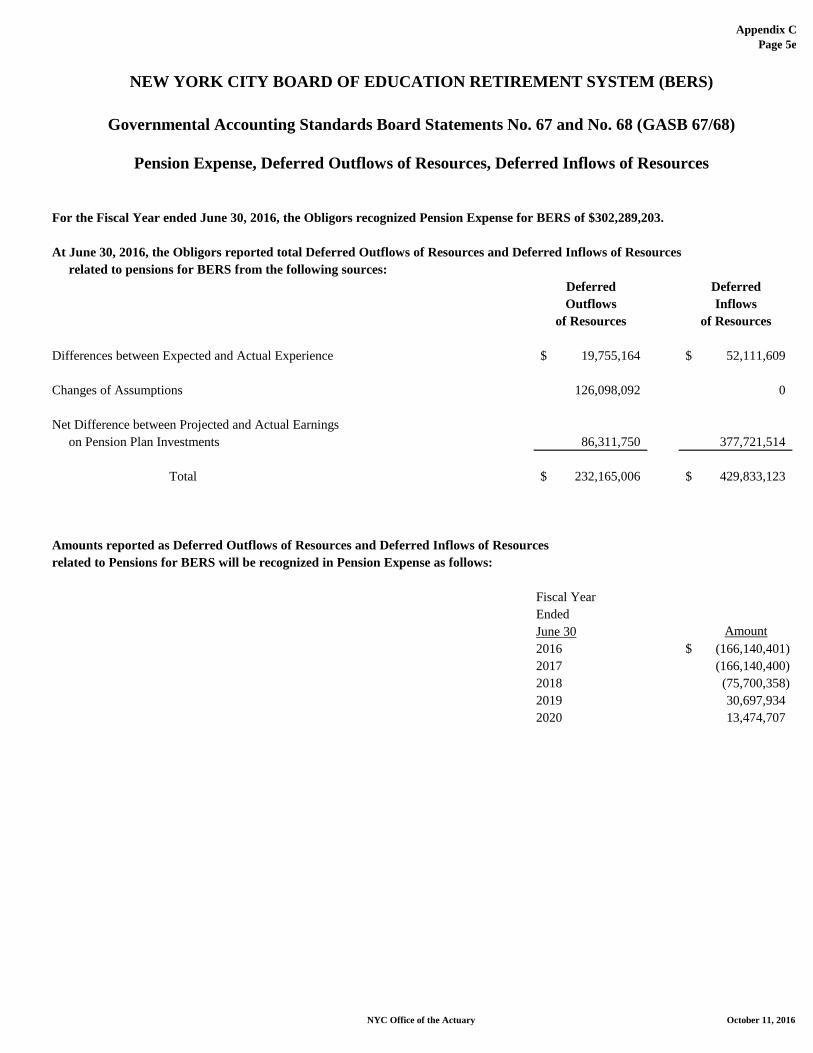
Appendix CPage 5e
NYC Office of the Actuary October 11, 2016
For the Fiscal Year ended June 30, 2016, the Obligors recognized Pension Expense for BERS of $302,289,203.
At June 30, 2016, the Obligors reported total Deferred Outflows of Resources and Deferred Inflows of Resources related to pensions for BERS from the following sources:
Deferred DeferredOutflows Inflows
of Resources of Resources
Differences between Expected and Actual Experience 19,755,164$ 52,111,609$
Changes of Assumptions 126,098,092 0
Net Difference between Projected and Actual Earnings on Pension Plan Investments 86,311,750 377,721,514
Total 232,165,006$ 429,833,123$
Amounts reported as Deferred Outflows of Resources and Deferred Inflows of Resources related to Pensions for BERS will be recognized in Pension Expense as follows:
Fiscal YearEnded June 30 Amount2016 (166,140,401)$ 2017 (166,140,400)2018 (75,700,358)2019 30,697,9342020 13,474,707
NEW YORK CITY BOARD OF EDUCATION RETIREMENT SYSTEM (BERS)
Governmental Accounting Standards Board Statements No. 67 and No. 68 (GASB 67/68)
Pension Expense, Deferred Outflows of Resources, Deferred Inflows of Resources

Appendix CPage 6
NYC Office of the Actuary October 11, 2016
Fiscal Year Ended June 30 2016 2015 2014 2013 2012 2011 2010 2009 2008 2007
Actuarially Determined Contribution 265,532$ 258,099$ 214,590$ 196,246$ 213,651$ 180,191$ 147,349$ 134,225$ 143,100$ 129,820$
Contributions in relation to the Actuarially Determined Contribution 265,532$ 258,099$ 214,590$ 196,246$ 213,651$ 180,191$ 147,349$ 134,225$ 143,100$ 129,820$
Contribution Deficency (Excess) 0 0 0 0 0 0 0 0 0 0
Contributions as a percentage of Covered Employee Payroll 1 26.341% 25.383% 21.694% 22.145% 24.293% 20.461% 17.822% 17.766% 19.627% 18.641%
1
NEW YORK CITY BOARD OF EDUCATION RETIREMENT SYSTEM (BERS)
Governmental Accounting Standards Board Statements No. 67 and No. 68 (GASB 67/68)
Schedule of Employer Contributions ($ in thousands)
The Employer Rate of Contribution equals the Statutory Contribution as a percentage of the salaries of members who were on payroll or projected to be on payroll (under One-Year Lag Methodology) as of the preceding June 30 adjusted, where be consistent with collective bargaining agreements estimated to be achieved.

Appendix CPage 7
NYC Office of the Actuary October 11, 2016
NEW YORK CITY BOARD OF EDUCATION RETIREMENT SYSTEM (BERS)
Governmental Accounting Standards Board Statements No. 67 and No. 68 (GASB 67/68)
Statement of Fiduciary Net Position - QPP OnlyJune 30, 2016 and June 30, 2015
(Dollar amounts in thousands)
June 30, 2016 June 30, 2015 (Revised)1
ASSETSCash 327$ 16,143$
Receivables:Investment securities sold 119,062 50,839 Member loans 46,748 44,675 Accrued interest and dividends 247 239 Other 3 3
Total receivables 166,060$ 95,756$
Investments - at fair valueFixed Return Funds:
Short-term investments:Commercial paper 71,888 148,449 Short-term investment fund 35,933 35,597 Discount notes 0 25,996
Debt securities: 879,762 851,577 Equity securities 291,144 334,325 Alternative investments 506,922 385,819 Collective Trust Funds:
International equity 942,911 969,838 Domestic equity 1,401,665 1,432,065 Mortgage debt security 28,956 23,862 Treasury inflation protected securities 218,608 139,367 Fixed income 106,684 85,942
Collateral from securities lending 476,001 298,872
Variable Return Funds:Short-term investments 571 553 Debt securities 976 1,024 Equities 40,953 44,666 Collateral from securities lending 1,622 3,263
Total Investments 5,004,596$ 4,781,215$
Other assets 124,031 106,254
Total assets 5,295,014$ 4,999,368$
LIABILITIESAccounts payable 6,907 6,199 Payables for investment securities purchased 103,213 86,747 Accrued benefits payable 7,357 5,461 Due to TDA Program from the System 1,283,481 1,144,817 Securities lending 477,623 302,135
Total liabilities 1,878,581$ 1,545,359$
Plan Net Position Held in Trust for Benefits 3,416,433$ 3,454,009$
1 Restated from Prior Year.

Appendix CPage 8
NYC Office of the Actuary October 11, 2016
NEW YORK CITY BOARD OF EDUCATION RETIREMENT SYSTEM (BERS)
Governmental Accounting Standards Board Statements No. 67 and No. 68 (GASB 67/68)
Statement of Changes in Fiduciary Net Position - QPP OnlyJune 30, 2016 and June 30, 2015
(Dollar amounts in thousands)
June 30, 2016 June 30, 2015 (Revised)1
Fixed Variable Fixed VariableADDITIONS
Contributions:Member Contributions 38,563$ 18$ 39,542$ 22$ Employer Contributions 265,532 0 258,099 0
Total contributions 304,095$ 18$ 297,641$ 22$
Investment income:Interest income 44,740 42 36,858 40Dividend income 50,527 801 45,422 785Net appreciation (depreciation) in fair value 80,059 (1,045) 99,931 1,565
Total investment income 175,326$ (202)$ 182,211$ 2,390$
Less:Investment expenses 14,296 0 10,098 0
Net income 161,030 (202) 172,113 2,390
Securities lending transactions:Securities lending income 3,547 0 2,849 0Securities lending fees (231) 0 (186) 0
Net securities lending income 3,316 0 2,663 0
Net investment income 164,346 (202) 174,776 2,390Other:
Net receipts from other retirement systems (157,499) 0 (52,021) 0Litigation income 0 0 0 0
Total additions 310,942$ (184)$ 420,396$ 2,412$
DEDUCTIONSBenefit payments and withdrawals 237,206 3,521 219,570 3,674Payment of Interest on TDA Fixed Funds 94,789 0 85,104 0Administrative expenses 12,818 0 10,956 0
Total deductions 344,813$ 3,521$ 315,630$ 3,674$
INCREASE IN PLAN NET POSITION (33,871) (3,705) 104,766 (1,262)
PLAN NET POSITION HELD IN TRUST FOR BENEFITS:Beginning of year 3,407,717$ 46,292$ 3,231,711$ 47,554$ Prior year adjustments 0 0 71,240 0Beginning of year restated 3,407,717$ 46,292$ 3,302,951$ 47,554$
End of year 3,373,846$ 42,587$ 3,407,717$ 46,292$
1 Restated from Prior Year.

Appendix CPage 9
NYC Office of the Actuary October 11, 2016
Long-TermTarget ExpectedAsset Real Rate
Asset Class Allocation of Return
U.S. Public Market Equities 35.00% 6.60%
International Public Market Equities 17.00% 7.00%
Emerging Public Market Equities 5.00% 7.90%
Private Market Equities 6.00% 9.90%
Fixed Income (Core, TIPS, HY, Opportunistic, Convertibles) 30.00% 2.70%
Alternatives (Real Assets, Hedge Funds) 7.00% 4.00%
Total 100.00%
NEW YORK CITY BOARD OF EDUCATION RETIREMENT SYSTEM (BERS)
Governmental Accounting Standards Board Statements No. 67 and No. 68 (GASB 67/68)
Long-Term Expected Rate of Return
The Long-Term Expected Rate of Return (LTEROR) assumption on pension fund investments was determined using aBuilding-Block Method in which best-estimate ranges of Expected Real Rates of Return (i.e., Expected Returns, net ofpension fund investment expenses and inflation) are developed for each major asset class. These ranges are combined toproduce the LTEROR by weighting the Expected Real Rates of Return (RROR) by the Target Asset Allocation percentageand by adding Expected Inflation. The Target Asset Allocation and best estimates of Arithmetic Real Rates of Return foreach major asset class are summarized in the following table:
The Discount Rate used to measure the Total Pension Liability was 7.0% per annum. The projection of Cash Flows used todetermine the Discount Rate assumes that employee contributions will be made at the rates applicable to the current Tier foreach member and that employer contributions will be made at rates as determined by the Actuary. Based on thoseassumptions, the pension fund's Fiduciary Net Position is projected to be available to make all projected future benefitpayments of current active and non-active members. Therefore, the Long-Term Expected Rate of Return on pension fundinvestments was applied to all periods of projected benefit payments to determine the Total Pension Liability.

Appendix CPage 10a
NYC Office of the Actuary October 11, 2016
2015Actual Employer
Employer AllocationEmployer Contributions Percentage
Department of Education (DOE) 249,252,547$ 96.5724%
School Construction Authority (SCA) 8,802,540 3.4105%
Beginning with Children Charter School (BwCCS) 20,715 0.0080%
Renaissance Charter School (REN) 21,744 0.0084%
KIPP Charter School (KIPP) 1,781 0.0007%
Total 258,099,327$ 100.0000%
NEW YORK CITY BOARD OF EDUCATION RETIREMENT SYSTEM (BERS)
Governmental Accounting Standards Board Statements No. 67 and No. 68 (GASB 67/68)
Schedule of Employer AllocationsJune 30, 2015

Appendix CPage 10b
NYC Office of the Actuary October 11, 2016
2016Actual Employer
Employer AllocationEmployer Contributions Percentage
Department of Education (DOE) 257,056,122$ 96.8080%
School Construction Authority (SCA) 8,440,432 3.1787%
Beginning with Children Charter School (BwCCS) 19,385 0.0073%
Renaissance Charter School (REN) 14,693 0.0055%
KIPP Charter School (KIPP) 1,400 0.0005%
Total 265,532,032$ 100.0000%
NEW YORK CITY BOARD OF EDUCATION RETIREMENT SYSTEM (BERS)
Governmental Accounting Standards Board Statements No. 67 and No. 68 (GASB 67/68)
Schedule of Employer AllocationsJune 30, 2016

Appendix CPage 11a
NYC Office of the Actuary October 11, 2016
NEW YORK CITY BOARD OF EDUCATION RETIREMENT SYSTEM (BERS)
Governmental Accounting Standards Board Statements No. 67 and No. 68 (GASB 67/68)
Increase (Decrease) in Pension Expense Arising from the Recognition of Differencesbetween Projected and Actual Earnings on Pension Plan Investments (Revised) 1
Differencesbetween Projected
and ActualEarnings on RecognitionPension Plan Period
Year Investments (Years) 2013 2014 2015 2016 2017 2018 2019 20202013 (505,387,204)$ 5 (101,077,441) (101,077,441) (101,077,441) (101,077,441) (101,077,440)2014 (691,610,182)$ 5 (138,322,036) (138,322,036) (138,322,036) (138,322,036) (138,322,038)2015 54,021,526$ 5 10,804,305 10,804,305 10,804,305 10,804,305 10,804,3062016 67,373,543$ 5 13,474,709 13,474,709 13,474,709 13,474,709 13,474,707201720182019
Net increase (decrease) in Pension Expense (101,077,441)$ (239,399,477)$ (228,595,172)$ (215,120,463)$ (215,120,462)$ (114,043,024)$ 24,279,015$ 13,474,707$
1 Post-Publication Adjustment to Assets at June 30, 2014 and Restated Assets at June 30, 2015.

Appendix CPage 11b
NYC Office of the Actuary October 11, 2016
NEW YORK CITY BOARD OF EDUCATION RETIREMENT SYSTEM (BERS)
Governmental Accounting Standards Board Statements No. 67 and No. 68 (GASB 67/68)
Increase (Decrease) in Pension Expense Arising from the Recognition of Differencesbetween Expected and Actual Experience
Differencesbetween Expected Recognition
and Actual PeriodYear Experience (Years) 2015 2016 2017 2018 20192015 50,147,724$ 3.30 15,196,280 15,196,280 15,196,280 4,558,884 02016 (75,906,864)$ 3.19 (23,795,255) (23,795,255) (23,795,255) (4,521,099)20172018201920202021
Net increase (decrease) in Pension Expense 15,196,280$ (8,598,975)$ (8,598,975)$ (19,236,371)$ (4,521,099)$

Appendix CPage 11c
NYC Office of the Actuary October 11, 2016
NEW YORK CITY BOARD OF EDUCATION RETIREMENT SYSTEM (BERS)
Governmental Accounting Standards Board Statements No. 67 and No. 68 (GASB 67/68)
Increase (Decrease) in Pension Expense Arising from the Recognition of Changes in Assumptions
Changes Recognitionin Period
Year Assumptions (Years) 2016 2017 2018 2019 20202016 183,677,129$ 3.19 57,579,037 57,579,037 57,579,037 10,940,018 0201720182019202020212022
Net increase (decrease) in Pension Expense 57,579,037$ 57,579,037$ 57,579,037$ 10,940,018$ 0$

Appendix CPage 12a
NYC Office of the Actuary October 11, 2016
Department of (1) (2) (3) (3)-(2)Education Proportionate Proportionate
Collective Share Share Change in RecognitionAmount at 6/30/2014 at 6/30/2015 Proportionate Period
at 6/30/2014 95.9638% 96.5724% Share (Years) 2015 2016 2017 2018Deferred Outflows
of Resources 0 0 0 0 3.30 0 0 0 0
Deferred Inflowsof Resources (856,520,468) (821,949,589) (827,162,372) (5,212,783) 3.30 (1,579,631) (1,579,631) (1,579,631) (473,890)
Net Pension Liability (835,333,562) (801,617,829) (806,701,669) (5,083,840) 3.30 (1,540,557) (1,540,557) (1,540,557) (462,169)
Total (1,691,854,030) (1,623,567,418) (1,633,864,041) (10,296,623) (3,120,188) (3,120,188) (3,120,188) (936,059)
School Construction (1) (2) (3) (3)-(2)Authority Proportionate Proportionate
Collective Share Share Change in RecognitionAmount at 6/30/2014 at 6/30/2015 Proportionate Period
at 6/30/2014 4.0287% 3.4105% Share (Years) 2015 2016 2017 2018Deferred Outflows
of Resources 0 0 0 0 3.30 0 0 0 0
Deferred Inflowsof Resources (856,520,468) (34,506,640) (29,211,631) 5,295,009 3.30 1,604,548 1,604,548 1,604,548 481,365
Net Pension Liability (835,333,562) (33,653,083) (28,489,051) 5,164,032 3.30 1,564,858 1,564,858 1,564,858 469,458
Total (1,691,854,030) (68,159,723) (57,700,682) 10,459,041 3,169,406 3,169,406 3,169,406 950,823
Beginning with (1) (2) (3) (3)-(2)Children Proportionate Proportionate
Collective Share Share Change in RecognitionAmount at 6/30/2014 at 6/30/2015 Proportionate Period
at 6/30/2014 0.0071% 0.0080% Share (Years) 2015 2016 2017 2018Deferred Outflows
of Resources 0 0 0 0 3.30 0 0 0 0
Deferred Inflowsof Resources (856,520,468) (60,813) (68,522) (7,709) 3.30 (2,336) (2,336) (2,336) (701)
Net Pension Liability (835,333,562) (59,309) (66,827) (7,518) 3.30 (2,278) (2,278) (2,278) (684)
Total (1,691,854,030) (120,122) (135,349) (15,227) (4,614) (4,614) (4,614) (1,385)
Renaissance (1) (2) (3) (3)-(2)Proportionate Proportionate
Collective Share Share Change in RecognitionAmount at 6/30/2014 at 6/30/2015 Proportionate Period
at 6/30/2014 0.0004% 0.0084% Share (Years) 2015 2016 2017 2018Deferred Outflows
of Resources 0 0 0 0 3.30 0 0 0 0
Deferred Inflowsof Resources (856,520,468) (3,426) (71,948) (68,522) 3.30 (20,764) (20,764) (20,764) (6,230)
Net Pension Liability (835,333,562) (3,341) (70,168) (66,827) 3.30 (20,251) (20,251) (20,251) (6,074)
Total (1,691,854,030) (6,767) (142,116) (135,349) (41,015) (41,015) (41,015) (12,304)
KIPP (1) (2) (3) (3)-(2)Proportionate Proportionate
Collective Share Share Change in RecognitionAmount at 6/30/2014 at 6/30/2015 Proportionate Period
at 6/30/2014 0.0000% 0.0007% Share (Years) 2015 2016 2017 2018Deferred Outflows
of Resources 0 0 0 0 3.30 0 0 0 0
Deferred Inflowsof Resources (856,520,468) 0 (5,995) (5,995) 3.30 (1,817) (1,817) (1,817) (544)
Net Pension Liability (835,333,562) 0 (5,847) (5,847) 3.30 (1,772) (1,772) (1,772) (531)
Total (1,691,854,030) 0 (11,842) (11,842) (3,589) (3,589) (3,589) (1,075)
1 Revised for Post-Publication Adjustment.
Amount to Recognize in Pension Expense
NEW YORK CITY BOARD OF EDUCATION RETIREMENT SYSTEM (BERS)
Governmental Accounting Standards Board Statements No. 67 and No. 68 (GASB 67/68)
Changes in Proportionate Share at 6/30/2015 (Revised) 1
Amount to Recognize in Pension ExpenseFor the Fiscal Year Ended June 30
For the Fiscal Year Ended June 30
For the Fiscal Year Ended June 30
Amount to Recognize in Pension ExpenseFor the Fiscal Year Ended June 30
Amount to Recognize in Pension ExpenseFor the Fiscal Year Ended June 30
Amount to Recognize in Pension Expense

Appendix CPage 12b
NYC Office of the Actuary October 11, 2016
Department of (1) (2) (3) (3)-(2)Education Proportionate Proportionate
Collective Share Share Change in RecognitionAmount at 6/30/2015 at 6/30/2016 Proportionate Period
at 6/30/2015 96.5724% 96.8080% Share (Years) 2016 2017 2018 2019Deferred Outflows
of Resources 78,168,665 75,489,357 75,673,522 184,165 3.19 57,732 57,732 57,732 10,969
Deferred Inflowsof Resources (617,120,991) (595,968,552) (597,422,488) (1,453,936) 3.19 (455,779) (455,779) (455,779) (86,599)
Net Pension Liability (1,006,223,876) (971,734,546) (974,105,211) (2,370,665) 3.19 (743,155) (743,155) (743,155) (141,200)
Total (1,545,176,202) (1,492,213,741) (1,495,854,177) (3,640,436) (1,141,202) (1,141,202) (1,141,202) (216,830)
School Construction (1) (2) (3) (3)-(2)Authority Proportionate Proportionate
Collective Share Share Change in RecognitionAmount at 6/30/2015 at 6/30/2016 Proportionate Period
at 6/30/2015 3.4105% 3.1787% Share (Years) 2016 2017 2018 2019Deferred Outflows
of Resources 78,168,665 2,665,942 2,484,747 (181,195) 3.19 (56,801) (56,801) (56,801) (10,792)
Deferred Inflowsof Resources (617,120,991) (21,046,911) (19,616,425) 1,430,486 3.19 448,428 448,428 448,428 85,202
Net Pension Liability (1,006,223,876) (34,317,265) (31,984,838) 2,332,427 3.19 731,168 731,168 731,168 138,923
Total (1,545,176,202) (52,698,234) (49,116,516) 3,581,718 1,122,795 1,122,795 1,122,795 213,333
Beginning with (1) (2) (3) (3)-(2)Children Proportionate Proportionate
Collective Share Share Change in RecognitionAmount at 6/30/2015 at 6/30/2016 Proportionate Period
at 6/30/2015 0.0080% 0.0073% Share (Years) 2016 2017 2018 2019Deferred Outflows
of Resources 78,168,665 6,253 5,706 (547) 3.19 (171) (171) (171) (34)
Deferred Inflowsof Resources (617,120,991) (49,370) (45,050) 4,320 3.19 1,354 1,354 1,354 258
Net Pension Liability (1,006,223,876) (80,498) (73,454) 7,044 3.19 2,208 2,208 2,208 420
Total (1,545,176,202) (123,615) (112,798) 10,817 3,391 3,391 3,391 644
Renaissance (1) (2) (3) (3)-(2)Proportionate Proportionate
Collective Share Share Change in RecognitionAmount at 6/30/2015 at 6/30/2016 Proportionate Period
at 6/30/2015 0.0084% 0.0055% Share (Years) 2016 2017 2018 2019Deferred Outflows
of Resources 78,168,665 6,566 4,299 (2,267) 3.19 (711) (711) (711) (134)
Deferred Inflowsof Resources (617,120,991) (51,838) (33,942) 17,896 3.19 5,610 5,610 5,610 1,066
Net Pension Liability (1,006,223,876) (84,523) (55,342) 29,181 3.19 9,148 9,148 9,148 1,737
Total (1,545,176,202) (129,795) (84,985) 44,810 14,047 14,047 14,047 2,669
KIPP (1) (2) (3) (3)-(2)Proportionate Proportionate
Collective Share Share Change in RecognitionAmount at 6/30/2015 at 6/30/2016 Proportionate Period
at 6/30/2015 0.0007% 0.0005% Share (Years) 2016 2017 2018 2019Deferred Outflows
of Resources 78,168,665 547 391 (156) 3.19 (49) (49) (49) (9)
Deferred Inflowsof Resources (617,120,991) (4,320) (3,086) 1,234 3.19 387 387 387 73
Net Pension Liability (1,006,223,876) (7,044) (5,031) 2,013 3.19 631 631 631 120
Total (1,545,176,202) (10,817) (7,726) 3,091 969 969 969 184
Amount to Recognize in Pension ExpenseFor the Fiscal Year Ended June 30
For the Fiscal Year Ended June 30
NEW YORK CITY BOARD OF EDUCATION RETIREMENT SYSTEM (BERS)
Governmental Accounting Standards Board Statements No. 67 and No. 68 (GASB 67/68)
Changes in Proportionate Share at 6/30/2016
For the Fiscal Year Ended June 30
Amount to Recognize in Pension Expense
Amount to Recognize in Pension Expense
Amount to Recognize in Pension Expense
Amount to Recognize in Pension Expense
For the Fiscal Year Ended June 30
For the Fiscal Year Ended June 30

Appendix CPage 13a
NYC Office of the Actuary October 11, 2016
NEW YORK CITY BOARD OF EDUCATION RETIREMENT SYSTEM (BERS)
Governmental Accounting Standards Board Statements No. 67 and No. 68 (GASB 67/68)
Schedule of Pension Amounts by EmployerAs of and for the year ended June 30, 2015 (Revised) 1
Net Amortization ofDeferred Amounts
Changes in Changes in from Changes inNet Difference Proportion Net Difference Proportion Proportion
Between and Differences Between and Differences and DifferencesProjected Between Projected Between Between
Differences and Actual Employer Total Differences and Actual Employer Total Proportionate EmployerBetween Investment Contributions Deferred Between Investment Contributions Deferred Share of Contributions TotalExpected Earnings on and Proportionate Outflows Expected Earnings on and Proportionate Inflows Plan and Proportionate Employer
Net Pension and Actual Pension Plan Changes of Share of of and Actual Pension Plan Changes of Share of of Pension Share of PensionEntity 2 Liability Experience Investments Assumptions Contributions Resources Experience Investments Assumptions Contributions Resources Expense Contributions Expense
DOE 971,734,545$ 33,753,448$ 41,735,908$ 0$ 7,176,435$ 82,665,791$ 0$ 595,968,552$ 0$ 0$ 595,968,552$ 107,602,102$ 3,120,188$ 110,722,290$
SCA 34,317,266 1,192,019 1,473,923 0 (7,289,635) (4,623,693) 0 21,046,911 0 0 21,046,911 3,800,018 (3,169,406) 630,612
BwCCS 80,498 2,796 3,457 0 10,613 16,866 0 49,370 0 0 49,370 8,913 4,614 13,527
REN 84,524 2,936 3,630 0 94,334 100,900 0 51,838 0 0 51,838 9,359 41,015 50,374
KIPP 7,043 245 303 0 8,253 8,801 0 4,320 0 0 4,320 780 3,589 4,369
Total 1,006,223,876$ 34,951,444$ 43,217,221$ 0$ 0$ 78,168,665$ 0$ 617,120,991$ 0$ 0$ 617,120,991$ 111,421,172$ 0$ 111,421,172$
1 Post-Publication Adjustment to Assets at June 30, 2014 and Restated Assets at June 30, 2015.
2 DOE - Department of Education SCA - School Construction Authority BwCCS - Beginning with Children Charter School REN - Renaissance Charter School KIPP - KIPP Charter School
Deferred Outflows of Resources Deferred Inflows of Resources Pension Expense

Appendix CPage 13b
NYC Office of the Actuary October 11, 2016
NEW YORK CITY BOARD OF EDUCATION RETIREMENT SYSTEM (BERS)
Governmental Accounting Standards Board Statements No. 67 and No. 68 (GASB 67/68)
Schedule of Pension Amounts by EmployerAs of and for the year ended June 30, 2016
Net Amortization ofDeferred Amounts
Changes in Changes in from Changes inNet Difference Proportion Net Difference Proportion Proportion
Between and Differences Between and Differences and DifferencesProjected Between Projected Between Between
Differences and Actual Employer Total Differences and Actual Employer Total Proportionate EmployerBetween Investment Contributions Deferred Between Investment Contributions Deferred Share of Contributions TotalExpected Earnings on and Proportionate Outflows Expected Earnings on and Proportionate Inflows Plan and Proportionate Employer
Net Pension and Actual Pension Plan Changes of Share of of and Actual Pension Plan Changes of Share of of Pension Share of PensionEntity Liability Experience Investments Assumptions Contributions Resources Experience Investments Assumptions Contributions Resources Expense Contributions Expense
DOE 1,340,079,542$ 19,124,579$ 83,556,678$ 122,073,042$ 6,681,914$ 231,436,213$ 50,448,206$ 365,664,642$ 0$ 126,433$ 416,239,281$ 292,640,132$ 4,261,390$ 296,901,522$
SCA 44,001,642 627,957 2,743,592 4,008,280 (6,703,546) 676,283 1,656,472 12,006,634 0 (124,394) 13,538,712 9,608,868 (4,292,201) 5,316,667
BwCCS 101,051 1,442 6,301 9,205 (1,803) 15,145 3,804 27,574 0 (376) 31,002 22,067 1,223 23,290
REN 76,133 1,087 4,747 6,935 21,000 33,769 2,866 20,775 0 (1,556) 22,085 16,625 26,968 43,593
KIPP 6,920 99 432 630 2,435 3,596 261 1,889 0 (107) 2,043 1,511 2,620 4,131
Total 1,384,265,288$ 19,755,164$ 86,311,750$ 126,098,092$ 0$ 232,165,006$ 52,111,609$ 377,721,514$ 0$ 0$ 429,833,123$ 302,289,203$ 0$ 302,289,203$
1 DOE - Department of Education SCA - School Construction Authority BwCCS - Beginning with Children Charter School REN - Renaissance Charter School KIPP - KIPP Charter School
Deferred Outflows of Resources Deferred Inflows of Resources Pension Expense

Appendix CPage 13c
NYC Office of the Actuary October 11, 2016
Net Difference Total Net Difference TotalBetween Deferred Between DeferredProjected Outflows of Projected Inflows of
Differences and Actual Resources Differences and Actual ResourcesBetween Investment Excluding Between Investment ExcludingExpected Earnings on Employer Expected Earnings on Employer Plan
Net Pension and Actual Pension Plan Changes of Specific and Actual Pension Plan Changes of Specific PensionLiability Experience Investments Assumptions Amounts Experience Investments Assumptions Amounts Expense
1,384,265,288$ 19,755,164$ 86,311,750$ 126,098,092$ 232,165,006$ 52,111,609$ 377,721,514$ 0$ 429,833,123$ 302,289,203$
Deferred Outflows of Resources Deferred Inflows of Resources
NEW YORK CITY BOARD OF EDUCATION RETIREMENT SYSTEM (BERS)
Governmental Accounting Standards Board Statements No. 67 and No. 68 (GASB 67/68)
Schedule of Collective Pension AmountsAs of and for the year ended June 30, 2016

Appendix CPage 14
NYC Office of the Actuary October 11, 2016
2016 2015 (Revised) 1
1. Total Pension Liabilitya. Service Cost 153,106,995$ 147,898,591$ b. Interest 320,315,152 299,591,999c. Changes of Benefit Terms 0 0d. Differences b/t Expected and Actual Experience (75,906,864) 50,147,724e. Changes of Assumptions 183,677,129 0f. Benefit Payments (240,727,000) (223,244,000)g. Net Changes in Total Pension Liability 340,465,412$ 274,394,314$
2. Total Pension Liability - Beginning 4,460,232,876$ 4,185,838,562$ 3. Total Pension Liability - Ending 4,800,698,288$ 4,460,232,876$
4. Plan Fiduciary Net Positiona. Contributions - Employer 265,532,000$ 258,099,000$ b. Contributions - Employee 38,581,000 39,564,000c. Net Investment Income 164,144,000 177,166,000d. Benefit Payments (240,727,000) (223,244,000)e. Administrative Expenses (12,818,000) (10,956,000)f. Payment of Interest on TDA Fixed Funds (94,789,000) (85,104,000)g. Other Changes (157,499,000) (52,021,000)h. Net Changes in Fiduciary Net Position (37,576,000)$ 103,504,000$
5. Plan Fiduciary Net Position - Beginning 3,454,009,000$ 3,350,505,000$ 6. Plan Fiduciary Net Position - Ending 3,416,433,000$ 3,454,009,000$
7. BERS' Net Pension Liability 1,384,265,288$ 1,006,223,876$
8. Plan Fiduciary Net Position as a Percentageof Total Pension Liability 71.2% 77.4%
9. Covered Employee Payroll 2 1,008,055,944$ 1,016,822,150$
10. BERS' Net Pension Liability as a Percentageof Covered Employee Payroll 137.3% 99.0%
1 Post-Publication Adjustment to Assets at June 30, 2014 and Restated Assets at June 30, 2015.2 Projected Employee Payroll at Time 1.0 under One-Year Lag Methodology.
NEW YORK CITY BOARD OF EDUCATION RETIREMENT SYSTEM (BERS)
Governmental Accounting Standards Board Statements No. 67 and No. 68 (GASB 67/68)
Schedule of Changes in Net Pension Liability and Related Ratios

Appendix CPage 15
NYC Office of the Actuary October 11, 2016
PV of Future Average Expected Average ExpectedWorkLife Remaining Service Life Remaining Service Life
Group # Count @ 6/30/2014 @ 6/30/2014 @ 6/30/2015Active 25,182 160,444 6.37 5.75Active/Inactive 4,005 0 0 0Term Vested 195 0 0 0Retired 15,995 0 0 0 Total 45,377 160,444 3.54 3.19
NEW YORK CITY BOARD OF EDUCATION RETIREMENT SYSTEM (BERS)
Governmental Accounting Standards Board Statements No. 67 and No. 68 (GASB 67/68)
Average Expected Remaining Service Lives

APPENDIX D

NYC Office of the Actuary October 11, 2016
Page 1a - Market Value of AssetsPage 1b - Development of Asset (Gain) / Loss - June 30, 2015Page 1c - Development of Asset (Gain) / Loss - June 30, 2016
Page 2a - Roll-Forward of Entry Age Actuarial Accrued Liabilities to June 30, 2015 (Revised)Page 2b - Roll-Forward of Entry Age Actuarial Accrued Liabilities to June 30, 2016
Page 3a - Changes in Net Pension Liability by Source - June 30, 2015 (Revised)Page 3b - Changes in Net Pension Liability by Source - June 30, 2016
Page 4a - Components of Pension Expense - June 30, 2015 (Revised)Page 4b - Components of Pension Expense - June 30, 2016
Page 5a - Pension Expense, Total Deferred Inflows/Outflows of Resources at June 30, 2013Page 5b - Pension Expense, Deferred Inflows/Outflows of Resources for June 30, 2014Page 5c - Pension Expense, Deferred Inflows/Outflows of Resources for June 30, 2015Page 5d - Pension Expense, Deferred Inflows/Outflows of Resources for June 30, 2016Page 5e - Pension Expense, Total Deferred Inflows/Outflows of Resources at June 30, 2016
Page 6 - Schedule of Employer Contributions
Page 7a - Statement of Fiduciary Net Position - POLICEPage 7b - Statement of Fiduciary Net Position - POVSFPage 7c - Statement of Fiduciary Net Position - PSOVSF
Page 8a - Statement of Changes in Fiduciary Net Position - POLICEPage 8b - Statement of Changes in Fiduciary Net Position - POVSFPage 8c - Statement of Changes in Fiduciary Net Position - PSOVSF
Page 9 - Long-Term Expected Rate of Return
Page 10a - Increase (Decrease) in Pension Expense Arising from the Recognition of Differences between Projected and Actual Earnings on Pension Plan Investments
Page 10b - Increase (Decrease) in Pension Expense Arising from the Recognition of Differences between Expected and Actual Experience
Page 10c - Increase (Decrease) in Pension Expense Arising from the Recognition of Changes in Assumptions
Page 11 - Schedule of Changes in Net Pension Liability and Related Ratios
Page 12 - Average Expected Remaining Service Lives
APPENDIX D
NEW YORK CITY POLICE PENSION FUND (POLICE)

Appendix DPage 1a
NYC Office of the Actuary October 11, 2016
QPP POVSF PSOVSF Total1. Plan Net Position @ 6/30/2014 34,060,892,000$ 318,935,000$ (107,177,000)$ 34,272,650,000$ 2. Accrued Benefits Payable 0 74,933,000 108,599,000 183,532,0003. Transferrable Earnings due from QPP to VSFs (2,310,000,000) 1,290,000,000 1,020,000,000 04. Adjusted Market Value @ 6/30/2014 31,750,892,000 1,683,868,000 1,021,422,000 34,456,182,000
5. Changes for the year:a. ER Contributions 2,309,619,000 0 0 2,309,619,000b. EE Contributions 241,102,000 0 0 241,102,000c. Net Investment Income 1,018,506,000 61,019,000 18,695,000 1,098,220,000d. Benefit Payments 1 (2,360,484,000) (151,333,000) (234,967,000) (2,746,784,000)e. Administrative Expenses (17,903,000) 0 0 (17,903,000)f. Reimbursement of Benefit Payments from QPP to PSOVSF (313,000) 0 313,000 0g. Other 4,554,000 25,000 37,000 4,616,000h. Net Changes 1,195,081,000$ (90,289,000)$ (215,922,000)$ 888,870,000$
6. Plan Net Position @ 6/30/2015 32,945,973,000$ 1,517,934,000$ 694,622,000$ 35,158,529,000$ 7. Accrued Benefits Payable 0 75,645,000 110,878,000 186,523,0008. Transferrable Earnings due from QPP to VSFs (590,000,000) 330,000,000 260,000,000 09. Adjusted Market Value @ 6/30/2015 32,355,973,000$ 1,923,579,000$ 1,065,500,000$ 35,345,052,000$
10. Changes for the year:a. ER Contributions 2,393,940,000 0 0 2,393,940,000b. EE Contributions 249,921,000 0 0 249,921,000c. Net Investment Income 644,318,000 (133,017,000) (107,767,000) 403,534,000d. Benefit Payments 2 (2,475,738,000) (155,754,000) (246,959,000) (2,878,451,000)e. Administrative Expenses (18,478,000) 0 0 (18,478,000)f. Other 6,479,000 147,000 130,000 6,756,000g. Net Changes 800,442,000$ (288,624,000)$ (354,596,000)$ 157,222,000$
11. Plan Net Position @ 6/30/2016 33,156,415,000$ 1,558,369,000$ 597,195,000$ 35,311,979,000$ 12. Accrued Benefits Payable 0 76,586,000 113,709,000 190,295,00013. Transferrable Earnings due from VSFs to QPP 326,195,000 (250,751,000) (75,444,000) 014. Adjusted Market Value @ 6/30/2016 33,482,610,000$ 1,384,204,000$ 635,460,000$ 35,502,274,000$
1 Includes Net Accrued Benefits Payable of $712,000 for POVSF and $2,279,000 for PSOVSF.2 Includes Net Accrued Benefits Payable of $941,000 for POVSF and $2,831,000 for PSOVSF.
NEW YORK CITY POLICE PENSION FUND (POLICE)
Governmental Accounting Standards Board Statements No. 67 and No. 68 (GASB 67/68)
Market Values of Assets

Appendix DPage 1b
NYC Office of the Actuary October 11, 2016
QPP POVSF PSOVSF Total
1. Assets
a. Market Value 6/30/2014* 34,060,892,000$ 393,868,000$ 1,422,000$ 34,456,182,000$
b. 2014 Transferrable Earnings due from QPP to VSFs (2,310,000,000) 1,290,000,000 1,020,000,000 0
c. Adjusted Market Value @6/30/2014 31,750,892,000 1,683,868,000 1,021,422,000 34,456,182,000
d. Market Value 6/30/2015** 32,945,973,000 1,593,579,000 805,500,000 35,345,052,000
e. 2015 Transferrable Earnings due from QPP to VSFs (590,000,000) 330,000,000 260,000,000 0
f. Adjusted Market Value @6/30/2015 32,355,973,000 1,923,579,000 1,065,500,000 35,345,052,000
2. Net Investment Income 1,018,506,000 61,019,000 18,695,000 1,098,220,000
3. Cash Flow (2,133,425,000) 1,138,692,000 785,383,000 (209,350,000)(1.d. - 1.a. - 2.)
4. Projected Earnings 2,310,851,286 66,753,152 27,124,569 2,404,729,007 (7% * 1.a. + 3.441% * 3.)
5. (Gain) / Loss 1,292,345,286 5,734,152 8,429,569 1,306,509,007(4. - 2.)
6. Recognition Period 5 Years 5 Years 5 Years 5 Years
7. Amount Recognized in Pension Expense 258,469,057 1,146,830 1,685,914 261,301,801(5. / 6.)
8. Deferred (Inflow) / Outflow of Resources 1,033,876,229$ 4,587,322$ 6,743,655$ 1,045,207,206$ (5. - 7.)
* Before Reflecting 2014 Transferrable Earnings to VSFs.
** Before Reflecting 2015 Transferrable Earnings to VSFs.
NEW YORK CITY POLICE PENSION FUND (POLICE)
Governmental Accounting Standards Board Statements No. 67 and No. 68 (GASB 67/68)
Development of Asset (Gain) / LossJune 30, 2015

Appendix DPage 1c
NYC Office of the Actuary October 11, 2016
QPP POVSF PSOVSF Total
1. Assets
a. Market Value 6/30/2015* 32,945,973,000$ 1,593,579,000$ 805,500,000$ 35,345,052,000$
b. 2015 Transferrable Earnings due from QPP to VSFs (590,000,000) 330,000,000 260,000,000 0
c. Adjusted Market Value @6/30/2015 32,355,973,000 1,923,579,000 1,065,500,000 35,345,052,000
d. Market Value 6/30/2016** 33,156,415,000 1,634,955,000 710,904,000 35,502,274,000
e. 2016 Transferrable Earnings due from VSFs to QPP 326,195,000 (250,751,000) (75,444,000) 0
f. Adjusted Market Value @6/30/2016 33,482,610,000 1,384,204,000 635,460,000 35,502,274,000
2. Net Investment Income 644,318,000 (133,017,000) (107,767,000) 403,534,000
3. Cash Flow (433,876,000) 174,393,000 13,171,000 (246,312,000)(1.d. - 1.a. - 2.)
4. Projected Earnings 2,291,288,437 117,551,393 56,838,214 2,465,678,044 (7% * 1.a. + 3.441% * 3.)
5. (Gain) / Loss 1,646,970,437 250,568,393 164,605,214 2,062,144,044(4. - 2.)
6. Recognition Period 5 Years 5 Years 5 Years 5 Years
7. Amount Recognized in Pension Expense 329,394,087 50,113,679 32,921,043 412,428,809(5. / 6.)
8. Deferred (Inflow) / Outflow of Resources 1,317,576,350$ 200,454,714$ 131,684,171$ 1,649,715,235$ (5. - 7.)
* Before Reflecting 2015 Transferrable Earnings to VSFs.
** Before Reflecting 2016 Transferrable Earnings to QPP.
NEW YORK CITY POLICE PENSION FUND (POLICE)
Governmental Accounting Standards Board Statements No. 67 and No. 68 (GASB 67/68)
Development of Asset (Gain) / LossJune 30, 2016

Appendix DPage 2a
NYC Office of the Actuary October 11, 2016
QPP POVSF PSOVSF Total1. EA Accrued Liability at 6/30/2013 39,088,861,622$ 1,859,399,999$ 3,429,241,209$ 44,377,502,830$ 2. EA Normal Cost at 6/30/2013 1,177,404,768 52,914,398 42,461,968 1,272,781,1343. Benefit Payments-FY14 2,305,609,000 147,153,000 229,461,000 2,682,223,0004. Interest 2,739,302,642 128,798,473 235,123,469 3,103,224,584
5a. Roll-Forward EAAL at 6/30/2014 40,699,960,032$ 1,893,959,870$ 3,477,365,646$ 46,071,285,548$ 5b. Additional EAAL at 6/30/2014 due to SADB 313,507,809 0 0 313,507,8095c. Revised Roll-Forward EAAL at 6/30/2014 41,013,467,841$ 1,893,959,870$ 3,477,365,646$ 46,384,793,357$
6. EA Normal Cost at 6/30/2014 1,227,570,182 54,501,830 43,735,827 1,325,807,8397. Benefit Payments-FY15 2,360,484,000 151,333,000 234,967,000 2,746,784,0008. Interest 2,875,648,407 131,184,950 238,391,889 3,245,225,246
9. Roll-Forward EAAL at 6/30/2015 42,756,202,430$ 1,928,313,650$ 3,524,526,362$ 48,209,042,442$
1 Special Accidental Death Benefits pursuant to Section 208-f of the General Municipal Law.
NEW YORK CITY POLICE PENSION FUND (POLICE)
Governmental Accounting Standards Board Statements No. 67 and No. 68 (GASB 67/68)
Roll-Forward of Entry Age Actuarial Accrued Liabilities to June 30, 2015 (Revised)1

Appendix DPage 2b
NYC Office of the Actuary October 11, 2016
QPP POVSF PSOVSF Total1. EA Accrued Liability at 6/30/2014 41,901,123,971$ 1,939,317,324$ 3,529,472,042$ 47,369,913,337$ 2. EA Normal Cost at 6/30/2014 1,205,540,356 52,063,455 43,964,061 1,301,567,8723. Benefit Payments-FY15 2,360,484,000 151,333,000 234,967,000 2,746,784,0004. Interest 2,936,242,248 134,189,286 242,055,313 3,312,486,847
5. Roll-Forward EAAL at 6/30/2015 43,682,422,575$ 1,974,237,065$ 3,580,524,416$ 49,237,184,056$
6. EA Normal Cost at 6/30/2015 1,241,706,567 53,625,359 45,282,983 1,340,614,9097. Benefit Payments-FY16 2,475,738,000 155,754,000 246,959,000 2,878,451,0008. Interest 3,059,498,895 136,590,875 245,308,659 3,441,398,429
9. Roll-Forward EAAL at 6/30/2016 45,507,890,037$ 2,008,699,299$ 3,624,157,058$ 51,140,746,394$
NEW YORK CITY POLICE PENSION FUND (POLICE)
Governmental Accounting Standards Board Statements No. 67 and No. 68 (GASB 67/68)
Roll-Forward of Entry Age Actuarial Accrued Liabilities to June 30, 2016
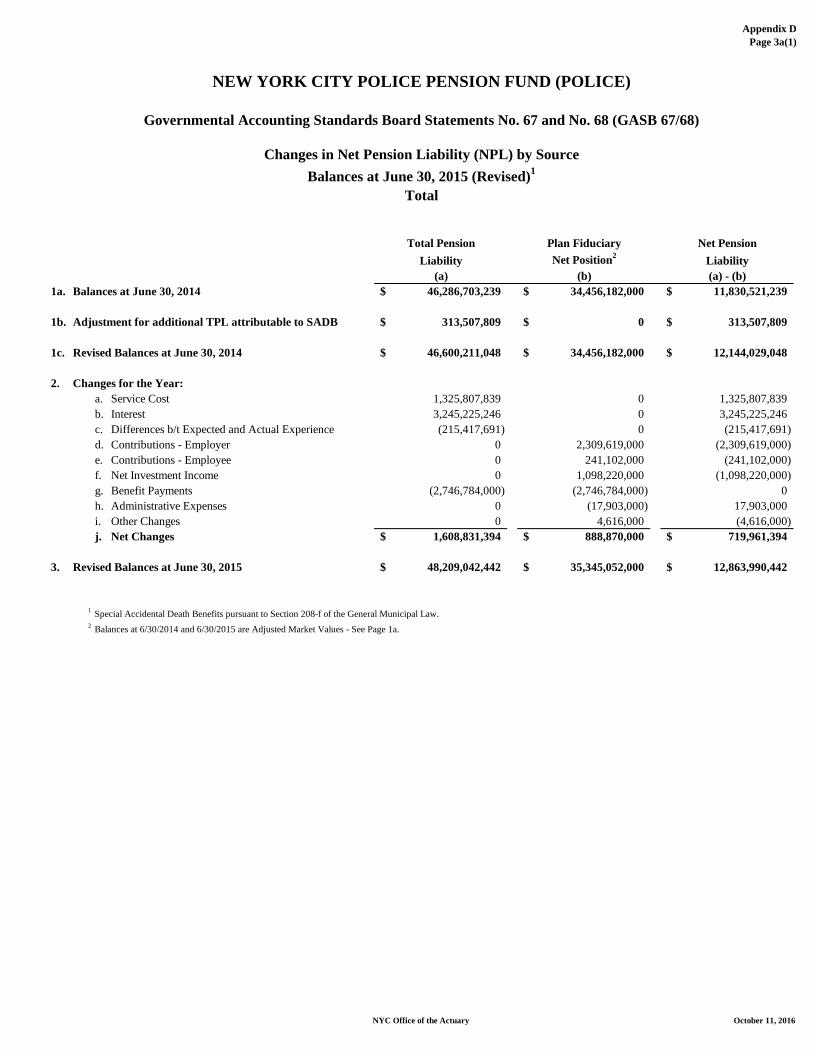
Appendix DPage 3a(1)
NYC Office of the Actuary October 11, 2016
Total Pension Plan Fiduciary Net PensionLiability Net Position2 Liability
(a) (b) (a) - (b)1a. Balances at June 30, 2014 46,286,703,239$ 34,456,182,000$ 11,830,521,239$
1b. Adjustment for additional TPL attributable to SADB 313,507,809$ 0$ 313,507,809$
1c. Revised Balances at June 30, 2014 46,600,211,048$ 34,456,182,000$ 12,144,029,048$
2. Changes for the Year:a. Service Cost 1,325,807,839 0 1,325,807,839b. Interest 3,245,225,246 0 3,245,225,246c. Differences b/t Expected and Actual Experience (215,417,691) 0 (215,417,691)d. Contributions - Employer 0 2,309,619,000 (2,309,619,000)e. Contributions - Employee 0 241,102,000 (241,102,000)f. Net Investment Income 0 1,098,220,000 (1,098,220,000)g. Benefit Payments (2,746,784,000) (2,746,784,000) 0h. Administrative Expenses 0 (17,903,000) 17,903,000i. Other Changes 0 4,616,000 (4,616,000)j. Net Changes 1,608,831,394$ 888,870,000$ 719,961,394$
3. Revised Balances at June 30, 2015 48,209,042,442$ 35,345,052,000$ 12,863,990,442$
1 Special Accidental Death Benefits pursuant to Section 208-f of the General Municipal Law.2 Balances at 6/30/2014 and 6/30/2015 are Adjusted Market Values - See Page 1a.
Governmental Accounting Standards Board Statements No. 67 and No. 68 (GASB 67/68)
NEW YORK CITY POLICE PENSION FUND (POLICE)
Changes in Net Pension Liability (NPL) by SourceBalances at June 30, 2015 (Revised)1
Total
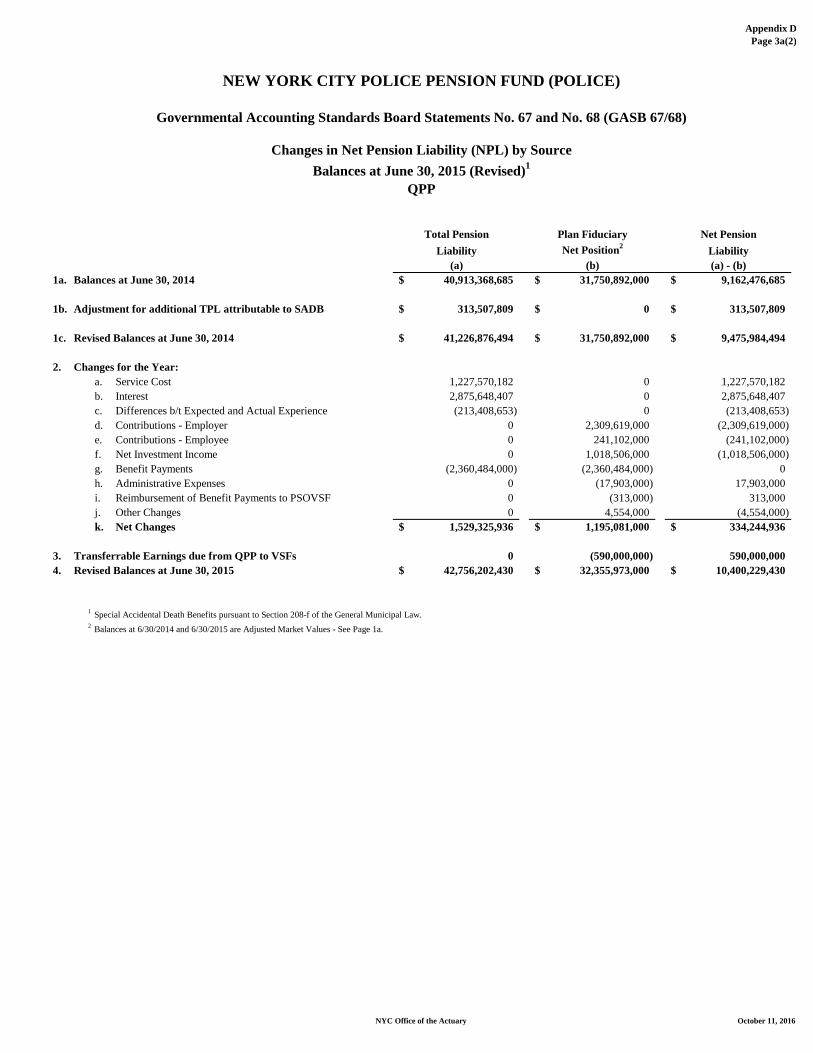
Appendix DPage 3a(2)
NYC Office of the Actuary October 11, 2016
Total Pension Plan Fiduciary Net PensionLiability Net Position2 Liability
(a) (b) (a) - (b)1a. Balances at June 30, 2014 40,913,368,685$ 31,750,892,000$ 9,162,476,685$
1b. Adjustment for additional TPL attributable to SADB 313,507,809$ 0$ 313,507,809$
1c. Revised Balances at June 30, 2014 41,226,876,494$ 31,750,892,000$ 9,475,984,494$
2. Changes for the Year:a. Service Cost 1,227,570,182 0 1,227,570,182b. Interest 2,875,648,407 0 2,875,648,407c. Differences b/t Expected and Actual Experience (213,408,653) 0 (213,408,653)d. Contributions - Employer 0 2,309,619,000 (2,309,619,000)e. Contributions - Employee 0 241,102,000 (241,102,000)f. Net Investment Income 0 1,018,506,000 (1,018,506,000)g. Benefit Payments (2,360,484,000) (2,360,484,000) 0h. Administrative Expenses 0 (17,903,000) 17,903,000i. Reimbursement of Benefit Payments to PSOVSF 0 (313,000) 313,000j. Other Changes 0 4,554,000 (4,554,000)k. Net Changes 1,529,325,936$ 1,195,081,000$ 334,244,936$
3. Transferrable Earnings due from QPP to VSFs 0 (590,000,000) 590,000,0004. Revised Balances at June 30, 2015 42,756,202,430$ 32,355,973,000$ 10,400,229,430$
1 Special Accidental Death Benefits pursuant to Section 208-f of the General Municipal Law.2 Balances at 6/30/2014 and 6/30/2015 are Adjusted Market Values - See Page 1a.
NEW YORK CITY POLICE PENSION FUND (POLICE)
Governmental Accounting Standards Board Statements No. 67 and No. 68 (GASB 67/68)
Changes in Net Pension Liability (NPL) by SourceBalances at June 30, 2015 (Revised)1
QPP

Appendix DPage 3a(3)
NYC Office of the Actuary October 11, 2016
Total Pension Plan Fiduciary Net PensionLiability Net Position1 Liability
(a) (b) (a) - (b)1. Balances at June 30, 2014 1,907,113,792$ 1,683,868,000$ 223,245,792$
2. Changes for the Year:a. Service Cost 54,501,830 0 54,501,830b. Interest 131,184,950 0 131,184,950c. Differences b/t Expected and Actual Experience (13,153,922) 0 (13,153,922)d. Contributions - Employer 0 0 0e. Contributions - Employee 0 0 0f. Net Investment Income 0 61,019,000 (61,019,000)g. Benefit Payments (151,333,000) (151,333,000) 0h. Administrative Expenses 0 0 0i. Other Changes 0 25,000 (25,000)j. Net Changes 21,199,858$ (90,289,000)$ 111,488,858$
3. Transferrable Earnings due from QPP to POVSF 0 330,000,000 (330,000,000)4. Balances at June 30, 2015 1,928,313,650$ 1,923,579,000$ 4,734,650$
1 Balances at 6/30/2014 and 6/30/2015 are Adjusted Market Values - See Page 1a.
NEW YORK CITY POLICE PENSION FUND (POLICE)
Governmental Accounting Standards Board Statements No. 67 and No. 68 (GASB 67/68)
Changes in Net Pension Liability (NPL) by SourceBalances at June 30, 2015
POVSF

Appendix DPage 3a(4)
NYC Office of the Actuary October 11, 2016
Total Pension Plan Fiduciary Net PensionLiability Net Position1 Liability
(a) (b) (a) - (b)1. Balances at June 30, 2014 3,466,220,762$ 1,021,422,000$ 2,444,798,762$
2. Changes for the Year:a. Service Cost 43,735,827 0 43,735,827b. Interest 238,391,889 0 238,391,889c. Differences b/t Expected and Actual Experience 11,144,884 0 11,144,884d. Contributions - Employer 0 0 0e. Contributions - Employee 0 0 0f. Net Investment Income 0 18,695,000 (18,695,000)g. Benefit Payments (234,967,000) (234,967,000) 0h. Administrative Expenses 0 0 0i. Reimbursement of Benefit Payments from QPP 0 313,000 (313,000)j. Other Changes 0 37,000 (37,000)k. Net Changes 58,305,600$ (215,922,000)$ 274,227,600$
3. Transferrable Earnings due from QPP to PSOVSF 0 260,000,000 (260,000,000)4. Balances at June 30, 2015 3,524,526,362$ 1,065,500,000$ 2,459,026,362$
1 Balances at 6/30/2014 and 6/30/2015 are Adjusted Market Values - See Page 1a.
NEW YORK CITY POLICE PENSION FUND (POLICE)
Governmental Accounting Standards Board Statements No. 67 and No. 68 (GASB 67/68)
Changes in Net Pension Liability (NPL) by SourceBalances at June 30, 2015
PSOVSF

Appendix DPage 3a(5)
NYC Office of the Actuary October 11, 2016
QPP POVSF PSOVSF Total1a. Balances at June 30, 2014 40,913,368,685$ 1,907,113,792$ 3,466,220,762$ 46,286,703,239$
1b. Adjustment for additional TPL attributable to SADB 313,507,809$ 0$ 0$ 313,507,809$
1c. Revised Balances at June 30, 2014 41,226,876,494$ 1,907,113,792$ 3,466,220,762$ 46,600,211,048$
2. Changes for the Year:a. Service Cost 1,227,570,182 54,501,830 43,735,827 1,325,807,839b. Interest 2,875,648,407 131,184,950 238,391,889 3,245,225,246c. Differences b/t Expected and Actual Experience (213,408,653) (13,153,922) 11,144,884 (215,417,691)d. Benefit Payments (2,360,484,000) (151,333,000) (234,967,000) (2,746,784,000)e. Net Changes 1,529,325,936$ 21,199,858$ 58,305,600$ 1,608,831,394$
3. Revised Balances at June 30, 2015 42,756,202,430$ 1,928,313,650$ 3,524,526,362$ 48,209,042,442$
QPP POVSF PSOVSF Total4. Balances at June 30, 2014 31,750,892,000$ 1,683,868,000$ 1,021,422,000$ 34,456,182,000$
5. Changes for the Year:a. Contributions - Employer 2,309,619,000 0 0 2,309,619,000b. Contributions - Employee 241,102,000 0 0 241,102,000c. Net Investment Income 1,018,506,000 61,019,000 18,695,000 1,098,220,000d. Benefit Payments (2,360,484,000) (151,333,000) (234,967,000) (2,746,784,000)e. Administrative Expenses (17,903,000) 0 0 (17,903,000)f. Reimbursement of Benefit Payments from to PSOVSF / from QPP (313,000) 0 313,000 0g. Other Changes 4,554,000 25,000 37,000 4,616,000h. Net Changes 1,195,081,000$ (90,289,000)$ (215,922,000)$ 888,870,000$
6. Transferrable Earnings due from QPP to VSFs (590,000,000) 330,000,000 260,000,000 07. Revised Balances at June 30, 2015 32,355,973,000$ 1,923,579,000$ 1,065,500,000$ 35,345,052,000$
QPP POVSF PSOVSF Total8a. Balances at June 30, 2014 9,162,476,685$ 223,245,792$ 2,444,798,762$ 11,830,521,239$
8b. Adjustment for additional TPL attributable to SADB 313,507,809$ 0$ 0$ 313,507,809$
8c. Revised Balances at June 30, 2014 9,475,984,494$ 223,245,792$ 2,444,798,762$ 12,144,029,048$
9. Changes for the Year:a. Service Cost 1,227,570,182 54,501,830 43,735,827 1,325,807,839b. Interest 2,875,648,407 131,184,950 238,391,889 3,245,225,246c. Differences b/t Expected and Actual Experience (213,408,653) (13,153,922) 11,144,884 (215,417,691)d. Contributions - Employer (2,309,619,000) 0 0 (2,309,619,000)e. Contributions - Employee (241,102,000) 0 0 (241,102,000)f. Net Investment Income (1,018,506,000) (61,019,000) (18,695,000) (1,098,220,000)g. Benefit Payments 0 0 0 0h. Administrative Expenses 17,903,000 0 0 17,903,000i. Reimbursement of Benefit Payments from to PSOVSF / from QPP 313,000 0 (313,000) 0j. Other Changes (4,554,000) (25,000) (37,000) (4,616,000)k. Net Changes 334,244,936$ 111,488,858$ 274,227,600$ 719,961,394$
10. Transferrable Earnings due from QPP to VSFs 590,000,000 (330,000,000) (260,000,000) 011. Revised Balances at June 30, 2015 10,400,229,430$ 4,734,650$ 2,459,026,362$ 12,863,990,442$
1 Special Accidental Death Benefits pursuant to Section 208-f of the General Municipal Law.2 Balances at 6/30/2014 and 6/30/2015 are Adjusted Market Values - See Page 1a.
NEW YORK CITY POLICE PENSION FUND (POLICE)
Governmental Accounting Standards Board Statements No. 67 and No. 68 (GASB 67/68)
Changes in Net Pension Liability (NPL) by SourceBalances at June 30, 2015 (Revised)1
Net Pension Liability
Total Pension Liability
Plan Fiduciary Net Position2

Appendix DPage 3b(1)
NYC Office of the Actuary October 11, 2016
Total Pension Plan Fiduciary Net PensionLiability Net Position1 Liability
(a) (b) (a) - (b)1. Revised Balances at June 30, 2015 48,209,042,442$ 35,345,052,000$ 12,863,990,442$
2. Changes for the Year:a. Service Cost 1,340,614,909 0 1,340,614,909b. Interest 3,441,398,429 0 3,441,398,429c. Differences b/t Expected and Actual Experience 233,461,664 0 233,461,664d. Changes of Assumptions 794,679,950 0 794,679,950e. Contributions - Employer 0 2,393,940,000 (2,393,940,000)f. Contributions - Employee 0 249,921,000 (249,921,000)g. Net Investment Income 0 403,534,000 (403,534,000)h. Benefit Payments (2,878,451,000) (2,878,451,000) 0i. Administrative Expenses 0 (18,478,000) 18,478,000j. Other Changes 0 6,756,000 (6,756,000)k. Net Changes 2,931,703,952$ 157,222,000$ 2,774,481,952$
3. Balances at June 30, 2016 51,140,746,394$ 35,502,274,000$ 15,638,472,394$
1 Balances at 6/30/2015 and 6/30/2016 are Adjusted Market Values - See Page 1a.
NEW YORK CITY POLICE PENSION FUND (POLICE)
Governmental Accounting Standards Board Statements No. 67 and No. 68 (GASB 67/68)
Changes in Net Pension Liability (NPL) by SourceBalances at June 30, 2016
Total

Appendix DPage 3b(2)
NYC Office of the Actuary October 11, 2016
Total Pension Plan Fiduciary Net PensionLiability Net Position1 Liability
(a) (b) (a) - (b)1. Revised Balances at June 30, 2015 42,756,202,430$ 32,355,973,000$ 10,400,229,430$
2. Changes for the Year:a. Service Cost 1,241,706,567 0 1,241,706,567b. Interest 3,059,498,895 0 3,059,498,895c. Differences b/t Expected and Actual Experience 216,334,147 0 216,334,147d. Changes of Assumptions 709,885,998 0 709,885,998e. Contributions - Employer 0 2,393,940,000 (2,393,940,000)f. Contributions - Employee 0 249,921,000 (249,921,000)g. Net Investment Income 0 644,318,000 (644,318,000)h. Benefit Payments (2,475,738,000) (2,475,738,000) 0i. Administrative Expenses 0 (18,478,000) 18,478,000j. Reimbursement of Benefit Payments to PSOVSF 0 0 0k. Other Changes 0 6,479,000 (6,479,000)l. Net Changes 2,751,687,607$ 800,442,000$ 1,951,245,607$
3. Transferrable Earnings due from VSFs to QPP 0 326,195,000 (326,195,000)4. Balances at June 30, 2016 45,507,890,037$ 33,482,610,000$ 12,025,280,037$
1 Balances at 6/30/2015 and 6/30/2016 are Adjusted Market Values - See Page 1a.
NEW YORK CITY POLICE PENSION FUND (POLICE)
Governmental Accounting Standards Board Statements No. 67 and No. 68 (GASB 67/68)
Changes in Net Pension Liability (NPL) by SourceBalances at June 30, 2016
QPP

Appendix DPage 3b(3)
NYC Office of the Actuary October 11, 2016
Total Pension Plan Fiduciary Net PensionLiability Net Position1 Liability
(a) (b) (a) - (b)1. Balances at June 30, 2015 1,928,313,650$ 1,923,579,000$ 4,734,650$
2. Changes for the Year:a. Service Cost 53,625,359 0 53,625,359b. Interest 136,590,875 0 136,590,875c. Differences b/t Expected and Actual Experience 13,273,367 0 13,273,367d. Changes of Assumptions 32,650,048 0 32,650,048e. Contributions - Employer 0 0 0f. Contributions - Employee 0 0 0g. Net Investment Income 0 (133,017,000) 133,017,000h. Benefit Payments (155,754,000) (155,754,000) 0i. Administrative Expenses 0 0 0j. Other Changes 0 147,000 (147,000)k. Net Changes 80,385,649$ (288,624,000)$ 369,009,649$
3. Transferrable Earnings due from POVSF to QPP 0 (250,751,000) 250,751,0004. Balances at June 30, 2016 2,008,699,299$ 1,384,204,000$ 624,495,299$
1 Balances at 6/30/2015 and 6/30/2016 are Adjusted Market Values - See Page 1a.
NEW YORK CITY POLICE PENSION FUND (POLICE)
Governmental Accounting Standards Board Statements No. 67 and No. 68 (GASB 67/68)
Changes in Net Pension Liability (NPL) by SourceBalances at June 30, 2016
POVSF

Appendix DPage 3b(4)
NYC Office of the Actuary October 11, 2016
Total Pension Plan Fiduciary Net PensionLiability Net Position1 Liability
(a) (b) (a) - (b)1. Balances at June 30, 2015 3,524,526,362$ 1,065,500,000$ 2,459,026,362$
2. Changes for the Year:a. Service Cost 45,282,983 0 45,282,983b. Interest 245,308,659 0 245,308,659c. Differences b/t Expected and Actual Experience 3,854,150 0 3,854,150d. Changes of Assumptions 52,143,904 0 52,143,904e. Contributions - Employer 0 0 0f. Contributions - Employee 0 0 0g. Net Investment Income 0 (107,767,000) 107,767,000h. Benefit Payments (246,959,000) (246,959,000) 0i. Administrative Expenses 0 0 0j. Reimbursement of Benefit Payments from QPP 0 0 0k. Other Changes 0 130,000 (130,000)l. Net Changes 99,630,696$ (354,596,000)$ 454,226,696$
3. Transferrable Earnings due from PSOVSF to QPP 0 (75,444,000) 75,444,0004. Balances at June 30, 2016 3,624,157,058$ 635,460,000$ 2,988,697,058$
1 Balances at 6/30/2015 and 6/30/2016 are Adjusted Market Values - See Page 1a.
NEW YORK CITY POLICE PENSION FUND (POLICE)
Governmental Accounting Standards Board Statements No. 67 and No. 68 (GASB 67/68)
Changes in Net Pension Liability (NPL) by SourceBalances at June 30, 2016
PSOVSF

Appendix DPage 3b(5)
NYC Office of the Actuary October 11, 2016
QPP POVSF PSOVSF TOTAL1. Revised Balances at June 30, 2015 42,756,202,430$ 1,928,313,650$ 3,524,526,362$ 48,209,042,442$
2. Changes for the Year:a. Service Cost 1,241,706,567 53,625,359 45,282,983 1,340,614,909b. Interest 3,059,498,895 136,590,875 245,308,659 3,441,398,429c. Differences b/t Expected and Actual Experience 216,334,147 13,273,367 3,854,150 233,461,664d. Changes of Assumptions 709,885,998 32,650,048 52,143,904 794,679,950e. Benefit Payments (2,475,738,000) (155,754,000) (246,959,000) (2,878,451,000)f. Net Changes 2,751,687,607$ 80,385,649$ 99,630,696$ 2,931,703,952$
3. Balances at June 30, 2016 45,507,890,037$ 2,008,699,299$ 3,624,157,058$ 51,140,746,394$
QPP POVSF PSOVSF TOTAL4. Balances at June 30, 2015 32,355,973,000$ 1,923,579,000$ 1,065,500,000$ 35,345,052,000$
5. Changes for the Year:a. Contributions - Employer 2,393,940,000 0 0 2,393,940,000b. Contributions - Employee 249,921,000 0 0 249,921,000c. Net Investment Income 644,318,000 (133,017,000) (107,767,000) 403,534,000d. Benefit Payments (2,475,738,000) (155,754,000) (246,959,000) (2,878,451,000)e. Administrative Expenses (18,478,000) 0 0 (18,478,000)f. Other Changes 6,479,000 147,000 130,000 6,756,000g. Net Changes 800,442,000$ (288,624,000)$ (354,596,000)$ 157,222,000$
6. Transferrable Earnings due from VSFs to QPP 326,195,000 (250,751,000) (75,444,000) 07. Balances at June 30, 2016 33,482,610,000$ 1,384,204,000$ 635,460,000$ 35,502,274,000$
QPP POVSF PSOVSF TOTAL8. Revised Balances at June 30, 2015 10,400,229,430$ 4,734,650$ 2,459,026,362$ 12,863,990,442$
9. Changes for the Year:a. Service Cost 1,241,706,567 53,625,359 45,282,983 1,340,614,909b. Interest 3,059,498,895 136,590,875 245,308,659 3,441,398,429c. Differences b/t Expected and Actual Experience 216,334,147 13,273,367 3,854,150 233,461,664d. Changes of Assumptions 709,885,998 32,650,048 52,143,904 794,679,950e. Contributions - Employer (2,393,940,000) 0 0 (2,393,940,000)f. Contributions - Employee (249,921,000) 0 0 (249,921,000)g. Net Investment Income (644,318,000) 133,017,000 107,767,000 (403,534,000)h. Benefit Payments 0 0 0 0i. Administrative Expenses 18,478,000 0 0 18,478,000j. Other Changes (6,479,000) (147,000) (130,000) (6,756,000)k. Net Changes 1,951,245,607$ 369,009,649$ 454,226,696$ 2,774,481,952$
10. Transferrable Earnings due from VSFs to QPP (326,195,000) 250,751,000 75,444,000 011. Balances at June 30, 2016 12,025,280,037$ 624,495,299$ 2,988,697,058$ 15,638,472,394$
1 Balances at 6/30/2015 and 6/30/2016 are Adjusted Market Values - See Page 1a.
NEW YORK CITY POLICE PENSION FUND (POLICE)
Governmental Accounting Standards Board Statements No. 67 and No. 68 (GASB 67/68)
Changes in Net Pension Liability (NPL) by SourceBalances at June 30, 2016
Net Pension Liability
Total Pension Liability
Plan Fiduciary Net Position1
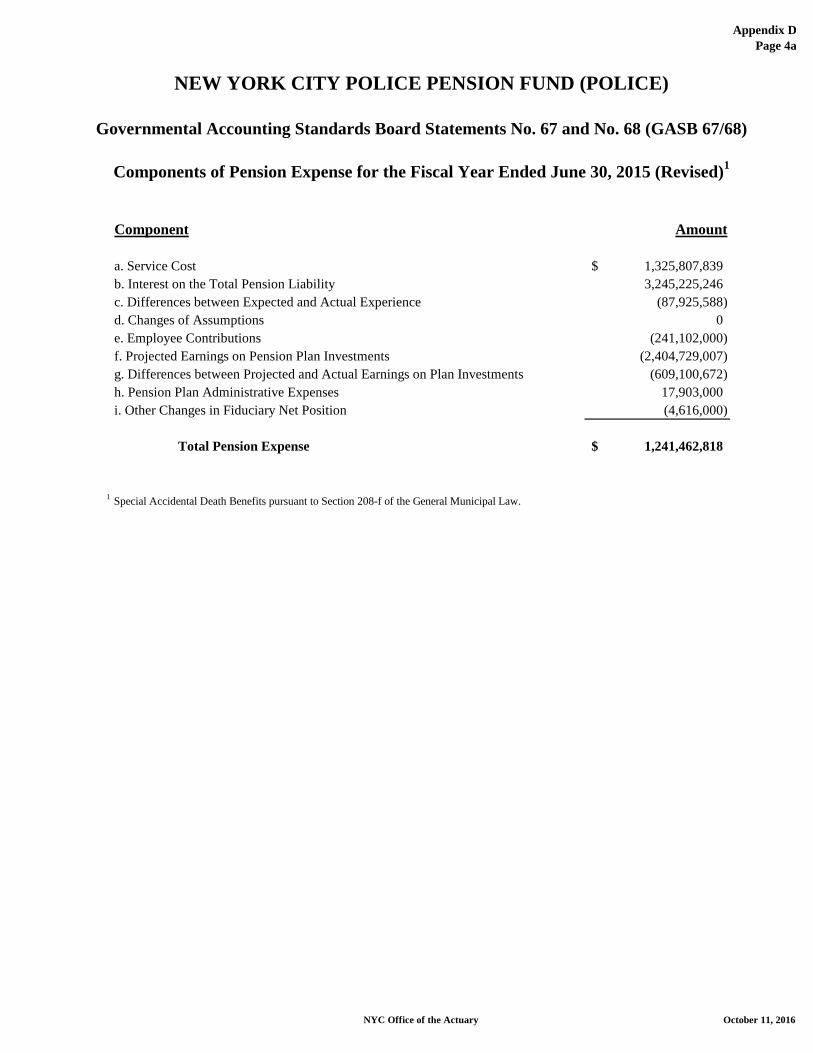
Appendix DPage 4a
NYC Office of the Actuary October 11, 2016
NEW YORK CITY POLICE PENSION FUND (POLICE)
Components of Pension Expense for the Fiscal Year Ended June 30, 2015 (Revised)1
Component Amount
a. Service Cost 1,325,807,839$ b. Interest on the Total Pension Liability 3,245,225,246c. Differences between Expected and Actual Experience (87,925,588)d. Changes of Assumptions 0e. Employee Contributions (241,102,000)f. Projected Earnings on Pension Plan Investments (2,404,729,007)g. Differences between Projected and Actual Earnings on Plan Investments (609,100,672)h. Pension Plan Administrative Expenses 17,903,000i. Other Changes in Fiduciary Net Position (4,616,000)
Total Pension Expense 1,241,462,818$
1 Special Accidental Death Benefits pursuant to Section 208-f of the General Municipal Law.
Governmental Accounting Standards Board Statements No. 67 and No. 68 (GASB 67/68)

Appendix DPage 4b
NYC Office of the Actuary October 11, 2016
NEW YORK CITY POLICE PENSION FUND (POLICE)
Governmental Accounting Standards Board Statements No. 67 and No. 68 (GASB 67/68)
Components of Pension Expense for the Fiscal Year Ended June 30, 2016
Component Amount
a. Service Cost 1,340,614,909$ b. Interest on the Total Pension Liability 3,441,398,429c. Differences between Expected and Actual Experience 7,364,887d. Changes of Assumptions 324,359,163e. Employee Contributions (249,921,000)f. Projected Earnings on Pension Plan Investments (2,465,678,044)g. Differences between Projected and Actual Earnings on Plan Investments (196,671,863)h. Pension Plan Administrative Expenses 18,478,000i. Other Changes in Fiduciary Net Position (6,756,000)
Total Pension Expense 2,213,188,481$
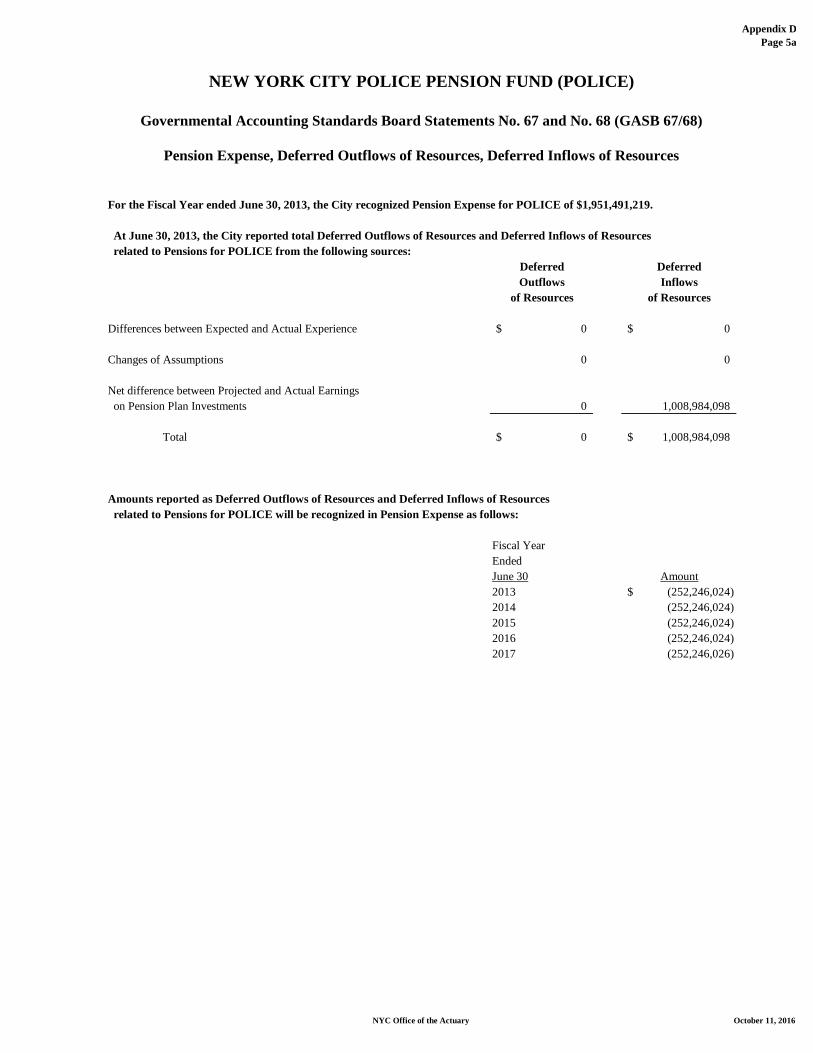
Appendix DPage 5a
NYC Office of the Actuary October 11, 2016
NEW YORK CITY POLICE PENSION FUND (POLICE)
Governmental Accounting Standards Board Statements No. 67 and No. 68 (GASB 67/68)
Pension Expense, Deferred Outflows of Resources, Deferred Inflows of Resources
For the Fiscal Year ended June 30, 2013, the City recognized Pension Expense for POLICE of $1,951,491,219.
At June 30, 2013, the City reported total Deferred Outflows of Resources and Deferred Inflows of Resources related to Pensions for POLICE from the following sources:
Deferred DeferredOutflows Inflows
of Resources of Resources
Differences between Expected and Actual Experience 0$ 0$
Changes of Assumptions 0 0
Net difference between Projected and Actual Earnings on Pension Plan Investments 0 1,008,984,098
Total 0$ 1,008,984,098$
Amounts reported as Deferred Outflows of Resources and Deferred Inflows of Resources related to Pensions for POLICE will be recognized in Pension Expense as follows:
Fiscal YearEnded June 30 Amount2013 (252,246,024)$ 2014 (252,246,024) 2015 (252,246,024) 2016 (252,246,024) 2017 (252,246,026)

Appendix DPage 5b
NYC Office of the Actuary October 11, 2016
NEW YORK CITY POLICE PENSION FUND (POLICE)
Governmental Accounting Standards Board Statements No. 67 and No. 68 (GASB 67/68)
For the Fiscal Year ended June 30, 2014, the City recognized Pension Expense for POLICE of $1,273,723,272.
For June 30, 2014, the City determined total Deferred Outflows of Resources and Deferred Inflows of Resources related to Pensions for POLICE from the following sources:
Deferred DeferredOutflows Inflows
of Resources of Resources
Differences between Expected and Actual Experience 0$ 0$
Changes of Assumptions 0 0
Net difference between Projected and Actual Earnings on Pension Plan Investments 0 2,472,625,795
Total 0$ 2,472,625,795$
Amounts reported as Deferred Outflows of Resources and Deferred Inflows of Resources related to Pensions for POLICE will be recognized in Pension Expense as follows:
Fiscal YearEnded June 30 Amount2014 (618,156,449)$ 2015 (618,156,449) 2016 (618,156,449) 2017 (618,156,449) 2018 (618,156,448)
Pension Expense, Deferred Outflows of Resources, Deferred Inflows of Resources

Appendix DPage 5c
NYC Office of the Actuary October 11, 2016
NEW YORK CITY POLICE PENSION FUND (POLICE)
Governmental Accounting Standards Board Statements No. 67 and No. 68 (GASB 67/68)
For the Fiscal Year ended June 30, 2015, the City recognized Pension Expense for POLICE of $1,241,462,818 (Revised) .
For June 30, 2015, the City determined individual Deferred Outflows of Resources and Deferred Inflows of Resources related to Pensions for POLICE from the following sources:
Deferred DeferredOutflows Inflows
of Resources of Resources
Differences between Expected and Actual Experience 0$ 127,492,103$
Changes of Assumptions 0 0
Net difference between Projected and Actual Earnings on Pension Plan Investments 1,045,207,206 0
Total 1,045,207,206$ 127,492,103$
Amounts reported as Deferred Outflows of Resources and Deferred Inflows of Resources related to Pensions for POLICE will be recognized in Pension Expense as follows:
Fiscal YearEnded June 30 Amount2015 173,376,213$ 2016 173,376,213 2017 221,735,286 2018 261,301,801 2019 261,301,803
Pension Expense, Deferred Outflows of Resources, Deferred Inflows of Resources

Appendix DPage 5d
NYC Office of the Actuary October 11, 2016
NEW YORK CITY POLICE PENSION FUND (POLICE)
Governmental Accounting Standards Board Statements No. 67 and No. 68 (GASB 67/68)
For the Fiscal Year ended June 30, 2016, the City recognized Pension Expense for POLICE of $2,213,188,481.
For June 30, 2016, the City determined individual Deferred Outflows of Resources and Deferred Inflows of Resources related to Pensions for POLICE from the following sources:
Deferred DeferredOutflows Inflows
of Resources of Resources
Differences between Expected and Actual Experience 138,171,189$ 0$
Changes of Assumptions 470,320,787 0
Net difference between Projected and Actual Earnings on Pension Plan Investments 1,649,715,235 0
Total 2,258,207,211$ 0$
Amounts reported as Deferred Outflows of Resources and Deferred Inflows of Resources related to Pensions for POLICE will be recognized in Pension Expense as follows:
Fiscal YearEnded June 30 Amount2016 832,078,447$ 2017 832,078,4472018 601,271,1472019 412,428,8092020 412,428,808
Pension Expense, Deferred Outflows of Resources, Deferred Inflows of Resources

Appendix DPage 5e
NYC Office of the Actuary October 11, 2016
NEW YORK CITY POLICE PENSION FUND (POLICE)
Governmental Accounting Standards Board Statements No. 67 and No. 68 (GASB 67/68)
For the Fiscal Year ended June 30, 2016, the City recognized Pension Expense for POLICE of $2,213,188,481.
At June 30, 2016, the City reported total Deferred Outflows of Resources and Deferred Inflows of Resources related to Pensions for POLICE from the following sources:
Deferred DeferredOutflows Inflows
of Resources of Resources
Differences between Expected and Actual Experience 138,171,189$ 39,566,515$
Changes of Assumptions 470,320,787 0
Net difference between Projected and Actual Earnings on Pension Plan Investments 2,433,620,640 1,488,558,923
Total 3,042,112,616$ 1,528,125,438$
Amounts reported as Deferred Outflows of Resources and Deferred Inflows of Resources related to Pensions for POLICE will be recognized in Pension Expense as follows:
Fiscal YearEnded June 30 Amount2016 135,052,187$ 2017 183,411,2582018 244,416,5002019 673,730,6122020 412,428,808
Pension Expense, Deferred Outflows of Resources, Deferred Inflows of Resources

Appendix DPage 6
NYC Office of the Actuary October 11, 2016
Fiscal Year Ended June 30 2016 2015 2014 2013 2012 2011 2010 2009 2008 2007
1. Actuarially Determined Contribution 2,393,940$ 2,309,619$ 2,320,910$ 2,424,690$ 2,385,731$ 2,083,633$ 1,980,996$ 1,932,150$ 1,797,824$ 1,544,341$
2. Contributions in relation to the Actuarially Determined Contribution 2,393,940$ 2,309,619$ 2,320,910$ 2,424,690$ 2,385,731$ 2,083,633$ 1,980,996$ 1,932,150$ 1,797,824$ 1,544,341$
3. Contribution Deficiency (Excess) 0 0 0 0 0 0 0 0 0
4. Contributions as a percentage of Covered Employee Payroll* 67.619% 65.749% 67.857% 70.080% 69.176% 64.058% 63.955% 65.570% 64.267% 55.386%
*
NEW YORK CITY POLICE PENSION FUND (POLICE)
Governmental Accounting Standards Board Statements No. 67 and No. 68 (GASB 67/68)
Schedule of Employer Contributions ($ in thousands)
The Employer Rate of Contribution equals the Statutory Contribution as a percentage of the salaries of members who were on payroll or projected to be on payroll (under One-Year Lag Methodology) as of the preceding June 30 increased to reflect overtime earnings and adjusted, where applicable, to be consistent with collective bargaining agreements estimated to be achieved.

Appendix DPage 7a
NYC Office of the Actuary October 11, 2016
NEW YORK CITY POLICE PENSION FUND (POLICE)
Governmental Accounting Standards Board Statements No. 67 and No. 68 (GASB 67/68)
Statement of Fiduciary Net PositionJune 30, 2016 and June 30, 2015
(Dollar amounts in thousands)
June 30, 2016 June 30, 2015ASSETS
Cash 116,153$ 48,152$
Receivables:Investment securities sold 575,823 461,115Member loans 251,861 256,288Transferrable earnings due from VSFs to QPP 326,195 (231,000)Accrued interest and dividends 66,102 60,370
Total receivables 1,219,981$ 546,773$
Investments - at fair valueShort-term investments:
Commercial paper 75,098 481,829Short-term investment fund 464,188 681,410U.S. treasury bills and agencies 293,310 682,955Discount notes 0 426,708
Debt securities:U.S. government and agency 6,870,189 7,074,891Corporate and other 0 0Equity securities 6,180,793 6,668,018Alternative Investments 6,382,258 5,770,380
Collective trust funds:Fixed income 656,243 641,806Domestic equity 5,803,115 4,989,666International equity 5,402,281 5,411,168Mortgage debt security 302,440 242,754Treasury inflation protected securities 1,503,457 953,550Promissory notes 0 0Collateral from securities lending 2,945,709 2,678,845
Total Investments 36,879,081$ 36,703,980$
Other assets 16,104 14,879
Total assets 38,231,319$ 37,313,784$
LIABILITIESAccounts payable 260,836 233,964Payables for investment securities purchased 837,047 1,347,025Accrued benefits payable 115,117 107,977Transferrable earnings due from QPP to VSFs 590,000 0Accrued Transfers to VSFs 0 590,000Securities lending 2,945,709 2,678,845
Total liabilities 4,748,709$ 4,957,811$
Plan Net Position Held in Trust for Benefits 33,482,610$ 32,355,973$

Appendix DPage 7b
NYC Office of the Actuary October 11, 2016
NEW YORK CITY POLICE DEPARTMENTPOLICE OFFICERS' VARIABLE SUPPLEMENTS FUND (POVSF)
Governmental Accounting Standards Board Statements No. 67 and No. 68 (GASB 67/68)
Statement of Fiduciary Net PositionJune 30, 2016 and June 30, 2015
(Dollar amounts in thousands)
June 30, 2016 June 30, 2015ASSETS
Cash 1,851$ 3,027$
Receivables:Investment securities sold 65,948 46,598Transferrable earnings due from QPP 330,000 129,000Accrued interest and dividends 2,317 2,299
Total receivables 398,265$ 177,897$
Investments - at fair valueShort term investments:
Commercial paper 10,803 4,752Short-term investments fund 5,710 5,433U.S. treasury bills and agencies 4,551 30,997
Debt securities:U.S. government and agency 322,512 371,413Corporate and other 0 0Equities Securities 612,597 0
Collective trust funds:Domestic equity 0 642,058International equity 338,978 430,625Collateral from securities lending 97,014 70,156
Total Investments 1,392,165$ 1,555,434$
Other assets 0 0
Accrued Transfer from QPP 0 330,000
Total assets 1,792,281$ 2,066,358$
LIABILITIESAccounts payable 12,289 0Payables for investment securities purchased 48,023 72,623Transferrable earnings due from POVSF to QPP 250,751 0Accrued benefits payable 76,586 75,645Securities lending 97,014 70,156
Total liabilities 484,663$ 218,424$
Plan Net Position Held in Trust for Benefits 1,307,618$ 1,847,934$

Appendix DPage 7c
NYC Office of the Actuary October 11, 2016
Statement of Fiduciary Net PositionJune 30, 2016 and June 30, 2015
(Dollar amounts in thousands)
June 30, 2016 June 30, 2015ASSETS
Cash 863$ 1,141$
Receivables:Investment securities sold 26,453 13,300Transferrable earnings due from QPP 260,000 102,000Accrued interest and dividends 804 1,028
Total receivables 287,257$ 116,328$
Investments - at fair valueShort-term investments:
Commercial paper 1,903 4,202Short-term investment fund 2,045 1,636U.S. treasury bills and agencies 258 34,477
Debt securities:U.S. government and agency 119,780 176,510Corporate and other 0 0
Collective trust funds:Domestic equity 210,014 308,588International equity 114,821 188,394Collateral from securities lending 35,508 43,750
Total Investments 484,329$ 757,557$
Other assets 0 0
Accrued Transfer from QPP 0 260,000
Total assets 772,449$ 1,135,026$
LIABILITIESAccounts payable & accrued liabilities 6,273 0Payables for investment securities purchased 19,764 25,776Transferrable earnings due from PSOVSF to QPP 75,444 0Accrued benefits payable 113,709 110,878Securities lending 35,508 43,750
Total liabilities 250,698$ 180,404$
Plan Net Position Held in Trust for Benefits 521,751$ 954,622$
POLICE SUPERIOR OFFICERS' VARIABLE SUPPLEMENTS FUND (PSOVSF)NEW YORK CITY POLICE DEPARTMENT
Governmental Accounting Standards Board Statements No. 67 and No. 68 (GASB 67/68)

Appendix DPage 8a
NYC Office of the Actuary October 11, 2016
NEW YORK CITY POLICE PENSION FUND (POLICE)
Governmental Accounting Standards Board Statements No. 67 and No. 68 (GASB 67/68)
Statement of Changes in Fiduciary Net PositionJune 30, 2016 and June 30, 2015
(Dollar amounts in thousands)
June 30, 2016 June 30, 2015ADDITIONS
Contributions:Member Contributions 249,921$ 241,102$ Employer Contributions 2,393,940 2,309,619
Total contributions 2,643,861$ 2,550,721$
Investment income:Interest income 416,038 392,792Dividend income 449,480 703,701Net appreciation (depreciation) in fair value (85,518) 96,151
Total investment income 780,000$ 1,192,644$
Less:Investment expenses 156,155 192,099
Net income 623,845 1,000,545
Securities lending transactions:Securities lending income 21,896 19,209Securities lending fees (1,423) (1,248)
Net securities lending income 20,473$ 17,961$
Net investment income 644,318 1,018,506Other:
Net receipts from other retirement systems 3,786 3,574Transferrable earnings due from VSFs to QPP 326,195 0Litigation income 2,693 980
Total additions 3,620,853$ 3,573,781$
DEDUCTIONSBenefit payments and withdrawals 2,475,738 2,360,484Transfer to PSOVSF 0 0Reimbursement of benefit payments from QPP to PSOVSF 0 313Accrued Transfers to VSFs 0 590,000Administrative expenses 18,478 17,903
Total deductions 2,494,216$ 2,968,700$
INCREASE IN PLAN NET POSITION 1,126,637 605,081
PLAN NET POSITION HELD IN TRUST FOR BENEFITS:Beginning of year 32,355,973$ 31,750,892$
End of year 33,482,610$ 32,355,973$

Appendix DPage 8b
NYC Office of the Actuary October 11, 2016
NEW YORK CITY POLICE DEPARTMENTPOLICE OFFICERS' VARIABLE SUPPLEMENTS FUND (POVSF)
Governmental Accounting Standards Board Statements No. 67 and No. 68 (GASB 67/68)
Statement of Changes in Fiduciary Net PositionJune 30, 2016 and June 30, 2015
(Dollar amounts in thousands)
June 30, 2016 June 30, 2015ADDITIONS
Contributions:Member Contributions 0$ 0$ Employer Contributions 0 0
Total contributions 0$ 0$
Investment income:Interest income 11,930 7,280Dividend income 25,507 19,099Net appreciation (depreciation) in fair value (170,921) 34,438
Total investment income (133,484)$ 60,817$
Less:Investment expenses 437 288
Net income (133,921) 60,529
Securities lending transactions:Securities lending income 967 524Securities lending fees (63) (34)
Net securities lending income 904$ 490$
Net investment income (133,017) 61,019
Other:Litigation income 147 25
Accrued Transfer from QPP 0 330,000
Total additions (132,870) 391,044
DEDUCTIONSBenefit payments and withdrawals 156,695 152,045Transferrable earnings due from POVSF to QPP 250,751 0
Total deductions 407,446 152,045
INCREASE IN PLAN NET POSITION (540,316) 238,999
PLAN NET POSITION HELD IN TRUST FOR BENEFITS:Beginning of year 1,847,934$ 1,608,935$
End of year 1,307,618$ 1,847,934$

Appendix DPage 8c
NYC Office of the Actuary October 11, 2016
NEW YORK CITY POLICE DEPARTMENTPOLICE SUPERIOR OFFICERS' VARIABLE SUPPLEMENTS FUND (PSOVSF)
Governmental Accounting Standards Board Statements No. 67 and No. 68 (GASB 67/68)
Statement of Changes in Fiduciary Net PositionJune 30, 2016 and June 30, 2015
(Dollar amounts in thousands)
June 30, 2016 June 30, 2015ADDITIONS
Contributions:Member Contributions 0$ 0$ Employer Contributions 0 0
Total contributions 0$ 0$
Investment income:Interest income 5,041 2,020Dividend income 10,007 7,443Net appreciation (depreciation) in fair value (122,997) 9,173
Total investment income (107,949)$ 18,636$
Less:Investment expenses 179 122
Net income (108,128) 18,514
Securities lending transactions:Securities lending income 386 194Securities lending fees (25) (13)
Net securities lending income 361$ 181$
Net investment income (107,767) 18,695
Other:Litigation income 130 37Transfer from QPP 0 0Reimbursement of benefit payments from QPP 0 313
Accrued Transfer from QPP 0 260,000
Total additions (107,637) 279,045
DEDUCTIONSBenefit payments and withdrawals 249,790 237,246Transferrable earnings due from PSOVSF to QPP 75,444 0
Total deductions 325,234 237,246
INCREASE IN PLAN NET POSITION (432,871) 41,799
PLAN NET POSITION HELD IN TRUST FOR BENEFITS:Beginning of year 954,622$ 912,823$
End of year 521,751$ 954,622$

Appendix DPage 9
NYC Office of the Actuary October 11, 2016
Long-TermTarget Expected Asset Real Rate
Asset Class Allocation of Return
U.S. Public Market Equities 34.00% 6.60%
International Public Market Equities 10.00% 7.00%
Emerging Public Market Equities 6.00% 7.90%
Private Market Equities 7.00% 9.90%
Fixed Income (Core, TIPS, HY, Opportunistic, Convertibles) 32.00% 2.70%
Alternatives (Real Assets, Hedge Funds) 11.00% 4.00%
Total 100.00%
The Discount Rate used to measure the Total Pension Liability was 7.0% per annum. The projection of Cash Flows used todetermine the Discount Rate assumes that employee contributions will be made at the rates applicable to the current Tier foreach member and that employer contributions will be made at rates as determined by the Actuary. Based on thoseassumptions, the pension fund's Fiduciary Net Position is projected to be available to make all projected future benefitpayments of current active and non-active members. Therefore, the Long-Term Expected Rate of Return on pension fundinvestments was applied to all periods of projected benefit payments to determine the Total Pension Liability.
Governmental Accounting Standards Board Statements No. 67 and No. 68 (GASB 67/68)
NEW YORK CITY POLICE PENSION FUND (POLICE)
Long-Term Expected Rate of Return
The Long-Term Expected Rate of Return (LTEROR) assumption on pension fund investments was determined using aBuilding-Block Method in which best-estimate ranges of Expected Real Rates of Return (i.e., Expected Returns, net ofpension fund investment expenses and inflation) are developed for each major asset class. These ranges are combined toproduce the LTEROR by weighting the Expected Real Rates of Return (RROR) by the Target Asset Allocation percentageand by adding Expected Inflation. The Target Asset Allocation and best estimates of Arithmetic Real Rates of Return foreach major asset class are summarized in the following table:

Appendix DPage 10a
NYC Office of the Actuary October 11, 2016
NEW YORK CITY POLICE PENSION FUND (POLICE)
Governmental Accounting Standards Board Statements No. 67 and No. 68 (GASB 67/68)
Increase (Decrease) in Pension Expense Arising from the Recognition of Differencesbetween Projected and Actual Earnings on Pension Plan Investments
Differencesbetween Projected
and ActualEarnings on RecognitionPension Plan Period
Year Investments (Years) 2013 2014 2015 2016 2017 2018 2019 20202013 (1,261,230,122)$ 5 (252,246,024)$ (252,246,024)$ (252,246,024)$ (252,246,024)$ (252,246,026)$ 2014 (3,090,782,244)$ 5 (618,156,449)$ (618,156,449)$ (618,156,449)$ (618,156,449)$ (618,156,448)$ 2015 1,306,509,007$ 5 261,301,801$ 261,301,801$ 261,301,801$ 261,301,801$ 261,301,803$ 2016 2,062,144,044$ 5 412,428,809$ 412,428,809$ 412,428,809$ 412,428,809$ 412,428,808$ 2017201820192020
Net increase (decrease) in Pension Expense (252,246,024)$ (870,402,473)$ (609,100,672)$ (196,671,863)$ (196,671,865)$ 55,574,162$ 673,730,612$ 412,428,808$
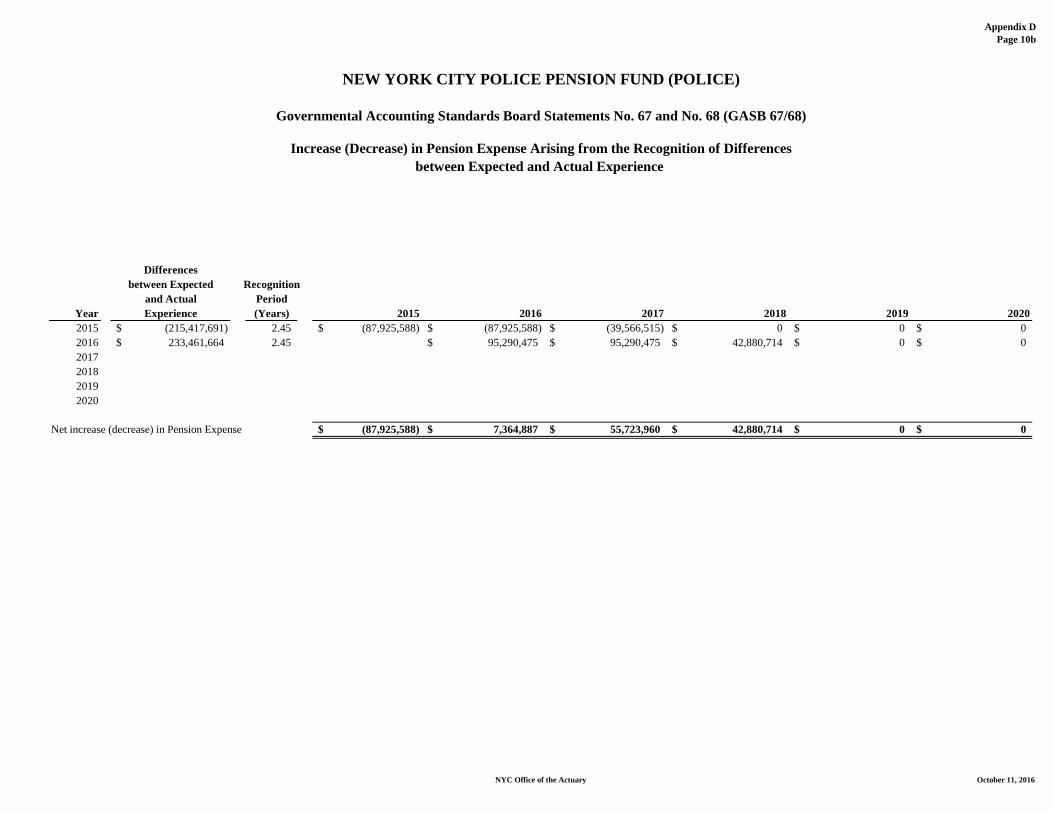
Appendix DPage 10b
NYC Office of the Actuary October 11, 2016
NEW YORK CITY POLICE PENSION FUND (POLICE)
Governmental Accounting Standards Board Statements No. 67 and No. 68 (GASB 67/68)
Increase (Decrease) in Pension Expense Arising from the Recognition of Differencesbetween Expected and Actual Experience
Differencesbetween Expected Recognition
and Actual PeriodYear Experience (Years) 2015 2016 2017 2018 2019 20202015 (215,417,691)$ 2.45 (87,925,588)$ (87,925,588)$ (39,566,515)$ 0$ 0$ 0$ 2016 233,461,664$ 2.45 95,290,475$ 95,290,475$ 42,880,714$ 0$ 0$ 2017201820192020
Net increase (decrease) in Pension Expense (87,925,588)$ 7,364,887$ 55,723,960$ 42,880,714$ 0$ 0$

Appendix DPage 10c
NYC Office of the Actuary October 11, 2016
NEW YORK CITY POLICE PENSION FUND (POLICE)
Governmental Accounting Standards Board Statements No. 67 and No. 68 (GASB 67/68)
Increase (Decrease) in Pension Expense Arising from the Recognition of Changes in Assumptions
Increase (Decrease)Due to Recognition
Changes in PeriodYear Assumptions (Years) 2016 2017 2018 2019 20202016 794,679,950$ 2.45 324,359,163$ 324,359,163$ 145,961,624$ 0$ 0$ 2017201820192020
Net increase (decrease) in Pension Expense 324,359,163$ 324,359,163$ 145,961,624$ 0$ 0$

Appendix DPage 11
NYC Office of the Actuary October 11, 2016
2016 2015 (Revised)1. Total Pension Liability
a. Service Cost 1,340,614,909$ 1,325,807,839$ b. Interest 3,441,398,429 3,245,225,246c. Differences b/t Expected and Actual Experience 233,461,664 (215,417,691)d. Changes of Assumptions 794,679,950 0e. Benefit Payments (2,878,451,000) (2,746,784,000)f. Net Changes 2,931,703,952$ 1,608,831,394$
2. Total Pension Liability - Beginning 48,209,042,442$ 46,600,211,048$ 3. Total Pension Liability - Ending 51,140,746,394$ 48,209,042,442$
4. Plan Fiduciary Net Positiona. Contributions - Employer 2,393,940,000$ 2,309,619,000$ b. Contributions - Employee 249,921,000 241,102,000c. Net Investment Income 403,534,000 1,098,220,000d. Benefit Payments (2,878,451,000) (2,746,784,000)e. Administrative Expenses (18,478,000) (17,903,000)f. Transfer to PSOVSF / from QPP 0 0g. Other Changes 6,756,000 4,616,000h. Net Changes 157,222,000$ 888,870,000$
5. Plan Fiduciary Net Position - Beginning 35,345,052,000$ 34,456,182,000$ 6. Plan Fiduciary Net Position - Ending 35,502,274,000$ 35,345,052,000$
7. POLICE Net Pension Liability 15,638,472,394$ 12,863,990,442$
8. Plan Fiduciary Net Position as a Percentageof Total Pension Liability 69.4% 73.3%
9. Covered Employee Payroll 1 3,540,326,198$ 3,512,777,844$
10. POLICE Net Pension Liability as a Percentageof Covered Employee Payroll 441.7% 366.2%
1 Projected Employee Payroll at Time 1.0 under One-Year Lag Methodology.
NEW YORK CITY POLICE PENSION FUND (POLICE)
Governmental Accounting Standards Board Statements No. 67 and No. 68 (GASB 67/68)
Schedule of Changes in Net Pension Liability and Related Ratios

Appendix DPage 12
NYC Office of the Actuary October 11, 2016
PV of Future Average Expected Average ExpectedWorkLife Remaining Service Life Remaining Service Life
Group # Count @ 6/30/2014 @ 6/30/2014 @ 6/30/2015Active 34,402 227,600 6.62 6.01 Active/Inactive 1,369 0 0 0 Terminated Vested 572 0 0 0 Retired 48,212 0 0 0 Total 84,555 227,600 2.69 2.45
NEW YORK CITY POLICE PENSION FUND (POLICE)
Governmental Accounting Standards Board Statements No. 67 and No. 68 (GASB 67/68)
Average Expected Remaining Service Lives

APPENDIX E

NYC Office of the Actuary October 11, 2016
Page 1a - Market Value of AssetsPage 1b - Development of Asset (Gain) / Loss - June 30, 2015Page 1c - Development of Asset (Gain) / Loss - June 30, 2016
Page 2a - Roll-Forward of Entry Age Actuarial Accrued Liabilities to June 30, 2015 (Revised)Page 2b - Roll-Forward of Entry Age Actuarial Accrued Liabilities to June 30, 2016
Page 3a - Changes in Net Pension Liability by Source - June 30, 2015 (Revised)Page 3b - Changes in Net Pension Liability by Source - June 30, 2016
Page 4a - Components of Pension Expense - June 30, 2015 (Revised)Page 4b - Components of Pension Expense - June 30, 2016
Page 5a - Pension Expense, Total Deferred Inflows/Outflows of Resources at June 30, 2013Page 5b - Pension Expense, Deferred Inflows/Outflows of Resources at June 30, 2014Page 5c - Pension Expense, Deferred Inflows/Outflows of Resources for June 30, 2015Page 5d - Pension Expense, Deferred Inflows/Outflows of Resources at June 30, 2016Page 5e - Pension Expense, Total Deferred Inflows/Outflows of Resources at June 30, 2016
Page 6 - Schedule of Employer Contributions
Page 7a - Statement of Fiduciary Net Position - FIREPage 7b - Statement of Fiduciary Net Position - FFVSFPage 7c - Statement of Fiduciary Net Position - FOVSF
Page 8a - Statement of Changes in Fiduciary Net Position - FIREPage 8b - Statement of Changes in Fiduciary Net Position - FFVSFPage 8c - Statement of Changes in Fiduciary Net Position - FOVSF
Page 9 - Long-Term Expected Rate of Return
Page 10a - Increase (Decrease) in Pension Expense Arising from the Recognition of Differences between Projected and Actual Earnings on Pension Plan Investments
Page 10b - Increase (Decrease) in Pension Expense Arising from the Recognition of Differences between Expected and Actual Experience
Page 10c - Increase (Decrease) in Pension Expense Arising from the Recognition of Changes in Assumptions
Page 11 - Schedule of Changes in Net Pension Liability and Related Ratios
Page 12 - Average Expected Remaining Service Lives
NEW YORK FIRE DEPARTMENT PENSION FUND (FIRE)
APPENDIX E
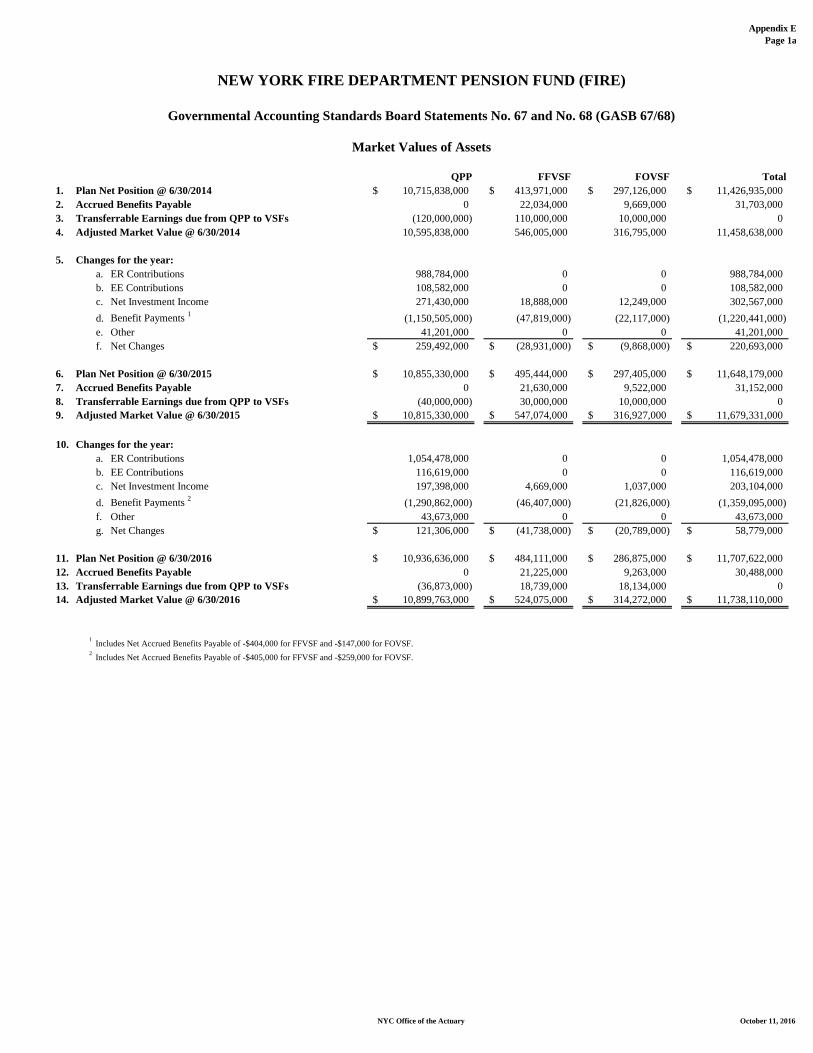
Appendix EPage 1a
NYC Office of the Actuary October 11, 2016
QPP FFVSF FOVSF Total1. Plan Net Position @ 6/30/2014 10,715,838,000$ 413,971,000$ 297,126,000$ 11,426,935,000$ 2. Accrued Benefits Payable 0 22,034,000 9,669,000 31,703,0003. Transferrable Earnings due from QPP to VSFs (120,000,000) 110,000,000 10,000,000 04. Adjusted Market Value @ 6/30/2014 10,595,838,000 546,005,000 316,795,000 11,458,638,000
5. Changes for the year:a. ER Contributions 988,784,000 0 0 988,784,000b. EE Contributions 108,582,000 0 0 108,582,000c. Net Investment Income 271,430,000 18,888,000 12,249,000 302,567,000d. Benefit Payments 1 (1,150,505,000) (47,819,000) (22,117,000) (1,220,441,000)e. Other 41,201,000 0 0 41,201,000f. Net Changes 259,492,000$ (28,931,000)$ (9,868,000)$ 220,693,000$
6. Plan Net Position @ 6/30/2015 10,855,330,000$ 495,444,000$ 297,405,000$ 11,648,179,000$ 7. Accrued Benefits Payable 0 21,630,000 9,522,000 31,152,0008. Transferrable Earnings due from QPP to VSFs (40,000,000) 30,000,000 10,000,000 09. Adjusted Market Value @ 6/30/2015 10,815,330,000$ 547,074,000$ 316,927,000$ 11,679,331,000$
10. Changes for the year:a. ER Contributions 1,054,478,000 0 0 1,054,478,000b. EE Contributions 116,619,000 0 0 116,619,000c. Net Investment Income 197,398,000 4,669,000 1,037,000 203,104,000d. Benefit Payments 2 (1,290,862,000) (46,407,000) (21,826,000) (1,359,095,000)f. Other 43,673,000 0 0 43,673,000g. Net Changes 121,306,000$ (41,738,000)$ (20,789,000)$ 58,779,000$
11. Plan Net Position @ 6/30/2016 10,936,636,000$ 484,111,000$ 286,875,000$ 11,707,622,000$ 12. Accrued Benefits Payable 0 21,225,000 9,263,000 30,488,00013. Transferrable Earnings due from QPP to VSFs (36,873,000) 18,739,000 18,134,000 014. Adjusted Market Value @ 6/30/2016 10,899,763,000$ 524,075,000$ 314,272,000$ 11,738,110,000$
1 Includes Net Accrued Benefits Payable of -$404,000 for FFVSF and -$147,000 for FOVSF.2 Includes Net Accrued Benefits Payable of -$405,000 for FFVSF and -$259,000 for FOVSF.
NEW YORK FIRE DEPARTMENT PENSION FUND (FIRE)
Governmental Accounting Standards Board Statements No. 67 and No. 68 (GASB 67/68)
Market Values of Assets

Appendix EPage 1b
NYC Office of the Actuary October 11, 2016
QPP FFVSF FOVSF Total
1. Market Value 6/30/2014
a. Market Value 6/30/2014* 10,715,838,000$ 436,005,000$ 306,795,000$ 11,458,638,000$
b. 2014 Transferrable Earnings due from QPP to VSFs (120,000,000) 110,000,000 10,000,000 0
c. Adjusted Market Value @6/30/2014 10,595,838,000 546,005,000 316,795,000 11,458,638,000
d. Market Value 6/30/2015** 10,855,330,000 517,074,000 306,927,000 11,679,331,000
e. 2015 Transferrable Earnings due from QPP to VSFs (40,000,000) 30,000,000 10,000,000 0
f. Adjusted Market Value @6/30/2015 10,815,330,000 547,074,000 316,927,000 11,679,331,000
2. Net Investment Income 271,430,000 18,888,000 12,249,000 302,567,000
3. Cash Flow (131,938,000) 62,181,000 (12,117,000) (81,874,000)(1.d. - 1.a. - 2.)
4. Projected Earnings 745,568,673 32,659,998 21,058,704 799,287,375 (7% * 1.a. + 3.441% * 3.)
5. (Gain) / Loss 474,138,673 13,771,998 8,809,704 496,720,375(4. - 2.)
6. Recognition Period 5 Years 5 Years 5 Years 5 Years
7. Amount Recognized in Pension Expense 94,827,735 2,754,400 1,761,941 99,344,076(5. / 6.)
8. Deferred (Inflow) / Outflow of Resources 379,310,938$ 11,017,598$ 7,047,763$ 397,376,299$ (5. - 7.)
* Before Reflecting 2014 Transferrable Earnings due from QPP to VSFs.
** Before Reflecting 2015 Transferrable Earnings due from QPP to VSFs.
NEW YORK FIRE DEPARTMENT PENSION FUND (FIRE)
Governmental Accounting Standards Board Statements No. 67 and No. 68 (GASB 67/68)
Development of Asset (Gain) / LossJune 30, 2015

Appendix EPage 1c
NYC Office of the Actuary October 11, 2016
QPP FFVSF FOVSF Total
1. Assets
a. Market Value 6/30/2015* 10,855,330,000$ 517,074,000$ 306,927,000$ 11,679,331,000$
b. 2015 Transferrable Earnings due from QPP to VSFs (40,000,000) 30,000,000 10,000,000 0
c. Adjusted Market Value @6/30/2015 10,815,330,000 547,074,000 316,927,000 11,679,331,000
d. Market Value 6/30/2016** 10,936,636,000 505,336,000 296,138,000 11,738,110,000
e. 2016 Transferrable Earnings due from QPP to VSFs (36,873,000) 18,739,000 18,134,000 0
f. Adjusted Market Value @6/30/2016 10,899,763,000 524,075,000 314,272,000 11,738,110,000
2. Net Investment Income 197,398,000 4,669,000 1,037,000 203,104,000
3. Cash Flow (116,092,000) (16,407,000) (11,826,000) (144,325,000)(1.d. - 1.a. - 2.)
4. Projected Earnings 755,878,374 35,630,615 21,077,957 812,586,946 (7% * 1.a. + 3.441% * 3.)
5. (Gain) / Loss 558,480,374 30,961,615 20,040,957 609,482,946(4. - 2.)
6. Recognition Period 5 Years 5 Years 5 Years 5 Years
7. Amount Recognized in Pension Expense 111,696,075 6,192,323 4,008,191 121,896,589(5. / 6.)
8. Deferred (Inflow) / Outflow of Resources 446,784,299$ 24,769,292$ 16,032,766$ 487,586,357$ (5. - 7.)
* Before Reflecting 2015 Transferrable Earnings due from QPP to VSFs.
** Before Reflecting 2016 Transferrable Earnings due from QPP to VSFs.
NEW YORK FIRE DEPARTMENT PENSION FUND (FIRE)
Governmental Accounting Standards Board Statements No. 67 and No. 68 (GASB 67/68)
Development of Asset (Gain) / LossJune 30, 2016

Appendix EPage 2a
NYC Office of the Actuary October 11, 2016
QPP FFVSF FOVSF Total1. EA Accrued Liability at 6/30/2013 16,805,287,332$ 549,158,798$ 342,103,004$ 17,696,549,134$ 2. EA Normal Cost at 6/30/2013 385,209,039 11,164,828 4,428,330 400,802,1973. Benefit Payments-FY14 1,099,162,000 50,822,000 22,014,000 1,171,998,0004. Interest 1,165,512,582 37,473,869 23,499,692 1,226,486,143
5a. Roll-Forward EAAL at 6/30/2014 17,256,846,953$ 546,975,495$ 348,017,026$ 18,151,839,474$ 5b. Additional EAAL at 6/30/2014 due to SADB 783,004,303 0 0 783,004,3035c. Revised Roll-Forward EAAL at 6/30/2014 18,039,851,256$ 546,975,495$ 348,017,026$ 18,934,843,777$
6. EA Normal Cost at 6/30/2014 403,514,593 11,499,773 4,561,180 419,575,5467. Benefit Payments-FY15 1,150,505,000 47,819,000 22,117,000 1,220,441,0008. Interest 1,251,446,732 37,447,817 23,919,428 1,312,813,977
9. Roll-Forward EAAL at 6/30/2015 18,544,307,581$ 548,104,085$ 354,380,634$ 19,446,792,300$
1 Special Accidental Death Benefits pursuant to Section 208-f of the General Municipal Law.
NEW YORK FIRE DEPARTMENT PENSION FUND (FIRE)
Governmental Accounting Standards Board Statements No. 67 and No. 68 (GASB 67/68)
Roll-Forward of Entry Age Actuarial Accrued Liabilities to June 30, 2015 (Revised)1

Appendix EPage 2b
NYC Office of the Actuary October 11, 2016
QPP FFVSF FOVSF Total1. EA Accrued Liability at 6/30/2014 18,705,279,595$ 562,253,222$ 349,588,628$ 19,617,121,445$ 2. EA Normal Cost at 6/30/2014 402,537,458 11,312,864 4,856,205 418,706,5273. Benefit Payments-FY15 1,150,505,000 47,819,000 22,117,000 1,220,441,0004. Interest 1,297,958,317 38,504,174 24,050,092 1,360,512,583
5. Roll-Forward EAAL at 6/30/2015 19,255,270,370$ 564,251,260$ 356,377,925$ 20,175,899,555$
6. EA Normal Cost at 6/30/2015 414,613,582 11,652,250 5,001,891 431,267,7237. Benefit Payments-FY16 1,290,862,000 46,407,000 21,826,000 1,359,095,0008. Interest 1,332,473,315 38,716,381 24,545,554 1,395,735,250
9. Roll-Forward EAAL at 6/30/2016 19,711,495,267$ 568,212,891$ 364,099,370$ 20,643,807,528$
Roll-Forward of Entry Age Actuarial Accrued Liabilities to June 30, 2016
NEW YORK FIRE DEPARTMENT PENSION FUND (FIRE)
Governmental Accounting Standards Board Statements No. 67 and No. 68 (GASB 67/68)

Appendix EPage 3a(1)
NYC Office of the Actuary October 11, 2016
Total Pension Plan Fiduciary Net PensionLiability Net Position2 Liability
(a) (b) (a) - (b)1a. Balances at June 30, 2014 17,980,492,338$ 11,458,638,000$ 6,521,854,338$
1b. Adjustment for additional TPL attributable to SADB 783,004,303$ 0$ 783,004,303$
1c. Revised Balances at June 30, 2014 18,763,496,641$ 11,458,638,000$ 7,304,858,641$
2. Changes for the Year:a. Service Cost 419,575,546 0 419,575,546b. Interest 1,312,813,977 0 1,312,813,977c. Differences b/t Expected and Actual Experience 171,347,136 0 171,347,136d. Contributions - Employer 0 988,784,000 (988,784,000)e. Contributions - Employee 0 108,582,000 (108,582,000)f. Net Investment Income 0 302,567,000 (302,567,000)g. Benefit Payments (1,220,441,000) (1,220,441,000) 0h. Administrative Expenses 0 0 0i. Other Changes 0 41,201,000 (41,201,000)j. Net Changes 683,295,659$ 220,693,000$ 462,602,659$
3. Revised Balances at June 30, 2015 19,446,792,300$ 11,679,331,000$ 7,767,461,300$
1 Special Accidental Death Benefits pursuant to Section 208-f of the General Municipal Law.2 Balances at 6/30/2014 and 6/30/2015 are Adjusted Market Values - See Page 1a.
NEW YORK FIRE DEPARTMENT PENSION FUND (FIRE)
Governmental Accounting Standards Board Statements No. 67 and No. 68 (GASB 67/68)
Changes in Net Pension Liability (NPL) by SourceBalances at June 30, 2015 (Revised)1
Total

Appendix EPage 3a(2)
NYC Office of the Actuary October 11, 2016
Total Pension Plan Fiduciary Net PensionLiability Net Position2 Liability
(a) (b) (a) - (b)1a. Balances at June 30, 2014 17,076,313,514$ 10,595,838,000$ 6,480,475,514$
1b. Adjustment for additional TPL attributable to SADB 783,004,303$ 0$ 783,004,303$
1c. Revised Balances at June 30, 2014 17,859,317,817$ 10,595,838,000$ 7,263,479,817$
2. Changes for the Year:a. Service Cost 403,514,593 0 403,514,593b. Interest 1,251,446,732 0 1,251,446,732c. Differences b/t Expected and Actual Experience 180,533,439 0 180,533,439d. Contributions - Employer 0 988,784,000 (988,784,000)e. Contributions - Employee 0 108,582,000 (108,582,000)f. Net Investment Income 0 271,430,000 (271,430,000)g. Benefit Payments (1,150,505,000) (1,150,505,000) 0h. Administrative Expenses 0 0 0i. Other Changes 0 41,201,000 (41,201,000)j. Net Changes 684,989,764$ 259,492,000$ 425,497,764$
3. Transferrable Earnings due from QPP to VSFs 0 (40,000,000) 40,000,0004. Revised Balances at June 30, 2015 18,544,307,581$ 10,815,330,000$ 7,728,977,581$
1 Special Accidental Death Benefits pursuant to Section 208-f of the General Municipal Law.2 Balances at 6/30/2014 and 6/30/2015 are Adjusted Market Values - See Page 1a.
NEW YORK FIRE DEPARTMENT PENSION FUND (FIRE)
Governmental Accounting Standards Board Statements No. 67 and No. 68 (GASB 67/68)
Changes in Net Pension Liability (NPL) by SourceBalances at June 30, 2015 (Revised)1
QPP

Appendix EPage 3a(3)
NYC Office of the Actuary October 11, 2016
Total Pension Plan Fiduciary Net PensionLiability Net Position1 Liability
(a) (b) (a) - (b)1. Balances at June 30, 2014 551,299,882$ 546,005,000$ 5,294,882$
2. Changes for the Year:a. Service Cost 11,499,773 0 11,499,773b. Interest 37,447,817 0 37,447,817c. Differences b/t Expected and Actual Experience (4,324,387) 0 (4,324,387)d. Contributions - Employer 0 0 0e. Contributions - Employee 0 0 0f. Net Investment Income 0 18,888,000 (18,888,000)g. Benefit Payments (47,819,000) (47,819,000) 0h. Administrative Expenses 0 0 0i. Other Changes 0 0 0j. Net Changes (3,195,797)$ (28,931,000)$ 25,735,203$
3. Transferrable Earnings due from QPP to FFVSF 0 30,000,000 (30,000,000)4. Balances at June 30, 2015 548,104,085$ 547,074,000$ 1,030,085$
1 Balances at 6/30/2014 and 6/30/2015 are Adjusted Market Values - See Page 1a.
NEW YORK FIRE DEPARTMENT PENSION FUND (FIRE)
Governmental Accounting Standards Board Statements No. 67 and No. 68 (GASB 67/68)
Changes in Net Pension Liability (NPL) by SourceBalances at June 30, 2015
FFVSF

Appendix EPage 3a(4)
NYC Office of the Actuary October 11, 2016
Total Pension Plan Fiduciary Net PensionLiability Net Position1 Liability
(a) (b) (a) - (b)1. Balances at June 30, 2014 352,878,942$ 316,795,000$ 36,083,942$
2. Changes for the Year:a. Service Cost 4,561,180 0 4,561,180b. Interest 23,919,428 0 23,919,428c. Differences b/t Expected and Actual Experience (4,861,916) 0 (4,861,916)d. Contributions - Employer 0 0 0e. Contributions - Employee 0 0 0f. Net Investment Income 0 12,249,000 (12,249,000)g. Benefit Payments (22,117,000) (22,117,000) 0h. Administrative Expenses 0 0 0i. Other Changes 0 0 0j. Net Changes 1,501,692$ (9,868,000)$ 11,369,692$
3. Transferrable Earnings due from QPP to FOVSF 0 10,000,000 (10,000,000)4. Balances at June 30, 2015 354,380,634$ 316,927,000$ 37,453,634$
1 Balances at 6/30/2014 and 6/30/2015 are Adjusted Market Values - See Page 1a.
NEW YORK FIRE DEPARTMENT PENSION FUND (FIRE)
Governmental Accounting Standards Board Statements No. 67 and No. 68 (GASB 67/68)
Changes in Net Pension Liability (NPL) by SourceBalances at June 30, 2015
FOVSF

Appendix EPage 3a(5)
NYC Office of the Actuary October 11, 2016
QPP FFVSF FOVSF Total1a. Balances at June 30, 2014 17,076,313,514$ 551,299,882$ 352,878,942$ 17,980,492,338$
1b. Adjustment for additional TPL attributable to SADB 783,004,303$ -$ -$ 783,004,303$
1c. Revised Balances at June 30, 2014 17,859,317,817$ 551,299,882$ 352,878,942$ 18,763,496,641$
2. Changes for the Year:a. Service Cost 403,514,593 11,499,773 4,561,180 419,575,546b. Interest 1,251,446,732 37,447,817 23,919,428 1,312,813,977c. Differences b/t Expected and Actual Experience 180,533,439 (4,324,387) (4,861,916) 171,347,136d. Benefit Payments (1,150,505,000) (47,819,000) (22,117,000) (1,220,441,000)e. Net Changes 684,989,764$ (3,195,797)$ 1,501,692$ 683,295,659$
3. Revised Balances at June 30, 2015 18,544,307,581$ 548,104,085$ 354,380,634$ 19,446,792,300$
QPP FFVSF FOVSF Total4. Balances at June 30, 2014 10,595,838,000$ 546,005,000$ 316,795,000$ 11,458,638,000$
5. Changes for the Year:a. Contributions - Employer 988,784,000 0 0 988,784,000b. Contributions - Employee 108,582,000 0 0 108,582,000c. Net Investment Income 271,430,000 18,888,000 12,249,000 302,567,000d. Benefit Payments (1,150,505,000) (47,819,000) (22,117,000) (1,220,441,000)e. Administrative Expenses 0 0 0 0f. Other Changes 41,201,000 0 0 41,201,000g. Net Changes 259,492,000$ (28,931,000)$ (9,868,000)$ 220,693,000$
6. Transferrable Earnings due from QPP to VSFs (40,000,000) 30,000,000 10,000,000 07. Balances at June 30, 2015 10,815,330,000$ 547,074,000$ 316,927,000$ 11,679,331,000$
QPP FFVSF FOVSF Total8a. Balances at June 30, 2014 6,480,475,514$ 5,294,882$ 36,083,942$ 6,521,854,338$
8b. Adjustment for additional TPL attributable to SADB 783,004,303$ -$ -$ 783,004,303$
8c. Revised Balances at June 30, 2014 7,263,479,817$ 5,294,882$ 36,083,942$ 7,304,858,641$
9. Changes for the Year:a. Service Cost 403,514,593 11,499,773 4,561,180 419,575,546b. Interest 1,251,446,732 37,447,817 23,919,428 1,312,813,977c. Differences b/t Expected and Actual Experience 180,533,439 (4,324,387) (4,861,916) 171,347,136d. Contributions - Employer (988,784,000) 0 0 (988,784,000)e. Contributions - Employee (108,582,000) 0 0 (108,582,000)f. Net Investment Income (271,430,000) (18,888,000) (12,249,000) (302,567,000)g. Benefit Payments 0 0 0 0h. Administrative Expenses 0 0 0 0i. Other Changes (41,201,000) 0 0 (41,201,000)j. Net Changes 425,497,764$ 25,735,203$ 11,369,692$ 462,602,659$
10. Transferrable Earnings due from QPP to VSFs 40,000,000 (30,000,000) (10,000,000) 011. Revised Balances at June 30, 2015 7,728,977,581$ 1,030,085$ 37,453,634$ 7,767,461,300$
1 Special Accidental Death Benefits pursuant to Section 208-f of the General Municipal Law.2 Balances at 6/30/2014 and 6/30/2015 are Adjusted Market Values - See Page 1a.
NEW YORK FIRE DEPARTMENT PENSION FUND (FIRE)
Governmental Accounting Standards Board Statements No. 67 and No. 68 (GASB 67/68)
Changes in Net Pension Liability (NPL) by SourceRevised Balances at June 30, 20151
Net Pension Liability
Total Pension Liability
Plan Fiduciary Net Position2

Appendix EPage 3b(1)
NYC Office of the Actuary October 11, 2016
Total Pension Plan Fiduciary Net PensionLiability Net Position1 Liability
(a) (b) (a) - (b)1. Revised Balances at June 30, 2015 19,446,792,300$ 11,679,331,000$ 7,767,461,300$
2. Changes for the Year:a. Service Cost 431,267,723 0 431,267,723b. Interest 1,395,735,250 0 1,395,735,250c. Differences b/t Expected and Actual Experience 323,609,267 0 323,609,267d. Changes of Assumptions 405,497,988 0 405,497,988e. Contributions - Employer 0 1,054,478,000 (1,054,478,000)f. Contributions - Employee 0 116,619,000 (116,619,000)g. Net Investment Income 0 203,104,000 (203,104,000)h. Benefit Payments (1,359,095,000) (1,359,095,000) 0i. Administrative Expenses 0 0 0j. Other Changes 0 43,673,000 (43,673,000)k. Net Changes 1,197,015,228$ 58,779,000$ 1,138,236,228$
3. Balances at June 30, 2016 20,643,807,528$ 11,738,110,000$ 8,905,697,528$
1 Balances at 6/30/2015 and 6/30/2016 are Adjusted Market Values - See Page 1a.
NEW YORK FIRE DEPARTMENT PENSION FUND (FIRE)
Governmental Accounting Standards Board Statements No. 67 and No. 68 (GASB 67/68)
Changes in Net Pension Liability (NPL) by SourceBalances at June 30, 2016
Total

Appendix EPage 3b(2)
NYC Office of the Actuary October 11, 2016
Total Pension Plan Fiduciary Net PensionLiability Net Position1 Liability
(a) (b) (a) - (b)1. Revised Balances at June 30, 2015 18,544,307,581$ 10,815,330,000$ 7,728,977,581$
2. Changes for the Year:a. Service Cost 414,613,582 0 414,613,582b. Interest 1,332,473,315 0 1,332,473,315c. Differences b/t Expected and Actual Experience 324,428,678 0 324,428,678d. Changes of Assumptions 386,534,111 0 386,534,111e. Contributions - Employer 0 1,054,478,000 (1,054,478,000)f. Contributions - Employee 0 116,619,000 (116,619,000)g. Net Investment Income 0 197,398,000 (197,398,000)h. Benefit Payments (1,290,862,000) (1,290,862,000) 0i. Administrative Expenses 0 0 0j. Other Changes 0 43,673,000 (43,673,000)k. Net Changes 1,167,187,686$ 121,306,000$ 1,045,881,686$
3. Transferrable Earnings due from QPP to VSFs 0 (36,873,000) 36,873,0004. Balances at June 30, 2016 19,711,495,267$ 10,899,763,000$ 8,811,732,267$
1 Balances at 6/30/2015 and 6/30/2016 are Adjusted Market Values - See Page 1a.
NEW YORK FIRE DEPARTMENT PENSION FUND (FIRE)
Governmental Accounting Standards Board Statements No. 67 and No. 68 (GASB 67/68)
Changes in Net Pension Liability (NPL) by SourceBalances at June 30, 2016
QPP

Appendix EPage 3b(3)
NYC Office of the Actuary October 11, 2016
Total Pension Plan Fiduciary Net PensionLiability Net Position1 Liability
(a) (b) (a) - (b)1. Balances at June 30, 2015 548,104,085$ 547,074,000$ 1,030,085$
2. Changes for the Year:a. Service Cost 11,652,250 0 11,652,250b. Interest 38,716,381 0 38,716,381c. Differences b/t Expected and Actual Experience 3,728,540 0 3,728,540d. Changes of Assumptions 12,418,635 0 12,418,635e. Contributions - Employer 0 0 0f. Contributions - Employee 0 0 0g. Net Investment Income 0 4,669,000 (4,669,000)h. Benefit Payments (46,407,000) (46,407,000) 0i. Administrative Expenses 0 0 0j. Other Changes 0 0 0k. Net Changes 20,108,806$ (41,738,000)$ 61,846,806$
3. Transferrable Earnings due from QPP to FFVSF 0 18,739,000 (18,739,000)4. Balances at June 30, 2016 568,212,891$ 524,075,000$ 44,137,891$
1 Balances at 6/30/2015 and 6/30/2016 are Adjusted Market Values - See Page 1a.
NEW YORK FIRE DEPARTMENT PENSION FUND (FIRE)
Governmental Accounting Standards Board Statements No. 67 and No. 68 (GASB 67/68)
Changes in Net Pension Liability (NPL) by SourceBalances at June 30, 2016
FFVSF

Appendix EPage 3b(4)
NYC Office of the Actuary October 11, 2016
Total Pension Plan Fiduciary Net PensionLiability Net Position1 Liability
(a) (b) (a) - (b)1. Balances at June 30, 2015 354,380,634$ 316,927,000$ 37,453,634$
2. Changes for the Year:a. Service Cost 5,001,891 0 5,001,891b. Interest 24,545,554 0 24,545,554c. Differences b/t Expected and Actual Experience (4,547,951) 0 (4,547,951)d. Changes of Assumptions 6,545,242 0 6,545,242e. Contributions - Employer 0 0 0f. Contributions - Employee 0 0 0g. Net Investment Income 0 1,037,000 (1,037,000)h. Benefit Payments (21,826,000) (21,826,000) 0i. Administrative Expenses 0 0 0j. Other Changes 0 0 0k. Net Changes 9,718,736$ (20,789,000)$ 30,507,736$
3. Transferrable Earnings due from QPP to FOVSF 0 18,134,000 (18,134,000)4. Balances at June 30, 2016 364,099,370$ 314,272,000$ 49,827,370$
1 Balances at 6/30/2015 and 6/30/2016 are Adjusted Market Values - See Page 1a.
NEW YORK FIRE DEPARTMENT PENSION FUND (FIRE)
Governmental Accounting Standards Board Statements No. 67 and No. 68 (GASB 67/68)
Changes in Net Pension Liability (NPL) by SourceBalances at June 30, 2016
FOVSF

Appendix EPage 3b(5)
NYC Office of the Actuary October 11, 2016
QPP FFVSF FOVSF Total1. Revised Balances at June 30, 2015 18,544,307,581$ 548,104,085$ 354,380,634$ 19,446,792,300$
2. Changes for the Year:a. Service Cost 414,613,582 11,652,250 5,001,891 431,267,723b. Interest 1,332,473,315 38,716,381 24,545,554 1,395,735,250c. Differences b/t Expected and Actual Experience 324,428,678 3,728,540 (4,547,951) 323,609,267d. Change of Assumptions 386,534,111 12,418,635 6,545,242 405,497,988e. Benefit Payments (1,290,862,000) (46,407,000) (21,826,000) (1,359,095,000)f. Net Changes 1,167,187,686$ 20,108,806$ 9,718,736$ 1,197,015,228$
3. Balances at June 30, 2016 19,711,495,267$ 568,212,891$ 364,099,370$ 20,643,807,528$
QPP FFVSF FOVSF Total4. Balances at June 30, 2015 10,815,330,000$ 547,074,000$ 316,927,000$ 11,679,331,000$
5. Changes for the Year:a. Contributions - Employer 1,054,478,000 0 0 1,054,478,000b. Contributions - Employee 116,619,000 0 0 116,619,000c. Net Investment Income 197,398,000 4,669,000 1,037,000 203,104,000d. Benefit Payments (1,290,862,000) (46,407,000) (21,826,000) (1,359,095,000)e. Administrative Expenses 0 0 0 0f. Other Changes 43,673,000 0 0 43,673,000g. Net Changes 121,306,000$ (41,738,000)$ (20,789,000)$ 58,779,000$
6. Transferrable Earnings due from QPP to VSFs (36,873,000) 18,739,000 18,134,000 07. Balances at June 30, 2016 10,899,763,000$ 524,075,000$ 314,272,000$ 11,738,110,000$
QPP FFVSF FOVSF Total8. Revised Balances at June 30, 2015 7,728,977,581$ 1,030,085$ 37,453,634$ 7,767,461,300$
9. Changes for the Year:a. Service Cost 414,613,582 11,652,250 5,001,891 431,267,723b. Interest 1,332,473,315 38,716,381 24,545,554 1,395,735,250c. Differences b/t Expected and Actual Experience 324,428,678 3,728,540 (4,547,951) 323,609,267d. Change of Assumptions 386,534,111 12,418,635 6,545,242 405,497,988e. Contributions - Employer (1,054,478,000) 0 0 (1,054,478,000)f. Contributions - Employee (116,619,000) 0 0 (116,619,000)g. Net Investment Income (197,398,000) (4,669,000) (1,037,000) (203,104,000)h. Benefit Payments 0 0 0 0i. Administrative Expenses 0 0 0 0j. Other Changes (43,673,000) 0 0 (43,673,000)k. Net Changes 1,045,881,686$ 61,846,806$ 30,507,736$ 1,138,236,228$
10. Transferrable Earnings due from QPP to VSFs 36,873,000 (18,739,000) (18,134,000) 011. Balances at June 30, 2016 8,811,732,267$ 44,137,891$ 49,827,370$ 8,905,697,528$
1 Balances at 6/30/2015 and 6/30/2016 are Adjusted Market Values - See Page 1a.
NEW YORK FIRE DEPARTMENT PENSION FUND (FIRE)
Net Pension Liability
Total Pension Liability
Plan Fiduciary Net Position1
Governmental Accounting Standards Board Statements No. 67 and No. 68 (GASB 67/68)
Changes in Net Pension Liability (NPL) by SourceBalances at June 30, 2016

Appendix EPage 4a
NYC Office of the Actuary October 11, 2016
Components of Pension Expense for the Fiscal Year Ended June 30, 2015 (Revised)1
Component Amount
a. Service Cost 419,575,546$ b. Interest on the Total Pension Liability 1,312,813,977c. Differences between Expected and Actual Experience 67,194,955d. Changes of Assumptions 0e. Employee Contributions (108,582,000)f. Projected Earnings on Pension Plan Investments (799,287,375)g. Differences between Projected and Actual Earnings on Plan Investments (186,763,245)h. Pension Plan Administrative Expenses 0i. Other Changes in Fiduciary Net Position (41,201,000)
Total Pension Expense 663,750,858$
1 Special Accidental Death Benefits pursuant to Section 208-f of the General Municipal Law.
NEW YORK FIRE DEPARTMENT PENSION FUND (FIRE)
Governmental Accounting Standards Board Statements No. 67 and No. 68 (GASB 67/68)

Appendix EPage 4b
NYC Office of the Actuary October 11, 2016
Components of Pension Expense for the Fiscal Year Ended June 30, 2016
Component Amount
a. Service Cost 431,267,723$ b. Interest on the Total Pension Liability 1,395,735,250c. Differences between Expected and Actual Experience 192,624,903d. Changes of Assumptions 157,169,763e. Employee Contributions (116,619,000)f. Projected Earnings on Pension Plan Investments (812,586,946)g. Differences between Projected and Actual Earnings on Plan Investments (64,866,656)h. Pension Plan Administrative Expenses 0i. Other Changes in Fiduciary Net Position (43,673,000)
Total Pension Expense 1,139,052,037$
NEW YORK FIRE DEPARTMENT PENSION FUND (FIRE)
Governmental Accounting Standards Board Statements No. 67 and No. 68 (GASB 67/68)

Appendix EPage 5a
NYC Office of the Actuary October 11, 2016
Governmental Accounting Standards Board Statements No. 67 and No. 68 (GASB 67/68)
For the Fiscal Year ended June 30, 2013, the City recognized Pension Expense for FIRE of $740,318,628.
At June 30, 2013, the City reported total Deferred Outflows of Resources and Deferred Inflows of Resources related to Pensions for FIRE from the following sources:
Deferred DeferredOutflows Inflows
of Resources of Resources
Differences between Expected and Actual Experience 0$ 0$
Changes of Assumptions 0 0
Net difference between Projected and Actual Earnings on Pension Plan Investments 0 341,428,650
Total 0$ 341,428,650$
Amounts reported as Deferred Outflows of Resources and Deferred Inflows of Resources related to Pensions for FIRE will be recognized in Pension Expense as follows:
Fiscal YearEnded June 30 Amount2013 (85,357,162)$ 2014 (85,357,162) 2015 (85,357,162) 2016 (85,357,162) 2017 (85,357,164)
NEW YORK FIRE DEPARTMENT PENSION FUND (FIRE)
Pension Expense, Deferred Outflows of Resources, Deferred Inflows of Resources

Appendix EPage 5b
NYC Office of the Actuary October 11, 2016
For the Fiscal Year ended June 30, 2014, the City recognized Pension Expense for FIRE of $507,507,195.
For June 30, 2014, the City determined Deferred Outflows of Resources and Deferred Inflows of Resources related to Pensions for FIRE from the following sources:
Deferred DeferredOutflows Inflows
of Resources of Resources
Differences between Expected and Actual Experience 0$ 0$
Changes of Assumptions 0 0
Net difference between Projected and Actual Earnings on Pension Plan Investments 0 803,000,636
Total 0$ 803,000,636$
Amounts reported as Deferred Outflows of Resources and Deferred Inflows of Resources related to Pensions for FIRE will be recognized in Pension Expense as follows:
Fiscal YearEnded June 30 Amount2014 (200,750,159)$ 2015 (200,750,159) 2016 (200,750,159) 2017 (200,750,159) 2018 (200,750,159)
NEW YORK FIRE DEPARTMENT PENSION FUND (FIRE)
Governmental Accounting Standards Board Statements No. 67 and No. 68 (GASB 67/68)
Pension Expense, Deferred Outflows of Resources, Deferred Inflows of Resources

Appendix EPage 5c
NYC Office of the Actuary October 11, 2016
For the Fiscal Year ended June 30, 2015, the City recognized Pension Expense for FIRE of $663,750,858.
For June 30, 2015, the City determined Deferred Outflows of Resources and Deferred Inflows of Resources related to Pensions for FIRE from the following sources:
Deferred DeferredOutflows Inflows
of Resources of Resources
Differences between Expected and Actual Experience 104,152,181$ 0$
Changes of Assumptions 0 0
Net difference between Projected and Actual Earnings on Pension Plan Investments 397,376,299 0
Total 501,528,480$ 0$
Amounts reported as Deferred Outflows of Resources and Deferred Inflows of Resources related to Pensions for FIRE will be recognized in Pension Expense as follows:
Fiscal YearEnded June 30 Amount2015 166,539,031$ 2016 166,539,031 2017 136,301,302 2018 99,344,076 2019 99,344,071
NEW YORK FIRE DEPARTMENT PENSION FUND (FIRE)
Governmental Accounting Standards Board Statements No. 67 and No. 68 (GASB 67/68)
Pension Expense, Deferred Outflows of Resources, Deferred Inflows of Resources

Appendix EPage 5d
NYC Office of the Actuary October 11, 2016
For the Fiscal Year ended June 30, 2016, the City recognized Pension Expense for FIRE of $1,139,052,037.
For June 30, 2016, the City determined Deferred Outflows of Resources and Deferred Inflows of Resources related to Pensions for FIRE from the following sources:
Deferred DeferredOutflows Inflows
of Resources of Resources
Differences between Expected and Actual Experience 198,179,319$ 0$
Changes of Assumptions 248,328,225 0
Net difference between Projected and Actual Earnings on Pension Plan Investments 487,586,357 0
Total 934,093,901$ 0$
Amounts reported as Deferred Outflows of Resources and Deferred Inflows of Resources related to Pensions for FIRE will be recognized in Pension Expense as follows:
Fiscal YearEnded June 30 Amount2016 404,496,300$ 2017 404,496,300 2018 285,804,422 2019 121,896,589 2020 121,896,590
NEW YORK FIRE DEPARTMENT PENSION FUND (FIRE)
Governmental Accounting Standards Board Statements No. 67 and No. 68 (GASB 67/68)
Pension Expense, Deferred Outflows of Resources, Deferred Inflows of Resources

Appendix EPage 5e
NYC Office of the Actuary October 11, 2016
Governmental Accounting Standards Board Statements No. 67 and No. 68 (GASB 67/68)
For the Fiscal Year ended June 30, 2016, the City recognized Pension Expense for FIRE of $1,139,052,037.
At June 30, 2016, the City reported total Deferred Outflows of Resources and Deferred Inflows of Resources related to Pensions for FIRE from the following sources:
Deferred DeferredOutflows Inflows
of Resources of Resources
Differences between Expected and Actual Experience 235,136,545$ 0$
Changes of Assumptions 248,328,225 0
Net difference between Projected and Actual Earnings on Pension Plan Investments 785,618,580 486,857,482
Total 1,269,083,350$ 486,857,482$
Amounts reported as Deferred Outflows of Resources and Deferred Inflows of Resources related to Pensions for FIRE will be recognized in Pension Expense as follows:
Fiscal YearEnded June 30 Amount2016 284,928,010$ 2017 254,690,279 2018 184,398,339 2019 221,240,660 2020 121,896,590
NEW YORK FIRE DEPARTMENT PENSION FUND (FIRE)
Pension Expense, Deferred Outflows of Resources, Deferred Inflows of Resources

Appendix EPage 6
NYC Office of the Actuary October 11, 2016
Schedule of Employer Contributions ($ in thousands)
Fiscal Year Ended June 30 2016 2015 2014 2013 2012 2011 2010 2009 2008 2007
1. Actuarially Determined Contribution 1,054,478$ 988,784$ 969,956$ 962,173$ 976,895$ 890,706$ 874,331$ 843,751$ 780,202$ 683,193$
2. Contributions in relation to the Actuarially Determined Contribution 1,054,478$ 988,784$ 969,956$ 962,173$ 976,895$ 890,706$ 874,331$ 843,751$ 780,202$ 683,193$
3. Contribution Deficiency (Excess) 0 0 0 0 0 0 0 0 0 0
4. Contributions as a percentage of Covered Employee Payroll* 93.360% 88.940% 87.986% 85.154% 84.990% 84.248% 82.491% 83.238% 82.608% 74.537%
*
NEW YORK FIRE DEPARTMENT PENSION FUND (FIRE)
The Employer Rate of Contribution equals the Statutory Contribution as a percentage of the salaries of members who were on payroll or projected to be on payroll (under One-Year Lag Methodology) as of the preceding June 30 increased to reflect overtime earnings and adjusted, where applicable, to be consistent with collective bargaining agreements estimated to be achieved.
Governmental Accounting Standards Board Statements No. 67 and No. 68 (GASB 67/68)

Appendix EPage 7a
NYC Office of the Actuary October 11, 2016
Statement of Fiduciary Net PositionJune 30, 2016 and June 30, 2015
(Dollar amounts in thousands)
June 30, 2016 June 30, 2015ASSETS
Cash 37,457$ 8,375$
Receivables:Investment securities sold 153,595 178,385Member loans 26,917 29,124Transferrable Earnings due from QPP to VSFs 0 0Accrued interest and dividends 20,518 18,568
Total receivables 201,030$ 226,077$
Investments - at fair valueShort-term investments:
Short-term investment fund 118,935 211,956Commercial paper 52,525 483,139
Debt securities: 2,237,923 2,463,809Equity Securities: 1,802,947 1,943,618Alternative Investments: 2,117,856 1,887,226Collective Trust Funds:
International - equity 1,966,228 2,022,335Fixed investment 401,512 394,772Domestic - equity 1,736,914 1,516,030Mortgage - debt security 86,107 72,185TIPS 547,146 300,374
Promissory Notes 0 0Collateral from securities lending 854,211 795,944
Total Investments 11,922,304$ 12,091,388$
Other assets 6,176 5,596
Total assets 12,166,967$ 12,331,436$
LIABILITIESAccounts payable 89,435 74,788Payables for investment securities purchased 215,792 574,447Accrued benefits payable 18,893 18,927Securities lending 854,211 795,944Transferrable Earnings due from QPP to VSFs 88,873 52,000
Total liabilities 1,267,204$ 1,516,106$
Plan Net Position Held in Trust for Benefits 10,899,763$ 10,815,330$
NEW YORK FIRE DEPARTMENT PENSION FUND (FIRE)
Governmental Accounting Standards Board Statements No. 67 and No. 68 (GASB 67/68)

Appendix EPage 7b
NYC Office of the Actuary October 11, 2016
Statement of Fiduciary Net PositionJune 30, 2016 and June 30, 2015
(Dollar amounts in thousands)
June 30, 2016 June 30, 2015ASSETS
Cash 10,740$ 11,750$
Receivables:Accrued interest and dividends 985 743Transferrable Earnings Due from QPP 59,739 41,000Investment securities sold 12,433 6,383
Total receivables 73,157$ 48,126$
Investments - at fair valueShort-term investments:
Short-term investment fund 4,397 6,259Commercial paper 6,953 3,602Discount Notes 1,369 10,989
Debt securities:U.S. Government 93,304 0U.S. Treasury Notes 0 88,272Corporate 0 0Foreign 0 0
Equities:Domestic 0 0Private equity 0 0Private equity real estate 0 0Equity securities 0 0
Mutual Funds:International - equity 85,780 77,890Fixed investment 26,885 26,385Domestic - equity 221,610 273,828Mortgage - debt security 0 0TIPS 10,394 9,946
Promissory Notes 0 0Collateral from securities lending 37,719 22,251
Total Investments 488,411$ 519,422$
Other assets 0 0
Total assets 572,308$ 579,298$
LIABILITIESAccounts payable 0 32Payables for investment securities purchased 10,514 9,941Accrued benefits payable 21,225 21,630Securities lending 37,719 22,251
Total liabilities 69,458$ 53,854$
Plan Net Position Held in Trust for Benefits 502,850$ 525,444$
NEW YORK CITY FIRE DEPARTMENTFIREFIGHTERS' VARIABLE SUPPLEMENTS FUND (FFVSF)
Governmental Accounting Standards Board Statements No. 67 and No. 68 (GASB 67/68)

Appendix EPage 7c
NYC Office of the Actuary October 11, 2016
Statement of Fiduciary Net PositionJune 30, 2016 and June 30, 2015
(Dollar amounts in thousands)
June 30, 2016 June 30, 2015ASSETS
Cash 558$ 643$
Receivables:Accrued interest and dividends 671 458Investment securities sold 11,636 3,867Transferrable Earnings due from QPP to VSFs 29,134 11,000
Total receivables 41,441$ 15,325$
Investments - at fair valueShort-term investments:
Short-term investment fund 1,726 1,572Commercial paper 3,603 3,151Discount Notes 585 3,184
Debt securities: 0 0U.S. Government 56,637 0U.S. treasury notes 0 53,983Corporate 0 0Foreign 0 0
Equities:Domestic 0 0Private equity 0 0Private equity real estate 0 0Equity securities 0 0
Mutual Funds:International - equity 52,725 61,322Fixed investment 17,541 17,215Domestic - equity 144,583 161,871Mortgage - debt security 0 0TIPS 6,593 6,309
Promissory Notes 0 0Collateral from securities lending 30,551 18,130
Total Investments 314,544$ 326,737$
Due from QPP 0 15Due from FFVSF 0 32
Other assets 0 0
Total assets 356,543$ 342,752$
LIABILITIESAccounts payable 2,712 56Payables for investment securities purchased 9,008 7,639Accrued benefits payable 9,263 9,522Securities lending 30,551 18,130
Total liabilities 51,534$ 35,347$
Plan Net Position Held in Trust for Benefits 305,009$ 307,405$
NEW YORK CITY FIRE DEPARTMENTFIRE OFFICERS' VARIABLE SUPPLEMENTS FUND (FOVSF)
Governmental Accounting Standards Board Statements No. 67 and No. 68 (GASB 67/68)

Appendix EPage 8a
NYC Office of the Actuary October 11, 2016
Statement of Changes in Fiduciary Net PositionJune 30, 2016 and June 30, 2015
(Dollar amounts in thousands)
June 30, 2016 June 30, 2015ADDITIONS
Contributions:Member Contributions 116,619$ 108,582$ Employer Contributions 1,054,478 988,784
Total contributions 1,171,097$ 1,097,366$
Investment income:Interest income 137,160 115,571Dividend income 145,276 227,390Net appreciation (depreciation) in fair value (44,510) (8,490)
Total investment income 237,926$ 334,471$
Less:Investment expenses 46,321 68,027
Net income 191,605 266,444
Securities lending transactions:Securities lending income 6,196 5,332Securities lending fees (403) (346)
Net securities lending income 5,793$ 4,986$
Net investment income 197,398 271,430Other:
Net receipts from other retirement systems 42,786 40,737Litigation income 887 464
Total additions 1,412,168 1,409,997
DEDUCTIONSBenefit payments and withdrawals 1,290,862 1,150,505Transferrable Earnings due from QPP to VSFs 36,873 40,000
Total deductions 1,327,735 1,190,505
INCREASE IN PLAN NET POSITION 84,433 219,492
PLAN NET POSITION HELD IN TRUST FOR BENEFITS:Beginning of year 10,815,330$ 10,595,838$
End of year 10,899,763$ 10,815,330$
NEW YORK FIRE DEPARTMENT PENSION FUND (FIRE)
Governmental Accounting Standards Board Statements No. 67 and No. 68 (GASB 67/68)

Appendix EPage 8b
NYC Office of the Actuary October 11, 2016
Statement of Changes in Fiduciary Net PositionJune 30, 2016 and June 30, 2015
(Dollar amounts in thousands)
June 30, 2016 June 30, 2015ADDITIONS
Contributions:Member Contributions 0$ 0$ Employer Contributions 0 0
Total contributions 0$ 0$
Investment income:Interest income 4,796 4,297Dividend income 7,957 7,138Net appreciation (depreciation) in fair value (8,428) 7,226
Total investment income 4,325$ 18,661$
Less:Investment expenses 0 0
Net income 4,325 18,661
Securities lending transactions:Securities lending income 368 243Securities lending fees (24) (16)
Net securities lending income 344$ 227$
Net investment income 4,669 18,888Other:
Net receipts from other retirement systems 0 0Litigation income 0 0
Transferrable Earnings due from QPP to FFVSF 18,739 30,000
Total additions 23,408 48,888
DEDUCTIONSBenefit payments and withdrawals 46,002 47,415
Total deductions 46,002 47,415
INCREASE IN PLAN NET POSITION (22,594) 1,473
PLAN NET POSITION HELD IN TRUST FOR BENEFITS:Beginning of year 525,444$ 523,971$
End of year 502,850$ 525,444$
NEW YORK CITY FIRE DEPARTMENTFIREFIGHTERS' VARIABLE SUPPLEMENTS FUND (FFVSF)
Governmental Accounting Standards Board Statements No. 67 and No. 68 (GASB 67/68)
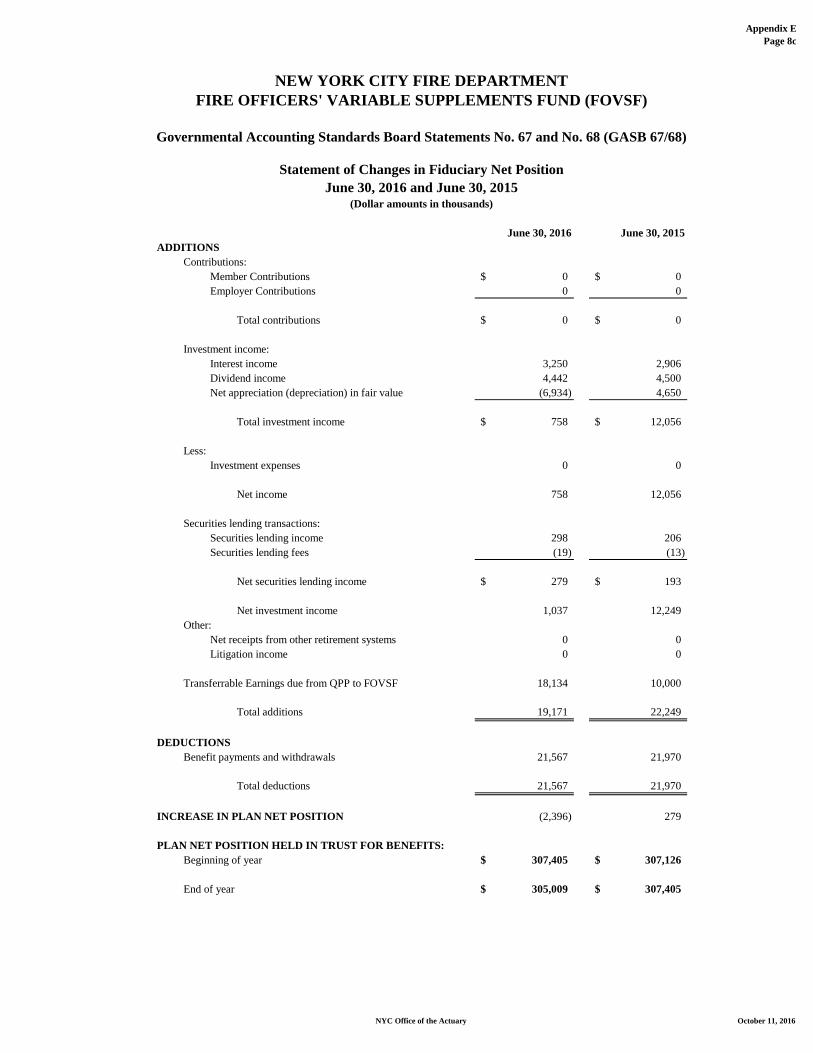
Appendix EPage 8c
NYC Office of the Actuary October 11, 2016
Statement of Changes in Fiduciary Net PositionJune 30, 2016 and June 30, 2015
(Dollar amounts in thousands)
June 30, 2016 June 30, 2015ADDITIONS
Contributions:Member Contributions 0$ 0$ Employer Contributions 0 0
Total contributions 0$ 0$
Investment income:Interest income 3,250 2,906Dividend income 4,442 4,500Net appreciation (depreciation) in fair value (6,934) 4,650
Total investment income 758$ 12,056$
Less:Investment expenses 0 0
Net income 758 12,056
Securities lending transactions:Securities lending income 298 206Securities lending fees (19) (13)
Net securities lending income 279$ 193$
Net investment income 1,037 12,249Other:
Net receipts from other retirement systems 0 0Litigation income 0 0
Transferrable Earnings due from QPP to FOVSF 18,134 10,000
Total additions 19,171 22,249
DEDUCTIONSBenefit payments and withdrawals 21,567 21,970
Total deductions 21,567 21,970
INCREASE IN PLAN NET POSITION (2,396) 279
PLAN NET POSITION HELD IN TRUST FOR BENEFITS:Beginning of year 307,405$ 307,126$
End of year 305,009$ 307,405$
NEW YORK CITY FIRE DEPARTMENTFIRE OFFICERS' VARIABLE SUPPLEMENTS FUND (FOVSF)
Governmental Accounting Standards Board Statements No. 67 and No. 68 (GASB 67/68)

Appendix EPage 9
NYC Office of the Actuary October 11, 2016
Long-Term Expected Rate of Return
Long-TermTarget Expected Asset Real Rate
Asset Class Allocation of Return
U.S. Public Market Equities 32.00% 6.60%
International Public Market Equities 10.00% 7.00%
Emerging Public Market Equities 6.50% 7.90%
Private Market Equities 7.00% 9.90%
Fixed Income (Core, TIPS, HY, Opportunistic, Convertibles) 34.50% 2.70%
Alternatives (Real Assets, Hedge Funds) 10.00% 4.00%
Total 100.00%
Governmental Accounting Standards Board Statements No. 67 and No. 68 (GASB 67/68)
NEW YORK FIRE DEPARTMENT PENSION FUND (FIRE)
The Long-Term Expected Rate of Return (LTEROR) assumption on pension fund investments was determined using aBuilding-Block Method in which best-estimate ranges of Expected Real Rates of Return (i.e., Expected Returns, net ofpension fund investment expenses and inflation) are developed for each major asset class. These ranges are combined toproduce the LTEROR by weighting the Expected Real Rates of Return (RROR) by the Target Asset Allocation percentageand by adding Expected Inflation. The Target Asset Allocation and best estimates of Arithmetic Real Rates of Return foreach major asset class are summarized in the following table:
The Discount Rate used to measure the Total Pension Liability was 7.0% per annum. The projection of Cash Flows used todetermine the Discount Rate assumes that employee contributions will be made at the rates applicable to the current Tier foreach member and that employer contributions will be made at rates as determined by the Actuary. Based on thoseassumptions, the pension fund's Fiduciary Net Position is projected to be available to make all projected future benefitpayments of current active and non-active members. Therefore, the Long-Term Expected Rate of Return on pension fundinvestments was applied to all periods of projected benefit payments to determine the Total Pension Liability.

Appendix EPage 10a
NYC Office of the Actuary October 11, 2016
NEW YORK FIRE DEPARTMENT PENSION FUND (FIRE)
Increase (Decrease) in Pension Expense Arising from the Recognition of Differencesbetween Projected and Actual Earnings on Pension Plan Investments
Differencesbetween Projected
and ActualEarnings on RecognitionPension Plan Period
Year Investments (Years) 2013 2014 2015 2016 2017 2018 2019 20202013 (426,785,812)$ 5 (85,357,162)$ (85,357,162)$ (85,357,162)$ (85,357,162)$ (85,357,164)$ 2014 (1,003,750,795) 5 (200,750,159)$ (200,750,159)$ (200,750,159)$ (200,750,159)$ (200,750,159)$ 2015 496,720,375 5 99,344,076$ 99,344,076$ 99,344,076$ 99,344,076$ 99,344,071$ 2016 609,482,946 5 121,896,589$ 121,896,589$ 121,896,589$ 121,896,589$ 121,896,590$ 2017201820192020
Net increase (decrease) in Pension Expense (85,357,162)$ (286,107,321)$ (186,763,245)$ (64,866,656)$ (64,866,658)$ 20,490,506$ 221,240,660$ 121,896,590$
Governmental Accounting Standards Board Statements No. 67 and No. 68 (GASB 67/68)

Appendix EPage 10b
NYC Office of the Actuary October 11, 2016
Differencesbetween Expected Recognition
and Actual PeriodYear Experience (Years) 2015 2016 2017 2018 2019 20202015 171,347,136$ 2.55 67,194,955$ 67,194,955$ 36,957,226$ 2016 323,609,267 2.58 125,429,948$ 125,429,948$ 72,749,371$ 2017201820192020
Net increase (decrease) in Pension Expense 67,194,955$ 192,624,903$ 162,387,174$ 72,749,371$ 0$ 0$
NEW YORK FIRE DEPARTMENT PENSION FUND (FIRE)
Governmental Accounting Standards Board Statements No. 67 and No. 68 (GASB 67/68)
Increase (Decrease) in Pension Expense Arising from the Recognition of Differencesbetween Expected and Actual Experience

Appendix EPage 10c
NYC Office of the Actuary October 11, 2016
NEW YORK FIRE DEPARTMENT PENSION FUND (FIRE)
Increase (Decrease) in Pension Expense Arising from the Recognition ofChanges in Assumptions
Increase/(Decrease) Recognitiondue to Changes Period
Year in Assumptions (Years) 2016 2017 2018 2019 20202016 405,497,988$ 2.58 157,169,763$ 157,169,763$ 91,158,462$ 2017201820192020
Net increase (decrease) in Pension Expense 157,169,763$ 157,169,763$ 91,158,462$ 0$ 0$
Governmental Accounting Standards Board Statements No. 67 and No. 68 (GASB 67/68)

Appendix EPage 11
NYC Office of the Actuary October 11, 2016
2016 2015 (Revised)1. Total Pension Liability
a. Service Cost 431,267,723$ 419,575,546$ b. Interest 1,395,735,250 1,312,813,977c. Differences b/t Expected and Actual Experience 323,609,267 171,347,136d. Change of Assumptions 405,497,988 0e. Benefit Payments (1,359,095,000) (1,220,441,000)f. Net Changes 1,197,015,228$ 683,295,659$
2. Total Pension Liability - Beginning 19,446,792,300$ 18,763,496,641$ 3. Total Pension Liability - Ending 20,643,807,528$ 19,446,792,300$
4. Plan Fiduciary Net Positiona. Contributions - Employer 1,054,478,000$ 988,784,000$ b. Contributions - Employee 116,619,000 108,582,000c. Net Investment Income 203,104,000 302,567,000d. Benefit Payments (1,359,095,000) (1,220,441,000)e. Administrative Expenses 0 0f. Other Changes 43,673,000 41,201,000g. Net Changes 58,779,000$ 220,693,000$
5. Plan Fiduciary Net Position - Beginning 11,679,331,000$ 11,458,638,000$ 6. Plan Fiduciary Net Position - Ending 11,738,110,000$ 11,679,331,000$
7. FIRE Net Pension Liability 8,905,697,528$ 7,767,461,300$
8. Plan Fiduciary Net Position as a Percentageof Total Pension Liability 56.9% 60.1%
9. Covered Employee Payroll 1 1,129,469,957$ 1,111,744,091$
10. FIRE Net Pension Liability as a Percentageof Covered Employee Payroll 788.5% 698.7%
1 Projected Employee Payroll at Time 1.0 under One-Year Lag Methodology.
NEW YORK FIRE DEPARTMENT PENSION FUND (FIRE)
Governmental Accounting Standards Board Statements No. 67 and No. 68 (GASB 67/68)
Schedule of Changes in Net Pension Liability and Related Ratios

Appendix EPage 12
NYC Office of the Actuary October 11, 2016
Average Expected Average ExpectedPV of Future WorkLife Remaining Service Life Remaining Service Life
Group # Count @ 6/30/2014 @ 6/30/2014 @ 6/30/2015Active 10,319 75,755 7.34 6.78 Active/Inactive 16 0 0 0 Terminated Vested 40 0 0 0 Retired 16,763 0 0 0 Total 27,138 75,755 2.79 2.58
NEW YORK FIRE DEPARTMENT PENSION FUND (FIRE)
Governmental Accounting Standards Board Statements No. 67 and No. 68 (GASB 67/68)
Average Expected Remaining Service Lives