office of industries publication 3206 - usitc ... the industry trade and technology review (ittr )...
TRANSCRIPT

JUNE 1999
OFFICE OF INDUSTRIESPUBLICATION 3206
PREFACEThe Industry Trade and Technology Review (ITTR) is a quarterly staff publication of theOffice of Industries, U.S. International Trade Commission. The opinions and conclusions itcontains are those of the authors and are not the views of the Commission or of any individualCommissioner. The report is intended to provide analysis of important issues and insights intothe global position of U.S. industries, the technological competitiveness of the United States,and implications of trade and policy developments.
The information and analysis in this series are for the purpose of this report only. Nothingin this report should be construed to indicate how the Commission would find in aninvestigation conducted under any statutory authority.
Inquiries or comments on items appearing in this report may be made directly to the author,or to:
Director of IndustriesIndustry Trade and Technology ReviewU. S. International Trade Commission
500 E Street, SWWashington, DC 20436
Fax: 202-205-3161
Requests for copies of the ITTR, or to be added to the mailing list, should be address to theOffice of the Secretary, U.S. International Trade Commission, 500 E Street SW, Washington,DC 20436, or by fax: 202-205-2104
Quarterly Review Staff
Larry Brookhart
assisted by
Zema TuckerSharon Greenfield
Contributing Authors
Chris MellyJennifer M. Baumert
Dennis R. Luther
Robert A. RogowskyDirector of Operations
Vern SimpsonDirector of Industries

OMB No.: 3117–0188
ITC READER SATISFACTION SURVEYThe Industry, Trade, and Technology Review (ITTR)
��������� � ���� ������������������������ ��������� ���� ������$�!��"��!� ��$������� ���-*��&�����%!&-,�+��,'� �$(�-+��++�++�, ��.�$-���&��)-�$!,1�'��'-*�*�('*,+���&��,'��++!+,�-+�!&!%(*'.!&���-,-*��(*'�-�,+���$��+���� !����!�"�$��$���#�����%���%���������$������,'�, ���� �
�'-*�&�%���&��,!,$���($��+��(*!&,�*� � � ����������������������
�$��+��+(��!�1�!&�'*%�,!'&�!&�, !+�*�('*,�%'+,�-+��-$�,'�1'-�1'-*�'*��&!2�,!'&����
��+��&1�!&�'*%�,!'&�%!++!&��, �,�1'-��'&+!��*�!%('*,�&,��� ��+��+(��!�1���$'/� �'
���1�+��($��+��!��&,!�1�%!++!&��!&�'*%�,!'&��&��/ 1�!,�/'-$�����!%('*,�&,�'*� �$(�-$�,'�1'-�
�$��+���++�++�, ��������'��, !+��� �*�('*,���&+/�*���$'/��1��!*�$!&���$$�, �,��(($1����3�,*'&�$1��*����3��*����3�'��(!&!'&��',��(($!���$���3�!+��*�����3�,*'&�$1��!+��*��
� ��('*,�(*�+�&,+�&�/����,+��!&�'*%�,!'&���&��'*���,� �� � � � ��� �,�����&�$1+!+����+�.�$-��,'����,+��!&�'*%�,!'&���&��'*���,� �� � � � ��� �&�$1+!+�!+�-&!)-��'*��*'-&���*��#!&� �� � � � ��� �,�,!+,!��$���,���*��-+��-$�,'�%��%1�'*��&!2�,!'& �� � � � ��� �-�"��,�%�,,�*��&���&�$1+!+��*��,!%�$1 �� � � � ��� �� �!+�, ��'&$1�'*�, ��(*���**���+'-*���'��, !+�!&�'*%�,!'& �� � � � ��
���&',��($��+��!��&,!�1��*'%�/ �,�', �*�+'-*���, ��!&�'*%�,!'&�!+��.�!$��$�
�$��+���.�$-�,��, ����������'��, !+�*�('*,���&+/�*���$'/��1��!*�$!&���$$�, �,��(($1����3�,*'&�$1��*�����3��*����3�'��(!&!'&��',��(($!���$���3�!+��*�����3�,*'&�$1��!+��*��
� �*!,,�&�!&��$��*��&��-&��*+,�&���$��%�&&�* �� � � � ��� ��('*,��!&�!&�+�'*��0��-,!.��+-%%�*1����*�++�#�1�!++-�+ �� � � � ��� �!�-*�+��� �*,+���*�( +��*�� �$(�-$�,'�-&��*+,�&�!&��!++-��� �� � � � ��� �&�$1+!+�, *'-� '-,�*�('*,��&+/�*+�#�1�)-�+,!'&+������ �� � � � ��� ��('*,�*���*�&��+�.�*!�,1�'��(*!%�*1��&��+��'&��*1�+'-*��+ �� � � � ��� �'-*��+��*���-$$1��'�-%�&,���!&�,�0,�'*��'',&',�+ �� � � � ��
�$��+��(*'.!����-*, �*��'%%�&,�'&��&1�'��, ����'.��(�*�'*%�&���%��+-*�+���+��((*'(*!�,��
�-���+,!'&+��'*�!%(*'.!&��, !+�*�('*,��&��'*��-,-*��*�('*,+�
�, �*�,'(!�+�!++-�+�'��!&,�*�+,�'*��'&��*&�
�$��+��(*'.!���1'-*��&,�*&�,����*�++��&��-(��,��1'-*�%�!$!&�����*�++���$'/��!���(($!���$��
UNITED STATESINTERNATIONAL TRADE COMMISSION
WASHINGTON, DC 20436
OFFICIAL BUSINESSPENALTY FOR PRIVATE, USE $300
����
NO POSTAGENECESSARY
IF MAILEDIN THE
UNITED STATES
BUSINESS REPLY MAILFIRST CLASS PERMIT NO. 12840 WASHINGTON, DC
POSTAGE WILL BE PAID BY ADDRESSEE
U.S INTERNATIONAL TRADE COMMISSION500 E STREET, SW.WASHINGTON, DC 20277–2840
ATTN:OFFICE OF INDUSTRIESIndustry Trade and Technology Review
JUNE 1999Industry, Trade, and Technology Review Cumulative Article Listing
i
Listing of Published Articles(July 1996 - June 1999)
July 1996Computer services: Examination of commitments scheduled under the General
Agreement on Trade in ServicesThe global positioning system advances toward universal acceptanceReformulated gasoline program achieves smooth transition
October 1996World textile and apparel trade: A new eraWorld shipbuilding and the status of the OECD Agreement to eliminate subsidiesThin-slab casting/flat-rolling: New technology to benefit U.S. steel industry
January 1997Basic telecommunication service negotiations in the World Trade
Organization: Impetus, offers, and prospectsU.S. film industry: How mergers and acquisitions are reshaping distribution
patterns worldwideGlobal competitiveness and organized labor: The case of Caterpillar Inc. and
the United Auto Workers UnionEvolution of the U.S.-Japanese semiconductor trade regime
April 1997Liberalization of the Mexican telecommunication sectorUse of magnesium castings in automobiles rises, but challenges remainU.S. trade in intangible intellectual property: Royalties and licensing fees
July 1997Mobile satellite servicesIndia’s steel industry emerging as a competitive global playerTextiles and apparel: India’s integration into the world economy and
opportunities for U.S. firms
October 1997The Uruguay Round elimination of duties on pharmaceuticals: Developments
in the 2 years since implementationAlternative materials in the U.S. automotive industry promote development of
joining and bonding technologyElectronic trade transforms delivery of audiovisual services

JUNE 1999Cumulative Article Listing Industry, Trade, and Technology Review
ii
Listing of Published Articles—Continued
January 1998Free trade in information technology goods Factors affecting the commercialization of new manufacturing processes
for materialsThermoplastic elastomers in the auto industry: Increasing use and the potential
implications
March 1998Textiles and apparel: New U.S. trade program likely to spur imports from
Israel and JordanThe assembly industry in Hungary: Favorable business climate creates new
opportunities for U.S. industriesIndian market reforms attract U.S. investment and trade in capital goods
and equipment
June 1998China's evolving automotive industry and marketCanadian involvement in Mexico's Maquiladora industry
September 1998Internet advertisingProgress in recognizing and regulating global professional service providersDeregulation fosters globalization of the electric power industry
December 1998Impediments to competitiveness in Russia’s minerals and metals sectorNonstore retailing: Alternative retailers attracting customersApparel sourcing strategies for competing in the U.S. market
March 1999Korea’s foreign exchange crisis and its implications for U.S.-Korean tradeAdvanced structural ceramics: Vast potential has yet to be realized
June 1999Energy services: Recent trends and future prospectsMarket trends affecting the U.S. environmental services sectorHealth care services: Strong fundamentals and innovations foreshadow growth in
U.S. exports and foreign direct investment
JUNE 1999Industry, Trade, and Technology Review Contents
iii
CONTENTSPage
Energy services: Recent trends and future prospects . . . . 1
Affiliate transactions . . . . . . . . . . . . . . . . . . . . . . . . . . . . . . . . . . . . . . . . . . . . . . . . . . . . 2U.S. competitive position in the global energy services market . . . . . . . . . . . . . . . . . . . . . 5Outlook . . . . . . . . . . . . . . . . . . . . . . . . . . . . . . . . . . . . . . . . . . . . . . . . . . . . . . . . . . . . . . 6
Market trends affecting the U.S. environmental servicessector . . . . . . . . . . . . . . . . . . . . . . . . . . . . . . . . . . . . . . . . . . . . . . . . . . . . . . . . . . . . . . . . . 9
U.S. trade in environmental services . . . . . . . . . . . . . . . . . . . . . . . . . . . . . . . . . . . . . . . . 10The U.S. environmental services sector . . . . . . . . . . . . . . . . . . . . . . . . . . . . . . . . . . . . . . 12The global environmental services market . . . . . . . . . . . . . . . . . . . . . . . . . . . . . . . . . . . . 13Trade barriers . . . . . . . . . . . . . . . . . . . . . . . . . . . . . . . . . . . . . . . . . . . . . . . . . . . . . . . . . 15Future prospects . . . . . . . . . . . . . . . . . . . . . . . . . . . . . . . . . . . . . . . . . . . . . . . . . . . . . . . . 16
Health care services: Strong fundamentals and innovationsforeshadow growth in U.S. exports and foreign directinvestment . . . . . . . . . . . . . . . . . . . . . . . . . . . . . . . . . . . . . . . . . . . . . . . . . . . . . . . . . . . . 19
Recent trends . . . . . . . . . . . . . . . . . . . . . . . . . . . . . . . . . . . . . . . . . . . . . . . . . . . . . . . . . 20Cross-border trade . . . . . . . . . . . . . . . . . . . . . . . . . . . . . . . . . . . . . . . . . . . . . . . . . . 20Affiliate transactions . . . . . . . . . . . . . . . . . . . . . . . . . . . . . . . . . . . . . . . . . . . . . . . . . 20
Market outlook . . . . . . . . . . . . . . . . . . . . . . . . . . . . . . . . . . . . . . . . . . . . . . . . . . . . . . . . 22

JUNE 1999Contents Industry, Trade, and Technology Review
iv
CONTENTS—ContinuedPage
Appendix A: Key performance indicators of selectedindustries . . . . . . . . . . . . . . . . . . . . . . . . . . . . . . . . . . . . . . . . . . . . . . . . . . . . . . . . . . . . . . . . . . A-1
Steel:Figure A-1 Steel industry: Profitability by strategic group . . . . . . . . . . . . . . . . . . . A-2Table A-1 Steel mill products, all grades . . . . . . . . . . . . . . . . . . . . . . . . . . . . . . . . A-2Table A-2 Steel service centers . . . . . . . . . . . . . . . . . . . . . . . . . . . . . . . . . . . . . . . A-3Figure A-2 Steel mill products, all grades: Selected industry conditions . . . . . . . . . A-3
Automobiles:Table A-3 U.S. sales of new automobiles, domestic and imported,
and share of U.S. market accounted for by sales of total importsand Japanese imports, by specified periods, January 1998-March 1999 . . . . . . . . . A-4
Figure A-3 U.S. sales of new passenger automobiles, by quarter . . . . . . . . . . . . . . . A-4
Aluminum:Figure A-4 Aluminum: U.S. imports, exports, and price . . . . . . . . . . . . . . . . . . . . . A-5Table A-4 U.S. production, secondary recovery, imports, import penetration,
exports, average nominal price, and inventory level of aluminum, byspecified periods, for first quarter 1998, fourth quarter1998, and firstquarter 1999 . . . . . . . . . . . . . . . . . . . . . . . . . . . . . . . . . . . . . . . . . . . . . . . . . . . . . A-5
Flat glass:Figure A-5 Average monthly Japanese imports of flat glass, by quantity and value,
from the United States and all countries, 1995-99 . . . . . . . . . . . . . . . . . . . . . . . . . A-6
Services:Figure A-6 Balance on U.S. service trade accounts, by quarter, 1998 . . . . . . . . . . . A-7Figure A-7 Surpluses on cross-border U.S. service transactions
with selected trading partners, by selected quarters, 1997-98 . . . . . . . . . . . . . . . . . A-7
#

JUNE 1999Industry, Trade, and Technology Review Energy Services
1 The views expressed in this article are those of the author. They are not the views of theInternational Trade Commission or any of the Commissioners. 2 Electric power transmission involves the movement of large amounts of electricity acrosssignificant distances through high-voltage grids, whereas electric power distribution involves thedelivery of lower voltage electricity to the ultimate consumer. 3 Although electricity itself is traded across borders, it is classified as a commodity andtherefore recorded in the merchandise trade account.
1
Energy Services: Recent Trends and FutureProspectsChris Melly1
[email protected](202) 205-3461
The two major components of the energy services sector--petroleum-relatedservices and utility-related services--have been undergoing dramaticallydifferent market trends in recent years. While demand for petroleum-related services has declined as a result of the Asian crisis and reduced oilprices, opportunities in the utilities-related services sector have beengrowing rapidly due to increased demand for electricity and the sale ofseveral state-owned electricity providers in developed countries. U.S. firmsare well-positioned to compete internationally in both of these markets.This article discusses the extent of U.S. trade in energy services, evaluatesthe competitive position of U.S. firms in the global energy services sector,and assesses the future prospects for U.S. trade and investment in thissector.
Energy services consist of a wide variety of activities involved with energy exploration,production, and delivery. These services may be broadly divided into two categories:petroleum-related services and utility-related services. Petroleum-related services principallyinclude oil field services, pipeline transportation and storage services, tanker services, andservices provided by petroleum wholesalers and retailers. Utility-related services comprisesales of services by firms engaged in the distribution of natural gas and the generation,transmission, and/or distribution of electrical energy.2 Energy services may include designand engineering; transportation; storage; trading, marketing, and brokerage; commodity andprice risk management; demand-side and other customer services; as well as wastemanagement and disposal services.3
As with most industries, energy services may be sold to foreign customers either throughcross-border channels or through foreign-based affiliates. Energy services most likely to betraded on a cross-border basis include transportation; design and engineering; and some of thefinancially oriented activities such as energy trading, marketing, brokerage, and riskmanagement. Services provided through foreign affiliates tend to be those that require a direct
JUNE 1999Energy Services Industry, Trade, and Technology Review
4 This means that sales of different kinds of services by a single affiliate can not bedistinguished. For example, sales of telecommunication services by a subsidiary of a U.S. electricpower company can not be distinguished from sales of electricity distribution services -- they bothwill be classified as services provided by electric power affiliates. 5 Sanitary services can not be separated from electric and gas services, which results in someoverstatement of energy service transactions. However, as noted previously, energy servicesprovided by construction, engineering, or consulting firms are not captured in the data, whichresults in some understatement of energy service transactions. 6 In 1995, foreign affiliates of U.S. energy service firms held assets measuring $123 billion,which were nearly three times larger than the $43 billion in assets held by U.S. affiliates offoreign energy firms. U.S. Department of Commerce (USDOC), Bureau of Economic Analysis(BEA), Foreign Direct Investment in the United States, preliminary 1995 estimates, June 1997,table A-1; and U.S. Direct Investment Abroad, preliminary 1995 estimates, Oct. 1997,Table II.A 1.
2
presence in foreign markets, such as oil field services, gas pipeline transportation, or electricpower generation, transmission, and distribution services. Official data on cross-borderenergy services transactions are unavailable principally because they are not captured by anindividual service category. Instead, cross-border transactions in energy services are reflectedin other data on engineering, financial, transportation, consulting, or other services. Withrespect to affiliate transactions, some official data are reported on sales of services by utilitiesand petroleum-related firms. However, as with cross-border transactions, the affiliate datado not capture energy-related sales of services by engineering, construction, or transportationcompanies, because such transactions cannot be distinguished from non-energy sales. Dueto these data limitations, the following data discussion addresses only affiliate transactions byfirms engaged directly in petroleum-related and utility businesses.
Affiliate Transactions
International services transactions by affiliates are reported based upon the industryclassification of the foreign affiliate rather than the type of service sold.4 With respect toenergy services, data are reported under two industry categories: petroleum services andpublic utilities. Petroleum services comprise sales of services by affiliates associated withpetroleum production, transportation, and distribution. Data on public utilities include salesof services by affiliates established as electric, gas, and sanitation service providers.5
In 1996, foreign affiliates of U.S. energy service firms recorded sales of $20.1 billion toforeign customers, reflecting a 39-percent increase from sales of $14.5 billion in 1995 (figure1). Such sales were almost evenly proportioned between petroleum-related services and utilityservices, at 48 percent and 52 percent, respectively. Sales were nearly three times thecorresponding purchases of energy services by U.S. customers through U.S. affiliates offoreign firms, which were $7.7 billion in 1996. U.S. purchases of energy services also werefairly evenly divided between petroleum-related services and services provided by utilities, at44 percent and 56 percent, respectively. The $12.4-billion difference between U.S. sales andpurchases of energy services through affiliates reflects U.S. firms’ more pronounced presenceabroad.6

JUNE 1999Industry, Trade, and Technology Review Energy Services
7 USITC, “Deregulation fosters globalization of the electric power industry,” Industry, Trade,and Technology Review, USITC publication No. 3134, Sept. 1998, pp. 49-55.
3
1992 1993 1994 1995 19960
5
10
15
20
25Sales Purchases Balance
Billion dollars
Source: U.S. Department of Commerce (USDOC), Bureau of Economic Analysis (BEA), Survey of Current Business,Sept. 1994, pp. 135-136; Sept. 1995, pp. 104-105; Nov. 1996, pp. 111-112; Oct. 1994, pp. 137-138; Oct. 1998,pp. 115-116; and USDOC, BEA, U.S. Direct Investment Abroad, 1994 Benchmark Survey, Final Results, table III.F20.
Figure 1Energy service transactions by majority-owned affiliates: U.S. sales,purchases, and balance, 1992-96
As noted, sales of energy services by foreign affiliates of U.S. firms grew by 39 percent in1996, considerably faster than the 9-percent average annual growth rate recorded during1992-95. This growth was principally driven by an 84-percent increase in sales of servicesby utilities, which in turn reflected a number of major acquisitions in the United Kingdom andAustralia by U.S. electric power companies.7 By contrast, purchases of energy services fromU.S.-based affiliates of foreign firms in 1996 grew by 10 percent, slightly slower than the 14-percent average annual growth rate during 1992-95.
On a regional basis, European-based affiliates of U.S. firms accounted for 46 percent of U.S.sales of energy services through foreign affiliates in 1996 (figure 2). Affiliates in the UnitedKingdom alone accounted for 29 percent of such sales. The regional distribution of energyservice sales varied somewhat by industry. Sales of services through petroleum-relatedaffiliates were relatively widely distributed geographically. U.S.-owned affiliates in Europeaccounted for 31 percent of such sales, almost half of which occurred in the United Kingdom,while Latin America accounted for 21 percent, and a collection of other countries in Asia andthe Middle East accounted for 26 percent. By contrast, U.S. sales of services throughforeign-based affiliates in the utility industry were much more concentrated in Europe. In1996, European-based affiliates accounted for 60 percent of utility-related services salesthrough affiliates, with those in the United Kingdom alone accounting for 41 percent of sales.Australian-based affiliates of U.S. firms also recorded significant utility-related sales,accounting for 16 percent of U.S. sales. The predominance of affiliate

JUNE 1999Energy Services Industry, Trade, and Technology Review
8 Sales of services by utilities that are foreign affiliates of U.S. firms operating in the UnitedKingdom increased by $3.2 billion in 1996, which accounted for 67 percent of the increase inworldwide service sales by foreign affiliates of U.S. firms in the utility sector. Similarly, sales ofservices by utilities that are foreign affiliates of U.S. firms operating in Australia increased by$1.2 billion in 1996, which accounted for 26 percent of the increase in worldwide service sales byforeign affiliates of U.S. firms in the utility sector. 9 USITC staff estimates, based on USDOC, BEA, “Direct Investment Positions for 1997: Country and Industry Detail,” Survey of Current Business, July 1998, p. 44.
4
Sales Balance
Other
Canada
Latin America
Europe
-2 0 2 4 6 8 10
Billion dollars
Source: U.S. Department of Commerce (USDOC), Bureau of Economic Analysis (BEA), Survey of CurrentBusiness, Sept. 1994, pp. 135-136; Sept. 1995, pp. 104-105; Nov. 1996, pp. 111-112; Oct. 1997, pp. 137-138;Oct. 1998, pp. 115-116; USDOC, BEA, U.S. Direct Investment Abroad, 1994 Benchmark Survey, Final Results,table III-F 20; and USITC staff estimates.
Figure 2Energy service transactions by majority-owned affiliates: U.S. sales andbalance, by major trading partners, 1996
transactions generated in the United Kingdom and Australia was a direct result ofprivatization and deregulation programs undertaken by these countries, which facilitated U.S.investment in the electric power sector during the mid-1990s. In particular, new acquisitionsby U.S. firms in the United Kingdom and Australia together were responsible for 93 percentof the growth in sales of services by utilities during 1996.8
With respect to U.S. purchases of energy-related services from U.S.-based affiliates of foreignfirms in 1996, affiliates with parent firms in Canada accounted for 41 percent, while thosewith European parents are believed to have accounted for about 30 percent.9 Canadian-ownedaffiliates were particularly prominent in the utilities sector, accounting for 65 percent of U.S.purchases of services from U.S.-based utility affiliates of foreign firms. European-ownedaffiliates held a more significant position in the petroleum-related sector, where they accountedfor 35 percent of U.S. purchases of petroleum-related services through affiliates in 1996,followed by 11 percent purchased through U.S.-based affiliates of Canadian firms.

JUNE 1999Industry, Trade, and Technology Review Energy Services
10 CNN News Network, “Halliburton, Dresser merge,” Feb. 26, 1998, found at Internetaddress http://cnnfn.com/, retrieved Mar. 17, 1998; Baker Hughes Company Profile, found atInternet address http://www.bakerhughes.com/, retrieved Nov. 10, 1998; and Standard & Poor’s,“Oil & Gas: Equipment & Services,” Industry Surveys, Sept. 11, 1997, p. 7. 11 Bhushan Bahree, “Oil prices likely to stay low through next year,” Wall Street Journal,Nov. 10, 1998, p. A2. 12 Upstream activities include exploration, development, and production functions. AnneMarie Morrego, “Unocal, Mobil to cut capital spending, joining moves of other oil companies,”Wall Street Journal, Nov. 12, 1998, p. A20; and Texaco, “Texaco announces worldwideupstream reorganization,” press release of Nov. 12, 1998, found at Internet address
(continued...)
5
In sum, available data on affiliate transactions indicate that sales of energy services throughforeign-based affiliates of U.S. firms increased significantly in 1996, principally due to severalmajor acquisitions by U.S. firms. Meanwhile, U.S. purchases of energy services fromaffiliates of foreign firms increased somewhat more slowly than in previous years, reflectingstable market conditions and the absence of major acquisitions by foreign firms. Regionally,European-based affiliates accounted for most U.S. sales of energy-related services throughforeign affiliates, while Canadian-owned affiliates accounted for most U.S. purchases fromaffiliates.
U.S. Competitive Position in the Global Energy ServicesMarket
With several strong, well established firms, U.S. providers of energy services are wellpositioned to compete internationally in both the petroleum and utility businesses. In the oilfield services industry, consolidation has resulted in the formation of three powerful U.S.companies with broad international activities: Baker Hughes, Halliburton, andSchlumberger.10 Major U.S. oil companies, such as Chevron and Exxon-Mobil, are similarlywell established global players that provide various services related to petroleum and naturalgas extraction and distribution. Enron, a large U.S. energy concern with expertise in thenatural gas sector, is also expanding in the electric utility sector, joining a number of privateelectric power companies that are major global competitors, including AES, CMS, EdisonMission Energy, Entergy, PP&L, Southern Energy, Texas Utilities, and Utilicorp.
U.S. firms such as these are well endowed in financial, managerial, and technologicalresources. Competitive threats and opportunities facing these firms are driven principally byeconomic and political forces that may alter the operating environment. In 1998, these forcesappeared to be sending petroleum-related businesses into decline while fostering internationalgrowth in the electric power industry. During 1997-98, increases in oil supplies from non-OPEC countries, combined with diminished demand in Asian markets, reduced oil prices froma high of $27 to $13 per barrel.11 With oil prices low, demand for services related to newexploration or relatively expensive extraction techniques is likely to decline as well. Such adecline was manifested by reductions in capital spending of 10 to 15 percent by the major oilcompanies in 1998, and by the November 1998 announcement of layoffs at Texaco, whichplans to reduce “upstream” employment by 12 percent.12
JUNE 1999Energy Services Industry, Trade, and Technology Review
12 (...continued)http://www.texaco.com/, retrieved Nov. 18, 1998. 13 Standard & Poor’s, “Oil & Gas: Equipment & Services,” Industry Surveys, Sept. 11, 1997,p. 8. 14 USITC, “Deregulation fosters globalization of the electric power industry,” Industry, Trade,and Technology Review, USITC publication 3134, Sept. 1998, p. 43. 15 USDOC, BEA, Survey of Current Business, Sept. 1997, p. 147. 16 Ibid., pp. 42-3. 17 U.S. Department of Energy, Energy Information Administration, “Asian economicdownturn slows growth in oil prices through 2007,” press release of Nov. 17, 1998; and BhushanBahree, “Oil prices likely to stay low through next year,” Wall Street Journal, Nov. 10, 1998,p. A2. 18 Kathryn Kranhold, “PacifiCorp says it is quitting foreign projects,” Wall Street Journal,Oct. 26, 1998, p. A4; Business Wire, “Utilicorp announces Power New Zealand transactioncreating largest New Zealand electric lines company,” Nov. 13, 1998, found at Internet addresshttp://www.energycentral.com/, retrieved Nov. 17, 1998; Reuters, “Texas Utilities in finalAustralia CitiPower bids,” Nov. 16, 1998, found at Internet address http://www.energy-central.com, retrieved Nov. 17, 1998; Reuters, “CMS says plans to invest $800 million inBrazil,” Nov. 13, 1998, found at Internet address http://www.energycentral.com, retrievedNov. 17, 1998; and Reuters, “Enron Mexico aims for top energy spot,” Sept. 25, 1998, retrievedthrough Pointcast Sept. 28, 1998.
6
In contrast, government policy changes are fostering growth in international electric powerservices. To meet rapidly rising demand for electric energy, governments in developingcountries are turning toward foreign investors, seeking their participation in build-operate-transfer programs, selling state-owned enterprises, and offering concessions to managedistribution services.13 Meanwhile, to drive down electricity costs and improve servicequality, governments in developed countries are breaking up monopolies and introducingcompetition into the generation and distribution sectors.14 The net effect of these policychanges is a boom in opportunities for foreign direct investment in electricity services, whichhas been manifested by 107-percent average annual growth in the U.S. direct investmentposition in foreign utilities during 1994-96.15 In dollar terms, the United Kingdom andAustralia have been the largest recipients of U.S. direct investment, reflecting U.S.acquisitions of eight electric power distribution companies in the United Kingdom and five inAustralia.16
Outlook
The opposing trends of declining demand for petroleum-related services and increasingopportunities in the electric power industry suggest that future prospects for energy servicestrade are mixed. Growth in world oil demand is projected to slow through 1999, and pricescurrently are not expected to recover soon, which suggests that sales of related services willlikely suffer.17 Meanwhile, U.S. electric power providers appear to be continuing with theirinternational expansion programs, despite some retrenchments. Although PacifiCorp andEntergy are exiting from foreign projects, other firms such as Utilicorp, Texas Utilities, CMS,and Enron are increasing their international activities.18 Due to the Asian economicslowdown, near-term growth in demand for electric power will likely slow and government-

JUNE 1999Industry, Trade, and Technology Review Energy Services
19 Reuters, “Spain opens electricity market to REN, Electrabel,” Nov. 12, 1998, found atInternet address http://www.energycentral.com, retrieved Nov. 17, 1998; and USITC,“Deregulation fosters globalization of the electric power industry,” Industry, Trade, andTechnology Review, p. 37. 20 Statoil and Tractebel, a majority-owned affiliate of Suez Lyonnaise des Eaux of France,already own some electric power plants in the United States. Kathryn Kranhold, “Plannedpurchase of GPU power plants highlights push by foreigners into U.S.,” Wall Street Journal,Nov. 10, 1998, p. A4, and Business Wire, “Sithe Energies wins bid for GPU generating assets,”Nov. 9, 1998, found at Internet address http://www.energycentral.com/, retrieved Nov. 10, 1998.
7
sponsored development projects may be curtailed across Asia. Despite such adverse marketconditions, U.S. firms may actually find more opportunities to establish foreign affiliates inAsia as the weakened financial condition of Asian governments may accelerate the ongoingshift to private funding of electric power sector development. In addition, Latin Americancountries such as Mexico and Brazil continue to seek foreign investment in the electric powerindustry, and the European Union’s movement toward the creation of a Common EnergyMarket is creating new business opportunities for affiliates of U.S. energy firms.19 Thesefactors suggest that, despite an ailing petroleum industry, sales of energy services throughU.S. affiliates will likely continue to grow strongly as utilities pursue international expansion,although, it is unlikely that the very high rate of growth experienced during 1995-96 will besustained.
U.S. purchases of energy services through affiliates of foreign firms are likely to encountersimilar forces, characterized by slowing growth in purchases of services from petroleum-related affiliates and accelerating growth in purchases from utilities owned by foreign firms.The U.S. electric power industry is undergoing significant change as several states restructuretheir regulatory frameworks to permit competition. Such changes provide increased incentivesand opportunities for new competitors, both foreign and domestic, to enter U.S. regionalmarkets through mergers and acquisitions. For example, in November 1998, New Jersey-based GPU announced the sale of 23 power generation plants to Sithe Energies, a U.S.affiliate of the French company, Vivendi, for $1.7 billion. The transaction allows GPU toconcentrate on electricity distribution, while enabling Sithe to become the largest independentpower producer in the United States. A number of other foreign companies are reportedlyconsidering similar acquisitions in the United States, including Scottish Power and PowerGenof the United Kingdom, Statoil of Norway, and Tractebel of Belgium.20 Should theseacquisitions take place, U.S. purchases of energy services would likely increase significantlyin the near future.#
JUNE 1999Industry, Trade, and Technology Review Environmental Services
1 The views expressed in this article are those of the author. They are not the views of theInternational Trade Commission or any of the Commissioners. 2 The Bureau of Economic Analysis (BEA) does not classify and report data that indicatecross-border trade in environmental services or transactions by majority-owned affiliates in theenvironmental services industry in its annual report in the Survey of Current Business entitled“U.S. International Sales and Purchases of Private Services.” Consequently, this chapter includesdata compiled and reported by industry sources, primarily Environmental Business International,Inc. (EBI) and Engineering News-Record, published by the McGraw-Hill Companies. 3 Organization for Economic Cooperation and Development (OECD), report prepared inconjunction with OECD/Eurostat Informal Working Group on the Environment Industry,“Interim Definition and Classification of the Environment Industry” (Paris: OECD, 1996), p. 7. 4 United Nations Conference on Trade and Development (UNCTAD), “StrengtheningCapacities in Developing Countries to Develop their Environmental Services Sector,” May 12,1998, p. 5. 5 The scope of the environmental services sector, as discussed herein, is that used by EBI (seefootnote 2) in the compilation of trade and market data.
9
Market Trends Affecting the U.S.Environmental Services SectorJennifer M. Baumert1
[email protected](202)205-3450
In recent years, slower growth in demand for environmental services in thelargely compliant U.S. market has led to increased U.S. industryconsolidation and a shift in emphasis to the international market amongU.S. environmental service providers. This shift in focus, together with theUnited States’ competitive position in the environmental services sectorand growing demand in foreign markets, suggests that U.S. exports ofenvironmental services will likely experience continued growth in thefuture. This article assesses U.S. trade performance in the environmentalservices sector; the effect of U.S. and foreign environmental marketstructures, recent trends, and foreign trade barriers on the ability of U.S.firms to compete in this sector; and future prospects for the U.S. and globalenvironmental services sectors.
The environmental services sector2 as defined by the Organization for Economic Cooperationand Development (OECD), broadly comprises those activities incidental to the cleanup,mitigation, prevention, study, and measurement of environmental damage affecting air, land,water, noise levels, and ecosystems.3 However, because of the relatively recent emergence ofthe environmental services industry, there is no consensus regarding the precise scope of thissector.4 For the purposes of this article, environmental services5 specifically include solid and

JUNE 1999Environmental Services Industry, Trade, and Technology Review
6 Remediation services comprise the cleanup of polluted land and water sites, as well as theemergency cleanup of accidents that damage the environment, such as oil spills. UNCTAD,“Strengthening Capacities in Developing Countries to Develop their Environmental ServicesSector,” p. 5. 7 UNCTAD, “Strengthening Capacities in Developing Countries to Develop TheirEnvironmental Services Sector,” p. 5. 8 World Trade Organization (WTO), Committee on Trade and Environment, contribution bythe United States, “Liberalization of Trade in Environmental Services and the Environment”(WT/CTE/W/70), Nov. 21, 1997. 9 UNCTAD, “Strengthening Capacities in Developing Countries to Develop theirEnvironmental Services Sector,” p. 11. 10 Environmental services trade data published by EBI are only available for the years 1994,1995, 1996, and 1997. 11 The U.S. analytical services sector registered a small surplus of $0.03 billion in 1997. During 1994-96, no imports or exports were registered in this sector.
10
hazardous waste management, environmental consulting and engineering, remediation,6
environmental analysis, and water treatment.
Engineers, consultants, architects, and other professional service providers typically supplyenvironmental services. National governments, local governments, and firms bound byenvironmental guidelines are the principal consumers of environmental services,7 with publicsector spending accounting for the greatest share of environmental services demand in allOECD countries, except the United States and the Netherlands.8 Environmental goods andservices are often provided as part of a single package, in which services frequently play themore important role.9 Although the data used in this article do not distinguish between cross-border trade and affiliate transactions, it is likely that trade in environmental services isconducted primarily through overseas affiliates, as cross-border trade is often infeasible in thissector.
U.S. Trade in Environmental Services
U.S. exports of environmental services reached $3.5 billion in 1997, a 4-percent increase fromthe previous year (figure 1). This increase was lower than the average annual increase of 22percent observed during 1994-96.10 U.S. imports rose by 43 percent to $2 billion in 1997.This increase was in sharp contrast to the average annual decrease of 3 percent during 1994-96. As a result, although the U.S. environmental services trade surplus increased at anaverage annual rate of 58 percent during 1994-96, the surplus decreased by 24 percent to $1.5billion in 1997. These trends are likely a result of the recent consolidation of the U.S.environmental industry, which is discussed in further detail in the following section. Solidwaste management services and consulting and engineering services accounted for the greatestshare of U.S. exports, as well as a majority of the U.S. surplus in environmental services tradeduring 1994-97.11 In 1997, solid waste management services and consulting and engineeringservices respectively accounted for exports of $1.3 billion and $1.7 billion, and tradesurpluses of $1.1 billion and $1.4 billion. In that same year, U.S. hazardous wastemanagement services and remediation and industrial services accounted for trade surpluses

JUNE 1999Industry, Trade, and Technology Review Environmental Services
12 In 1997, no U.S. imports were registered in the hazardous waste management andremediation and industrial services sectors. 13 EBI, Environmental Business Journal, Overview 1998, vol. 11, No. 7, p. 7; Annual IndustryOverview, Aug. 1995, vol. 8, No. 8, p. 2; Apr. 1996, vol. 9, No. 4, p. 7; and Apr. 1997, vol. 10,No. 4, p. 11. 14 USITC staff estimates, based on data reported by Andrew G. Wright and Debra K. Rubin,et. al., “Despite Some Rough Spots in Asia, International Markets Forge On,” Engineering News-Record, July 6, 1998, p. 49.
11
1994 1995 1996 19970
0.5
1
1.5
2
2.5
3
3.5
4Exports Imports Balance
Billion dollars
Source: EBI, Environmental Business Journal, Overview 1998, vol. 11, No. 7, p. 7; Annual Industry Overview, Aug. 1995, vol. 8, No. 8, p. 2; Apr. 1996, vol. 9, No. 4, p. 7; and Apr. 1997, vol. 10, No. 4, p. 11.
Figure 1Environmental services: U.S. exports, imports, and balance, 1994-97
of $0.1 billion and $0.3 billion, respectively.12 Waste water treatment is the onlyenvironmental service sector in which the United States registered a trade deficit, amountingto $1.5 billion in 1997.13
Available trade data do not indicate which countries or regions account for the greatest shareof U.S. environmental services imports and exports. However, data do reveal the relativeimportance of certain foreign markets for the U.S. environmental industry. Europe isreportedly the largest market for U.S. environmental goods and services, accounting for 44percent of the overseas revenue earned by the leading 200 U.S.-based environmental firms(figure 2). Asia/Australia, Latin America, and Canada are also important markets for U.S.environmental goods and services, accounting for 19 percent, 16 percent, and 13 percent ofoverseas revenues in 1997, respectively. By contrast, the Middle East and Africa accountedfor only 7 percent and 1 percent of such revenues, respectively.14 Because environmentalgoods and services are often provided simultaneously, it is likely that these figures closelyreflect the proportion of international revenues earned by the U.S. environmental serviceproviders in each of these markets.

JUNE 1999Environmental Services Industry, Trade, and Technology Review
15 David R. Berg and Grant Ferrier, “The U.S. Environmental Industry Meeting theChallenge: U.S. Industry Faces the 21st Century,” Sept. 1997, found at Internet addresshttp://www.gnet.org/, retrieved July 8, 1998; and EBI, Environmental Business Journal,Overview 1998, vol. 11, No. 7, p. 15. 16 UNCTAD, “Strengthening Capacities in Developing Countries to Develop theirEnvironmental Services Sector,” May 12, 1998, p. 6; and Berg and Ferrier, “The U.S.Environmental Industry Meeting the Challenge: U.S. Industry Faces the 21st Century,” Sept.1997. 17 Berg and Ferrier, “The U.S. Environmental Industry Meeting the Challenge: U.S. Industry
(continued...)
12
Europe 43.9%
Asia/Australia 19.3%
Latin America 15.8%
Canada 12.8%
Middle East 7.2%
Africa 1.0%
1 Data relating to the environmental industry, as presented in the Engineering News-Record, comprise both goodsand services revenues earned by the leading 200 U.S.-based environmental firms in the following environmentalsectors: hazardous waste management, nuclear waste management, water quality, wastewater treatment,environmental compliance, and other environmental markets.
Source: Compiled by USITC staff using data reported by Wright and Rubin, “Despite Some Rough Spots in Asia,International Markets Forge On,” Engineering News-Record, July 6, 1998, p. 49.
Figure 2Environmental industry:1 Foreign revenue of U.S.-based environmentalgoods/services firms, by region, 1997
The U.S. Environmental Services Sector
Environmental firms in the United States have traditionally focused on meeting domesticdemand, which is substantial. In 1997, less than 10 percent of U.S. environmental industryrevenues were generated abroad.15 The domestic market has been particularly important tothe small- and mid-size firms that generate more than half of U.S. environmental industryrevenues, as such firms are frequently unable to market their goods and services abroad dueto insufficient resources.16 In recent years, however, the U.S. environmental sector hasexperienced slower growth in domestic demand, because many firms have come intocompliance with present environmental law, and little new legislation has been introduced.This slowdown in the U.S. market has led to greater competition and declining industryprofits.17 Consequently, U.S. firms are pursuing mergers and acquisitions more aggressively,
JUNE 1999Industry, Trade, and Technology Review Environmental Services
17 (...continued)Faces the 21st Century,” Sept. 1997. 18 Wright and Rubin, “Booming Economy Keeps Green Markets Afloat,” p. 38. 19 Cary Perket, “Environmental Service Demands Shrink, Close Smaller Shops,” WorldWastes, May 1998, found at Internet address http://www.umi.com/proquest/, retrieved June 30, 1998. 20 Berg and Ferrier, “The U.S. Environmental Industry Meeting the Challenge: U.S. IndustryFaces the 21st Century,” Sept. 1997. 21 EBI, Environmental Business Journal, Apr. 1997, vol. 10, No. 4, p. 11; Apr. 1996, vol. 9,No. 4, p. 7; and Aug. 1995, vol. 8, No. 8, p. 2. 22 Berg and Ferrier, “The U.S. Environmental Industry Meeting the Challenge: U.S. IndustryFaces the 21st Century,” Sept. 1997. 23 Ibid. 24 Ibid. 25 UNCTAD, “Strengthening Capacities in Developing Countries to Develop theirEnvironmental Services Sector,” p. 7.
13
in an effort to broaden their companies’ expertise and increase growth potential.18 Slowinggrowth in demand for environmental services also has precipitated market exit by many smallenvironmental services firms.19
As a result of domestic trends, U.S. firms have shown increasing interest in the overseasenvironmental market, which is growing more rapidly than the domestic market forenvironmental services.20 Increasing international orientation is well illustrated by the factthat U.S. exports of environmental services grew at an average annual rate of 15 percentduring 1994-97, while the domestic U.S. environmental services market registered averageannual growth of 1 percent during that same period.21
The relatively large number of small- and mid-size companies in the U.S. environmentalsector, together with the traditional industry focus on domestic compliance, have had anegative effect on the overall competitiveness of the U.S. environmental goods and servicesindustry.22 The U.S. environmental goods industry lags behind competitors from countriessuch as Germany and Japan in certain equipment sectors.23 However, with the exception ofservices incidental to water treatment works--in which France and the United Kingdomreportedly have a competitive advantage--U.S. firms are competitive in all areas of theenvironmental services industry.24
The Global Environmental Services Market
The growing need for environmental goods and services in developing countries--caused byincreasing population, urbanization, and industrialization--could precipitate the rapid growthof their environmental markets. However, potential market growth in the developing worldis hampered by limited resources and a lack of environmental regulation, enforcementmechanisms, and knowledge.25 Currently, industrialized countries reportedly remain the mostimportant overseas markets for U.S. environmental goods and services firms. Europe had thefastest growing market for environmental services in 1997 (figure 3). Between 1996 and1997, European revenues for the leading 200 U.S.-based environmental

JUNE 1999Environmental Services Industry, Trade, and Technology Review
26 Industry representatives indicate that business has decreased substantially in both Asia andLatin America as a result of the crisis, while another has suggested the possibility that the Asiancrisis could have a delayed impact on the environmental industry. Moreover, the Asian crisis hasreportedly resulted in an unwillingness to borrow funds for environmental projects frommultilateral development banks, such as the Inter-American Development Bank. Wright andRubin, “Despite Some Rough Spots in Asia, International Markets Forge On,” EngineeringNews-Record, July 6, 1998, p.49; and industry representatives, facsimile responses to questionsposed by USITC staff, received Oct. 15, 1998, Nov. 16, 1998, and Dec. 18, 1998. 27 Wright and Rubin, “Despite Some Rough Spots in Asia, International Markets Forge On,”Engineering News-Record, July 6, 1998, p. 49. 28 Ibid.
14
1996 1997
Europe Asia/Australia Latin America Canada Middle East Africa0
500
1000
1500
2000
2500Million dollars
1 Data relating to the environmental industry, as presented in the Engineering News-Record, comprise both goodsand services revenues earned by the leading 200 U.S.-based environmental firms in the following environmentalsectors: hazardous waste management, nuclear waste management, water quality, wastewater treatment,environmental compliance, and other environmental markets.
Source: Wright and Rubin, “Despite Some Rough Spots in Asia, International Markets Forge On,” Engineering News-Record, July 6, 1998, p. 49.
Figure 3Environmental industry:1 Foreign revenue of U.S.-based environmentalgoods/services firms, by region, 1996 and 1997
goods and services firms increased by 80 percent, from $1.2 billion in 1996 to $2.2 billion in1997. This growth has been attributed to the low risk and relatively solid economic climatethat have encouraged investment in the European market. The Latin American and Canadianrevenues of leading U.S. environmental firms also grew significantly in 1997, registeringincreases of 66 percent and 53 percent, respectively. Though environmental business in Asiahas slowed due to the recent currency crisis,26 the Asia-Pacific revenues of leading U.S.environmental firms also rose by 18 percent in 1997.27 By contrast, revenues generated byU.S. firms in Africa and the Middle East that year decreased by 34 percent and 12 percent,respectively.28

JUNE 1999Industry, Trade, and Technology Review Environmental Services
29 UNCTAD, “Strengthening Capacities in Developing Countries to Develop theirEnvironmental Services Sector,” May 12, 1998, p. 21. 30 Ibid., p. 2. Additional information on recent trends in professional services provision canbe found in chapters 5 and 21 of Recent Trends in U.S. Services Trade (USITC publication 3198;May 1999). 31 Ibid., p. 17. 32 “Frost & Sullivan–Regulations and Infrastructure Developments Drive Mexican Water andWastewater Treatment Market,” Frost & Sullivan, received by NewsEDGE/Lan, Oct. 19, 1998; and industry representative, facsimile response to questions posed by USITC staff,received Nov. 16, 1998. 33 Tied aid is project financing to which certain conditions are attached. Recipients of tied aidare often required to procure goods and services from firms based in the country that provides theaid. 34 Berg and Ferrier, “The U.S. Environmental Industry Meeting the Challenge: U.S. IndustryFaces the 21st Century,” Sept. 1997. 35 Industry representative, facsimile response to questions posed by USITC staff, received Nov.16, 1998. 36 “Export Financing for Service Industries,” Business America, Apr. 1998.
15
Trade Barriers
The ability of U.S. environmental firms to provide services abroad is dependent on variousfactors. For example, government procurement regulations, as well as the transparency ofthese rules, can have a considerable effect on environmental services providers, as federal andlocal governments are frequently the purchasers of environmental services. In some countries,government procurement restrictions place foreign firms at a competitive disadvantage, orprohibit their participation in the procurement process.29 Because engineers, architects,consultants, and other professionals provide many environmental services, restrictions on thepresence of foreign professionals, the failure to recognize professional degrees, and otherbarriers to professional services provision also have a chilling effect on the foreign provisionof environmental services.30 Barriers to commercial presence, a principal mode ofenvironmental services supply, can also impede foreign provision of such services.31
Moreover, access to financing is crucial. For example, firms that can secure project financingreportedly are more likely to win business in the water and wastewater treatment sector.32
Countries such as Canada, France, Germany, Japan, Korea, the Netherlands, and the UnitedKingdom reinforce the international competitiveness of their environmental industries byoffering incentives such as “tied aid”33 and generous financing packages to potentialcustomers.34 In addition, European environmental firms occasionally provide analysis ormanagement services inexpensively or at no charge in an effort to attract business.35 U.S.services providers, on the other hand, can obtain financing from U.S. agencies such as theExport-Import Bank of the United States (Eximbank) and the Small Business Administration(SBA).36 Creative financing techniques, such as build-operate-

JUNE 1999Environmental Services Industry, Trade, and Technology Review
37 When operating under a BOT contract, a firm builds and operates a facility for a certainperiod of time, gradually transferring ownership to a public authority. UNCTAD, “StrengtheningCapacities in Developing Countries to Develop their Environmental Services Sector,” p. 22. 38 Ibid., p. 22. 39 Industry representative, facsimile response to questions posed by USITC staff, received Dec.18, 1998. 40 Jennifer Lin, “China awakes to the fact that its growth has created an environmentaldisaster,” Knight Ridder/Tribune Information Services, received by NewsEDGE/Lan, Nov. 7, 1998. 41 Industry representative, facsimile response to questions posed by USITC staff, received Dec.18, 1998. 42 “Frost & Sullivan–Regulations and Infrastructure Developments Drive Mexican Water andWastewater Treatment Market,” Frost & Sullivan, received by NewsEDGE/Lan, Oct. 19, 1998. 43 Obligations could also be satisfied through various other means, including emissionsreducing projects in developing countries and the purchase of pollution permits. Though not ineffect, this protocol has been agreed to by 160 countries. “Administration pushes Kyoto Protocoldespite strong industry opposition,” Chemical Marketing Reporter, Aug. 31, 1998, found atInternet address http://www.umi.com/proquest/, retrieved Nov. 5, 1998.
16
transfer (BOT),37 have also been used in the environmental services sector.38 However,because BOT projects are perceived as being risky, few U.S. environmental firms pursue suchprojects.39 Client countries can also obtain project financing from various internationalagencies.
Future Prospects
If current trends persist, growth will likely continue in the world environmental servicesmarket in spite of the recent economic downturn caused by the Asian currency crisis.Increasing environmental awareness, the return of economic growth, and new environmentallegislation may cause demand for environmental services to rise in the developing world. Forinstance, China has recently demonstrated heightened environmental awareness and a greaterwillingness to enforce environmental regulations in response to poor environmental conditionscaused by years of rapid industrialization. Government officials have adopted new laws andfines, closed a large number of small factories, and advocated media exposure of polluters.40
Reportedly, business opportunities for U.S. environmental services firms in Eastern Europeare relatively abundant as a result of increasingly strict environmental regulations and a highregard for U.S. technologies in that region.41 In Mexico, decreasing supplies of potable water,together with a growing population and expanding industrial sector, likely will lead toincreased demand for water and wastewater treatment goods and services in the near future.42
The Kyoto Protocol and efforts to comply with ISO 14000 standards also could increasebusiness opportunities for U.S. environmental services providers. Under the Kyoto Protocol,industrialized countries would be required to reduce greenhouse gas emissions significantly.43
ISO 14000 is a set of standards according to which providers of environmental auditingservices can certify the environmental management systems (EMS) of firms in various goodsand services industries. Firms that obtain ISO 14000 certification may gain a competitive
JUNE 1999Industry, Trade, and Technology Review Environmental Services
44 Glenn Hasek, “ISO’s green standards take root,” Industry Week, Feb. 16, 1998, found atInternet address http://www.umi.com/proquest/, retrieved Mar. 10, 1998; and Charles W.Thurston, “Latin America finds profit in ISO 14000,” Chemical Marketing Reporter, Feb. 16, 1998, found at Internet address http://www.umi.com/proquest/, retrieved Nov. 5, 1998.
17
advantage among potential customers who prefer to do business with environmentallyresponsible companies. Though these standards are voluntary, approximately 1,500 firmsaround the world already have become ISO 14000 certified.44 #

JUNE 1999Industry, Trade, and Technology Review Health Care Services
1 The views expressed in this article are those of the author. They are not the views of theInternational Trade Commission or any of the Commissioners. 2 For the purpose of this article, health care services include services provided to patients byhospitals and hospital chains; offices and clinics of medical doctors and other health careprofessionals; nursing homes and other long-term care providers; rehabilitation facilities; homehealth care providers; certain health maintenance organizations (HMOs); medical and dentallaboratories; kidney dialysis centers; and specialty outpatient facilities. This discussionencompasses HMOs or similar organizations that provide medical or other health care services tomembers, but does not include organizations that provide only insurance for hospitalization ormedical costs, as these services are captured under insurance services.
19
Health Care Services: Strong Fundamentalsand Innovations Foreshadow Growth in U.S.Exports and Foreign Direct InvestmentDennis R. Luther1
[email protected](202) 205-3497
Health care services encompass a broad range of activity provided bymedical professionals and health care institutions.2 Substantial visitationby foreign individuals to the United States for medical treatment and risingforeign direct investment in U.S. health care institutions testify to thevitality of U.S. health care services, despite pressures of high health carecosts. Admittedly, the most recently reported official data reflect aslowdown in U.S. health care export growth in 1997 and a sudden, steepdecline in transactions by foreign health care affiliates of U.S. firms in1996. This article examines the principal factors contributing to theslowdown as well as market factors that suggest a likely increase in U.S.exports and direct investment in health care services in the United Statesand abroad.
Today, U.S. medical facilities and health insurers are expanding international marketingefforts, and “telemedicine” via telecommunication technologies is proliferating across nationalboundaries. At the same time, opportunities for mergers and acquisitions are likely tocontinue to attract foreign investors to the U.S. health care market, and some large U.S.investors seem willing to explore market niches gradually opening abroad.
U.S. health professionals provide services to foreign patients and health care facilities boththrough cross-border transactions and through affiliates established in foreign markets.Cross-border trade consists of the treatment of citizens of one country by health care providers

JUNE 1999Health Care Services Industry, Trade, and Technology Review
3 Cross-border exports largely consist of the treatment of foreign persons in the United Statesby hospitals, clinics, medical doctors, and other health care service professionals. Cross-borderimports comprise the treatment of U.S. citizens overseas by foreign health care service providers. 4 Reportedly, such data are very difficult to capture and presumed to be quite small. Bureau ofEconomic Analysis representative, telephone interview by USITC staff, Nov. 24, 1998. 5 U.S. industry representatives, telephone interviews by USITC staff, Oct. 27-29, 1997.
20
in another country.3 Affiliate transactions reflect health care services provided to persons orfacilities in their home countries by affiliates also based there, but whose parent firm is basedin another country. Cross-border transactions account for the greatest proportion of U.S.receipts (exports) for providing health care services, while affiliate transactions account formost U.S. purchases (imports). This indicates that most U.S. transactions in health careservices involve the provision of treatment within the territory of the United States, as cross-border receipts are driven by patients traveling to the United States for treatment; andpurchases through affiliates are driven by foreign firms acquiring or establishing health carefacilities in the United States, which subsequently provide treatment to U.S. citizens.
Recent Trends
Cross-Border Trade
In 1997, U.S. cross-border exports of health care services amounted to $888 million.Corresponding imports of health care services are not available because data on medicalservices are not reported by official data collection agencies.4 U.S. cross-border exports ofhealth care services increased by 2 percent in 1997, slower than the 5-percent average annualrate of growth recorded during 1992-96. Slowing growth of health care services exports islikely a result of currency devaluations in Asia, Latin America, and Canada, which madetraveling to the United States for elective procedures considerably more expensive in 1997.Although official data do not identify exports of health care services by country, Canada isbelieved to be the dominant export market for U.S. health care services.5 Other sizablemarkets for U.S. cross-border exports of health care services include the United Kingdom,Germany, Mexico, Australia, and Japan.
Affiliate Transactions
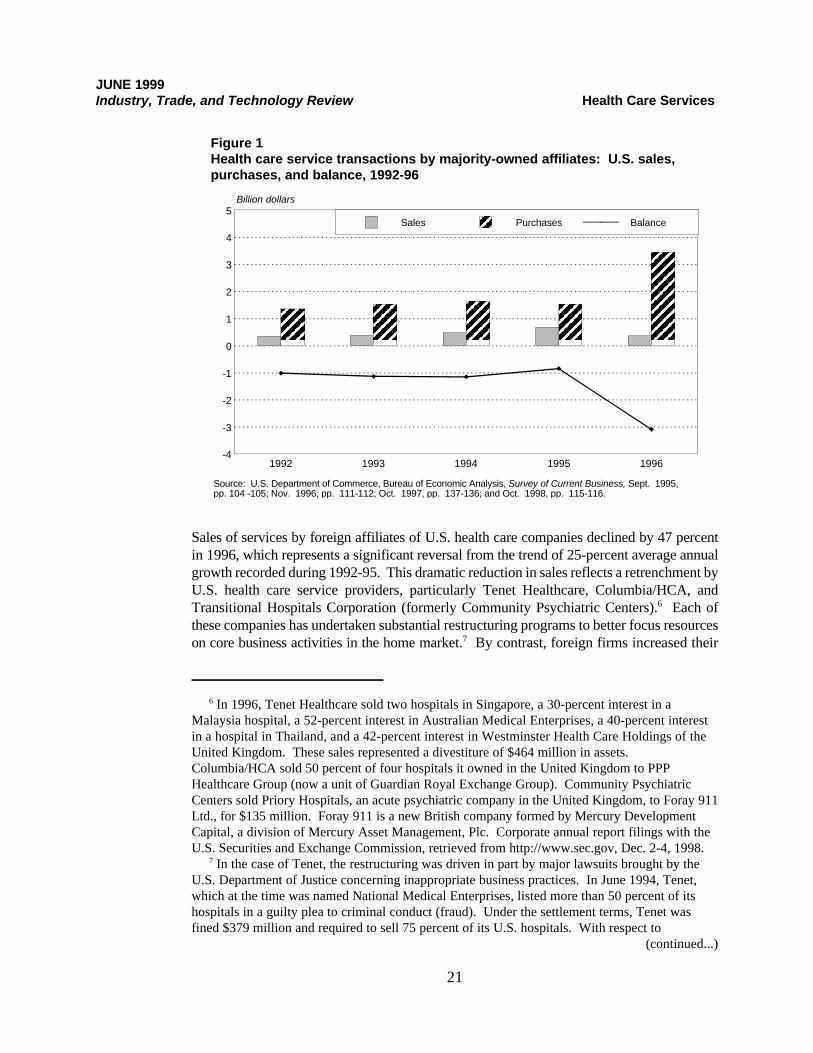
Sales of services by foreign-based affiliates of U.S. health care companies fell to $360 millionin 1996, while purchases of services through U.S.-based affiliates of foreign health carecompanies increased to $3.5 billion (figure 1). The $3.1-billion difference between U.S. salesand purchases of services through affiliates reflects the fact that the United States offersconsiderably greater opportunities for private-sector participation in the health care sectorthan most other countries. As a result, foreign firms have acquired or established health carefacilities in the United States to a much larger extent than U.S. firms have abroad.
JUNE 1999Industry, Trade, and Technology Review Health Care Services
6 In 1996, Tenet Healthcare sold two hospitals in Singapore, a 30-percent interest in aMalaysia hospital, a 52-percent interest in Australian Medical Enterprises, a 40-percent interestin a hospital in Thailand, and a 42-percent interest in Westminster Health Care Holdings of theUnited Kingdom. These sales represented a divestiture of $464 million in assets. Columbia/HCA sold 50 percent of four hospitals it owned in the United Kingdom to PPPHealthcare Group (now a unit of Guardian Royal Exchange Group). Community PsychiatricCenters sold Priory Hospitals, an acute psychiatric company in the United Kingdom, to Foray 911Ltd., for $135 million. Foray 911 is a new British company formed by Mercury DevelopmentCapital, a division of Mercury Asset Management, Plc. Corporate annual report filings with theU.S. Securities and Exchange Commission, retrieved from http://www.sec.gov, Dec. 2-4, 1998. 7 In the case of Tenet, the restructuring was driven in part by major lawsuits brought by theU.S. Department of Justice concerning inappropriate business practices. In June 1994, Tenet,which at the time was named National Medical Enterprises, listed more than 50 percent of itshospitals in a guilty plea to criminal conduct (fraud). Under the settlement terms, Tenet wasfined $379 million and required to sell 75 percent of its U.S. hospitals. With respect to
(continued...)
21
1992 1993 1994 1995 1996-4
-3
-2
-1
0
1
2
3
4
5Sales Purchases Balance
Billion dollars
Source: U.S. Department of Commerce, Bureau of Economic Analysis, Survey of Current Business, Sept. 1995, pp. 104 -105; Nov. 1996, pp. 111-112; Oct. 1997, pp. 137-136; and Oct. 1998, pp. 115-116.
Figure 1Health care service transactions by majority-owned affiliates: U.S. sales,purchases, and balance, 1992-96
Sales of services by foreign affiliates of U.S. health care companies declined by 47 percentin 1996, which represents a significant reversal from the trend of 25-percent average annualgrowth recorded during 1992-95. This dramatic reduction in sales reflects a retrenchment byU.S. health care service providers, particularly Tenet Healthcare, Columbia/HCA, andTransitional Hospitals Corporation (formerly Community Psychiatric Centers).6 Each ofthese companies has undertaken substantial restructuring programs to better focus resourceson core business activities in the home market.7 By contrast, foreign firms increased their

JUNE 1999Health Care Services Industry, Trade, and Technology Review
7 (...continued)Community Psychiatric Centers, changes in the structure of the psychiatric care industry resultedin reduced profitability, prompting the company to exit the business and focus instead on theprovision of long term acute care services under the new corporate identity of TransitionalHospitals Corp. In 1996, Columbia/HCA was focusing its resources on continuing its aggressive,acquisition-driven expansion in the United States. By 1997, however, Columbia/HCA hadbecome the target of a U.S. Department of Justice investigation that prompted major managementchanges and the sale of several institutions. J.M. Wynne, “The Corporate Scene in Health,”found at Internet address http://www.uow.edu.au, retrieved Dec. 4, 1998; corporate annual reportfilings with the U.S. Securities and Exchange Commission, retrieved from http://www.sec.gov,Dec. 2-4, 1998; and Columbia/HCA press releases, found at Internet addresshttp://www.columbia-hca.com, retrieved Dec. 4, 1998. 8 The slower growth trend reflects a decline of 6 percent recorded in 1995, which partiallyoffset the modest growth recorded during 1992-94. 9 Weiss, Peck, & Greer Private Equity, “Paracelsus Healthcare Corporation,” found at Internetaddress http://www.wpgequity.com, retrieved Dec. 1, 1998. 10 Fresenius Medical Care, Annual Report 1996, found at Internet address http://www.fmc-ag.com, retrieved Dec. 2, 1998. 11 USITC staff estimates.
22
level of participation in the U.S. market substantially in 1996. As a result, purchases ofhealth care services through U.S.-based affiliates of foreign firms increased by 126 percentin 1996, reflecting a major jump from the 4-percent average annual rate of growth recordedduring 1992-95.8 Much of this increase may be explained by two major acquisitions by theGerman firms Paracelsus Healthcare and Fresenius AG. In August 1996, ParacelsusHealthcare merged with Champion Healthcare, a U.S. firm, to form a for-profit hospitalmanagement company that owns and operates 31 acute care and psychiatric hospitals in eightstates.9 Meanwhile, Fresenius became the world’s largest fully integrated renal health carecompany in September 1996 when Fresenius AG acquired National Medical Care, Inc.,formerly a subsidiary of W.R. Grace.10
As the foregoing discussion suggests, Germany appears to account for the majority of U.S.purchases of health care services through affiliates, followed by Canada.11 Australia andJapan are the only other countries from which purchases through U.S.-based affiliates werereported in 1996, but such purchases amounted to only $14 million and $5 million,respectively. U.S. sales of services through foreign-based health care affiliates wereconcentrated in the United Kingdom, which accounted for 51 percent of total sales throughforeign affiliates in 1996. Switzerland also appears to account for significant U.S. sales ofhealth care services through affiliates, although the actual value is not officially reported inorder to avoid disclosing financial data concerning individual firms.
Market Outlook
U.S. international trade in health care services reflects the widely recognized capabilities ofU.S. medical institutions. Significant numbers of foreign individuals travel to the UnitedStates each year to receive medical treatment at U.S. facilities. As a result, the United Statesis believed to consistently record a substantial surplus in cross-border trade of health care

JUNE 1999Industry, Trade, and Technology Review Health Care Services
12 “Health Care in America: Medicine for Export,” The Economist, Mar. 7, 1998, andStandard & Poor’s, Industry Surveys, Healthcare: Facilities, Nov. 19, 1998, p. 2.
23
services. With respect to affiliate transactions, the strength and diversity of the U.S. healthcare industry has prompted foreign firms to enter the U.S. market by acquiring or establishinghealth care facilities. By contrast, U.S. firms typically have had relatively few investmentopportunities abroad, where government agencies often control the entire health care systemor where financing is unavailable for the provision of services by private institutions. Thedisparity between investment opportunities in the United States and abroad is manifested bythe substantially greater volume of U.S. health care purchases through affiliates of foreignfirms relative to U.S. sales by foreign affiliates.
Since cross-border trade in health care services is largely dependent upon the ability of foreignindividuals to travel to the United States and typically to finance their treatment throughpersonal resources, this trade is heavily influenced by changes in currency values.Consequently, the Asian financial crisis, which resulted in currency devaluations in Asia andLatin America, had a dampening effect on U.S. exports of health care services in 1997.Transactions through affiliates respond to different forces, as these are driven by newinternational investments and the microeconomic conditions of countries in which affiliatesare located. In 1996, affiliate transactions reflected retrenchment by U.S. health care firmsand further expansion by foreign firms into the U.S. market. In both cases, these actionsappear to have been driven by individual corporate objectives rather than broader economicfactors.
Strategically, the U.S. health care industry is well positioned with respect to internationalcompetitors. The industry enjoys the strengths of a large, wealthy domestic market withadvanced capabilities in technology and expertise, while suffering from few, if any, functionalweaknesses. The large volume of individuals who travel to the United States for medicaltreatment and the substantial level of foreign direct investment testify to the vitality of U.S.health care sectors. The principal challenges to the industry are financial and philosophical.Rising health care costs have become increasingly difficult to sustain in the United States andabroad, forcing governments, insurance companies, and health care institutions to adoptpolicies such as managed care programs.12 Such policy shifts apply financial pressure tovarious segments of the market and force adaptation, as demonstrated by the rise of healthmaintenance organizations and the consolidation of hospitals into health care systems in theUnited States. The philosophical challenge confronting the industry lies in the common beliefthat health care is a fundamental right to which all members of society are entitled. In manycountries, this provides the rationale for the government to serve as the principal provider ofhealth care services. As a result, private health care companies are excluded from many ofthe world’s markets, which limits international growth opportunities for U.S. firms.
Despite these challenges, international prospects for the U.S. health care industry arepromising. The flow of patients into the United States for treatment is likely to continuegrowing, as medical centers are expanding their international marketing efforts. For example,a number of hospitals in the Boston area have begun working cooperatively to attract patients

JUNE 1999Health Care Services Industry, Trade, and Technology Review
13 “Boston area hospitals seek global market,” Marketing News, Mar. 3, 1997. 14 “International Health Alliance offers first online global plans,” PR Newswire, Dec. 15,1998. 15 Ernest D. Plock, “Telemedicine is emerging as a cost-effective health care alternative,”Business America, Jan. 1998. 16 Official of American Telemedicine Association, interview by USITC staff, Washington,DC, June 8, 1999. 17 “BeeZee Launches Telemedicine Centre in Mumbai,” Economic Times, Jan. 2, 1998; andK.S. Nayar, “U.S. Firm Offering Care via Telemedicine,” India Abroad, Apr. 4, 1997. 18 Official of American Telemedicine Association, interview by USITC staff, Washington,DC, June 8, 1999. 19 Standard & Poor’s, Industry Surveys, Healthcare: Facilities, Nov. 19, 1998, pp. 2 and 6. 20 HealthSouth Corporation, “HealthSouth acquires Australian Rehabilitation Hospital,” press
(continued...)
24
from around the world to their facilities.13 The development of new health insurance productsmay further foster cross-border exports of health care services. In December 1998,International Health Alliance introduced a global medical plan that allows policy holders totravel anywhere in the world for treatment.14 This program is specifically marketed to non-U.S. citizens as well as to those who travel frequently for extended periods. A third factorthat may influence cross-border trade in health care services is the increasing use oftelemedicine, which involves providing health care services via telecommunication technology.For example, diagnostic images such as x-rays or magnetic resonance images may betransmitted via the Internet for examination by specialists in another country.15 Theproliferation of applications of telemedicine has spurred formation of demonstration projectsand associations of telemedicine practitioners worldwide.16 As a leading provider of bothhealth care technology and medical expertise, the United States could benefit significantly bythe development of telemedicine applications. U.S. organizations such as Telequest, theUniversity of California San Francisco, and Telemedicine Applications Company, havealready engaged in telemedicine ventures in India.17 Meanwhile, issues concerning the scopeof practice, ethics, licensing, liability, and payment, among others, are currently subject todebate largely in the absence of regulations specifically formulated for such rapidly developinghealth care services.18
International trade of health care services through foreign affiliates is likely to undergocontinued growth as well. The United States remains an attractive market for foreigninvestors, particularly in discrete market segments such as dialysis treatment, while financingconstraints are likely to create opportunities for additional merger and acquisition activity.19
Abroad, the investment climate seems to be showing signs of promise. Many countries arebeginning to embrace participation by private institutions in at least some segments of theirmarket. At the same time, some of the larger U.S. health care companies appear to havestrengthened their domestic position to the extent that they are now exploring internationalopportunities more earnestly. As a result of these factors, U.S. firms appear to be graduallyincreasing their international activities. For example, in October 1997, HealthSouth acquiredthe Cedar Court Physical Rehabilitation Hospital in Melbourne, Australia; and in April 1998,Columbia/HCA acquired 54 percent of the Instituto Dexeus, a private, 110-bed tertiary-carehospital located in Barcelona, Spain.20
JUNE 1999Industry, Trade, and Technology Review Health Care Services
20 (...continued)release of Dec. 5, 1997, found at Internet address http://www.healthsouth.com, retrieved Dec. 1,1998; and “Columbia completes acquisition of majority interest in Instituto Dexeus in Barcelona,Spain,” PR Newswire, Apr. 25, 1998.
25
While there are some inherent impediments to trading health care services, and current globaleconomic conditions appear to be having a deleterious effect, the overall outlook for healthcare trade is promising. The United States continues to hold a leadership role in technologyand quality of care, which should translate into additional international opportunities.Financial limitations pose the principal constraint on the health care field, as even wealthycountries are increasingly having difficulty paying for high-quality treatment for all of theircitizens. However, such financial constraints may also present opportunities for private firmsthat can develop management techniques or serve a market niche so as to offer cost savingswithout compromising the quality of care.#
JUNE 1999Industry, Trade, and Technology Review Key Performance Indicators
A-1
APPENDIX AKEY PERFORMANCE INDICATORS OF SELECTED
INDUSTRIES
~ STEEL (Tracy Quilter, 202-205-3437/[email protected])~ AUTOMOBILES (Laura A. Polly, 202-205-3408/[email protected])~ ALUMINUM (Karl Tsuji, 202-205-3434/[email protected])~ FLAT GLASS (James Lukes, 202-205-3426/[email protected])~ SERVICES (Tsedale Assefa, 202-205-2374/[email protected])

JUNE 1999Key Performance Indicators Industry, Trade, and Technology Review
A-2
STEEL
• All three groups of steelmakers reported lower profitability for the first quarter of 1999 compared to the firstquarter 1998, with integrated steel producers reporting negative profitability. Steel companies cited loweraverage selling prices and increased imports as factors contributing to increasingly competitive markets for steelmill products.
• Qualitech Steel Corp. of Indiana filed for Chapter 11 bankruptcy protection in late March 1999. The mill
began rolling operations in May 1998 and produced its first steel in July 1998, but suffered setbacks due toproduction difficulties, weak markets for the company’s special bar quality and iron carbide products, a fire,and increased import competition.1
_____________1Darrel Hassler, “Sell-offs eyed to rescue Qualitech,” American Metal Market, Mar. 25, 1999, p. 1. Table A-1Steel mill products, all grades
Item Q1 1999
Percentagechange, Q11999 from
Q1 19981 YTD 1999
Percentagechange, YTD
1999 from YTD 19981
Producers’ shipments (1,000 short tons) . . . . . . . . . . . 24,046 -12.0 24,046 -12.0
Imports (1,000 short tons) . . . . . . . . . . . . . . . . . . . . . . 7,849 2.6 7,849 2.6
Exports (1,000 short tons) . . . . . . . . . . . . . . . . . . . . . . 1,161 -28.3 1,161 -28.3
Apparent supply (1,000 short tons) . . . . . . . . . . . . . . . 30,733 -7.9 30,733 -7.9
Ratio of imports to apparent supply (percent) . . . . . . . . 25.5 22.6 25.5 22.6
1Based on unrounded numbers. 2Percentage point change.
Note.–Because of rounding, figures may not add to the totals shown.Source: American Iron and Steel Institute.
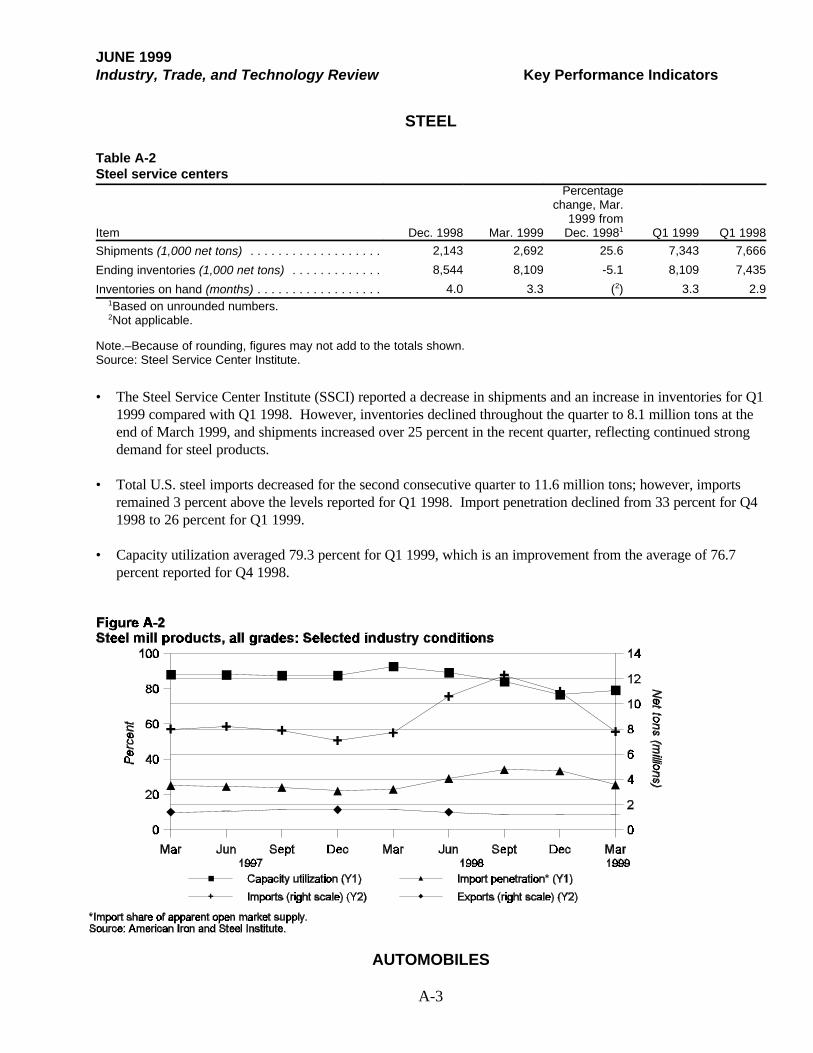
JUNE 1999Industry, Trade, and Technology Review Key Performance Indicators
A-3
STEEL
Table A-2Steel service centers
Item Dec. 1998 Mar. 1999
Percentagechange, Mar.
1999 from Dec. 19981 Q1 1999 Q1 1998
Shipments (1,000 net tons) . . . . . . . . . . . . . . . . . . . 2,143 2,692 25.6 7,343 7,666
Ending inventories (1,000 net tons) . . . . . . . . . . . . . 8,544 8,109 -5.1 8,109 7,435
Inventories on hand (months) . . . . . . . . . . . . . . . . . . 4.0 3.3 (2) 3.3 2.9 1Based on unrounded numbers. 2Not applicable.
Note.–Because of rounding, figures may not add to the totals shown.Source: Steel Service Center Institute.
• The Steel Service Center Institute (SSCI) reported a decrease in shipments and an increase in inventories for Q11999 compared with Q1 1998. However, inventories declined throughout the quarter to 8.1 million tons at theend of March 1999, and shipments increased over 25 percent in the recent quarter, reflecting continued strongdemand for steel products.
• Total U.S. steel imports decreased for the second consecutive quarter to 11.6 million tons; however, importsremained 3 percent above the levels reported for Q1 1998. Import penetration declined from 33 percent for Q41998 to 26 percent for Q1 1999.
• Capacity utilization averaged 79.3 percent for Q1 1999, which is an improvement from the average of 76.7percent reported for Q4 1998.
AUTOMOBILES

JUNE 1999Key Performance Indicators Industry, Trade, and Technology Review
A-4
I II III IV I II III IV I II III IV I II III IV I
0
500
1000
1500
2000
2500
Total sales-consumption Domestic sales
Import sales
Figure A-3U.S. sales of new passenger automobiles, by quarter
Note.--Domestic sales include all automobiles assembled in Canada and imported into the United States under the UnitedStates-Canadian automobile agreement; these same units are not included in import sales.
Source: Automotive News; prepared by the Office of Industries.
2,016,190
1,645,223
370,967
1995 1996 1997 1998 1999
Table A-3U.S. sales of new automobiles, domestic and imported, and share of U.S. market accounted forby sales of total imports and Japanese imports, by specified periods, January 1998-March 1999
Percentage change
ItemJan.-Mar.
1999
Jan.-Mar. 1999from
Oct.-Dec. 1998
Jan.-Mar. 1999from
Jan.-Mar. 1998U.S. sales of domestic autos
(1,000 units)1 . . . . . . . . . . . . . . . . . . . . . . . . . . . . . . . . . . . 1,645 1.6 6.3U.S. sales of imported autos
(1,000 units)2 . . . . . . . . . . . . . . . . . . . . . . . . . . . . . . . . . . . 371 5.4 13.9Total U.S. sales (1,000 units)1, 2 . . . . . . . . . . . . . . . . . . . . . . . 2,016 2.3 7.7Ratio of U.S. sales of imported autos to
total U.S. sales (percent)1, 2 . . . . . . . . . . . . . . . . . . . . . . . . 18.4 3.0 5.8U.S. sales of Japanese imports as a
share of the total U.S. market (percent)1, 2 . . . . . . . . . . . . . . 9.3 0.0 7.51 Domestic automobile sales include U.S.-, Canadian-, and Mexican-built automobiles sold in the United States.2 Does not include automobiles imported from Canada and Mexico.
Source: Compiled from data obtained from Automotive News.
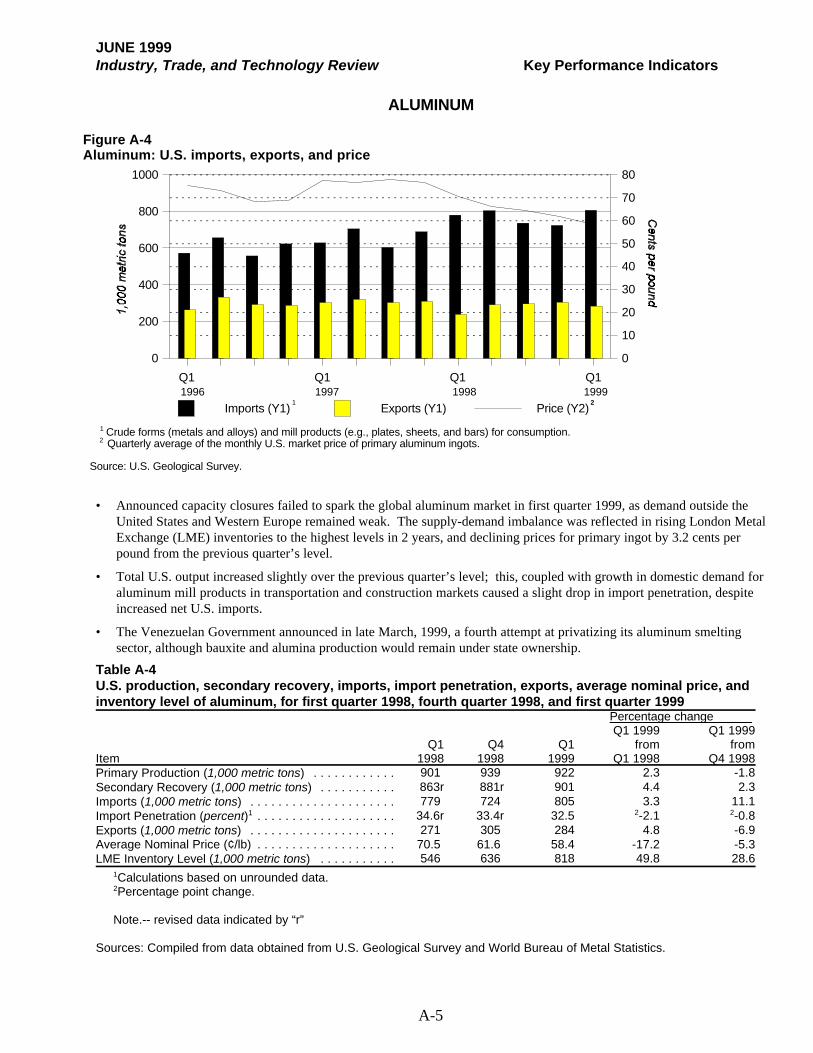
JUNE 1999Industry, Trade, and Technology Review Key Performance Indicators
A-5
Q1 Q1 Q1 Q1
0
200
400
600
800
1000
0
10
20
30
40
50
60
70
80
Imports (Y1) Exports (Y1) Price (Y2)
Figure A-4Aluminum: U.S. imports, exports, and price
1 Crude forms (metals and alloys) and mill products (e.g., plates, sheets, and bars) for consumption. 2 Quarterly average of the monthly U.S. market price of primary aluminum ingots.
Source: U.S. Geological Survey.
1 21996 1997 1998 1999
ALUMINUM
• Announced capacity closures failed to spark the global aluminum market in first quarter 1999, as demand outside theUnited States and Western Europe remained weak. The supply-demand imbalance was reflected in rising London MetalExchange (LME) inventories to the highest levels in 2 years, and declining prices for primary ingot by 3.2 cents perpound from the previous quarter’s level.
• Total U.S. output increased slightly over the previous quarter’s level; this, coupled with growth in domestic demand for
aluminum mill products in transportation and construction markets caused a slight drop in import penetration, despiteincreased net U.S. imports.
• The Venezuelan Government announced in late March, 1999, a fourth attempt at privatizing its aluminum smelting
sector, although bauxite and alumina production would remain under state ownership. Table A-4U.S. production, secondary recovery, imports, import penetration, exports, average nominal price, andinventory level of aluminum, for first quarter 1998, fourth quarter 1998, and first quarter 1999
Percentage change
ItemQ1
1998Q4
1998Q1
1999
Q1 1999from
Q1 1998
Q1 1999from
Q4 1998Primary Production (1,000 metric tons) . . . . . . . . . . . . 901 939 922 2.3 -1.8Secondary Recovery (1,000 metric tons) . . . . . . . . . . . 863r 881r 901 4.4 2.3Imports (1,000 metric tons) . . . . . . . . . . . . . . . . . . . . . 779 724 805 3.3 11.1Import Penetration (percent)1 . . . . . . . . . . . . . . . . . . . . 34.6r 33.4r 32.5 2-2.1 2-0.8Exports (1,000 metric tons) . . . . . . . . . . . . . . . . . . . . . 271 305 284 4.8 -6.9Average Nominal Price (¢/lb) . . . . . . . . . . . . . . . . . . . . 70.5 61.6 58.4 -17.2 -5.3LME Inventory Level (1,000 metric tons) . . . . . . . . . . . 546 636 818 49.8 28.6
1Calculations based on unrounded data. 2Percentage point change.
Note.-- revised data indicated by “r”
Sources: Compiled from data obtained from U.S. Geological Survey and World Bureau of Metal Statistics.

JUNE 1999Key Performance Indicators Industry, Trade, and Technology Review
1 Flat glass is largely unworked; safety glass (tempered or laminated) and insulating glass are also covered under the U.S.-Japanese agreement on flat glass.
2 USITC, “Flat glass,” Industry, Trade, and Technology Review, Oct. 1997, p. 42.
3 USITC, “Flat glass,” Industry, Trade, and Technology Review, June 1998, p. 37.
4 U.S. Trade Representative, “1999 Trade Policy Agenda,” downloaded from http://www.ustr.gov/tpa/1999/index.html onMar. 18, 1999.
A-6
FLAT GLASS
Background • The U.S.-Japanese agreement on Japanese market access for imports of flat glass1 seeks to increase access and
sales of foreign flat glass in Japan through such means as increased adoption of nondiscriminatory standardsand expanded promotion of safety and insulating glass.2 The agreement covers the 1995-99 period.
• Japanese demand for imported glass began weakening in the second half of 1997. The Asian financial crisis and
an increase in the Japanese consumption tax from 3 to 5 percent likely were contributing factors.3 Current • Japanese demand for imported glass has continued to weaken, although the U.S. share of the market has
improved. The average monthly quantity of Japanese imports from all countries decreased by 3 percent for thefirst two months of 1999 to 1.5 million square meters, while the average monthly value of such importsincreased by 8 percent to $11.8 million as the average unit value of imports increased by 11 percent. Importsfrom the United States in Jan.-Feb. 1999 increased 6 and 8 percent to 468,000 square meters ($6.5 million),respectively. The shift to an increase in imports from the United States occurred as the U.S. dollar appreciatedagainst the Japanese yen, and the average unit value of imports from the United States increased by 1 percent,compared with an average increase of 16 percent for imports from other countries.
• Flat glass continues to be considered a key sector in efforts by the U.S. Government to obtain genuine
deregulation of the Japanese economy and greater market opening.4
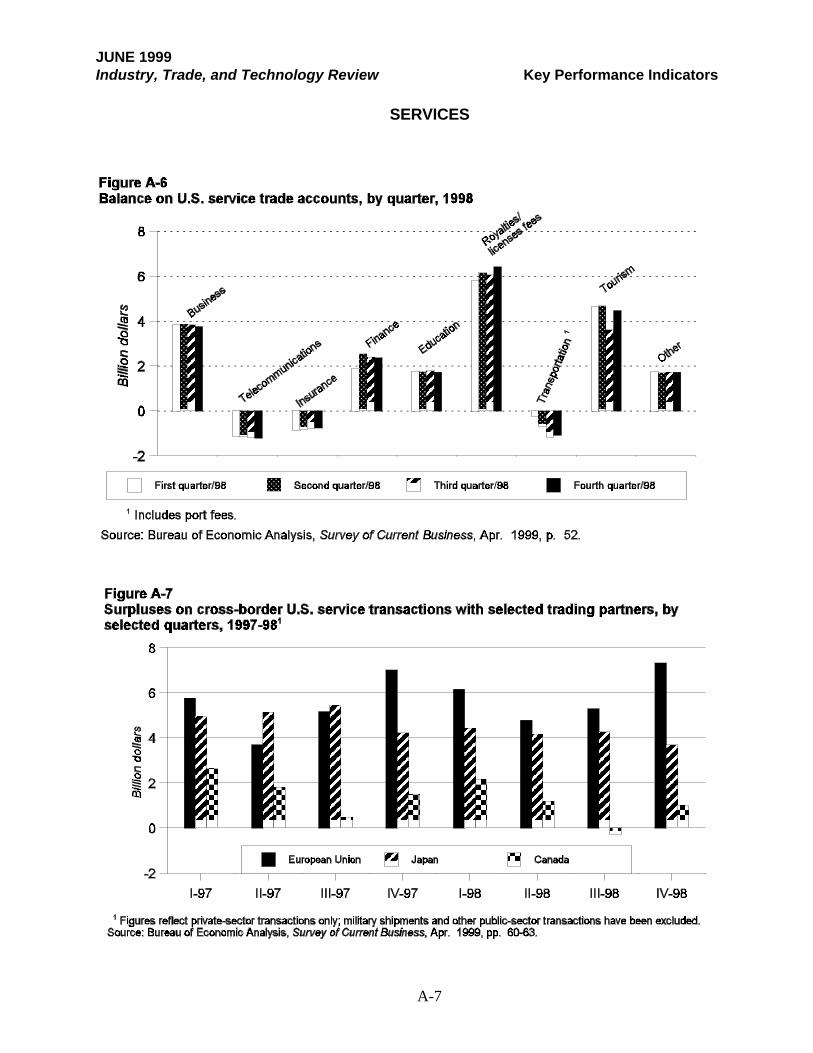
JUNE 1999Industry, Trade, and Technology Review Key Performance Indicators
A-7
SERVICES