office of health care ombudsman and bill of rights … · office of health care ombudsman and bill...
TRANSCRIPT

Office of Health Care Ombudsman and Bill of Rights (OHCOBR)
FY2014 Summary of Cases
October 1, 2013 through September 30, 2014
“The Knowledge to Guide You”

Office of Health Care Ombudsman and Bill of Rights (OHCOBR)Highlights - FY2014 Contact Summary Table of Contents
Highlights – FY2014 Contact Summary 3
Summary of Activities –FY2014 4
Number and Percentage of Opened Cases Among All Contacts—(Non-Commercial); (Commercial-Non-Appeals/Grievances-Bill of Rights); and (Commercial-Appeals/Grievances-Bill of Rights) 5-6
Number and Percentage of Closed/Resolved Cases Among (Non-Commercial) Contacts 7-8
Number and Percentage of Closed/Resolved Cases Among (Commercial-Non-Appeals/Grievances-Bill of Rights) Contacts 9-10
Number and Percentage of Closed/Resolved Cases Among (Commercial-Appeals/Grievances-Bill of Rights) Contacts 11-12
Methods of Contacting OHCOBR 13-14
Categories of Contacts by Insurance Type 15-16
Contacts by Wards and States Located Within the DC Metropolitan Area and States Located Outside of the DC Metropolitan Area 17-18
Breakdown of Types of Issues Encountered by All Contacts—(Non-Commercial); (Commercial-Non-Appeals/Grievances-Bill of Rights); and(Commercial-Appeals/Grievances-Bill of Rights) 20-21
Breakdown of Types of Issues Encountered by (Non-Commercial) Contacts 22-23
Breakdown of Types of Issues Encountered by (Commercial-Non-Appeals/Grievances-Bill of Rights) Contacts 24-25
Breakdown of Types of Issues Encountered by (Commercial-Appeals/Grievances-Bill of Rights) Contacts 26-27
Breakdown of Dispositions Among All (Commercial-Appeals/Grievances-Bill of Rights) Contacts 28
Breakdown of Types of Issues Encountered by Dual Eligible (Medicare and Medicaid) Contacts 29-30
Breakdown of Types of Issues Encountered by Medicaid (Fee –For-Service) Contacts 31-32
Breakdown of Types of Issues Encountered by Medicare Part A; Part B; Part A/B; Part A/B (QMB) Contacts 33-34
Breakdown of Types of Issues Encountered by Medicaid Managed Care (MCO) Contacts 35-36
Breakdown of Types of Issues Encountered by Alliance Contacts 37-38
Breakdown of Types of Issues Encountered by Uninsured Contacts 39-40
Breakdown of Transportation Contacts by Insurance Type and Issues Encountered by Contacts 41-44
Breakdown of EPD Waiver Contacts by Insurance Type and Issues Encountered by EPD Waiver Contacts 45-48
Breakdown of Types of Issues Encountered by DC Health Link and Health Exchange Marketplace Contacts 49-50
Dollar Amount of Savings on Behalf of (Non-Commercial); (Commercial-Non-Appeals/Grievances-Bill of Rights) and (Commercial-Appeals/Grievances-Bill of Rights) Contacts 51-52
Average Number of Days to Close/Resolve (Non-Commercial) Cases 53-54
Average Number of Days to Close/Resolve (Commercial-Non-Appeals/Grievances-Bill of Rights) Cases 55-56
Average Number of Days to Close/Resolve (Commercial-Appeals/Grievances-Bill of Rights) Cases 57-58
Breakdown of Number and Percentage of How (Non-Commercial) Cases Were Closed/Resolved by the OHCOBR 59-60
Breakdown of Number and Percentage of How (Commercial-Non-Appeals/Grievances-Bill of Rights) Cases Were Closed/Resolved by the OHCOBR 61-62
Breakdown of Number and Percentage of How (Commercial-Appeals/Grievances-Bill of Rights) Cases Were Closed/Resolved by the OHCOBR 63-64

Office of Health Care Ombudsman and Bill of Rights (OHCOBR)
Highlights - FY2014 Contact Summary
• In FY2014, the Office of Health Care Ombudsman and Bill of Rights opened a grand total of (7,904) Non-Commercial and Commercial cases - (See Pages 5 & 6); • Of the (7,904) cases opened - (7,712) cases were Non-Commercial - (See Pages 5 & 6); • Percentage of closed/resolved Non-Commercial cases was (95% or 7,304 closed/resolved cases) out of a total of (7,712) Non-Commercial cases opened) – (See Pages 7 & 8); • In FY2014, the Average Number of Days for the Office of Health Care Ombudsman and Bill of Rights to close/resolve Non-Commercial cases was (2) days -(See Pages 53 & 54); • Of the (7,712) Non-Commercial cases opened in FY2014, the Office of Health Care Ombudsman and Bill of Rights closed/resolved (6,472) cases on same day that cases were opened - (See Pages 53 & 54); • Of the grand total of (7,904) cases opened by the Office of Health Care Ombudsman and Bill of Rights – (192) cases were among the Commercial Health Plan Members – (See Pages 5 & 6);
• Of the (192) Commercial cases opened – (59) cases were Commercial-Non-Appeals/Grievances - (See Pages 5 & 6); • Percentage of closed/resolved Commercial-Non-Appeals/Grievances cases was (73% or 43 closed/resolved cases) out of a total of (59) Commercial-Non-Appeals/Grievances cases opened - (See Pages 9 & 10); • In FY2014, the Average Number of Days for the Office of Health Care Ombudsman and Bill of Rights to close/resolve Commercial-Non-Appeals/Grievances cases was (0) days - (See Pages 55 & 56); • Of the (59) Commercial-Non-Appeals/Grievances cases opened in FY2014, the Office of Health Care Ombudsman and Bill of Rights closed/resolved (41) cases on same day that cases were opened - (See Pages 55 & 56);
• Of the (192) Commercial cases opened – (133) cases were Commercial-Appeals/Grievances - (See Pages 5 & 6); • Percentage of closed/resolved Commercial-Appeals/Grievances cases was (36% or 48 closed/resolved cases) out of a total of (133) commercial-appeals/grievances cases opened - (See Pages 11 & 12); • In FY2014, the Average Number of Days for the Office of Health Care Ombudsman and Bill of Rights to close/resolve Commercial-Appeals/Grievances cases was (87.7) days - (See Pages 57 & 58); • Of the (133) Commercial-Appeals/Grievances cases opened in FY2014, the Office of Health Care Ombudsman and Bill of Rights closed/resolved (53) cases on same day that cases were opened - (See Pages 57 & 58);
• On behalf of consumers, the Office of Health Care Ombudsman and Bill of Rights saved consumers a total dollar amount of ($932,651.62). Of the total dollar amount
saved, $457,240.56 (49%) was from Commercial-Appeals/Grievances cases; $25,991.07 (2%) was removed from beneficiaries’ accounts for QMB (Co-Pays); $26,803.43 (2%) was for reimbursements to beneficiaries due to non-payment of Medicare Part B Premiums; and $422,616.56 (47%) was for Other-(Money saved or recouped for Fee-for-Service, MCO and Alliance beneficiaries - (See Pages 51 & 52);
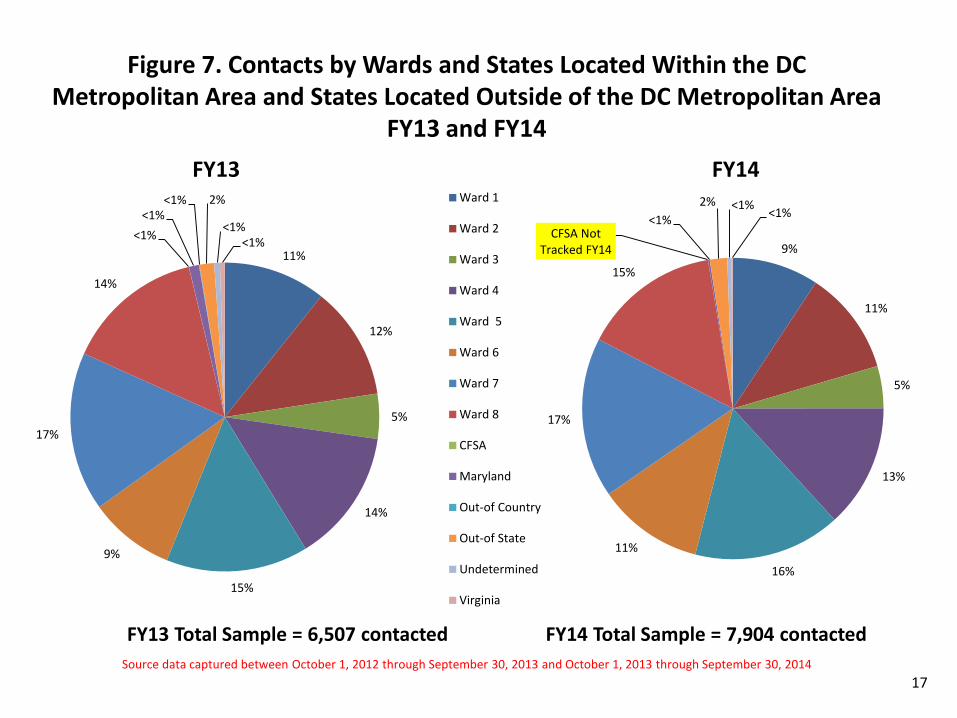
• Of the (162) Administrative/Fair Hearing cases filed by the Office of Health Care Ombudsman and Bill of Rights (13% or 85 cases) were filed on behalf of EPD Waiver beneficiaries - (See Pages 20, 21, 47 & 48); • Most consumers utilized the telephone to contact the Office of Health Care Ombudsman and Bill of Rights—(94% or 7,462 contacts) (See Pages 13 & 14); • Most contacts made to the Office of Health Care Ombudsman and Bill of Rights’ were by Medicare Part A; Part B; Part A/B or Part A/B (QMB) beneficiaries - (See Pages 15 & 16); • Consumers from all Wards and States located within and outside of the DC Metropolitan Area contacted the Office of Health Care Ombudsman and Bill of Rights. (Ward (7) had the highest number of contacts, followed by Ward (5), and Ward (8) - (See Pages 17 & 18); • Eligibility issues represented the largest category of issues encountered by all consumers - (See Pages 20 & 21); • Eligibility issues represented the largest category of issues encountered by MCOs and Alliance beneficiaries – (See Pages 35, 36, 37 & 38); • Access/Coverage issues (to include denials) represented the largest category of issues encountered by Dual Eligible (Medicaid/Medicare), and Medicaid (FFS) - (See Pages 29, 30, 31 & 32); • Other issues represented the largest category of issues encountered by Medicare Part A; Part B; Part A/B or Part A/B (QMB) beneficiaries - (See Pages 33 & 34); • The Office of Health Care Ombudsman and Bill of Rights opened a total of (148) Transportation Cases in FY2014, versus the (107) Transportation cases opened in FY2013 – (See Pages 41 & 42); • The Office of Health Care Ombudsman and Bill of Rights opened a total of (678) EPD Waiver Cases in FY2014, versus the (618) EPD Waiver cases opened in FY2013 – (See Pages 45 & 46); and • In FY 2014, the Office of Health Care Ombudsman and Bill of Rights opened a total of (252) DC Health Link cases - (See Pages 49 & 50).
Source data captured between October 1, 2013 through September 30, 2014
3

Office of Health Care Ombudsman and Bill of Rights (OHCOBR) FY2014
Summary of Activities • During Fiscal Year 2014, the OHCOBR has tracked all communications, or contacts received. The OHCOBR classified all contacts as “cases” which the OHCOBR investigated and strived to bring
closure. The OHCOBR staff recorded all contacts in a specially designed database system – Ombudsman In-Take Data System (OIDS) that has specific categories for classifying different cases. These findings summarize data from the In-Take Tracking Log for the Fiscal Year 2014 (October 1, 2013 through September 30, 2014).
• In summarizing the activities from the Ombudsman In-Take Data System (OIDS), the OHCOBR sought to answer the following key questions:
• How do DC residents contact the Office of Health Ombudsman and Bill of Rights?
• Who contacts the Office of Health Care Ombudsman and Bill of Rights?
• What are the most common issues experienced by the community?
• During Fiscal Year 2014, the OHCOBR received a total of (556) contacts by individuals (consumers) who were repeat users.
• The following sections present findings from the Health Care Ombudsman’s In-Take Tracking Log, specifically:
• Number and Percentage of Opened Cases Among All Contacts—(Non-Commercial); (Commercial-Non-Appeals/Grievances-Bill of Rights); and (Commercial-Appeals/Grievances-Bill of Rights);
• Number and Percentage of Closed/Resolved Cases Among (Non-Commercial) Contacts;
• Number and Percentage of Closed/Resolved Cases Among (Commercial-Non-Appeals/Grievances-Bill of Rights) Contacts;
• Number and Percentage of Closed/Resolved Cases Among (Commercial-Appeals/Grievances-Bill of Rights) Contacts;
• Methods of Contacting OHCOBR;
• Categories of Contacts by Insurance Type;
• Contacts by Wards and States Located Within the DC Metropolitan Area and States Located Outside of the DC Metropolitan Area;
• Breakdown of Types of Issues Encountered by All Contacts—(Non-Commercial); (Commercial-Non-Appeals/Grievances-Bill of Rights); and (Commercial-Appeals/Grievances-Bill of Rights);
• Breakdown of Types of Issues Encountered by (Non-Commercial) Contacts;
• Breakdown of Types of Issues Encountered by (Commercial-Non-Appeals/Grievances-Bill of Rights) Contacts;
• Breakdown of Types of Issues Encountered by (Commercial-Appeals/Grievances-Bill of Rights) Contacts;
• Breakdown of Dispositions Among All (Commercial-Appeals/Grievances-Bill of Rights) Contacts;
• Breakdown of Types of Issues Encountered by Dual Eligible (Medicare and Medicaid) Contacts;
• Breakdown of Types of Issues Encountered by Medicaid (FFS) Contacts;
• Breakdown of Types of Issues Encountered by Medicare Part A; Part B; Part A/B; Part A/B (QMB) Contacts;
• Breakdown of Types of Issues Encountered by Medicaid Managed Care (MCO) Contacts;
• Breakdown of Types of Issues Encountered by Alliance Contacts;
• Breakdown of Types of Issues Encountered by Uninsured Contacts;
• Breakdown of Transportation Contacts by Insurance Type and Issues Encountered by Contacts;
• Breakdown of EPD Waiver Contacts by Insurance Type and Issues Encountered by EPD Waiver Contacts;
• Breakdown of Types of Issues Encountered by DC Health Link and Health Exchange Marketplace Contacts;
• Dollar Amount of Savings on Behalf of (Non-Commercial); (Commercial-Non-Appeals/Grievances-Bill of Rights) and (Commercial-Appeals/Grievances-Bill of Rights) Contacts;
• Average Number of Days to Close/Resolve (Non-Commercial) Cases;
• Average Number of Days to Close/Resolve (Commercial-Non-Appeals/Grievances-Bill of Rights) Cases;
• Average Number of Days to Close/Resolve (Commercial-Appeals/Grievances-Bill of Rights) Cases;
• Breakdown of Number and Percentage of How (Non-Commercial) Cases Were Closed/Resolved by the OHCOBR;
• Breakdown of Number and Percentage of How (Commercial-Non-Appeals/Grievances-Bill of Rights) Cases Were Closed/Resolved by the OHCOBR; and
• Breakdown of Number and Percentage of How (Commercial-Appeals/Grievances-Bill of Rights) Cases Were Closed/Resolved by the OHCOBR.
Source data captured between October 1, 2013 through September 30, 2014
4

Figure 1. Total Number and Percentage of Opened Cases Among All Contacts--(Non-Commercial); (Commercial-Non-Appeals/Grievances-Bill of
Rights); and (Commercial-Appeals/Grievances-Bill of Rights) Contacts FY13 and FY14
FY13 Total Sample = 6,507 contacted FY14 Total Sample = 7,904 contacted
Source data captured between October 1, 2012 through September 30, 2013 and October 1, 2013 through September 30, 2014
FY13 FY14
5
96%
1% 3%
Non-Commercial Cases
Commerical (Non-Appeals/Grievances
Commercial(Appeals/Grievances - Billof Rights) Cases
97%
1% 2%

Table 1. Total Number and Percentage of Opened Cases Among All Contacts--(Non-Commercial); (Commercial-Non-Appeals/Grievances-Bill of
Rights); and (Commercial-Appeals/Grievances-Bill of Rights) Contacts FY13 and FY14
Opened Cases Among All Contacts
FY13 Totals
FY13 Percent
(%)
FY14 Totals
FY14 Percent (%)
Non-Commercial Cases 6233 96% 7712 97%
Commercial (Non-Appeals/Grievances) Cases
100 1% 59 1%
Commercial (Appeals/Grievances—Bill of Rights) Cases
174 3% 133 2%
Total (Non-Commercial); (Commercial-Non-Appeals/Grievances-Bill of Rights); (Commercial-Appeals/Grievances-Bill of Rights) Opened Cases
6,507 100% 7,904 100%
Source data captured between October 1, 2012 through September 30, 2013 and October 1, 2013 through September 30, 2014
6

99%
1%
CasesClosed/Resolved
Cases Not YetClosed/Resolved
95%
5%
Figure 2. Number and Percentage of Closed/Resolved Cases Among (Non-Commercial) Contacts
FY13 and FY14
FY13 Total Sample = 6,233 contacted FY14 Total Sample = 7,712 contacted
Source data captured between October 1, 2012 through September 30, 2013 and October 1, 2013 through September 30, 2014
FY13 FY14
7

Table 2. Number and Percentage of Closed/Resolved Cases Among (Non-Commercial) Contacts
FY13 and FY14
Closed/Resolved Cases (Non-Commercial)
FY13 Totals
FY13 Percent
(%)
FY14 Totals
FY14 Percent (%)
Cases Closed/Resolved 6,178 99% 7,304 95%
Cases Not Yet Closed/Resolved 55 1% 408 5%
Total (Non-Commercial) Contacts/Cases
6,233 100% 7,712 100%
Source data captured between October 1, 2012 through September 30, 2013 and October 1, 2013 through September 30, 2014
8

Figure 3. Number and Percentage of Closed/Resolved Cases Among (Commercial-Non-Appeals/Grievances-Bill of Rights) Contacts
FY13 and FY14
FY13 Total Sample = 100 contacted FY14 Total Sample = 59 contacted
Source data captured between October 1, 2012 through September 30, 2013 and October 1, 2013 through September 30, 2014
FY13 FY14
9
96%
4%
Cases Closed/Resolved
Cases Not YetClosed/Resolved
73%
27%

Table 3. Number and Percentage of Closed/Resolved Cases Among (Commercial-Non-Appeals/Grievances-Bill of Rights) Contacts
FY13 and FY14
Closed/Resolved Cases (Commercial-Non-
Appeals/Grievances-Bill of Rights)
FY13 Totals
FY13 Percent
(%)
FY14 Totals
FY14 Percent (%)
Cases Closed/Resolved 96 96% 43 73%
Cases Not Yet Closed/Resolved 4 4% 16 27%
Total (Commercial-Non-Appeals/Grievances-Bill of Rights) Contacts/Cases
100 100% 59 100%
Source data captured between October 1, 2012 through September 30, 2013 and October 1, 2013 through September 30, 2014
10

Figure 4. Number and Percentage of Closed/Resolved Cases Among (Commercial-Appeals/Grievances-Bill of Rights) Contacts
FY13 and FY14
FY13 Total Sample = 174 contacted FY14 Total Sample = 133 contacted
Source data captured between October 1, 2012 through September 30, 2013 and October 1, 2013 through September 30, 2014
FY13 FY14
11
73%
27%
Cases Closed/Resolved
Cases Not YetClosed/Resolved
36%
64%

Table 4. Number and Percentage of Closed/Resolved Cases Among (Commercial-Appeals/Grievances-Bill of Rights) Contacts
FY13 and FY14
Closed/Resolved Cases (Commercial-Appeals/Grievances-Bill of Rights)
FY13 Totals
FY13 Percent
(%)
FY14 Totals
FY14 Percent
(%)
Appeals/Grievances Cases Closed/Resolved 127 73% 48 36%
Appeals/Grievances Cases Not Yet Closed 47 27% 85 64%
Total (Commercial-Appeals/Grievances-Bill of Rights) Contacts/Cases
174 100% 133 100%
Source data captured between October 1, 2012 through September 30, 2013 and October 1, 2013 through September 30, 2014 12

Figure 5. Methods of Contacting OHCOBR FY13 and FY14
FY13 FY14
FY13 Total Sample = 6,507 contacted FY14 Total Sample = 7,904 contacted
Source data captured between October 1, 2012 through September 30, 2013 and October 1, 2013 through September 30, 2014
13
<1%
3%
<1%
2%
1%
91%
2%
Appointment
Fax
Letter
OHCOBR’s Website
Telephone
Walk-In
<1% 1% <1%
2%
1%
94%
1%

Methods of Contacting OHCOBR FY13 Totals
FY13 Contacts
(%)
FY14 Totals
FY14 Contacts
(%)
Appointment 2 <1% 27 <1%
Email 226 3% 101 1%
Fax 22 <1% 11 <1%
Letter 151 2% 146 2%
OHCOBR’s Website 93 1% 80 1%
Telephone 5901 91% 7462 94%
Walk-In 112 2% 77 1%
Total Methods of Contacting OHCOBR 6,507 100% 7,904 100%
Table 5. Methods of Contacting OHCOBR FY13 and FY14
Source data captured between October 1, 2012 through September 30, 2013 and October 1, 2013 through September 30, 2014 14

Figure 6. Categories of Contacts by Insurance Type FY13 and FY14
FY13 Total Sample = 6,507 contacted FY14 Total Sample = 7,904 contacted
Source data captured between October 1, 2012 through September 30, 2013 and October 1, 2013 through September 30, 2014
FY13 FY14
15
3% 2%
21%
20%
19%
31%
1% 3% 4% 4%
23%
16% 21%
28%
1% 3% Alliance (includes Alliance/ADAP)
Commercial Health Plan (includes Non-Appeals/Grievances and Appeals/Grievances-Bill ofRights cases)Dual Eligible (Medicaid/Medicare) – (includes QMB/Long-Term Care/Money Follows the Person/Spend-Down Beneficiaries) Medicaid Fee-for-Service (FFS)
Medicaid Managed Care (MCO) – (includes Childless Adult/SCHIP/AFDC-TANF/Katie Beckett/TANF/ Undocumented Alien Child Beneficiaries) Medicare Part A; Part B; Part A/B; Part A/B (QMB)and SLIMB Beneficiaries)
Other (includes Out-of-State MedicaidCoverage/ADAP/Undetermined)

Table 6. Categories of Contacts by Insurance Type FY13 and FY14
Source data captured between October 1, 2012 through September 30, 2013 and October 1, 2013 through September 30, 2014
Categories of Insurance Type FY13 Totals
FY13 Contacts
(%)
FY14 Totals
FY14 Contacts
(%)
Alliance (includes Alliance/ADAP) 263 4% 238 3%
Commercial Health Plan (includes Non-Appeals/Grievances
and Appeals/Grievances-Bill of Rights cases) 274 4% 192 2%
Dual Eligible (Medicaid/Medicare) – (includes
QMB/Long-Term Care/Money Follows the Person/Spend-Down Beneficiaries)
1485 23% 1667 21%
Medicaid Fee-for-Service (FFS) 1035 16% 1599 20%
Medicaid Managed Care (MCO) – (includes Childless
Adult/SCHIP/AFDC-TANF/Katie Beckett/TANF/ Undocumented Alien Child Beneficiaries)
1366 21% 1499 19%
Medicare – (includes Part A; Part B; Part A/B; Part A/B
(QMB) and SLIMB Beneficiaries) 1820 28% 2436 31%
Other (includes Out-of-State Medicaid Coverage/ ADAP/Undetermined)
56 1% 40 1%
Uninsured 208 3% 233 3%
Total Contacts by Insurance Type 6507 100% 7904 100%
16
11%
12%
5%
14%
15%
9%
17%
14%
<1%
<1% <1% 2%
<1% <1%
Ward 1
Ward 2
Ward 3
Ward 4
Ward 5
Ward 6
Ward 7
Ward 8
CFSA
Maryland
Out-of Country
Out-of State
Undetermined
Virginia
Figure 7. Contacts by Wards and States Located Within the DC Metropolitan Area and States Located Outside of the DC Metropolitan Area
FY13 and FY14
FY13 Total Sample = 6,507 contacted FY14 Total Sample = 7,904 contacted
Source data captured between October 1, 2012 through September 30, 2013 and October 1, 2013 through September 30, 2014 17
FY13 FY14
9%
11%
5%
13%
16%
11%
17%
15%
CFSA Not Tracked FY14
<1%
2% <1% <1%

Contacts by Wards and States Located Within the DC Metropolitan Area and States Located Outside of the DC
Metropolitan Area
FY13 Totals
FY13 Contacts
(%)
FY14 Totals
FY14 Contacts
(%)
Ward 1 698 11% 733 9%
Ward 2 770 12% 883 11%
Ward 3 307 5% 358 5%
Ward 4 908 14% 1046 13%
Ward 5 969 15% 1249 16%
Ward 6 584 9% 900 11%
Ward 7 1083 17% 1358 17%
Ward 8 944 14% 1168 15%
Child and Family Services Agency (CFSA) 1 < 1% NOT TRACKED NOT TRACKED
Maryland (Located Within the DC Metropolitan Area) 68 < 1% 15 <1%
Out-of Country 4 < 1% 0 0%
Out-of State (States Located Outside of the DC Metropolitan Area) 99 2% 147 2%
Undetermined 39 < 1% 35 <1%
Virginia (Located Outside of the DC Metropolitan Area) 33 < 1% 12 <1%
Total Contacts by Wards and States Located Within the DC Metropolitan Area and States Located Outside of the DC Metropolitan Area
6507 100% 7904 100%
Table 7. Contacts by Wards and States Located Within the DC Metropolitan Area and States Located Outside of the DC Metropolitan Area
FY13 and FY14
Source data captured between October 1, 2012 through September 30, 2013 and October 1, 2013 through September 30, 2014
18

Types of Issues Encountered
The following issues were encountered by Consumers:
Access/Coverage (includes denials):
• Access: Administrative hearings; appeals/grievances (Bill of Rights); health care benefits to include: uninsured; DC Health Link; Health Exchange Market insurance plans; commercial insurance; Medicaid, Medicare; Buy-In; Qualified Medicare Beneficiary benefits (QMB); long-term care; home health agency services (EPD and State Waiver Plan), MCO enrollment; and Part D prescription plan. Assisted beneficiaries in securing medical; dental; durable medical equipment (DME); non-emergency transportation services or appointments. Assisted in obtaining prior authorizations for health related services to include home health agency services; and assistance in securing medications; methods of co-payments; and filling prescriptions, etc.
• Coverage: Denials of health related services (medical, dental, optical, durable medical equipment (DME), home health, non- emergency transportation, and prescriptions services, etc.).
Eligibility: Determining eligibility, status of eligibility, verification of eligibility for health care programs; assistance with enrollment or recertification in health care programs; explanation of Qualified Medicare Beneficiary (QMB) benefits, and assisting with termination of coverage, etc.
Quality of Service: Medical, dental, durable medical equipment (DME), in-patient services, out-patient services, home health services, long-term care, optical services, and non-emergency transportation services, etc.
Non-Payment/Reimbursement Issues: Non-payment of bills (medical, dental, hospital, emergency room bills, and co-pays, to include QMB co-pays, and Part B premiums), reimbursement of out-of-pocket expenses (medical, hospital, dental bills, co-pays to include QMB co-pays, etc.).
Other Issues: Anomalous and generic complaints such as auto repairs; banking issues; burial assistance; death certificates; duplicate QMB ID cards; food stamps; fraud-Medicaid/Medicare; housing assistance; legal services; name/address change; names misspelled on QMB ID cards; non-receipt-QMB ID cards; replacement of Medicaid/Medicare/MCO/QMB ID cards; and responses to Department of Health Care Finance’s correspondence mailed to DC Medicaid beneficiaries regarding issues that affected their coverage, etc.
Source data captured between October 1, 2012 through September 30, 2013 and October 1, 2013 through September 30, 2014
19

Figure 8. Breakdown of Types of Issues Encountered by All Contacts – (Non-Commercial); (Commercial-Non-Appeals/Grievances-Bill of Rights); and
(Commercial-Appeals/Grievances-Bill of Rights) FY13 and FY14
FY13 FY14
FY13 Total Sample = 6,507 contacted FY14 Total Sample = 7,904 contacted
*Other Issues: Anomalous and generic complaints such as auto repairs; banking issues; burial assistance; death certificates; duplicate QMB ID cards; food stamps;
fraud-Medicaid/Medicare; housing assistance; legal services; name/address change; names misspelled on QMB ID cards; non-receipt-QMB cards; replacement of Medicaid/Medicare/MCO/QMB ID cards; and responses to Department of Health Care Finance’s (DHCF) correspondence mailed to DC Medicaid beneficiaries regarding issues that affected their coverage; etc.
Source data captured between October 1, 2012 through September 30, 2013 and October 1, 2013 through September 30, 2014
20
2% 1% 3%
29%
35%
7%
19%
4% Access (Administrative Hearings)
Access (Commercial-Non-Appeals/Grievances-Bill of Rights)
Access (Commercial-Appeals/Grievances-Bill ofRights)
Access/Coverage (includes denials)
Eligibility
Non-Payment/Reimbursement (Out-of-PocketExpenses) Challenges
*Other Issues
Quality of Service
2% 1%
2%
30%
33%
7%
21%
4%

*Other Issues: Anomalous and generic complaints such as auto repairs, banking issues, burial assistance, death certificates, duplicate QMB ID cards, food stamps, fraud-Medicaid/Medicare; housing assistance, legal services, name/address change, names misspelled on QMB ID cards, non-receipt-QMB ID cards, replacement of Medicaid/Medicare/MCO/QMB ID cards, and responses to Department of Health Care Finance’s correspondence mailed to DC Medicaid beneficiaries regarding issues that affected their coverage, etc. Source data captured between October 1, 2012 through September 30, 2013 and October 1, 2013 through September 30, 2014
Table 8. Breakdown of Types of Issues Encountered by All Contacts – (Non-Commercial); (Commercial-Non-Appeals/Grievances-Bill of Rights); and
(Commercial-Appeals/Grievances-Bill of Rights) FY13 and FY14
Types of Issues Encountered by All Contacts (Non-Commercial); (Commercial-Non-
Appeals/Grievances-Bill of Rights); (Commercial-Appeals/Grievances-Bill of Rights)
FY13 Totals
FY13 Contacts
(%)
FY14 Totals
FY14 Contacts
(%)
Access (Administrative Hearings) 112 2% 162 2%
Access (Commercial-Non-Appeals/Grievances-Bill of Rights)
100 1% 59 1%
Access (Commercial-Appeals/Grievances-Bill of Rights)
174 3% 133 2%
Access/Coverage (includes denials) 1870 29% 2416 30%
Eligibility 2288 35% 2601 33% Non-Payment/Reimbursement (Out-of-Pocket Expenses) Challenges
424 7% 528 7%
*Other Issues 1249 19% 1708 21%
Quality of Service 290 4% 297 4%
Total Types of Issues (Non-Commercial); (Commercial-Non-Appeals/Grievances-Bill of Rights); and (Commercial-Appeals/Grievances-Bill of Rights) Contacts
6,507 100% 7,904 100%
21

Figure 9. Breakdown of Types of Issues Encountered by (Non-Commercial) Contacts
FY13 and FY14
FY13 FY14
FY13 Total Sample = 6,233 contacted FY14 Total Sample = 7,712 contacted
*Other Issues: Anomalous and generic complaints such as auto repairs; banking issues; burial assistance; death certificates; duplicate QMB ID cards; food stamps;
fraud-Medicaid/Medicare; housing assistance; legal services; name/address change; names misspelled on QMB ID cards; non-receipt-QMB cards; replacement of Medicaid/Medicare/MCO/QMB ID cards; and responses to Department of Health Care Finance’s (DHCF) correspondence mailed to DC Medicaid beneficiaries regarding issues that affected their coverage; etc.
Source data captured between October 1, 2012 through September 30, 2013 and October 1, 2013 through September 30, 2014
22
2%
30%
37%
7%
20%
4%
Access (Administrative Hearings)
Access/Coverage (includes denials)
Eligibility
Non-Payment/Reimbursement (Out-of-Pocket Expenses) Challenges
*Other Issues
Quality of Service
2%
31%
34%
7%
22%
4%

*Other Issues: Anomalous and generic complaints such as auto repairs, banking issues, burial assistance, death certificates, duplicate QMB ID cards, food stamps, fraud-Medicaid/Medicare; housing assistance, legal services, name/address change, names misspelled on QMB ID cards, non-receipt-QMB ID cards, replacement of Medicaid/Medicare/MCO/QMB ID cards, and responses to Department of Health Care Finance’s correspondence mailed to DC Medicaid beneficiaries regarding issues that affected their coverage, etc. Source data captured between October 1, 2012 through September 30, 2013 and October 1, 2013 through September 30, 2014
Table 9. Breakdown of Types of Issues Encountered by (Non-Commercial) Contacts
FY13 and FY14
Types of Issues (Non-Commercial)
Contacts FY13 Totals
FY13 Contacts
(%)
FY14 Totals
FY14 Contacts
(%)
Access (Administrative Hearings) 112 2% 162 2%
Access/Coverage (includes denials) 1870 30% 2416 31%
Eligibility 2288 37% 2601 34%
Non-Payment/Reimbursement (Out-of-Pocket Expenses) Challenges
424 7% 528 7%
*Other Issues 1249 20% 1708 22%
Quality of Service 290 4% 297 4%
Total Types of Issues-(Non-Commercial) Contacts
6,233 100% 7,712 100%
23

Figure 10. Breakdown of Types of Issues Encountered by (Commercial-Non-Appeals/Grievances-Bill of Rights) Contacts
FY13 and FY14
FY13 FY14
FY13 Total Sample = 100 contacted FY14 Total Sample = 59 contacted
*Other Issues: Anomalous and generic complaints such as auto repairs; banking issues; burial assistance; death certificates; duplicate QMB ID cards; food stamps; fraud-Medicaid/Medicare; housing assistance; legal services; name/address change; names misspelled on QMB ID cards; non-receipt-QMB cards; replacement of Medicaid/Medicare/MCO/QMB ID cards; and responses to Department of Health Care Finance’s (DHCF) correspondence mailed to DC Medicaid beneficiaries regarding issues that affected their coverage; etc.
Source data captured between October 1, 2012 through September 30, 2013 and October 1, 2013 through September 30, 2014
24
38%
6%
21%
33%
2%
Access/Coverage (includesdenials)
Eligibility
Non-Payment/Reimbursement(Out-of-Pocket Expenses)Challenges
*Other Issues
Quality of Service
24%
10%
25%
39%
2%

*Other Issues: Anomalous and generic complaints such as auto repairs, banking issues, burial assistance, death certificates, duplicate QMB ID cards, food stamps, fraud-Medicaid/Medicare; housing assistance, legal services, name/address change, names misspelled on QMB ID cards, non-receipt-QMB ID cards, replacement of Medicaid/Medicare/MCO/QMB ID cards, and responses to Department of Health Care Finance’s correspondence mailed to DC Medicaid beneficiaries regarding issues that affected their coverage, etc. Source data captured between October 1, 2012 through September 30, 2013 and October 1, 2013 through September 30, 2014
Table 10. Breakdown of Types of Issues Encountered by (Commercial-Non-Appeals/Grievances-Bill of Rights) Contacts
FY13 and FY14
Types of Issues (Commercial-Non-Appeals/Grievances-Bill of Rights)
Contacts
FY13 Totals
FY13 Contacts
(%)
FY14 Totals
FY14 Contacts
(%)
Access/Coverage (includes denials) 38 38% 14 24%
Eligibility 6 6% 6 10%
Non-Payment/Reimbursement (Out-of-Pocket Expenses) Challenges
21 21% 15 25%
*Other Issues 33 33% 23 39%
Quality of Service 2 2% 1 2%
Total Types of Issues-(Commercial-Non-Appeals/Grievances-Bill of Rights) Contacts
100 100% 59 100%
25

Figure 11. Breakdown of Types of Issues Encountered by (Commercial-Appeals/Grievances-Bill of Rights) Contacts
FY13 and FY14
FY13 Total Sample = 174 contacted FY14 Total Sample = 133 contacted
*Other Issues: Provider’s denial decision; business practices of provider; reconsideration request; denial of prior authorization for medical services; denial of dental services; denial of medical services; denial of lab services; denial of physical therapy services; denial of prescription services; non-payment of medical and dental bills; and reimbursements for out-of-pocket expenses for medical and dental services.
Source data captured between October 1, 2012 through September 30, 2013 and October 1, 2013 through September 30, 2014
FY13 FY14
26
4%
23%
30%
37%
5% 1% Care IsExperimental/Investigational
Care Is Not Medically Necessary
Grandfather Status
Not Eligible for HealthPlan/Benefit
*Other Issues
Pre-Existing Condition
Rescission
Undetermined
8%
32%
41%
11%
Pre-Existing Condition
Discontinued FY14
1% 7%

Table 11. Breakdown of Types of Issues Encountered by (Commercial-Appeals/Grievances Bill of Rights) Contacts
FY13 and FY14
Types of Issues (Commercial-Appeals/Grievances-Bill of Rights)
FY13 Totals
FY13 Contacts (%)
FY14 Totals
FY14 Contact (%)
Care Is Experimental/Investigational 7 4% 11 8%
Care Is Not Medically Necessary 39 23% 42 32%
Grandfather Status 0 0% 0 0%
Not Eligible for Health Plan/Benefit 52 30% 55 41%
*Other Issues 65 37% 15 11%
Pre-Existing Condition 9 5% Discontinued Discontinued
Rescission 2 1% 1 1%
Undetermined 0 0% 9 7%
Total Types of Issues-(Commercial-Appeals/Grievances-Bill of Rights) Contacts
174 100% 133 100%
Source data captured between October 1, 2012 through September 30, 2013 and October 1, 2013 through September 30, 2014 27

Table 11(a). Breakdown of Dispositions of All Cases Among (Commercial-Appeals/Grievances-Bill of Rights) Contacts
FY13 and FY14
Dispositions of All Cases Among (Commercial-Appeals/Grievances-Bill of Rights) Contacts
FY13 Totals
FY13 Percent
(%)
FY14 Totals
FY14 Percent
(%)
Administratively Closed (case closed-due to no action) 35 20% 3 2%
Overturned (case closed-insurer reconsidered denial) 19 11% 20 15%
Partially Overturned (case closed-insurer modified denial) 1 1% 3 2%
Pending (case is still opened) 69 40% 60 45%
Referred to DISB (case closed-referred to DISB for investigation regarding benefits and policy issues)
19 11% 2 2%
Referred to DOL (case closed-appeals submitted by employees of self-insured companies are referred to DOL for processing)
1 1% 0 0%
Referred to OPM (case closed-appeals submitted by federal employees are referred to OPM for processing)
1 1% 0 0%
Referred to Out-of-State (case closed-insurance policy was not issued in the District of Columbia)
1 1% 0 0%
Rejected (case closed-lack of evidence) Not tracked Not tracked 4 3%
Reversed (case closed-IPROs recommended reversal after external review of the appeal)
6 3% 10 8%
Upheld (case closed-insurer’s denial was maintained) 7 4% 7 5%
Withdrawn (case closed-case resolved prior to processing the appeal) 15 7% 23 17%
Write-Off (case closed-provider agreed to write-off balance due) Not tracked Not tracked 1 1%
Total Dispositions of All Cases Among (Commercial-Appeals/Grievances-Bill of Rights) Contacts
174 100% 133 100%
Source data captured between October 1, 2012 through September 30, 2013 and October 1, 2013 through September 30, 2014
28

Figure 12. Breakdown of Types of Issues Encountered by Dual Eligible (Medicare and Medicaid) Contacts
FY13 and FY14
FY13 FY14
FY13 Total Sample = 1,485 contacted FY14 Total Sample = 1,667 contacted
*Other Issues: Anomalous and generic complaints such as auto repairs; banking issues; burial assistance; death certificates; duplicate QMB ID cards; food stamps; fraud-Medicaid/Medicare; housing assistance; legal services; name/address change; names misspelled on QMB ID cards; non-receipt-QMB cards; replacement of Medicaid/Medicare/MCO/QMB ID cards; and responses to Department of Health Care Finance’s (DHCF) correspondence mailed to DC Medicaid beneficiaries regarding issues that affected their coverage; etc.
Source data captured between October 1, 2012 through September 30, 2013 and October 1, 2013 through September 30, 2014
29
4%
32%
32%
9%
14%
9%
Access (Administrative Hearings)
Access/Coverage (includes denials)
Eligibility
Non-Payment/Reimbursement (Out-of-Pocket Expenses) Challenges
*Other Issues
Quality of Service
5%
37%
29%
6%
15%
8%
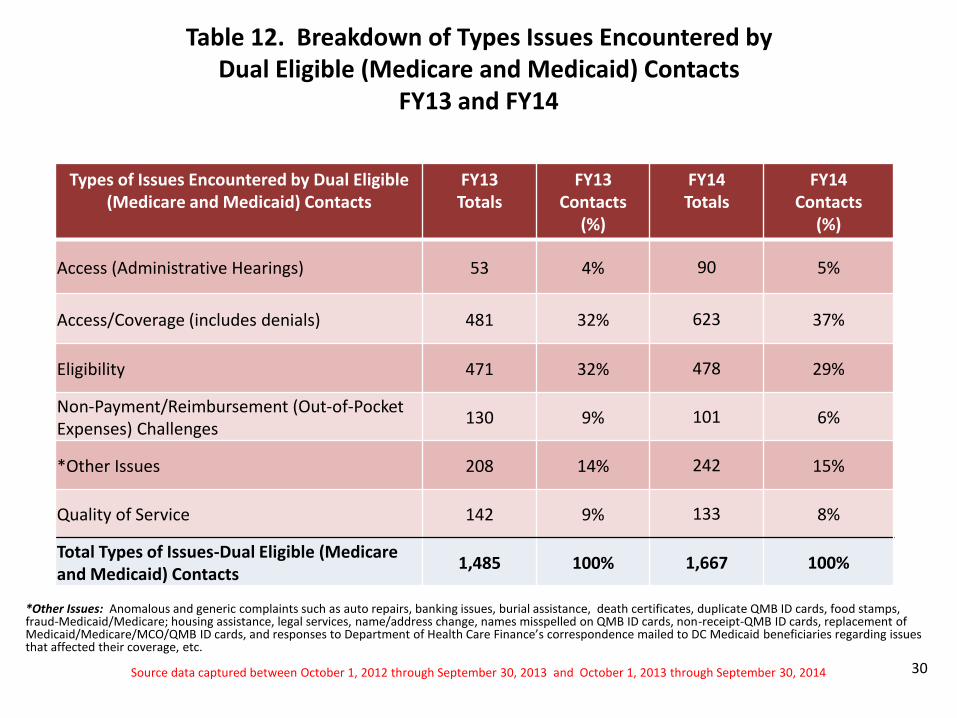
Table 12. Breakdown of Types Issues Encountered by Dual Eligible (Medicare and Medicaid) Contacts
FY13 and FY14
*Other Issues: Anomalous and generic complaints such as auto repairs, banking issues, burial assistance, death certificates, duplicate QMB ID cards, food stamps, fraud-Medicaid/Medicare; housing assistance, legal services, name/address change, names misspelled on QMB ID cards, non-receipt-QMB ID cards, replacement of Medicaid/Medicare/MCO/QMB ID cards, and responses to Department of Health Care Finance’s correspondence mailed to DC Medicaid beneficiaries regarding issues that affected their coverage, etc.
Source data captured between October 1, 2012 through September 30, 2013 and October 1, 2013 through September 30, 2014
Types of Issues Encountered by Dual Eligible (Medicare and Medicaid) Contacts
FY13 Totals
FY13 Contacts
(%)
FY14 Totals
FY14 Contacts
(%)
Access (Administrative Hearings) 53 4% 90 5%
Access/Coverage (includes denials) 481 32% 623 37%
Eligibility 471 32% 478 29%
Non-Payment/Reimbursement (Out-of-Pocket Expenses) Challenges
130 9% 101 6%
*Other Issues 208 14% 242 15%
Quality of Service 142 9% 133 8%
Total Types of Issues-Dual Eligible (Medicare and Medicaid) Contacts
1,485 100% 1,667 100%
30

Figure 13. Breakdown of Types of Issues Encountered by Medicaid Fee-for-Service (FFS) Contacts
FY13 and FY14
FY13 Total Sample = 1,035 contacted FY14 Total Sample = 1,599 contacted
*Other Issues: Anomalous and generic complaints such as auto repairs; banking issues; burial assistance; death certificates; duplicate QMB ID cards; food stamps; fraud-Medicaid/Medicare; housing assistance; legal services; name/address change; names misspelled on QMB ID cards; non-receipt-QMB cards; replacement of Medicaid/Medicare/MCO/QMB ID cards; and responses to Department of Health Care Finance’s (DHCF) correspondence mailed to DC Medicaid beneficiaries regarding issues that affected their coverage; etc.
Source data captured between October 1, 2012 through September 30, 2013 and October 1, 2012 through September 30, 2013
FY13 FY14
31
3%
36%
30%
4%
18%
9%
Access (Administrative Hearings)
Access/Coverage (includes denials)
Eligibility
Non-Payment/Reimbursement (Out-of-Pocket Expenses) Challenges
*Other Issues
Quality of Service
3%
43%
23%
5%
19%
7%

Table 13. Breakdown of Types of Issues Encountered by Medicaid Fee-for-Service (FFS) Contacts
FY13 and FY14 Types of Issues Encountered by Medicaid Fee-for-
Service (FFS) Contacts FY13 Totals
FY13 Contacts
(%)
FY14 Totals
FY14 Contacts
(%)
Access (Administrative Hearings) 29 3% 46 3%
Access/Coverage (includes denials) 369 36% 687 43%
Eligibility 310 30% 365 23%
Non-Payment/Reimbursement (Out-of-Pocket Expenses) Challenges
47 4% 82 5%
*Other Issues 182 18% 298 19%
Quality of Service 98 9% 121 7%
Total Types of Issues-Medicaid Fee-for-Service Contacts 1,035 100% 1,599 100%
*Other Issues: Anomalous and generic complaints such as auto repairs, banking issues, burial assistance, death certificates, duplicate QMB ID cards, food stamps, fraud-Medicaid/Medicare; housing assistance, legal services, name/address change, names misspelled on QMB ID cards, non-receipt-QMB ID cards, replacement of Medicaid/Medicare/MCO/QMB ID cards, and responses to Department of Health Care Finance’s correspondence mailed to DC Medicaid beneficiaries regarding issues that affected their coverage, etc.
Source data captured between October 1, 2012 through September 30, 2013 and October 1, 2013 through September 30, 2014
32

Figure 14. Breakdown of Types of Issues Encountered by Medicare Part A; Part B; Part A/B; Part A/B (QMB) Contacts
FY13 and FY14 FY13 FY14
FY13 Total Sample = 1,820 contacted FY14 Total Sample = 2,436 contacted
*Other Issues: Anomalous and generic complaints such as auto repairs; banking issues; burial assistance; death certificates; duplicate QMB ID cards; food stamps; fraud-Medicaid/Medicare; housing assistance; legal services; name/address change; names misspelled on QMB ID cards; non-receipt-QMB cards; replacement of
Medicaid/Medicare/MCO/QMB ID cards; and responses to Department of Health Care Finance’s (DHCF) correspondence mailed to DC Medicaid beneficiaries regarding issues that affected their coverage; etc.
Source data captured between October 1, 2012 through September 30, 2013 and October 1, 2013 through September 30, 2014
33
1%
22%
36%
9%
31%
1%
Access (AdministrativeHearings)
Access/Coverage (includesdenials)
Eligibility
Non-Payment/Reimbursement(Out-of-Pocket Expenses)Challenges
*Other
Quality of Service
1%
22%
33% 7%
36%
1%
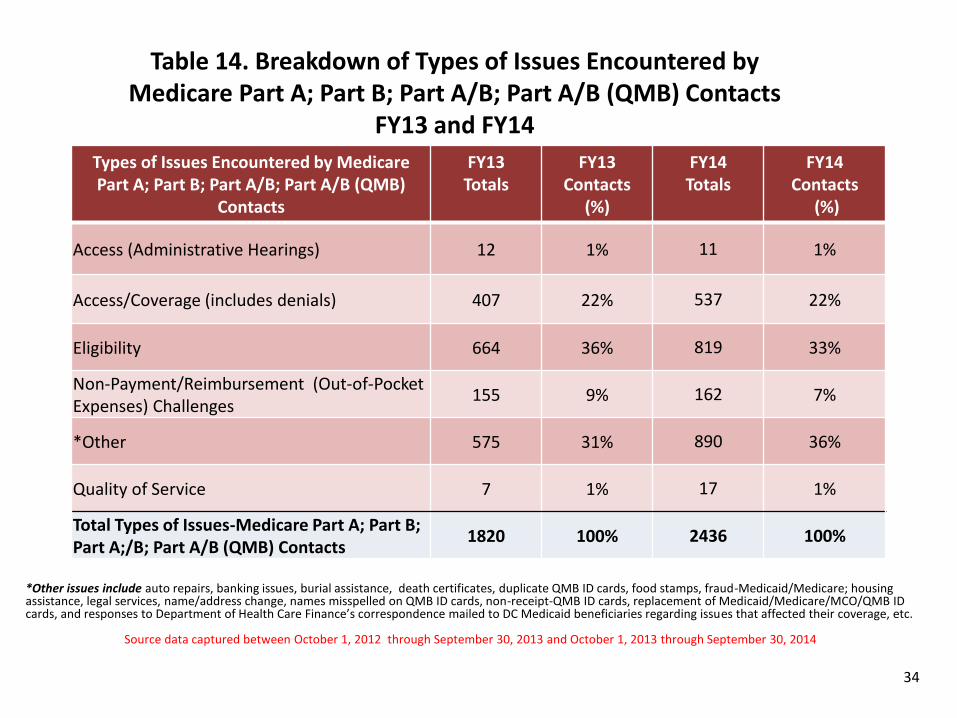
Table 14. Breakdown of Types of Issues Encountered by Medicare Part A; Part B; Part A/B; Part A/B (QMB) Contacts
FY13 and FY14
Types of Issues Encountered by Medicare Part A; Part B; Part A/B; Part A/B (QMB)
Contacts
FY13 Totals
FY13 Contacts
(%)
FY14 Totals
FY14 Contacts
(%)
Access (Administrative Hearings) 12 1% 11 1%
Access/Coverage (includes denials) 407 22% 537 22%
Eligibility 664 36% 819 33%
Non-Payment/Reimbursement (Out-of-Pocket Expenses) Challenges
155 9% 162 7%
*Other 575 31% 890 36%
Quality of Service 7 1% 17 1%
Total Types of Issues-Medicare Part A; Part B; Part A;/B; Part A/B (QMB) Contacts
1820 100% 2436 100%
*Other issues include auto repairs, banking issues, burial assistance, death certificates, duplicate QMB ID cards, food stamps, fraud-Medicaid/Medicare; housing assistance, legal services, name/address change, names misspelled on QMB ID cards, non-receipt-QMB ID cards, replacement of Medicaid/Medicare/MCO/QMB ID cards, and responses to Department of Health Care Finance’s correspondence mailed to DC Medicaid beneficiaries regarding issues that affected their coverage, etc.
Source data captured between October 1, 2012 through September 30, 2013 and October 1, 2013 through September 30, 2014
34

Figure 15. Breakdown of Types of Issues Encountered by Medicaid Managed Care (MCO) Contacts
FY13 and FY14
FY13 FY14
FY13 Total Sample = 1,366 FY14 Total Sample = 1,499 contacted
*Other Issues: Anomalous and generic complaints such as auto repairs; banking issues; burial assistance; death certificates; duplicate QMB ID cards; food stamps; fraud-Medicaid/Medicare; housing assistance; legal services; name/address change; names misspelled on QMB ID cards; non-receipt-QMB cards; replacement of Medicaid/Medicare/MCO/QMB ID cards; and responses to Department of Health Care Finance’s (DHCF) correspondence mailed to DC Medicaid beneficiaries regarding issues that affected their coverage; etc.
Source data captured between October 1, 2012 through September 30, 2013 and October 1, 2013 through September 30, 2014 35
1%
30%
46%
5%
15%
3%
Access (Administrative Hearings)
Access/Coverage (includes denials)
Eligibility
Non-Payment/Reimbursement (Out-of-Pocket Expenses) Challenges
*Other Issues
Quality of Service
1%
26%
47%
8%
16%
2%

Table 15. Breakdown of Types Issues Encountered by Medicaid Managed Care (MCO) Contacts
FY13 and FY14
Types of Issues Encountered by Medicaid Managed Care (MCO) Contacts
FY13 Totals
FY13 Contacts
(%)
FY14 Totals
FY14 Contacts (%)
Access (Administrative Hearings) 14 1% 14 1%
Access/Coverage (includes denials) 413 30% 394 26%
Eligibility 632 46% 707 47%
Non-Payment/Reimbursement (Out-of-Pocket Expenses) Challenges
71 5% 122 8%
*Other Issues 196 15% 232 16%
Quality of Service 40 3% 30 2%
Total Types of Issues-Medicaid Managed Care (MCO) Contacts
1366 100% 1499 100%
*Other Issues: Anomalous and generic complaints such as auto repairs, banking issues, burial assistance, death certificates, duplicate QMB ID cards, food stamps, fraud-Medicaid/Medicare; housing assistance, legal services, name/address change, names misspelled on QMB ID cards, non-receipt-QMB ID cards, replacement of Medicaid/Medicare/MCO/QMB ID cards, and responses to Department of Health Care Finance’s correspondence mailed to DC Medicaid beneficiaries regarding issues that affected their coverage, etc.
Source data captured between October 1, 2012 through September 30, 2013 and October 1, 2013 through September 30, 2014 36

Figure 16. Breakdown of Types of Issues Encountered by Alliance Contacts
FY13 and FY14
FY13 Total Sample = 263 contacted FY14 Total Sample = 238 contacted
*Other Issues: Anomalous and generic complaints such as auto repairs; banking issues; burial assistance; death certificates; duplicate QMB ID cards; food stamps;
fraud-Medicaid/Medicare; housing assistance; legal services; name/address change; names misspelled on QMB ID cards; non-receipt-QMB cards; replacement of Medicaid/Medicare/MCO/QMB ID cards; and responses to Department of Health Care Finance’s (DHCF) correspondence mailed to DC Medicaid beneficiaries regarding issues that affected their coverage; etc.
Source data captured between October 1, 2012 through September 30, 2013 and October 1, 2013 through September 30, 2014
FY13 FY14
37
1% 9%
64%
7%
18%
<1% Access (Administrative Hearings)
Access/Coverage (includesdenials)
Eligibility
Non-Payment/Reimbursement(Out-of-Pocket Expenses)Challenges
*Other Issues
Quality of Service
16%
56%
22%
5% 1%

Table 16. Breakdown of Types of Issues Encountered by Alliance Contacts
FY13 and FY14
Types of Issues Encountered by Alliance Contacts
FY13 Totals
FY13 Contacts
(%)
FY14 Totals
FY14 Contacts
(%)
Access (Administrative Hearings) 3 1% 0 0%
Access/Coverage (includes denials) 25 9% 38 16%
Eligibility 168 64% 134 56%
Non-Payment/Reimbursement (Out-of-Pocket Expenses) Challenges
18 7% 53 22%
*Other Issues 48 18% 12 5%
Quality of Service 1 <1% 1 1%
Total Types of Issues-Alliance Contacts 263 100% 238 100%
*Other Issues: Anomalous and generic complaints such as auto repairs, banking issues, burial assistance, death certificates, duplicate QMB ID cards, food stamps, fraud-Medicaid/Medicare; housing assistance, legal services, name/address change, names misspelled on QMB ID cards, non-receipt-QMB ID cards, replacement of Medicaid/Medicare/MCO/QMB ID cards, and responses to Department of Health Care Finance’s correspondence mailed to DC Medicaid beneficiaries regarding issues that affected their coverage, etc.
Source data captured between October 1, 2012 through September 30, 2013 and October 1, 2013 through September 30, 2014 38

FY13 Total Sample = 208 contacted FY14 Total Sample = 233 contacted
*Other Issues: Anomalous and generic complaints such as auto repairs; banking issues; burial assistance; death certificates; duplicate QMB ID cards; food stamps; fraud-Medicaid/Medicare; housing assistance; legal services; name/address change; names misspelled on QMB ID cards; non-receipt-QMB cards; replacement of Medicaid/Medicare/MCO/QMB ID cards; and responses to Department of Health Care Finance’s (DHCF) correspondence mailed to DC Medicaid beneficiaries regarding issues that affected their coverage; etc.
Source data captured between October 1, 2012 through September 30, 2013 and October 1, 2013 through September 30, 2014 39
Figure 17. Breakdown of Types of Issues Encountered by Uninsured Contacts
FY13 and FY14
FY13 FY14
75%
16%
1% 8%
Access/Coverage (includesdenials)
Eligibility
Non-Payment/Reimbursement(Out-of-Pocket Expenses)Challenges
*Other Issues
Quality of Service
35%
45%
3%
10%
7%

Table 17. Breakdown of Issues Encountered by Uninsured Contacts
FY13 and FY14 Types of Issues Encountered by Uninsured Contacts FY13
Totals FY13
Contacts (%)
FY14 Totals
FY14 Contacts
(%)
Access/Coverage (includes denials) 157 75% 80 35%
Eligibility 34 16% 105 45%
Non-Payment/Reimbursement (Out-of-Pocket Expenses) Challenges
1 1% 7 3%
*Other Issues 16 8% 24 10%
Quality of Service 0 0% 17 7%
Total Types of Issues-Uninsured Contacts 208 100% 233 100%
40
*Other Issues: Anomalous and generic complaints such as auto repairs, banking issues, burial assistance, death certificates, duplicate QMB ID cards, food stamps, fraud-Medicaid/Medicare; housing assistance, legal services, name/address change, names misspelled on QMB ID cards, non-receipt-QMB ID cards, replacement of Medicaid/Medicare/MCO/QMB ID cards, and responses to Department of Health Care Finance’s correspondence mailed to DC Medicaid beneficiaries regarding issues that affected their coverage, etc.
Source data captured between October 1, 2012 through September 30, 2013 and October 1, 2013 through September 30, 2014

Figure 18. Breakdown of Transportation Contacts by Insurance Type FY13 and FY14
FY13 Total Sample = 107 contacted FY14 Total Sample = 148 contacted
Source data captured between October 1, 2012 through September 30, 2013 and October 1, 2013 through September 30, 2014
FY13 FY14
41
3%
30%
35%
14%
16%
2%
Alliance
Commercial Health Plan
Dual Eligible(Medicare/Medicaid)
Medicaid (Fee-for-Service)
Medicaid (MCOs)
Medicare Part A; Part B;Part A/B; Part A/B (QMB)
Uninsured
23%
40%
19%
17%
1%

Table 18. Breakdown of Transportation Contacts by Insurance Type FY13 and FY14
Transportation Contacts by Insurance Type
FY13 Totals
FY13 Contacts
(%)
FY14 Totals
FY14 Contacts
(%)
Alliance 0 0% 0 0%
Commercial Health Plan 3 3% 0 0%
Dual Eligible (Medicare/Medicaid) 32 30% 34 23%
Medicaid (Fee-for-Service) 38 35% 59 40%
Medicaid (MCOs) 15 14% 28 19%
Medicare Part A; Part B; Part A/B; Part A/B (QMB)
17 16% 26 17%
Uninsured 2 2% 1 1%
Total Transportation Contacts by Insurance Type
107 100% 148 100%
Source data captured between October 1, 2012 through September 30, 2013 and October 1, 2013 through September 30, 2014
42

Figure 19. Breakdown of Types of Issues Encountered by Transportation Contacts
FY13 and FY14
FY13 Total Sample = 107 contacted FY14 Total Sample = 148 contacted
Source data captured between October 1, 2012 through September 30, 2013 and October 1, 2013 through September 30, 2014
FY13 FY14
43
66%
7%
6%
2% 1%
18% Access (includes prior authorizationrequests)
Coverage (includes denials ofservice)
Eligibility (status ofeligibility/verification of coverage)
Non-Payment/Reimbursement (Out-of-Pocket Expenses) Challenges
*Other Issues
Quality of Service78%
12%
0%
0% 0%
10%

Table 19. Breakdown of Types of Issues Encountered by Transportation Contacts
FY13 and FY14
Types of Issues Encountered by Transportation Contacts
FY13 Totals
FY13 Contacts
(%)
FY14 Totals
FY14 Contacts
(%)
Access (includes prior authorization requests) 71 66% 116 78%
Coverage (includes denials of service) 8 7% 18 12%
Eligibility (status of eligibility/verification of coverage)
6 6% 0 0%
Non-Payment/Reimbursement (Out-of-Pocket Expenses) Challenges
2 2% 0 0%
*Other Issues 1 1% 0 0%
Quality of Service 19 18% 14 10%
Total Types of Issues-Transportation Contacts 107 100% 148 100%
*Other Issues: Anomalous and generic complaints such as auto repairs, banking issues, burial assistance, death certificates, duplicate QMB ID cards, food stamps, fraud-Medicaid/Medicare; housing assistance, legal services, name/address change, names misspelled on QMB ID cards, non-receipt-QMB ID cards, replacement of Medicaid/Medicare/MCO/QMB ID cards, and responses to Department of Health Care Finance’s correspondence mailed to DC Medicaid beneficiaries regarding issues that affected their coverage, etc.
Source data captured between October 1, 2012 through September 30, 2013 and October 1, 2013 through September 30, 2014
44

Figure 20. Breakdown of EPD Waiver Contacts by
Insurance Type FY13 and FY14
FY13 Total Sample = 618 contacted FY14 Total Sample = 678 contacted
Source data captured between October 1, 2012 through September 30, 2013 and October 1, 2013 through September 30, 2014
FY13 FY14
45
76%
24%
Dual Eligible (Medicare/Medicaid)
Fee-For-Service (Medicaid)
78%
22%

Table 20. Breakdown of EPD Waiver Contacts by Insurance Type FY13 and FY14
EPD Waiver Contacts by Insurance Type FY13 Totals
FY13
Contacts (%)
FY14
Totals
FY14
Contacts (%)
Dual Eligible (Medicare/Medicaid) 470 76% 527 78%
Fee-For-Service (Medicaid) 148 24% 151 22%
Total EPD Waiver Contacts by Insurance Type 618 100% 678 100%
Source data captured between October 1, 2012 through September 30, 2013 and October 1, 2013 through September 30, 2014
46

Figure 21. Breakdown of Types of Issues Encountered by EPD Waiver Contacts
FY13 and FY14
FY13 Total Sample = 618 contacted FY14 Total Sample = 678 contacted
*Other Issues: Anomalous and generic complaints such as auto repairs, banking issues, burial assistance, death certificates, duplicate QMB ID cards, food stamps, fraud-Medicaid/Medicare; housing assistance, legal services, name/address change, names misspelled on QMB ID cards, non-receipt-QMB ID cards, replacement of Medicaid/Medicare/MCO/QMB ID cards, and responses to Department of Health Care Finance’s correspondence mailed to DC Medicaid beneficiaries regarding issues that affected their coverage, etc.
Source data captured between October 1, 2012 through September 30, 2013 and October 1, 2013 through September 30, 2014
FY13 FY14
47
8%
27%
7%
32%
3%
10%
13% Access (Administrative Hearings)
Access (to include PriorAuthorization requests)
Coverage (denials)
Eligibility/Recertification
Non-Payment/Reimbursement (Out-of-Pocket Expenses) Challenges
*Other Issues
Quality of Service
13%
37%
1%
24%
4%
9%
12%

Table 21. Breakdown of Types of Issues Encountered by EPD Waiver Contacts
FY13 and FY14
Types of Issues Encountered by EPD Waiver Contacts
FY13 Totals
FY13
Contacts (%)
FY14 Totals
FY14
Contacts (%)
Access (Administrative Hearings) 48 8% 85 13%
Access (to include Prior Authorization requests) 167 27% 253 37%
Coverage (denials) 44 7% 7 1%
Eligibility/Recertification 197 32% 166 24%
Non-Payment/Reimbursement (Out-of-Pocket Expenses) Challenges
19 3% 29 4%
*Other Issues 60 10% 59 9%
Quality of Service 83 13% 79 12%
Total Types of Issues-EPD Waiver Contacts 618 100% 678 100%
*Other Issues: Anomalous and generic complaints such as auto repairs, banking issues, burial assistance, death certificates, duplicate QMB ID cards, food stamps, fraud-Medicaid/Medicare; housing assistance, legal services, name/address change, names misspelled on QMB ID cards, non-receipt-QMB ID cards, replacement of Medicaid/Medicare/MCO/QMB ID cards, and responses to Department of Health Care Finance’s correspondence mailed to DC Medicaid beneficiaries regarding issues that affected their coverage, etc.
Source data captured between October 1, 2012 through September 30, 2013 and October 1, 2013 through September 30, 2014
48

FY14 Total Sample = 252 contacted
Note: FY14 is the first year for tracking Types of Issues Encountered by DC Health Link and Health Exchange Marketplace
Source data captured between January 1, 2014 through September 30, 2014
48%
1%
46%
5%
Access (DC Health Link Services)
Access (Health Care ExchangeMarketplace Website)
Eligibility
Non-Payment/Non-Reimbursement(Out-of-Pocket Expenses) Challenges
*Other Issues
Quality of Service
Figure 22. Breakdown of Types of Issues Encountered by DC Health Link and Health Exchange Marketplace Contacts
FY14
49
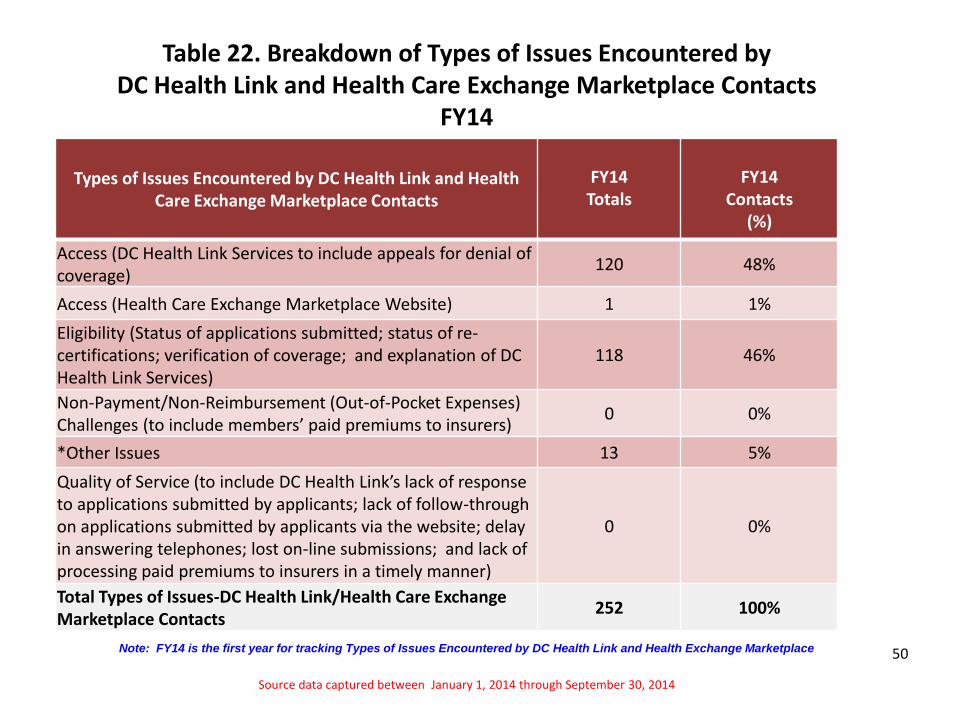
Table 22. Breakdown of Types of Issues Encountered by DC Health Link and Health Care Exchange Marketplace Contacts
FY14
Note: FY14 is the first year for tracking Types of Issues Encountered by DC Health Link and Health Exchange Marketplace
Source data captured between January 1, 2014 through September 30, 2014
50
Types of Issues Encountered by DC Health Link and Health Care Exchange Marketplace Contacts
FY14 Totals
FY14
Contacts (%)
Access (DC Health Link Services to include appeals for denial of coverage)
120 48%
Access (Health Care Exchange Marketplace Website) 1 1%
Eligibility (Status of applications submitted; status of re-certifications; verification of coverage; and explanation of DC Health Link Services)
118 46%
Non-Payment/Non-Reimbursement (Out-of-Pocket Expenses) Challenges (to include members’ paid premiums to insurers)
0 0%
*Other Issues 13 5%
Quality of Service (to include DC Health Link’s lack of response to applications submitted by applicants; lack of follow-through on applications submitted by applicants via the website; delay in answering telephones; lost on-line submissions; and lack of processing paid premiums to insurers in a timely manner)
0 0%
Total Types of Issues-DC Health Link/Health Care Exchange Marketplace Contacts
252 100%

Figure 23. Dollar Amount of Savings on Behalf of (Non-Commercial); (Commercial-Non-Appeals/Grievances-Bill of Rights); and (Commercial-Appeals/Grievances-Bill of Rights) Contacts
FY13 and FY14
Source data captured between October 1, 2012 through September 30, 2013 and October 1, 2013 through September 30, 2014
51
FY13 FY14
Total Sample = $460,549.11 Total Sample = $932,651.62
78%
8%
7%
7%
Commercial (to includeAppeals/Grievances-Bill of Rights)
Fee-For-Service, MCO, Alliance, Uninsured – (Non-payments of medical bills)
QMB (Co-Pays removed from beneficiaries’ accounts)
Medicare Part B Premiums(Reimbursements for non-payments of Premiums)
49%
45%
3% 3%

Table 23. Dollar Amount of Savings on Behalf of (Non-Commercial); (Commercial-Non-Appeals/Grievances-Bill of Rights); and (Commercial-Appeals/Grievances-Bill of Rights) Contacts
FY13 and FY14
Dollar Amount of Savings on Behalf of (Non-Commercial); (Commercial-Non-
Appeals/Grievances-Bill of Rights); (Commercial-Appeals/Grievances-Bill-
Rights) Contacts
FY13 Totals
FY13 Percent
(%)
FY14 Totals
FY14 Percent (%)
Commercial (to include Appeals/Grievances-Bill of Rights)
$359,286.35 78% $457,240.56 49%
Fee-For-Service, MCO, Alliance, Uninsured – (Non-payments of medical bills)
$36,868.80 8% $422,616.56 45%
QMB (Co-Pays removed from beneficiaries’ accounts)
$33,007.36 7% $25,991.07 3%
Medicare Part B Premiums (Reimbursements for non-payments of Premiums)
$31,386.60 7% $26,803.43 3%
Total Dollar Amount of Savings on Behalf of All Consumers
$460,549.11 100% $932,651.62 100%
Source data captured between October 1, 2012 through September 30, 2013 and October 1, 2013 through September 30, 2014
52

3.6 Days
2.0 Days
0
0.5
1
1.5
2
2.5
3
3.5
4
FY13 FY14
Figure 24. Average Number of Days to Close/Resolve (Non-Commercial) Cases
FY13 and FY14
Source data captured between October 1, 2012 through September 30, 2013 and October 1, 2013 through September 30, 2014 53
FY13 Total Cases Closed/ Resolved = 6,178 FY14 Total Cases Closed/Resolved = 7,304

Table 24. Average Number of Days to Close/Resolve (Non-Commercial) Cases
FY13 and FY14
FY13 Average Number of Days to Close/Resolve
(Non-Commercial) Cases
FY13 Total
FY14 Average Number of Days to Close/Resolve
(Non-Commercial) Cases
FY14 Total
Average Number of Days It Took to Close/Resolve
(6,178) Cases 3.6 days
Average Number of Days It Took to Close/Resolve
(7,304) Cases 2.0 days
Note: Of the (6,233) cases opened, the OHCOBR closed/resolved (4,913)
cases on same day that cases were opened
Note: Of the (7,712) cases opened, the OHCOBR closed/resolved (6,472) cases
on same day that cases were opened
Source data captured between October 1, 2012 through September 30, 2013 and October 1, 2013 through September 30, 2014 54
14.0 Days
0 Days * 0
2
4
6
8
10
12
14
16
FY13 FY14
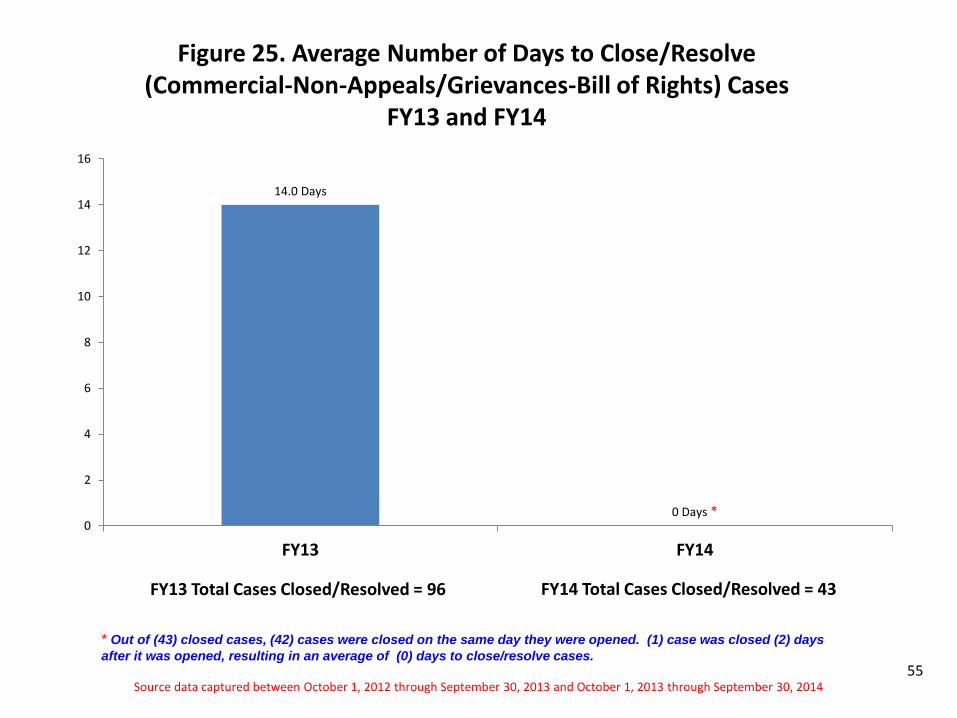
Figure 25. Average Number of Days to Close/Resolve (Commercial-Non-Appeals/Grievances-Bill of Rights) Cases
FY13 and FY14
Source data captured between October 1, 2012 through September 30, 2013 and October 1, 2013 through September 30, 2014 55
FY13 Total Cases Closed/Resolved = 96
* Out of (43) closed cases, (42) cases were closed on the same day they were opened. (1) case was closed (2) days
after it was opened, resulting in an average of (0) days to close/resolve cases.
FY14 Total Cases Closed/Resolved = 43

Table 25. Average Number of Days to Close/Resolve (Commercial-Non-Appeals/Grievances-Bill of Rights) Cases
FY13 and FY14
FY13 Average Number of Days to Close/Resolve
(Commercial-Non-Appeals/Grievances- Bill of Rights) Cases
FY13 Total
FY14 Average Number of Days to Close/Resolve
(Commercial-Non-Appeals/Grievances- Bill of Rights) Cases
FY14 Total
Average Number of Days It Took to Close/Resolve
(96) Cases 14.0 days
Average Number of Days It Took to Close/Resolve
(43) Cases 0 days
Note: Of the (100) cases opened, the OHCOBR closed/resolved (70) cases on
same day that cases were opened
Note: Of the (59) cases opened, the OHCOBR closed/resolved (42) cases on
same day that cases were opened
Source data captured between October 1, 2012 through September 30, 2013 and October 1, 2013 through September 30, 2014
56

Figure 26. Average Number of Days to Close/Resolve (Commercial-Appeals/Grievances-Bill of Rights) Cases
FY13 and FY14
Source data captured between October 1, 2012 through September 30, 2013 and October 1, 2013 through September 30, 2014
57
91.6 Days
68.3 Days
85
86
87
88
89
90
91
92
FY13 FY14
FY13 Total Cases Closed/Resolved = 127 FY14 Total Cases Closed/Resolved = 48

Table 26. Average Number of Days to Close/Resolve (Commercial-Appeals/Grievances-Bill of Rights) Cases
FY13 and FY14
FY13 Average Number of Days to Close/Resolve
(Commercial-Appeals/Grievances- Bill of Rights) Cases
FY13 Total
FY14 Average Number of Days to Close/Resolve
(Commercial-Appeals/Grievances- Bill of Rights) Cases
FY14 Total
Average Number of Days It Took to Close/Resolve (127) Cases
91.6 days Average Number of Days
It Took to Close/Resolve (48) Cases 68.3 days
Note: Of the (174) cases opened, the OHCOBR closed/resolved (19) cases on
same day that cases were opened
Note: Of the (133) cases opened, the OHCOBR closed/resolved (53) cases on
same day that cases were opened
Source data captured between October 1, 2012 through September 30, 2013 and October 1, 2013 through September 30, 2014
58
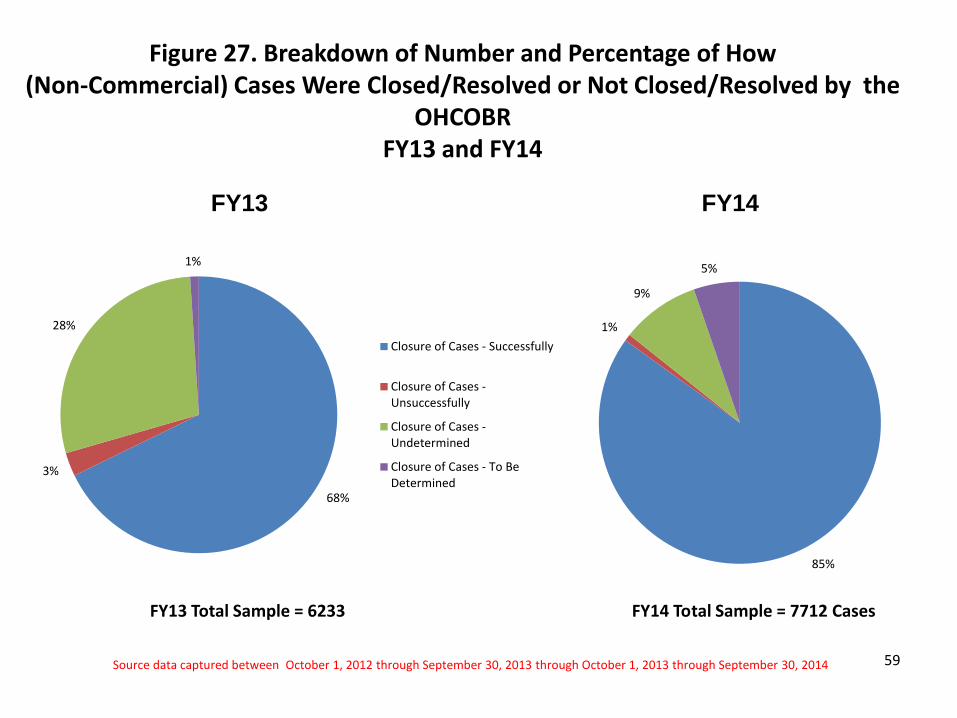
Figure 27. Breakdown of Number and Percentage of How (Non-Commercial) Cases Were Closed/Resolved or Not Closed/Resolved by the
OHCOBR FY13 and FY14
FY13 Total Sample = 6233 FY14 Total Sample = 7712 Cases
Source data captured between October 1, 2012 through September 30, 2013 through October 1, 2013 through September 30, 2014 59
FY13 FY14
68%
3%
28%
1%
Closure of Cases - Successfully
Closure of Cases -Unsuccessfully
Closure of Cases -Undetermined
Closure of Cases - To BeDetermined
85%
1%
9%
5%

Table 27. Breakdown of Number and Percentage of How (Non-Commercial) Cases Were Closed/Resolved or Not Closed/Resolved by
the OHCOBR FY13 and FY14
How (Non-Commercial) Cases were
Closed/Resolved or Not Closed/Resolved
FY13 Totals
FY13 Percent
(%)
FY14 Totals
FY14 Percent
(%)
Closure of Cases - Successfully 4224 68% 6550 85%
Closure of Cases -Unsuccessfully 172 3% 60 1%
Closure of Cases-Undetermined 1774 28% 694 9%
Closure of Cases - To Be Determined 63 1% 408 5%
Total Number and Percentage of (Non-Commercial) Cases
6233 100% 7712 100%
Source data captured between October 1, 2012 through September 30, 2013 and October 1, 2013 through September 30, 2014
60
51%
2%
20%
27%
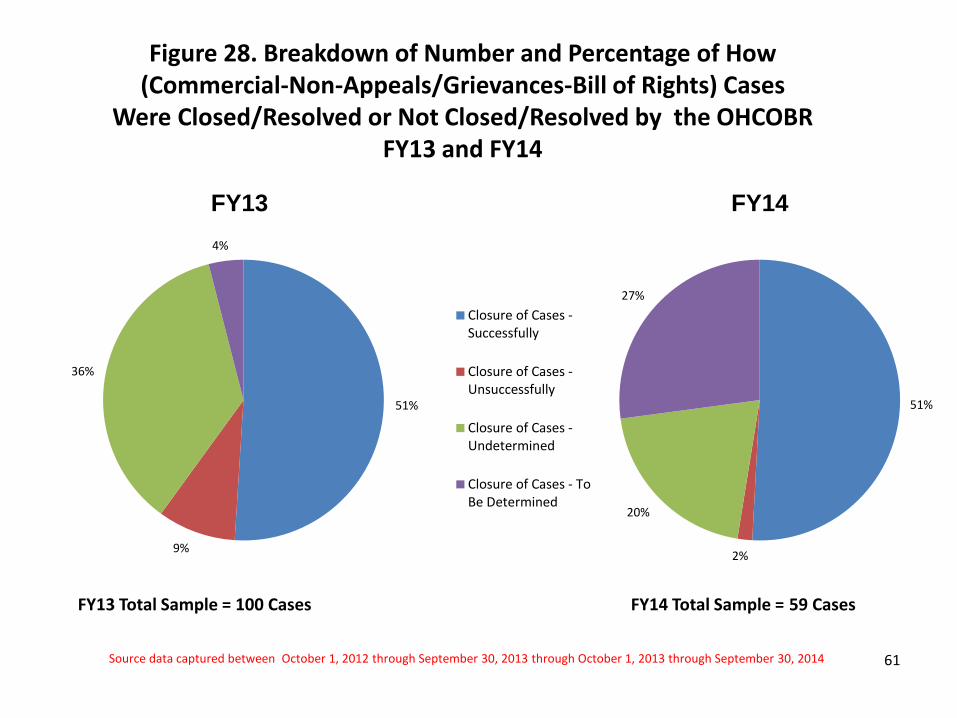
Figure 28. Breakdown of Number and Percentage of How (Commercial-Non-Appeals/Grievances-Bill of Rights) Cases
Were Closed/Resolved or Not Closed/Resolved by the OHCOBR FY13 and FY14
FY13 Total Sample = 100 Cases FY14 Total Sample = 59 Cases
Source data captured between October 1, 2012 through September 30, 2013 through October 1, 2013 through September 30, 2014 61
FY13 FY14
51%
9%
36%
4%
Closure of Cases -Successfully
Closure of Cases -Unsuccessfully
Closure of Cases -Undetermined
Closure of Cases - ToBe Determined

Table 28. Breakdown of Number and Percentage of How (Commercial-Non-Appeals/Grievances-Bill of Rights) Cases
Were Closed/Resolved or Not Closed/Resolved by the OHCOBR FY13 and FY14
How (Commercial-Non-Appeals/Grievances-
Bill of Rights) Cases were Closed/Resolved or Not
Closed/Resolved
FY13 Totals
FY13 Percent
(%)
FY14 Totals
FY14 Percent
(%)
Closure of Cases - Successfully 51 51% 30 51%
Closure of Cases -Unsuccessfully 9 9% 1 2%
Closure of Cases-Undetermined 36 36% 12 20%
Closure of Cases - To Be Determined 4 4% 16 27%
Total Number and Percentage of (Commercial-Non-Appeals/Grievances-Bill of Rights) Cases
100 100% 59 100%
Source data captured between October 1, 2012 through September 30, 2013 and October 1, 2013 through September 30, 2014 62

Figure 29. Breakdown of Number and Percentage of How (Commercial-Appeals/Grievances-Bill of Rights) Cases
Were Closed/Resolved or Not Closed/Resolved by the OHCOBR FY13 and FY14
FY13 Total Sample = 174 Cases FY14 Total Sample = 133 Cases
Source data captured between October 1, 2012 through September 30, 2013 through October 1, 2013 through September 30, 2014 63
FY13 FY14
41%
30%
2%
27%
Closure of Cases -Successfully
Closure of Cases -Unsuccessfully
Closure of Cases -Undetermined
Closure of Cases - To BeDetermined
28%
5%
3%
64%

Table 29. Breakdown of Number and Percentage of How (Commercial-Appeals/Grievances-Bill of Rights) Cases
Were Closed/Resolved or Not Closed/Resolved by the OHCOBR FY13 and FY14
How (Commercial-Appeals/Grievances-Bill of Rights) Cases were Closed/Resolved or
Not Closed/Resolved
FY13 Totals
FY13 Percent
(%)
FY14 Totals
FY14 Percent
(%)
Closure of Cases - Successfully 72 41% 38 28%
Closure of Cases -Unsuccessfully 52 30% 6 5%
Closure of Cases-Undetermined 3 2% 4 3%
Closure of Cases - To Be Determined 47 27% 85 64%
Total Number and Percentage of (Commercial-Appeals/Grievances-Bill of Rights) Cases
174 100% 133 100%
Source data captured between October 1, 2012 through September 30, 2013 and October 1, 2013 through September 30, 2014
64
Moving Forward
Office of Health Care Ombudsman and Bill of Rights intends to continue:
• Capturing data for each contact
• Tracking types of calls received to identify changes over time
• Keep updated and add new features to new Ombudsman In-Take Log Data System (OIDS)
• Expanding data analysis capability
65