office of clinical pharmacology … sinha, ph.d. director, division of pharmacometrics ocp: office...
TRANSCRIPT

U.S. FDA Qualification of The MCP-Mod Procedure Page 1 of 31
OFFICE OF CLINICAL PHARMACOLOGY DIVISION OF PHARMACOMETRICS
Application Request for Qualification of MCP-Mod as an efficient statisti-cal methodology for model-based design and analysis of Phase II dose finding studies under model uncertainty
Applicant Janssen Pharmaceuticals and Novartis Pharmaceuticals
Application date 22 April, 2015
OCP Division Division of Pharmacometrics
OCP Reviewer Dinko Rekić, MSc(Pharm), Ph.D.
Concurring reviewers
Yaning Wang, Ph.D. Deputy Director, Division of Pharmacometrics Vikram Sinha, Ph.D. Director, Division of Pharmacometrics
OCP: Office of Clinical Pharmacology
Table of Contents 1 Executive Summary ....................................................................................... 2
1.1 Recommendations ................................................................................... 2 2 Summary of Methodology Assessment ......................................................... 3 3 Introduction .................................................................................................... 5 4 Background.................................................................................................... 6
4.1 Estimation Methods ................................................................................. 7 4.1.1 The Utility of Concentration-Response Modeling .............................. 8
4.2 Testing Methods .................................................................................... 10 4.3 Determination of the Minimal Effective Dose ......................................... 10
5 Applicant’s Submission ................................................................................ 12 5.1 Overview of the MCP-Mod Procedure ................................................... 12 5.2 Applicant’s Comparison of MCP-Mod to Other Methods ....................... 13
5.2.1 MCP-Mod versus LLR test .............................................................. 13
5.2.2 MCP-Mod versus ANOVA, BMA, and LOCFIT ................................ 17
5.2.3 Reviewer’s Conclusions .................................................................. 23
6 Reviewer’s Analysis ..................................................................................... 24 7 References .................................................................................................. 30
U.S. FDA Qualification of The MCP-Mod Procedure Page 2 of 31
1 EXECUTIVE SUMMARY Janssen Pharmaceuticals and Novartis Pharmaceuticals have submitted a “Re-quest for Qualification of MCP-Mod as an efficient statistical methodology for model-based design and analysis of Phase II dose finding studies under model uncertainty”. MCP-Mod, (Multiple Comparison Procedure – Modelling) is a hy-brid approach that combines hypothesis testing and modeling in a structured manner to analyze phase 2 dose-ranging studies with the purpose of finding suit-able dose(s) for confirmatory phase 3 trials. The first step of the procedure (MCP-step) is used to assess presence of a dose-response signal using a trend test deducted from a set of prespecified candidate models. The second step (Mod-step) relies on parametric modeling or model av-eraging to find the “optimal’ dose for confirmatory trials. MCP-Mod method is found more effective than pairwise comparison due to its ability to utilize all avail-able data from the continuum of active doses and placebo to estimate a paramet-ric dose-response curve which allows for interpolation and extrapolation of effect across a range of doses. Other structured hybrid testing-modeling approaches are likely to provide similar benefit. Similar to other methods that depend on modeling, MCP-Mod encourages better design of dose-ranging studies by alloca-tion of doses at the ascending part of the dose-response curve.
1.1 Recommendations The Division of Pharmacometrics in The Office of Clinical Pharmacology finds the MCP-Mod method an adequate and appropriate method for dose selection based on dose-response data.
U.S. FDA Qualification of The MCP-Mod Procedure Page 3 of 31
2 SUMMARY OF METHODOLOGY ASSESSMENT The Applicant’s motivation for developing a hybrid testing-modeling approach was to combine the strengths of hypothesis testing (few assumptions, control for type I error) and modeling (better predictive performance) to support better deci-sions. This application is supported by: a) summaries of two simulation studies that compared MCP-Mod to other methods, b) examples of use of MCP-Mod in litera-ture, and c) examples of use at the two firms supporting this application. The focus of this review has been on the evaluation of MCP-mod in the two simu-lation studies where findings from the applicant’s simulations have been con-firmed by the reviewer in an independent analysis. The two simulation studies evaluated MCP-Mod, based on power to detect a sig-nificant dose-response relationship, type I error rate, and likelihood to find a min-imal effective dose. Methods were evaluated under various model shapes, sam-ple size, and number of doses. Power to declare a positive dose-response relationship with the MCP-Mod meth-od was compared to Dunnett’s test (Dunnett 1955), Log-likelihood ratio (LLR) test for monotonicity (Bartholomew 1961), a Bayesian modeling approach, and a non-parametric modeling approach. Dunnett’s test was consistently inferior to other methods. All other methods were similar in performance. It is noteworthy that the power of the MCP-Mod method was shown to be sensi-tive to the initial ‘guesses’ of model shapes. Under a scenario where the simulat-ed model shape was not included amongst the prespecified model shapes, pow-er was 14%-points lower than the average power for the other model shapes. It is therefore advisable not to restrict the number of shapes to be included in the pro-cedure. Power of MCP-Mod method was also negatively affected when number of doses increased but total sample size remained the same, but less so than Dunnett’s test. A plausible explanation is that the design with fewer doses includ-ed more subjects at highly informative doses compared to the design with a large number of doses. These findings were confirmed in an independent analysis conducted by the reviewer which showed that MCP-Mod performance increased if doses were chosen based on the D-optimal design compared to other designs that included more dose levels. It should be noted that both the model shape and model parameters need to be known a priori in order to design a dose-ranging study based on the D-optimal design. This is almost never the case in clinical drug development. It is therefore good practice to explore a wide range of doses so that the shape of the dose response curve can be characterized. Reviewer’s analysis also shows that MCP-Mod performance is similar to LLR test unless the assumption of monotonicity is violated. In that case, MCP-Mod was superior to LLR test. Applicant’s simulations as well as reviewer’s analysis show that MCP-Mod meth-od has similar power and type I error to test for significant dose-response rela-tionships as other methods.

U.S. FDA Qualification of The MCP-Mod Procedure Page 4 of 31
MCP-Mod performance was similar to other modeling methods or hybrid meth-ods in terms of power to detect the minimal effective dose. Applicant’s hybrid approach to dose finding is not unique. Similar hybrid methods have been proposed (Overgaard et al. 2015, and Aoki et al. 2014). There is cur-rently no direct comparison between the method proposed by Aoki et al. and the MCP-Mod method however, based on the reviewer’s cross-study comparison, there is no reason to believe that there would be a significant difference in per-formance.
U.S. FDA Qualification of The MCP-Mod Procedure Page 5 of 31
3 INTRODUCTION Janssen Pharmaceuticals and Novartis Pharmaceuticals have submitted a “Re-quest for Qualification of MCP-Mod as an efficient statistical methodology for model-based design and analysis of Phase II dose finding studies under model uncertainty” to the Agency on April 22, 2015. The applicant refers to past interac-tions with the Agency where the MCP-Mod method was discussed: 1) 1-day course to the CDER/OTS Office of Biostatistics on “Dose Finding Studies: Meth-ods and Implementation” on August 12, 2008. 2) Half-day tutorial on “MCP-Mod: A structured approach to model-based design and analysis of Phase II dose find-ing studies under model uncertainty” presented to CDER/OTS/OB and OCP on January 28, 2015. The European Medicines Agency (EMA) has offered a positive qualification opin-ion on MCP-Mod procedure (EMA 2014).
U.S. FDA Qualification of The MCP-Mod Procedure Page 6 of 31
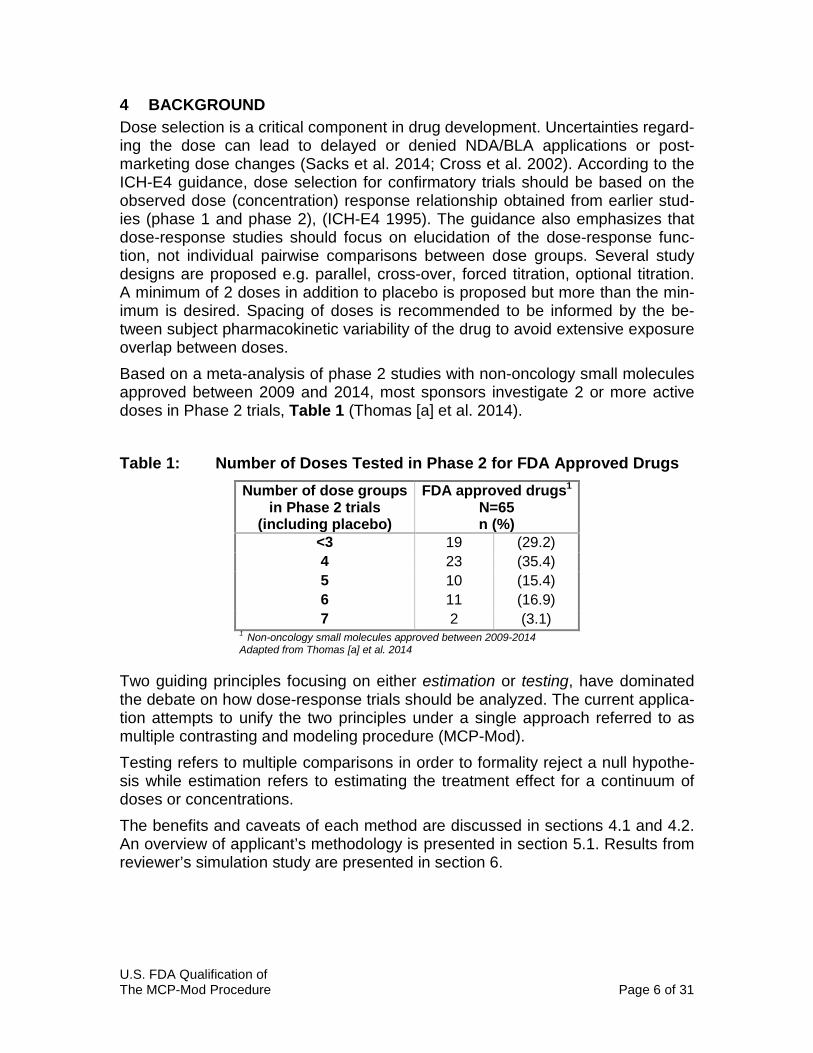
4 BACKGROUND Dose selection is a critical component in drug development. Uncertainties regard-ing the dose can lead to delayed or denied NDA/BLA applications or post-marketing dose changes (Sacks et al. 2014; Cross et al. 2002). According to the ICH-E4 guidance, dose selection for confirmatory trials should be based on the observed dose (concentration) response relationship obtained from earlier stud-ies (phase 1 and phase 2), (ICH-E4 1995). The guidance also emphasizes that dose-response studies should focus on elucidation of the dose-response func-tion, not individual pairwise comparisons between dose groups. Several study designs are proposed e.g. parallel, cross-over, forced titration, optional titration. A minimum of 2 doses in addition to placebo is proposed but more than the min-imum is desired. Spacing of doses is recommended to be informed by the be-tween subject pharmacokinetic variability of the drug to avoid extensive exposure overlap between doses. Based on a meta-analysis of phase 2 studies with non-oncology small molecules approved between 2009 and 2014, most sponsors investigate 2 or more active doses in Phase 2 trials, Table 1 (Thomas [a] et al. 2014). Table 1: Number of Doses Tested in Phase 2 for FDA Approved Drugs
Number of dose groups in Phase 2 trials
(including placebo)
FDA approved drugs1 N=65 n (%)
<3 19 (29.2) 4 23 (35.4) 5 10 (15.4) 6 11 (16.9) 7 2 (3.1)
1 Non-oncology small molecules approved between 2009-2014 Adapted from Thomas [a] et al. 2014
Two guiding principles focusing on either estimation or testing, have dominated the debate on how dose-response trials should be analyzed. The current applica-tion attempts to unify the two principles under a single approach referred to as multiple contrasting and modeling procedure (MCP-Mod). Testing refers to multiple comparisons in order to formality reject a null hypothe-sis while estimation refers to estimating the treatment effect for a continuum of doses or concentrations. The benefits and caveats of each method are discussed in sections 4.1 and 4.2. An overview of applicant’s methodology is presented in section 5.1. Results from reviewer’s simulation study are presented in section 6.
U.S. FDA Qualification of The MCP-Mod Procedure Page 7 of 31
4.1 Estimation Methods The use of estimation methods1 (as opposed to testing methods) to analyze dose-response data is supported in the ICH-E4 guidance and in literature. These recommendations are in line with the learning rather than the confirming purpose of phase 2 studies. Under the ‘learning and confirming’ paradigm; phase 2b con-stitutes a ‘learning’ phase in drug development where the study design and the analysis are geared to maximize information gained from the trial (Sheiner 1997). Estimation based analysis utilizes observations from the continuum of active doses and placebo to estimate the dose-response curve. Once the dose-response curve is estimated, effect size between tested doses (interpolation) as well as effect size beyond the range of the tested doses (extrapolation) can be estimated with various degrees of precision that depend on the position of the observed doses on the dose-response curve and the underlying assumption about of the relationship between dose and response. Assumption regarding the relationship between dose and response takes form of a parametric relationship (a model) that is driven by the observed data. It is generally accepted that esti-mation driven or model-based analysis will lead to more precise and less biased estimation of the dose-response relationship due to utilization of all information across doses. In principal, a dose-response relationship is selected based on how well it de-scribes the observed data. Physiologically plausible dose-response relationships are evaluated based on various goodness of fit criteria in a process referred to as model selection. Following model selection, a single model is selected as the ‘best’ representation of observed data and subsequently used to estimate treat-ment effect. Estimates of treatment effect often account for uncertainty in param-eter estimates giving a probability range of the typical response along the contin-uum of doses. While parameter uncertainty is a function of the information con-tent of the observed data, it does not account for uncertainty in model selection. Uncertainty in model selection can be accounted for by averaging estimates of treatment effect over several or all tested models. It has been argued that ignoring uncertainty in model selection can lead to over-confidence in decision-making (Chatfield 1995)2. It should be noted that Chatfield makes this argument for any decision-making that is based on modeling. As such, there can be an infinitive number of models. Given the finite number of shapes a dose-response curve can take, it is debatable whether or not that ar-gument is applicable to dose-response modeling. A recent meta-analysis of a drug portfolio consisting of 33 drugs and 76 dose-ranging studies found that the maximum response (Emax) model adequately described all but one drug. In fair-
1 Estimation methods are often referred to as modeling methods where the aim is to describe the relationship between two observed variables with mathematical equations. 2 This argument has been brought forward by the applicant as to why modeling approaches alone may lead to over confident decisions. Request for FDA Qualification Opinion section 2.3

U.S. FDA Qualification of The MCP-Mod Procedure Page 8 of 31
ness, it should be noted that in this meta-analysis no dose-ranging study includ-ed less than 3 active doses (Thomas [b] et al. 2014). Thus, most dose-response relationships are adequately described by an Emax model and the impact on model uncertainty on dose selection as it pertains to the shape of the curve may be low. Given that the relationship between dose and response is driven by the observed data, it is sometimes argued that analysis based estimation is a post-hoc analy-sis that has limited value. Prespecification of dose-response analysis in combina-tion with model averaging have been proposed to address the issues with esti-mation based dose-response analysis (Aoki et al. 2014). Others argue that be-cause phase 2 is geared toward learning (hypothesis generation); there is no need to fully pre-specify the analysis and a reasonably predefined and standard-ized data driven model-finding process is appropriate (Sheiner 1997). One can argue that estimation methods do not formally test a hypothesis and that there is a risk of selecting a model that describes a significant dose-response relationship when there is none. A common method to guard against that type of type I error is to first formally test the dose-response relationship with a linear model. This method is described in more detail in section 4.2 (Likelihood Ratio Test Statistic for Monotonicity) and is recommended in proposed good practice principals published in literature (Overgaard et al. 2015). Alternatively, as proposed by Aoki and colleagues, one can use the log-likelihood ratio test to compare each drug-effect model to a no-effect model in order to test for signifi-cant dose-effect relationship. This method has many similarities with the MCP-Mod procedure, for example: both methods combine hypothesis testing to guard against type I error (log likelihood test and multiple contrast procedure) with esti-mation methods to select the minimal therapeutic dose. A direct comparison against these methods is currently not available.
4.1.1 The Utility of Concentration-Response Modeling The MCP-Mod method focuses on analysis of dose-response; however, expo-sure-response analysis is a fundamental part of dose selection, as such it needs to be put in context of this application. Dose-response analysis assumes that all subjects in one dose group are ex-posed to the same amount of drug. Due to between subject variability in drug ab-sorption, distribution, metabolism, and elimination (ADME), subjects administered the same dose may have vastly different drug concentrations in blood. In addition to variability in drug exposure, there is variability in drug response. Thus i, if we can identify what concentration results in a particular effect we can answer the question what dose will result in a particular concentration. Exposure-response modeling can also inform the need for dose adjustment in specific populations that may have different drug exposure compared to the typi-cal patient, e.g. due to renal or hepatic impairment. Without relating exposure to response, there is no way of determining the need to adjust dose due to differ-ence in drug exposure.
U.S. FDA Qualification of The MCP-Mod Procedure Page 9 of 31
The main caveat of exposure-response modeling is that exposure in a subject is not randomized (some randomization is present because different doses result in different exposure ranges). Since exposures are not truly random, there is a pos-sibility that a patient factor affecting drug exposure is also affecting drug re-sponse (independent of drug exposure). This phenomenon is commonly ob-served for large molecules with oncology indications where tumor burden can in-crease the elimination of drugs; however, this phenomenon is rare for small mol-ecules (Yang et al. 2013.) Another assumption about exposure-response modeling is that the treatment ef-fect is related to drug concentrations in blood. This is known not to be true for in-haled COPD and Asthma drugs where the treatment effect is mediated by local drug concentrations at the site of administration. In such cases, dose response analysis is more informative than exposure-response analyses. However, drug safety, an important element of dose selection is related to drug concentrations in blood is well suited for exposure response analysis, e.g. endogenous cortisol suppression by inhaled corticosteroids for treatment of Asthma.

U.S. FDA Qualification of The MCP-Mod Procedure Page 10 of 31
4.2 Testing Methods The common core of most testing methods is the treatment of dose as a categor-ical factor (as opposed to a continuum) and that few (if any) assumptions are made concerning the underlying dose-response relationship. Treating a continu-ous variable, such as dose, as a categorical variable leads to loss of statistical as well as predictive power. Statistical power refers to decreased likelihood of de-tecting a true relationship. Loss of predictive power refers to limiting the infer-ences one can make based on the analysis e.g. diminished ability to estimate ef-fect between or beyond the observed doses. Estimation of overall dose-response is commonly based on analysis of variance (ANOVA), with dose as a factor. ANOVA methods can be extended to include other predictors such as patient’s baseline characteristics, or study design ele-ments such as period and sequence. Several multiple comparison procedures are available to differentiate the effect between doses or treatment arms. These include Williams’ procedure (Williams, 1971, 1972) where active dose are compared versus placebo in a stepwise man-ner (starting from the highest). The procedure tests each dose level but stops at the dose level where the null hypothesis (of no dose effect) is not rejected. Wil-liams’ procedure assumes that effect increases with increasing dose. A popular alternative to Williams’ procedure is Dunnett’s test, also referred to many-to-one comparison. Dunnett’s test reduces the number of comparison by only testing active doses versus placebo (Dunnett et al. 1955). Another method is the Likeli-hood Ratio Test Statistic for Monotonicity. The global likelihood ratio test (Bar-tholomew 1961) can be used to test the null hypothesis of no treatment effect against the alternative hypothesis of where effect increases with dose. The mean effect for each treatment group or dose is estimated with linear regression with or without a slope parameter relating dose to effect. The log likelihood (LL) under the null or the alternative model is compared. When the LL ratio of the two LL is large the null hypothesis is rejected. The threshold for rejection depends on the desired level of significance. A major drawback of this test is the assumption of increasing effect with increasing dose, as is the case for Williams’ procedure. A violation of that assumption leads to dramatic decrease in power of the test, as shown in this review and elsewhere.
4.3 Determination of the Minimal Effective Dose Drug safety data obtained from phase 1 and 2 studies may not always be predic-tive of the drug safety profile at long-term drug exposure observed in large phase 3 trials. It is therefore often advisable to select a lowest dose that will provide a desired therapeutic effect, i.e. the minimal effective dose (MED). It is important to emphasize that there are no statutory requirements to find the minimal effective dose. It is however, an important inference that can be gleaned from a well con-ducted dose-finding study. Finding the MED can minimize unnecessary drug ex-posure that will not lead to additional benefit to the patient but may increase the risk or severity of adverse events.
U.S. FDA Qualification of The MCP-Mod Procedure Page 11 of 31
Several estimation (modeling) methods have been proposed to find the MED. Early examples include the work of Filloon, who was an advocate of estimating the smallest dose with therapeutic benefit as opposed to the smallest dose that is statistically significant from placebo, (Filloon 1995). He argued that since statisti-cal significance is a function of response variability and sample size, larger sam-ples size and smaller response variability would result in lower MED, completely disconnecting MED selection from desired therapeutic effect. Fillon also recog-nized the problem with estimating the typical treatment effect at a given dose as opposed to estimating the percent of subjects that will reach the desired treat-ment effect. He advocated for the use of estimation methods to characterize the dose-response curve for the typical patient and to estimate percentiles for each estimated dose effect in order to select a dose that would benefit a predefined number of subject e.g. 75% of the tested population. Since the works of Filloon, others have contributed to estimation based methods for determining the MED and this practice is now well established in clinical drug development. Recent focus has been on estimating the probability of the typical response to reach a predefined threshold of clinical relevant effect. The estimat-ed probability can be adjusted for multiple levels of uncertainty e.g. uncertainty in parameter estimates and uncertainty in model selection, etc. (Lalonde et al. 2007, Aoki et al. 2014). As mentioned previously, the MCP-Mod procedure relies on modeling methods to estimate the minimal effective dose; an example of this is shown in section 5.2.1. Several methods to identify the minimal effective dose by testing methods have been proposed. Both the Dunnett’s and Williams test have been developed for that purpose. In addition to those methods, step contrasts have also been widely used for finding the minimal effective dose. Bauer and Hackl have shown con-trast to be superior compared to Dunnett’s and Williams’ test, (Bauer and Hackl, 1985). Applicant has submitted evaluations of different methods to estimate the MED, see section 5.2.

U.S. FDA Qualification of The MCP-Mod Procedure Page 12 of 31
5 APPLICANT’S SUBMISSION The documentation submitted by the applicant in support of the Agencies qualifi-cation opinion is shown in Table 2. The submission does not contain original da-tasets or program codes. The MCP-Mod method is implemented in the publicly available software for statistical computing and graphics: R3. The review focused on the Applicant’s simulation studies that compared the MCP-Mod method to other methods. Table 2: Applicant’s submitted documentation in support of qualification opinion Document Content
Request for Qualification Opinion to the Agency Methodological aspects of MCP-Mod Examples of use of MCP-Mod in literature and at Novartis and Jensen Summary of simulation studies comparing MCP-Mod to other methods*
Request for Qualification Opinion to the EMA Similar content as above
Qualification Opinion of MCP-Mod as an efficient sta-tistical methodology for model-based design and analysis of Phase II dose finding studies under model uncertainty
CHMP qualification opinion
Note: * Indicates the focus of this review.
5.1 Overview of the MCP-Mod Procedure The MCP-Mod procedure consists of a study design step and a data analysis stage. In the study design stage, a set of candidate models are selected based on the known pharmacology of the drug and any relevant previous experience with the indication in question. There are two analytical steps within the MCP-Mod procedure, the Multiple con-trast step (MCP) and the Modeling (Mod) step. The Multiple Contrast step aims to identify a statistically significant dose-response signal. A significant dose-response signal is declared if one or more prespecified models have been found to be significant. The statistically significant models form a model pool used to estimate the dose-response relationship and select a dose for further testing (Modeling step).
3 https://cran.r-project.org/web/packages/DoseFinding/index.html
U.S. FDA Qualification of The MCP-Mod Procedure Page 13 of 31
5.2 Applicant’s Comparison of MCP-Mod to Other Methods The applicant has submitted results from 2 simulation studies. The purpose of these studies was to compare MCP-Mod to other established methods for testing a positive dose-response relationship as well as finding the MED. Applicant’s re-sults are summarized below. Reviewer’s own interpretation and conclusions are reported in the main text and separately after each section.
5.2.1 MCP-Mod versus LLR test
Simulation Study 1 The first simulation study compared MCP-Mod to the LLR test and the contrast test (Bauer and Hackl, 1985). This study was published by Branson et al. in 2003. Several dose-response shapes were used to simulate parallel design trials with 5 dose groups (including placebo), Figure 1. Equal sample size per dose group was assumed and ranged from 10 to 150 subjects per group. The null hypothesis of a non-significant dose-response relationship was tested at one sided alpha of 0.05. The standard deviation was set at 1.478. A power of 80 % is achieved at a sample size of 75 for the pairwise test at the maximum effect 0.6. A total of 10.000 simulations were performed under each shape and sample size. Results of simulation study 1 are shown in Table 3. Only results from sample size of n=75 are shown. The following inferences are made with regards to power to detect a true dose-response relationship:4
• The MCP-Mod method was numerically superior to LLR for all model shapes except for convex shape.
• The MCP-Mod method was numerically superior to Step Contrast for all model shapes except for convex shape.
• The median power difference between MCP-Mod and LLR was 1.45%, in favor of MCP-Mod.
• The median difference between MCP-Mod and step contrast was 2.85%, in favor of MCP-Mod.
• The median difference between LLR and step contrast was 0.8%, in favor of LLR.
The following inferences are made with regards to type I error rate.
• All methods performed equally and adequately in terms of type I error rate. The reviewer as well as the applicant agree that power is very similar between LLR and MCP-Mod. MCP-Mod was inferior to LLR for the convex shape, likely
4 Power is defined as percent of the simulated trials where a significant dose-response relation-ship was found.

U.S. FDA Qualification of The MCP-Mod Procedure Page 14 of 31
because that model was not included in the MCP-Mod library. Power to detect a true significant dose-response under the convex shape was 14% lower com-pared to the average power of the other shapes. This reviewer thinks that this is an indication of how sensitive the performance of MCP-Mod is to the prespecifi-cation of the model library. This is in contrast to the robustness of LLR under the monotone dose-response shape assumption. In cases where the assumption of monotonicity is violated (quadratic and the double-logistic shapes), LLR test per-formance is on average 16% lower compared to shapes that are monotone.
Figure 1: Dose-response Models Included in Applicants Simulation Study 1
Source: Request for Qualification Opinion, Figure 3-7

U.S. FDA Qualification of The MCP-Mod Procedure Page 15 of 31
Table 3: Dose-response Signal Detection Probabilities at Sample Size n=75 (Applicant’s Simulation Study 1)
Model Shape MCP-Mod LRT Step Contrast
Constant 0.051* 0.052 0.055
Emax 0.868 0.857 0.841
Lin-log 0.891 0.874 0.858
Linear 0.880 0.865 0.850
Exponential 0.862 0.858 0.844
Quad 0.799 0.684 0.682
Logistic 0.960 0.946 0.944
Double Logist 0.805 0.721 0.726
Convex 0.728 0.761 0.753 Source: Adapted from Request for Qualification Opinion, Table 3-3. Notes: Green, yellow and red cell color indicates the method with highest, second highest and lowest power. * indicates the method with lowest type I error.
Reviewer’s comments: Parts of simulation study 1 were independently replicated by the reviewers. Results are presented in section 6.
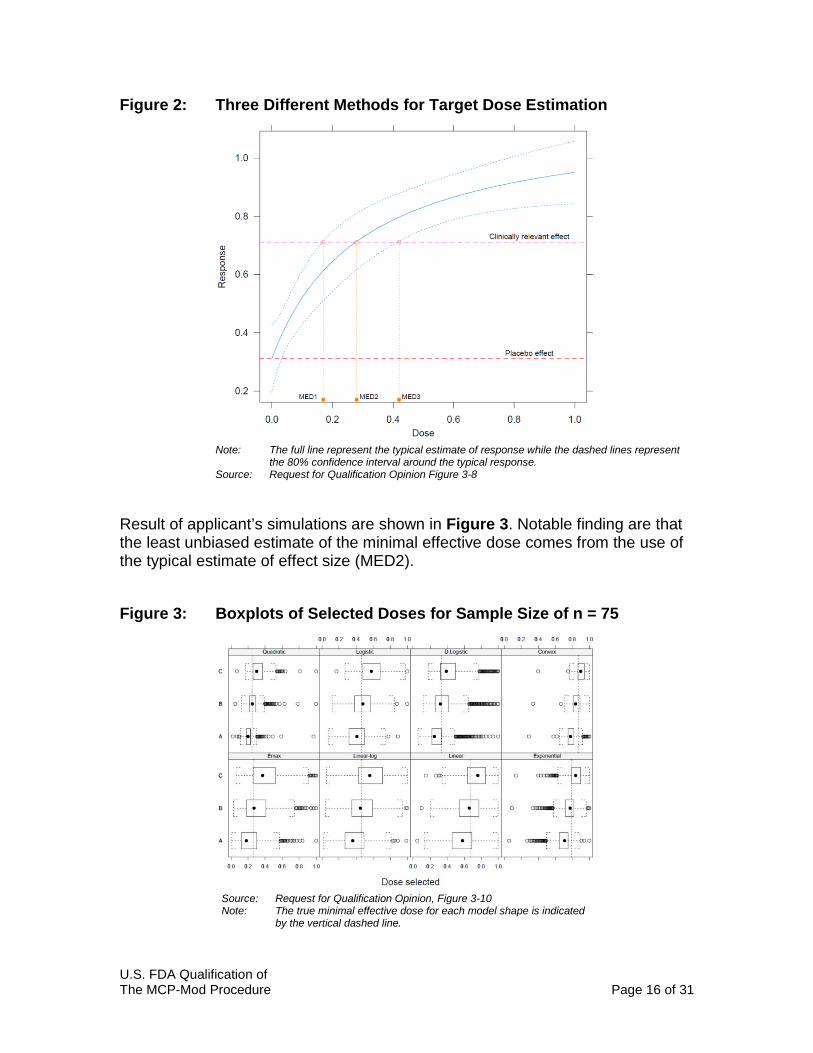
In addition to investigate the power of MCP-Mod in comparison to other methods, simulation study 1 investigated the probability of the MCP-Mod method to detect a “true” under simulation scenario pre-defined minimal effective dose. No com-parison was performed to stepwise contrast method because it is not equipped to detect a minimal effective dose outside of the observed doses (no interpolation or extrapolation is possible). The LLR ratio test is designed to test the overall signif-icance of a positive dose-response signal. Hence no comparison to select the minimal effective dose was made. The minimal effective dose was defined as the smallest dose that reached the clinical relevant effect of 0.4 points over placebo. These simulations were con-ducted using the same model shapes as before but with a lower residual error (σ = 0.65, compared to σ =1.478). The minimal effective dose was estimated using 3 methods as shown in Figure 2. The three methods rely on the typical estimate, the upper, or the lower confidence interval with the estimated probability to reach the target effect size. Applicant reports using 80% confidence intervals for the purpose of finding the minimal effective dose.
U.S. FDA Qualification of The MCP-Mod Procedure Page 16 of 31
Figure 2: Three Different Methods for Target Dose Estimation
Note: The full line represent the typical estimate of response while the dashed lines represent the 80% confidence interval around the typical response. Source: Request for Qualification Opinion Figure 3-8
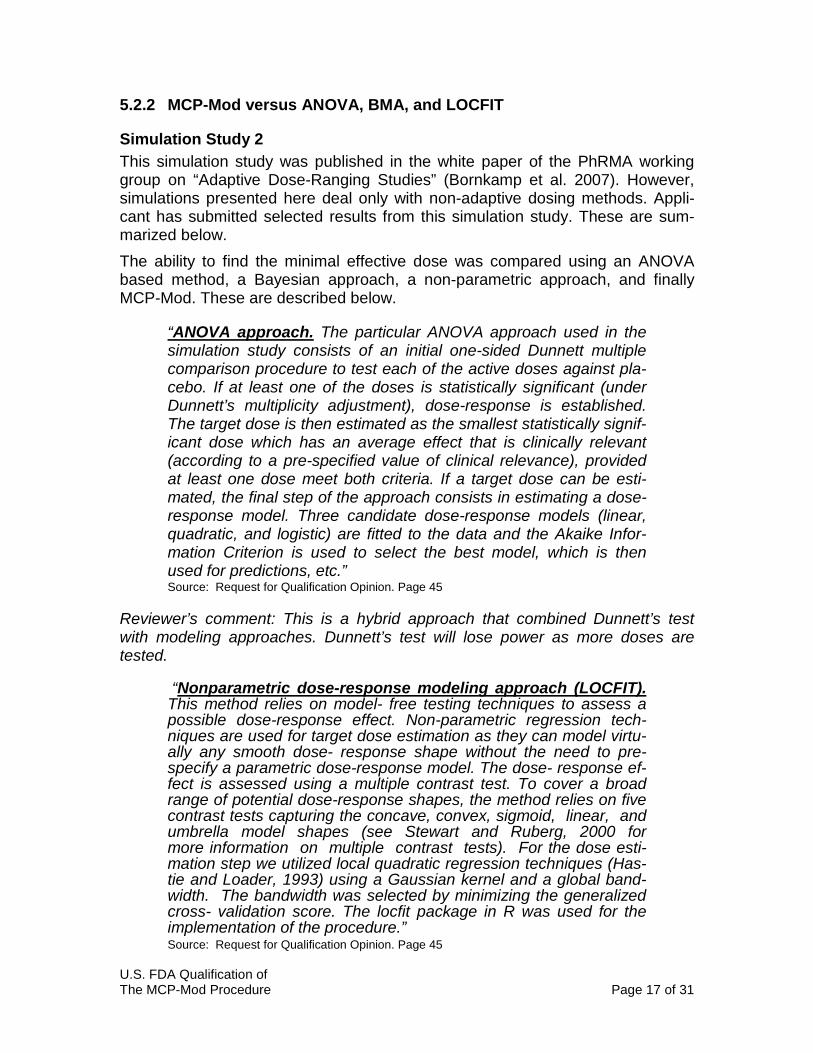
Result of applicant’s simulations are shown in Figure 3. Notable finding are that the least unbiased estimate of the minimal effective dose comes from the use of the typical estimate of effect size (MED2). Figure 3: Boxplots of Selected Doses for Sample Size of n = 75
Source: Request for Qualification Opinion, Figure 3-10 Note: The true minimal effective dose for each model shape is indicated by the vertical dashed line.
U.S. FDA Qualification of The MCP-Mod Procedure Page 17 of 31
5.2.2 MCP-Mod versus ANOVA, BMA, and LOCFIT
Simulation Study 2 This simulation study was published in the white paper of the PhRMA working group on “Adaptive Dose-Ranging Studies” (Bornkamp et al. 2007). However, simulations presented here deal only with non-adaptive dosing methods. Appli-cant has submitted selected results from this simulation study. These are sum-marized below. The ability to find the minimal effective dose was compared using an ANOVA based method, a Bayesian approach, a non-parametric approach, and finally MCP-Mod. These are described below.
“ANOVA approach. The particular ANOVA approach used in the simulation study consists of an initial one-sided Dunnett multiple comparison procedure to test each of the active doses against pla-cebo. If at least one of the doses is statistically significant (under Dunnett’s multiplicity adjustment), dose-response is established. The target dose is then estimated as the smallest statistically signif-icant dose which has an average effect that is clinically relevant (according to a pre-specified value of clinical relevance), provided at least one dose meet both criteria. If a target dose can be esti-mated, the final step of the approach consists in estimating a dose-response model. Three candidate dose-response models (linear, quadratic, and logistic) are fitted to the data and the Akaike Infor-mation Criterion is used to select the best model, which is then used for predictions, etc.”
Source: Request for Qualification Opinion. Page 45
Reviewer’s comment: This is a hybrid approach that combined Dunnett’s test with modeling approaches. Dunnett’s test will lose power as more doses are tested.
“Nonparametric dose-response modeling approach (LOCFIT). This method relies on model- free testing techniques to assess a possible dose-response effect. Non-parametric regression tech-niques are used for target dose estimation as they can model virtu-ally any smooth dose- response shape without the need to pre-specify a parametric dose-response model. The dose- response ef-fect is assessed using a multiple contrast test. To cover a broad range of potential dose-response shapes, the method relies on five contrast tests capturing the concave, convex, sigmoid, linear, and umbrella model shapes (see Stewart and Ruberg, 2000 for more information on multiple contrast tests). For the dose esti-mation step we utilized local quadratic regression techniques (Has-tie and Loader, 1993) using a Gaussian kernel and a global band-width. The bandwidth was selected by minimizing the generalized cross- validation score. The locfit package in R was used for the implementation of the procedure.” Source: Request for Qualification Opinion. Page 45

U.S. FDA Qualification of The MCP-Mod Procedure Page 18 of 31
“Bayesian model-averaging approach (BMA). Bayesian model averaging is a strategy intermediate between parametric modeling and nonparametric modeling that tries to avoid the dangers of un-der- or over-fitting. As a basis here a set of relatively simple dose-response models is used. Then, starting from prior model probabili-ties (“weights”), as well as prior distributions on the model-specific parameters, standard Bayesian inference leads to posterior up-dates of the unknown quantities (model weights and model pa-rameters). The approach is well-suited for situations where the quantity of interest is model-independent, such as in dose- ranging studies where the objective is to find a dose fulfilling a certain pre-specified criterion. Bayesian model averaging generalizes model selection strategies and has the advantage of weighting the candi-date models in an appropriate (data-dependent) way. A simple in-formal Bayesian model averaging approach based on a set of nor-mal linear models allowing for analytic posterior updates was used. Here this choice was mainly dictated by the fact that MCMC-based posterior inferences for non-conjugate models would have made simulations computationally infeasible. The approach is informal in that it only uses posterior summaries as a basis for dose selec-tions.”
Source: Request for Qualification Opinion. Page 45
Reviewer’s comment: The original publication investigated the performance of other methods; these include Multiple Trend Test Approach (MTT), D-Optimal Response-Adaptive Approach (Dop), and Bayesian Adaptive Dose Allocation Approach (GADA). Applicant’s decision to not include results from the methods that rely on adaptive trial design is understandable. It is however not clear why results from Multiple Trend Test approach were omitted since the MTT method is related to the MCP-Mod method and does not rely on adaptive trial elements.
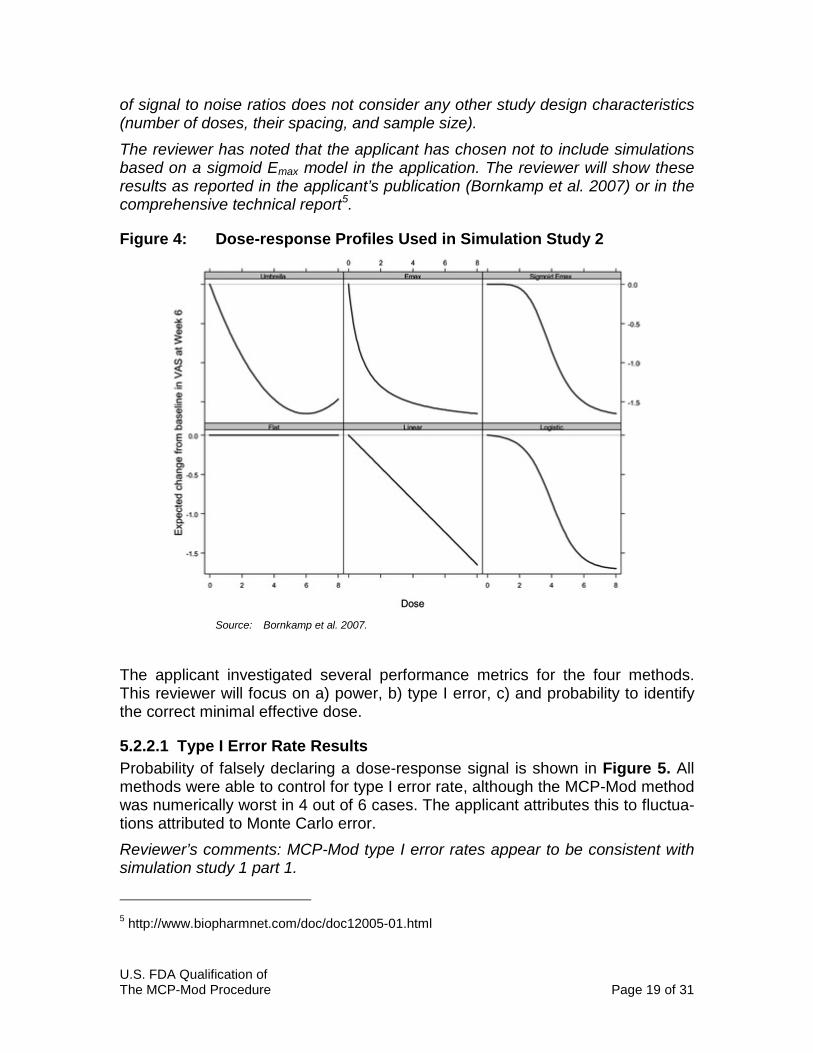
Drug effect was simulated under different dose-response shapes (Figure 4), and various dosing scenarios.
• Five equally spaced doses: 0, 2, 4, 6, and 8. • Seven unequally spaced doses: 0, 2, 3, 4, 5, 6, 8. • All nine equally spaced doses: 0, 1, …, 8.
The maximum effect was set to -1.65 units for all model shapes. Residual error was assumed to be normally distributed with a mean of zero and variance of 4.5. Simulations were conducted with a total sample size of 150 or 250 patients. Total sample size is the sum of number of patients in each dose arm. Number of simu-lations per method varied between 5,000 and 10,000 samples. Reviewer’s comments: These dosing scenarios differ significantly from the typical phase 2 trial in terms of number of doses and their spacing (Table 1). Traditional-ly dose-response trials do not have equal spacing between doses and usually do not include more than 3 to 4 active doses. The residual error variance of 4.5 or 2.12 standard deviations corresponds to a 0.78 signal to noise ratio. This ratio is larger than the signal to noise ratio in simulation study 1 part 1 (0.41) but smaller than the signal to noise ratio of simulation study 1 part 2 (0.92). The comparison
U.S. FDA Qualification of The MCP-Mod Procedure Page 19 of 31
of signal to noise ratios does not consider any other study design characteristics (number of doses, their spacing, and sample size). The reviewer has noted that the applicant has chosen not to include simulations based on a sigmoid Emax model in the application. The reviewer will show these results as reported in the applicant’s publication (Bornkamp et al. 2007) or in the comprehensive technical report5.
Figure 4: Dose-response Profiles Used in Simulation Study 2
Source: Bornkamp et al. 2007.
The applicant investigated several performance metrics for the four methods. This reviewer will focus on a) power, b) type I error, c) and probability to identify the correct minimal effective dose.
5.2.2.1 Type I Error Rate Results Probability of falsely declaring a dose-response signal is shown in Figure 5. All methods were able to control for type I error rate, although the MCP-Mod method was numerically worst in 4 out of 6 cases. The applicant attributes this to fluctua-tions attributed to Monte Carlo error. Reviewer’s comments: MCP-Mod type I error rates appear to be consistent with simulation study 1 part 1.
5 http://www.biopharmnet.com/doc/doc12005-01.html

U.S. FDA Qualification of The MCP-Mod Procedure Page 20 of 31
Figure 5: Type I Error Rate for Detecting Dose-response Under Flat Dose-response Profile
Source: Request for Qualification Opinion. Figure 3-12
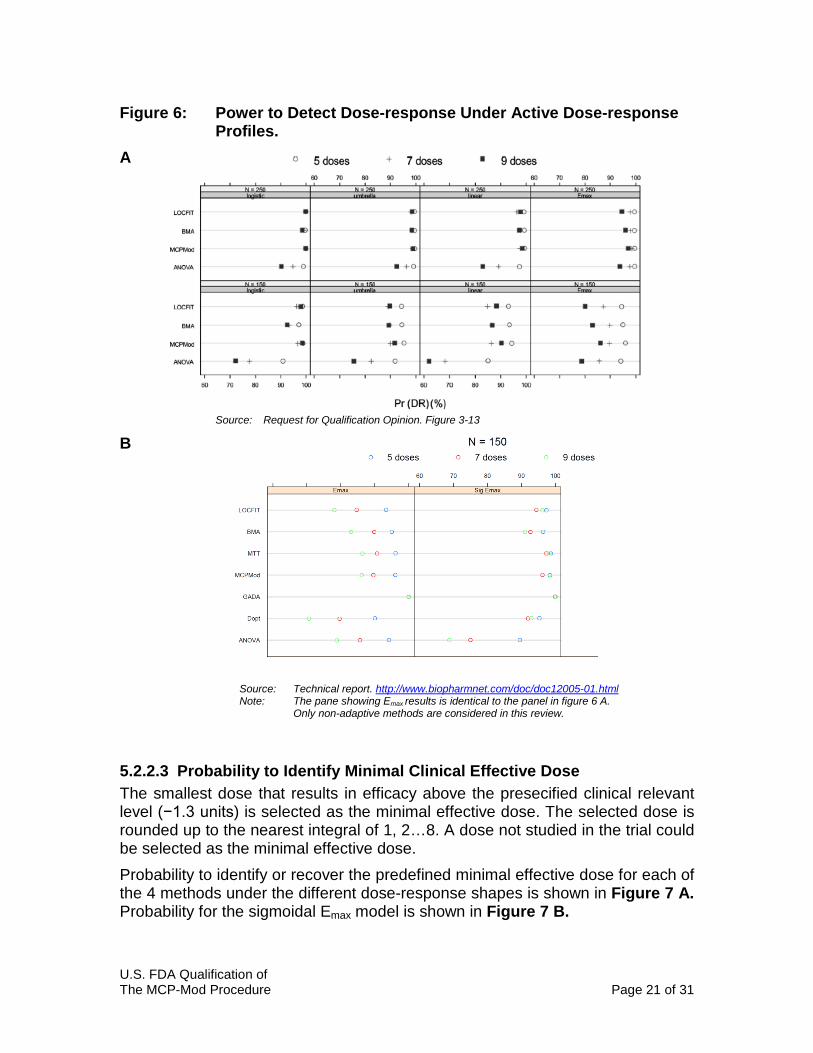
5.2.2.2 Power to Declare Significant Dose-response The probabilities of detecting true dose-response are shown in Figure 6. As ex-pected the ANOVA followed by Dunnett’s test loses power when the number of doses increase due to adjustment for multiplicity. The other three methods ap-pear to consistently outperform ANOVA. The MCP-Mod approach and the other two approaches were also shown to lose power when number of doses increase from 5 to 9. The applicant acknowledges this finding in their 2007 publication but not in the current submission.
“It is worth noting that increasing the number of doses, while keeping the total sample size fixed, does not lead to an in-crease in power to detect DR, even for model-based ap-proaches. In fact, for some model-method combinations, Pr(DR)decreased with the number of doses.” Bornkamp et al. 2007
Results from simulations using the sigmoid Emax model were omitted in this sub-mission. They have been retrieved by the reviewer and presented in Figure 6 B. It is noteworthy that MCP-Mod method performs better under the sigmoid Emax model.
U.S. FDA Qualification of The MCP-Mod Procedure Page 21 of 31
Figure 6: Power to Detect Dose-response Under Active Dose-response Profiles. A
Source: Request for Qualification Opinion. Figure 3-13
B
Source: Technical report. http://www.biopharmnet.com/doc/doc12005-01.html Note: The pane showing Emax results is identical to the panel in figure 6 A. Only non-adaptive methods are considered in this review.
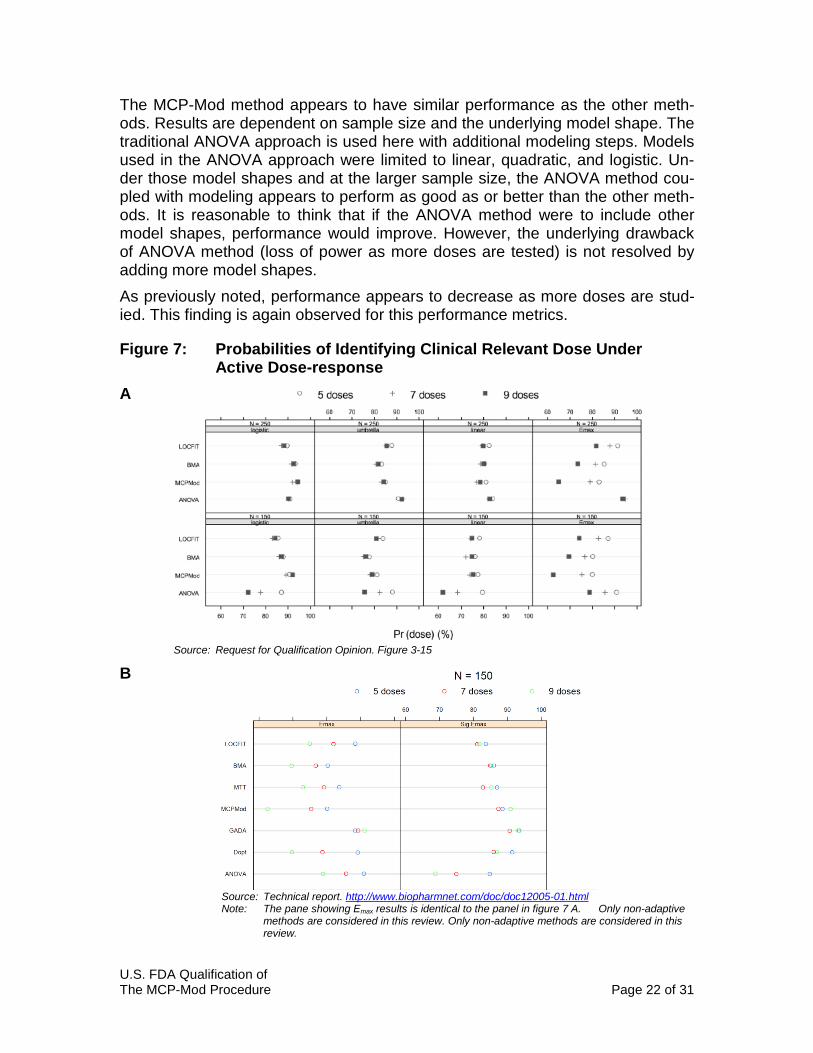
5.2.2.3 Probability to Identify Minimal Clinical Effective Dose The smallest dose that results in efficacy above the presecified clinical relevant level (−1.3 units) is selected as the minimal effective dose. The selected dose is rounded up to the nearest integral of 1, 2…8. A dose not studied in the trial could be selected as the minimal effective dose. Probability to identify or recover the predefined minimal effective dose for each of the 4 methods under the different dose-response shapes is shown in Figure 7 A. Probability for the sigmoidal Emax model is shown in Figure 7 B.
U.S. FDA Qualification of The MCP-Mod Procedure Page 22 of 31
The MCP-Mod method appears to have similar performance as the other meth-ods. Results are dependent on sample size and the underlying model shape. The traditional ANOVA approach is used here with additional modeling steps. Models used in the ANOVA approach were limited to linear, quadratic, and logistic. Un-der those model shapes and at the larger sample size, the ANOVA method cou-pled with modeling appears to perform as good as or better than the other meth-ods. It is reasonable to think that if the ANOVA method were to include other model shapes, performance would improve. However, the underlying drawback of ANOVA method (loss of power as more doses are tested) is not resolved by adding more model shapes. As previously noted, performance appears to decrease as more doses are stud-ied. This finding is again observed for this performance metrics.
Figure 7: Probabilities of Identifying Clinical Relevant Dose Under Active Dose-response A
Source: Request for Qualification Opinion. Figure 3-15 B
Source: Technical report. http://www.biopharmnet.com/doc/doc12005-01.html Note: The pane showing Emax results is identical to the panel in figure 7 A. Only non-adaptive methods are considered in this review. Only non-adaptive methods are considered in this review.
U.S. FDA Qualification of The MCP-Mod Procedure Page 23 of 31
5.2.3 Reviewer’s Conclusions The applicant submitted an overview of two simulation studies where MCP-Mod was assessed based on metrics relevant to the analysis of dose ranging trials. These metrics included type I error rate, power to detect a significant dose-response shape, and the power to find the minimal effective dose. Comparisons were made to other data analysis methods; these included a combination of ANOVA with Dunnett’s test coupled with a limited modeling approach; a Bayesi-an modeling approach, and a non-parametric modeling approach. MCP-Mod was also compared to the log likelihood ratio test (linear regression) but only in terms of power and type I error rate. The simulation studies were conducted in a manner that explores different model shapes and sample sizes. However based on literature reports on phase 2 study design, see section 4, and this reviewer’s experience, there is a disconnect be-tween what is the typical phase 2 study and the simulations reported here. Par-ticularly in the sense that a typical phase 2 study includes 3 to 4 dose while the number of doses in applicant’s simulations ranged between 5 and 9. As previous-ly stated (see section 4.1), it is reported in literature that dose ranging data typi-cally has an Emax type of shape. The Emax shape was indeed investigated in these simulations; however other shapes (even some very unlikely shapes) are given equal weight in these simulations. This reviewer is therefore making his conclu-sions with special attention to simulations that are closest to the typical dose ranging trial. With respect to power and type I error rate, the ANOVA based method suffered (as expected) from loss of power with increasing number of doses. So did the other methods (including MCP-Mod) but to a less extend than ANOVA. MCP-Mod method was not shown to be superior nor was it inferior to LLR test, Bayesi-an modeling or non-parametric modeling. The LLR test and MCP-Mod had very similar performance. Both methods where shown to have their weakness and strengths. The MCP-Mod method seems to be sensitive to the initial ‘guesses’ of the model shapes that are included in the analysis. This was evident in simulation study 1 part 1 when power of the MCP-Mod approach was significantly lower when the data was simulated with a model not included in the MCP-Mod library. A somewhat counter-intuitive finding was that MCP-Mod and other modeling methods performed worse when number of dose arms increased but the total sample size remained the same. A possible explanation to this finding is that the design with smaller number of doses includ-ed more subjects at highly optimal or influential doses compared to the other de-signs. Reviewer’s own simulation study lends support to this explanation, see section 6. It should be noted that both the model shape and model parameters need to be known a priori in order to design a dose-ranging study based on the D-optimal design. This is almost never the case in clinical drug development. It is therefore good practice to explore a wide range of doses so that the shape of the dose response curve can be characterized. Power to find the minimal effective dose differed across model shapes and sam-ple sizes. No method was consistently better than the other.
U.S. FDA Qualification of The MCP-Mod Procedure Page 24 of 31
6 REVIEWER’S ANALYSIS
Introduction The purpose of this simulation study is to compare the MCP-Mod procedure to the log-likelihood ratio test. Log-likelihood ratio test is widely used to assess the global dose (exposure) response relationship and is currently recommended in published best practice principals of exposure-response analysis (Overgaard et al. 2015). Reviewer’s analysis was conducted in collaboration with Dr. Lei Nie (Office of Bi-ostatistics). Objectives The objective of this analysis is to confirm the applicant’s finding with an inde-pendent analysis. The analysis will focus on the following: Objective 1: Assess the power of the MCP and the LLR test to detect a true
dose-response relationship under different simulated true dose-response relationships.
Objective 2: Assess type I error rate of the MCP and LLR when no true dose-response effect is present.
Objective 3: Assess the influence of increasing the number of doses when the total samples size is the same on power to detect true dose re-sponse relationship.
Objective 4: Asses the influence of using D-optimal design on power to detect true dose-response relationship.
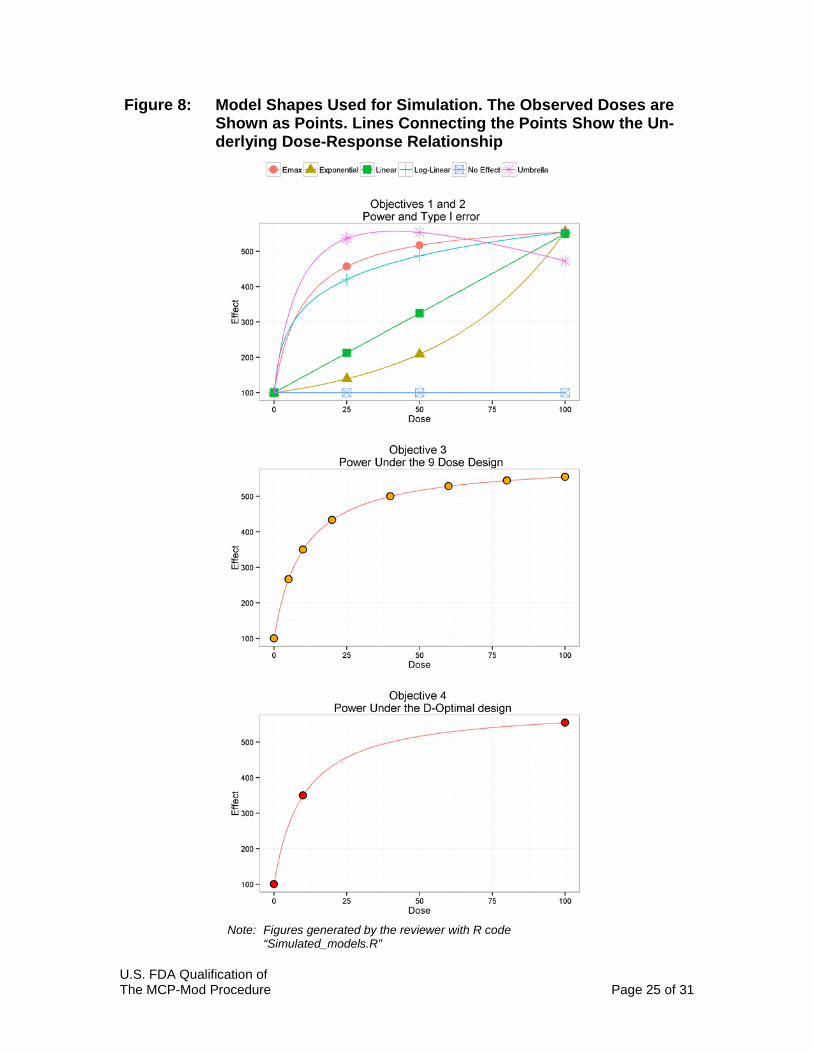
Methods The maximal observed effect adjusted for placebo was 455 under all model shapes. The dose resulting in the highest effect was the highest dose simulated for all models except for the Umbrella model where the nominal dose of 50 re-sulted in highest effect over placebo, Figure 8. All models were simulated with a residual error with the mean of 0 and the standard deviation of 400. Simulations were repeated 10,100 times. A power of 90 % (α=0.05) is achieved at a sample size of 18 for the one sided pairwise test at the maximum effect over placebo (455 units). The following doses were tested in the simulation study Objectives 1 and 2. Effect at placebo (dose: 0), and nominal doses of 25, 50, and 100 were simulated for all models. This design is considered to be the ‘standard design’ of phase 2 dose ranging trials. Objective 3. Nine (9) doses including placebo were simulated. These were: 0, 2.5, 5, 10, 20, 40, 60, 80, and 100. Objective 4. Tree doses (0, 10, 100) were selected based on the D-optimal de-sign under the Emax model. Optimal doses were restricted to be between 0 and 100 and to increase in increments of 5 units.
U.S. FDA Qualification of The MCP-Mod Procedure Page 25 of 31
Figure 8: Model Shapes Used for Simulation. The Observed Doses are Shown as Points. Lines Connecting the Points Show the Un-derlying Dose-Response Relationship
Note: Figures generated by the reviewer with R code “Simulated_models.R”

U.S. FDA Qualification of The MCP-Mod Procedure Page 26 of 31
Methods: Software R (version 3.2.1) in conjunction with R Studio (version 0.99.486) was used for simulation, data analysis and visualization. DoseFinding (version 0.9-13) pack-age in R was used to find the D-optimal design and to apply the MCP-Mod meth-od.
Methods: Models Model equations and model parameters used in these simulations are shown in Table 4. Table 4. Model Equations and Parameter Values Used in Reviewer’s Simulations Model Equation
Parameter definition and numerical value used in simulations
Emax
𝐸𝐸 = 𝐸𝐸0 +
𝐸𝐸𝑚𝑚𝑚𝑚𝑚𝑚 × 𝐷𝐷𝐷𝐷𝐷𝐷𝐷𝐷𝐸𝐸𝐷𝐷50 + 𝐷𝐷𝐷𝐷𝐷𝐷𝐷𝐷 + 𝜎𝜎
𝐸𝐸𝑚𝑚𝑚𝑚𝑚𝑚:𝑀𝑀𝑀𝑀𝑀𝑀𝑀𝑀𝑀𝑀𝑀𝑀𝑀𝑀 𝐷𝐷𝑒𝑒𝑒𝑒𝐷𝐷𝑒𝑒𝑒𝑒 (500) 𝐸𝐸𝐷𝐷50: 𝐷𝐷𝐷𝐷𝐷𝐷𝐷𝐷 𝑟𝑟𝐷𝐷𝑟𝑟𝑟𝑟𝑀𝑀𝑟𝑟𝐷𝐷𝑟𝑟 𝑒𝑒𝐷𝐷 𝑟𝑟𝐷𝐷𝑀𝑀𝑒𝑒ℎ 𝐸𝐸𝑚𝑚𝑚𝑚𝑚𝑚/2 (10) 𝐸𝐸0: 𝑃𝑃𝑀𝑀𝑀𝑀𝑒𝑒𝐷𝐷𝑃𝑃𝐷𝐷 𝑟𝑟𝐷𝐷𝐷𝐷𝑟𝑟𝐷𝐷𝑟𝑟𝐷𝐷𝐷𝐷 𝑒𝑒𝐷𝐷𝑟𝑟 𝑀𝑀𝑀𝑀𝑀𝑀 𝑀𝑀𝐷𝐷𝑟𝑟𝐷𝐷𝑀𝑀𝐷𝐷 (100) 𝜎𝜎: 𝑟𝑟𝐷𝐷𝐷𝐷𝑀𝑀𝑟𝑟𝑟𝑟𝑀𝑀𝑀𝑀 𝐷𝐷𝑟𝑟𝑟𝑟𝐷𝐷𝑟𝑟,𝑀𝑀𝐷𝐷𝑀𝑀𝑟𝑟 𝐷𝐷𝑒𝑒 0 𝑀𝑀𝑟𝑟𝑟𝑟 𝐷𝐷𝑟𝑟 𝐷𝐷𝑒𝑒 400 𝑒𝑒𝐷𝐷𝑟𝑟 𝑀𝑀𝑀𝑀𝑀𝑀 𝑀𝑀𝐷𝐷𝑟𝑟𝐷𝐷𝑀𝑀𝐷𝐷
Linear 𝐸𝐸 = 𝐸𝐸0 + 𝛿𝛿 ∗ 𝐷𝐷𝐷𝐷𝐷𝐷𝐷𝐷 + 𝜎𝜎 𝛿𝛿: 𝑆𝑆𝑀𝑀𝐷𝐷𝑟𝑟𝐷𝐷 𝑟𝑟𝑀𝑀𝑟𝑟𝑀𝑀𝑀𝑀𝐷𝐷𝑒𝑒𝐷𝐷𝑟𝑟 (4.5)
Log-Linear 𝐸𝐸 = 𝐸𝐸0 + 𝛿𝛿 ∗ ln (𝐷𝐷𝐷𝐷𝐷𝐷𝐷𝐷 + 1) + 𝜎𝜎 𝛿𝛿: 𝑆𝑆𝑀𝑀𝐷𝐷𝑟𝑟𝐷𝐷 𝑟𝑟𝑀𝑀𝑟𝑟𝑀𝑀𝑀𝑀𝐷𝐷𝑒𝑒𝐷𝐷𝑟𝑟 (98.5)
Umbrella 𝐸𝐸 = 𝐸𝐸0 +𝐸𝐸𝑚𝑚𝑚𝑚𝑚𝑚 × 𝐷𝐷𝐷𝐷𝐷𝐷𝐷𝐷𝐸𝐸𝐷𝐷50 + 𝐷𝐷𝐷𝐷𝐷𝐷𝐷𝐷 − 𝑟𝑟 × 𝐷𝐷𝐷𝐷𝐷𝐷𝐷𝐷 + 𝜎𝜎 𝐸𝐸𝑚𝑚𝑚𝑚𝑚𝑚:𝑀𝑀𝑀𝑀𝑀𝑀𝑀𝑀𝑀𝑀𝑀𝑀𝑀𝑀 𝐷𝐷𝑒𝑒𝑒𝑒𝐷𝐷𝑒𝑒𝑒𝑒 𝑀𝑀𝑒𝑒 𝑟𝑟 = 0 (705)
𝐸𝐸𝐷𝐷50: 𝐷𝐷𝐷𝐷𝐷𝐷𝐷𝐷 𝑟𝑟𝐷𝐷𝑟𝑟𝑟𝑟𝑀𝑀𝑟𝑟𝐷𝐷𝑟𝑟 𝑒𝑒𝐷𝐷 𝑟𝑟𝐷𝐷𝑀𝑀𝑒𝑒ℎ 𝐸𝐸𝑚𝑚𝑚𝑚𝑚𝑚/2 (10) 𝑟𝑟:𝑟𝑟𝐷𝐷𝑛𝑛𝑀𝑀𝑒𝑒𝑀𝑀𝑛𝑛𝐷𝐷 𝐷𝐷𝑀𝑀𝐷𝐷𝑟𝑟𝐷𝐷 (2.68)
Exponential 𝐸𝐸 = 𝐸𝐸0 + 𝐸𝐸1 ∗ exp �𝐷𝐷𝐷𝐷𝐷𝐷𝐷𝐷𝛿𝛿 − 1� + 𝜎𝜎 𝛿𝛿: 𝑒𝑒𝐷𝐷𝑟𝑟𝑛𝑛𝐷𝐷𝑀𝑀𝑀𝑀𝑒𝑒𝑐𝑐 𝑟𝑟𝑀𝑀𝑟𝑟𝑀𝑀𝑀𝑀𝐷𝐷𝑒𝑒𝐷𝐷𝑟𝑟 (43.21)
𝐸𝐸1: 𝑆𝑆𝑀𝑀𝐷𝐷𝑟𝑟𝐷𝐷 𝑟𝑟𝑀𝑀𝑟𝑟𝑀𝑀𝑀𝑀𝐷𝐷𝑒𝑒𝐷𝐷 (50)
Results
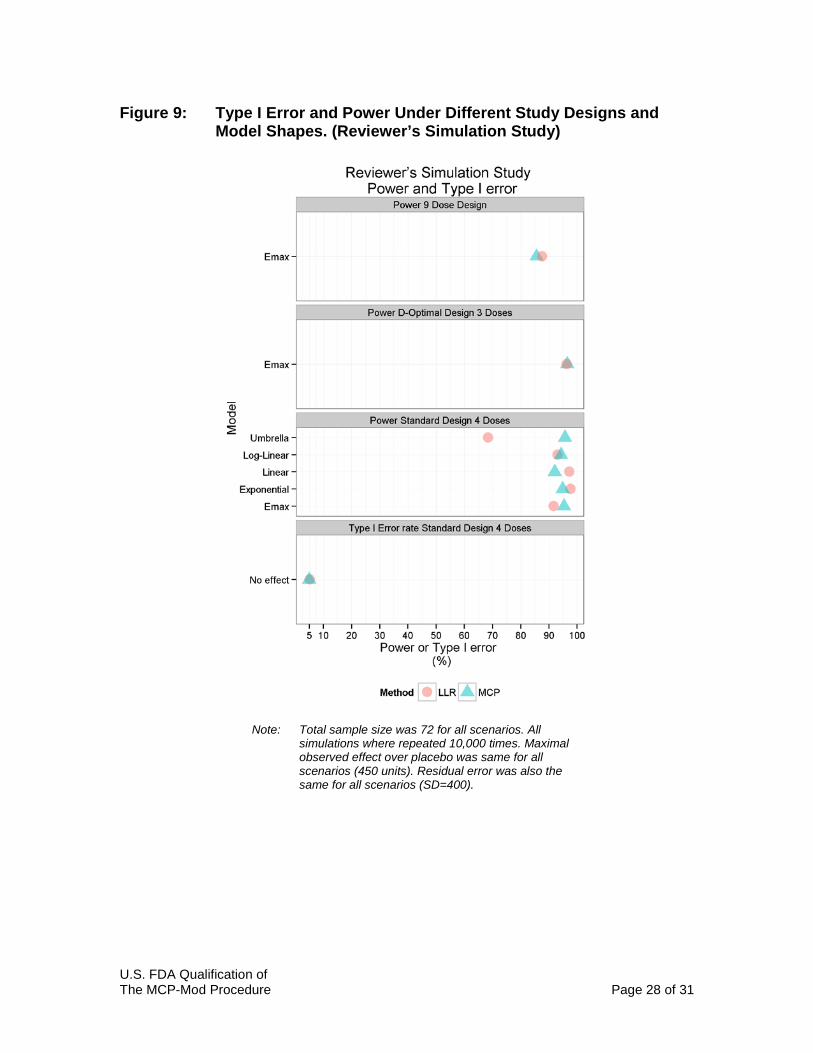
Objectives 1 and 2: Power and Type I Error Rate Results are visualized in Figure 9. The type I error rate was similar and accepta-ble for both MCP-Mod and LLR. A small numerical difference was observed in favor of MCP-Mod. MCP-Mod method and the LLR test have similar power to detect a significant dose-response relationship for most model shapes. LLR test was numerically su-perior for the linear and the exponential model while MCP-Mod was superior un-der the Emax and the log-linear model shape. As expected power of the LLR test is significantly lower under the umbrella model shape because of the monotonici-ty assumption of the LLR test.
U.S. FDA Qualification of The MCP-Mod Procedure Page 27 of 31
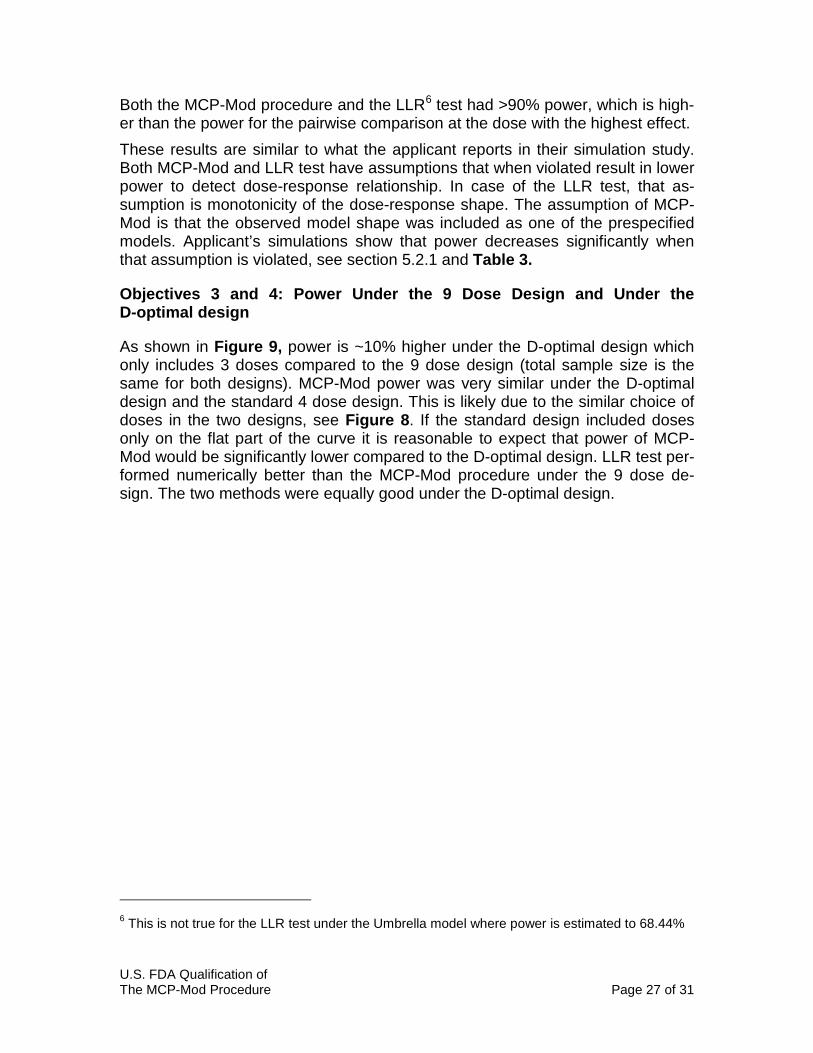
Both the MCP-Mod procedure and the LLR6 test had >90% power, which is high-er than the power for the pairwise comparison at the dose with the highest effect. These results are similar to what the applicant reports in their simulation study. Both MCP-Mod and LLR test have assumptions that when violated result in lower power to detect dose-response relationship. In case of the LLR test, that as-sumption is monotonicity of the dose-response shape. The assumption of MCP-Mod is that the observed model shape was included as one of the prespecified models. Applicant’s simulations show that power decreases significantly when that assumption is violated, see section 5.2.1 and Table 3.
Objectives 3 and 4: Power Under the 9 Dose Design and Under the D-optimal design
As shown in Figure 9, power is ~10% higher under the D-optimal design which only includes 3 doses compared to the 9 dose design (total sample size is the same for both designs). MCP-Mod power was very similar under the D-optimal design and the standard 4 dose design. This is likely due to the similar choice of doses in the two designs, see Figure 8. If the standard design included doses only on the flat part of the curve it is reasonable to expect that power of MCP-Mod would be significantly lower compared to the D-optimal design. LLR test per-formed numerically better than the MCP-Mod procedure under the 9 dose de-sign. The two methods were equally good under the D-optimal design.
6 This is not true for the LLR test under the Umbrella model where power is estimated to 68.44%
U.S. FDA Qualification of The MCP-Mod Procedure Page 28 of 31
Figure 9: Type I Error and Power Under Different Study Designs and Model Shapes. (Reviewer’s Simulation Study)
Note: Total sample size was 72 for all scenarios. All simulations where repeated 10,000 times. Maximal observed effect over placebo was same for all scenarios (450 units). Residual error was also the same for all scenarios (SD=400).

U.S. FDA Qualification of The MCP-Mod Procedure Page 29 of 31
Listing of Analyses Codes and Output Files File Name Description Location in
\\cdsnas\pharmacometrics\
D_optimal_emax.R R code used to calculate optimal design for the Emax model in the reviewer’s simulation study
…/MCP_MOD_DR
Simulated_models.R R code used to generate Figure 8
Power.T.test.R R code used to calculate samples power in reviewer’s simulation study
Sim.Eff.R Sim.Eff_analysis
R code used to estimate power under the Emax model in reviewer’s simulation study
Sim.Eff_expo.R Sim.Eff_expo_analysis.R
R code used to estimate power under the Exponential model in reviewer’s simula-tion study
Sim.Eff_linear.R Sim.Eff_Linear_analysis.R
R code used to estimate power under the Linear model in reviewer’s simula-tion study
Sim._LOG_lin_Eff.R Sim.Eff_Log_Linear_analysis.R
R code used to estimate power under the Log-Linear model in reviewer’s simula-tion study
Sim.Eff_umbrella.R Sim.Eff_Unbrella_analysis.R
R code used to estimate power under the Umbrella model in reviewer’s simula-tion study
Sim.No.Eff.R Sim.No.Eff_analysis.R
R code used to estimate type I error rate in reviewer’s simulation study
Results.plot.R R code used to generate Figure 9
Sim3doses.Eff.R Sim3doses.ANNALYSIS Sim9doses.Eff.R Sim9doses.ANNALYSIS
R code used to estimate power under the Emax model based on D-optimal design or 9 dose design.
D_optimal_emax.R R code to estimate the D-optimal design.
U.S. FDA Qualification of The MCP-Mod Procedure Page 30 of 31
7 REFERENCES
Aoki, Yasunory, Bengt Hamrén, Daniel Röshammar, and Andrew C Hooker. 2014. “Averaged Model Based Decision Making for Dose Selection Studies.” http://www.ema.europa.eu/docs/en_GB/document_library/Presentation/2015/01/WC500179793.pdf. Retrieved 12/01/2015.
Bartholomew, D. J. "Ordered tests in the analysis of variance." Biometrika (1961): 325-332.
Bauer, P., and P. Hackl. "The application of Hunter's inequality in simultaneous testing." Biometrical journal 27.1 (1985): 25-38.
Bornkamp, Björn, et al. "Innovative approaches for designing and analyzing adaptive dose-ranging trials." Journal of biopharmaceutical statistics 17.6 (2007): 965-995.
Branson, Michael, José Pinheiro, and Frank Bretz. "Searching for an adequate dose: Combining multiple comparisons and modeling techniques in dose-response studies." (2003). Novartis Biometrics Technical Report No. 2003-08-20. http://citeseerx.ist.psu.edu/viewdoc/download;jsessionid=1A7992413E16CB9CA4295A9FF07B6EB5?doi=10.1.1.201.1944&rep=rep1&type=pdf. Retrieved 12/1/2015
Cross, James, et al. "Postmarketing drug dosage changes of 499 FDA‐approved new molecular entities, 1980–1999." Pharmacoepidemiology and drug safety 11.6 (2002): 439-446.
Dunnett, Charles W. "A multiple comparison procedure for comparing several treatments with a control." Journal of the American Statistical Association 50.272 (1955): 1096-1121.
EMA.”Qualification Opinion of MCP-Mod as an efficient statistical methodology for model-based design and analysis of Phase II dose finding studies under model uncertainty” (2014) http://www.ema.europa.eu/docs/en_GB/document_library/Regulatory_and_procedural_guideline/2014/02/WC500161027.pdf. Retrieved 12/2/2015
U.S. FDA Qualification of The MCP-Mod Procedure Page 31 of 31
FDA. 2009. “Guidance for Industry: End-of-Phase 2A Meetings.” Filloon, Thomas G. "Estimating the minimum therapeutically effective dose of a
compound via regression modelling and percentile estimation." Statistics in medicine 14.9 (1995): 925-932.
ICH-4. 1994. “Dose-response Information to Support Drug Registration.”
Lalonde, R. L., et al. "Model-based drug development." Clinical Pharmacology & Therapeutics 82.1 (2007): 21-32.
Overgaard, R. V., S. H. Ingwersen, and C. W. Tornøe. "Establishing Good Practices for Exposure–Response Analysis of Clinical Endpoints in Drug Development." CPT: pharmacometrics & systems pharmacology 4.10 (2015): 565-575.
Sacks, Leonard V., et al. "Scientific and regulatory reasons for delay and denial of FDA approval of initial applications for new drugs, 2000-2012." JAMA 311.4 (2014): 378-384.
Sheiner, Lewis B. "Learning versus confirming in clinical drug development*." Clinical Pharmacology & Therapeutics 61.3 (1997): 275-291.
Thomas (a), Neal, Kevin Sweeney, and Veena Somayaji.. Meta-analyses of clinical dose-response. Presented at EMA/EFPIA, 2014, http://www.ema.europa.eu/docs/en_GB/document_library/Presentation/2015/01/WC500179795.pdf. Retrieved 12/1/2015
Thomas (b), Neal, Kevin Sweeney, and Veena Somayaji. "Meta-Analysis of Clinical Dose–Response in a Large Drug Development Portfolio." Statistics in Biopharmaceutical Research 6.4 (2014): 302-317.
Williams, D. A. "A test for differences between treatment means when several dose levels are compared with a zero dose control." Biometrics (1971): 103-117.
Williams, D. A. "The comparison of several dose levels with a zero dose control." Biometrics (1972): 519-531.
Yang, Jun, et al. "The Combination of Exposure‐Response and Case‐Control Analyses in Regulatory Decision Making." The Journal of Clinical Pharmacology 53.2 (2013): 160-166.