office market report - knight...
TRANSCRIPT

Office Market repOrtSaint petersburg
2016
the total delivery volume of quality office space reached 243 thousand sq m in 2016.
HigHligHtS
reSearcH
The Сlass A vacancy rate hit a low of 5.5%, the lowest value since 2008. The share of Class B vacant space was 9.7%.
The net take-up level was 73% higher if compared with 2015 amounting to 217 thousand sq m at the end of 2016.
the level of average asking rental rates grew over the past year due to the withdrawal of office units in the non-central business districts with traditionally lower rates, high take-up level, as well as with the US dollar decline against the ruble.
Office market repOrt. Saint peterSburg
2
Key indicators. Dynamics
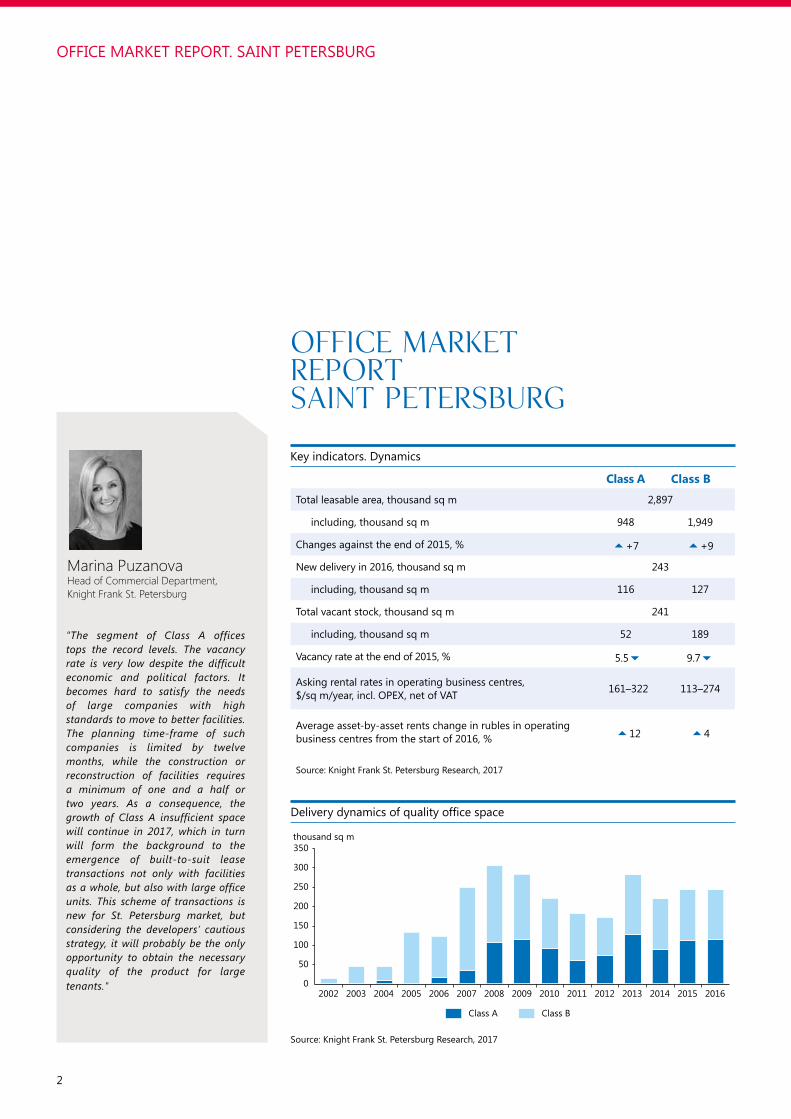
ʺThe segment of Class A offices tops the record levels. The vacancy rate is very low despite the difficult economic and political factors. It becomes hard to satisfy the needs of large companies with high standards to move to better facilities. The planning time-frame of such companies is limited by twelve months, while the construction or reconstruction of facilities requires a minimum of one and a half or two years. As a consequence, the growth of Class A insufficient space will continue in 2017, which in turn will form the background to the emergence of built-to-suit lease transactions not only with facilities as a whole, but also with large office units. This scheme of transactions is new for St. Petersburg market, but considering the developers’ cautious strategy, it will probably be the only opportunity to obtain the necessary quality of the product for large tenants.ʺ
Marina PuzanovaHead of Commercial Department, Knight Frank St. Petersburg
Office Market Report Saint Petersburg
Class А Class В
total leasable area, thousand sq m 2,897
including, thousand sq m 948 1,949
changes against the end of 2015, % 5+7 5+9
New delivery in 2016, thousand sq m 243
including, thousand sq m 116 127
Total vacant stock, thousand sq m 241
including, thousand sq m 52 189
Vacancy rate at the end of 2015, % 5.56 9.76
Asking rental rates in operating business centres, $/sq m/year, incl. OPEX, net of VAT 161–322 113–274
Average asset-by-asset rents change in rubles in operating business centres from the start of 2016, % 512 54
Source: Knight Frank St. Petersburg Research, 2017
Source: Knight Frank St. Petersburg Research, 2017
Delivery dynamics of quality office space
thousand sq m
Class A Class B
0
50
100
150
200
250
300
350
2002 2003 2004 2005 2006 2007 2008 2009 2010 2011 2012 2013 2014 2015 2016
3
ReseaRch2016
key eventsTransactions with more than 100 thousand sq m were completed during the year: office buildings were purchased with investment purposes and for personal needs of companies, as well as the landlords of business centres were changed.
Major lease transactions of the whole buildings were carried out by one tenant in business centres of Flandria Plaza, FORT TOWER and Renaissance Business Park. The leasable office space of each facility is more than 20 thousand sq m.
The market volatility affected the strategy of developers to execute the projects of business centres in 2016 – the delivery of 1/3 of them was postponed.
The developers associated with Gazprom company received the construction permits for additional facilities in 2016 – 2nd phase of Lakhta Centr in Primorsky district and Morskaya residenciya in Vasileostrovsky district.
SupplyThe total area of quality office space in St. Petersburg amounted to 2,897 thousand sq m, its 33% corresponded to Class A and 67% to Class B.
The market volatility affected the strategy of the developers to execute the projects of business centres: a number of projects were cancelled or frozen, the delivery of 1/3 of all office buildings under construction was carried over for 2017–2018, including projects that were in the final stages of construction and at the beginning of Q4 they had been scheduled to be commissioned before the end of the year.
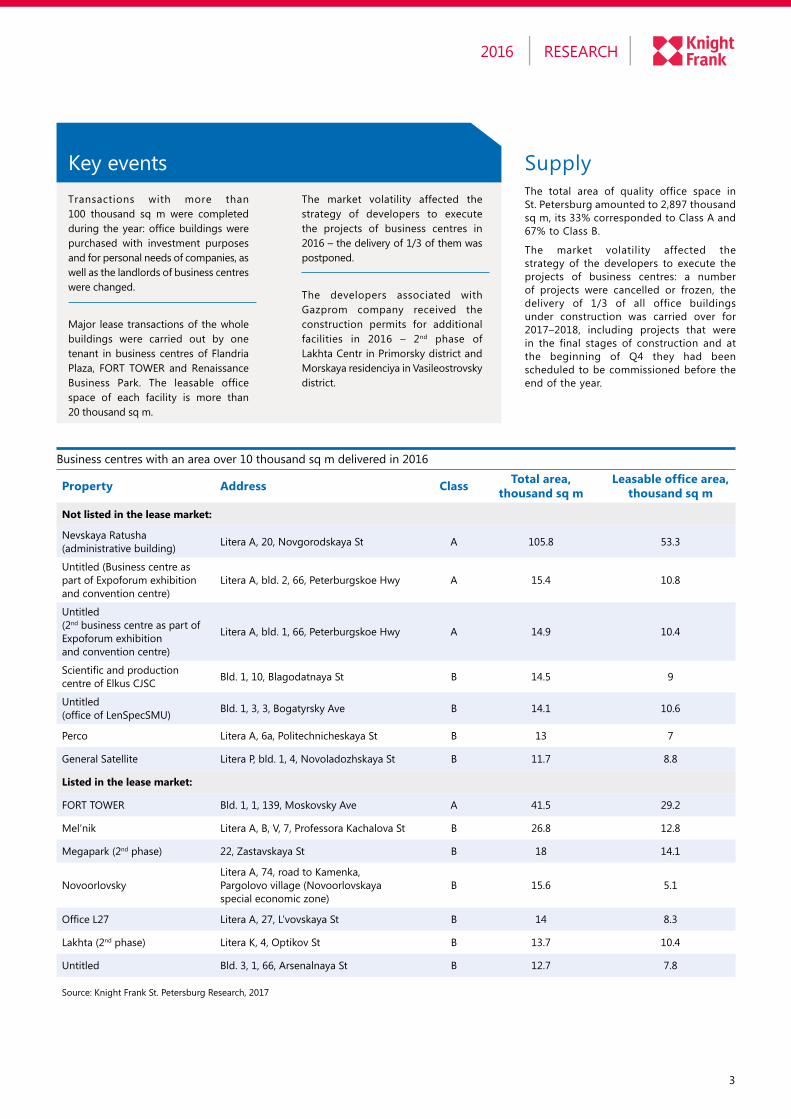
Business centres with an area over 10 thousand sq m delivered in 2016
Property Address Class Total area, thousand sq m
Leasable office area, thousand sq m
Not listed in the lease market:
Nevskaya ratusha (administrative building) litera a, 20, Novgorodskaya St a 105.8 53.3
Untitled (Business centre as part of Expoforum exhibition and convention centre)
litera a, bld. 2, 66, peterburgskoe Hwy a 15.4 10.8
Untitled (2nd business centre as part of Expoforum exhibition and convention centre)
litera a, bld. 1, 66, peterburgskoe Hwy a 14.9 10.4
Scientific and production centre of Elkus CJSC Bld. 1, 10, Blagodatnaya St B 14.5 9
Untitled (office of LenSpecSMU) Bld. 1, 3, 3, Bogatyrsky ave B 14.1 10.6
Perco Litera A, 6a, Politechnicheskaya St B 13 7
general Satellite litera p, bld. 1, 4, Novoladozhskaya St B 11.7 8.8
Listed in the lease market:
fOrt tOWer Bld. 1, 1, 139, Moskovsky Ave a 41.5 29.2
Mel’nik Litera A, B, V, 7, Professora Kachalova St B 26.8 12.8
Megapark (2nd phase) 22, Zastavskaya St B 18 14.1
NovoorlovskyLitera A, 74, road to Kamenka, pargolovo village (Novoorlovskaya special economic zone)
B 15.6 5.1
Office L27 Litera A, 27, L’vovskaya St B 14 8.3
lakhta (2nd phase) Litera K, 4, Optikov St B 13.7 10.4
Untitled Bld. 3, 1, 66, arsenalnaya St B 12.7 7.8
Source: Knight Frank St. Petersburg Research, 2017

Office market repOrt. Saint peterSburg
4
Despite extended deadlines, the delivery pace of office space corresponded to figures of year-end 2015: 243 thousand sq m were put into operation in 2016. The key commissioned projects were the administrative building with a total area of 106 thousand sq m in Nevskaya ratusha Business centre, as well as fOrt tOWer and fOrt rOSS with a total area of 46.6 thousand sq m.
57% of the new office supply entering the market in 2016 were the projects intended for lease (including built-to-suit facilities). As for 2017, 68% of the total volume of office space under construction are aimed for lease.
DemandThe downward trend of the Class A vacancy rate was indicated during Q2–Q3 2016, this trend was set to continue in Q4 and the year-end figure was equal to 5.5%, falling by 3% p. p. for 12 months. Interestingly, this figure hit 9-year low of St. Petersburg office market. The comparable level of the vacancy rate was observed in Class A in 2007–2008 when the total Class A stock was seven times less than the current one. About 70% of existing Class A business centres enjoy 100% occupancy rate, while there is a shortage of office units from 1,000 sq m.
Ratio of new delivery to office space take-up
Source: Knight Frank St. Petersburg Research, 2017
Source: Knight Frank St. Petersburg Research, 2017
Share of tenants cooperating with Gazprom in the total volume of major 2016 transactions
Source: Knight Frank St. Petersburg Research, 2017
Distribution of leasable office area of new supply
87%
57%
68%
3%
2%
11%
10%
41%
21%
Before 2016
2016
2017F
Intended for leaseIntended for saleIntended for own needs of companies
thousand sq m %
Exclusive of subsidiaries and subcontractors of GazpromSubsidiaries and subcontractors of GazpromThe share of subsidiaries and subcontractors of Gazprom in the total volume of major transactions
0
20
40
60
80
100
120
140
2009 2010 2011 2012 2013 2014 2015 20160
10
20
30
40
50
60
70
Devivery Take-up Vacancy
thousand sq m %
0
5
10
15
20
25
0
20
40
60
80
100
120
140
160
Q1 Q2 Q3 Q42009
Q1 Q2 Q3 Q42010
Q1 Q2 Q3 Q42011
Q1 Q2 Q3 Q42012
Q1 Q2 Q3 Q42013
Q1 Q2 Q3 Q42014
Q1 Q2 Q3 Q42015
Q1 Q2 Q3 Q42016

5
ReseaRch2016
Lease transactions of quality office space over 6 thousand sq m executed in 2016
Purchase transactions of office buildings over 10 thousand sq m executed in 2016
Tenant Profile Leased office area, thousand sq m Property Business district
Gazprom PJSC (subsidiaries) Oil/gas/raw materials 29.2 fOrt tOWer Moskovsky prospect
Gazprom pererabotka LLC Oil/gas/raw materials 20.9 Renaissance Business park embankments with views
Gtroygazconsulting LLC Oil/gas/raw materials 15.0 flandria plaza (1st tower) Moskovsky prospect
Gtroygazconsulting LLC (subsidiaries) Oil/gas/raw materials 14.8 flandria plaza
(2nd tower) Moskovsky prospect
Confidential IT/Telecommunications 8.2 energo Moskovsky prospect
epaM Systems IT/Telecommunications 6.6 Megapark (2nd phase) Moskovsky prospect
Gazprom (subsidiary) Oil/gas/raw materials 6.6 Novgorodskaya 13 central-2
Megafon NWregion IT/Telecommunications 6.1 Smolensky Vasileostrovsky-2
arkadiya IT/Telecommunications 6.0 Mezon plaza embankments with views
Source: Knight Frank St. Petersburg Research, 2017
Buyer ProfileTotal area of the
building, thousand sq m
Property Business district
Gazprom subsidiary Oil/gas/raw materials 35.0 MeZON plaZa embankments with views
Piter Management Company investments/Development 27.0 LENIZDAT central-1
BEST Group of Companies investments/Development 14.7 aura Outside area
Private persons investments 10.0 formida eastern
pSi cro Pharmaceuticals 7.0 griffon House central-2
JetBrains it 6.5 Univers Vasileostrovsky-1
Source: Knight Frank St. Petersburg Research, 2017
The Class B vacancy rate ranged from 1–2 p. p. during the year totalling 9.7% at the year-end, which was comparable to the same period in 2015, despite the high delivery volume of office space intended for lease in 2016.
The net take-up volume was 217 thousand sq m of leasable office area at the end of 2016 (excluding facilities for sale and for own needs of companies), exceeding by 73% the same period last year. Most of the take-up was concen-trated in Class A premises, its dominant share was situated in Moskovsky prospect business district.
Interestingly, Moskovsky Prospect ranks first in the total area of quality office space among business districts of St. Petersburg: there are 19% of all Class A and B office space intended for lease. The popularity of the district is explained both by its favourable location – proximity to major transport infrastructure projects of St. Petersburg, the convenience of access to the business centre, the convenience of the city’s exit – and by a special interest in this location by the structures and contractors of Gazprom: an essential part of the leased office premises is situated in this business location.
a noteworthy detail is that the minimum quality stock of office space for lease was represented in this business district at the end of the year, and the vacancy rate did not exceed 3%.
the largest demand of 2016 was formed by tenants connected with Gazprom company, like the year before: in the total volume of major transactions their share was 61% by the end of 2016. it is worth noting that this is the highest take-up volume since the beginning of the move of Gazprom structures to St. Petersburg. However, we do not expect that office

Office market repOrt. Saint peterSburg
6
space will be taken-up at the same pace by oil and gas companies in 2017 as in 2015–2016.
High proportion of IT and tele- communications companies was observed in the structure of major lease transactions of quality office space in 2016. 22% of quality office space were leased with the participation of representatives of the sector.
In general, investors continue to show interest to distressed assets and seek to take advantage of the crisis situation. However, we cannot confirm the increasing number of sold properties with a significant discount. The demand is steady from investors to existing business centres with constant and predictable financial flows, and although developers are potentially willing to get rid of their assets, their asking price is not lower than the market average.
Transactions with more than 100 thousand sq m were completed during the year: quality office buildings were purchased with investment purposes and for personal needs of companies, as well as the landlords of business centres were changed: Griffon House Business Centre was bought by pharmaceutical company, Univers Business Centre by IT company.
* Incl. OPEX, net of VATSource: Knight Frank St. Petersburg Research, 2017
Ratio of vacancy rate to average asking rental rates*
Commercial termsThe high take-up level led to a sharp reduction of Class A office vacant premises, which influenced the rents increase: the level of average asking rental rates grew over the past year due to the US dollar decline against the ruble and the withdrawal of office units in the non-central business districts with traditionally lower rates. the average class a rental rate was registered at the level of 271 $/sq m/year (incl. OPEX, net of VAT) at the end of 2016.
The average asset-by-asset increase of asking rental rates in rubles for Class A office space amounted to 12% for 12 months, due to overstated rental rates in a number of properties in central business districts. It is important to note that the average asset-by-asset increase occurred in a few vacant office premises, while the rents in existing leases are mostly at a lower level.
Asking USD rental rates in Class B premises were 16% up year-on-year by the end of the year. The average increase of rental rates in rubles was 4% for 12 months. The average asking rental rates declared in Class B business centres at year-end 2016 reached a total of 177 $/sq m/year (incl. OPEX, net of VAT).
An expected increase in the stated rental rates in the business centres of Vasileostrovsky district took place in H2. We expect the recovery of rents to the level average for the city. The rates are raising primarily due to the launch of the Western High Speed Diameter and improving transport accessibility of the district.
Forecast206 thousand sq m of office space will be delivered in 2017 according to developers’ plans. 68% of them are intended for the lease market, 21% for own needs of companies and 11% – for sale. A significant part of the planned delivery stock of 2017 is formed of the projects with deferred delivery dates: 17 office properties from 29 (including phases) were originally planned for commissioning in 2016. We do not leave out further postponement of a number of projects mostly scheduled for commissioning in Q3–Q4 2017.
In the current market situation, the delivery of Class A office space becomes sought-after. Circa 40 thousand sq m will come into the open market in 2017 excluding already leased space of business centres. This will not allow Class A indicator go ahead considerably during the year.
$/sq m/year %
Rental rate, Class ARental rate, Class B
Vacancy rate, Class AVacancy rate, Class B
0
5
10
15
20
25
30
35
40
0
100
200
300
400
500
600
Q3 Q4 Q1 Q2 Q3 Q4 Q1 Q2 Q3 Q4 Q1 Q2 Q3 Q4 Q1 Q2 Q3 Q4 Q1 Q2 Q3 Q4 Q1 Q2 Q3 Q4 Q1 Q2 Q3 Q4
2009 2010 2011 2012 2013 2014 2015 2016

7
ReseaRch2016
Business districts of St. Petersburg. Key indicators
Submarket Delivery volume, sq m*
Vacancy volume, sq m
Average rental rates, $/sq m/year, Class A**
Average rental rates, $/sq m/year, Class B**
Moskovsky Prospect 461,774 11,309 258 220
embankments with views 310,720 40,447 246 197
petrogradsky 309,695 17,071 241 191
central-2 247,227 38,304 283 213
North-Western 185,796 33,491 260 162
Obvodny 160,202 30,731 - 152
eastern 153,546 24,053 - 169
central-1 147,958 15,347 297 215
South-eastern 115,125 8,090 - 171
Vasileostrovsky-1 101,940 9,098 184 158
Vasileostrovsky-2 78,670 2,880 161 138
admiralteisky 78,099 1,849 - 157
North-eastern 42,121 4,658 - 179
South-Western 35,775 1,384 - 138
Outside area 27,483 2,018 - 177
* Excl. business centres intended for sale or for own needs of companies** Incl. OPEX, net of VAT
Source: Knight Frank St. Petersburg Research, 2017
The interest of developers to the construction of office facilities for lease sharpened by the end of the year. Nevertheless, in view of the high degree of uncertainty in the economy and difficulties in attracting available debt financing, many investors continue to take a wait and see position, although the start of construction of several quality office properties was preliminary declared in 2017. More dynamic actions can be performed by
developers previously focused exclusively on built-to-suit schemes considering moderate delivery pace of office space, high take-up rate and the increase in rental rates during the year.
In the next 3–5 years, we expect the arousal of considerable interest from investors to North-Western business district connected to the promising accommodation of Gazprom headquarters there, as well as with significant improvement of the transport
infrastructure and the development of the district. In the future, a large construction volume of office space is anticipated in the business district, as well as a gradual increase of rental rates: in Moscow the average asking rental rates are 20–25% higher in the district where Gazprom headquarters is located than the corresponding figures in comparable locations even after the move of the most part of departments to St. Petersburg.
Business centres with leasable office area over 10 thousand sq m announced for delivery in 2017
Property Business district Developer Class Leasable office area, thousand sq m
Renaissance Business Park embankments with views Renaissance Develop-ment a 20.9
Senator Chapaeva (2nd phase) petrogradsky Imperia Financial
Holding Company a 17.9
Untitled Vasileostrovsky-2 Detsky khor teleradio SPb centre B 15.0
premier liga (3rd phase) Moskovsky prospect Stroitelnye mashiny B 14.4
graffiti embankments with views Splav Group of Companies B 14.0
riverside embankments with views Setl Group B 13.1
Moika 74 central-1 adamant a 11.1
Untitled South-eastern Polis Group of Companies B 10.5
Dom Pushniny Moskovsky prospect Pushnoy Dom PLC B 10.0
Source: Knight Frank St. Petersburg Research, 2017

Office market repOrt. Saint peterSburg
8
ReSeARChTamara PopovaHead of Department [email protected]
OffiCeSMarina PuzanovaHead of Commercial Department [email protected]
+7 (812) 363 2222
© Knight frank LLP 2017 – This overview is published for general information only. although high standards have been used in the preparation of the information, analysis, view and projections presented in this report, no legal responsibility can be accepted by Knight Frank Research or Knight Frank for any loss or damage resultant from the contents of this document. As a general report, this material does not necessarily represent the view of Knight Frank in relation to particular properties or projects.
Reproduction of this report in whole or in part is allowed with proper reference to Knight Frank.
Source: Knight Frank St. Petersburg Research, 2017
Growth dynamics of quality office space supply
The developers associated with Gazprom company received the construction permits for additional facilities for own needs of the company – 2nd phase of Lakhta Centre in Primorsky district and Morskaya residenciya Business Centre in Vasileostrovsky district. The total area of buildings may reach 130 thousand sq m. Nevertheless, we do not expect the critical surrender of occupied office space after 2018.
The shortage of Class A vacant space and the decrease of Class B vacant premises are forecasted in 2017 owing to a stable demand for office space in quality business centres and moderate delivery rate.
Market conditions demonstrate favourable prospects for the growth of ruble rental rates: Class A rates have prerequisites for the growth by an average of 10–15% for 2017 due to the high take-up rate, Class B rents – by 7–10% except for facilities with unfavourable transport accessibility and business centres with above-market rates.
To be noticed is that the reached certain market stability does not mean the recovery of St. Petersburg office real estate market and it is a long way off till recovery of pre-crisis capitalization rates in the segment.
The map of Saint Petersburg business districts
Source: Knight Frank St. Petersburg Research, 2017
42
109
11
1213
8
8
13
14 14
756
1. Central-12. Central-23. Admiralteisky4. Petrogradsky5. Vasileostrovsky-16. Vasileostrovsky-27. Embankments with views8. Moskovsky Prospect9. South-Western10. South-Eastern11. Eastern12. North-Eastern13. North-Western14. Obvodny
thousand sq m
Class A supply (cumulative space) Class B supply (cumulative space)
0
500
1,000
1,500
2,000
2,500
3,000
3,500
2002 2003 2004 2005 2006 2007 2008 2009 2010 2011 2012 2013 2014 2015 2016 2017F