office hours wednesday 3-4pm 304a stanley hall review session 5pm thursday, dec. 11 gpb100
Post on 22-Dec-2015
219 views
TRANSCRIPT

Office hoursWednesday 3-4pm304A Stanley Hall
Review session5pm Thursday, Dec. 11
GPB100

Association vs. linkage
Strong, easy to detect, but rare in population;may not be reflective of common disease.Also, hard to collect family data.
Common but weak effects; need 1000’s of samples to detect.If no common cause, can fail.
Unrelatedindividuals
Relatedindividuals
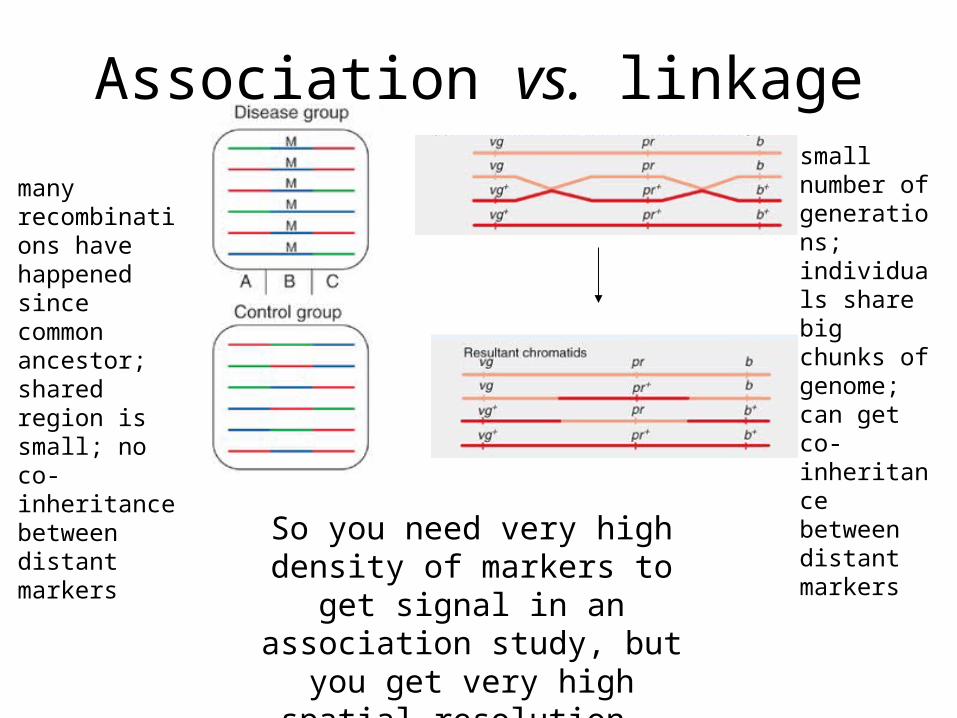
Association vs. linkagesmall number of generations; individuals share big chunks of genome; can get co-inheritance between distant markers
many recombinations have happened since common ancestor;shared region is small; no co-inheritance between distant markers
So you need very high density of markers to get signal in an association study, but you get very high spatial resolution.

Association and admixture
Cases
Controls
=
=
At any one of these loci, Caucasian-like allele will be enriched in control samples.

Genotyping by array
Fig. 11.8

Expression microarrays
Fig. 1.13
Labeled DNA sample vs. labeled mRNA (cDNA) sample

Labeled DNA sample vs. labeled mRNA (cDNA) sample
(reverse transcription in the test tube)

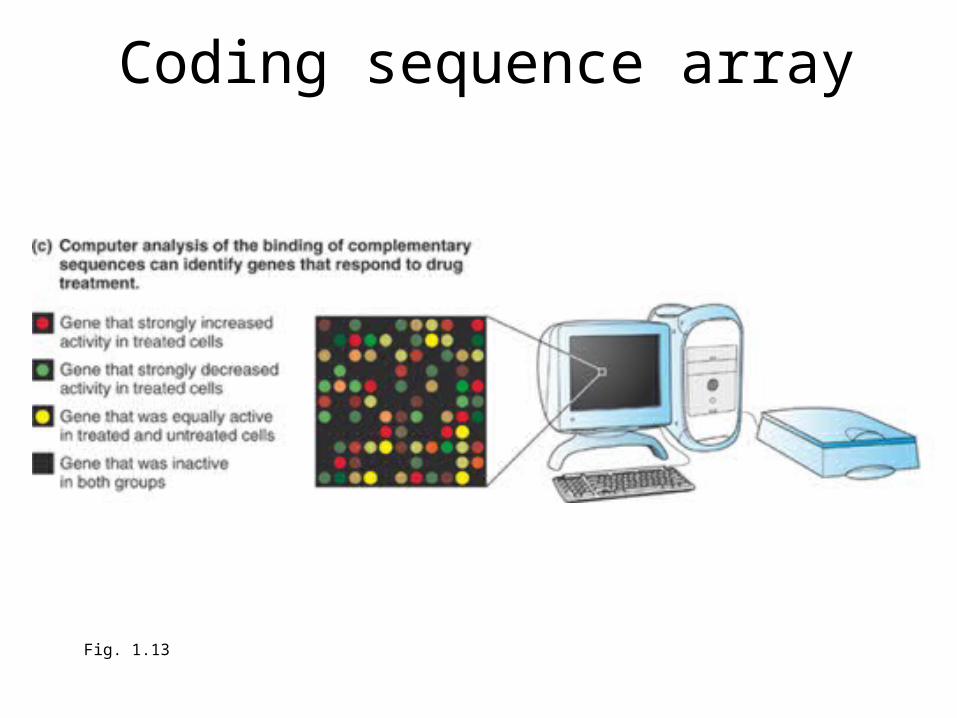
Coding sequence array
Fig. 1.13

Coding sequence array
Fig. 1.13
say, with chemotherapeutic

Coding sequence array
Fig. 1.13
Coding sequence array
Fig. 1.13

Coding sequence array
Fig. 1.13
expression
expression
expressed
not expressed

Why measure expression of all genes at once?

“Regulon” expression response
http://www.mcb.mcgill.ca/~hallett/GEP/Lecture2/Image17.gif
QuickTime™ and aTIFF (Uncompressed) decompressor
are needed to see this picture.
(e.g. cortisol)
“Regulon” expression response
QuickTime™ and aTIFF (Uncompressed) decompressor
are needed to see this picture.
http://www2.kenyon.edu/Depts/BioEllipse/courses/biol114/Chap06/week08a_files/regulon.gif

Finding regulatory response on a large scale
Oligo expression array
QuickTime™ and aTIFF (Uncompressed) decompressor
are needed to see this picture.
transcripts
(soybean component)
Expression profiles
QuickTime™ and aTIFF (Uncompressed) decompressor
are needed to see this picture.
Time since drug administered

Expression profiles
QuickTime™ and aTIFF (Uncompressed) decompressor
are needed to see this picture.
Time since drug administered
Time since drug administered

Expression profiles
QuickTime™ and aTIFF (Uncompressed) decompressor
are needed to see this picture.
Time since drug administered
Time since drug administered
Each color is a regulon, or “cluster,” of co-regulated genes

Expression effects of cancer
QuickTime™ and aTIFF (Uncompressed) decompressor
are needed to see this picture.
Cancer classification
QuickTime™ and aTIFF (Uncompressed) decompressor
are needed to see this picture.
Cancer classification
QuickTime™ and aTIFF (Uncompressed) decompressor
are needed to see this picture.

Histological classification is finicky: can we do better?

Diagnosis via transcriptional profile
QuickTime™ and aTIFF (Uncompressed) decompressor
are needed to see this picture.

Diagnosis via transcriptional profile
QuickTime™ and aTIFF (Uncompressed) decompressor
are needed to see this picture.
transcripts
patient samples
Diagnosis via transcriptional profile
QuickTime™ and aTIFF (Uncompressed) decompressor
are needed to see this picture.
QuickTime™ and aTIFF (Uncompressed) decompressor
are needed to see this picture.

Diagnosis via transcriptional profileQuickTime™ and a
TIFF (Uncompressed) decompressorare needed to see this picture.

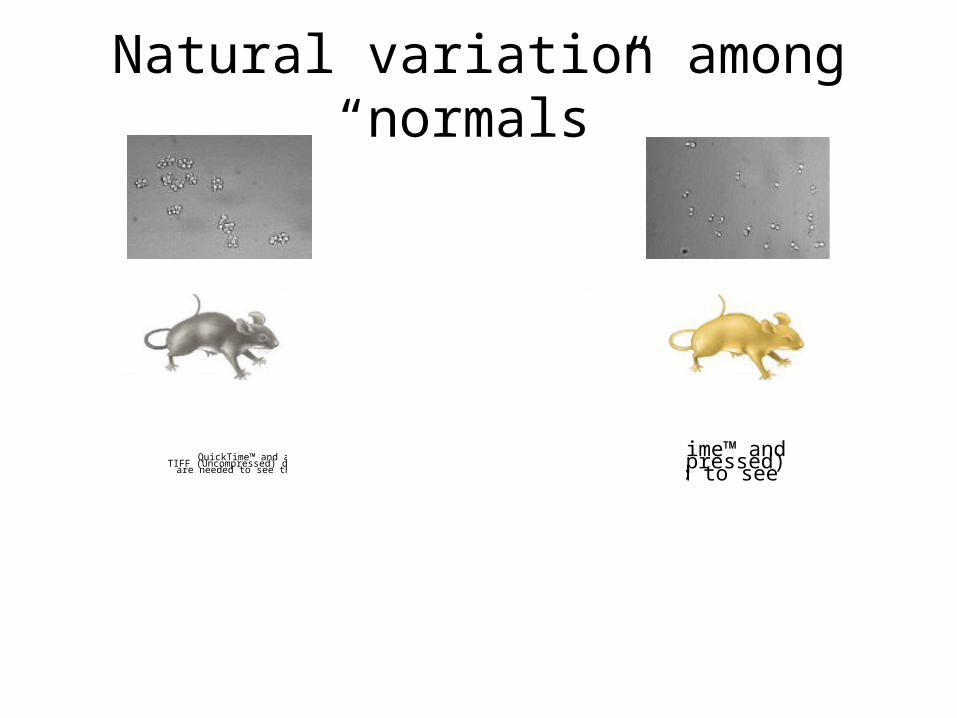
Natural variation among “normals”
Two human chromosomes differ at ~1/1000 bases.
96% of these differences are not in protein-coding sequence.Why?

Two human chromosomes differ at ~1/1000 bases.
96% of these differences are not in protein-coding sequence.Most protein coding mutations are deleterious;appear but are culled by natural selection.
Natural variation among “normals”
QuickTime™ and aTIFF (Uncompressed) decompressor
are needed to see this picture.
QuickTime™ and aTIFF (Uncompressed) decompressor
are needed to see this picture.
Natural variation among “normals”
QuickTime™ and aTIFF (Uncompressed) decompressor
are needed to see this picture.
QuickTime™ and aTIFF (Uncompressed) decompressor
are needed to see this picture.
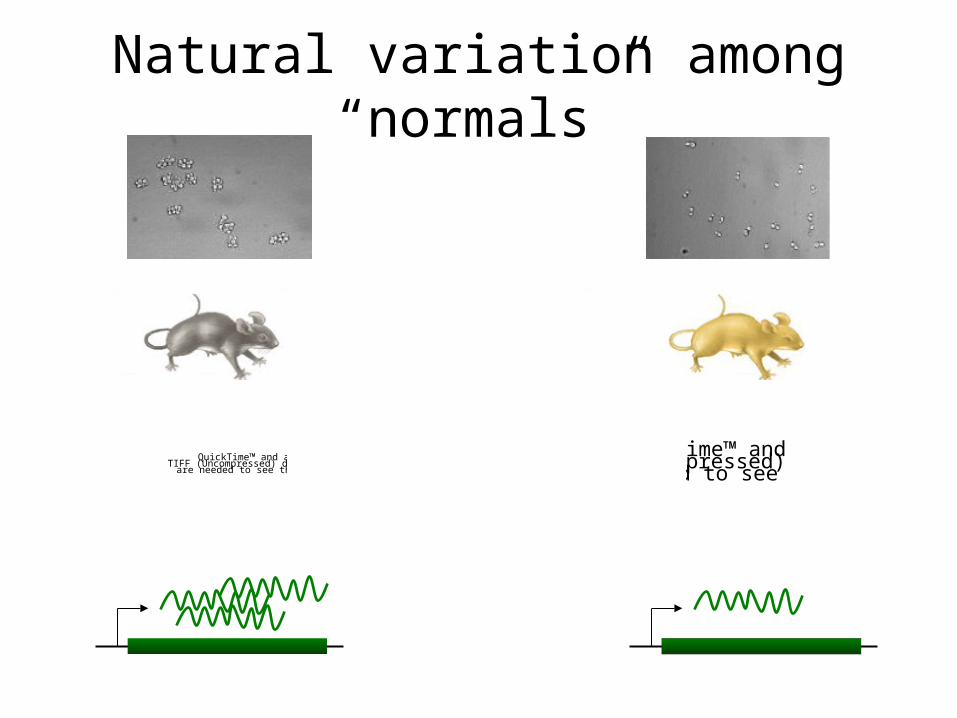
Natural variation among “normals”

Genetic variation in mRNA levels
ORFTFTF
G
kinaseTF

Genetic variation in mRNA levels
ORFTFTF
G
kinaseTF
Likely to be a complex trait.

QuickTime™ and aTIFF (Uncompressed) decompressor
are needed to see this picture.
Many mRNA differences at once
QuickTime™ and aTIFF (Uncompressed) decompressor
are needed to see this picture.
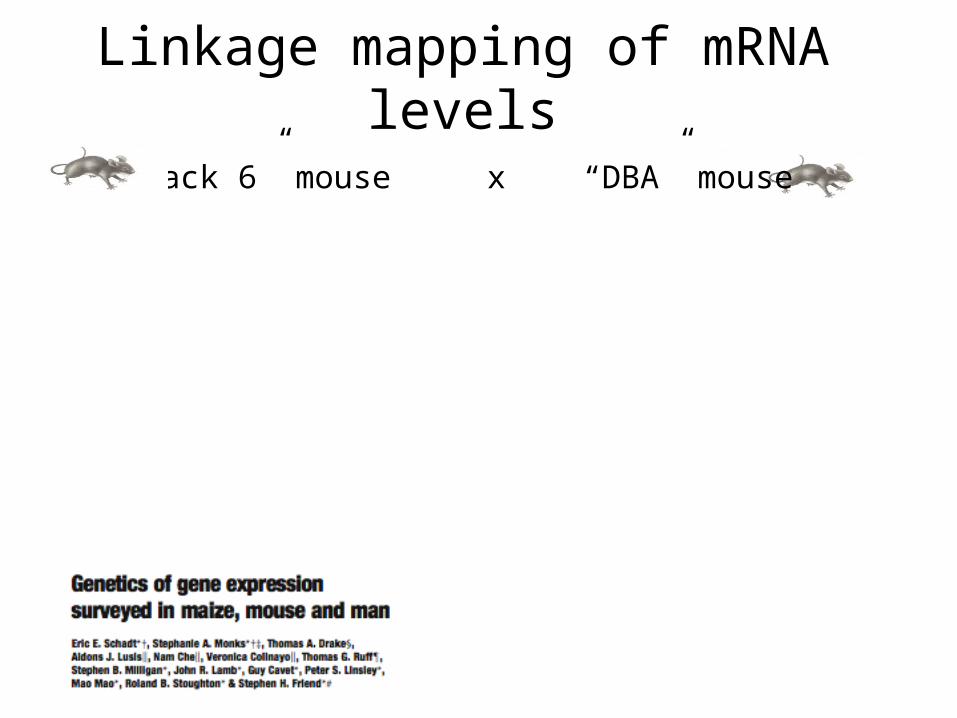
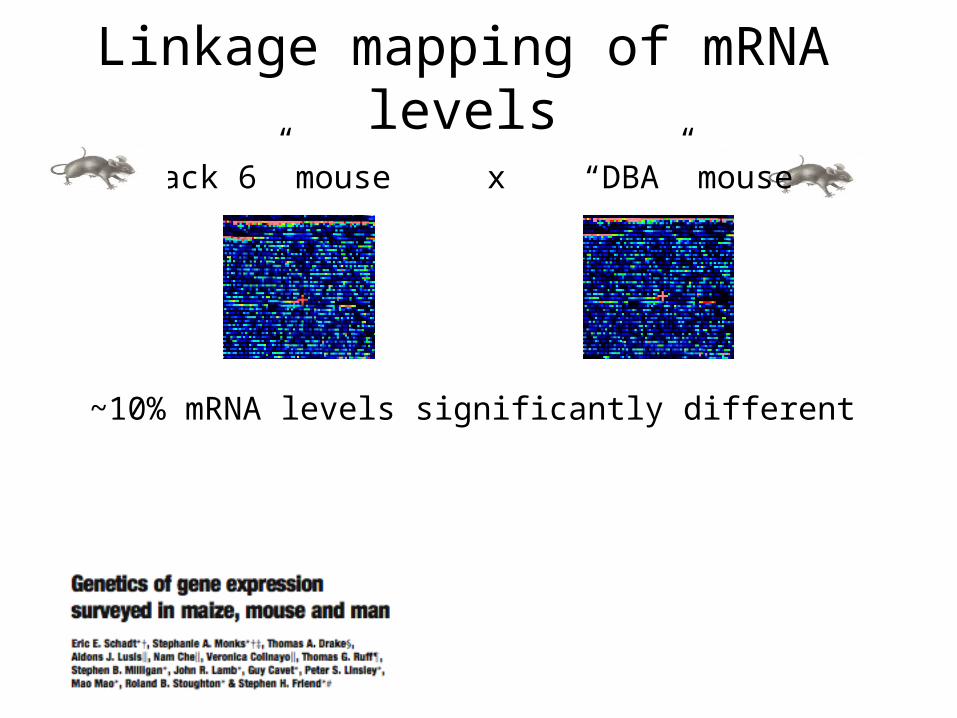
Linkage mapping of mRNA levels
“Black 6” mouse x “DBA” mouse
Linkage mapping of mRNA levels
“Black 6” mouse x “DBA” mouse
~10% mRNA levels significantly different

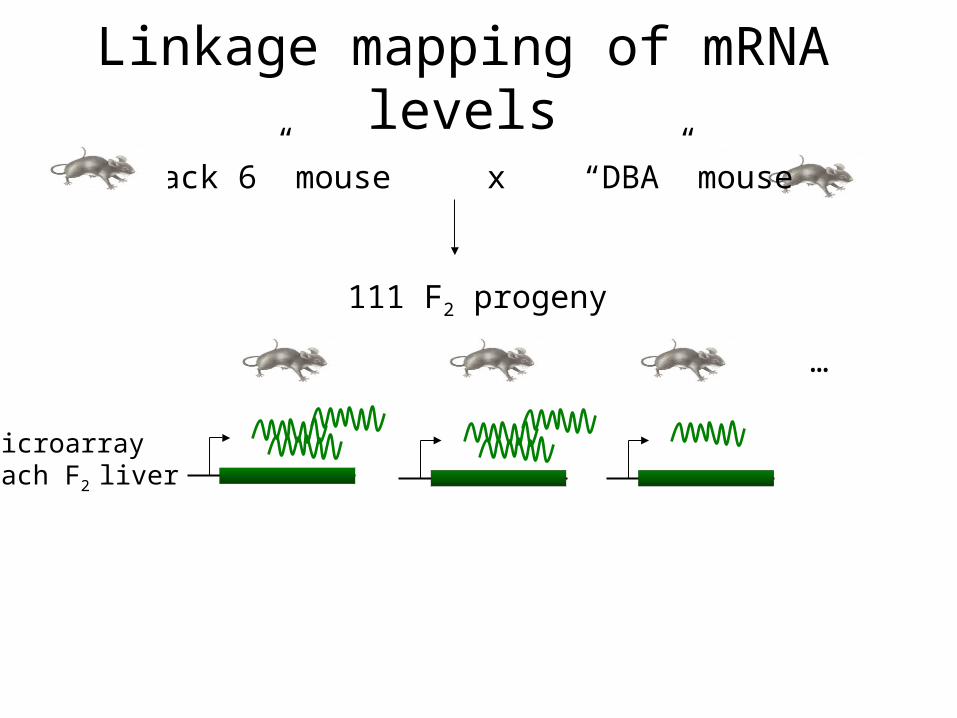
Linkage mapping of mRNA levels
“Black 6” mouse x “DBA” mouse
111 F2 progeny
…
Linkage mapping of mRNA levels
“Black 6” mouse x “DBA” mouse
111 F2 progeny
Microarrayeach F2 liver
…
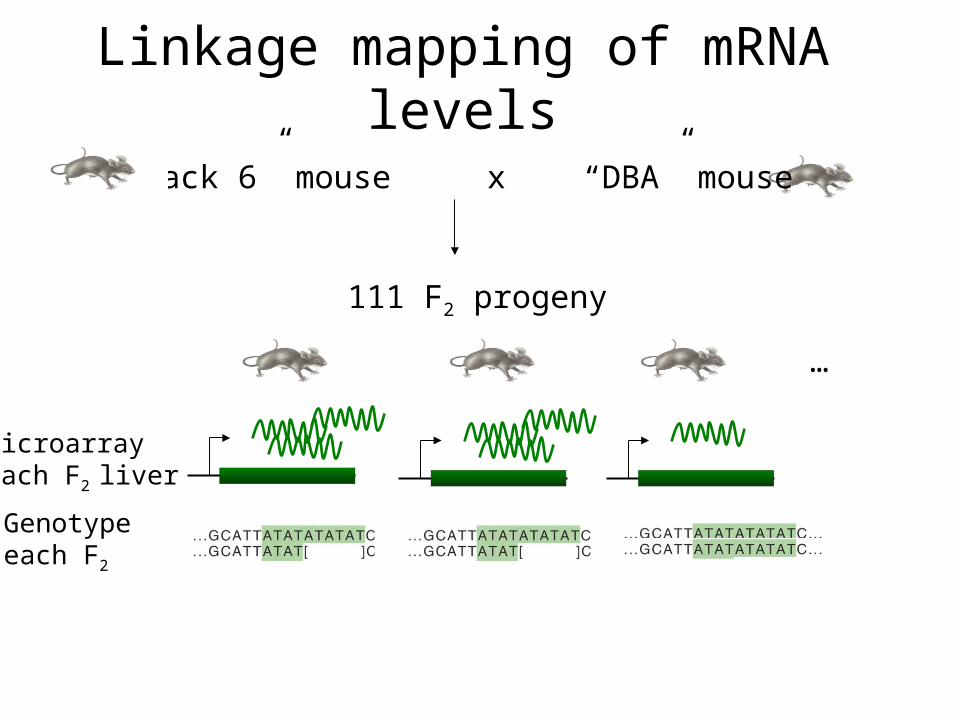
Linkage mapping of mRNA levels
“Black 6” mouse x “DBA” mouse
111 F2 progeny
Microarrayeach F2 liver
…
Genotypeeach F2
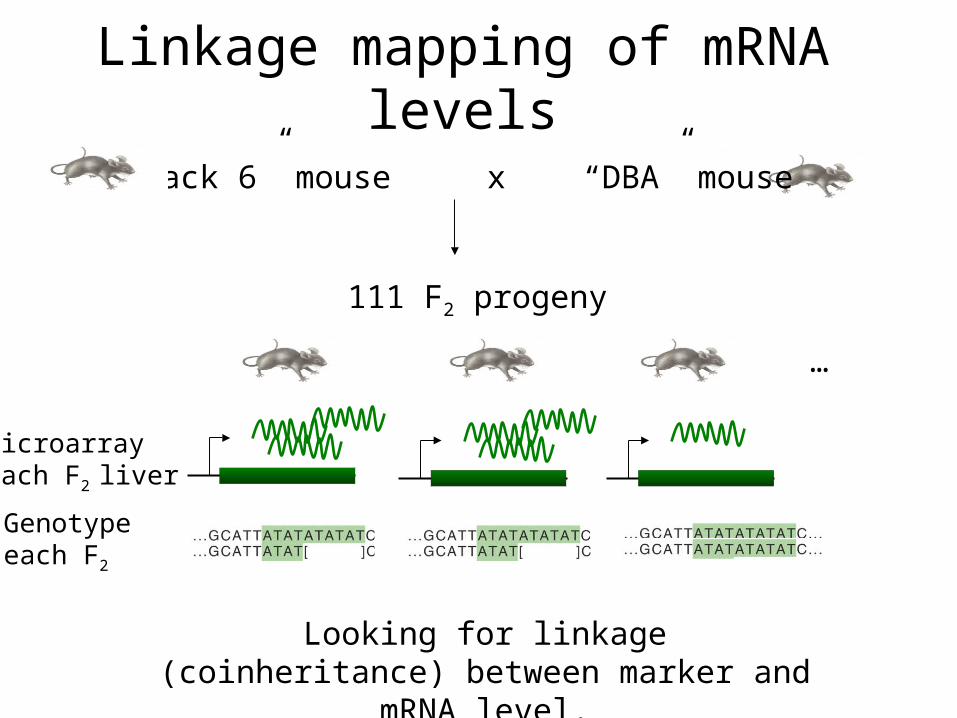
Linkage mapping of mRNA levels
“Black 6” mouse x “DBA” mouse
111 F2 progeny
Microarrayeach F2 liver
…
Genotypeeach F2
Looking for linkage (coinheritance) between marker and mRNA level.

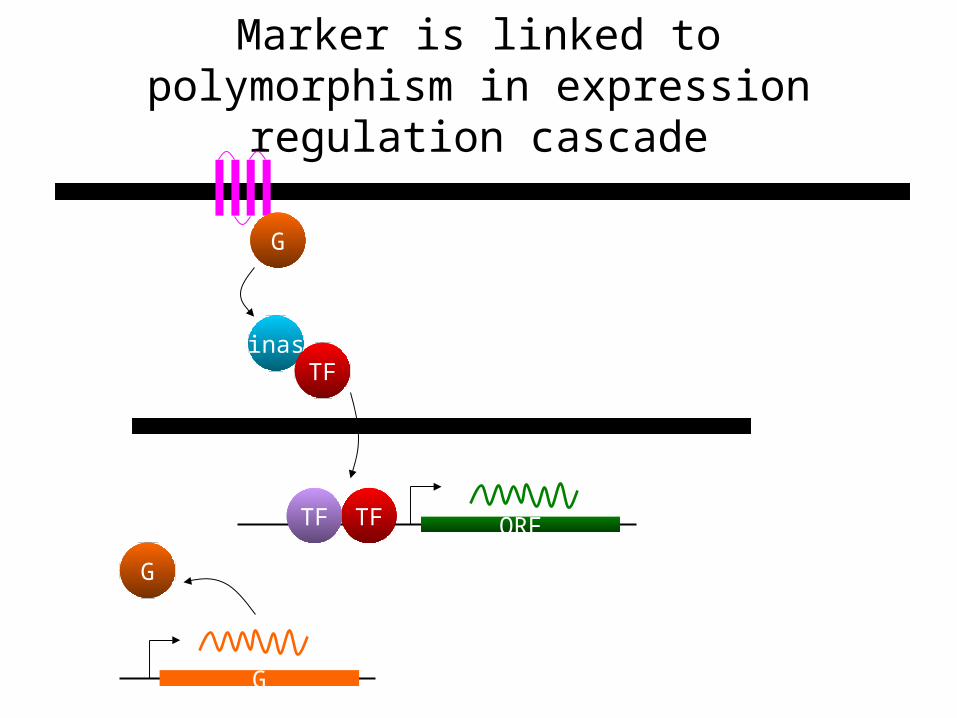
Marker is linked to polymorphism in expression regulation cascade
ORFTFTF
G
kinaseTF

Marker is linked to polymorphism in expression regulation cascade
ORFTFTF
G
kinaseTF
G
G
Marker is linked to polymorphism in expression regulation cascade
ORFTFTF
G
kinaseTF
G
G
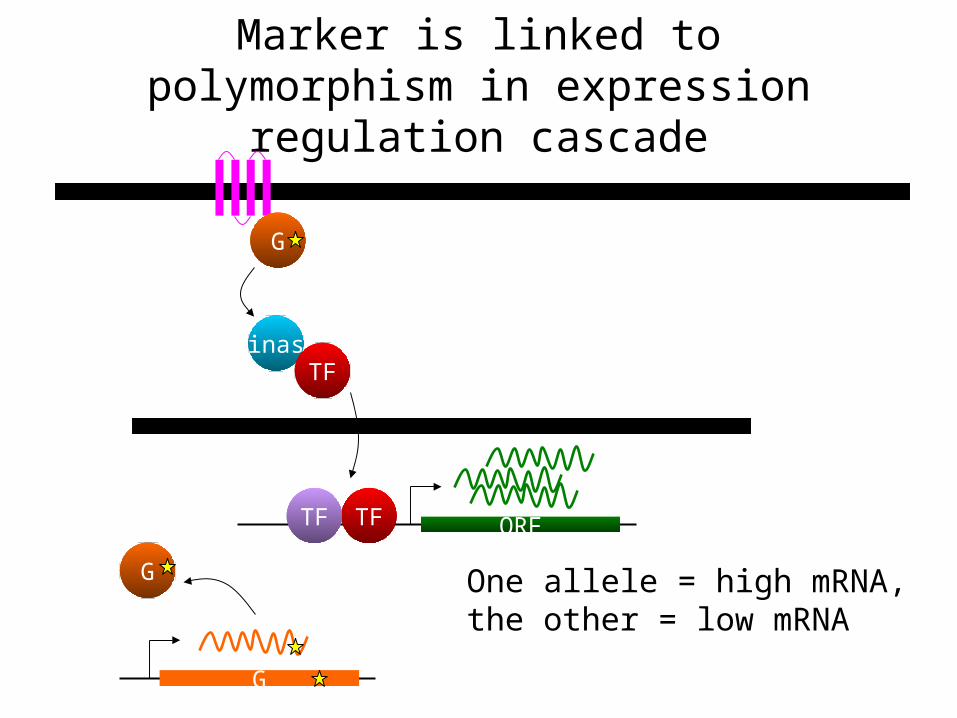
Marker is linked to polymorphism in expression regulation cascade
ORFTFTF
G
kinaseTF
G
G One allele = high mRNA,the other = low mRNA

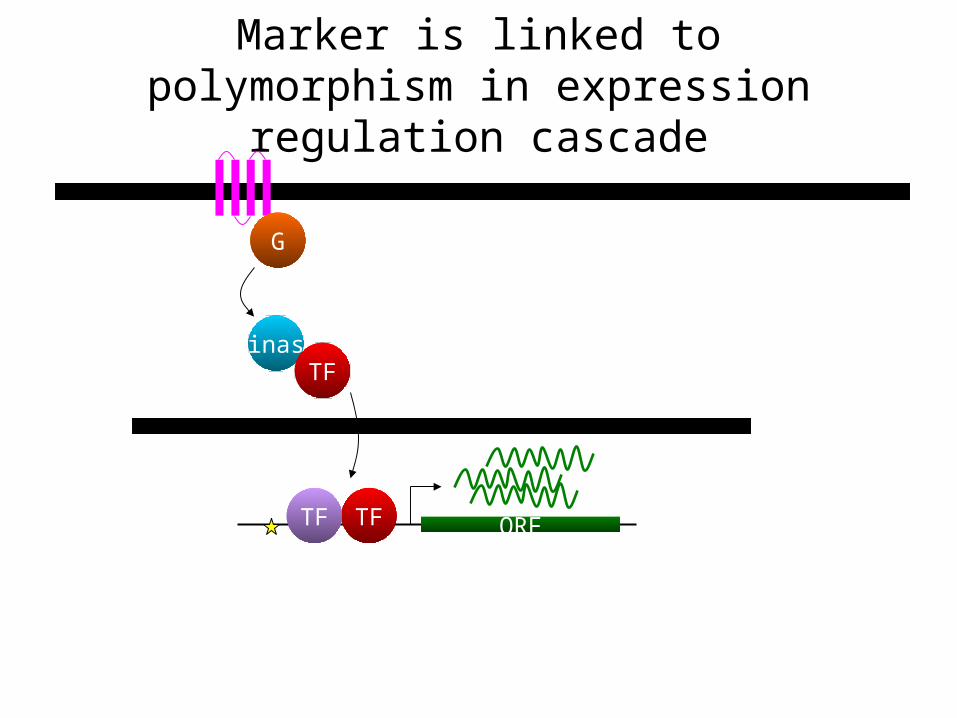
Marker is linked to polymorphism in expression regulation cascade
ORFTFTF
G
kinaseTF
Marker is linked to polymorphism in expression regulation cascade
ORFTFTF
G
kinaseTF

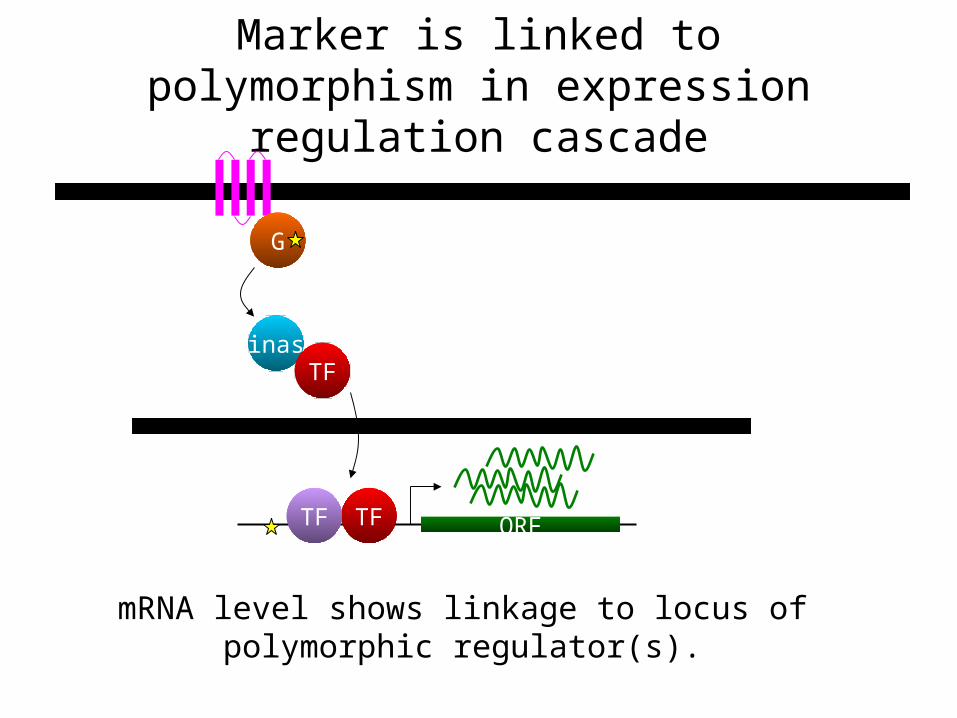
Marker is linked to polymorphism in expression regulation cascade
ORFTFTF
G
kinaseTF
mRNA level shows linkage to locus of polymorphic regulator(s).
Marker is linked to polymorphism in expression regulation cascade
ORFTFTF
G
kinaseTF
mRNA level shows linkage to locus of polymorphic regulator(s).

Locally acting polymorphisms
QuickTime™ and aTIFF (Uncompressed) decompressor
are needed to see this picture.
Locally acting polymorphisms
QuickTime™ and aTIFF (Uncompressed) decompressor
are needed to see this picture.
Locally acting polymorphisms
QuickTime™ and aTIFF (Uncompressed) decompressor
are needed to see this picture.
Polymorphism responsible for mRNA difference is at the locus of the gene itself

Locally acting polymorphisms
ORFTFTF
G
kinaseTF

Locally acting polymorphisms
ORFTFTF
G
kinaseTF

Locally acting polymorphisms
QuickTime™ and aTIFF (Uncompressed) decompressor
are needed to see this picture.
Polymorphism responsible for mRNA difference is at the locus of the gene itself
Locally acting polymorphisms
QuickTime™ and aTIFF (Uncompressed) decompressor
are needed to see this picture.
Polymorphism responsible for mRNA difference is at the locus of the gene itself
~25% of varying mRNAs are caused by locally acting polymorphism

Nonlocal polymorphisms
QuickTime™ and aTIFF (Uncompressed) decompressor
are needed to see this picture.
Nonlocal polymorphisms
One polymorphism in a key regulator can affect a regulon: 100’s of related mRNAs.
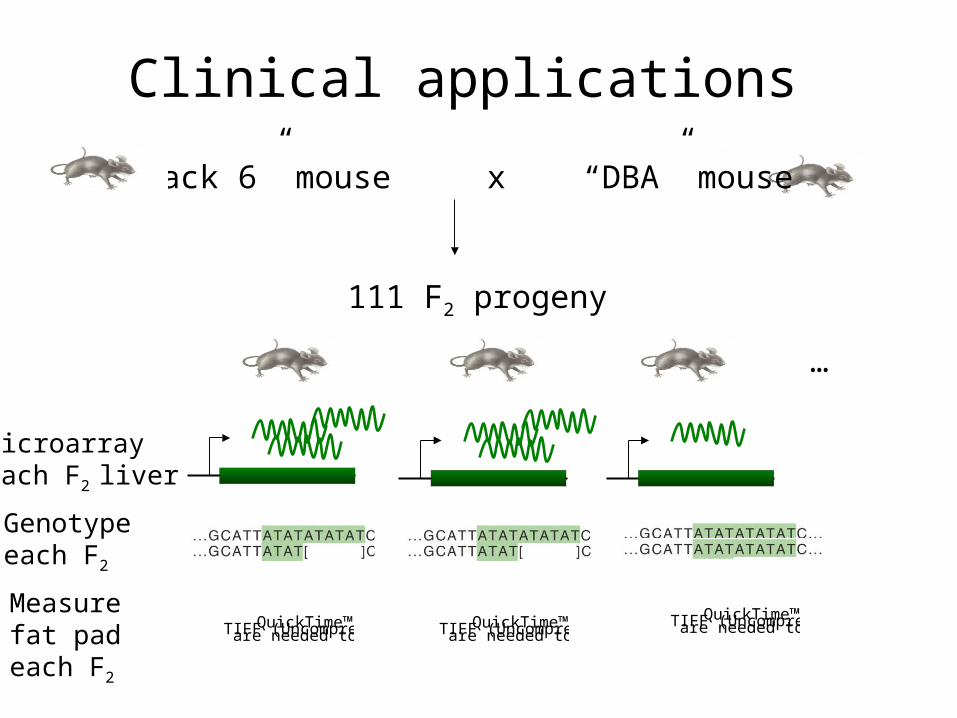
Clinical applications
“Black 6” mouse x “DBA” mouse
111 F2 progeny
Microarrayeach F2 liver
…
Genotypeeach F2
Measure fat pad each F2
QuickTime™ and aTIFF (Uncompressed) decompressorare needed to see this picture.QuickTime™ and aTIFF (Uncompressed) decompressorare needed to see this picture.
QuickTime™ and aTIFF (Uncompressed) decompressorare needed to see this picture.

Clinical applications
QuickTime™ and aTIFF (Uncompressed) decompressor
are needed to see this picture.

Clinical applications
QuickTime™ and aTIFF (Uncompressed) decompressor
are needed to see this picture.
Colored curves = fat mass at different body locations
Clinical applications
Finding polymorphism responsible for difference in macroscopic phenotype is hard
Clinical applications
Finding polymorphism responsible for difference in macroscopic phenotype is hard
If mRNAs change too, can learn mechanism from known function of encoded proteins

Clinical applications
Clinical applications

Clinical applications
QuickTime™ and aTIFF (Uncompressed) decompressor
are needed to see this picture.
Clinical applications
QuickTime™ and aTIFF (Uncompressed) decompressor
are needed to see this picture.
Counts allele 1/allele 2, casesCounts allele 1/allele 2, controls
= 1.5

Clinical applications

Clinical applications
Marker predicts quantitative expression level = association

Can we map expression traits first, disease afterward?

QuickTime™ and aTIFF (Uncompressed) decompressor
are needed to see this picture.
Linkage of human transcripts

Linkage of human transcripts
QuickTime™ and aTIFF (Uncompressed) decompressor
are needed to see this picture.
Association of human transcripts
QuickTime™ and aTIFF (Uncompressed) decompressor
are needed to see this picture.

Association of human transcripts
QuickTime™ and aTIFF (Uncompressed) decompressor
are needed to see this picture.
linkage (families)
assoc (unrelated)
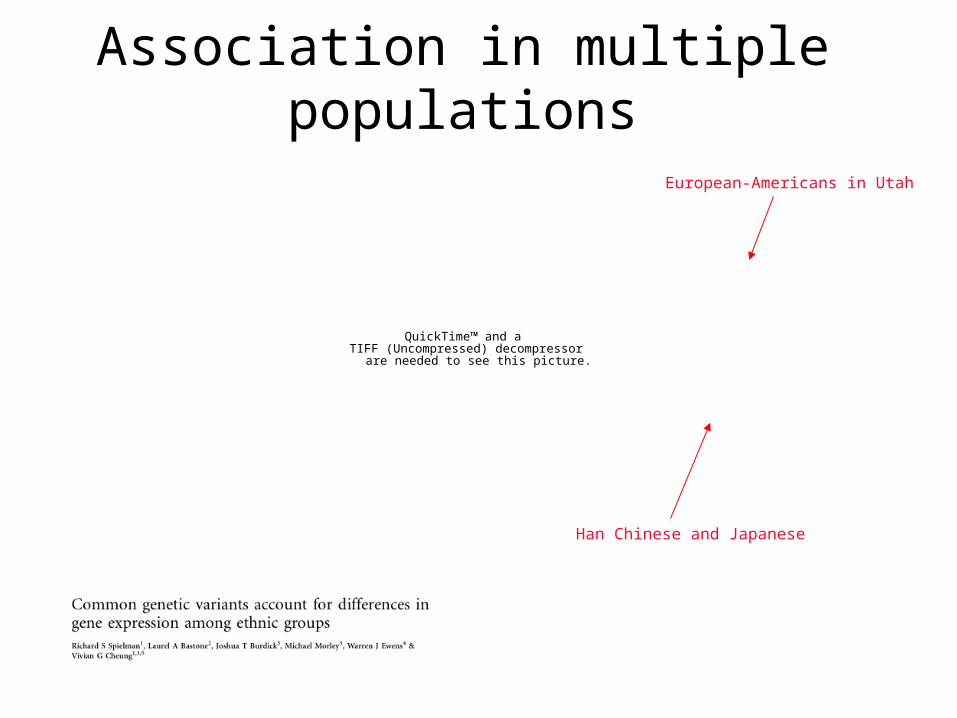
Association in multiple populations
QuickTime™ and aTIFF (Uncompressed) decompressor
are needed to see this picture.
Han Chinese and Japanese
European-Americans in Utah
Association in multiple populations
QuickTime™ and aTIFF (Uncompressed) decompressor
are needed to see this picture.